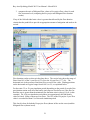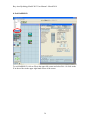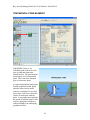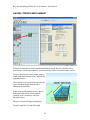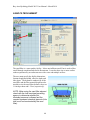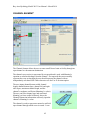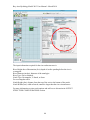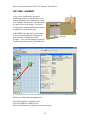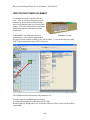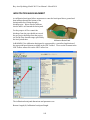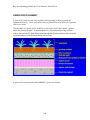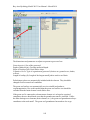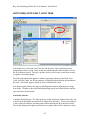
1
Bay Area Hydrology Model 2013 User Manual Prepared by Clear Creek Solutions, Inc. www.clearcreeksolutions.com Prepared for Alameda Countywide Clean Water Program San Mateo Countywide Water Pollution Prevention Program Santa Clara Valley Urban Runoff Pollution Prevention Program March 2014 To download the Bay Area Hydrology Model 2013 and the electronic version of this user’s manual, please go to www.bayareahydrologymodel.org If you have questions about BAHM2013 or its use, please contact: ACCWP: [email protected] or Arleen Feng, 510-670-5575 SCVURPPP or SMCWPPP: Jill Bicknell, [email protected] ii End User License Agreement End User Software License Agreement (Agreement). By clicking on the “Accept” Button when installing the Bay Area Hydrology Model 2013 (BAHM2013) software or by using the Bay Area Hydrology Model 2013 software following installation, you, your employer, client and associates (collectively, “End User”) are consenting to be bound by the following terms and conditions. If you or User do not desire to be bound by the following conditions, click the “Decline” Button, and do not continue the installation process or use of the Bay Area Hydrology Model 2013 software. The Bay Area Hydrology Model 2013 software is being provided to End User pursuant to a sublicense of a governmental licensee of Clear Creek Solutions, Inc. Pursuant to the terms and conditions of this Agreement, End User is permitted to use the Bay Area Hydrology Model 2013 software solely for purposes authorized by participating municipal, county or special district member agencies of signatory programs which are organized on a county-wide basis for implementation of stormwater discharge permits issued by the California Regional Water Quality Control Board, San Francisco Bay Region, under the National Pollutant Discharge Elimination System. The signatory programs include the Alameda Countywide Clean Water Program (ACCWP), the Santa Clara Valley Urban Runoff Pollution Prevent Program (SCVURPPP), and the San Mateo Countywide Water Pollution Prevention Program (SMCWPPP), each of which signed a Letter of Understanding (LOU) to jointly fund development of BAHM2013 and are hereinafter referred to collectively as “LOU Participants”. The End User is not permitted to use the Bay Area Hydrology Model 2013 software for any other purpose than as described above. End User shall not copy, distribute, alter, or modify the Bay Area Hydrology Model 2013 software. The BAHM2013 incorporates data on soils, climate and geographical features to support its intended uses of identifying site-appropriate modeling parameters, incorporating user-defined inputs into long-term hydro-logic simulation models of areas within the jurisdictions of the LOU Participants, and assisting design of facilities for flow duration control as described in the accompanying documentation. These data may not be adequate for other purposes such as those requiring precise location, measurement or description of geographical features, or engineering analyses other than those described in the documentation. This program and accompanying documentation are provided 'as-is' without warranty of any kind. The entire risk regarding the performance and results of this program is assumed by End User. Clear Creek Solutions Inc. and the governmental licensee or sublicensees disclaim all warranties, either expressed or implied, including but not limited to implied warranties of program and accompanying documentation. In no event shall Clear Creek Solutions Inc, Applied Marine Sciences Incorporated, the Alameda County Flood Control and Water Conservation District, EOA Incorporated, member agencies of the Alameda Countywide Clean Water Program, member agencies of the San Mateo Countywide Water Pollution Prevention Program, member agencies of the Santa Clara Valley Urban Runoff Pollution Prevention Program or any other LOU Participants or authorized representatives of LOU Participants be liable for any damages whatsoever (including without limitation to damages for loss of business profits, loss of business information, business interruption, and the like) arising out of the use of, or inability to use this program even if Clear Creek Solutions Inc., Applied Marine Sciences Incorporated, the Alameda County Flood Control and Water Conservation District, EOA Incorporated or any member iii agencies of the LOU Participants or their authorized representatives have been advised of the possibility of such damages. Software Copyright © by Clear Creek Solutions, Inc. 2013-2014; All Rights Reserved. iv FOREWORD The Bay Area Hydrology Model 2013 (BAHM2013) is a tool for analyzing the hydromodification effects of land development projects and sizing solutions to mitigate the increased runoff from these projects. This section of the User Manual provides background information on the definition and effects of hydromodification, the regulatory history for stormwater programs in the San Francisco Bay Region, and relevant findings from technical analyses conducted in response to regulatory requirements. It also summarizes the current Hydromodification Management Standard and general design approach for hydromodification control facilities, which led to the development of the BAHM2013.1 Effects of Hydromodification Urbanization of a watershed modifies natural watershed and stream processes by altering the terrain, modifying the vegetation and soil characteristics, introducing pavement and buildings, installing drainage and flood control infrastructure, and altering the condition of stream channels through straightening, deepening, and armoring. These changes affect hydrologic characteristics in the watershed (rainfall interception, infiltration, runoff and stream flows), and affect the supply and transport of sediment in the stream system. The change in runoff characteristics from a watershed caused by changes in land use conditions is called hydrograph modification, or simply hydromodification. As the total area of impervious surfaces increases in previously undeveloped areas, infiltration of rainfall decreases, causing more water to run off the surface as overland flow at a faster rate. Storms that previously didn’t produce runoff under rural conditions can produce erosive flows. The increase in the volume of runoff and the length of time that erosive flows occur ultimately intensify sediment transport, causing changes in sediment transport characteristics and the hydraulic geometry (width, depth, slope) of channels. The larger runoff durations and volumes and the intensified erosion of streams can impair the beneficial uses of the stream channels. Regulatory Context The California Regional Water Quality Control Board (Water Board), San Francisco Bay Region, requires stormwater programs to address the increases in runoff rate and volume from new and redevelopment projects where those increases could cause increased erosion of receiving streams. Starting in 2002, Phase 1 municipal stormwater permits in the San Francisco Bay Area contained requirements to develop and implement hydromodification management plans (HMPs) and to implement associated management measures. 1 Portions of this Foreword were excerpted from Bicknell, Beyerlein and Feng, “The Bay Area Hydrology Model – A Tool for Analyzing Hydromodification Effects of Development Projects and Sizing Solutions”, 2006. http://www.scvurppp-w2k.com/permit_c3_docs/Bicknell-Beyerlein-Feng_CASQA_Paper_9-26-06.pdf v The first Bay Area permit to include the new requirements was that of the Santa Clara Valley Urban Runoff Pollution Prevention Program (SCVURPPP). SCVURPPP conducted an assessment of hydromodification impacts on streams tributary to South San Francisco Bay and developed an HMP Report2 that describes the results of the assessments and technical studies and how SCVURPPP agencies will meet the hydromodification management requirements. On July 20, 2005, the Water Board adopted key provisions of the HMP Report into SCVURPPP’s permit. Subsequently, other Bay Area countywide stormwater programs developed and began implementing HMPs in response to similar permit requirements. The Alameda Countywide Clean Water Program (ACCWP) and San Mateo Countywide Water Pollution Prevention Program (SMCWPPP) HMPs were adopted by the Water Board on March 14, 20073. On October 14, 2009, the Water Board adopted a Municipal Regional Permit (MRP) that consolidated all Bay Area Phase I municipal stormwater program permit requirements into one permit. The MRP includes the current hydromodification management requirements for the individual stormwater programs4. Technical Analysis of Hydromodification Controls SCVURPPP and its consultant team completed a literature review and a number of technical analyses to address key issues for hydromodification management, such as the effectiveness of various flow control techniques, the range of storm events to be considered for design criteria, and examples of flow duration basin sizing for local projects5. The key findings of these analyses, which served as the basis for developing performance criteria for hydromodification controls, are described below. Effective Design Approaches It has been previously demonstrated that control of peak flows alone is not adequate for erosion control. SCVURPPP’s studies showed that hydromodification controls designed for discrete event volume control or design storm hydrograph matching do not provide adequate protection of receiving streams. The recommended effective method for hydromodification control is flow duration control. This approach involves incorporating one or more flow control structures to maintain the magnitude and duration of postproject flows at the same level as the pre-project flows (i.e., matching the long term pattern of flow rates and the proportion of time during which they occur) for the full distribution of flows within a significant range. The flow duration approach considers the entire multi-year discharge record, as opposed to a single event. Flow controls should be 2 SCVURPPP, Hydromodification Management Plan, Final Report, April 2005.www.scvurppp.org 3The Contra Costa Clean Water Program (CCCWP) and the Fairfield-Suisun Urban Runoff Management Program (FSURMP) have also developed HMPs that were adopted by the Water Board; however, they currently do not use the Bay Area Hydrology Model as the basis for compliance. 4 For more information on the MRP, see: http://www.waterboards.ca.gov/rwqcb2/water_issues/programs/stormwater/Municipal/index.shtml 5 Technical memoranda describing these analyses are available in Appendix C of the SCVURPPP HMP Report. See:www.scvurppp.org vi supplemented by site design measures that reduce the amount of post-project runoff generated at the site. Range of Storms to Manage An evaluation was performed of the range of flows that are the most important for stream channel erosion and hydromodification impacts in Santa Clara Valley. The evaluation was based on watershed assessments conducted for three subwatersheds in the Valley. The lower limit of the range is based on the critical flow (Qc) in each stream reach that initiates erosion of the stream bed or bank. For all three subwatersheds, Qc could be approximated as 10% of the 2-year pre-development peak flow. To partition this allowable flow among contributing land areas, an on-site project design criteria of 10% of the pre-project 2-year peak flow was proposed, and later adopted, as the allowable low flow from a flow control facility. The upper limit on the range of storms was determined by evaluating the contribution of different flow magnitudes to the total amount of erosive “work”6 done on the stream bed and banks over a period of time. The low flows contribute the most work over time, whereas high flows contribute less work because they occur less frequently. Approximately 90-95% of the total work on the channel boundary is done by flows between Qc and the pre-development 10-year peak flow magnitude. Flows greater than the 10-year peak flow contribute less than 10% of the total work. Thus, the 10-year preproject peak flow was selected as the practical upper limit for controlling erosive flows. Hydromodification Management Standard and Design Approach As described in current permits, the Hydromodification Management (HM) standard states that “stormwater discharges from applicable new development and redevelopment projects shall not cause an increase in the erosion potential of the receiving stream over the pre-project (existing) condition7. Increase in runoff flow and volume shall be managed so that post-project runoff shall not exceed estimated pre-project rates and durations, where such increased flow and/or volume is likely to cause increased potential for erosion of creek beds and banks, silt pollutant generation, or other adverse impacts to beneficial uses due to increased erosive force.” Most of the Bay Area stormwater program permits include performance and applicability criteria to meet this requirement. Projects can meet the HM standard by use of on-site control measures, regional control measures, in-stream measures, or a combination thereof. Applicable projects with on-site flow control facilities that are designed to provide flow duration control to the pre-project condition are considered to comply with the HM standard. Flow duration controls must be designed such that post-project stormwater discharge rates and durations match preproject discharge rates and durations from 10% of the pre-project 2-year peak flow up to 6 “Work” is a measure of the erosive hydraulic forces on the stream segment in excess of what the stream bed and bank materials can withstand (critical shear stress) before sediment movement occurs. 7 The requirements apply to development or redevelopment projects that create and/or replace 1 acre or more of impervious surface area. Consult local stormwater programs for guidance on definition of applicable projects. vii the pre-project 10-year peak flow.8 On-site flow controls include site design techniques, treatment controls that have the added effect of reducing flow (normally via infiltration), and flow control structures. Examples of site design features and flow reducing treatment controls (also known as low impact development (LID) techniques) include minimizing impervious surface areas, preserving natural areas, limiting development especially where native soils have good infiltration characteristics, directing roof runoff to landscaped areas, and installing bioretention areas (landscaped treatment systems with a specified soil mix to remove pollutants). Flow control structures are generally detention/retention basins or underground vaults or tanks fitted with outlet structures such as weirs and/or orifices to control outflow rate and duration. Flow control structures can be combined with LID treatment facilities or with flood control facilities. The basic approach for design of flow control structures to meet hydromodification requirements involves: 1) simulating the runoff from the project site under pre- and postproject conditions using a continuous simulation hydrologic model with a long-term rainfall record9; 2) generating flow-duration curves from the results; and 3) designing a flow control facility such that when the post-project time series of runoff is routed through the facility, the discharge pattern matches the pre-project flow-duration curve. The flow control structure is typically a type of detention facility that diverts and retains a certain portion of the runoff which is essentially the increase in surface runoff volume created between the pre-project and post-project condition. This captured increase in volume must be discharged in one of several ways: 1) to the ground via infiltration (and/or evapotranspiration if vegetation is present) in the basin; 2) released at a very low rate to the receiving stream (at the project critical flow for basin design called Qcp, defined as 10% of the pre-project 2-year runoff event); and/or 3) diverted to a safe discharge location or other infiltration site, if feasible. Development of the Bay Area Hydrology Model The concept of designing a flow duration control facility is relatively new and, as described above, requires the use of a continuous simulation hydrologic model. To facilitate this design approach, SCVURPPP, ACCWP and SMCWPPP decided to jointly fund development of a user-friendly, automated modeling and flow duration control facility sizing software tool adapted from the Western Washington Hydrology Model (WWHM). The WWHM was developed in 2001 for the Washington State Department of Ecology to support Ecology’s Stormwater Management Manual for Western 8 The matching criterion is as follows: the post-project flow duration curve may not deviate above the pre-project flow duration curve by more than 10% over more than 10% of the length of the curve. 9 There are several public domain hydrologic models that can be used for simulating runoff for a continuous rainfall record and sizing flow control facilities. Examples are: 1) the Army Corps of Engineers’ Hydrologic Engineering Center Hydrologic Modeling System (HEC-HMS); 2) the Environmental Protection Agency’s (EPA’s) Hydrologic Simulation Program Fortran (HSPF); and 3) the EPA’s Stormwater Management Model (SWMM). viii Washington10 and assist project proponents in complying with the Western Washington hydromodification control requirements. The original Bay Area Hydrology Model (BAHM), developed in 2007, was adapted from WWHM Version 3, but has been calibrated to southern San Francisco Bay Area watersheds11 and enhanced to be able to size other types of control measures and low impact development (LID) techniques for flow reduction as well. This new version of the Bay Area Hydrology Model (BAHM2013) includes new tools, procedures, and methodologies incorporated in WWHM2012. BAHM2013 is a useful tool in the design process, but must be used in conjunction with local design guidance to ensure compliance for specific projects. The reader should refer to Appendix D and local stormwater program guidance for additional information and suggestions for using the BAHM. Acknowledgements The following individuals and agencies are acknowledged for their contributions to the development of the BAHM2013 and User Manual: Doug Beyerlein, Joe Brascher and Gary Maxfield of Clear Creek Solutions, Inc., for development of WWHM and BAHM2013 and preparation of the BAHM2013 User Manual; Jill Bicknell (EOA/SCVURPPP), Arleen Feng and Jim Scanlin (ACCWP), Matt Fabry (SMCWPPP), and Fred Jarvis (EOA, Inc.) for their participation in the BAHM Oversight Committee and review of the original BAHM and User Manual; Anthony Donigian, AQUA TERRA Consultants, for calibration of the Alameda County watersheds and consultation on regional BAHM parameters; Washington State Department of Ecology for its leadership in creating the WWHM; and The countless municipal staff and consultants who tested BAHM and BAHM2013 and provided comments on earlier versions of the software. 10 Washington State Department of Ecology. 2001. Stormwater Management Manual for Western Washington. Volume III: Hydrologic Analysis and Flow Control Design/BMPs. Publication No. 99-13. Olympia, WA. 11 AQUA TERRA Consultants. 2005. Hydrologic Modeling of the Castro Valley Creek and Alameda Creek Watersheds with the U.S. EPA Hydrologic Simulation Program – FORTRAN (HSPF). Mountain View, CA. www.cleanwaterprogram.org ix This page has been intentionally left blank. x TABLE OF CONTENTS End User License Agreement ............................................................................................ iii FOREWORD ...................................................................................................................... v Effects of Hydromodification ......................................................................................... v Regulatory Context ......................................................................................................... v Technical Analysis of Hydromodification Controls ...................................................... vi Hydromodification Management Standard and Design Approach ............................... vii Development of the Bay Area Hydrology Model ........................................................ viii Acknowledgements ........................................................................................................ ix INTRODUCTION TO BAHM2013 ................................................................................... 1 BAHM2013 OVERVIEW .................................................................................................. 3 QUICK START .................................................................................................................. 5 MAIN SCREENS ............................................................................................................. 35 MAP INFORMATION SCREEN................................................................................. 36 GENERAL PROJECT INFORMATION SCREEN..................................................... 37 SCHEMATIC EDITOR ................................................................................................ 38 STANDARD ELEMENTS ......................................................................................... 40 BASIN ELEMENT ....................................................................................................... 41 TRAPEZOIDAL POND ELEMENT ........................................................................... 45 VAULT ELEMENT ..................................................................................................... 51 TANK ELEMENT ........................................................................................................ 53 IRREGULAR POND ELEMENT ................................................................................ 55 GRAVEL TRENCH BED ELEMENT ......................................................................... 58 SAND FILTER ELEMENT ......................................................................................... 60 CHANNEL ELEMENT ................................................................................................ 62 FLOW SPLITTER ELEMENT .................................................................................... 64 TIME SERIES ELEMENT ........................................................................................... 66 SSD TABLE ELEMENT .............................................................................................. 67 HIGH GROUNDWATER/WETLAND ELEMENT .................................................... 72 LID ELEMENTS ........................................................................................................ 74 BIORETENTION ELEMENT...................................................................................... 75 IN-GROUND (INFILTRATION) PLANTER ELEMENT .......................................... 85 FLOW-THROUGH PLANTER ELEMENT ................................................................ 88 PERMEABLE PAVEMENT ELEMENT .................................................................... 90 DISPERSION ............................................................................................................... 93 LATERAL BASIN ELEMENT (Pervious) .................................................................. 95 LATERAL I BASIN ELEMENT (Impervious) ........................................................... 97 DRY WELL ELEMENT .............................................................................................. 98 xi INFILTRATION TRENCH ELEMENT .................................................................... 100 INFILTRATION BASIN ELEMENT ........................................................................ 102 GREEN ROOF ELEMENT ........................................................................................ 104 RAINWATER HARVESTING .................................................................................. 106 ADDITIONAL INFORMATION ............................................................................ 107 OUTLET STRUCTURE CONFIGURATIONS......................................................... 108 INFILTRATION ......................................................................................................... 114 AUTO POND, AUTO VAULT, AUTO TANK......................................................... 115 STAGE-STORAGE-DISCHARGE TABLE .............................................................. 118 POINT OF COMPLIANCE........................................................................................ 119 CONNECTING ELEMENTS..................................................................................... 121 ANALYSIS SCREEN .................................................................................................... 125 FLOW DURATION ................................................................................................... 127 FLOW FREQUENCY ................................................................................................ 128 DRAWDOWN ............................................................................................................ 130 HYDROGRAPHS....................................................................................................... 131 REPORTS SCREEN....................................................................................................... 133 LID ANALYSIS SCREEN ............................................................................................. 141 OPTIONS ........................................................................................................................ 147 DURATION CRITERIA ............................................................................................ 148 SCALING FACTORS ................................................................................................ 149 TIMESTEP ................................................................................................................. 150 APPENDIX A: DEFAULT BAHM2013 HSPF PERVIOUS PARAMETER VALUES FOR ALAMEDA AND SAN MATEO COUNTIES ..................................................... 151 APPENDIX B: DEFAULT BAHM2013 HSPF PERVIOUS PARAMETER VALUES FOR SANTA CLARA COUNTY .................................................................................. 171 APPENDIX C: DEFAULT BAHM2013 HSPF IMPERVIOUS PARAMETER VALUES FOR ALAMEDA, SANTA CLARA, AND SAN MATEO COUNTIES ...................... 191 APPENDIX D: ADDITIONAL GUIDANCE FOR USING BAHM2013 ..................... 195 Infiltration Reduction Factor....................................................................................... 195 Flow Duration Outlet Structures – Practical Design Considerations.......................... 196 Drawdown Time and Considerations.......................................................................... 197 Additional Resources .................................................................................................. 198 APPENDIX E: BIORETENTION MODELING METHODOLOGY ........................... 201 xii Bay Area Hydrology Model 2013 User Manual – March 2014 INTRODUCTION TO BAHM2013 BAHM2013 is the Bay Area Hydrology Model Version 2013. BAHM2013 is based on the WWHM (Western Washington Hydrology Model) stormwater modeling platform. WWHM was originally developed for the Washington State Department of Ecology. More information about WWHM can be found at www.clearcreeksolutions.com. More information can be found about the Washington State Department of Ecology’s stormwater management program and manual at www.ecy.wa.gov/programs/wq/stormwater/manual.html. This user manual and development of the original BAHM and BAHM2013 were funded by the Alameda Countywide Clean Water Program (ACCWP), the Santa Clara Valley Urban Runoff Pollution Prevention Program (SCVURPPP), and the San Mateo Countywide Water Pollution Prevention Program (SMCWPPP). Original HSPF calibration of Alameda watersheds was conducted by AQUA TERRA Consultants of Mountain View, CA; HSPF calibration of Santa Clara watersheds was conducted by Clear Creek Solutions. Clear Creek Solutions (the successor of the AQUA TERRA Washington state offices) is responsible for BAHM2013 and the BAHM2013 User Manual. This user manual is organized so as to provide the user an example of a standard application using BAHM2013 (described in Quick Start) followed by descriptions of the different components and options available in BAHM2013. Appendices A through C provide a full list of the HSPF parameter values used in BAHM2013. Appendix D contains additional guidance and recommendations by the stormwater programs that have sponsored the BAHM2013 development. Throughout the user manual notes using this font (sans-serif italic) alert the user to actions or design decisions for which guidance must be consulted that is external to the BAHM2013 software, either provided in Appendix D of this user manual, at the BAHM website, or by the local municipal permitting agency. Purpose The purpose of BAHM2013 is to size hydromodification management or flow control facilities to mitigate the effects of increased runoff (peak discharge, duration, and volume) from proposed land use changes that impact natural streams, wetlands, and other water courses. BAHM2013 provides: A uniform methodology for the three South San Francisco Bay Area counties A more accurate methodology than single-event design storms An easy-to-use software package 1 Bay Area Hydrology Model 2013 User Manual – March 2014 BAHM2013 is based on: Continuous simulation hydrology (HSPF) Actual long-term recorded precipitation data Measured pan evaporation data Existing vegetation (for pre-project conditions) Regional HSPF parameters NOTE: Because of changes in input format and software architecture original (2007) BAHM project files cannot be read or used by BAHM2013. What’s New in BAHM2013 BAHM2013 gives the user greater modeling flexibility, options, and accuracy than were available in the original BAHM (dated 2007). The original BAHM included some simplified approaches to modeling stormwater LID (low impact development) facilities. BAHM2013 includes modeling elements that more accurately represent these stormwater facilities. Specific changes and additions in BAHM2013 include: Ability to run on Microsoft Windows 7 and 8 operating systems either on a workstation (single computer) or network. Improved Auto Pond capabilities to optimize sizing of stormwater ponds and vaults. New bioretention element that accurately represents bioretention and rain gardens with or without underdrains and/or infiltration to the native soil. New permeable pavement element to accurately model the movement of water through the pavement and subgrade. Added new SSD (Stage-Storage-Discharge) Table element options. Automated sizing options for infiltration facilities. Computer Requirements Windows 2000/XP/Vista/7/8 with 200 MB uncompressed hard drive space Internet access (only required for downloading BAHM2013, not required for executing BAHM2013) Pentium 3 or faster processor (desirable) Color monitor (desirable) Before Starting the Program Knowledge of the site location and/or street address. Knowledge of the actual distribution of existing site soil by category (A, B, or C/D). Knowledge of the planned distribution of the proposed development (buildings, streets, sidewalks, parking, lawn areas) overlying the soil categories. 2 Bay Area Hydrology Model 2013 User Manual – March 2014 BAHM2013 OVERVIEW The BAHM2013 software architecture and methodology is the same as that developed for the WWHM and uses HSPF as its computational engine12. Like WWHM, BAHM2013 is a tool that generates flow duration curves for the pre- and post-project condition and then sizes a flow duration control basin or vault and outlet structure to match the pre-project curve. The software package consists of a user-friendly graphical interface with screens for input of pre-project and post-project conditions; an engine that automatically loads appropriate parameters and meteorological data and runs continuous simulations of site runoff to generate flow duration curves; a module for sizing or checking the control measure to achieve the hydromodification control standard; and a reporting module. The HSPF hydrology parameter values used in BAHM2013 are based on calibrated watersheds located in the San Francisco Bay Area, two Alameda County watersheds and two Santa Clara County watersheds. BAHM2013 uses one or more long-term local precipitation gages for each of the three South Bay counties and then scales the precipitation to the user’s site using mean annual precipitation maps developed by local flood control districts or published as NOAA rainfall maps. BAHM2013 computes stormwater runoff for a site selected by the user. BAHM2013 runs HSPF in the background to generate an hourly runoff time series from the available rain gauge data over a number of years. Stormwater runoff is computed for both preproject and post-project land use conditions. Then, another part of the BAHM2013 routes the post-project stormwater runoff through a stormwater control facility of the user’s choice. BAHM2013 uses the pre-project peak flood value for each water year to compute the preproject 2- through 100-year flood frequency values13. The post-project runoff 2- through 100-year flood frequency values are computed at the outlet of the proposed stormwater facility. The model routes the post-project runoff through the stormwater facility. As with the pre-project peak flow values, the maximum post-project flow value for each water year is selected by the model to compute the developed 2- through 100-year flood frequency. The pre-project two-year peak flow is multiplied by 10% to set the lower limit of the erosive flows, in accordance with the current hydromodification management (HM) performance criteria14. The pre-project 10-year peak flow is the upper limit. A comparison of the pre-project and post-project flow duration curves is conducted for 100 flow levels between the lower limit and the upper limit. The model counts the number of 12 BAHM2013 is based on WWHM Version 2012. The actual flood frequency calculations are made using the Weibull ranking procedure described in Bulletin 17B (United States Water Resources Council, 1981). 14 In BAHM2013, this low flow limit is a user-defined variable, to allow flexibility pending potential changes in regulatory requirements. 13 3 Bay Area Hydrology Model 2013 User Manual – March 2014 hours that pre-project flows exceed each of the flow levels during the entire simulation period. The model does the same analysis for the post-project mitigated flows. Low impact development (LID) practices have been recognized as opportunities to reduce and/or eliminate stormwater runoff at the source before it becomes a problem. They include compost-amended (engineered) soils, bioretention, permeable pavement, green roofs, rain gardens, and vegetated swales. All of these approaches reduce stormwater runoff. BAHM2013 can be used to determine the magnitude of the reduction from each of these practices and the amount of stormwater detention storage still required to meet HM requirements. 4 Bay Area Hydrology Model 2013 User Manual – March 2014 QUICK START Quick Start very briefly describes the steps to quickly size a stormwater detention pond using BAHM2013. New users should read the descriptions of the BAHM2013 screens, elements, and analysis tools before going through the steps described below. 1. Select the county in which the project site is located. Click the down arrow in the box in the upper left corner. A list of the counties is shown. Scroll down to find the county you want. Left click on the county name. The county map will then show on the map screen. Locate the project site on the map. Use the map controls to magnify a portion of the map, if needed. Select the project site by left clicking on the map location. A red square will be placed on the map identifying the project site. 5 Bay Area Hydrology Model 2013 User Manual – March 2014 The BAHM2013 selects the appropriate rain gage record and precipitation multiplication factor. Note that for this example the rain gage is San Jose and the precipitation multiplication factor is 0.862. The precipitation multiplication factor is the ratio of the project site mean annual precipitation to that of the nearest precipitation station included in BAHM2013. In the above example a factor of 0.862 indicates that the mean annual precipitation of the project site is 86.2% of the mean annual precipitation of the San Jose station. BAHM2013 automatically computes the precipitation multiplication factor based on mean annual precipitation data included in its database. 6 Bay Area Hydrology Model 2013 User Manual – March 2014 2. Use the tool bar (immediately above the map) to move to the Scenario Editor. Click on the General Project Information button. The General Project Information button will bring up the Schematic Editor. The schematic editor screen contains two scenarios: Pre-project and Mitigated. Set up first the Pre-project scenario and then the Mitigated scenario. Check the Pre-project scenario box. Left click on the Basin element under the Elements heading. The Basin element represents the project drainage area. It is the upper left element. Select any grid cell (preferably near the top of the grid) and left click on that grid. The basin will appear in that grid cell. 7 Bay Area Hydrology Model 2013 User Manual – March 2014 To the right of the grid is the land use information associated with the basin element. Select the appropriate soil, vegetation, and land slope for the Pre-project scenario. Soils are based on NRCS general categories A, B, C, and D (for modeling purposes BAHM2013 combines C and D into a single C/D). Vegetation is based on the native or existing vegetation for the Pre-project area and the planned vegetation for the planned development (Mitigated scenario). Non-urban vegetation has been divided into forest, shrub, and non-turf grass and refers to the natural (non-planted) vegetation. In contrast, the developed landscape will consist of urban vegetation (lawns, flowers, planted shrubs and trees). Land slope is divided into flat (0-5%), moderate (5-10%), steep (10-20%), and very steep (>20%) land slopes. HSPF parameter values in BAHM2013 have been adjusted for the different soil, vegetation, and land slope categories. For this example we will assume that the Pre-project land use is 10 acres of D soil with non-turf grass vegetation on a steep slope (10-20%) and 1 acre of pre-project impervious area on a flat (0-5%) slope. 8 Bay Area Hydrology Model 2013 User Manual – March 2014 The exit from this basin will be selected as our point of compliance for the Pre-project scenario. Right click on the basin element and highlight Connect to Point of Compliance (the point of compliance is defined as the location at which the runoff from both the Preproject scenario and the Mitigated scenario are compared). The Point of Compliance screen will be shown for Preproject Basin 1. The POC (Point of Compliance) outlet has been checked for both surface runoff and interflow (shallow subsurface flow). These are the two flow components of stormwater runoff. Do not check the groundwater box unless there is observed and documented base flow on the project site. Click the Connect button in the low right corner to connect this point of compliance to the Pre-project basin. 9 Bay Area Hydrology Model 2013 User Manual – March 2014 After the point of compliance has been added to the basin the basin element will change. A small box with a bar chart graphic and a number will be shown in the lower right corner of the basin element. This small POC box identifies this basin as a point of compliance. The number is the POC number (e.g., POC 1). 10 Bay Area Hydrology Model 2013 User Manual – March 2014 3. Set up the Mitigated (i.e., Post-Project) scenario. First, check the Mitigated scenario box and place a basin element on the grid. 11 Bay Area Hydrology Model 2013 User Manual – March 2014 For the Mitigated land use we have: 5.5 acres of C/D soil, urban vegetation, moderate slope 0.5 acres of C/D soil, urban vegetation, steep slope 2 acres of roads, flat 1 acre of roof area 1 acre of driveways, flat 1 acre of sidewalks, flat We will add a trapezoidal pond downstream of the basin. The impervious land categories are roads, roofs, sidewalks, parking, and driveways. All are modeled the same, except that steeper slopes have less surface retention storage prior to the start of surface runoff. 12 Bay Area Hydrology Model 2013 User Manual – March 2014 The trapezoidal pond element is placed below the basin element on the grid. Right click on the basin and select Connect To Element. A green line will appear with one end connected to the basin. 13 Bay Area Hydrology Model 2013 User Manual – March 2014 With the mouse pointer pull the other end of the line down to the trapezoidal pond and click on the pond. This will bring up the From Basin to Conveyance screen. As with the Pre-project scenario we want to only connect the surface flow and the interflow (shallow subsurface runoff) from the basin to the pond. Click OK. 14 Bay Area Hydrology Model 2013 User Manual – March 2014 A line will connect the basin to the pond. 15 Bay Area Hydrology Model 2013 User Manual – March 2014 Right click on the trapezoidal pond element to connect the pond’s outlet to the point of compliance. Highlight Connect to Point Of Compliance and click. 16 Bay Area Hydrology Model 2013 User Manual – March 2014 The Point of Compliance screen will be shown for the pond. The pond has one outlet (by default). The outflow from the pond will be compared with the Pre-project runoff. The point of compliance is designated as POC 1 (BAHM2013 allows for multiple points of compliance). Click on the Connect button. 17 Bay Area Hydrology Model 2013 User Manual – March 2014 The point of compliance is shown on the pond element as a small box with the letter “A” and number 1 in the bar chart symbol in the lower right corner. The letter “A” stands for Analysis and designates that this is an analysis location where flow and stage will be computed and the output flow and stage time series will be made available to the user. The number 1 denotes that this is POC 1. 18 Bay Area Hydrology Model 2013 User Manual – March 2014 4. Sizing the pond. A trapezoidal stormwater pond can be sized either manually or automatically (using Auto Pond). For this example Auto Pond will be used. (Go to page 47 to find more information about how to manually size a pond or other HM facility.) Click on the Auto Pond button and the Auto Pond screen will appear. The user can set the pond depth (default: 4 feet), pond length to width ratio (default: 1 to 1), pond side slopes (default: 3 to 1), and the outlet structure configuration (default: 1 orifice and riser with rectangular notch weir). 19 Bay Area Hydrology Model 2013 User Manual – March 2014 To optimize the pond design and create the smallest pond possible, move the Automatic Pond Adjuster pointer from the left to the right. The pond does not yet have any dimensions. Click the Create Pond button to create initial pond dimensions, which will be the starting point for Auto Pond’s automated optimization process to calculate the pond size and outlet structure dimensions. Running Auto Pond automates the following BAHM2013 processes: 1. the hourly Pre-project runoff is computed for the 35-50 years of record (it varies depending on which rain gage is used), 2. the Pre-project runoff flood frequency is calculated based on annual peak flows, 3. the range of flows is selected for the flow duration (the default is 10% of the 2year peak to the 10-year peak), 4. this flow range is divided into 100 increments, and 5. the number of hourly Pre-project flow values that exceed each flow increment level (Pre-project flow duration) are counted to create the flow duration curves and accompanying tabular results. Next, BAHM2013 computes the post-project runoff (in the Mitigated scenario) and routes the runoff through the pond. But before the runoff can be routed through the pond the pond must be given dimensions and an outlet configuration. Auto Pond uses a set of rules based on the Pre-project and Mitigated scenario land uses to give the pond an initial set of dimensions and an initial outlet orifice diameter and riser (the riser is given a default rectangular notch). This information allows BAHM2013 to compute a stagestorage-discharge table for the pond. With this initial pond stage-storage-discharge table BAHM2013: 1. routes the hourly post-project runoff through the pond for the 35-50 years of record to create to the Mitigated flow time series, 2. counts the number of hourly Mitigated flow values that exceed each flow increment level (this is the Mitigated flow duration), and 20 Bay Area Hydrology Model 2013 User Manual – March 2014 3. computes the ratio of Mitigated flow values to Pre-project flow values for each flow increment level (comparing the Pre-project and Mitigated flow duration results). If any of the 100 individual ratio values is greater than allowed by the flow duration criteria then the pond fails to provide an appropriate amount of mitigation and needs to be resized. Flow duration results are shown in the plots above. The vertical axis shows the range of flows from 10% of the 2-year flow (0.15 cfs) to the 10-year flow (3.77 cfs). The horizontal axis is the percent of time that flows exceed a flow value. Plotting positions on the horizontal axis typical range from 0.001% to 1%, as explained below. For the entire 35- to 50-year simulation period (depending on the period of record of the precipitation station used) all of the hourly time steps are checked to see if the flow for that time step is greater than the minimum flow duration criteria value (0.19 cfs, in this example). For a 50-year simulation period there are approximately 400,000 hourly values to check. Many of them are zero flows. The 10% of the Pre-project 2-year flow value is exceeded less than 1% of the total simulation period. This check is done for both the Pre-project flows (shown in blue on the screen) and the Mitigated flows (shown in red). 21 Bay Area Hydrology Model 2013 User Manual – March 2014 If all of the Mitigated flow duration values (in red) are to the left of the Pre-project flow duration values (in blue) then the pond mitigates the additional erosive flows produced by the development. If the Mitigated flow duration values (in red) are far to the left of the Pre-project flow duration values (in blue) then the pond can be made smaller and still meet the flow duration criteria. Auto Pond goes through an iteration process by which it changes the pond dimensions and outlet configuration, then instructs BAHM2013 to again compute the resulting Mitigated runoff, compare flow durations, and decide if it has made the results better or worse. This iteration process continues until Auto Pond finally concludes that an optimum solution has been found and the Mitigated flow duration values (in red) are as close as possible to the Pre-project flow duration values (in blue). The user may continue to manually optimize the pond by manually changing pond dimensions and/or the outlet structure configuration. (Manual optimization is explained in more detail on page 47.) After making these changes the user should click on the Optimize Pond button to check the results and see if Auto Pond can make further improvements. 22 Bay Area Hydrology Model 2013 User Manual – March 2014 The final pond dimensions (bottom length, bottom width, effective pond depth, and side slopes) and outlet structure information (riser height, riser diameter, riser weir type, weir notch height and width, and orifice diameter and height) are shown on the trapezoidal pond screen to the right of the Schematic grid. NOTE: If Auto Pond selects a bottom orifice diameter smaller than the smallest diameter allowed by the local municipal permitting agency then the user has the option of specifying a minimum allowable bottom orifice diameter even if this size diameter is too large to meet flow duration criteria for this element. Additional mitigating BMPs may be required to meet local hydromodification control requirements. Please see Appendix D or consult with local municipal permitting agency for more details. For manual sizing information see page 47. 23 Bay Area Hydrology Model 2013 User Manual – March 2014 5. Review analysis. The Analysis tool bar button (third from the left) brings up the Analysis screen where the user can look at the results. Each time series dataset is listed in the Analyze Datasets box in the lower left corner. To review the flow duration analysis at the point of compliance select the POC 1 tab at the bottom and make sure that both the 501 POC 1 Pre-project flow and 801 POC 1 Developed flow are highlighted. Click the Run Analysis button if the flow duration analysis is not automatically computed. 24 Bay Area Hydrology Model 2013 User Manual – March 2014 The flow duration plot for both Pre-project and Mitigated flows will be shown along with the specific flow values and number of times Pre-project and Mitigated flows exceeded those flow values. The Pass/Fail on the right indicates whether or not at that flow level the flow control standard criteria were met and the pond passes at that flow level (from 10% of the 2-year flow to the 10-year). If not, a Fail is shown; one Fail fails the pond design. 25 Bay Area Hydrology Model 2013 User Manual – March 2014 Pond drawdown/retention time is computed on the Analysis screen. NOTE: This information is not required for basic sizing of the flow duration facility, but can assist the user in minimizing risk of vector (mosquito) breeding problems. See page 130 for more descriptions of this BAHM2013 feature, and Appendix D for discussion and references for these requirements. Click on the Stage tab at the bottom to get the Mitigated pond stage time series. 26 Bay Area Hydrology Model 2013 User Manual – March 2014 Click on the tab labeled Drawdown. This is where the pond drawdown/retention time results will be shown. 27 Bay Area Hydrology Model 2013 User Manual – March 2014 Select the pond you want to analyze for drawdown/retention time (in this example there is only one pond: Trapezoidal Pond 1) by clicking on the dataset and highlighting it. 28 Bay Area Hydrology Model 2013 User Manual – March 2014 Click on the Analyze Stage button and the computed pond stages (pond water depths) are summarized and reported in terms of drain/retention time (in days). For this example, a stage/depth of 0.77 feet occurred 2.9% of the time and took 1 day on average to drain (because of continuing inflows to the pond). The pond depth of 1.86 feet occurred 0.6% of the time and took 2 days on average to drain for the same reason. The maximum stage computed during the entire 35-50 year simulation period is 3.30 feet. This maximum stage has a drawdown time of 20 hours, 17 minutes, 22 seconds (approximately 20.5 hours). Stages can have drain times in excess of 5 days. This can occur when a pond has a small bottom orifice. If this is not acceptable then the user needs to change the pond outlet configuration, manually run the Mitigated scenario, and repeat the analyze stage computations. A situation may occur where it is not possible to have both an acceptable pond drawdown/ retention time and meet the flow duration criteria. NOTE: See Appendix D or the local municipal permitting agency for an overview of other requirements that may apply regarding drawdown time, and suggestions for addressing situations where it is not possible to meet all drawdown/retention time guidelines and also meet the flow duration criteria. The user manual assumes that the flow duration criteria take precedence unless the user is instructed otherwise by the local municipal permitting agency. 29 Bay Area Hydrology Model 2013 User Manual – March 2014 6. Produce report. Click on the Reports tool bar button (fourth from the left) to generate a project report with all of the project information and results. The project report can be generated as either a Microsoft Word file or a PDF file. 30 Bay Area Hydrology Model 2013 User Manual – March 2014 Scroll down the Report screen to see all of the results. 31 Bay Area Hydrology Model 2013 User Manual – March 2014 7. Save project. To save the project click on File in the upper left corner and select Save As. 32 Bay Area Hydrology Model 2013 User Manual – March 2014 Select a file name and save the BAHM2013 project file. The user can exit BAHM2013 and later reload the project file with all of its information by going to File, Open. 33 Bay Area Hydrology Model 2013 User Manual – March 2014 8. Exit BAHM2013. To exit BAHM2013 click on File in the upper left corner and select Exit. Or click on the X in the red box in the upper right hand corner of the screen. 34 Bay Area Hydrology Model 2013 User Manual – March 2014 MAIN SCREENS BAHM2013 has six main screens. These main screens can be accessed through the buttons shown on the tool bar above or via the View menu. The six main screens are: Map Information General Project Information Analysis Reports Tools LID (Low Impact Development) Analysis Each is discussed in more detail in the following sections. 35 Bay Area Hydrology Model 2013 User Manual – March 2014 MAP INFORMATION SCREEN The Map Screen contains county information. The map is directly linked to the meteorological database that contains precipitation and evaporation data. The precipitation gage and precip factor are shown to the right of the map. They change depending on the project site location. The county selection can be changed by clicking on the pulldown menu above the map and selecting one of the three Bay Area counties. The user can provide site information (optional). The site name and address will help to identify the project on the Report screen and in the printed report provided to the local municipal permitting agency. The user locates the project site on the map screen by using the mouse and left clicking at the project site location. Right clicking on the map re-centers the view. The + and – buttons zoom in and out, respectively. The cross hair button zooms out to the full county view. The arrow keys scroll the map view. 36 Bay Area Hydrology Model 2013 User Manual – March 2014 GENERAL PROJECT INFORMATION SCREEN The project screen contains all of the information about the project site for the two land use scenarios: Pre-project land use conditions and the Mitigated (post-project) land use conditions. To change from one scenario to another check the box in front of the scenario name in the upper left corner of the screen. Pre-project is defined as the existing conditions prior to the proposed land use development. Runoff from the Pre-project scenario is used as the target for the Mitigated scenario compliance. The model will accept any land use for this scenario. Mitigated is defined as the developed land use with mitigation measures (as selected by the user). Mitigated is used for sizing hydromodification control facilities. The runoff from the Mitigated scenario is compared with the Pre-project scenario runoff to determine compliance with flow duration criteria. Below the scenario boxes are the Elements. Each element represents a specific feature (basin, pond, etc.) and is described in more detail in the following section. 37 Bay Area Hydrology Model 2013 User Manual – March 2014 SCHEMATIC EDITOR The project screen also contains the Schematic Editor. The Schematic Editor is the grid to the right of the elements. This grid is where each element is placed and linked together. The grid, using the scroll bars on the left and bottom, expands as large as needed to contain all of the elements for the project. All movement on the grid must be from the top of the grid down. The space to the right of the grid will contain the appropriate element information. To select and place an element on the grid, first left click on the specific element in the Elements menu and then left click on the selected grid square. The selected element will appear in the grid square. The entire grid can be moved up, down, left, or right using the Move Elements arrow buttons. The grid coordinates from one project can be saved (Save x,y) and used for new projects (Load x,y). 38 Bay Area Hydrology Model 2013 User Manual – March 2014 The following discussion of the Schematic Editor is divided into Standard Elements, LID Elements, and Additional Information. Standard Elements include: Basin, Trapezoidal Pond, Vault, Tank, Irregular Pond, Gravel Trench Bed, Sand Filter, Channel, Flow Splitter, Time Series, SSD Table, and High Groundwater/Wetland elements. LID Elements include: Bioretention, In-Ground Planter, Flow-Through Planter, Permeable Pavement, Dispersion, Lateral Basin (Pervious), Lateral I Basin (Impervious), Dry Well, Infiltration Trench, Infiltration Basin, Green Roof, and Rainwater Harvesting. Additional information is provided on Outlet Structure Configurations, Infiltration, Auto Pond, Stage-Storage-Discharge Table, Point of Compliance, and Connecting Elements. 39 Bay Area Hydrology Model 2013 User Manual – March 2014 STANDARD ELEMENTS The following pages contain information about these standard elements: Basin Trapezoidal Pond Vault Tank Irregular Pond Gravel Trench Bed Sand Filter Channel Flow Splitter Time Series SSD Table High Groundwater/Wetland 40 Bay Area Hydrology Model 2013 User Manual – March 2014 BASIN ELEMENT The Basin element represents a drainage area that can have any combination of soils, vegetation, and land uses. A basin produces three types of runoff: (1) surface runoff, (2) interflow, and (3) groundwater. Surface runoff is defined as the overland flow that quickly reaches a conveyance system. Surface runoff mainly comes from impervious surfaces. Interflow is shallow, subsurface flow produced by pervious land categories and varies based on soil characteristics and how these characteristics are altered by land development practices. Groundwater is the subsurface flow that typically does not enter a stormwater conveyance system, but provides base flow directly to streams and rivers. The user can specify where each of these three types of runoff should be directed. The default setting is for the surface runoff and interflow to go to the stormwater facility; groundwater should not be connected unless there is observed base flow occurring in the drainage basin. 41 Bay Area Hydrology Model 2013 User Manual – March 2014 Table 1 shows the different pervious land types represented in the Basin element. Table 1. BAHM2013 Pervious Land Types PERLND No. 1 2 3 4 5 6 7 8 9 10 11 12 13 14 15 16 17 18 19 20 21 22 23 24 25 26 27 28 29 30 31 32 33 34 35 36 37 38 39 40 41 42 43 Soil A A A A A A A A A A A A A A A A B B B B B B B B B B B B B B B B C/D C/D C/D C/D C/D C/D C/D C/D C/D C/D C/D Vegetation/Surface Forest Forest Forest Forest Shrub Shrub Shrub Shrub Grass Grass Grass Grass Urban Urban Urban Urban Forest Forest Forest Forest Shrub Shrub Shrub Shrub Grass Grass Grass Grass Urban Urban Urban Urban Forest Forest Forest Forest Shrub Shrub Shrub Shrub Grass Grass Grass 42 Slope Flat(0-5%) Moderate(5-10%) Steep(10-20%) Very Steep(>20%) Flat(0-5%) Moderate(5-10%) Steep(10-20%) Very Steep(>20%) Flat(0-5%) Moderate(5-10%) Steep(10-20%) Very Steep(>20%) Flat(0-5%) Moderate(5-10%) Steep(10-20%) Very Steep(>20%) Flat(0-5%) Moderate(5-10%) Steep(10-20%) Very Steep(>20%) Flat(0-5%) Moderate(5-10%) Steep(10-20%) Very Steep(>20%) Flat(0-5%) Moderate(5-10%) Steep(10-20%) Very Steep(>20%) Flat(0-5%) Moderate(5-10%) Steep(10-20%) Very Steep(>20%) Flat(0-5%) Moderate(5-10%) Steep(10-20%) Very Steep(>20%) Flat(0-5%) Moderate(5-10%) Steep(10-20%) Very Steep(>20%) Flat(0-5%) Moderate(5-10%) Steep(10-20%) Bay Area Hydrology Model 2013 User Manual – March 2014 44 45 46 47 48 C/D C/D C/D C/D C/D Grass Urban Urban Urban Urban Very Steep(>20%) Flat(0-5%) Moderate(5-10%) Steep(10-20%) Very Steep(>20%) The user does not need to know or keep track of the HSPF PERLND number. That number is used only for internal tracking purposes in the HSPF UCI file created by BAHM2013. The user inputs the number of acres of appropriate basin land use information. Pervious land use information is in the form of soil, vegetation, and land slope. For example, “A, Grass, Flat” means NRCS soil type A, non-turf grassland vegetation, and flat (0-5%) land slope. There are three basic soil types: A (well infiltrating soils), B (moderate infiltrating soils), and C/D (poor infiltrating soils). There are four basic vegetation categories: forest, native shrub rural vegetation, non-turf grasslands, and urban landscaped vegetation. Natural vegetation has been divided into forest, shrub, and non-turf grass and refers to the natural (non-planted) vegetation. In contrast, the developed landscape will consist of urban vegetation (lawns, flowers, planted shrubs and trees). Land slope is divided into flat (0-5%), moderate (5-10%), steep (10-20%), and very steep (>20%) land slopes. HSPF parameter values in BAHM2013 have been adjusted for the different soil, vegetation, and land slope categories. BAHM2013 HSPF soil parameter values take into account the hydrologic effects of land development activities that result from soil compaction when “Urban” is specified. Impervious areas are divided into five types with four different slopes (see Table 2). The five types are: roads, roofs, driveways, sidewalks, and parking. The slope categories are the same as for the pervious land use (flat, moderate, steep, and very steep). 43 Bay Area Hydrology Model 2013 User Manual – March 2014 Table 2. BAHM2013 Impervious Land Types IMPLND No. 1 2 3 4 5 6 7 8 9 10 11 12 13 14 15 16 17 Surface Roads Roads Roads Roads Roof Area Driveways Driveways Driveways Driveways Sidewalks Sidewalks Sidewalks Sidewalks Parking Parking Parking Parking Slope Flat(0-5%) Moderate(5-10%) Steep(10-20%) Very Steep(>20%) All Flat(0-5%) Moderate(5-10%) Steep(10-20%) Very Steep(>20%) Flat(0-5%) Moderate(5-10%) Steep(10-20%) Very Steep(>20%) Flat(0-5%) Moderate(5-10%) Steep(10-20%) Very Steep(>20%) The user does not need to know or keep track of the HSPF IMPLND number. That number is used only for internal tracking purposes in the HSPF UCI file created by BAHM2013. 44 Bay Area Hydrology Model 2013 User Manual – March 2014 TRAPEZOIDAL POND ELEMENT In BAHM2013 there is an individual pond element for each type of pond and stormwater control facility. The pond element shown above is for a trapezoidal pond. This is the most common type of stormwater pond. A trapezoidal pond has dimensions (bottom length and width, depth, and side slopes) and an outlet structure consisting of a riser and one or more orifices to control the release of stormwater from the pond. A trapezoidal pond includes the option to infiltrate runoff, if the soils are appropriate and there is sufficient depth to the underlying groundwater table. 45 Bay Area Hydrology Model 2013 User Manual – March 2014 The user has the option to specify that different outlets be directed to different downstream destinations, although usually all of the outlets go to a single downstream location. Auto Pond will automatically size a trapezoidal pond to meet the required flow duration criteria. Auto Pond is available only in the Mitigated scenario. Quick Pond can be used to instantly add pond dimensions and an outlet configuration without checking the pond for compliancy with flow duration criteria. Quick Pond is sometimes used to quickly create a scenario and check the model linkages prior to sizing the pond. Multiple clicks on the Quick Pond button incrementally increase the pond size. The user can change the default name “Trapezoidal Pond 1” to another more appropriate name, if desired. Precipitation and evaporation must be applied to the pond unless the pond is covered. The pond bottom elevation can be set to an elevation other than zero if the user wants to use actual elevations. All pond stage values are relative to the bottom elevation. Negative bottom elevations are not allowed. The pond effective depth is the pond height (including freeboard) above the pond bottom. It is not the actual elevation of the top of the pond. Pond side slopes are in terms of horizontal distance over vertical. A standard 3:1 (H/V) side slope would be given a value of 3. A vertical side slope has a value of 0. The pond bottom is assumed to be flat. The pond outlet structure consists of a riser and zero to three orifices. The riser has a height (typically one foot less than the effective depth) and a diameter. The riser can have either a flat top or a weir notch cut into the side of the top of the riser. The notch can be either rectangular, V-shaped, or a Sutro weir. More information on the riser weir shapes and orifices is provided later in this manual. After the pond is given dimensions and outlet information the user can view the resulting stage-storage-discharge table by clicking on the “Open Table” arrow in the lower right corner of the pond information screen. This table hydraulically defines the pond’s characteristics. The user can use either Auto Pond to size a pond or can manually size a pond. Use the following steps for manual sizing a pond using an outlet configuration with one orifice and a riser with rectangular notch (this is usually the most efficient design): 46 Bay Area Hydrology Model 2013 User Manual – March 2014 1. Input a bottom orifice diameter that allows a discharge equal to 10% of the 2-year Pre-project flow for a stage equal to 2/3rds the height of the riser. This discharge can be checked by reviewing the pond’s stage-storage-discharge table. 2. Input a riser rectangular notch height equal to 1/3 of the height of the riser. Initially set the riser notch width to 0.1 feet. 3. Run Pre-project and Mitigated scenarios. 4. Go to Analysis screen and check flow duration results. 5. If pond passes flow duration criteria then decrease pond dimensions. 6. If pond fails flow duration criteria then change (in order) bottom orifice diameter, riser notch width, pond dimensions. 7. Iterate until there is a good match between Pre-project and Mitigated flow duration curves or fatigue sets in. Pond input information: Bottom Length (ft): Pond bottom length. Bottom Width (ft): Pond bottom width. Effective Depth (ft): Pond height from pond bottom to top of riser plus at least 0.5 feet extra. Left Side Slope (H/V): ratio of horizontal distance to vertical; 0 (zero) for vertical pond sides. Bottom Side Slope (H/V): ratio of horizontal distance to vertical; 0 (zero) for vertical pond sides. Right Side Slope (H/V): ratio of horizontal distance to vertical; 0 (zero) for vertical pond sides. Top Side Slope (H/V): ratio of horizontal distance to vertical; 0 (zero) for vertical pond sides. Riser Height (ft): Height of overflow pipe above pond bottom. Riser Diameter (in): Pond overflow pipe diameter. Riser Type (options): Flat or Notched Notch Type: Rectangular, V-Notch, or Sutro. For a rectangular notch: Notch Height (feet): distance from the top of the weir to the bottom of the notch. Notch Width (feet): width of notch; cannot be larger than the riser circumference. For more information on riser notch options and orifices see discussion in OUTLET STRUCTURE CONFIGURATIONS section. Infiltration: Yes (infiltration into the underlying native soil) Measured Infiltration Rate (in/hr): Native soil infiltration rate. Infiltration Reduction Factor: 1/Native soil infiltration rate safety factor (see page 114). Use Wetted Surface Area (sidewalls): Yes, if infiltration through the pond side slopes is allowed. If infiltration is used then the user should consult the Infiltration discussion on page 114. 47 Bay Area Hydrology Model 2013 User Manual – March 2014 NOTE: See Appendix D or consult with the local municipal permitting agency for additional considerations regarding infiltration and determination of the appropriate infiltration reduction factor. A pond receives precipitation on and evaporation from the pond surface. The Precipitation Applied to Facility and Evaporation Applied to Facility boxes should be checked. 48 Bay Area Hydrology Model 2013 User Manual – March 2014 NOTE: The detention pond section diagram shows the general configuration used in designing a pond and its outlet structure. This diagram is from the 49 Bay Area Hydrology Model 2013 User Manual – March 2014 Washington State Department of Ecology’s 2005 Stormwater Management Manual for Western Washington. Consult with your local municipal permitting agency on specific design requirements for your project site. 50 Bay Area Hydrology Model 2013 User Manual – March 2014 VAULT ELEMENT The storage vault has all of the same characteristics of the trapezoidal pond, except that the user does not specify the side slopes (by definition they are zero). AutoVault and Quick Vault work the same way as Auto Pond and Quick Pond. Go to page 47 to find information on how to manually size a vault or other HM facility. Vault input information: Bottom Length (ft): Vault bottom length. Bottom Width (ft): Vault bottom width. Effective Depth (ft): Vault height from vault bottom to top of riser plus at least 0.5 feet extra. Riser Height (ft): Height of overflow pipe above vault bottom. Riser Diameter (in): Vault overflow pipe diameter. Riser Type (options): Flat or Notched Notch Type: Rectangular, V-Notch, or Sutro. 51 Bay Area Hydrology Model 2013 User Manual – March 2014 For a rectangular notch: Notch Height (feet): distance from the top of the weir to the bottom of the notch. Notch Width (feet): width of notch; cannot be larger than the riser circumference. For more information on riser notch options and orifices see discussion in OUTLET STRUCTURE CONFIGURATIONS section. Infiltration: Yes (infiltration into the underlying native soil) Measured Infiltration Rate (in/hr): Native soil infiltration rate. Infiltration Reduction Factor: 1/Native soil infiltration rate safety factor (see page 114). Use Wetted Surface Area (sidewalls): Yes, if infiltration through the vault sides is allowed. If infiltration is used then the user should consult the Infiltration discussion on page 114. NOTE: See Appendix D or consult with the local municipal permitting agency for additional considerations regarding infiltration and determination of the appropriate infiltration reduction factor. A vault is usually covered and does not receive precipitation on and evaporation from the vault surface. The Precipitation Applied to Facility and Evaporation Applied to Facility boxes should not be checked. 52 Bay Area Hydrology Model 2013 User Manual – March 2014 TANK ELEMENT A storage tank is a cylinder placed on its side. The user specifies the tank’s diameter and length. Auto Tank and Quick Tank work the same way as Auto Pond and Quick Pond. Auto Tank is only available in the Mitigated scenario. There is a Quick Tank option that creates a tank, but does not check for compliance with the flow duration criteria. Tank input information: Tank Type: Circular or Arched For Circular: Diameter (ft): Tank diameter. Length (ft): Tank length. For Arched: Height (ft): Tank height. Width (ft): Tank width (at widest point). 53 Bay Area Hydrology Model 2013 User Manual – March 2014 Length (ft): Tank length. Riser Height (ft): Height of overflow pipe above tank bottom; must be less than tank diameter or height. Riser Diameter (in): Tank overflow pipe diameter. Riser Type (options): Flat or Notched Notch Type: Rectangular, V-Notch, or Sutro. For a rectangular notch: Notch Height (feet): distance from the top of the weir to the bottom of the notch. Notch Width (feet): width of notch; cannot be larger than the riser circumference. For more information on riser notch options and orifices see discussion in OUTLET STRUCTURE CONFIGURATIONS section. Infiltration: Yes (infiltration into the underlying native soil) Measured Infiltration Rate (in/hr): Native soil infiltration rate. Infiltration Reduction Factor: 1/Native soil infiltration rate safety factor (see page 114). Use Wetted Surface Area (sidewalls): Yes, if infiltration through the tank sides is allowed. If infiltration is used then the user should consult the Infiltration discussion on page 114. NOTE: See Appendix D or consult with the local municipal permitting agency for additional considerations regarding infiltration and determination of the appropriate infiltration reduction factor. A tank is covered and does not receive precipitation on and evaporation from the tank surface. The Precipitation Applied to Facility and Evaporation Applied to Facility boxes should not be checked. 54 Bay Area Hydrology Model 2013 User Manual – March 2014 IRREGULAR POND ELEMENT An irregular pond is any pond with a shape that differs from the rectangular top of a trapezoidal pond. An irregular pond has all of the same characteristics of a trapezoidal pond, but its shape must be defined by the user. The Auto Pond option is not available for an irregular-shaped pond. Go to page 47 to find information on how to manually size an irregular pond or other HM facility. To create the shape of an irregular pond the user clicks on the “Open PondPad” button. This allows the user to access the PondPad interface (see below). 55 Bay Area Hydrology Model 2013 User Manual – March 2014 PondPad Interface The PondPad interface is a grid on which the user can specify the outline of the top of the pond and the pond’s side slopes. The user selects the line button (second from the top on the upper left corner of the PondPad screen). Once the line button is turned on the user moves the mouse over the grid to locate the pond’s corner points. The user does this in a clockwise direction to outline the pond’s top perimeter. The user can select individual points by clicking on the point button immediately below the line button. Once selected, any individual point can be moved or repositioned. 56 Bay Area Hydrology Model 2013 User Manual – March 2014 The default side slope value is 3 (3:1). The side slopes can be individually changed by right clicking on the specific side (which changes the line color from black to red) and then entering the individual side slope value in the slope text box. The grid scale can be changed by entering a new value in the grid scale box. The default value is 200 feet. PondPad Controls and Numbers Clear: Line: Point: The Clear button clears all of the lines on the grid. The Line button allows the user to draw new lines with the mouse. The Point button allows the user to move individual points to alter the pond shape and size. Sq Ft: Grid Scale: Grid X: Converts the computed pond area from square feet to acres and back. Changes the length of a grid line. Default grid scale is 200 feet. Horizontal location of the mouse pointer on the grid (0 is the upper left corner). Vertical location of the mouse pointer on the grid (0 is the upper left corner) Grid Y: Area: Slope: Top area of the pond (either in square feet or acres). Side slope of the selected line (side of the pond). 57 Bay Area Hydrology Model 2013 User Manual – March 2014 GRAVEL TRENCH BED ELEMENT The gravel trench bed is used to spread and infiltrate runoff, but also can have one or more surface outlets represented by an outlet structure with a riser and multiple orifices. The user specifies the trench length, bottom width, total depth, bottom slope, and left and right side slopes. The material layers represent the gravel/rock layers and their design characteristics (thickness and porosity). Quick Trench will instantly create a gravel trench bed with default values without checking it for compliancy with flow duration criteria. The gravel trench bed input information: Trench Length (ft): Trench bed length. 58 Bay Area Hydrology Model 2013 User Manual – March 2014 Trench Bottom Width (ft): Trench bed bottom width. Effective Total Depth (ft): Height from bottom of trench bed to top of riser plus at least 0.5 feet extra. Bottom Slope of Trench (ft/ft): Must be non-zero. Left Side Slope (ft/ft): H/V ratio of horizontal distance to vertical; 0 (zero) for vertical trench bed sides. Right Side Slope (ft/ft): H/V ratio of horizontal distance to vertical; 0 (zero) for vertical trench bed sides. Infiltration Rate (in/hr): Trench bed gravel or other media infiltration rate. Layer 1 Thickness (ft): Trench top media layer depth. Layer 1 Porosity: Trench top media porosity. Layer 2 Thickness (ft): Trench middle media layer depth (Layer 2 is optional). Layer 2 Porosity: Trench middle media porosity. Layer 3 Thickness (ft): Trench bottom media layer depth (Layer 3 is optional). Layer 3 Porosity: Trench bottom media porosity. Riser Height (ft): Height of trench overflow pipe above trench surface. Riser Diameter (in): Trench overflow pipe diameter. Riser Type (options): Flat or Notched Notch Type: Rectangular, V-Notch, or Sutro. For a rectangular notch: Notch Height (feet): distance from the top of the weir to the bottom of the notch. Notch Width (feet): width of notch; cannot be larger than the riser circumference. For more information on riser notch options and orifices see discussion in OUTLET STRUCTURE CONFIGURATIONS section. Native Infiltration: Yes (infiltration into the underlying native soil) Measured Infiltration Rate (in/hr): Native soil infiltration rate. Infiltration Reduction Factor: 1/Native soil infiltration rate safety factor (see page 114). Use Wetted Surface Area (sidewalls): Yes, if infiltration through the trench side slopes is allowed. If infiltration is used then the user should consult the Infiltration discussion on page 114. The infiltration trench does not explicitly include an underdrain. However, to include an underdrain set the underdrain height and orifice diameter using the orifice input (the orifice height is defined as from the bottom of the lowest layer in the trench). NOTE: See Appendix D or consult with the local municipal permitting agency for additional considerations regarding infiltration and determination of the appropriate infiltration reduction factor. Gravel trench bed receives precipitation on and evaporation from the trench surface. The Precipitation Applied to Facility and Evaporation Applied to Facility boxes should be checked. 59 Bay Area Hydrology Model 2013 User Manual – March 2014 SAND FILTER ELEMENT The sand filter is a water quality facility. It does not infiltrate runoff, but is used to filter runoff through a medium and send it downstream. It can also have one or more surface outlets represented by an outlet structure with a riser and multiple orifices. The user must specify the facility dimensions (bottom length and width, effective depth, and side slopes. The hydraulic conductivity of the sand filter and the filter material depth are also needed to size the sand filter (default values are 1.0 inch per hour and 1.5 feet, respectively). NOTE: When using the sand filter element check with the local municipal permitting agency to determine whether this treatment measure is allowed and the required treatment standard (percent of the total runoff volume treated by the sand filter). 60 Bay Area Hydrology Model 2013 User Manual – March 2014 The filter discharge is calculated using the equation Q = K*I*A, where Q is the discharge in cubic feet per second (cfs). K equals the hydraulic conductivity (inches per hour). For sand filters K = 1.0 in/hr. Sand is the default medium. If another filtration material is used then the design engineer should enter the appropriate K value supported by documentation and approval by the reviewing authority. Design of a sand filter requires input of facility dimensions and outlet structure characteristics, running the sand filter scenario, and then checking the volume calculations to see if the Percent Filtered equals or exceeds the treatment standard percentage. If the value is less than the treatment standard percentage then the user should increase the size of the sand filter dimensions and/or change the outlet structure. The sand filter input information: Bottom Length (ft): Sand filter bottom length. Bottom Width (ft): Sand filter bottom width. Effective Depth (ft): Height from bottom of sand filter to top of riser plus at least 0.5 feet extra. Left Side Slope (ft/ft): H/V ratio of horizontal distance to vertical; 0 (zero) for vertical sand filter sides. Bottom Side Slope (ft/ft): H/V ratio of horizontal distance to vertical; 0 (zero) for vertical sand filter sides. Right Side Slope (ft/ft): H/V ratio of horizontal distance to vertical; 0 (zero) for vertical sand filter sides. Top Side Slope (ft/ft): H/V ratio of horizontal distance to vertical; 0 (zero) for vertical sand filter sides. Riser Height (ft): Height of sand filter overflow pipe above sand filter surface. Riser Diameter (in): Sand filter overflow pipe diameter. Riser Type (options): Flat or Notched Notch Type: Rectangular, V-Notch, or Sutro. For a rectangular notch: Notch Height (feet): distance from the top of the weir to the bottom of the notch. Notch Width (feet): width of notch; cannot be larger than the riser circumference. For more information on riser notch options and orifices see discussion in OUTLET STRUCTURE CONFIGURATIONS section. Infiltration: Yes (infiltration through the filter material) Hydraulic Conductivity (in/hr): Filtration rate through the sand filter. Filter material depth (ft): Depth of sand filter material (for runoff filtration). Sand filter receives precipitation on and evaporation from the sand filter surface. The Precipitation Applied to Facility and Evaporation Applied to Facility boxes should be checked. 61 Bay Area Hydrology Model 2013 User Manual – March 2014 CHANNEL ELEMENT The Channel element allows the user to route runoff from a basin or facility through an open channel to a downstream destination. The channel cross section is represented by a trapezoid and is used with Manning’s equation to calculate discharge from the channel. If a trapezoid does not accurately represent the cross section then the user should represent the channel with an independently calculated SSD Table element or use the Use X-Sections option. The user inputs channel bottom width, channel length, channel bottom slope, channel left and right side slopes, maximum channel depth, and the channel’s roughness coefficient (Manning’s n value). The user can select channel type and associated Manning’s n from a table list directly above the Channel Dimension information or directly input the channel’s Manning’s n value. The channel is used to represent a natural or artificial open channel through which water is routed. It can 62 Bay Area Hydrology Model 2013 User Manual – March 2014 be used to connect a basin to a pond or a pond to a pond or multiple channels can linked together. Channel input information: Channel Bottom Width (ft): Open channel bottom width. Channel Length (ft): Open channel length. Manning’s n coefficient: Open channel roughness coefficient (user menu selected or input). Slope of Channel (ft/ft): Open channel bottom slope. Left Side Slope of Channel (ft/ft): H/V ratio of horizontal distance to vertical; 0 (zero) for vertical channel sides. Right Side Slope of Channel (ft/ft): H/V ratio of horizontal distance to vertical; 0 (zero) for vertical channel sides. Maximum Channel Depth (ft): Height from bottom of channel to top of channel bank. Infiltration: Yes (infiltration into the underlying native soil) Measured Infiltration Rate (in/hr): Native soil infiltration rate. Infiltration Reduction Factor: 1/Native soil infiltration rate safety factor (see page 114). Use Wetted Surface Area (sidewalls): Yes, if infiltration through the channel side slopes is allowed. If infiltration is used then the user should consult the Infiltration discussion on page 114. NOTE: See Appendix D or consult with the local municipal permitting agency for additional considerations regarding infiltration and determination of the appropriate infiltration reduction factor. 63 Bay Area Hydrology Model 2013 User Manual – March 2014 FLOW SPLITTER ELEMENT The flow splitter divides the runoff and sends it to two difference destinations. The splitter has a primary exit (exit 1) and a secondary exit (exit 2). The user defines how the flow is split between these two exits. The user can define a flow control structure with a riser and one to three orifices for each exit. The flow control structure works the same way as the pond outlet structure, with the user setting the riser height and diameter, the riser weir type (flat, rectangular notch, Vnotch, or Sutro), and the orifice diameter and height. For more information on riser notch options and orifices see discussion in OUTLET STRUCTURE CONFIGURATIONS section. 64 Bay Area Hydrology Model 2013 User Manual – March 2014 The second option is that the flow split can be based on a flow threshold. The user sets the flow threshold value (cfs) for exit 1 at which flows in excess of the threshold go to exit 2. For example, if the flow threshold is set to 5 cfs then all flows less than or equal to 5 cfs go to exit 1. Exit 2 gets only the excess flow above the 5 cfs threshold (total flow minus exit 1 flow). 65 Bay Area Hydrology Model 2013 User Manual – March 2014 TIME SERIES ELEMENT BAHM2013 uses time series of precipitation, evaporation, and runoff stored in its database (HSPF WDM file). The user has the option to create or use a time series file external from BAHM2013 in BAHM2013. This may be a time series of flow values created by another HSPF model. An example is offsite runoff entering a project site. If this offsite runoff is in an existing WDM file and is the same period as BAHM2013 data and the same simulation time step (hourly) then it can be linked to BAHM2013 model using the Time Series element. To link the external time series to BAHM2013 the user clicks on the Choose WDM button and identifies the external WDM file. The external WDM’s individual time series files are shown in the Time Series Out box. The selected input dataset is the time series that will be used by BAHM2013. The user also has the option of modifying and/or copying time series files using the options shown in the Functions box. These options are: add, subtract, apply factor (multiply), copy, raise to a power, select a threshold greater than, and select a threshold less than. Once a specific option is selected then by clicking on Run Analysis the time series is appropriately modified. 66 Bay Area Hydrology Model 2013 User Manual – March 2014 SSD TABLE ELEMENT The SSD Table is a stage-storage-discharge table externally produced by the user and is identical in format to the stage-storage-discharge tables generated internally by BAHM2013 for ponds, vaults, tanks, and channels. The easiest way to create a SSD Table outside of BAHM2013 is to use a spreadsheet with a separate column for stage, surface area, storage, and discharge (in that order). Save the spreadsheet file as a space or comma-delimited file. A text file can also be created, if more convenient. The SSD Table must use the following units: Stage: feet Surface Area: acres Storage: acre-feet Discharge: cubic feet per second (cfs) A fifth column can be used to create a second discharge (cfs). This second discharge can be infiltration or a second surface discharge. 67 Bay Area Hydrology Model 2013 User Manual – March 2014 Certain rules apply to the SSD Table whether it is created inside or outside of BAHM2013. These rules are: 1. Stage (feet) must start at zero and increase with each row. The incremental increase does not have to be consistent. 2. Storage (acre-feet) must start at zero and increase with each row. Storage values should be physically based on the corresponding depth and surface area, but BAHM2013 does not check externally generated storage values. 3. Discharge (cfs) must start at zero. Discharge does not have to increase with each row. It can stay constant or even decrease. Discharge cannot be negative. Discharge should be based on the outlet structure’s physical dimensions and characteristics, but BAHM2013 does not check externally generated discharge values. 4. Surface area (acres) is only used if precipitation to and evaporation from the facility are applied. To input an externally generated SSD Table, first create and save the table outside of BAHM2013. Use the Browse button to locate and load the file into BAHM2013. Save the spreadsheet file as a comma-delimited file. A text file can also be created, if more convenient. More information on stage-storage-discharge tables, in general, can be found starting page 118. 68 Bay Area Hydrology Model 2013 User Manual – March 2014 To input columns of values beyond (to the right of) the Storage column click on the “Not Used” title and select the appropriate option. Use “Manual” when the discharge has been included in the external spreadsheet. 69 Bay Area Hydrology Model 2013 User Manual – March 2014 Use “Outlet Structure” to input riser and orifice dimensions. 70 Bay Area Hydrology Model 2013 User Manual – March 2014 The fifth column can be used for a second surface outlet (manual or outlet structure), infiltration, or aquifer recharge. Aquifer recharge differs from infiltration in how the model separately accounts for it. 71 Bay Area Hydrology Model 2013 User Manual – March 2014 HIGH GROUNDWATER/WETLAND ELEMENT The High Groundwater/Wetland element is a complex element that should only be used in special applications by advanced BAHM2013 users. The purpose of the high groundwater/ wetland element is to model hydrologic conditions where high groundwater rises to the surface (or near the surface) and reduces the ability of water to infiltrate into the soil. The element can be used to represent wetland conditions with surface ponding where the discharge from the wetland is via a surface release. The user is given the choice of using either a natural channel, berm/weir, or control structure to determine the release characteristics. The element provides default values for some of the parameters, especially as they relate to high groundwater. The user should be fully familiar with these parameters and the appropriate values for their site prior to attempting to use this element. The high groundwater parameter definitions are shown below. Cohension water porosity: soil pore space in micropores. 72 Bay Area Hydrology Model 2013 User Manual – March 2014 Gravitational water porosity: soil pore space in macropores in the lower and groundwater layers of the soil column. Upper gravitation water porosity: soil pore space in macropores in the upper layer of the soil column. Upper zone storage factor: portion of the water stored in macropores in the upper soil layer which will not surface discharge, but will percolate, evaporate or transpire. Lower zone storage factor: portion of the water stored in micropores in the lower soil layer which will not gravity drain, but will evaporate or transpire. NOTE: Due to permit restrictions on infiltration for stormwater treatment measures in areas of high groundwater, consult with the local municipal permitting agency regarding any project conditions that might involve using this element. 73 Bay Area Hydrology Model 2013 User Manual – March 2014 LID ELEMENTS The following pages contain information about these LID elements: Bioretention In-Ground Planter Flow-Through Planter Permeable Pavement Dispersion Lateral Basin (Pervious) Lateral I Basin (Impervious) Dry Well Infiltration Trench Infiltration Basin Green Roof Rainwater Harvesting 74 Bay Area Hydrology Model 2013 User Manual – March 2014 BIORETENTION ELEMENT The bioretention element is a landscaped treatment system in which the native soils have been excavated and replaced with engineered soil. The facility can have one or more surface outlets represented by an outlet structure with a riser and multiple orifices or a vertical orifice and weir overflow structure. The BAHM2013 bioretention element uses the HSPF hydraulic algorithms to route runoff, but the HSPF routing is modified to represent the two different flow paths that runoff can take. The routing is dependent on the inflow to the bioretention element and the engineered and native soils’ capacity to absorb additional runoff. HSPF Special Actions is used to check the soil capacity to determine the appropriate routing option. Infiltration from the engineered soil to the native soil is also possible, depending on the properties of the native soil. Bioretention facilities can include an underdrain pipe at a specified depth. There is no underdrain for A or B soils. The material layers represent the engineered “soils” (i.e., soil layer(s) and gravel) and their design characteristics (thickness and vertical water movement). Each engineered soil type has appropriate drainage characteristics assigned based on literature values. When a soil type is selected by the user then BAHM2013 automatically assigns the appropriate values for: 1. Wilting: wilting point (0-1) 2. Porosity: saturated moisture content (0-1) 75 Bay Area Hydrology Model 2013 User Manual – March 2014 3. 4. 5. 6. 7. K Sat: maximum saturated hydraulic conductivity (cm/hr) VG n: Van Genuchten number (from literature) A: alpha (constant) L: lambda (constant) BPH: bubbling pressure head (cm) The user can see the values for any of the soil types by selecting the soil type from the pulldown menu: If none of the available soil types represents the engineered soil planned for use on the site then the user can select a new soil type and input the appropriate values into the above input table. NOTE: For all bioretention-type facilities Attachment L of the Municipal Regional Stormwater Permit (MRP) specifies the biotreatment soil mix for the top layer (see “Specification of Soils for Biotreatment or Bioretention Facilities” in Attachment L for more details). BAHM 5 contains the appropriate soil values to meet the Attachment L standard. The first engineered soil layer should be the BAHM 5 soil mix specified by the Municipal Regional Stormwater Permit, Attachment L. 76 Bay Area Hydrology Model 2013 User Manual – March 2014 The second engineered soil layer is an intermediate material that is intended to prevent loss of fine material out of the engineered top layer soil mix into the gravel underlayer (layer 3). This layer is optional. The third (bottom) engineered soil layer should be gravel. A full list of the soil mixtures included in BAHM2013 is shown in Table 1. Table 1. BAHM2013 Soil Mixtures Soil Type BAHM 5* GRAVEL Sand Gravel Loamy Sand Coarse sand Humous loamy mcs Light loamy mcs Medium coarse sand (mcs) Loamy mcs Medium fine sand Fine sand Loamy fine sand Loam Sandy loam Fine sandy loam Clay loam Sandy clay loam Silty clay loam Silty clay Clay Peat Amended 1.5 in/hr Amended 2.5 in/hr Amended 3.0 in/hr Amended 5 in/hr SMMWW** Amended 15 in/hr ASTM 1 ASTM 2 ASTM 3 ASTM 4 ASTM 5 ASTM 6 ASTM 7 ASTM 8 ASTM 9 ASTM 10 Wilting Point Porosity 0.0700 0.0050 0.0200 0.1000 0.0520 0.0600 0.0600 0.0820 0.0600 0.0970 0.0520 0.0600 0.0560 0.0350 0.0560 0.0875 0.0665 0.0770 0.0980 0.0980 0.0995 0.0850 0.0800 0.0750 0.0700 0.0650 0.0600 0.0900 0.0825 0.0750 0.0725 0.0700 0.0675 0.0667 0.0659 0.0651 0.0643 0.450 0.420 0.420 0.450 0.395 0.470 0.394 0.365 0.301 0.350 0.364 0.439 0.503 0.437 0.504 0.445 0.432 0.475 0.507 0.507 0.863 0.450 0.470 0.480 0.490 0.850 0.480 0.410 0.420 0.430 0.440 0.450 0.460 0.470 0.480 0.490 0.500 77 VG n Ksat (cm/hr) A L BPH 1.700 10.000 3.000 3.500 3.162 2.348 2.145 2.959 1.941 2.755 2.552 1.738 1.479 1.445 1.660 1.413 1.318 1.514 1.318 1.318 3.050 1.400 1.500 1.600 2.200 3.000 3.200 1.500 1.550 1.600 1.650 1.700 1.850 2.000 2.150 2.300 2.450 12.70 1260.00 23.56 570.97 23.56 15.00 10.00 18.00 9.00 11.00 10.00 2.18 1.32 5.98 1.10 0.20 0.30 0.20 0.10 0.06 0.15 5.00 6.50 7.62 13.00 15.24 39.00 2.54 5.08 7.62 10.16 12.70 15.24 17.78 20.32 22.86 25.40 6.90 0.50 6.00 4.00 6.26 6.50 6.50 6.50 7.00 7.00 7.30 7.69 10.15 7.69 15.00 24.89 27.08 31.56 33.19 33.19 39.00 7.30 7.20 7.10 6.90 6.50 6.30 7.50 7.30 7.10 7.00 6.90 6.50 6.45 6.43 6.41 6.39 1.30 1.19 0.69 2.50 2.16 1.35 1.14 1.96 0.94 1.76 1.55 0.74 0.48 0.55 0.66 0.41 0.32 0.51 0.32 0.32 2.05 0.85 0.90 1.00 1.30 1.40 2.10 0.75 0.88 1.00 1.15 1.30 1.40 1.50 1.58 1.66 1.74 7.90 0.20 7.26 5.00 7.26 7.50 7.50 7.50 8.00 8.00 8.30 8.69 11.15 8.69 16.00 25.89 28.08 32.56 34.19 34.19 40.00 8.30 8.20 8.10 7.90 7.50 7.30 8.50 8.30 8.10 8.00 7.90 7.50 7.45 7.43 7.41 7.39 Bay Area Hydrology Model 2013 User Manual – March 2014 ASTM 11 ASTM 12 ASTM 13 ASTM 14 ASTM 15 ASTM 24.32 ASTM 35.46 ASTM 50 ASTM 60 ASTM 100 0.0635 0.0627 0.0619 0.0611 0.0603 0.0590 0.0550 0.0500 0.0490 0.0450 0.510 0.520 0.530 0.540 0.550 0.550 0.550 0.550 0.550 0.550 2.600 2.750 2.900 3.050 3.200 3.200 3.250 3.300 3.350 3.400 27.94 30.48 33.02 35.56 39.00 39.00 90.10 127.00 152.40 254.00 6.37 6.35 6.33 6.31 6.30 6.25 6.20 6.15 6.10 6.05 1.82 1.90 1.98 2.06 2.14 2.25 2.30 2.35 2.40 2.45 *BAHM 5 is the San Francisco Bay Municipal Regional Permit required top layer standard soil mix for bioretention facilities. **SMMWW is the Washington State Department of Ecology required top layer standard soil mix for bioretention facilities. Wilting: wilting point (0-1) Porosity: saturated moisture content (0-1) K Sat: maximum saturated hydraulic conductivity (cm/hr) VG n: Van Genuchten number (from literature) A: alpha (constant) L: lambda (constant) BPH: bubbling pressure head (cm) Table 1 values are from Schaap and Leij, 1998 soil parameter estimations using Rosetta. The water movement through the soil column calculations are based on the methodology described in Appendix E: Bioretention Modeling Methodology. The native soil infiltration is input by the user and is assumed to be constant throughout the year. Inflow to the bioretention facility can exceed the engineered soil infiltration rate. When this occurs the extra water ponds on the surface of the bioretention area. The extra water can then infiltrate into the soil during the next time step or can flow out of the bioretention facility through its surface outlet if the ponding exceeds the surface outlet’s storage.[JB1] Runoff in both the surface storage and engineered soil storage is available for evapotranspiration. Surface storage evapotranspiration is set to the potential evapotranspiration; the engineered soil evapotranspiration pan evaporation coefficient is set to 0.50 to reflect reduced evapotranspiration from the engineered soil. The user is required to enter the following information about the bioretention facility: 78 7.37 7.35 7.33 7.31 7.30 7.20 7.00 6.80 6.40 6.00 Bay Area Hydrology Model 2013 User Manual – March 2014 The bioretention dimensions are specified in terms of bottom length, bottom width, freeboard, over-road flooding, effective total depth, bottom slope, and side slopes. Bottom Length (ft): length dimension of surface bottom. Bottom Width (ft): width dimension of surface bottom. Freeboard (ft): height above riser to top of facility. Over-road Flooding (ft): maximum depth of flow over weir/street (only required for vertical orifice plus overflow outlet). Effective Total Depth (ft): the total depth of the engineered soil layer(s) plus riser height plus freeboard; effective total depth is computed by BAHM2013. Bottom Slope (ft/ft): the slope of the bioretention facility length; must be greater than zero. Top and Bottom Side Slope (ft/ft): H/V ratio of horizontal distance to vertical; 0 (zero) for vertical sides. Top and bottom refer to sides on plan view of bioretention. Left Side Slope (ft/ft): H/V ratio of horizontal distance to vertical; 0 (zero) for vertical sides. Left refers to left side on plan view of bioretention. Right Side Slope (ft/ft): H/V ratio of horizontal distance to vertical; 0 (zero) for vertical sides. Right refers to right side on plan view of bioretention. Infiltration Rate (inches per hour): infiltration rate of the engineered soil for all layers. Layer Depth (feet): depth of engineered soil. Note that there can be a maximum of three different engineered soil layers. Infiltration to the native soil can be turned on by setting Native Infiltration to YES. The parameters for native soil infiltration are: Measured Infiltration Rate (inches per hour): infiltration rate of the native soil. Infiltration Reduction Factor: between 0 and 1 (1/Native soil infiltration rate safety factor (see page 114). Use Wetted Surface Area (sidewalls): YES or NO; YES allows infiltration to the native soil through the sidewalls of the bioretention unit; otherwise all infiltration is through the bottom only. If infiltration is used then the user should consult the Infiltration discussion on page 114. NOTE: See Appendix D or consult with the local municipal permitting agency for additional considerations regarding infiltration and determination of the appropriate infiltration reduction factor. The user has two bioretention surface outlet configuration choices: (1) riser outlet structure, or (2) vertical orifice + overflow. 79 Bay Area Hydrology Model 2013 User Manual – March 2014 The input information required for the riser outlet structure is: Riser Height above Bioretention (feet): depth of surface ponding before the riser is overtopped. Riser Diameter (inches): diameter of the stand pipe. Riser Type: Flat or Notched. Notch Type: Rectangular, V-Notch, or Sutro. For a rectangular notch: Notch Height (feet): distance from the top of the weir to the bottom of the notch. Notch Width (feet): width of notch; cannot be larger than the riser circumference. For more information on riser notch options and orifices see discussion in OUTLET STRUCTURE CONFIGURATIONS section. 80 Bay Area Hydrology Model 2013 User Manual – March 2014 The input information required for the vertical orifice plus overflow is: Vertical Orifice Diameter (inches): diameter of vertical opening below the weir. Vertical Orifice Elevation (inches): vertical distance from the top of the engineered soil surface to the bottom of the vertical orifice. Width of Over-road Flow (feet): weir/street length. Over-road Flooding (ft): maximum depth of flow over weir/street (only required for vertical orifice plus overflow outlet). 81 Bay Area Hydrology Model 2013 User Manual – March 2014 Diagram of bioretention facility with vertical orifice plus overflow: Width of Over-road Flow Over-road Flooding Freeboard Vertical Orifice Diameter Native Soil Vertical Orifice Elevation Amended Soil Underdrain Layer 1 Layer 2 Layer 3 Native Soil 82 Effective Total Depth Native Soil Bay Area Hydrology Model 2013 User Manual – March 2014 To use the underdrain click the Underdrain Used box and input an underdrain diameter (feet) and the underdrain orifice diameter (inches). The bottom of the underdrain pipe is set by the user based on the offset (inches) above the bottom of the lowest engineered soil layer. Underdrain Used: if C or D soil Underdrain Diameter (ft): Underdrain pipe diameter (C or D soil). The engineered soil layer fills with stormwater from the top on down to where it can drain to the native soil (if Native Infiltration is set to YES) and/or the underdrain pipe (if Underdrain Used box is checked). Water enters the underdrain when the engineered soil becomes saturated down to the top of the underdrain. The underdrain pipe fills and conveys water proportionally to the depth of engineered soil saturation. When the engineered soil is fully saturated the underdrain pipe is at full capacity. If native infiltration is turned on then native infiltration will start when/if: 1. Water starts to fill the underdrain (if an underdrain is used). 2. Water enters the engineered soil (if Use Wetted Surface Area (sidewalls) is set to YES). 3. Water saturates the engineered soil layer(s) to 2/3rds of the total engineered soil depth (if there is no underdrain and Wetted Surface Area is set to NO). 83 Bay Area Hydrology Model 2013 User Manual – March 2014 There is a simple bioretention option. It is computationally much faster than the standard bioretention. Before using the simple option read the note below to understand the limitations of the simple bioretention. NOTE: The standard bioretention routine uses HSPF Special Actions to check the available engineered soil storage and compares it with the inflow rate. Because of the check done by HSPF Special Actions simulations using the bioretention element take much longer than simulations not using the bioretention element. Simulations that normally take only seconds may take multiple minutes when one or more bioretention elements are added, depending on the computational speed of the computer used. One solution to this problem is to use the simple bioretention option (check the Use Simple Bioretention box). The simple bioretention does not include HSPF Special Actions. It is less accurate than the standard bioretention option. Tests have shown that the simple option should only be used when the bioretention area (and volume) is relatively small compared to the contributing basin area. If in doubt, model the bioretention area both ways and see how close the simple answer is to the standard method. The standard method will always be more accurate than the simple option. 84 Bay Area Hydrology Model 2013 User Manual – March 2014 IN-GROUND (INFILTRATION) PLANTER ELEMENT An in-ground planter allows stormwater to enter the planter above ground and then infiltrate through the soil and gravel storage layers before exiting through a discharge pipe. Water can also infiltrate into the native soil beneath the planter. For the purpose of flow control the discharge from the pipe should not exceed the pre-project discharge from the project site for the flow duration range specified by the local jurisdiction. In-Ground (Infiltration) Planter In BAHM2013 the in-ground planter is represented by a specialized application of the bioretention element available in the LID Toolbox. To access the elements in the LID Toolbox menu click on the LID Toolbox bar. The in-ground (infiltration) planter dimensions and parameters are: 85 Bay Area Hydrology Model 2013 User Manual – March 2014 Planter Length (ft): Length of planter box. Planter Bottom Width (ft): Width of planter box. Freeboard: Additional storage height above top of riser. Effective Total Depth (ft): Planter height from bottom of planter to top of riser plus freeboard. Soil Layer 1 Type: Select from Soil Type pulldown menu (select BAHM 5). Soil Layer 1 (ft): Planter soil layer depth. NOTE: For all bioretention-type facilities Attachment L of the Municipal Regional Stormwater Permit (MRP) specifies the biotreatment soil mix for the top layer (see “Specification of Soils for Biotreatment or Bioretention Facilities” in Attachment L for more details). BAHM 5 contains the appropriate soil values to meet the Attachment L standard. The first engineered soil layer should be the BAHM 5 soil mix specified by the Municipal Regional Stormwater Permit, Attachment L. Soil Layer 2 Type: Select from Soil Type pulldown menu (usually gravel). Soil Layer 2 (ft): Planter gravel layer depth. Underdrain Diameter (ft): Planter underdrain pipe diameter (set to zero if no underdrain is included). Orifice Diameter (in): Planter underdrain pipe orifice diameter (set to zero if no underdrain is included). Riser Height Above Planter Surface (ft): Height of planter overflow pipe above planter soil surface. Riser Diameter (in): Planter overflow pipe diameter. Native Infiltration: Yes (infiltration into the underlying native soil) Measured Infiltration Rate (in/hr): Native soil infiltration rate. If infiltration is used then the user should consult the Infiltration discussion on page 114. NOTE: See Appendix D or consult with the local municipal permitting agency for additional considerations regarding infiltration and determination of the appropriate infiltration reduction factor. 86 Bay Area Hydrology Model 2013 User Manual – March 2014 BAHM2013 includes automated sizing of the planter box based on a user-set target infiltration percentage. After the target percentage is set then the user can click on the Size Infiltration Planter button. BAHM2013 will iterate to determine the planter length and width needed to meet the target infiltration percentage. 87 Bay Area Hydrology Model 2013 User Manual – March 2014 FLOW-THROUGH PLANTER ELEMENT A flow-through planter is similar to the inground (infiltration) planter, except that water is not allowed to infiltrate into the native soil underlying the gravel layer of the planter. As with the in-ground planter, stormwater enters the planter above ground and then infiltrate through the soil and gravel storage layers before exiting through a discharge pipe. Flow-through Planter For the purpose of flow control the discharge from the pipe should not exceed the preproject discharge from the project site for the flow duration range specified by the local jurisdiction. In BAHM2013 the flow-through planter is represented by a specialized application of the bioretention element available in the LID Toolbox. To access the elements in the LID Toolbox menu click on the LID Toolbox bar. The flow-through planter dimensions and parameters are: 88 Bay Area Hydrology Model 2013 User Manual – March 2014 Planter Length (ft): Length of planter box. Planter Bottom Width (ft): Width of planter box. Freeboard: Additional storage height above top of riser. Effective Total Depth (ft): Planter height from bottom of planter to top of riser plus freeboard. Soil Layer 1 Type: Select from Soil Type pulldown menu (select BAHM 5). Soil Layer 1 (ft): Planter soil layer depth. NOTE: For all bioretention-type facilities Attachment L of the Municipal Regional Stormwater Permit (MRP) specifies the biotreatment soil mix for the top layer (see “Specification of Soils for Biotreatment or Bioretention Facilities” in Attachment L for more details). BAHM 5 contains the appropriate soil values to meet the Attachment L standard. The first engineered soil layer should be the BAHM 5 soil mix specified by the Municipal Regional Stormwater Permit, Attachment L. Soil Layer 2 Type: Select from Soil Type pulldown menu (usually gravel). Soil Layer 2 (ft): Planter gravel layer depth. Underdrain Diameter (ft): Planter underdrain pipe diameter (set to zero if no underdrain is included). Orifice Diameter (in): Planter underdrain pipe orifice diameter (set to zero if no underdrain is included). Riser Height Above Planter Surface (ft): Height of planter overflow pipe above planter soil surface. Riser Diameter (in): Planter overflow pipe diameter. The only difference between an in-ground (infiltration) planter and a flow-through planter is whether or not native infiltration is allowed. 89 Bay Area Hydrology Model 2013 User Manual – March 2014 PERMEABLE PAVEMENT ELEMENT Permeable pavement LID options include porous asphalt or concrete and grid/lattice systems (non-concrete) and paving blocks. The use of any of these LID options requires that certain minimum standards and requirements are met related to subgrade, geotextile material, separation or bottom filter layer, base material, wearing layer, drainage conveyance, acceptance testing, and surface maintenance. NOTE: Permeable pavement can be used in place of conventional pavement for roadways, sidewalks, driveways, and parking lots. Check with Appendix D or the local municipal permitting agency to find out under what conditions permeable pavement is allowed. Permeable pavement can be represented by the permeable pavement element in BAHM2013 if the following three conditions are met: 1. The infiltration rate of the permeable pavement is greater than the peak rainfall rate. 2. The infiltration rate of the permeable pavement is greater than the underlying native soil. 3. There is subgrade layer of crushed rock/gravel between the permeable pavement and the native soil. 90 Bay Area Hydrology Model 2013 User Manual – March 2014 The permeable pavement element (also called porous pavement) is an impervious basin element that drains directly to storage layer similar to a gravel trench bed. The permeable pavement element is a new BAHM2013 element, not previously available in BAHM. The permeable pavement element dimensions and parameters are: Pavement Length (ft): Roadway length. Pavement Bottom Width (ft): Roadway width. Effective Total Depth (ft): Height from bottom of permeable pavement subgrade to top of pavement plus at least 0.5 feet extra. Bottom Slope (ft/ft): Gravel layer slope or grade. The effective volume factor is a value between zero and 1.00. It is only used when the bottom slope is greater than 2%. The effective volume factor is the fraction ratio of the average maximum water depth behind a check dam in the gravel layer (Sublayer 1) compared to the maximum gravel layer depth (Sublayer 1). For example, if the average maximum water height is 6” and the gravel depth is 9” then the Effective Volume Factor = 0.67 (6/9). The effective volume factor is multiplied by the Sublayer 1 storage volume to determine the actual maximum volume available for stormwater storage before the check dam is overtopped and the water in the gravel layer depth (Sublayer 1) proceeds to a downstream conveyance facility. Pavement Thickness (ft): Permeable pavement layer depth. Pavement Porosity: Permeable pavement porosity. Layer 1 Thickness (ft): Subgrade gravel layer depth. Layer 1 Porosity: Subgrade gravel porosity. Layer 2 Thickness (ft): Sand layer depth (if appropriate). Layer 2 Porosity: Sand porosity. Ponding Depth Above Pavement (ft): Height at which sheet flow occurs on the pavement. Underdrain Diameter (in): Set to zero if there is no underdrain. Underdrain Height (ft): Height of the bottom of the underdrain above the bottom layer. Native Infiltration: Yes (infiltration into the underlying native soil) Measured Infiltration Rate (in/hr): Native soil infiltration rate. Infiltration Reduction Factor: 1/Native soil infiltration rate safety factor (see page 114). If infiltration is used then the user should consult the Infiltration discussion on page 114. NOTE: See Appendix D or consult with the local municipal permitting agency for additional considerations regarding infiltration and determination of the appropriate infiltration reduction factor. 91 Bay Area Hydrology Model 2013 User Manual – March 2014 The permeable pavement layers represent the pavement layer and two subgrade layers and their design characteristics (thickness and porosity). The subgrade layers (Sublayer 1 and Sublayer 2) are available to provide storage prior to discharge through infiltration to the native soil or discharge via an underdrain. Quick Pavement will create a permeable pavement feature with default values without checking it for compliancy with flow duration standards. The permeable pavement surface area automatically receives rainfall and produces evapotranspiration. Due to this model input the permeable pavement surface area should be excluded from the basin element’s total surface area. NOTE: Check with Appendix D or the local municipal permitting agency to find out if ponding on the surface of the pavement is allowed. If ponding is not allowed then the ponding depth above pavement value should be set to zero. 92 Bay Area Hydrology Model 2013 User Manual – March 2014 DISPERSION LID Dispersion practices can include roof runoff dispersion onto adjacent yard area, parking lot runoff onto adjacent lawn area, and reverse slope sidewalks draining onto adjacent vegetated areas. NOTE: Specific minimum requirements and standards must be met to allow dispersion (see Appendix D and the local municipal permitting agency for details). Dispersion is represented in BAHM2013 with lateral flow basin elements. Roof Dispersion Runoff Example 93 Bay Area Hydrology Model 2013 User Manual – March 2014 The impervious lateral basin (Lateral I Basin 1 in the above scenario) is connected to the pervious lateral basin (Lateral Basin 1). All of the runoff generated by impervious roof Lateral I Basin 1 is distributed onto pervious urban Lateral Basin 1 before routing to a stormwater control facility (pond, vault, etc.). The lateral basin dimensions and parameters to adjust to represent dispersion are: Impervious/IMPLND type: select either road, roof, sidewalks, parking, or driveways and the associated slope category (all roofs are the same; there is no roof slope category). Soil (PERLND) type: select one of the 48 different pervious land types based on soil, vegetation, and slope. A and B soils will provide more dispersion benefits than C or D soils because of their ability to infiltrate more runoff. Lateral Area: size of contributing or receiving area (acres). Dispersion will decrease the total runoff, but will not totally eliminate the need for a stormwater control facility. A pond can be connected to the discharge from the pervious lateral basin to provide the final required mitigation. 94 Bay Area Hydrology Model 2013 User Manual – March 2014 LATERAL BASIN ELEMENT (Pervious) Runoff dispersion from impervious surfaces onto adjacent pervious land can be modeled using pervious and impervious lateral basins. For example, runoff from an impervious parking lot can sheet flow onto an adjacent lawn prior to draining into a stormwater conveyance system. This action slows the runoff and allows for some limited infiltration into the pervious lawn soil prior to discharging into a conveyance system. The pervious lateral basin is similar to the standard basin except that the runoff from the lateral basin goes to another adjacent lateral basin (impervious or pervious) rather than directly to a conveyance system or stormwater facility. By definition, the pervious lateral basin contains only a single pervious land type. Impervious area is handled separately with the impervious lateral basin (Lateral I Basin). The user selects the pervious lateral basin land type by checking the appropriate box on the Available Soil Types Tools screen. This information is automatically placed in the Soil (PERLND) Type box above. Once entered, the land type can be changed by clicking on the Change button on the right. The user enters the number of acres represented by the lateral basin land type. 95 Bay Area Hydrology Model 2013 User Manual – March 2014 If the lateral basin contains two or more pervious land use types then the user should create a separate lateral basin for each. 96 Bay Area Hydrology Model 2013 User Manual – March 2014 LATERAL I BASIN ELEMENT (Impervious) The impervious lateral basin is similar to the standard basin except that the surface runoff from the lateral impervious basin goes to another adjacent lateral basin (impervious or pervious) rather than directly to a conveyance system or stormwater facility. By definition, the impervious lateral basin contains only impervious land types. Pervious area is handled separately with the pervious lateral basin (Lateral Basin). The user selects the impervious lateral basin land type by checking the appropriate box on the Available Impervious Coverages screen. This information is automatically placed in the Impervious (IMPLND) Type box above. Once entered, the land type can be changed by clicking on the Change button on the right. The user enters the number of acres represented by the lateral impervious basin land type. If the lateral impervious basin contains two or more impervious land use types then the user should create a separate lateral I basin for each. To model parking lot runoff dispersion onto adjacent lawn connect the Lateral I Basin (the parking lot) to the Lateral Basin (the lawn). In the model’s calculations surface runoff from the parking lot is added to the surface of the lawn (urban vegetation). The total runoff will then directed to a stormwater conveyance system by the user. 97 Bay Area Hydrology Model 2013 User Manual – March 2014 DRY WELL ELEMENT A dry well is similar to the in-ground (infiltration) planter, except that there is no bottom discharge pipe or underdrain. Water must infiltrate into the native soil underlying the gravel layer of the planter. The native soil must have sufficient infiltration capacity to infiltrate all of the stormwater. In BAHM2013 the dry well is represented by a specialized application of the gravel trench element available in the LID Toolbox. To access the elements in the LID Toolbox menu click on the LID Toolbox bar. The dry well dimensions and parameters: Dry Well Length (ft): Length of well. Dry Well Width (ft): Width of well. Reservoir Thickness (ft): Depth of open water storage. 98 Dry Well Bay Area Hydrology Model 2013 User Manual – March 2014 Top Soil Layer Thickness (ft): Dry well soil layer depth. Top Soil Layer Porosity: Dry well soil porosity. Gravel/Sand Layer Thickness (ft): Dry well gravel layer depth. Gravel/Sand Layer Porosity: Dry well gravel porosity. Native Infiltration: Yes (infiltration into the underlying native soil) Measured Infiltration Rate (in/hr): Native soil infiltration rate. If infiltration is used then the user should consult the Infiltration discussion on page 114. BAHM2013 includes automated sizing of the dry well based on a user-set target infiltration percentage. After the target percentage is set then the user can click on the Size Dry Well button. BAHM2013 will iterate to determine the dry well length and width needed to meet the target infiltration percentage. NOTE: See Appendix D or consult with the local municipal permitting agency for additional considerations regarding infiltration and determination of the appropriate infiltration reduction factor. Note that the dry well is covered; there is no precipitation on or evaporation from the dry well. 99 Bay Area Hydrology Model 2013 User Manual – March 2014 INFILTRATION TRENCH ELEMENT An infiltration trench is similar to the dry well. There is no bottom discharge pipe or underdrain. Water must infiltrate into the native soil underlying the gravel layer of the planter. The native soil must have sufficient infiltration capacity to infiltrate all of the stormwater. In BAHM2013 the infiltration trench is Infiltration Trench represented by a specialized application of the gravel trench element available in the LID Toolbox. To access the elements in the LID Toolbox menu click on the LID Toolbox bar. The infiltration trench dimensions and parameters are: Trench Length (ft): Infiltration trench length. Trench Bottom Width (ft): Infiltration trench width. Berm Height (ft): Height above top of trench at which overflow occurs (one foot above riser height). 100 Bay Area Hydrology Model 2013 User Manual – March 2014 Layer 1 Thickness (ft): Infiltration trench soil layer depth. Layer 1 Porosity: Infiltration trench soil porosity. Riser Height (ft): Height of infiltration trench overflow pipe above trench soil surface. If a weir is preferred instead of a riser then set the riser height to the weir height and set the riser diameter to the weir length. Riser Diameter (in): Infiltration trench overflow pipe diameter. Native Infiltration: Yes (infiltration into the underlying native soil) Measured Infiltration Rate (in/hr): Native soil infiltration rate. If infiltration is used then the user should consult the Infiltration discussion on page 114. The infiltration trench does not include an underdrain. If an underdrain is required then use the gravel trench element (page 58) instead and set the underdrain height and orifice diameter using the orifice input (the orifice height is defined as from the bottom of the lowest layer in the trench). BAHM2013 includes automated sizing of the infiltration trench based on a user-set target infiltration percentage. After the target percentage is set then the user can click on the Size Infiltration Trench button. BAHM2013 will iterate to determine the infiltration trench length and width needed to meet the target infiltration percentage. NOTE: See Appendix D or consult with the local municipal permitting agency for additional considerations regarding infiltration and determination of the appropriate infiltration reduction factor. Note that, unlike the dry well, the infiltration trench receives precipitation on and evaporation from the trench surface. 101 Bay Area Hydrology Model 2013 User Manual – March 2014 INFILTRATION BASIN ELEMENT An infiltration basin/pond allows stormwater to enter the basin/pond above ground and then infiltrate through the bottom of the basin/pond before exiting through a discharge pipe. Water can also infiltrate into the native soil beneath the basin/pond. For the purpose of flow control the discharge from the pipe should not exceed the pre-project discharge from the project site for the flow duration range specified by the local jurisdiction. Infiltration Basin/Pond In BAHM2013 the infiltration basin/pond is represented by a specialized application of the trapezoidal pond element available in the LID Toolbox. To access the elements in the LID Toolbox menu click on the LID Toolbox bar. The infiltration basin/pond dimensions and parameters are: Bottom Length (ft): Infiltration basin/pond length. 102 Bay Area Hydrology Model 2013 User Manual – March 2014 Bottom Width (ft): Infiltration basin/pond width. Effective Depth (ft): Infiltration basin height from basin/pond bottom to top of riser plus at least 0.5 feet extra. Left Side Slope (H/V): 0 (zero) for vertical infiltration basin/pond sides. Bottom Side Slope (H/V): 0 (zero) for vertical infiltration basin/pond sides. Right Side Slope (H/V): 0 (zero) for vertical infiltration basin/pond sides. Top Side Slope (H/V): 0 (zero) for vertical infiltration basin/pond sides. Riser Height (ft): Height of infiltration basin/pond overflow pipe above basin/pond soil surface. Riser Diameter (in): Infiltration basin/pond overflow pipe diameter. Infiltration: Yes (infiltration into the underlying native soil) Measured Infiltration Rate (in/hr): Native soil infiltration rate. Use Wetted Surface Area (sidewalls): Yes, if infiltration through the basin/pond side slopes is allowed. If infiltration is used then the user should consult the Infiltration discussion on page 114. BAHM2013 includes automated sizing of the infiltration basin/pond based on a user-set target infiltration percentage. After the target percentage is set then the user can click on the Size Infiltration Basin button. BAHM2013 will iterate to determine the infiltration basin/pond length and width needed to meet the target infiltration percentage. NOTE: See Appendix D or consult with the local municipal permitting agency for additional considerations regarding infiltration and determination of the appropriate infiltration reduction factor. An infiltration basin/pond receives precipitation on and evaporation from the basin/pond surface. 103 Bay Area Hydrology Model 2013 User Manual – March 2014 GREEN ROOF ELEMENT A green roof is roof covered with vegetation and a growing medium (typically an engineered soil mix). Green roofs are not always green and are also known as vegetated roofs or eco-roofs. The advantage of a green roof is its ability to store some runoff on the plants’ surfaces and in the growing medium. Evapotranspiration by the plants and growing medium reduces the total runoff. Runoff movement through the growing medium slows down the runoff and reduces peak discharge during storm events. A green roof is represented by the BAHM2013 green roof element. 104 Bay Area Hydrology Model 2013 User Manual – March 2014 The dimensions and parameters to adjust to represent a green roof are: Green Area (ac): Size of the green roof. Depth of Material (in): Growing media/soil depth. Slope of Rooftop (ft/ft): Roof surface slope. Vegetative Cover: Type of vegetation on green roof (choices are: ground cover, shrubs, or trees). Length of rooftop (ft): Length of the longest runoff path to reach a roof drain. Default input values are automatically included with the element. They should be changed to reflect actual roof conditions. The green roof surface area automatically receives rainfall and produces evapotranspiration. Due to this model input the green roof surface area should be excluded from the basin element’s total surface area. If the green roof is connected to a downstream element or is selected as a point of compliance the user should make sure that the groundwater runoff is included. Unlike the other drainage area elements (basin element, etc.), the green roof groundwater always contributes to the total runoff. The green roof groundwater has nowhere else to go. 105 Bay Area Hydrology Model 2013 User Manual – March 2014 RAINWATER HARVESTING Rainwater harvesting involves water collection, storage, and reuse for residential outdoor use. The LID credit is pretty simple: the drainage area for which there is 100% capture does not have to be included in the BAHM2013 Mitigated land use scenario. 106 Bay Area Hydrology Model 2013 User Manual – March 2014 ADDITIONAL INFORMATION The following pages contain additional information about these features: Outlet Structure Configurations Infiltration Auto Pond, Auto Vault, Auto Tank Stage-Storage-Discharge Table Point of Compliance Connecting Elements 107 Bay Area Hydrology Model 2013 User Manual – March 2014 OUTLET STRUCTURE CONFIGURATIONS The trapezoidal pond, vault, tank, irregular pond, gravel trench bed, and sand filter all use a riser for the outlet structure to control discharge from the facility. The riser is a vertical pipe with a height above pond bottom (typically one foot less than the effective depth). The user specifies the riser height and diameter. The riser can have up to three round orifices. The bottom orifice is usually located at the bottom of the pond and/or above any dead storage in the facility. The user can set the diameter and height of each orifice. The user specifies the riser type as either flat or notched. The weir notch can be either rectangular, V-notch, or a Sutro weir. The shape of each type of weir is shown below. Rectangular Notch V-Notch 108 Sutro Bay Area Hydrology Model 2013 User Manual – March 2014 By selecting the appropriate notch type the user is then given the option to enter the appropriate notch type dimensions. Riser and orifice equations used in BAHM2013 are provided below. Headr = the water height over the notch/orifice bottom. q = discharge Riser Head Discharge: Head = water level above riser q = 9.739 * Riser Diameter * Head ^ 1.5 Orifice Equation: q = 3.782 * (Orifice Diameter) ^ 2 * SQRT(Headr) Rectangular Notch: b = NotchWidth *- (1- 0.2 * Headr) where b >= 0.8 q = 3.33 * b * Headr ^ 1.5 Sutro: Wh = Top Width + {(Bottom Width- Top Width)/Notch Height }* Headr Wd = Bottom Width - Wh (the difference between the bottom and top widths) Q1 = (rectangular notch q where Notch Width = Wh) Q2 = (rectangular notch q where Notch Width = Wd) q = Q1 + Q2 / 2 V-Notch: Notch Bottom = height from bottom of riser to bottom of notch Theta = Notch Angle a = 2.664261 - 0.0018641 * Theta + 0.00005761 * Theta ^2 b = -0.48875 + 0.003843 * Theta - 0.000092124 * Theta ^2 c = 0.3392 - 0.0024318 * Theta + 0.00004715 * Theta ^2 YoverH = Headr / (NotchBottom + Headr) Coef = a + b * Headr + c * Headr ^2 q = (Coef * Tan(Theta / 2)) * (Headr ^ (5 / 2)) These equations are provided from the Washington State Department of Ecology’s 2005 Stormwater Management Manual for Western Washington. The outlet designs are shown 109 Bay Area Hydrology Model 2013 User Manual – March 2014 below. They have been reproduced from Volume III of the Stormwater Management Manual for Western Washington which has more information on the subject. 110 Bay Area Hydrology Model 2013 User Manual – March 2014 111 Bay Area Hydrology Model 2013 User Manual – March 2014 The physical configuration of the outlet structure should include protection for the riser and orifices to prevent clogging of the outlet from debris or sediment. Various outlet configurations are shown below. They have been reproduced from Volume III of the Stormwater Management Manual for Western Washington which has more information on the subject. 112 Bay Area Hydrology Model 2013 User Manual – March 2014 Riser protection structures. Diagrams courtesy of Washington State Department of Ecology. 113 Bay Area Hydrology Model 2013 User Manual – March 2014 INFILTRATION Infiltration of stormwater runoff is a recommended solution if certain conditions are met. These conditions include: a soils report, testing, groundwater protection, pre-settling, and appropriate construction techniques. NOTE: See Appendix D or consult with the local municipal permitting agency for additional considerations regarding infiltration and determination of the appropriate infiltration reduction factor. The user clicks on the Infiltration option arrow to change infiltration from NO to YES. This activates the infiltration input options: measured infiltration rate, infiltration reduction factor, and whether or not to allow infiltration through the wetted side slopes/walls. The infiltration reduction factor is a multiplier for the measured infiltration rate and should be less than one. It is the same as the inverse of a safety factor. For example, a safety factor of 2 is equal to a reduction factor of 0.5. Infiltration occurs only through the bottom of the facility if the wetted surface area option is turned off. Otherwise the entire wetted surface area is used for infiltration. After the model is run and flow is routed through the infiltration facility the total volume infiltrated, total volume through the riser, total volume through the facility, and percent infiltrated are reported on the screen. If the percent infiltrated is 100% then there is no surface discharge from the facility. The percent infiltrated can be less than 100% as long as the surface discharge does not exceed the flow duration criteria. Infiltration facilities have the option to allow users to automatically size the facility to meet an infiltration target percentage. The user can set the target percentage for being filtered/infiltrated to 80% to meet the water quality treatment standard. 114 Bay Area Hydrology Model 2013 User Manual – March 2014 AUTO POND, AUTO VAULT, AUTO TANK Auto Pond, Auto Vault, and Auto Tank all work the same. Each optimizing routine automatically creates a pond, vault, or tank size and designs the outlet structure to meet the flow duration criteria. The user can either create a pond, vault, or tank from scratch or optimize an existing design. The following information applies to all three optimizing routines (Auto Pond, Auto Vault, and Auto Tank), but for the purposes of simplifying the following documentation the term “Auto Pond” applies equally to Auto Vault and Auto Tank. Auto Pond requires that the Pre-project and Mitigated basins be defined prior to using Auto Pond. Clicking on the Auto Pond button brings up the Auto Pond window and the associated Auto Pond controls. Auto Pond controls: Automatic Pond Adjuster: The slider at the top of the Auto Pond window allows the user to decide how thoroughly the pond will be designed for efficiency. The lowest setting (01 min) at the left constructs an initial pond without checking the flow duration criteria. The second setting to the right creates and sizes a pond to pass the flow duration criteria; 115 Bay Area Hydrology Model 2013 User Manual – March 2014 however, the pond is not necessarily optimized. The higher settings increase the amount of optimization. The highest setting (farthest left) will size the most efficient (smallest) pond, but will result in longer computational time. Pond Depth: Pond depth is the total depth of the pond and should include at least one foot of freeboard (above the riser). The pond’s original depth will be used when optimizing an existing pond; changing the value in the Pond Depth text box will override any previous set depth value. The default depth is 4 feet. Pond Length to Width Ratio: This bottom length to width ratio will be maintained regardless of the pond size or orientation. The default ratio value is 1.0 Pond Side Slopes: Auto Pond assumes that all of the pond’s sides have the same side slope. The side slope is defined as the horizontal distance divided by the vertical. A typical side slope is 3 (3 feet horizontal to every 1 foot vertical). The default side slope value is 3. Choose Outlet Structure: The user has the choice of either 1 orifice and rectangular notch or 3 orifices. If the user wants to select another outlet structure option then the pond must be manually sized. Create Pond: This button creates a pond when the user does not input any pond dimensions or outlet structure information. Any previously input pond information will be deleted. Optimize Pond: This button optimizes an existing pond. It cannot be used if the user has not already created a pond. Accept Pond: This button will stop the Auto Pond routine at the last pond size and discharge characteristics that produce a pond that passes the flow duration criteria. Auto Pond will not stop immediately if the flow duration criteria have not yet been met. The bottom length and width and volume at riser head will be computed by Auto Pond; they cannot be input by the user. AutoVault operates the same way as Auto Pond. There are some situations where Auto Pond will not work. These situations occur when complex routing conditions upstream of the pond make it difficult or impossible for Auto Pond to determine which land use will be contributing runoff to the pond. For these situations the pond will have to be manually sized. Go to page 47 to find information on how to manually size a pond or other HM facility. NOTE: If Auto Pond selects a bottom orifice diameter smaller than the smallest diameter allowed by the local municipal permitting agency then the user has the option of specifying a minimum allowable bottom orifice diameter even if this size 116 Bay Area Hydrology Model 2013 User Manual – March 2014 diameter is too large to meet flow duration criteria for this element. Additional mitigating BMPs may be required to meet local hydromodification control requirements. Please see Appendix D or consult with local municipal permitting agency for more details. For manual sizing information see page 47. 117 Bay Area Hydrology Model 2013 User Manual – March 2014 STAGE-STORAGE-DISCHARGE TABLE The stage-storage-discharge table hydraulically represents any facility that requires stormwater routing. The table is automatically generated by BAHM2013 when the user inputs storage facility dimensions and outlet structure information. BAHM2013 generates 91 lines of stage, surface area, storage, surface discharge, and infiltration values starting at a stage value of zero (facility bottom height) and increasing in equal increments to the maximum stage value (facility effective depth). When the user or BAHM2013 changes a facility dimension (for example, bottom length) or an orifice diameter or height the model immediately recalculates the stage-storagedischarge table. The user can input to BAHM2013 a stage-storage-discharge table created outside of BAHM2013. To use a stage-storage-discharge table created out of BAHM2013 the SSD Table element is required (see page 67). See the SSD Table element description below for more information on how to load such a table to BAHM2013 program. 118 Bay Area Hydrology Model 2013 User Manual – March 2014 POINT OF COMPLIANCE BAHM2013 allows for multiple points of compliance (maximum of 59) in a single project. A point of compliance is defined as the location at which the Pre-project and Mitigated flows will be analyzed for compliance with the flow control standard. The point of compliance is selected by right clicking on the element at which the compliance analysis will be made. In the example above, the point of compliance analysis will be conducted at the outlet of the trapezoidal pond. 119 Bay Area Hydrology Model 2013 User Manual – March 2014 Once the point of compliance has been selected the element is modified on the Schematic screen to include a small box with the letter “A” (for Analysis) in the lower right corner. This identifies the outlet from this element as a point of compliance. The number 1 next to the letter “A” is the number of the POC (POC 1). 120 Bay Area Hydrology Model 2013 User Manual – March 2014 CONNECTING ELEMENTS Elements are connected by right clicking on the upstream element (in this example Basin 1) and selecting and then left clicking on the Connect To Element option. By doing so BAHM2013 extends a line from the upstream element to wherever the user wants to connect that element. 121 Bay Area Hydrology Model 2013 User Manual – March 2014 The user extends the connection line to the downstream element (in this example, a pond) and left clicks on the destination element. This action brings up the From Basin to Conveyance box that allows the user to specify which runoff components to route to the downstream element. Stormwater runoff is defined as surface flow + interflow. Both boxes should be checked. Groundwater should not be checked for the standard land development mitigation analysis. Groundwater should only be checked when there is observed and documented base flow occurring from the upstream basin. After the appropriate boxes have been checked click the OK button. 122 Bay Area Hydrology Model 2013 User Manual – March 2014 The final screen will look like the above screen. The basin information screen on the right will show that Basin 1 surface and interflow flows to Trapezoidal Pond 1 (groundwater is not connected). 123 Bay Area Hydrology Model 2013 User Manual – March 2014 This page has been intentionally left blank. 124 Bay Area Hydrology Model 2013 User Manual – March 2014 ANALYSIS SCREEN The Analysis tool bar button (third from the left) brings up the Analysis screen where the user can look at the results. The Analysis screen allows the user to analyze and compare flow durations, flow frequency, drawdown times, and hydrographs. 125 Bay Area Hydrology Model 2013 User Manual – March 2014 The user can analyze all time series datasets or just flow, stage, precipitation, evaporation, or point of compliance (POC) flows by selecting the appropriate tab below the list of the different datasets available for analysis. 126 Bay Area Hydrology Model 2013 User Manual – March 2014 FLOW DURATION Flow duration at the point of compliance (POC 1) is the most common analysis. A plot of the flow duration values is shown on the left, the flow values on the right. The flow duration flow range is from 10% of the 2-year flow frequency value to the 10year value. As shown in the flow duration table to the right of the flow duration curves, this flow range is divided into approximately 100 levels (flow values). For each flow level/value BAHM2013 counts the number of times that the flow at the Point of Compliance for the Pre-project scenario (Predev) exceeds that specific flow level/value. It does the same count for the Mitigated scenario flow (Dev). The total number of counts is the number of simulated hours in the multi-year simulation period that the flow exceeds that specific flow level/value. The Percentage column is the ratio of the Dev count to the Predev count. This ratio must be less than or equal to 110.0 for flow levels/values between 10% of the 2-year flow value and the 10-year value (the upper limit). If the percentage value does not exceed this maximum ratio (110% for 10% of the 2-year value to the 10-year value) then the Pass/Fail column shows a Pass for that flow level. If they are exceeded then a Fail is shown. One Fail and the facility fails the flow duration criteria. The facility overall Pass/Fail is listed at the top of the flow duration table. 127 Bay Area Hydrology Model 2013 User Manual – March 2014 FLOW FREQUENCY Flow frequency plots are shown on the left and the 2-, 5-, 10-, and 25-year frequency values are on the right. Flow frequency calculations are based on selecting annual peak flow values and ranking them by their Weibull Plotting Position. Bulletin 17B (U.S. Water Resources Council, 1981) provides information on the use of the Weibull Plotting Position. The Weibull Plotting Position formula is: P = (m-a)/(N-a-b+1) where P = probability m = rank N = number of years a = constant b = constant The two constants (a and b) are used to adjust the probability of historical values to more accurately represent extreme events (for example, 100-year event) when the number of years (N) is not sufficient to produce the appropriate Weibull plotting position. For the purposes of the HM requirements, which focuses on the range of 10% of the 2-year to the 10-year, the constants can be assumed to equal zero. This reduces the Weibull equation to 128 Bay Area Hydrology Model 2013 User Manual – March 2014 P = m/(N+1) Return period, Tr (years) = 1/P The return period value, Tr, is used in BAHM2013 to determine the 2-year, 5-year, 10year, and 25-year peak flow values. If necessary, the 2-year, 5-year, 10-year, and 25-year values are interpolated from the Tr values generated by Weibull. 129 Bay Area Hydrology Model 2013 User Manual – March 2014 DRAWDOWN The drawdown screen is used to compute pond stages (water depths). These stages are summarized and reported in terms of drain/retention time (in days). For this example, the maximum stage computed during the entire 35-50 year simulation period is 3.30 feet. This maximum stage has a drawdown time of 20 hours, 17 minutes, 22 seconds. Stages can have drain times in excess of 5 days. This can occur when a pond has a small bottom orifice. If this is not acceptable then the user needs to change the pond outlet configuration, manually run the Mitigated scenario, and repeat the analyze stage computations. A situation may occur where it is not possible to have both an acceptable pond drawdown/ retention time and meet the flow duration criteria. NOTE: The flow duration criteria take precedence unless the user is instructed otherwise by Appendix D or the local municipal permitting agency. 130 Bay Area Hydrology Model 2013 User Manual – March 2014 HYDROGRAPHS The user can graph/plot any or all time series data by selecting the Hydrograph tab. The Create Graph screen is shown and the user can select the time series to plot, the time interval (yearly, monthly, daily, or hourly), and type of data (peaks, average, or volume). The following numbering system is used for the flow time series: 500-599: Pre-project flow (Pre-project scenario) 700-799: Pre-mitigated flow (Mitigated scenario before the pond) 800-899: Mitigated flow (Mitigated scenario after the pond) The selected time series are shown. To graph the selected time series the user clicks on the Graph button. 131 Bay Area Hydrology Model 2013 User Manual – March 2014 The hydrograph shows the yearly maximum/peak flow values for each time series for the entire simulation period (in this example, from 1960 through 2000). The graph can be either saved or printed. 132 Bay Area Hydrology Model 2013 User Manual – March 2014 REPORTS SCREEN The Reports tool bar button (fourth from the left) brings up the Report screen where the user can look at all of the project input and output. The project report can be saved or printed. The user has the option of producing the report file in a number of different formats. Click on “Text Report” button to generate the report file in WordPad RTF format. 133 Bay Area Hydrology Model 2013 User Manual – March 2014 Scroll down the WordPad screen to see all of the results. 134 Bay Area Hydrology Model 2013 User Manual – March 2014 Click on “PDF Report” button to generate the report file in PDF format. 135 Bay Area Hydrology Model 2013 User Manual – March 2014 Click on “Landuse Report” button to generate a listing of the input basin land use data in WordPad RTF format. 136 Bay Area Hydrology Model 2013 User Manual – March 2014 Click on “Parameter Report” button to generate a listing of the HSPF input parameter values that have been changed from their default values. The listing is in WordPad RTF format. If the listing is blank then there have been no HSPF input parameter value changes made. 137 Bay Area Hydrology Model 2013 User Manual – March 2014 This page has been intentionally left blank. 138 Bay Area Hydrology Model 2013 User Manual – March 2014 TOOLS SCREEN The Tools screen is accessed with the Tools tool bar (second from the right). The two purposes of the Tools screen are: (1) To allow users to import HSPF PERLND parameter values from existing HSPF UCI files and/or view and edit BAHM2013 PERLND parameter values. (2) To allow users to export time series datasets. To export a time series dataset click on the Export Dataset box. 139 Bay Area Hydrology Model 2013 User Manual – March 2014 The list of available time series datasets will be shown. The user can select the start and end dates for the data they want to export. The time step (hourly, daily, monthly, yearly) can also be specified. If the user wants daily, monthly, or yearly data the user is given the choice of either selecting the maximum, minimum, or the sum of the hourly values. Click the Export button. The user provides a file name and the format or type of file. The file type can be ASCII, comma delimited, Excel spreadsheet, or Access database. Click Save to save the exported time series file. 140 Bay Area Hydrology Model 2013 User Manual – March 2014 LID ANALYSIS SCREEN The LID tool bar button (farthest on the right) brings up the Low Impact Development Scenario Generator screen. The LID scenario generator can be used to compare the amount of runoff from different land types and combinations. The user can quickly see how changing the land use affects surface runoff, interflow, groundwater, and evapotranspiration. NOTE: The LID scenario generator works only in the Mitigated scenario. 141 Bay Area Hydrology Model 2013 User Manual – March 2014 The easiest way to compare different land use scenarios is to place all of them on the same Schematic Editor screen grid. Each basin can then represent a different land use scenario. Because the LID scenario generator only compares runoff volume there is no need to do any routing through a conveyance system or stormwater facility. For this example the three basins are assigned the following land uses: Basin 1: 100 acres C/D, Shrub, Flat Basin 2: 100 acres C/D, Urban, Flat Basin 3: 50 acres C/D, Urban, Flat; 50 acres Parking Flat Each basin is assigned a different POC (point of compliance) for the LID analysis. 142 Bay Area Hydrology Model 2013 User Manual – March 2014 Click on the Compute LID Base Data button to generate the LID analysis data and summarize the surface runoff, interflow, groundwater, precipitation, evaporation, and total runoff for all of the basins. The results will be shown for each basin in terms of its POC. 143 Bay Area Hydrology Model 2013 User Manual – March 2014 For Basin 1 (50 acres of C/D, Shrub, Flat) the distribution of the precipitation is: Surface runoff = 1.147 inches per year Interflow = 1.106 inches per year Groundwater = 0.928 inches per year Evaporation = 11.053 inches per year The sum of the surface runoff + interflow + groundwater + evaporation equals 14.234 inches per year. The precipitation at this site equals 15.421 inches per year. The difference is the water that goes to deep or inactive groundwater and is not available to the downstream stream system. Note that for basins with the Urban land use category that irrigation will increase surface runoff, interflow, groundwater, and evaporation and the total will be greater than the precipitation because of the additional irrigation water. To look at the other basins click on the Select POC To arrow and select the basin of interest. The LID analysis results can be presented in terms of either inches per year or acre-feet per year by checking the appropriate box in the lower right portion of the LID analysis screen. 144 Bay Area Hydrology Model 2013 User Manual – March 2014 To compare the different scenarios side-by-side in a graphical format click on the Water Balance Chart button. The water balance chart graphically displays the runoff distribution for all three land use scenarios side-by-side. The bottom red is the surface runoff. Above in yellow is interflow; then green for groundwater and blue for evaporation. Basin 1 (Scenario 1) is all shrub vegetation and produces the least amount of surface runoff and interflow (the sum of surface and interflow is the total stormwater runoff). Basin 2 is all urban vegetation; it produces more surface runoff and interflow than Basin 1. Basin 3 is 50% urban vegetation and 50% impervious and produces the largest amount of surface runoff and interflow and smaller amounts of groundwater and evaporation. A maximum of seven scenarios can be graphed at one time. 145 Bay Area Hydrology Model 2013 User Manual – March 2014 This page has been intentionally left blank. 146 Bay Area Hydrology Model 2013 User Manual – March 2014 OPTIONS Options can be accessed by going to View, Options. This will bring up the Options screen and the ability to modify the built-in default duration criteria for flow duration matching and scaling factors for climate variables. 147 Bay Area Hydrology Model 2013 User Manual – March 2014 DURATION CRITERIA The flow duration criteria are: 1. If the post-development flow duration values exceed any of the pre-project flow levels between 10% of the two-year and 100% of the ten-year pre-project peak flow values more than 10 percent of the time (110 Percent Threshold) then the flow duration standard has not been met. 2. If more than 10 percent of the flow duration levels exceed the 100 percent threshold then the flow duration standard has not been met. The duration criteria in BAHM2013 can be modified by the user if appropriate and the local municipal permitting agency allows (see NOTE below). The user can conduct the duration analysis using either (1) durations based on Pre-project flow frequency, or (2) durations based on user defined flow values. If using durations based on Pre-project flow frequency the percent of the lower limit can be changed from the default of the 2-year flow event to a higher or lower percent value. The lower and upper flow frequency limits (2-year and 10-year) also can be changed. If using durations based on user defined flow values click on that option and input the lower and upper flow values. The default pass/fail threshold is 110%. This value can be changed by the user. The duration criteria can be changed for a single point of compliance. Click on the Update button once all of the changes have been made. To return to the default values click on the Restore Defaults button. NOTE: Any change(s) to the default duration criteria must be approved by the appropriate local municipal permitting agency or specified in Appendix D. 148 Bay Area Hydrology Model 2013 User Manual – March 2014 SCALING FACTORS The user can change the scaling factors for precipitation (minimum and maximum) and pan evaporation. NOTE: Any change in default scaling factors requires approval by the local municipal permitting agency or Appendix D. Click on the Update button once all of the changes have been made. To return to the default values click on the Restore Defaults button. 149 Bay Area Hydrology Model 2013 User Manual – March 2014 TIMESTEP The user can change the time step for the HSPF calculations. The default time step is hourly. NOTE: Any change in the default time step requires approval by the local municipal permitting agency or Appendix D. Click on the Update button a change has been made. To return to the default value click on the Restore Defaults button. 150 Bay Area Hydrology Model 2013 User Manual – March 2014 APPENDIX A: DEFAULT BAHM2013 HSPF PERVIOUS PARAMETER VALUES FOR ALAMEDA AND SAN MATEO COUNTIES The default BAHM2013 HSPF pervious parameter values are found in BAHM2013 file defaultpers.uci. These pervious parameter values have not changed from the original BAHM values. The default BAHM2013 HSPF pervious parameter values for Alameda and San Mateo counties are based on HSPF calibrations of Castro Valley Creek and Alameda Creek. The default BAHM2013 HSPF pervious parameter values for Santa Clara County are based on the HSPF calibration of Ross Creek and Thompson Creek and are listed in Appendix B. HSPF calibrations of Castro Valley Creek and Alameda Creek are documented in the report: AQUA TERRA Consultants. 2006. Hydrologic Modeling of the Castro Valley Creek and Alameda Creek Watersheds with the U.S. EPA Hydrologic Simulation Program – FORTRAN (HSPF). Prepared for Alameda Countywide Clean Water Program. January 20, 2006. Any changes in the default BAHM2013 HSPF pervious and impervious parameter values require approval by the local municipal permitting agency, unless covered by additional guidance in Appendix D. HSPF parameter documentation is found in the document: Bicknell, B.R., J.C. Imhoff, J.L. Kittle Jr, T.H. Jobes, and A.S. Donigian Jr. 2001. Hydrological Simulation Program – Fortran, User’s Manual for Version 12. AQUA TERRA Consultants. Mountain View, CA. 151 Bay Area Hydrology Model 2013 User Manual – March 2014 Table 1. BAHM2013 Alameda/San Mateo Pervious Land Types PERLND No. 1 2 3 4 5 6 7 8 9 10 11 12 13 14 15 16 17 18 19 20 21 22 23 24 25 26 27 28 29 30 31 32 33 34 35 36 37 38 39 40 41 42 43 44 Soil A A A A A A A A A A A A A A A A B B B B B B B B B B B B B B B B C/D C/D C/D C/D C/D C/D C/D C/D C/D C/D C/D C/D Vegetation/Surface Forest Forest Forest Forest Shrub Shrub Shrub Shrub Grass Grass Grass Grass Urban Urban Urban Urban Forest Forest Forest Forest Shrub Shrub Shrub Shrub Grass Grass Grass Grass Urban Urban Urban Urban Forest Forest Forest Forest Shrub Shrub Shrub Shrub Grass Grass Grass Grass 152 Slope Flat(0-5%) Moderate(5-10%) Steep(10-20%) Very Steep(>20%) Flat(0-5%) Moderate(5-10%) Steep(10-20%) Very Steep(>20%) Flat(0-5%) Moderate(5-10%) Steep(10-20%) Very Steep(>20%) Flat(0-5%) Moderate(5-10%) Steep(10-20%) Very Steep(>20%) Flat(0-5%) Moderate(5-10%) Steep(10-20%) Very Steep(>20%) Flat(0-5%) Moderate(5-10%) Steep(10-20%) Very Steep(>20%) Flat(0-5%) Moderate(5-10%) Steep(10-20%) Very Steep(>20%) Flat(0-5%) Moderate(5-10%) Steep(10-20%) Very Steep(>20%) Flat(0-5%) Moderate(5-10%) Steep(10-20%) Very Steep(>20%) Flat(0-5%) Moderate(5-10%) Steep(10-20%) Very Steep(>20%) Flat(0-5%) Moderate(5-10%) Steep(10-20%) Very Steep(>20%) Bay Area Hydrology Model 2013 User Manual – March 2014 45 46 47 48 C/D C/D C/D C/D Urban Urban Urban Urban Flat(0-5%) Moderate(5-10%) Steep(10-20%) Very Steep(>20%) 153 Bay Area Hydrology Model 2013 User Manual – March 2014 Table 2. BAHM2013 Alameda/San Mateo HSPF Pervious Parameter Values – Part I PERLND No. 1 2 3 4 5 6 7 8 9 10 11 12 13 14 15 16 17 18 19 20 21 22 23 24 25 26 27 28 29 30 31 32 33 34 35 36 37 38 39 40 41 42 43 44 45 LZSN 5.2 4.8 4.5 4.2 5.2 4.8 4.5 4.2 5.2 4.8 4.5 4.2 5.0 4.6 4.2 3.8 4.5 4.3 4.1 3.9 4.5 4.3 4.1 3.9 4.5 4.3 4.1 3.9 4.3 4.1 3.9 3.4 4.0 3.8 3.6 3.4 4.0 3.8 3.6 3.4 4.0 3.8 3.6 3.4 3.8 INFILT 0.100 0.075 0.055 0.045 0.090 0.070 0.045 0.040 0.090 0.070 0.045 0.040 0.060 0.050 0.040 0.030 0.080 0.060 0.045 0.035 0.070 0.055 0.040 0.030 0.070 0.055 0.040 0.030 0.050 0.040 0.030 0.025 0.045 0.040 0.035 0.030 0.040 0.035 0.030 0.025 0.040 0.035 0.030 0.025 0.035 LSUR 400 350 300 200 400 350 300 200 400 350 300 200 400 350 300 200 400 350 300 200 400 350 300 200 400 350 300 200 400 350 300 200 400 350 300 200 400 350 300 200 400 350 300 200 400 154 SLSUR 0.05 0.10 0.15 0.25 0.05 0.10 0.15 0.25 0.05 0.10 0.15 0.25 0.05 0.10 0.15 0.25 0.05 0.10 0.15 0.25 0.05 0.10 0.15 0.25 0.05 0.10 0.15 0.25 0.05 0.10 0.15 0.25 0.05 0.10 0.15 0.25 0.05 0.10 0.15 0.25 0.05 0.10 0.15 0.25 0.05 KVARY 0.8 0.8 0.8 0.8 0.8 0.8 0.8 0.8 0.8 0.8 0.8 0.8 1.2 1.2 1.2 1.2 1.2 1.2 1.2 1.2 1.2 1.2 1.2 1.2 1.2 1.2 1.2 1.2 1.8 1.8 1.8 1.8 2.0 2.0 2.0 2.0 2.0 2.0 2.0 2.0 2.0 2.0 2.0 2.0 3.0 AGWRC 0.985 0.985 0.985 0.985 0.955 0.955 0.955 0.955 0.955 0.955 0.955 0.955 0.997 0.997 0.997 0.997 0.980 0.980 0.980 0.980 0.950 0.950 0.950 0.950 0.950 0.950 0.950 0.950 0.995 0.995 0.995 0.995 0.980 0.980 0.980 0.980 0.950 0.950 0.950 0.950 0.950 0.950 0.950 0.950 0.995 Bay Area Hydrology Model 2013 User Manual – March 2014 46 47 48 3.6 3.4 3.2 0.030 0.022 0.020 350 300 200 0.10 0.15 0.25 LZSN: Lower Zone Storage Nominal (inches) INFILT: Infiltration (inches per hour) LSUR: Length of surface flow path (feet) SLSUR: Slope of surface flow path (feet/feet) KVARY: Variable groundwater recession AGWRC: Active Groundwater Recession Constant (per day) 155 3.0 3.0 3.0 0.995 0.995 0.995 Bay Area Hydrology Model 2013 User Manual – March 2014 Table 3. BAHM2013 Alameda/San Mateo HSPF Pervious Parameter Values – Part II PERLND No. 1 2 3 4 5 6 7 8 9 10 11 12 13 14 15 16 17 18 19 20 21 22 23 24 25 26 27 28 29 30 31 32 33 34 35 36 37 38 39 40 41 42 43 44 45 INFEXP 2 2 2 2 2 2 2 2 2 2 2 2 2 2 2 2 2 2 2 2 2 2 2 2 2 2 2 2 2 2 2 2 3 3 3 3 3 3 3 3 3 3 3 3 3 INFILD 2 2 2 2 2 2 2 2 2 2 2 2 2 2 2 2 2 2 2 2 2 2 2 2 2 2 2 2 2 2 2 2 2 2 2 2 2 2 2 2 2 2 2 2 2 DEEPFR 0.02 0.02 0.02 0.02 0.02 0.02 0.02 0.02 0.02 0.02 0.02 0.02 0.06 0.06 0.06 0.06 0.12 0.12 0.12 0.12 0.12 0.12 0.12 0.12 0.12 0.12 0.12 0.12 0.36 0.36 0.36 0.36 0.15 0.15 0.15 0.15 0.15 0.15 0.15 0.15 0.15 0.15 0.15 0.15 0.45 156 BASETP 0 0 0 0 0 0 0 0 0 0 0 0 0 0 0 0 0 0 0 0 0 0 0 0 0 0 0 0 0 0 0 0 0 0 0 0 0 0 0 0 0 0 0 0 0 AGWETP 0 0 0 0 0 0 0 0 0 0 0 0 0 0 0 0 0 0 0 0 0 0 0 0 0 0 0 0 0 0 0 0 0 0 0 0 0 0 0 0 0 0 0 0 0 Bay Area Hydrology Model 2013 User Manual – March 2014 46 47 48 3 3 3 2 2 2 0.45 0.45 0.45 0 0 0 0 0 0 INFEXP: Infiltration Exponent INFILD: Infiltration ratio (maximum to mean) DEEPFR: Fraction of groundwater to deep aquifer or inactive storage BASETP: Base flow (from groundwater) Evapotranspiration fraction AGWETP: Active Groundwater Evapotranspiration fraction 157 Bay Area Hydrology Model 2013 User Manual – March 2014 Table 4. BAHM2013 Alameda/San Mateo HSPF Pervious Parameter Values – Part III PERLND No. 1 2 3 4 5 6 7 8 9 10 11 12 13 14 15 16 17 18 19 20 21 22 23 24 25 26 27 28 29 30 31 32 33 34 35 36 37 38 39 40 41 42 43 44 45 CEPSC see Table 8 see Table 8 see Table 8 see Table 8 see Table 8 see Table 8 see Table 8 see Table 8 see Table 8 see Table 8 see Table 8 see Table 8 see Table 8 see Table 8 see Table 8 see Table 8 see Table 8 see Table 8 see Table 8 see Table 8 see Table 8 see Table 8 see Table 8 see Table 8 see Table 8 see Table 8 see Table 8 see Table 8 see Table 8 see Table 8 see Table 8 see Table 8 see Table 8 see Table 8 see Table 8 see Table 8 see Table 8 see Table 8 see Table 8 see Table 8 see Table 8 see Table 8 see Table 8 see Table 8 see Table 8 UZSN 0.45 0.35 0.25 0.20 0.40 0.30 0.20 0.15 0.35 0.30 0.23 0.20 0.35 0.30 0.23 0.20 0.45 0.35 0.25 0.20 0.40 0.30 0.20 0.15 0.35 0.30 0.23 0.20 0.35 0.30 0.23 0.20 0.35 0.30 0.25 0.20 0.30 0.25 0.20 0.15 0.30 0.25 0.20 0.15 0.25 NSUR 0.35 0.35 0.35 0.35 0.30 0.30 0.30 0.30 0.25 0.25 0.25 0.25 0.25 0.25 0.25 0.25 0.35 0.35 0.35 0.35 0.30 0.30 0.30 0.30 0.25 0.25 0.25 0.25 0.25 0.25 0.25 0.25 0.35 0.35 0.35 0.35 0.30 0.30 0.30 0.30 0.25 0.25 0.25 0.25 0.25 158 INTFW 2.25 2.00 1.50 1.00 2.00 1.60 1.30 0.90 2.00 1.60 1.30 0.90 1.50 1.20 0.80 0.50 2.00 1.50 1.00 0.40 1.50 1.20 0.80 0.30 1.50 1.20 0.80 0.30 1.00 0.60 0.40 0.30 0.80 0.65 0.50 0.20 0.75 0.55 0.35 0.20 0.70 0.50 0.30 0.15 0.50 IRC 0.60 0.50 0.45 0.40 0.50 0.45 0.40 0.35 0.50 0.45 0.40 0.35 0.40 0.35 0.30 0.30 0.60 0.50 0.45 0.40 0.50 0.45 0.40 0.35 0.50 0.45 0.40 0.35 0.40 0.35 0.30 0.30 0.60 0.50 0.45 0.40 0.50 0.45 0.40 0.35 0.50 0.45 0.40 0.35 0.40 LZETP see Table 9 see Table 9 see Table 9 see Table 9 see Table 9 see Table 9 see Table 9 see Table 9 see Table 9 see Table 9 see Table 9 see Table 9 see Table 9 see Table 9 see Table 9 see Table 9 see Table 9 see Table 9 see Table 9 see Table 9 see Table 9 see Table 9 see Table 9 see Table 9 see Table 9 see Table 9 see Table 9 see Table 9 see Table 9 see Table 9 see Table 9 see Table 9 see Table 9 see Table 9 see Table 9 see Table 9 see Table 9 see Table 9 see Table 9 see Table 9 see Table 9 see Table 9 see Table 9 see Table 9 see Table 9 Bay Area Hydrology Model 2013 User Manual – March 2014 46 47 48 see Table 8 see Table 8 see Table 8 0.23 0.20 0.15 0.25 0.25 0.25 CEPSC: Interception storage (inches) UZSN: Upper Zone Storage Nominal (inches) NSUR: Surface roughness (Manning’s n) INTFW: Interflow index IRC: Interflow Recession Constant (per day) LZETP: Lower Zone Evapotranspiration fraction 159 0.35 0.25 0.15 0.35 0.30 0.30 see Table 9 see Table 9 see Table 9 Bay Area Hydrology Model 2013 User Manual – March 2014 Table 5. BAHM2013 Alameda/San Mateo HSPF Pervious Parameter Values – Part IV PERLND No. 1 2 3 4 5 6 7 8 9 10 11 12 13 14 15 16 17 18 19 20 21 22 23 24 25 26 27 28 29 30 31 32 33 34 35 36 37 38 39 40 41 42 43 44 45 MELEV 400 400 400 400 400 400 400 400 400 400 400 400 400 400 400 400 400 400 400 400 400 400 400 400 400 400 400 400 400 400 400 400 400 400 400 400 400 400 400 400 400 400 400 400 400 BELV 0 0 0 0 0 0 0 0 0 0 0 0 0 0 0 0 0 0 0 0 0 0 0 0 0 0 0 0 0 0 0 0 0 0 0 0 0 0 0 0 0 0 0 0 0 GWDATM 0 0 0 0 0 0 0 0 0 0 0 0 0 0 0 0 0 0 0 0 0 0 0 0 0 0 0 0 0 0 0 0 0 0 0 0 0 0 0 0 0 0 0 0 0 160 PCW 0.35 0.35 0.35 0.35 0.33 0.33 0.33 0.33 0.31 0.31 0.31 0.31 0.30 0.30 0.30 0.30 0.30 0.30 0.30 0.30 0.28 0.28 0.28 0.28 0.26 0.26 0.26 0.26 0.25 0.25 0.25 0.25 0.20 0.20 0.20 0.20 0.18 0.18 0.18 0.18 0.15 0.15 0.15 0.15 0.14 PGW 0.38 0.38 0.38 0.38 0.35 0.35 0.35 0.35 0.33 0.33 0.33 0.33 0.32 0.32 0.32 0.32 0.32 0.32 0.32 0.32 0.30 0.30 0.30 0.30 0.28 0.28 0.28 0.28 0.27 0.27 0.27 0.27 0.23 0.23 0.23 0.23 0.20 0.20 0.20 0.20 0.17 0.17 0.17 0.17 0.15 UPGW 0.45 0.45 0.45 0.45 0.42 0.42 0.42 0.42 0.40 0.40 0.40 0.40 0.38 0.38 0.38 0.38 0.40 0.40 0.40 0.40 0.37 0.37 0.37 0.37 0.35 0.35 0.35 0.35 0.33 0.33 0.33 0.33 0.28 0.28 0.28 0.28 0.25 0.25 0.25 0.25 0.20 0.20 0.20 0.20 0.18 Bay Area Hydrology Model 2013 User Manual – March 2014 46 47 48 400 400 400 0 0 0 0 0 0 0.14 0.14 0.14 MELEV: Mean surface elevation of the land segment (feet) BELV: Base elevation for active groundwater (feet) GWDATM: Datum for the groundwater elevation (feet) PCW: Cohesion Water Porosity (fraction) PGW: Gravitational Water Porosity (fraction) UPGW: Upper Gravitational Water porosity (fraction) 161 0.15 0.15 0.15 0.18 0.18 0.18 Bay Area Hydrology Model 2013 User Manual – March 2014 Table 6. BAHM2013 Alameda/San Mateo HSPF Pervious Parameter Values – Part V PERLND No. 1 2 3 4 5 6 7 8 9 10 11 12 13 14 15 16 17 18 19 20 21 22 23 24 25 26 27 28 29 30 31 32 33 34 35 36 37 38 39 40 41 42 43 44 45 STABNO 1 1 1 1 1 1 1 1 1 1 1 1 1 1 1 1 1 1 1 1 1 1 1 1 1 1 1 1 1 1 1 1 1 1 1 1 1 1 1 1 1 1 1 1 1 SRRC 0.1 0.1 0.1 0.1 0.1 0.1 0.1 0.1 0.1 0.1 0.1 0.1 0.1 0.1 0.1 0.1 0.1 0.1 0.1 0.1 0.1 0.1 0.1 0.1 0.1 0.1 0.1 0.1 0.1 0.1 0.1 0.1 0.1 0.1 0.1 0.1 0.1 0.1 0.1 0.1 0.1 0.1 0.1 0.1 0.1 SREXP 0 0 0 0 0 0 0 0 0 0 0 0 0 0 0 0 0 0 0 0 0 0 0 0 0 0 0 0 0 0 0 0 0 0 0 0 0 0 0 0 0 0 0 0 0 162 IFWSC 4 4 4 4 4 4 4 4 4 4 4 4 4 4 4 4 4 4 4 4 4 4 4 4 4 4 4 4 4 4 4 4 4 4 4 4 4 4 4 4 4 4 4 4 4 DELTA 0.2 0.2 0.2 0.2 0.2 0.2 0.2 0.2 0.2 0.2 0.2 0.2 0.2 0.2 0.2 0.2 0.2 0.2 0.2 0.2 0.2 0.2 0.2 0.2 0.2 0.2 0.2 0.2 0.2 0.2 0.2 0.2 0.2 0.2 0.2 0.2 0.2 0.2 0.2 0.2 0.2 0.2 0.2 0.2 0.2 UELFAC 4 4 4 4 4 4 4 4 4 4 4 4 4 4 4 4 4 4 4 4 4 4 4 4 4 4 4 4 4 4 4 4 4 4 4 4 4 4 4 4 4 4 4 4 4 LELFAC 2.5 2.5 2.5 2.5 2.5 2.5 2.5 2.5 2.5 2.5 2.5 2.5 2.5 2.5 2.5 2.5 2.5 2.5 2.5 2.5 2.5 2.5 2.5 2.5 2.5 2.5 2.5 2.5 2.5 2.5 2.5 2.5 2.5 2.5 2.5 2.5 2.5 2.5 2.5 2.5 2.5 2.5 2.5 2.5 2.5 Bay Area Hydrology Model 2013 User Manual – March 2014 46 47 48 1 1 1 0.1 0.1 0.1 0 0 0 4 4 4 0.2 0.2 0.2 4 4 4 2.5 2.5 2.5 STABNO: User's number for the FTABLE in the FTABLES block which contains the outflow properties from the surface storage SRRC: Surface Runoff Recession Constant (per hour) SREXP: Surface Runoff Exponent IFWSC: Maximum Interflow Storage Capacity when the groundwater elevation is greater than the upper influence elevation (inches) DELTA: groundwater tolerance level used to determine transition between regions when high water table conditions are being simulated UELFAC: multiplier on UZSN which gives the upper zone capacity LELFAC: multiplier on LZSN which gives the lower zone capacity The selection of the Table 5 and Table 6 default parameter values is based on limited application of these parameters in San Francisco Bay Area by the staff of Clear Creek Solutions, Inc. NOTE: The parameter values should be used with caution and only after consultation with the appropriate local municipal permitting agency or guidance provided in Appendix D. Different values should only be selected following detailed local soil analysis, a thorough understanding of the parameters and algorithms, and consultation with the appropriate local municipal permitting agency. 163 Bay Area Hydrology Model 2013 User Manual – March 2014 Table 7. BAHM2013 Alameda/San Mateo HSPF Pervious Parameter Values – Part VI PERLND No. 1 2 3 4 5 6 7 8 9 10 11 12 13 14 15 16 17 18 19 20 21 22 23 24 25 26 27 28 29 30 31 32 33 34 35 36 37 38 39 40 41 42 43 44 45 CEPS 0 0 0 0 0 0 0 0 0 0 0 0 0 0 0 0 0 0 0 0 0 0 0 0 0 0 0 0 0 0 0 0 0 0 0 0 0 0 0 0 0 0 0 0 0 SURS 0 0 0 0 0 0 0 0 0 0 0 0 0 0 0 0 0 0 0 0 0 0 0 0 0 0 0 0 0 0 0 0 0 0 0 0 0 0 0 0 0 0 0 0 0 UZS 0.01 0.01 0.01 0.01 0.01 0.01 0.01 0.01 0.01 0.01 0.01 0.01 0.01 0.01 0.01 0.01 0.01 0.01 0.01 0.01 0.01 0.01 0.01 0.01 0.01 0.01 0.01 0.01 0.01 0.01 0.01 0.01 0.01 0.01 0.01 0.01 0.01 0.01 0.01 0.01 0.01 0.01 0.01 0.01 0.01 164 IFWS 0 0 0 0 0 0 0 0 0 0 0 0 0 0 0 0 0 0 0 0 0 0 0 0 0 0 0 0 0 0 0 0 0 0 0 0 0 0 0 0 0 0 0 0 0 LZS 0.5 0.5 0.5 0.5 0.5 0.5 0.5 0.5 0.5 0.5 0.5 0.5 3.5 3.5 3.5 3.5 0.5 0.5 0.5 0.5 0.5 0.5 0.5 0.5 0.5 0.5 0.5 0.5 3.5 3.5 3.5 3.5 0.5 0.5 0.5 0.5 0.5 0.5 0.5 0.5 0.5 0.5 0.5 0.5 3.5 AGWS 0.3 0.3 0.3 0.3 0.3 0.3 0.3 0.3 0.3 0.3 0.3 0.3 1.5 1.5 1.5 1.5 0.3 0.3 0.3 0.3 0.3 0.3 0.3 0.3 0.3 0.3 0.3 0.3 1.5 1.5 1.5 1.5 0.3 0.3 0.3 0.3 0.3 0.3 0.3 0.3 0.3 0.3 0.3 0.3 1.7 GWVS 0.01 0.01 0.01 0.01 0.01 0.01 0.01 0.01 0.01 0.01 0.01 0.01 0.10 0.10 0.10 0.10 0.01 0.01 0.01 0.01 0.01 0.01 0.01 0.01 0.01 0.01 0.01 0.01 0.10 0.10 0.10 0.10 0.01 0.01 0.01 0.01 0.01 0.01 0.01 0.01 0.01 0.01 0.01 0.01 0.10 Bay Area Hydrology Model 2013 User Manual – March 2014 46 47 48 0 0 0 0 0 0 0.01 0.01 0.01 0 0 0 CEPS: Initial interception storage (inches) SURS: Initial surface runoff (inches) UZS: Initial Upper Zone Storage (inches) IFWS: Initial interflow (inches) LZS: Initial Lower Zone Storage (inches) AGWS: Initial Active Groundwater storage (inches) GWVS: Initial Groundwater Vertical Slope (feet/feet) 165 3.5 3.5 3.5 1.7 1.7 1.7 0.10 0.10 0.10 Bay Area Hydrology Model 2013 User Manual – March 2014 Table 8. BAHM2013 Alameda/San Mateo HSPF Pervious Parameter Values: Monthly Interception Storage (inches) PERLND No. 1 2 3 4 5 6 7 8 9 10 11 12 13 14 15 16 17 18 19 20 21 22 23 24 25 26 27 28 JAN 0.15 0.15 0.15 0.15 0.13 0.13 0.13 0.13 0.12 0.12 0.12 0.12 0.11 0.11 0.11 0.11 0.15 0.15 0.15 0.15 0.13 0.13 0.13 0.13 0.12 0.12 0.12 0.12 FEB 0.15 0.15 0.15 0.15 0.13 0.13 0.13 0.13 0.12 0.12 0.12 0.12 0.11 0.11 0.11 0.11 0.15 0.15 0.15 0.15 0.13 0.13 0.13 0.13 0.12 0.12 0.12 0.12 MAR 0.15 0.15 0.15 0.15 0.13 0.13 0.13 0.13 0.12 0.12 0.12 0.12 0.11 0.11 0.11 0.11 0.15 0.15 0.15 0.15 0.13 0.13 0.13 0.13 0.12 0.12 0.12 0.12 APR 0.20 0.20 0.20 0.20 0.14 0.14 0.14 0.14 0.11 0.11 0.11 0.11 0.11 0.11 0.11 0.11 0.20 0.20 0.20 0.20 0.14 0.14 0.14 0.14 0.11 0.11 0.11 0.11 MAY 0.20 0.20 0.20 0.20 0.15 0.15 0.15 0.15 0.10 0.10 0.10 0.10 0.11 0.11 0.11 0.11 0.20 0.20 0.20 0.20 0.15 0.15 0.15 0.15 0.10 0.10 0.10 0.10 JUN 0.20 0.20 0.20 0.20 0.15 0.15 0.15 0.15 0.10 0.10 0.10 0.10 0.11 0.11 0.11 0.11 0.20 0.20 0.20 0.20 0.15 0.15 0.15 0.15 0.10 0.10 0.10 0.10 166 JUL 0.20 0.20 0.20 0.20 0.15 0.15 0.15 0.15 0.10 0.10 0.10 0.10 0.11 0.11 0.11 0.11 0.20 0.20 0.20 0.20 0.15 0.15 0.15 0.15 0.10 0.10 0.10 0.10 AUG 0.20 0.20 0.20 0.20 0.15 0.15 0.15 0.15 0.10 0.10 0.10 0.10 0.11 0.11 0.11 0.11 0.20 0.20 0.20 0.20 0.15 0.15 0.15 0.15 0.10 0.10 0.10 0.10 SEP 0.20 0.20 0.20 0.20 0.15 0.15 0.15 0.15 0.10 0.10 0.10 0.10 0.11 0.11 0.11 0.11 0.20 0.20 0.20 0.20 0.15 0.15 0.15 0.15 0.10 0.10 0.10 0.10 OCT 0.20 0.20 0.20 0.20 0.15 0.15 0.15 0.15 0.10 0.10 0.10 0.10 0.11 0.11 0.11 0.11 0.20 0.20 0.20 0.20 0.15 0.15 0.15 0.15 0.10 0.10 0.10 0.10 NOV 0.20 0.20 0.20 0.20 0.14 0.14 0.14 0.14 0.11 0.11 0.11 0.11 0.11 0.11 0.11 0.11 0.20 0.20 0.20 0.20 0.14 0.14 0.14 0.14 0.11 0.11 0.11 0.11 DEC 0.18 0.18 0.18 0.18 0.13 0.13 0.13 0.13 0.12 0.12 0.12 0.12 0.11 0.11 0.11 0.11 0.18 0.18 0.18 0.18 0.13 0.13 0.13 0.13 0.12 0.12 0.12 0.12 Bay Area Hydrology Model 2013 User Manual – March 2014 29 30 31 32 33 34 35 36 37 38 39 40 41 42 43 44 45 46 47 48 0.11 0.11 0.11 0.11 0.15 0.15 0.15 0.15 0.13 0.13 0.13 0.13 0.12 0.12 0.12 0.12 0.11 0.11 0.11 0.11 0.11 0.11 0.11 0.11 0.15 0.15 0.15 0.15 0.13 0.13 0.13 0.13 0.12 0.12 0.12 0.12 0.11 0.11 0.11 0.11 0.11 0.11 0.11 0.11 0.15 0.15 0.15 0.15 0.13 0.13 0.13 0.13 0.12 0.12 0.12 0.12 0.11 0.11 0.11 0.11 0.11 0.11 0.11 0.11 0.20 0.20 0.20 0.20 0.14 0.14 0.14 0.14 0.11 0.11 0.11 0.11 0.11 0.11 0.11 0.11 0.11 0.11 0.11 0.11 0.20 0.20 0.20 0.20 0.15 0.15 0.15 0.15 0.10 0.10 0.10 0.10 0.11 0.11 0.11 0.11 0.11 0.11 0.11 0.11 0.20 0.20 0.20 0.20 0.15 0.15 0.15 0.15 0.10 0.10 0.10 0.10 0.11 0.11 0.11 0.11 167 0.11 0.11 0.11 0.11 0.20 0.20 0.20 0.20 0.15 0.15 0.15 0.15 0.10 0.10 0.10 0.10 0.11 0.11 0.11 0.11 0.11 0.11 0.11 0.11 0.20 0.20 0.20 0.20 0.15 0.15 0.15 0.15 0.10 0.10 0.10 0.10 0.11 0.11 0.11 0.11 0.11 0.11 0.11 0.11 0.20 0.20 0.20 0.20 0.15 0.15 0.15 0.15 0.10 0.10 0.10 0.10 0.11 0.11 0.11 0.11 0.11 0.11 0.11 0.11 0.20 0.20 0.20 0.20 0.15 0.15 0.15 0.15 0.10 0.10 0.10 0.10 0.11 0.11 0.11 0.11 0.11 0.11 0.11 0.11 0.20 0.20 0.20 0.20 0.14 0.14 0.14 0.14 0.11 0.11 0.11 0.11 0.11 0.11 0.11 0.11 0.11 0.11 0.11 0.11 0.18 0.18 0.18 0.18 0.13 0.13 0.13 0.13 0.12 0.12 0.12 0.12 0.11 0.11 0.11 0.11 Bay Area Hydrology Model 2013 User Manual – March 2014 Table 9. BAHM2013 Alameda/San Mateo HSPF Pervious Parameter Values: Monthly Lower Zone Evapotranspiration PERLND No. 1 2 3 4 5 6 7 8 9 10 11 12 13 14 15 16 17 18 19 20 21 22 23 24 25 26 27 28 29 JAN 0.60 0.60 0.60 0.60 0.50 0.50 0.50 0.50 0.40 0.40 0.40 0.40 0.50 0.50 0.50 0.50 0.60 0.60 0.60 0.60 0.50 0.50 0.50 0.50 0.40 0.40 0.40 0.40 0.50 FEB 0.60 0.60 0.60 0.60 0.50 0.50 0.50 0.50 0.40 0.40 0.40 0.40 0.50 0.50 0.50 0.50 0.60 0.60 0.60 0.60 0.50 0.50 0.50 0.50 0.40 0.40 0.40 0.40 0.50 MAR 0.60 0.60 0.60 0.60 0.50 0.50 0.50 0.50 0.40 0.40 0.40 0.40 0.50 0.50 0.50 0.50 0.60 0.60 0.60 0.60 0.50 0.50 0.50 0.50 0.40 0.40 0.40 0.40 0.50 APR 0.70 0.70 0.70 0.70 0.60 0.60 0.60 0.60 0.45 0.45 0.45 0.45 0.60 0.60 0.60 0.60 0.70 0.70 0.70 0.70 0.60 0.60 0.60 0.60 0.45 0.45 0.45 0.45 0.60 MAY 0.75 0.75 0.75 0.75 0.65 0.65 0.65 0.65 0.50 0.50 0.50 0.50 0.65 0.65 0.65 0.65 0.75 0.75 0.75 0.75 0.65 0.65 0.65 0.65 0.50 0.50 0.50 0.50 0.65 JUN 0.75 0.75 0.75 0.75 0.65 0.65 0.65 0.65 0.55 0.55 0.55 0.55 0.65 0.65 0.65 0.65 0.75 0.75 0.75 0.75 0.65 0.65 0.65 0.65 0.55 0.55 0.55 0.55 0.65 168 JUL 0.75 0.75 0.75 0.75 0.65 0.65 0.65 0.65 0.55 0.55 0.55 0.55 0.65 0.65 0.65 0.65 0.75 0.75 0.75 0.75 0.65 0.65 0.65 0.65 0.55 0.55 0.55 0.55 0.65 AUG 0.75 0.75 0.75 0.75 0.65 0.65 0.65 0.65 0.55 0.55 0.55 0.55 0.65 0.65 0.65 0.65 0.75 0.75 0.75 0.75 0.65 0.65 0.65 0.65 0.55 0.55 0.55 0.55 0.65 SEP 0.75 0.75 0.75 0.75 0.65 0.65 0.65 0.65 0.55 0.55 0.55 0.55 0.65 0.65 0.65 0.65 0.75 0.75 0.75 0.75 0.65 0.65 0.65 0.65 0.55 0.55 0.55 0.55 0.65 OCT 0.75 0.75 0.75 0.75 0.65 0.65 0.65 0.65 0.55 0.55 0.55 0.55 0.65 0.65 0.65 0.65 0.75 0.75 0.75 0.75 0.65 0.65 0.65 0.65 0.55 0.55 0.55 0.55 0.65 NOV 0.65 0.65 0.65 0.65 0.55 0.55 0.55 0.55 0.45 0.45 0.45 0.45 0.55 0.55 0.55 0.55 0.65 0.65 0.65 0.65 0.55 0.55 0.55 0.55 0.45 0.45 0.45 0.45 0.55 DEC 0.60 0.60 0.60 0.60 0.50 0.50 0.50 0.50 0.40 0.40 0.40 0.40 0.50 0.50 0.50 0.50 0.60 0.60 0.60 0.60 0.50 0.50 0.50 0.50 0.40 0.40 0.40 0.40 0.50 Bay Area Hydrology Model 2013 User Manual – March 2014 30 31 32 33 34 35 36 37 38 39 40 41 42 43 44 45 46 47 48 0.50 0.50 0.50 0.60 0.60 0.60 0.60 0.50 0.50 0.50 0.50 0.40 0.40 0.40 0.40 0.50 0.50 0.50 0.50 0.50 0.50 0.50 0.60 0.60 0.60 0.60 0.50 0.50 0.50 0.50 0.40 0.40 0.40 0.40 0.50 0.50 0.50 0.50 0.50 0.50 0.50 0.60 0.60 0.60 0.60 0.50 0.50 0.50 0.50 0.40 0.40 0.40 0.40 0.50 0.50 0.50 0.50 0.60 0.60 0.60 0.70 0.70 0.70 0.70 0.60 0.60 0.60 0.60 0.45 0.45 0.45 0.45 0.60 0.60 0.60 0.60 0.65 0.65 0.65 0.75 0.75 0.75 0.75 0.65 0.65 0.65 0.65 0.50 0.50 0.50 0.50 0.65 0.65 0.65 0.65 0.65 0.65 0.65 0.75 0.75 0.75 0.75 0.65 0.65 0.65 0.65 0.55 0.55 0.55 0.55 0.65 0.65 0.65 0.65 169 0.65 0.65 0.65 0.75 0.75 0.75 0.75 0.65 0.65 0.65 0.65 0.55 0.55 0.55 0.55 0.65 0.65 0.65 0.65 0.65 0.65 0.65 0.75 0.75 0.75 0.75 0.65 0.65 0.65 0.65 0.55 0.55 0.55 0.55 0.65 0.65 0.65 0.65 0.65 0.65 0.65 0.75 0.75 0.75 0.75 0.65 0.65 0.65 0.65 0.55 0.55 0.55 0.55 0.65 0.65 0.65 0.65 0.65 0.65 0.65 0.75 0.75 0.75 0.75 0.65 0.65 0.65 0.65 0.55 0.55 0.55 0.55 0.65 0.65 0.65 0.65 0.55 0.55 0.55 0.65 0.65 0.65 0.65 0.55 0.55 0.55 0.55 0.45 0.45 0.45 0.45 0.55 0.55 0.55 0.55 0.50 0.50 0.50 0.60 0.60 0.60 0.60 0.50 0.50 0.50 0.50 0.40 0.40 0.40 0.40 0.50 0.50 0.50 0.50 Bay Area Hydrology Model 2013 User Manual – March 2014 This page has been intentionally left blank. . 170 Bay Area Hydrology Model 2013 User Manual – March 2014 APPENDIX B: DEFAULT BAHM2013 HSPF PERVIOUS PARAMETER VALUES FOR SANTA CLARA COUNTY The default BAHM2013 HSPF pervious parameter values are found in BAHM2013 file defaultpers.uci. These pervious parameter values have not changed from the original BAHM values. The default BAHM2013 HSPF pervious parameter values for Santa Clara County are based on the HSPF calibration of Ross Creek. The default BAHM2013 HSPF pervious parameter values for Alameda and San Mateo counties are listed in Appendix A. The HSPF calibrations of Ross Creek and Thompson Creek are documented in the report: Clear Creek Solutions. 2007. Hydrologic Modeling of the Ross Creek and Thompson Creek Watersheds with the U.S. EPA Hydrologic Simulation Program – FORTRAN (HSPF). Prepared for Santa Clara Valley Urban Runoff Pollution Prevention Program. Any changes in the default BAHM2013 HSPF pervious and impervious parameter values require approval by the local municipal permitting agency, unless covered by additional guidance in Appendix D. HSPF parameter documentation is found in the document: Bicknell, B.R., J.C. Imhoff, J.L. Kittle Jr, T.H. Jobes, and A.S. Donigian Jr. 2001. Hydrological Simulation Program – Fortran, User’s Manual for Version 12. AQUA TERRA Consultants. Mountain View, CA. 171 Bay Area Hydrology Model 2013 User Manual – March 2014 Table 1. BAHM2013 Santa Clara Pervious Land Types PERLND No. 1 2 3 4 5 6 7 8 9 10 11 12 13 14 15 16 17 18 19 20 21 22 23 24 25 26 27 28 29 30 31 32 33 34 35 36 37 38 39 40 41 42 43 44 Soil A A A A A A A A A A A A A A A A B B B B B B B B B B B B B B B B C/D C/D C/D C/D C/D C/D C/D C/D C/D C/D C/D C/D Vegetation/Surface Forest Forest Forest Forest Shrub Shrub Shrub Shrub Grass Grass Grass Grass Urban Urban Urban Urban Forest Forest Forest Forest Shrub Shrub Shrub Shrub Grass Grass Grass Grass Urban Urban Urban Urban Forest Forest Forest Forest Shrub Shrub Shrub Shrub Grass Grass Grass Grass 172 Slope Flat(0-5%) Moderate(5-10%) Steep(10-20%) Very Steep(>20%) Flat(0-5%) Moderate(5-10%) Steep(10-20%) Very Steep(>20%) Flat(0-5%) Moderate(5-10%) Steep(10-20%) Very Steep(>20%) Flat(0-5%) Moderate(5-10%) Steep(10-20%) Very Steep(>20%) Flat(0-5%) Moderate(5-10%) Steep(10-20%) Very Steep(>20%) Flat(0-5%) Moderate(5-10%) Steep(10-20%) Very Steep(>20%) Flat(0-5%) Moderate(5-10%) Steep(10-20%) Very Steep(>20%) Flat(0-5%) Moderate(5-10%) Steep(10-20%) Very Steep(>20%) Flat(0-5%) Moderate(5-10%) Steep(10-20%) Very Steep(>20%) Flat(0-5%) Moderate(5-10%) Steep(10-20%) Very Steep(>20%) Flat(0-5%) Moderate(5-10%) Steep(10-20%) Very Steep(>20%) Bay Area Hydrology Model 2013 User Manual – March 2014 45 46 47 48 C/D C/D C/D C/D Urban Urban Urban Urban Flat(0-5%) Moderate(5-10%) Steep(10-20%) Very Steep(>20%) 173 Bay Area Hydrology Model 2013 User Manual – March 2014 Table 2. BAHM2013 Santa Clara HSPF Pervious Parameter Values – Part I PERLND No. 1 2 3 4 5 6 7 8 9 10 11 12 13 14 15 16 17 18 19 20 21 22 23 24 25 26 27 28 29 30 31 32 33 34 35 36 37 38 39 40 41 42 43 44 45 LZSN 5.2 4.8 4.5 4.2 5.2 4.8 4.5 4.2 5.2 4.8 4.5 4.2 5.0 4.6 4.2 3.8 5.0 4.7 4.4 4.1 5.0 4.7 4.4 4.1 5.0 4.7 4.4 4.1 4.8 4.4 4.0 3.6 4.8 4.5 4.2 4.0 4.8 4.5 4.2 4.0 4.8 4.5 4.2 4.0 4.6 INFILT 0.100 0.075 0.055 0.045 0.090 0.070 0.045 0.040 0.090 0.070 0.045 0.040 0.060 0.050 0.040 0.030 0.080 0.060 0.045 0.035 0.070 0.055 0.040 0.030 0.070 0.055 0.040 0.030 0.050 0.040 0.030 0.025 0.050 0.045 0.035 0.030 0.045 0.040 0.030 0.025 0.045 0.040 0.030 0.025 0.040 LSUR 400 350 300 200 400 350 300 200 400 350 300 200 400 350 300 200 400 350 300 200 400 350 300 200 400 350 300 200 400 350 300 200 400 350 300 200 400 350 300 200 400 350 300 200 400 174 SLSUR 0.05 0.10 0.15 0.25 0.05 0.10 0.15 0.25 0.05 0.10 0.15 0.25 0.05 0.10 0.15 0.25 0.05 0.10 0.15 0.25 0.05 0.10 0.15 0.25 0.05 0.10 0.15 0.25 0.05 0.10 0.15 0.25 0.05 0.10 0.15 0.25 0.05 0.10 0.15 0.25 0.05 0.10 0.15 0.25 0.05 KVARY 0.8 0.8 0.8 0.8 0.8 0.8 0.8 0.8 0.8 0.8 0.8 0.8 1.2 1.2 1.2 1.2 1.2 1.2 1.2 1.2 1.2 1.2 1.2 1.2 1.2 1.2 1.2 1.2 1.8 1.8 1.8 1.8 2.0 2.0 2.0 2.0 2.0 2.0 2.0 2.0 2.0 2.0 2.0 2.0 3.0 AGWRC 0.985 0.985 0.985 0.985 0.955 0.955 0.955 0.955 0.955 0.955 0.955 0.955 0.997 0.997 0.997 0.997 0.980 0.980 0.980 0.980 0.950 0.950 0.950 0.950 0.950 0.950 0.950 0.950 0.995 0.995 0.995 0.995 0.980 0.980 0.980 0.980 0.950 0.950 0.950 0.950 0.950 0.950 0.950 0.950 0.995 Bay Area Hydrology Model 2013 User Manual – March 2014 46 47 48 4.2 3.8 3.5 0.030 0.022 0.020 350 300 200 0.10 0.15 0.25 3.0 3.0 3.0 LZSN: Lower Zone Storage Nominal (inches) INFILT: Infiltration (inches per hour) LSUR: Length of surface flow path (feet) SLSUR: Slope of surface flow path (feet/feet) KVARY: Variable groundwater recession AGWRC: Active Groundwater Recession Constant (per day) 175 0.995 0.995 0.995 Bay Area Hydrology Model 2013 User Manual – March 2014 Table 3. BAHM2013 Santa Clara HSPF Pervious Parameter Values – Part II PERLND No. 1 2 3 4 5 6 7 8 9 10 11 12 13 14 15 16 17 18 19 20 21 22 23 24 25 26 27 28 29 30 31 32 33 34 35 36 37 38 39 40 41 42 43 44 45 INFEXP 2 2 2 2 2 2 2 2 2 2 2 2 2 2 2 2 2 2 2 2 2 2 2 2 2 2 2 2 2 2 2 2 3 3 3 3 3 3 3 3 3 3 3 3 3 INFILD 2 2 2 2 2 2 2 2 2 2 2 2 2 2 2 2 2 2 2 2 2 2 2 2 2 2 2 2 2 2 2 2 2 2 2 2 2 2 2 2 2 2 2 2 2 DEEPFR 0.5 0.5 0.5 0.5 0.5 0.5 0.5 0.5 0.5 0.5 0.5 0.5 0.5 0.5 0.5 0.5 0.5 0.5 0.5 0.5 0.5 0.5 0.5 0.5 0.5 0.5 0.5 0.5 0.5 0.5 0.5 0.5 0.5 0.5 0.5 0.5 0.5 0.5 0.5 0.5 0.5 0.5 0.5 0.5 0.5 176 BASETP 0 0 0 0 0 0 0 0 0 0 0 0 0 0 0 0 0 0 0 0 0 0 0 0 0 0 0 0 0 0 0 0 0 0 0 0 0 0 0 0 0 0 0 0 0 AGWETP 0 0 0 0 0 0 0 0 0 0 0 0 0 0 0 0 0 0 0 0 0 0 0 0 0 0 0 0 0 0 0 0 0 0 0 0 0 0 0 0 0 0 0 0 0 Bay Area Hydrology Model 2013 User Manual – March 2014 46 47 48 3 3 3 2 2 2 0.5 0.5 0.5 0 0 0 0 0 0 INFEXP: Infiltration Exponent INFILD: Infiltration ratio (maximum to mean) DEEPFR: Fraction of groundwater to deep aquifer or inactive storage BASETP: Base flow (from groundwater) Evapotranspiration fraction AGWETP: Active Groundwater Evapotranspiration fraction 177 Bay Area Hydrology Model 2013 User Manual – March 2014 Table 4. BAHM2013 Santa Clara HSPF Pervious Parameter Values – Part III PERLND No. 1 2 3 4 5 6 7 8 9 10 11 12 13 14 15 16 17 18 19 20 21 22 23 24 25 26 27 28 29 30 31 32 33 34 35 36 37 38 39 40 41 42 43 44 45 CEPSC see Table 8 see Table 8 see Table 8 see Table 8 see Table 8 see Table 8 see Table 8 see Table 8 see Table 8 see Table 8 see Table 8 see Table 8 see Table 8 see Table 8 see Table 8 see Table 8 see Table 8 see Table 8 see Table 8 see Table 8 see Table 8 see Table 8 see Table 8 see Table 8 see Table 8 see Table 8 see Table 8 see Table 8 see Table 8 see Table 8 see Table 8 see Table 8 see Table 8 see Table 8 see Table 8 see Table 8 see Table 8 see Table 8 see Table 8 see Table 8 see Table 8 see Table 8 see Table 8 see Table 8 see Table 8 UZSN 0.50 0.40 0.30 0.25 0.45 0.35 0.25 0.20 0.40 0.35 0.28 0.25 0.40 0.35 0.28 0.25 0.50 0.40 0.30 0.25 0.45 0.35 0.25 0.20 0.40 0.35 0.28 0.25 0.40 0.35 0.28 0.25 0.40 0.35 0.25 0.20 0.35 0.30 0.25 0.20 0.35 0.30 0.25 0.20 0.30 NSUR 0.35 0.35 0.35 0.35 0.30 0.30 0.30 0.30 0.25 0.25 0.25 0.25 0.25 0.25 0.25 0.25 0.35 0.35 0.35 0.35 0.30 0.30 0.30 0.30 0.25 0.25 0.25 0.25 0.25 0.25 0.25 0.25 0.35 0.35 0.35 0.35 0.30 0.30 0.30 0.30 0.25 0.25 0.25 0.25 0.25 178 INTFW 1.00 0.95 0.90 0.80 0.95 0.90 0.80 0.60 0.95 0.90 0.80 0.60 0.90 0.80 0.70 0.60 1.00 0.95 0.90 0.80 0.95 0.90 0.80 0.60 0.95 0.90 0.80 0.60 0.90 0.80 0.70 0.60 1.00 0.95 0.90 0.80 0.95 0.90 0.80 0.60 0.95 0.90 0.80 0.60 0.80 IRC 0.80 0.50 0.45 0.40 0.70 0.45 0.40 0.35 0.70 0.45 0.40 0.35 0.40 0.35 0.30 0.30 0.80 0.50 0.45 0.40 0.70 0.45 0.40 0.35 0.70 0.45 0.40 0.35 0.40 0.35 0.30 0.30 0.80 0.50 0.45 0.40 0.70 0.45 0.40 0.35 0.70 0.45 0.40 0.35 0.40 LZETP see Table 9 see Table 9 see Table 9 see Table 9 see Table 9 see Table 9 see Table 9 see Table 9 see Table 9 see Table 9 see Table 9 see Table 9 see Table 9 see Table 9 see Table 9 see Table 9 see Table 9 see Table 9 see Table 9 see Table 9 see Table 9 see Table 9 see Table 9 see Table 9 see Table 9 see Table 9 see Table 9 see Table 9 see Table 9 see Table 9 see Table 9 see Table 9 see Table 9 see Table 9 see Table 9 see Table 9 see Table 9 see Table 9 see Table 9 see Table 9 see Table 9 see Table 9 see Table 9 see Table 9 see Table 9 Bay Area Hydrology Model 2013 User Manual – March 2014 46 47 48 see Table 8 see Table 8 see Table 8 0.28 0.25 0.20 0.25 0.25 0.25 CEPSC: Interception storage (inches) UZSN: Upper Zone Storage Nominal (inches) NSUR: Surface roughness (Manning’s n) INTFW: Interflow index IRC: Interflow Recession Constant (per day) LZETP: Lower Zone Evapotranspiration fraction 179 0.70 0.50 0.35 0.35 0.30 0.30 see Table 9 see Table 9 see Table 9 Bay Area Hydrology Model 2013 User Manual – March 2014 Table 5. BAHM2013 Santa Clara HSPF Pervious Parameter Values – Part IV PERLND No. 1 2 3 4 5 6 7 8 9 10 11 12 13 14 15 16 17 18 19 20 21 22 23 24 25 26 27 28 29 30 31 32 33 34 35 36 37 38 39 40 41 42 43 44 45 MELEV 400 400 400 400 400 400 400 400 400 400 400 400 400 400 400 400 400 400 400 400 400 400 400 400 400 400 400 400 400 400 400 400 400 400 400 400 400 400 400 400 400 400 400 400 400 BELV 0 0 0 0 0 0 0 0 0 0 0 0 0 0 0 0 0 0 0 0 0 0 0 0 0 0 0 0 0 0 0 0 0 0 0 0 0 0 0 0 0 0 0 0 0 GWDATM 0 0 0 0 0 0 0 0 0 0 0 0 0 0 0 0 0 0 0 0 0 0 0 0 0 0 0 0 0 0 0 0 0 0 0 0 0 0 0 0 0 0 0 0 0 180 PCW 0.35 0.35 0.35 0.35 0.33 0.33 0.33 0.33 0.31 0.31 0.31 0.31 0.30 0.30 0.30 0.30 0.30 0.30 0.30 0.30 0.28 0.28 0.28 0.28 0.26 0.26 0.26 0.26 0.25 0.25 0.25 0.25 0.20 0.20 0.20 0.20 0.18 0.18 0.18 0.18 0.15 0.15 0.15 0.15 0.14 PGW 0.38 0.38 0.38 0.38 0.35 0.35 0.35 0.35 0.33 0.33 0.33 0.33 0.32 0.32 0.32 0.32 0.32 0.32 0.32 0.32 0.30 0.30 0.30 0.30 0.28 0.28 0.28 0.28 0.27 0.27 0.27 0.27 0.23 0.23 0.23 0.23 0.20 0.20 0.20 0.20 0.17 0.17 0.17 0.17 0.15 UPGW 0.45 0.45 0.45 0.45 0.42 0.42 0.42 0.42 0.40 0.40 0.40 0.40 0.38 0.38 0.38 0.38 0.40 0.40 0.40 0.40 0.37 0.37 0.37 0.37 0.35 0.35 0.35 0.35 0.33 0.33 0.33 0.33 0.28 0.28 0.28 0.28 0.25 0.25 0.25 0.25 0.20 0.20 0.20 0.20 0.18 Bay Area Hydrology Model 2013 User Manual – March 2014 46 47 48 400 400 400 0 0 0 0 0 0 0.14 0.14 0.14 MELEV: Mean surface elevation of the land segment (feet) BELV: Base elevation for active groundwater (feet) GWDATM: Datum for the groundwater elevation (feet) PCW: Cohesion Water Porosity (fraction) PGW: Gravitational Water Porosity (fraction) UPGW: Upper Gravitational Water porosity (fraction) 181 0.15 0.15 0.15 0.18 0.18 0.18 Bay Area Hydrology Model 2013 User Manual – March 2014 Table 6. BAHM2013 Santa Clara HSPF Pervious Parameter Values – Part V PERLND No. 1 2 3 4 5 6 7 8 9 10 11 12 13 14 15 16 17 18 19 20 21 22 23 24 25 26 27 28 29 30 31 32 33 34 35 36 37 38 39 40 41 42 43 44 45 STABNO 1 1 1 1 1 1 1 1 1 1 1 1 1 1 1 1 1 1 1 1 1 1 1 1 1 1 1 1 1 1 1 1 1 1 1 1 1 1 1 1 1 1 1 1 1 SRRC 0.1 0.1 0.1 0.1 0.1 0.1 0.1 0.1 0.1 0.1 0.1 0.1 0.1 0.1 0.1 0.1 0.1 0.1 0.1 0.1 0.1 0.1 0.1 0.1 0.1 0.1 0.1 0.1 0.1 0.1 0.1 0.1 0.1 0.1 0.1 0.1 0.1 0.1 0.1 0.1 0.1 0.1 0.1 0.1 0.1 SREXP 0 0 0 0 0 0 0 0 0 0 0 0 0 0 0 0 0 0 0 0 0 0 0 0 0 0 0 0 0 0 0 0 0 0 0 0 0 0 0 0 0 0 0 0 0 182 IFWSC 4 4 4 4 4 4 4 4 4 4 4 4 4 4 4 4 4 4 4 4 4 4 4 4 4 4 4 4 4 4 4 4 4 4 4 4 4 4 4 4 4 4 4 4 4 DELTA 0.2 0.2 0.2 0.2 0.2 0.2 0.2 0.2 0.2 0.2 0.2 0.2 0.2 0.2 0.2 0.2 0.2 0.2 0.2 0.2 0.2 0.2 0.2 0.2 0.2 0.2 0.2 0.2 0.2 0.2 0.2 0.2 0.2 0.2 0.2 0.2 0.2 0.2 0.2 0.2 0.2 0.2 0.2 0.2 0.2 UELFAC 4 4 4 4 4 4 4 4 4 4 4 4 4 4 4 4 4 4 4 4 4 4 4 4 4 4 4 4 4 4 4 4 4 4 4 4 4 4 4 4 4 4 4 4 4 LELFAC 2.5 2.5 2.5 2.5 2.5 2.5 2.5 2.5 2.5 2.5 2.5 2.5 2.5 2.5 2.5 2.5 2.5 2.5 2.5 2.5 2.5 2.5 2.5 2.5 2.5 2.5 2.5 2.5 2.5 2.5 2.5 2.5 2.5 2.5 2.5 2.5 2.5 2.5 2.5 2.5 2.5 2.5 2.5 2.5 2.5 Bay Area Hydrology Model 2013 User Manual – March 2014 46 47 48 1 1 1 0.1 0.1 0.1 0 0 0 4 4 4 0.2 0.2 0.2 4 4 4 2.5 2.5 2.5 STABNO: User's number for the FTABLE in the FTABLES block which contains the outflow properties from the surface storage SRRC: Surface Runoff Recession Constant (per hour) SREXP: Surface Runoff Exponent IFWSC: Maximum Interflow Storage Capacity when the groundwater elevation is greater than the upper influence elevation (inches) DELTA: groundwater tolerance level used to determine transition between regions when high water table conditions are being simulated UELFAC: multiplier on UZSN which gives the upper zone capacity LELFAC: multiplier on LZSN which gives the lower zone capacity The selection of the Table 5 and Table 6 default parameter values is based on limited application of these parameters in San Francisco Bay Area by the staff of Clear Creek Solutions, Inc. NOTE: The parameter values should be used with caution and only after consultation with the appropriate local municipal permitting agency or guidance in Appendix D. Different values should only be selected following detailed local soil analysis, a thorough understanding of the parameters and algorithms, and consultation with the appropriate local municipal permitting agency. 183 Bay Area Hydrology Model 2013 User Manual – March 2014 Table 7. BAHM2013 Santa Clara HSPF Pervious Parameter Values – Part VI PERLND No. 1 2 3 4 5 6 7 8 9 10 11 12 13 14 15 16 17 18 19 20 21 22 23 24 25 26 27 28 29 30 31 32 33 34 35 36 37 38 39 40 41 42 43 44 45 CEPS 0 0 0 0 0 0 0 0 0 0 0 0 0 0 0 0 0 0 0 0 0 0 0 0 0 0 0 0 0 0 0 0 0 0 0 0 0 0 0 0 0 0 0 0 0 SURS 0 0 0 0 0 0 0 0 0 0 0 0 0 0 0 0 0 0 0 0 0 0 0 0 0 0 0 0 0 0 0 0 0 0 0 0 0 0 0 0 0 0 0 0 0 UZS 0.01 0.01 0.01 0.01 0.01 0.01 0.01 0.01 0.01 0.01 0.01 0.01 0.01 0.01 0.01 0.01 0.01 0.01 0.01 0.01 0.01 0.01 0.01 0.01 0.01 0.01 0.01 0.01 0.01 0.01 0.01 0.01 0.01 0.01 0.01 0.01 0.01 0.01 0.01 0.01 0.01 0.01 0.01 0.01 0.01 184 IFWS 0 0 0 0 0 0 0 0 0 0 0 0 0 0 0 0 0 0 0 0 0 0 0 0 0 0 0 0 0 0 0 0 0 0 0 0 0 0 0 0 0 0 0 0 0 LZS 0.5 0.5 0.5 0.5 0.5 0.5 0.5 0.5 0.5 0.5 0.5 0.5 3.5 3.5 3.5 3.5 0.5 0.5 0.5 0.5 0.5 0.5 0.5 0.5 0.5 0.5 0.5 0.5 3.5 3.5 3.5 3.5 0.5 0.5 0.5 0.5 0.5 0.5 0.5 0.5 0.5 0.5 0.5 0.5 3.5 AGWS 0.3 0.3 0.3 0.3 0.3 0.3 0.3 0.3 0.3 0.3 0.3 0.3 1.5 1.5 1.5 1.5 0.3 0.3 0.3 0.3 0.3 0.3 0.3 0.3 0.3 0.3 0.3 0.3 1.5 1.5 1.5 1.5 0.3 0.3 0.3 0.3 0.3 0.3 0.3 0.3 0.3 0.3 0.3 0.3 1.7 GWVS 0.01 0.01 0.01 0.01 0.01 0.01 0.01 0.01 0.01 0.01 0.01 0.01 0.10 0.10 0.10 0.10 0.01 0.01 0.01 0.01 0.01 0.01 0.01 0.01 0.01 0.01 0.01 0.01 0.10 0.10 0.10 0.10 0.01 0.01 0.01 0.01 0.01 0.01 0.01 0.01 0.01 0.01 0.01 0.01 0.10 Bay Area Hydrology Model 2013 User Manual – March 2014 46 47 48 0 0 0 0 0 0 0.01 0.01 0.01 0 0 0 CEPS: Initial interception storage (inches) SURS: Initial surface runoff (inches) UZS: Initial Upper Zone Storage (inches) IFWS: Initial interflow (inches) LZS: Initial Lower Zone Storage (inches) AGWS: Initial Active Groundwater storage (inches) GWVS: Initial Groundwater Vertical Slope (feet/feet) 185 3.5 3.5 3.5 1.7 1.7 1.7 0.10 0.10 0.10 Bay Area Hydrology Model 2013 User Manual – March 2014 Table 8. BAHM2013 Santa Clara HSPF Pervious Parameter Values: Monthly Interception Storage (inches) PERLND No. 1 2 3 4 5 6 7 8 9 10 11 12 13 14 15 16 17 18 19 20 21 22 23 24 25 26 27 28 JAN 0.15 0.15 0.15 0.15 0.13 0.13 0.13 0.13 0.12 0.12 0.12 0.12 0.11 0.11 0.11 0.11 0.15 0.15 0.15 0.15 0.13 0.13 0.13 0.13 0.12 0.12 0.12 0.12 FEB 0.15 0.15 0.15 0.15 0.13 0.13 0.13 0.13 0.12 0.12 0.12 0.12 0.11 0.11 0.11 0.11 0.15 0.15 0.15 0.15 0.13 0.13 0.13 0.13 0.12 0.12 0.12 0.12 MAR 0.15 0.15 0.15 0.15 0.13 0.13 0.13 0.13 0.12 0.12 0.12 0.12 0.11 0.11 0.11 0.11 0.15 0.15 0.15 0.15 0.13 0.13 0.13 0.13 0.12 0.12 0.12 0.12 APR 0.20 0.20 0.20 0.20 0.14 0.14 0.14 0.14 0.11 0.11 0.11 0.11 0.11 0.11 0.11 0.11 0.20 0.20 0.20 0.20 0.14 0.14 0.14 0.14 0.11 0.11 0.11 0.11 MAY 0.20 0.20 0.20 0.20 0.15 0.15 0.15 0.15 0.10 0.10 0.10 0.10 0.11 0.11 0.11 0.11 0.20 0.20 0.20 0.20 0.15 0.15 0.15 0.15 0.10 0.10 0.10 0.10 JUN 0.20 0.20 0.20 0.20 0.15 0.15 0.15 0.15 0.10 0.10 0.10 0.10 0.11 0.11 0.11 0.11 0.20 0.20 0.20 0.20 0.15 0.15 0.15 0.15 0.10 0.10 0.10 0.10 186 JUL 0.20 0.20 0.20 0.20 0.15 0.15 0.15 0.15 0.10 0.10 0.10 0.10 0.11 0.11 0.11 0.11 0.20 0.20 0.20 0.20 0.15 0.15 0.15 0.15 0.10 0.10 0.10 0.10 AUG 0.20 0.20 0.20 0.20 0.15 0.15 0.15 0.15 0.10 0.10 0.10 0.10 0.11 0.11 0.11 0.11 0.20 0.20 0.20 0.20 0.15 0.15 0.15 0.15 0.10 0.10 0.10 0.10 SEP 0.20 0.20 0.20 0.20 0.15 0.15 0.15 0.15 0.10 0.10 0.10 0.10 0.11 0.11 0.11 0.11 0.20 0.20 0.20 0.20 0.15 0.15 0.15 0.15 0.10 0.10 0.10 0.10 OCT 0.20 0.20 0.20 0.20 0.15 0.15 0.15 0.15 0.10 0.10 0.10 0.10 0.11 0.11 0.11 0.11 0.20 0.20 0.20 0.20 0.15 0.15 0.15 0.15 0.10 0.10 0.10 0.10 NOV 0.20 0.20 0.20 0.20 0.14 0.14 0.14 0.14 0.11 0.11 0.11 0.11 0.11 0.11 0.11 0.11 0.20 0.20 0.20 0.20 0.14 0.14 0.14 0.14 0.11 0.11 0.11 0.11 DEC 0.18 0.18 0.18 0.18 0.13 0.13 0.13 0.13 0.12 0.12 0.12 0.12 0.11 0.11 0.11 0.11 0.18 0.18 0.18 0.18 0.13 0.13 0.13 0.13 0.12 0.12 0.12 0.12 Bay Area Hydrology Model 2013 User Manual – March 2014 29 30 31 32 33 34 35 36 37 38 39 40 41 42 43 44 45 46 47 48 0.11 0.11 0.11 0.11 0.15 0.15 0.15 0.15 0.13 0.13 0.13 0.13 0.12 0.12 0.12 0.12 0.11 0.11 0.11 0.11 0.11 0.11 0.11 0.11 0.15 0.15 0.15 0.15 0.13 0.13 0.13 0.13 0.12 0.12 0.12 0.12 0.11 0.11 0.11 0.11 0.11 0.11 0.11 0.11 0.15 0.15 0.15 0.15 0.13 0.13 0.13 0.13 0.12 0.12 0.12 0.12 0.11 0.11 0.11 0.11 0.11 0.11 0.11 0.11 0.20 0.20 0.20 0.20 0.14 0.14 0.14 0.14 0.11 0.11 0.11 0.11 0.11 0.11 0.11 0.11 0.11 0.11 0.11 0.11 0.20 0.20 0.20 0.20 0.15 0.15 0.15 0.15 0.10 0.10 0.10 0.10 0.11 0.11 0.11 0.11 0.11 0.11 0.11 0.11 0.20 0.20 0.20 0.20 0.15 0.15 0.15 0.15 0.10 0.10 0.10 0.10 0.11 0.11 0.11 0.11 187 0.11 0.11 0.11 0.11 0.20 0.20 0.20 0.20 0.15 0.15 0.15 0.15 0.10 0.10 0.10 0.10 0.11 0.11 0.11 0.11 0.11 0.11 0.11 0.11 0.20 0.20 0.20 0.20 0.15 0.15 0.15 0.15 0.10 0.10 0.10 0.10 0.11 0.11 0.11 0.11 0.11 0.11 0.11 0.11 0.20 0.20 0.20 0.20 0.15 0.15 0.15 0.15 0.10 0.10 0.10 0.10 0.11 0.11 0.11 0.11 0.11 0.11 0.11 0.11 0.20 0.20 0.20 0.20 0.15 0.15 0.15 0.15 0.10 0.10 0.10 0.10 0.11 0.11 0.11 0.11 0.11 0.11 0.11 0.11 0.20 0.20 0.20 0.20 0.14 0.14 0.14 0.14 0.11 0.11 0.11 0.11 0.11 0.11 0.11 0.11 0.11 0.11 0.11 0.11 0.18 0.18 0.18 0.18 0.13 0.13 0.13 0.13 0.12 0.12 0.12 0.12 0.11 0.11 0.11 0.11 Bay Area Hydrology Model 2013 User Manual – March 2014 Table 9. BAHM2013 HSPF Pervious Parameter Values: Monthly Lower Zone Evapotranspiration PERLND No. 1 2 3 4 5 6 7 8 9 10 11 12 13 14 15 16 17 18 19 20 21 22 23 24 25 26 27 28 29 JAN 0.60 0.60 0.60 0.60 0.50 0.50 0.50 0.50 0.40 0.40 0.40 0.40 0.50 0.50 0.50 0.50 0.60 0.60 0.60 0.60 0.50 0.50 0.50 0.50 0.40 0.40 0.40 0.40 0.50 FEB 0.60 0.60 0.60 0.60 0.50 0.50 0.50 0.50 0.40 0.40 0.40 0.40 0.50 0.50 0.50 0.50 0.60 0.60 0.60 0.60 0.50 0.50 0.50 0.50 0.40 0.40 0.40 0.40 0.50 MAR 0.60 0.60 0.60 0.60 0.50 0.50 0.50 0.50 0.40 0.40 0.40 0.40 0.50 0.50 0.50 0.50 0.60 0.60 0.60 0.60 0.50 0.50 0.50 0.50 0.40 0.40 0.40 0.40 0.50 APR 0.70 0.70 0.70 0.70 0.60 0.60 0.60 0.60 0.45 0.45 0.45 0.45 0.60 0.60 0.60 0.60 0.70 0.70 0.70 0.70 0.60 0.60 0.60 0.60 0.45 0.45 0.45 0.45 0.60 MAY 0.75 0.75 0.75 0.75 0.65 0.65 0.65 0.65 0.50 0.50 0.50 0.50 0.65 0.65 0.65 0.65 0.75 0.75 0.75 0.75 0.65 0.65 0.65 0.65 0.50 0.50 0.50 0.50 0.65 JUN 0.75 0.75 0.75 0.75 0.65 0.65 0.65 0.65 0.55 0.55 0.55 0.55 0.65 0.65 0.65 0.65 0.75 0.75 0.75 0.75 0.65 0.65 0.65 0.65 0.55 0.55 0.55 0.55 0.65 188 JUL 0.75 0.75 0.75 0.75 0.65 0.65 0.65 0.65 0.55 0.55 0.55 0.55 0.65 0.65 0.65 0.65 0.75 0.75 0.75 0.75 0.65 0.65 0.65 0.65 0.55 0.55 0.55 0.55 0.65 AUG 0.75 0.75 0.75 0.75 0.65 0.65 0.65 0.65 0.55 0.55 0.55 0.55 0.65 0.65 0.65 0.65 0.75 0.75 0.75 0.75 0.65 0.65 0.65 0.65 0.55 0.55 0.55 0.55 0.65 SEP 0.75 0.75 0.75 0.75 0.65 0.65 0.65 0.65 0.55 0.55 0.55 0.55 0.65 0.65 0.65 0.65 0.75 0.75 0.75 0.75 0.65 0.65 0.65 0.65 0.55 0.55 0.55 0.55 0.65 OCT 0.75 0.75 0.75 0.75 0.65 0.65 0.65 0.65 0.55 0.55 0.55 0.55 0.65 0.65 0.65 0.65 0.75 0.75 0.75 0.75 0.65 0.65 0.65 0.65 0.55 0.55 0.55 0.55 0.65 NOV 0.65 0.65 0.65 0.65 0.55 0.55 0.55 0.55 0.45 0.45 0.45 0.45 0.55 0.55 0.55 0.55 0.65 0.65 0.65 0.65 0.55 0.55 0.55 0.55 0.45 0.45 0.45 0.45 0.55 DEC 0.60 0.60 0.60 0.60 0.50 0.50 0.50 0.50 0.40 0.40 0.40 0.40 0.50 0.50 0.50 0.50 0.60 0.60 0.60 0.60 0.50 0.50 0.50 0.50 0.40 0.40 0.40 0.40 0.50 Bay Area Hydrology Model 2013 User Manual – March 2014 30 31 32 33 34 35 36 37 38 39 40 41 42 43 44 45 46 47 48 0.50 0.50 0.50 0.60 0.60 0.60 0.60 0.50 0.50 0.50 0.50 0.40 0.40 0.40 0.40 0.50 0.50 0.50 0.50 0.50 0.50 0.50 0.60 0.60 0.60 0.60 0.50 0.50 0.50 0.50 0.40 0.40 0.40 0.40 0.50 0.50 0.50 0.50 0.50 0.50 0.50 0.60 0.60 0.60 0.60 0.50 0.50 0.50 0.50 0.40 0.40 0.40 0.40 0.50 0.50 0.50 0.50 0.60 0.60 0.60 0.70 0.70 0.70 0.70 0.60 0.60 0.60 0.60 0.45 0.45 0.45 0.45 0.60 0.60 0.60 0.60 0.65 0.65 0.65 0.75 0.75 0.75 0.75 0.65 0.65 0.65 0.65 0.50 0.50 0.50 0.50 0.65 0.65 0.65 0.65 0.65 0.65 0.65 0.75 0.75 0.75 0.75 0.65 0.65 0.65 0.65 0.55 0.55 0.55 0.55 0.65 0.65 0.65 0.65 189 0.65 0.65 0.65 0.75 0.75 0.75 0.75 0.65 0.65 0.65 0.65 0.55 0.55 0.55 0.55 0.65 0.65 0.65 0.65 0.65 0.65 0.65 0.75 0.75 0.75 0.75 0.65 0.65 0.65 0.65 0.55 0.55 0.55 0.55 0.65 0.65 0.65 0.65 0.65 0.65 0.65 0.75 0.75 0.75 0.75 0.65 0.65 0.65 0.65 0.55 0.55 0.55 0.55 0.65 0.65 0.65 0.65 0.65 0.65 0.65 0.75 0.75 0.75 0.75 0.65 0.65 0.65 0.65 0.55 0.55 0.55 0.55 0.65 0.65 0.65 0.65 0.55 0.55 0.55 0.65 0.65 0.65 0.65 0.55 0.55 0.55 0.55 0.45 0.45 0.45 0.45 0.55 0.55 0.55 0.55 0.50 0.50 0.50 0.60 0.60 0.60 0.60 0.50 0.50 0.50 0.50 0.40 0.40 0.40 0.40 0.50 0.50 0.50 0.50 Bay Area Hydrology Model 2013 User Manual – March 2014 This page has been intentionally left blank. 190 Bay Area Hydrology Model 2013 User Manual – March 2014 APPENDIX C: DEFAULT BAHM2013 HSPF IMPERVIOUS PARAMETER VALUES FOR ALAMEDA, SANTA CLARA, AND SAN MATEO COUNTIES The default BAHM2013 HSPF impervious parameter values are found in BAHM2013 file defaultpers.uci. These impervious parameter values have not changed from the original BAHM values. The default BAHM2013 HSPF impervious parameter values are based on HSPF calibrations of Castro Valley Creek, Alameda Creek, and Ross Creek. HSPF calibrations of Castro Valley Creek and Alameda Creek are documented in the report: AQUA TERRA Consultants. 2006. Hydrologic Modeling of the Castro Valley Creek and Alameda Creek Watersheds with the U.S. EPA Hydrologic Simulation Program – FORTRAN (HSPF). Prepared for Alameda Countywide Clean Water Program. January 20, 2006. The HSPF calibrations of Ross Creek and Thompson Creek are documented in the report: Clear Creek Solutions. 2007. Hydrologic Modeling of the Ross Creek and Thompson Creek Watersheds with the U.S. EPA Hydrologic Simulation Program – FORTRAN (HSPF). Prepared for Santa Clara Valley Urban Runoff Pollution Prevention Program. Any changes in the default BAHM2013 HSPF pervious and impervious parameter values require approval by the local municipal permitting agency, unless covered by additional guidance in Appendix D. HSPF parameter documentation is found in the document: Bicknell, B.R., J.C. Imhoff, J.L. Kittle Jr, T.H. Jobes, and A.S. Donigian Jr. 2001. Hydrological Simulation Program – Fortran, User’s Manual for Version 12. AQUA TERRA Consultants. Mountain View, CA. 191 Bay Area Hydrology Model 2013 User Manual – March 2014 Table 1. BAHM2013 Impervious Land Types IMPLND No. 1 2 3 4 5 6 7 8 9 10 11 12 13 14 15 16 17 Surface Roads Roads Roads Roads Roof Area Driveways Driveways Driveways Driveways Sidewalks Sidewalks Sidewalks Sidewalks Parking Parking Parking Parking Slope Flat(0-5%) Moderate(5-10%) Steep(10-20%) Very Steep(>20%) All Flat(0-5%) Moderate(5-10%) Steep(10-20%) Very Steep(>20%) Flat(0-5%) Moderate(5-10%) Steep(10-20%) Very Steep(>20%) Flat(0-5%) Moderate(5-10%) Steep(10-20%) Very Steep(>20%) 192 Bay Area Hydrology Model 2013 User Manual – March 2014 Table 2. BAHM2013 HSPF Impervious Parameter Values – Part I IMPLND No. 1 2 3 4 5 6 7 8 9 10 11 12 13 14 15 16 17 LSUR 100 100 100 100 100 100 100 100 100 100 100 100 100 100 100 100 100 SLSUR 0.05 0.10 0.15 0.25 0.05 0.05 0.10 0.15 0.25 0.05 0.10 0.15 0.25 0.05 0.10 0.15 0.25 NSUR 0.1 0.1 0.1 0.1 0.1 0.1 0.1 0.1 0.1 0.1 0.1 0.1 0.1 0.1 0.1 0.1 0.1 RETSC 0.10 0.09 0.08 0.06 0.10 0.10 0.09 0.08 0.06 0.10 0.09 0.08 0.06 0.10 0.09 0.08 0.06 LSUR: Length of surface flow path (feet) for impervious area SLSUR: Slope of surface flow path (feet/feet) for impervious area NSUR: Surface roughness (Manning’s n) for impervious area RETSC: Surface retention storage (inches) for impervious area 193 Bay Area Hydrology Model 2013 User Manual – March 2014 Table 3. BAHM2013 HSPF Impervious Parameter Values – Part II IMPLND No. 1 2 3 4 5 6 7 8 9 10 11 12 13 14 15 16 17 18 RETS 0.00 0.00 0.00 0.00 0.00 0.00 0.00 0.00 0.00 0.00 0.00 0.00 0.00 0.00 0.00 0.00 0.00 0.00 SURS 0.00 0.00 0.00 0.00 0.00 0.00 0.00 0.00 0.00 0.00 0.00 0.00 0.00 0.00 0.00 0.00 0.00 0.00 RETSC: Initial surface retention storage (inches) for impervious area SURS: Initial surface runoff (inches) for impervious area 194 Bay Area Hydrology Model 2013 User Manual – March 2014 APPENDIX D: ADDITIONAL GUIDANCE FOR USING BAHM2013 Scope and Purpose This appendix includes guidance and background information that are not incorporated into the BAHM2013 software, but which the user needs to know in order to use BAHM2013 for designing projects in the participating jurisdictions. The three main topic areas in this appendix are flagged in the main user manual text by specially formatted notes under the BAHM2013 elements or software features to which they are related: Appendix D Topic Infiltration Reduction Factor Flow Duration Outlet Structures (includes sizing of low-flow orifice and alternative configurations) Drawdown (drain) time for flow duration facilities Relevant Sections in User Manual Infiltration, page 114; applicable when specifying characteristics of a facility (pond, vault, tank, some LID elements) if “yes” is selected as the Infiltration option. Outlet Structure Configurations, pages 108113; applicable when specifying characteristics of a flow duration facility. Drawdown (Analysis screen), page 130. Additional guidance and references are also discussed at the end of this appendix. The sponsoring stormwater programs will revise and expand this section as time and resources allow. Check the BAHM2013 website at www.bayareahydrologymodel.org for the most recent updates. Infiltration Reduction Factor The Western Washington Hydrology Model included this factor to reflect the requirement in the Stormwater Management Manual for Western Washington (SMMWW), to incorporate a Correction Factor (CF) to determine long-term infiltration rates; the inverse of the CF is the Infiltration Reduction Factor in BAHM. The SMMWW gives three methods for determining CF: 1) a table providing empirical correlations between long-term infiltration rates and USDA Soil Textural Classification; 2) ASTM gradation testing at full-scale infiltration facilities; or 3) In-situ infiltration tests, preferably using a Pilot Infiltration Test specified in an appendix of the SMMWW. Application of a CF or safety factor attempts to account for clogging and the reduction in infiltration over time, which might apply to the bottom of a flow duration pond or the top layer of a bioretention facility. However, a safety factor is also used to account for uncertainties in the available estimate of in-situ infiltration rates. The SMMWW notes that its suggested CF values, which range from 2 to 4, “represent an average degree of long-term facility maintenance, TSS reduction through pretreatment, and site variability 195 Bay Area Hydrology Model 2013 User Manual – March 2014 in the subsurface conditions”, and that increases or decreases to these factors should be considered for unusual situations. Suggested safety factors in other texts and guidance generally range from 1 to 4. Bay Area stormwater permits typically require some form of tracking and verification for treatment and hydromodification facilities. In addition, designers should not be overly conservative in selecting a very high safety factor, since this might lead to overcontrolled (lower) post-project flows and an increase risk of causing impacts from deposition or sedimentation in the receiving channels. In the absence of other guidance, it is suggested that the BAHM2013 Infiltration Reduction Factor (the inverse of the safety factor) not be less than 0.25 or greater than 0.5. Note: Bay Area stormwater programs also restrict the use of infiltration for treatment purposes in certain conditions; since the flow duration facilities are also performing some treatment, designers should refer to the “C.3” guidance on treatment measure design for the applicable jurisdiction (see weblinks under Additional Resources below). Flow Duration Outlet Structures – Practical Design Considerations Low-flow Orifice Sizing The diameter of the low-flow (bottom) orifice is an important design parameter for flow duration facilities, since flows discharged through this outlet should be at or below the project threshold for controlled flows (Qcp). However maintenance and/or other practical considerations may dictate a practical limit to how small this orifice may be, which may be larger than the optimal theoretical diameter determined by Auto Pond. As an example, the SWMMWW specifies a minimum orifice diameter of 0.5 inches, for flow restrictor assemblies that are within protective enclosures that screen out large particles and also have 1-2 ft of sump below the orifice to allow for some sediment accumulation. While the user can manually set a minimum size for the low-flow orifice, doing so before running Auto Pond is not recommended as this may impair the program’s ability to optimize the pond configuration. The following general approach is suggested for designing a pond when there is a small value for the low end of the flow matching range: 1. First estimate the minimum pond volume allowing Auto Pond to freely determine the diameter and placement of all orifices. 2. Then manually accept all of the pond settings except low-flow orifice diameter. Set the low-flow orifice to the desired minimum size, after consulting the local municipal permitting agency. 3. Manually run the mitigated scenario as described on page 47 and review the Analysis screen to check if the revised mitigated flow still passes the flowduration criteria for curve matching. If so, proceed with the pond design using the revised outlet. 4. If the revised design shows Fail scoring at one or more flow levels, excess flow durations may be reduced somewhat by reducing the depth of the pond which 196 Bay Area Hydrology Model 2013 User Manual – March 2014 lowers the head above the orifice (SWMMWW recognizes a practical minimum of 3 feet of live storage if pond shallowing is required at the minimum orifice size. As an alternative, further mitigation can be applied to the low-flow orifice flow by adding an additional infiltration measure downstream. This can be sized either approximately by estimating an average excess flow from the orifice or with the help of BAHM2013 by returning to the screen for the Pond characteristics and specifying a different Downstream Connection for the bottom orifice, which is then connected to an additional element. With this revision to the post project scenario, the Point of Compliance for the system would then be located at the downstream end of the additional low-flow mitigation. Alternative Outlet Configurations BAHM2013 has two default types of outlet configurations (multiple orifice or orifice plus weir notch) based on a standpipe riser structure detailed in the SMMWW. The entire standpipe is usually within a cylindrical enclosure or manhole to exclude trash and larger particles that could clog the outlet. The SMMWW notes that orifices can also be placed on a tee section or a vertical baffle within the same type of enclosure. An alternative configuration is a flat headwall with orifices and or notches, protected by racks or gratings. This may be fabricated from a large steel plate, similar in construction to the extended detention outlets specified in the Denver (Colorado) manual referenced below. This alternative outlet can be simulated in the BAHM2013 as a very large diameter standpipe, where the width of the top notch is equal to the overflow width at the top of the plate between its supports. Drawdown Time and Considerations Flow duration control facilities are designed to detain stormwater on-site for an extended period of time. The drawdown time is a concern to designers in relation to two areas of design besides hydromodification management15: 1. Standing water for extended periods provides a potential habitat in which mosquitoes can breed. Each Bay Area stormwater program has worked with its local mosquito abatement or vector control agencies to develop guidelines for stormwater facility design; these generally recommend that design detention times not exceed 72 hours, and under no circumstances should exceed 5 days. Provisions for access and inspection by vector control personnel are also required. See stormwater C.3 guidance documents at the weblinks under Additional Resources for details of local vector control provisions, which apply to both treatment measures and flow duration facilities. 2. Flood control design is intended to control peak flows for large sized storms (with expected recurrence intervals such as 15, 25 or 100 years). Flood control 15 Drawdown time also influences the effectiveness of a flow duration control facility for stormwater treatment; however, under the MRP, HM facilities cannot be used as treatment facilities because detention basins are not considered LID treatment. 197 Bay Area Hydrology Model 2013 User Manual – March 2014 facilities typically require capture and detention of a specified volume of stormwater, which then is discharged out at flows that can be safely conveyed by downstream channels without undue risk of flooding. Flood control facilities usually are required to drain within 24 hours after the end of the design storm in order to be empty for the next storm event. This concern that flood control storage remain available for large events has led flood control agencies to require that any storage volume for water quality not be credited for flood control, a feature that is sometimes referred to as “dead storage”. Although many factors affect the drawdown time, the suggestions below may help BAHM2013 users in evaluating these other requirements. If flow duration control is required for a project site, it is recommended that the design process start with by using BAHM2013 to obtain a preliminary design for the flow duration pond, vault, or tank. Then check the performance of the facility for vector control concerns, and against flood control design criteria as appropriate. The latter is typically based on the concept of a single empirical “design storm” which does not directly correspond to the flow duration approach using frequency analysis in a long-term simulation. Vector Control If the 3-day drawdown is seldom or never exceeded over the simulation period, then likelihood of mosquito breeding in the facility is very low and the design for the pond, vault or tank does not need to be modified. If a 5-day drawdown time is exceeded more than once or twice during the simulation, the system may need to be redesigned to reduce the drawdown time. The designer should consider additional reductions in impervious area and/or LID elements to help reduce the facility size. To evaluate the frequency and distribution of larger events in more detail, use the Hydrograph tool (page 131) to plot monthly peaks for several years at a time of the mitigated (post-project) scenario to get an idea of how often the discharge that corresponds to the 3-day drain time would be exceeded during warmer months, when mosquito development times are shortest. Flood Control Local flood control design criteria must be obtained from the appropriate agency, as well as any other policies or restrictions that may apply to drainage design. A single design storm event can be imported as a time series (page 66) and applied to the post-project scenario instead of the simulated precipitation record. If additional live storage is needed, it may be added to upper levels of the same facility or provided elsewhere on the site Additional Resources Stormwater Programs have produced guidance documents for new and redevelopment projects in each county, which cover all “C.3” requirements including hydromodification management. These are available from local municipal permitting agencies and also on the following stormwater program websites: 198 Bay Area Hydrology Model 2013 User Manual – March 2014 Alameda Countywide Clean Water Program : www.cleanwaterprogram.org San Mateo Countywide Water Pollution Prevention Program: www.flowstobay.org Santa Clara Valley Urban Runoff Pollution Prevention Program: www.scvurppp.org The BAHM2013 website includes links to specific resources on these websites about stormwater requirements for new and redevelopment projects, along with BAHM2013 software and support documents and announcements about BAHM2013 updates and trainings: www.bayareahydrologymodel.org. Guidance by Other Agencies Some agencies in other parts of the US have developed extensive guidance for design of stormwater management measures. Two manuals are discussed below that provide detailed discussions or examples that may be helpful to users of BAHM, although the suitability of these recommendations for Bay Area conditions has not been verified. These documents can help provide context and ideas for users for BAHM, but adapting these ideas requires the exercise of professional engineering judgment. Mention of the procedures and details in these documents does not imply any endorsement or guarantee that they will be appropriate for addressing the Hydromodification Management Standards in Bay Area jurisdictions. Stormwater Management Manual for Western Washington (SMMWW) was prepared by the Washington Department of Ecology for implementation in 19 counties of Western Washington. The latest (2012) edition in 5 volumes is on the Web at: http://www.udfcd.org/downloads/down_critmanual.htm Design recommendations from this manual were the basis for many features of the WWHM that have been carried over into BAHM. Portions of Volume 3 (Hydrology) that may be of interest to project designers include: Pages 3-2 through 3-18 illustrate several types of roof downspout controls, simple pre-engineered designs for infiltrating and/or dispersing runoff from roof areas in order to reduce runoff volume and/or increase potential groundwater recharge. Pages 3-50 to 3-63 discuss outlet control structures, their maintenance and source equations modeled into WWHM and BAHM Pages 3-75 to 3-93 regarding Infiltration Reduction Factor Urban Storm Drain Criteria Manual by the Denver Urban Drainage and Flood Control District is on the Web at: http://www.udfcd.org/downloads/down_critmanual.htm Volume 3 covers design of extended detention basins on pages S-66 through S-77 and structural details shown on pages SD-1 to SD-16. Although these designs are not 199 Bay Area Hydrology Model 2013 User Manual – March 2014 presented for hydromodification management control, the perforated plate design concept allows fine-tuning of drawdown times and is adaptable for use in flow duration facilities. 200 Bay Area Hydrology Model 2013 User Manual – March 2014 APPENDIX E: BIORETENTION MODELING METHODOLOGY Water Movement Through The Soil Column Water movement through the soil column is dependent on soil layer characteristics and saturation rates for different discharge conditions. Consider a simple two-layered bioretention facility designed with two soil layers with different characteristics. As water enters the facility at the top, it infiltrates into the soil based on the modified Green Ampt equation (Equation 1). The water then moves through the top soil layer at the computed rate, determined by Darcy’s and Van Genuchten’s equations. As the soil approaches field capacity (i.e., gravity head is greater than matric head), we can determine when water will begin to infiltrate into the second layer (lower layer) of the soil column. This occurs when the matric head is less than the gravity head in the first layer (top layer). Since the two layers have different soil characteristics, water will move through the two layers at different rates. Once both layers have achieved field capacity then the layer that first becomes saturated is determined by which layer is more restrictive. This is determined by using Darcy’s equation to compute flux for each layer at the current level of saturation. The layer with the more restrictive flux is the layer that becomes saturated for that time step. The next time step the same comparison is made. The rate and location of water discharging from the soil layer is determined by the discharge conditions selected by the user. There are four possible combinations of discharge conditions: 1. There is no discharge from the subsurface layers (except for evapotranspiration). This means that there is no underdrain and there is no infiltration into the native soil. Which this discharge condition is unlikely, we still need to be able to model it. 2. There is an underdrain, but no native infiltration. Discharge from the underdrain is computed based on head conditions for the underdrain. The underdrain is configured to have an orifice. (It is possible for the orifice to be the same diameter as the underdrain.) With a maximum of three soil layers determining head conditions for the orifice is complicated. Each modeled layer must overcome matric head before flow through the underdrain can begin. Once matric head is overcome by gravity head for all of the layers then the underdrain begins to flow. The flow rate is determined based on the ability of the water to move through the soil layers and by the discharge from the orifice, whichever is smaller. Head conditions are determined by computing the saturation level of the lowest soil layer first. Once the lowest soil layer is saturated and flow begins then the gravity head is considered to be at the saturation level of the lowest soil layer. Once the lowest soil layer is saturated completely then the head will include the gravity head from the next soil layer above 201 Bay Area Hydrology Model 2013 User Manual – March 2014 until gravity head from all soil layers is included. Gravity head from ponding on the surface is included in the orifice calculations only if all of the intervening soil layers are saturated. 3. There is native infiltration but no underdrain. Discharge (infiltration) into the native soil is computed based a user entered infiltration rate in units of inches per hour. Specific head conditions are not used in determining infiltration into the native soil. Any impact due to head on the infiltration rate is considered to be part of the determination of the native soil infiltration rate. Because it is possible to have a maximum of three soil layers, each modeled layer must overcome matric head before infiltration to the native soil can begin. Once matric head is overcome by gravity head for all modeled layers then infiltration begins at a maximum rate determined either by the ability of the water to move through the soil layers or by the ability of the water to infiltrate into the native soil, whichever is limiting. 4. There is both an underdrain and native infiltration. Underdrain flow and native infiltration are computed as discussed above. However, there is one other limitation to consider. In the case where the flow through the soil layer is less than the sum of the discharge through the underdrain and the native infiltration then the flow through the soil layer becomes the limiting flow and must be divided between the native infiltration and the underdrain. This division is done based on the relative discharge rates of each. Note that wetted surface area can be included in the discharge calculations by adding the infiltration through the wetted surface area to the lower soil layer and the upper surface layer individually. This is done by computing the portion of the wetted surface area that is part of the upper surface layer and computing the infiltration independently from the portion of the wetted surface area that is part of the lower soil layers. Water Movement Equations There are several equations used to determine water movement from the surface of the bioretention facility, through the soil layers, and into an underdrain or native infiltration. The water movement process can be divided into three different zones: 1) Surface ponding and infiltration into the top soil layer (soil layer 1) 2) Percolation through the subsurface layers 3) Underdrain flow and native infiltration 202 Bay Area Hydrology Model 2013 User Manual – March 2014 Surface ponding and infiltration into the top subsurface layer The modified Green Ampt equation (Equation 1) controls the infiltration rate into the top soil layer: ( )(d ) f K 1 F (Equation 1; Ref: Rossman, 2009) f = soil surface infiltration rate (cm/hr) soil porosity of top soil layer soil moisture content of top soil layer suction head at the wetting front (cm) F= soil moisture content of the top soil layer (cm) d= surface ponding depth (cm) K= hydraulic conductivity based on saturation of top soil layer (cm/hr) K (relative hydraulic conductivity) can be computed using the following Van Genuchten approximation equation: (Equation 2; Ref: Blum et al, 2001) A few issues arise when dealing with multiple subsurface soil layers. The K value used in Equation 1 must be computed from the top soil layer. Infiltration into the upper soil layer must not exceed the lesser of the maximum percolation rates for each of the soil layers. Finally, the rate of percolation of the top layer may be reduced because the layer or layers beneath the top layer cannot accept the percolation flux because of existing saturation levels. 203 Bay Area Hydrology Model 2013 User Manual – March 2014 Percolation through the subsurface layers Water storage and movement through the three subsurface layers will be computed using Darcy’s equation as shown below: q K h z (Equation 3) Where: q = Darcy flux (cm/hr) K = hydraulic conductivity of the porous medium (cm/hr) h = total hydraulic head (cm) z = elevation (cm) The total head, h, is the sum of the matric head, , and the gravity head, z: h z . (Equation 4) Substituting for h yields: q K d ( z ) . dz (Equation 5) Hydraulic conductivity and matric head vary with soil moisture content. These values can be computed by solving the Van Genuchten’s equation (Equation 6) for both values. Note that 0 when the soil is saturated. 204 Bay Area Hydrology Model 2013 User Manual – March 2014 (Equation 6; Ref: Blum et al, 2001) Effective saturation (SE) can be computed using the following Van Genuchten equation: (Equation 7; Ref: Blum et al, 2001) Ignoring z (elevation head) results in h = hm (matric head). 205 Bay Area Hydrology Model 2013 User Manual – March 2014 Evapotranspiration from the Soil Column Evapotranspiration is an important component of the bioretention facility’s hydrologic processes. Evapotranspiration removes water from bioretention surface ponding and the soil column during non-storm periods. The routine will satisfy potential evapotranspiration (PET) demands in the same sequence as implemented in HSPF: 1. Water available from vegetation interception storage 2. Water available from surface ponding 3. Water available from the bioretention soil layers (top layer first) Water will be removed from vegetation interception storage and surface ponding and the bioretention soil layers (starting at the top layer) down to the rooting depth at the potential rate. Water is taken from the soil layers below the rooting depth based on a percentage factor to be determined. Without this factor there will be no way to remove water from below the rooting depth once it becomes completely saturated. References Blum, V.S., S. Israel, and S.P. Larson. 2001. Adapting MODFLOW to Simulate Water Movement in the Unsaturated Zone. MODFLOW 2001 and Other Modeling Odysseys, International Groundwater Modeling Center (IGWMC), Colorado School of Mines, Golden, Colorado, September 11-14, 2001. In MODFLOW 2001 and Other Modeling Odysseys, Proceedings. pp.60-65. Rossman, L.A. 2009. Modeling Low Impact Development Alternatives with SWMM. Presented at CHI International Stormwater and Urban Water Systems Conference, Toronto, Ontario, Canada, February 20, 2009. 206