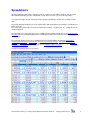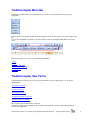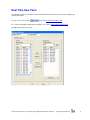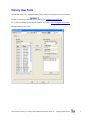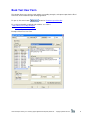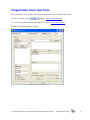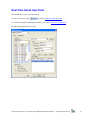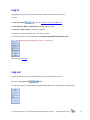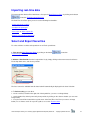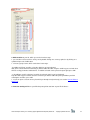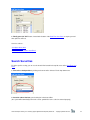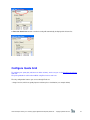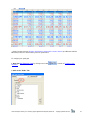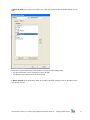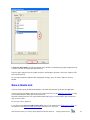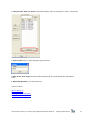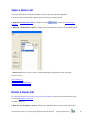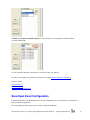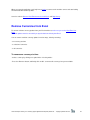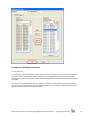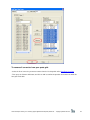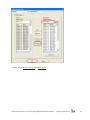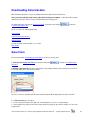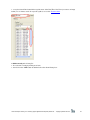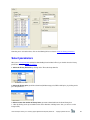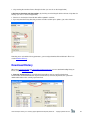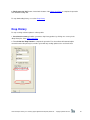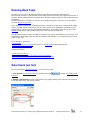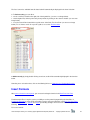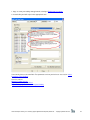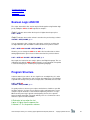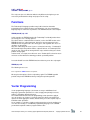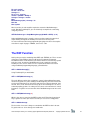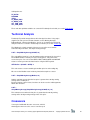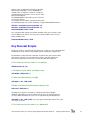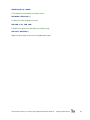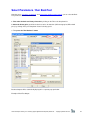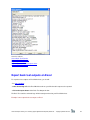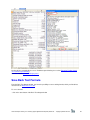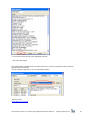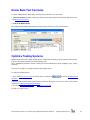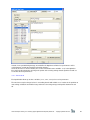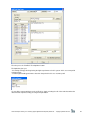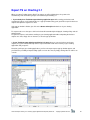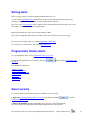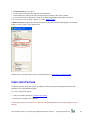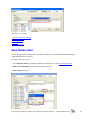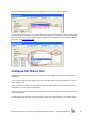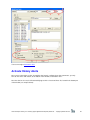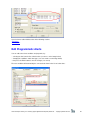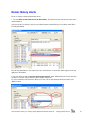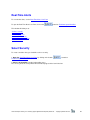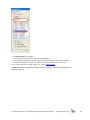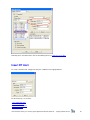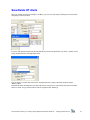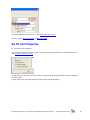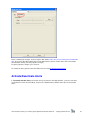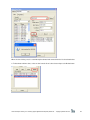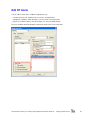
1
TRADE INTERCEPTOR EXCEL 1.0
USER MANUAL
Trade Interceptor Charting 3.3 is a trading support application developed by Riflexo Ltd - Copyright ©Riflexo Ltd 2007
1
Welcome to TradeInterceptor Excel 1.0 help file
This help file has been created to give you a fast understanding of what's possible with TradeInterceptor
Excel v.1.0 in order to get you started right away. It offers a full screenshot-based explanation of each
application functionality.
In the "how to" section below, you will learn how to use the most important features provided by
TradeInterceptor Excel 1.0 through simple step by step instructions.
To get you to speed quickly, all these functionalities and techniques are also explained in our self-running
video demos.
For faster understanding, we first advise you to take a look at the Application Overview.
CONTENT - How to use TradeInterceptor Excel 1.0:
This user manual covers the following aspects:
Application Overview
3
How to log in
11
How to import real-time data
12
How to download historical data
26
How to run trading system back tests
31
How to use TradeScript programming language
34
How to optimize trading systems
47
How to export trading system signals on TradeInterceptor Charting application
50
How to set alerts
51
Trade Interceptor Charting 3.3 is a trading support application developed by Riflexo Ltd - Copyright ©Riflexo Ltd 2007
2
Introduction
TradeInterceptor Excel 1.0 is a suite of trading support tools integrated seamlessly with Microsoft Excel,
designed to help you make more effective trading decisions.
This software module comes in bundle with TradeInterceptor Charting Platform and gives you the possibility
to:
- import real-time currency prices from various data providers into excel spreadsheets,
- download history prices, updated in real time, in your excel worksheets
- back test and optimize any kind of trading strategy
- export back test outputs both on Excel worksheets and TradeInterceptor Charting application
- set programmatic history alters, real-time alerts and voice alerts
- build trading systems through the use TradeScript™ programming language, which provides you with the
basic framework required to build sophisticated trading systems without extensive training or programming
experience,
- programme any advanced trading strategy thanks to Excel's Visual Basic Editor
- execute real-time custom formulas and calculations, thanks to the use of Microsoft Excel's extended
calculation and data analysis functionalities
TradeInterceptor Excel is a multi-feed market data module, meaning that you can choose to import data
from various data feed providers, and never be left without data.
You'll also be able to import historical data directly from our servers, so you won't need to burden your
PC with heavy downloads.
Another advantage is that you can have access to the program from anywhere you are, through a simple
internet connection.
Since users make calculations through the familiar Excel interface, learning time is minimal, greatly
reducing the interval between loading the software and performing useful strategies. The application is
extremely intuitive and the integration with TradeScript programming language makes it easy-to-use for
beginners yet powerful enough for the most demanding traders.
TradeInterceptor Excel v.1 is composed of:
- Microsoft Excel spreadsheets, which include Excel menus and icons
- TradeInterceptor Excel Menu Bar
- TradeInterceptor Excel User Forms
Trade Interceptor Charting 3.3 is a trading support application developed by Riflexo Ltd - Copyright ©Riflexo Ltd 2007
3
Spreadsheets
Opening TradeInterceptor Excel 1.0 will open your PC-resident version of Microsoft Excel, and the system
will automatically display your last configuration, exactly like it was when you closed the application.
You only need to log in and the worksheet will be activated automatically and will start receiving real-time
data.
So you'll be working exactly like you do on any Excel file, with standard Excel spreadsheets, standard Excel
menus and icons.
This means that you'll be able use Excel instruments and functions, sort, filter, print, etc., exactly like you do
on Microsoft Excel.
The only difference is that you'll have access to additional functionalities through the use of TradeInterceptor
Menu Bar, which is automatically displayed as a floating menu bar on the Excel worksheet when you open
the application.
This menu bar will give you access to TradeInterceptor Excel functionalities including the download of
streaming real-time data, of historical data, the back test of trading strategies, the optimization of trading
systems, the export of back test outputs on Excel and TradeInterceptor charts, the possibility to set historybased and real-time alerts, all this through the use of TradeInterceptor User Forms,
Example of TradeInterceptor Excel interface:
Trade Interceptor Charting 3.3 is a trading support application developed by Riflexo Ltd - Copyright ©Riflexo Ltd 2007
4
TradeInterceptor Menu Bar
TradeInterceptor Menu Bar is the floating bar you see on the excel spreadsheet when you open the
application.
You can resize it by using the double arrow which appears when you place your mouse on the edges of the
bar.
You can also drag&drop it on Excel's icons bar in order to seamlessly integrate it with Excel's main icons
menu.
This menu bar gives you access to the following functionalities:
- log in
- log out
- import real-time data
- download historical data
- run back tests
- set alerts
TradeInterceptor User Forms
TradeInterceptor User Forms are a series of pop-up windows, each one giving you access to specific
functionalities:
- Real-time User Form:
- History User Form:
- Back Test User Form:
- Programmatic Alerts User Form
- Real Time Alerts User Form:
All User Forms are presented in the same way.
In all of them, data can be sorted by simply clicking on the header of a column, and by clicking again to
reverse the sorting order.
Trade Interceptor Charting 3.3 is a trading support application developed by Riflexo Ltd - Copyright ©Riflexo Ltd 2007
5
Real Time User Form
This windows allows you to import or delete real-time data from Excel worksheets, and to configure your
real-time quote grid.
To open it, click on the button
, located on TradeInterceptor Menu Bar.
To see the functionalities provided by this window, see section: how to import real-time data
Example of Real Time User Form:
Trade Interceptor Charting 3.3 is a trading support application developed by Riflexo Ltd - Copyright ©Riflexo Ltd 2007
6
History User Form
This window allows you to download historical data, or drop history requests in Excel worksheets.
To open it, click on the button
, located on TradeInterceptor Menu Bar.
To see the functionalities provided by this window, see section: How to download historical data
Example of History User Form:
Trade Interceptor Charting 3.3 is a trading support application developed by Riflexo Ltd - Copyright ©Riflexo Ltd 2007
7
Back Test User Form
This window allows you to back test and optimize your trading strategies, and export outputs both to Excel
worksheets and to TradeInterceptor Charting application.
To open it, click on the button
, located on TradeInterceptor Menu Bar.
To see the functionalities provided by this window, see sections:
- How to Back Test Trading Strategies
- and How to Export Back Test Outputs
Example of Back Test User Form:
Trade Interceptor Charting 3.3 is a trading support application developed by Riflexo Ltd - Copyright ©Riflexo Ltd 2007
8
Programmatic Alerts User Form
This window allows you to program alerts based on historical data, such as trading systems alerts.
To open it, click on the button
, located on TradeInterceptor Menu Bar.
To see the functionalities provided by this window, see section: How to set history alerts
Example of Programmatic Alerts User Form:
Trade Interceptor Charting 3.3 is a trading support application developed by Riflexo Ltd - Copyright ©Riflexo Ltd 2007
9
Real-Time Alerts User Form
This window allows you to set real-time alerts.
To open it, click on the button
, located on TradeInterceptor Menu Bar.
To see the functionalities provided by this window, see section: How to set real time alerts
Example of Real-Time Alerts User Form:
Trade Interceptor Charting 3.3 is a trading support application developed by Riflexo Ltd - Copyright ©Riflexo Ltd 2007
10
Log in
Logging in allows you to get connected to TradeInterceptor real-time and history servers.
To log in:
1. click on the button
located on TradeInterceptor floating Menu Bar
2. Insert your User Name and Password in the login pop-up window.
5. press the "Login" button to complete the operation
If you want to cancel the operation, press the "Cancel" button.
6. The log in procedure is completed when the TradeInterceptor Menu Bar becomes active.
This is how TradeInterceptor Menu Bar looks after successful login:
See also section: Log out
Log out
Logging out will disconnect you from TradeInterceptor real-time and history servers.
To log out, simply press the
button.
The log out procedure is completed when TradeInterceptor Menu Bar is deactivated (see image below)
Trade Interceptor Charting 3.3 is a trading support application developed by Riflexo Ltd - Copyright ©Riflexo Ltd 2007
11
Importing real-time data
To import real-time data into Excel worksheets, first open the Real-Time User Form, by clicking on the button
, located on TradeInterceptor Menu Bar.
The Real Time User Form gives you access to the following functionalities:
- Select and export securities
- Configure the quote grid
- Save, open, or delete a quote list
- Remove a list from Excel worksheet
Select and Export Securities
To select real-time securities and export them on an Excel spreadsheet:
1. First open the Real-Time User Form, by clicking on the button
TradeInterceptor Menu Bar.
, located on
2. Choose a Data Provider from the feed providers list, by simply clicking on the arrow next to the "Choose
Feed" drop-down menu, and select a provider.
The list of currencies available from this data feed will automatically be displayed in the items list below.
3. To find a security, you can either:
• use the scroll bar, located on the right side of the Symbol list, (see area 1 on image below)
• sort the Symbol list, either by name of by item provider, by clicking on the column's header (see area 2 on
image below)
• or use the Search Box located in the top left corner of the Real Time User Form (see area 3 on image
below). To see how to search for a specific symbol, see section Find Securities
Trade Interceptor Charting 3.3 is a trading support application developed by Riflexo Ltd - Copyright ©Riflexo Ltd 2007
12
4. Add securities to your list, which you can do in various ways:
• you can either select currencies one by one by double clicking on a currency symbol, or by clicking on a
symbol and press the "Add" button
• or insert a group a items, which can be done in two ways:
- by adding a full list of securities, using the "Shift" key of your keyboard:
after you've selected the first instrument you want to add to the table, keep the "Shift" key pressed and select
the last security you want to add to the list. To add the selected currency list to the quote grid, press "OK"
- or by adding a specific selection of securities by using the "Ctrl" key of you keyboard:
keep the "Ctrl" key pressed and select the currencies you want to add to the quote grid. When you finish
selecting the securities, press "OK"
• or you can open a custom currency list which you already saved previously (see section: Save or Delete a
Quote List)
4. Insert the starting cell where you'd like the quote grid to start from on your Excel Sheet 1:
Trade Interceptor Charting 3.3 is a trading support application developed by Riflexo Ltd - Copyright ©Riflexo Ltd 2007
13
5. Finally, press the "OK" button, located at the bottom of the Real Time User Form, to export your realtime quote list on Excel,
See also sections :
- Configure Quote Grid
- Save a Quote List
- Remove Real-time Quotes from Excel
Search Securities
To find a specific security, you can use the Search Box located in the top left corner of the Real Time User
Form.
1- First select a feed provider by clicking on the arrow of the "Choose Feed" drop-down menu:
2- Insert the code of the item you're looking for in the Search Box:
(the system will automatically look for the correct symbol if the item's code isn't entered properly)
Trade Interceptor Charting 3.3 is a trading support application developed by Riflexo Ltd - Copyright ©Riflexo Ltd 2007
14
3- Press the Search icon and the searched security will automatically be displayed in the items list.
Configure Quote Grid
To configure your quote grid, (add, move or delete columns) ,make sure you use the Real Time User Form
fields tab.
The quote grid table should not be modified using Excel' menus and icons.
The only configuration features you can use through Excel are:
- change font size, which can greatly improve real-time prices visualization (see example below)
Trade Interceptor Charting 3.3 is a trading support application developed by Riflexo Ltd - Copyright ©Riflexo Ltd 2007
15
- change font type: however font type should not be changed in the arrows columns (Ask Direction and Bid
Direction) because this would reduce your CPU performance.
To configure your quote grid:
1. Open the Real Time User Form by clicking on the button
Menu Bar.
, located on TradeInterceptor
2. Click on the "Fields" Tab:
Trade Interceptor Charting 3.3 is a trading support application developed by Riflexo Ltd - Copyright ©Riflexo Ltd 2007
16
3. Select the fields of the columns you want to see or hide from your quote grid, by double clicking on each
field:
Two buttons, located at the bottom of this window, can help you select fields quickly:
• the "Select All" button checks and therefore selects all fields
• the "Remove Select" button clears all selected fields.
4. Define the order of the quote table's fields, by selecting a field and using the arrows on the right to move
each field up or down
Trade Interceptor Charting 3.3 is a trading support application developed by Riflexo Ltd - Copyright ©Riflexo Ltd 2007
17
5. Press the "OK" button, located at the bottom of the window, to confirm both your grid configuration and
securities selection, and export your grid into Excel.
If you first prefer going back to the symbols list before confirming the operation, click on the "Symbols" Tab,
next to the Fields Tab.
To cancel the operation and ignore table configuration changes, press the "Close" button to close the
window.
Save a Quote List
Your last real-time quote list will automatically be saved and retrieved when you'll open the application.
You also have the possibility to prepare and save various items lists into the Real Time User Form, in order
to easily download items when you need to watch a list.
Note that real-time quote lists can only be downloaded on Worksheet1, and you will be able to download
only one list at a time.
To save one or more quote lists:
1. You first need to select and add currency items to the List of Symbols of the Real Time User Form, as
described in section Select and Export Securities, before you can save a list.
Trade Interceptor Charting 3.3 is a trading support application developed by Riflexo Ltd - Copyright ©Riflexo Ltd 2007
18
2. Then press the "Save List" button, located at the bottom of the List of Symbols, in order to save that list.
3. Insert a name for this list in the appropriate pop-up window
4. Click on the "Save" button and the list will be automatically saved and added to the drop-down list
menu.
5. Repeat the operation to save other quote lists.
See also sections:
Open a Quote List
Delete a Quote List
Save/Open Excel Configuration
Remove Currencies from Excel
Trade Interceptor Charting 3.3 is a trading support application developed by Riflexo Ltd - Copyright ©Riflexo Ltd 2007
19
Open a Quote List
Your last real-time quote list will automatically be retrieved when you'll open the application.
You can also open and download a different quote list, which you saved previously:
1. Open the Real Time User Form by clicking on the button
Menu Bar.
, located on TradeInterceptor
2. Open the "List of Symbols" menu by clicking on the drop-down menu arrow next to the "Delete" button:
3. Select a list and the currencies of this list will automatically be displayed in the items list below.
See also section:
Save a Quote List
Delete a Quote List
Save/Open Excel Configuration
Remove Currencies from Excel
Delete a Quote List
This operation will not remove quotes from your Excel spreadsheet, but it will cancel a quote list which you
saved in the Real Time User Form.
To delete a quote list:
1. Open the "List of Symbols" menu by clicking on the drop-down menu arrow next to the "Del" button
Trade Interceptor Charting 3.3 is a trading support application developed by Riflexo Ltd - Copyright ©Riflexo Ltd 2007
20
2. Select a list and press the Delete button to remove it from the "List of Symbols" and the list will be
canceled automatically.
You can repeat the operation several times to cancel more than one quote list.
To delete a currency list from your Excel worksheet, see section: Remove Currencies from Excel.
See also section:
Save a Quote List
Open a Quote List
Save/Open Excel Configuration
Save/Open Excel Configuration
TradeInterceptor Excel 1.0 automatically saves the last configuration you've been working on, and retrieves it
when you open the application.
The retrieved lay-out will be your last lay-out, when closing the application.
Trade Interceptor Charting 3.3 is a trading support application developed by Riflexo Ltd - Copyright ©Riflexo Ltd 2007
21
When you open the application, you'll only have to log in to connect to the real-time servers and start feeding
the worksheet with real-time updates.
See also sections: Remove Real Time Currencies from Excel, and Drop History
Remove Currencies from Excel
To remove real-time currency updates from your Excel worksheet, make sure you use the Real Time User
Form.
Data and updates won't be canceled if you try to delete items directly from Excel.
You can remove real-time currency updates in various ways, either by removing:
- one currency at a time
- a selection of currencies
- or all currencies
To remove one currency at a time:
- Select a currency by clicking on a symbol in the "List of Symbols"
- Press the "Remove" button, and finally click on "OK" to remove this currency from your excel table.
Trade Interceptor Charting 3.3 is a trading support application developed by Riflexo Ltd - Copyright ©Riflexo Ltd 2007
22
To remove a selection of currencies:
You can either use:
- the "Shift" key of your keyboard to remove a group of currencies: after you've selected the first instrument
you want to remove from the table, keep the "Shift" key pressed and select the last security you want to
remove from the list. Then press the "remove" button and finally click on "OK" to remove this group from your
excel table.
- the "Ctrl" key of you keyboard to remove a selection of currencies: keep the "Ctrl" key pressed and select
the currencies you want to remove from the quote grid. Then press the "remove" button, and finally click on
"OK" to remove this selection from your excel table.
Trade Interceptor Charting 3.3 is a trading support application developed by Riflexo Ltd - Copyright ©Riflexo Ltd 2007
23
To remove all currencies from your quote grid:
- Select the list of currencies you want to remove from the List of Symbols of the Real Time User Form
- Then press the "Remove All" button, and click on "OK" to confirm the operation and remove the whole list
from your Excel table
Trade Interceptor Charting 3.3 is a trading support application developed by Riflexo Ltd - Copyright ©Riflexo Ltd 2007
24
See also sections: Delete a Quote List and Drop History
Trade Interceptor Charting 3.3 is a trading support application developed by Riflexo Ltd - Copyright ©Riflexo Ltd 2007
25
Downloading historical data
With TradeInterceptor Excel 1.0 you can download historical data into Excel worksheets.
The system automatically feeds history tables with real-time price updates, so that your table is always
updated, and you don't have to refresh or download the latest history prices.
To download history, first open the History User Form, by clicking on the button
TradeInterceptor Menu Bar.
, located on
There are 3 steps for downloading history:
Select an item
Select the history parameters
Download data
To stop receiving real time updates, see section:
Drop history
Select item
The first step towards downloading historical data is to select a currency item.
1. First open the History User Form, by clicking on the button
Menu Bar.
, located on TradeInterceptor
2. Choose a Data Provider from the feed providers list, by simply clicking on the arrow next to the "Choose
Feed" drop-down menu, and select a provider.
The list of currencies available from this data feed will automatically be displayed in the items list below.
3. To find a security, you can either:
• use the scroll bar, located on the right side of the Symbol list, (see area 1 on image below)
• sort the Symbol list, either by name of by item provider, by clicking on the column's header (see area 2 on
image below)
Trade Interceptor Charting 3.3 is a trading support application developed by Riflexo Ltd - Copyright ©Riflexo Ltd 2007
26
• or use the Search Box located in the top left corner of the Real Time User Form (see area 3 on image
below). To see how to search for a specific symbol, see section Find Securities
4. Add a security to the history list:
• first select the security by clicking on an item,
• then click on the "ADD" button to add the item to the "Show History" box
Trade Interceptor Charting 3.3 is a trading support application developed by Riflexo Ltd - Copyright ©Riflexo Ltd 2007
27
Now that you've selected an item, click on the following link to see how to select the history parameters.
Select parameters
After you've selected an item and before downloading historical data in Excel, you should select the history
parameters, using the History User Form:
1. Select the history timescale by clicking on the Timescale drop-down list
2. Select the history price you'd like to download (AVG:average price; BID or ASK price), by clicking on the
price drop-down list
3. Select or enter the number of history items you want to download from the Show History box:
• either by clicking on the up and down arrows of the "Number of History Items" box, (see area "a" on the
image below)
Trade Interceptor Charting 3.3 is a trading support application developed by Riflexo Ltd - Copyright ©Riflexo Ltd 2007
28
• or by entering the number of items directly in the box (see area "b" on the image below)
4. Activate or deactivate real-time updates, by checking or unchecking the tick box in front of "Updates for
History" (see area "c" on the image below):
• if the box is checked, the historical table will be updated in real-time
• if you only want the history data, but you don't need the real-time price updates, just uncheck the box
Now that you've selected the history parameters, you're ready to download historical data in Excel: see
section Download History
Download History
After you've selected an item and selected the history parameters you can start downloading history on
Excel, using the History User Form.
1. Insert the starting cell where you'd like the history table to start on your Excel worksheet.
Historical data can be downloaded on any Excel worksheet (ie. Sheet 2). By default, the system will
download the data on the currently open worksheet.
Trade Interceptor Charting 3.3 is a trading support application developed by Riflexo Ltd - Copyright ©Riflexo Ltd 2007
29
5. Finally, press the "OK" button, located at the bottom of the History User Form, to complete the operation
and start downloading data.
To stop downloading history, see section: Drop History
Drop History
To stop receiving real-time updates in a history table:
1. first select the currency for which you want to drop history updates, by clicking on a currency in the
"Drop History" list of the History User Form
2. Then click on the "Drop" button to complete the operation. The selected item will automatically be
removed from the Drop History list, and the system will stop sending updates to the excel worksheet.
Trade Interceptor Charting 3.3 is a trading support application developed by Riflexo Ltd - Copyright ©Riflexo Ltd 2007
30
Running Back Tests
Back tests are a key part of developing confidence in a trading strategy before implementation.
Back Testing refers to the actual execution of the trading system on a security, over a given period of time. It
simulates decision making based on past data, and is effective in refining systems in order to optimize future
performance.
TradeInterceptor Excel 1.0 allows you to back test any trading strategy on a selected security, through the
use of the Back Test User Form.
Upon completion of a back test , TradeInterceptor Excel 1.0 displays a performance summary of the trading
system, including statistics and trade log. You can make revisions to the trading rules, then back test your
strategy again to see if the revisions improved the performance of the trading system. Or you can use the
Optimizer functionality to adjust trading signals based on the best past performance.
The application also gives you the possibility to export back test outputs and optimizer results on Excel, and
to export Back Test trading signals directly into TradeInterceptor Charting 3.1, to visualize past buy and sell
signals on the chart.
To run back tests, you have to:
- select an item,
- insert the trading system formula thanks to the use of TradeScript programming language.
- select the back test parameters
You'll then be able to:
- export outputs into Excel
- use the Optimizer to optimize the trading system's performance
- export your trading strategy on TradeInterceptor Charting application,
Select back test Item
The first step towards running a back test is to select a currency item.
1. First open the Back Test User Form, by clicking on the button
Menu Bar.
, located on TradeInterceptor
2. Choose a Data Provider from the feed providers list, by simply clicking on the arrow next to the "Choose
Feed" drop-down menu, and select a provider.
Trade Interceptor Charting 3.3 is a trading support application developed by Riflexo Ltd - Copyright ©Riflexo Ltd 2007
31
The list of currencies available from this data feed will automatically be displayed in the items list below.
3. To find a security, you can either:
• use the scroll bar, located on the right side of the Symbol list, (see area 1 on image below)
• sort the Symbol list, either by name of by item provider, by clicking on the column's header (see area 2 on
image below)
• or use the Search Box located in the top left corner of the Back Test User Form (see area 3 on image
below). To see how to search for a specific symbol, see section Find Securities
4. Add a security by simply double-clicking on an item, and it will be automatically displayed in the item box
below.
Now that you've selected an item, click on the following link to see How to Insert a TradeScript Formula
Insert Formula
After you've selected a currency item, you can start inserting the formula in the Back Test User Form
TradeInterceptor Excel 1.0 gives you the possibility to use the powerful programming functionalities of
TradeScript language to create and insert trading systems and custom formulas in the Back Test User Form,
in order to run back tests, optimize and export your trading strategies in Excel and on TradeInterceptor
Charting.
To insert a formula:
Trade Interceptor Charting 3.3 is a trading support application developed by Riflexo Ltd - Copyright ©Riflexo Ltd 2007
32
1. Copy or create your trading strategy formula, referring to TradeScript User Guide
2. Insert the Buy and Sell scripts in the appropriate boxes
You now only have to select the Back Test parameters and run your back test. See section: Select
Parameters / Run Backtest
See also sections:
Optimize Trading Systems
Export BackTest Outputs on Excel
Export Trading Signals on TradeInterceptor Charting
Trade Interceptor Charting 3.3 is a trading support application developed by Riflexo Ltd - Copyright ©Riflexo Ltd 2007
33
TradeScript
TradeScript™ is a powerful and versatile programming language for traders.
The language provides the framework required to build sophisticated trading
programs piece by piece without extensive training or programming experience.
In the following sections, we've reported the 1st chapter of TradeScript User Manual,
explaining the most important concepts for the use of the programming language.
To download the full TradeScript User Guide, including:
- Primitive Functions & Operators,
- Technical Analysis Functions,
- Trading System Examples & Techniques
- Primitive Variables, Constants, and Flags
click on the following link:
Introduction
The following script is a very simple example that identifies markets that are
trading higher than the opening price:
LAST > OPEN
It almost goes without saying that the purpose of this script is to identify when the
last price is trading higher than the open price… it is nearly as plain as English.
Just as a spoken language gives you many ways to express each idea, the
TradeScript™ programming language provides a wide variety of ways to program
a trading system. Scripts can be very simple as just shown or extremely complex,
consisting of many hundreds of lines of instructions. But for most systems, scripts
usually consist of just a few lines of code.
In the following sections, you'll find an introduction to TradeScript language
together with short examples that demonstrate how to perform common,
basic tasks such as identifying securities within specific price range,
increasing in volatility, crossing over an indicator, and so forth.
You can cut and paste many of these examples right into the TradeScript™
programming area of TradeInterceptor Excel.
The last sections of this introduction contain a reference of functions, properties, and
constants supported by the TradeScript™ language as well as hands-on trading
system examples. This method of organization allows the beginning programmer
to see results immediately while learning at his or her own pace.
Most important concepts and Examples include:
- Boolean Logic AND/OR
- Program Structure
- Functions
- Vector Programming
- The REF Function
- The TREND Function
- Price Gaps and Volatility
Trade Interceptor Charting 3.3 is a trading support application developed by Riflexo Ltd - Copyright ©Riflexo Ltd 2007
34
- Fundamental Analysis
- Technical Analysis
- Crossovers
- Key Reversal Scripts
Boolean Logic AND/OR
The scripts shown in this first section may be linked together using Boolean logic
just by adding the AND or the OR keyword, for example…
Script 1 evaluates to true when the last price is higher than the open price:
LAST > OPEN
Script 2 evaluates to true when volume is two times the previous day's volume:
VOLUME > REF(VOLUME, 1) * 2
You can aggregate scripts so that your script returns results for securities that
are higher than the open and with the volume two times the previous volume:
LAST > OPEN AND VOLUME > REF(VOLUME, 1) * 2
Likewise, you can change the AND into an OR to find securities that are either
trading higher than the open or have a volume two times the previous volume:
LAST > OPEN OR VOLUME > REF(VOLUME, 1) * 2
Once again, the instructions are nearly is plain as the English language. The use
of Boolean logic with the AND and OR keywords is a very important concept that
is used extensively by the TradeScript™ programming language.
Program Structure
It doesn't matter if your code is all on a single line or on multiple lines. It is often
easier to read a script where the code is broken into multiple lines. The following
script will work exactly as the previous example, but is somewhat easier to read:
LAST > OPEN OR
VOLUME > REF(VOLUME, 1) * 2
It is good practice to structure your scripts to make them as intuitive as possible
for future reference. In some cases it may be useful to add comments to a very
complex script. A comment is used to include explanatory remarks in a script.
Whenever the pound sign is placed at the beginning of a line, the script will
ignore the words that follow. The words will only serve as a comment or note to
make the script more understandable:
# Evaluates to true when the last
# price is higher than the open or the
# volume is 2 X's the previous volume:
Trade Interceptor Charting 3.3 is a trading support application developed by Riflexo Ltd - Copyright ©Riflexo Ltd 2007
35
LAST > OPEN OR
VOLUME > REF(VOLUME, 1) * 2
The script runs just as it did before with the only difference being that you can
more easily understand the design and purpose of the script.
Functions
The TradeScript™ language provides many built-in functions that make
programming easier. When functions are built into the core of a programming
language they are referred to as primitives. The TREND function is one example:
TREND(CLOSE, 30) = UP
In this example, the TREND function tells TradeScript™ to identify trades where
the closing price is in a 30-day uptrend.
The values that are contained inside a function (such as the REF function or the
TREND function) are called arguments. Here there are two arguments in the
TREND function. Argument #1 is the closing price, and argument #2 is 30, as in
"30 days" or "30 periods".
Only one of two things will occur if you use a function incorrectly… TradeScript™
will automatically fix the problem and the script will still run, or TradeScript™ will
report an error, tell you what's wrong with the script, and then allow you to fix the
problem and try again.
In other words, user input errors will never cause TradeScript™ to break or return
erroneous results without first warning you about a potential problem.
Let's take CLOSE out of the TREND function and then try to run the script again:
TREND(30) = UP
The following error occurs:
Error: argument of 'TREND' function not optional.
We are given the option to fix the script and try again. The TREND hyperlink
provides help for the TREND function by listing the required arguments.
Vector Programming
Vector programming languages (also known as array or multidimensional
languages) generalize operations on scalars to apply transparently to vectors,
matrices, and higher dimensional arrays.
The fundamental idea behind vector programming is that operations apply at
once to an entire set of values (a vector or field). This allows you to think and
operate on whole aggregates of data, without having to resort to explicit loops of
individual scalar operations.
As an example, to calculate a simple moving average based on the median price
of a stock over 30 days, in a traditional programming language such as BASIC
you would be required to write a program similar to this:
Trade Interceptor Charting 3.3 is a trading support application developed by Riflexo Ltd - Copyright ©Riflexo Ltd 2007
36
For each symbol
For bar = 30 to max
Average = 0
For n = bar - 30 to bar
median = (CLOSE + OPEN) / 2
Average = Average + median
Next
MedianAverages(bar) = Average / 30
Next bar
Next symbol
Nine to ten lines of code would be required to create the "MedianAverages"
vector. But with TradeScript™, you can effectively accomplish the same thing
using only one line:
SET MedianAverage = SimpleMovingAverage((CLOSE + OPEN) / 2, 30)
And now MedianAverage is actually a new vector that contains the 30-period
simple moving average of the median price of the stock at each point.
It is not uncommon to find array programming language "one-liners" that require
more than a couple of pages of BASIC, Java or C++ code.
The REF Function
At this point you may be wondering what "REF" and "TREND" are. These are two
of the very useful primitives that are built into the TradeScript™ language.
The REF function is used whenever you want to reference a value at any specific
point in a vector. Assume the MedianAverage vector contains the average
median price of a stock. In order to access a particular element in the vector
using a traditional programming language, you would write:
SET A = MedianAverage[n]
Using TradeScript™ you would write:
SET A = REF(MedianAverage, n)
The main difference other than a variation in syntax is that traditional languages
reference the points in a vector starting from the beginning, or 0 if the vectors are
zero-based. TradeScript™ on the other hand references values backwards, from
the end. This is most convenient since the purpose of TradeScript™ is of course,
to develop trading systems. It is always the last, most recent value that is of most
importance. To get the most recent value in the MedianAverage vector we could
write:
SET A = REF(MedianAverage, 0)
Which is the same as not using the REF function at all. Therefore the preferred
way to get the last value (the most recent value) in a vector is to simply write:
SET A = MedianAverage
The last value of a vector is always assumed when the REF function is absent.
To get the value as of one bar ago, we would write:
Trade Interceptor Charting 3.3 is a trading support application developed by Riflexo Ltd - Copyright ©Riflexo Ltd 2007
37
SET A = REF(MedianAverage, 1)
Or two bars ago:
SET A = REF(MedianAverage, 2)
The TREND Function
Stock traders often refer to "trending" as a state when the price of a stock has
been increasing (up-trending) or decreasing (down-trending) for several days,
weeks, months, or years. The typical investor or trader would avoid opening a
new long position of a stock that has been in a downtrend for many months.
TradeScript™ provides a primitive function aptly named TREND especially for
detecting trends in stock price, volume, or indicators:
TREND(CLOSE, 30) = UP
This tells TradeScript™ to identify trades where the closing price is in a 30-day
uptrend. Similarly, you could also use the TREND function to find trends in
volume or technical indicators:
# the volume has been
# in a downtrend for at least 10 days:
TREND(VOLUME, 10) = DOWN
# the 14-day CMO indicator
# has been up-trending for at least 20 days:
TREND(CMO(CLOSE, 14), 20) = UP
It is useful to use the TREND function for confirming a trading system signal.
Suppose we have a trading system that buys when the close price crosses
above a 20-day Simple Moving Average. The script may look similar to this:
# Gives a buy signal when the close price crosses above the 20-day SMA
CROSSOVER(CLOSE, SimpleMovingAverage(CLOSE, 20)) = TRUE
It would be helpful in this case to narrow the script down to only the securities
that have been in a general downtrend for some time. We can add the following
line of code to achieve this:
AND TREND(CLOSE, 40) = DOWN
TREND tells us if a vector has been trending upwards, downwards, or sideways,
but does not tell us the degree of which it has been trending. We can use the
REF function in order to determine the range in which the data has been
trending. To find the change from the most current price and the price 40 bars
ago, we could write:
SET A = LAST - REF(CLOSE, 40)
Trade Interceptor Charting 3.3 is a trading support application developed by Riflexo Ltd - Copyright ©Riflexo Ltd 2007
38
Price Gaps and Volatility
Although the TREND function can be used for identifying trends and the REF
function can be used for determining the degree in which a stock has moved, it is
often very useful to identify gaps in prices and extreme volume changes, which
may be early indications of a change in trend. We can achieve this by writing:
# Returns true when the price has gapped up
LOW > REF(HIGH, 1)
Or:
# Returns true when the price has gapped down
HIGH < REF(LOW, 1)
You can further specify a minimum percentage for the price gap:
# Returns true when the price has gapped up at least 1%
LOW > REF(HIGH, 1) * 1.01
And with a slight variation we can also the volume is either up or down by a large
margin:
# the volume is up 1000%
VOLUME > REF(VOLUME, 1) * 10
Or by the average volume:
# the volume is up 1000% over average volume
VOLUME > SimpleMovingAverage(VOLUME, 30) * 10
We can also measure volatility in price or volume by using any one of the built-in
technical indicators such as the Volume Oscillator, Chaikin Volatility Index,
Coefficient of Determination, Price Rate of Change, Historical Volatility Index,
etc. These technical indicators are described in TradeScript User Guide (see section TradeScript) .
Fundamental Analysis
Many investors and traders rely upon fundamental information such as the pricetoearnings (PE) ratio, dividend, and yield. This information can be used as part
of your trading system simply by including the option in your script:
# the PE ratio is between 10 and 15
PE_RATIO >= 10 AND PE_RATIO <= 15
Trade Interceptor Charting 3.3 is a trading support application developed by Riflexo Ltd - Copyright ©Riflexo Ltd 2007
39
Valid options are:
PE_RATIO
DIVIDEND
YIELD
52_WEEK_HIGH
52_WEEK_LOW
ALL_TIME_LOW
ALL_TIME_HIGH
These and other primitive variables are covered in TradeScript User Guide (see section TradeScript) .
Technical Analysis
TradeScript™ provides many built-in technical analysis functions. Using only a
single line of code you can calculate functions such as Moving Averages,
Bollinger Bands, Japanese Candlesticks, and so on. A complete list of technical
analysis functions is covered in TradeScript User Guide (see section TradeScript) .
The following is a simple example of how to use one of the most common
technical analysis functions, the simple moving average:
LAST > SimpleMovingAverage(CLOSE, 20)
The script will the last price is over the 20-day moving average of the close price.
The CLOSE variable is actually a vector of closing prices, not just the most
recent close price. You can use the OPEN, HIGH, LOW, CLOSE and VOLUME
vectors to create your own calculated vectors using the SET keyword:
SET Median = (CLOSE + OPEN) / 2
This code creates a vector containing the median price for each trading day.
We can use the Median vector inside any function that requires a vector:
LAST > SimpleMovingAverage(Median, 20)
And this evaluates to true when the last price is greater than a 20-day moving
average of the median price.
Because functions return vectors, functions can also be used as valid arguments
within other functions:
LAST >
SimpleMovingAverage(SimpleMovingAverage(CLOSE, 30), 20)
This evaluates to true when the last price is greater than the 20-day moving
average of the 30-day moving average of the close price.
Crossovers
You may be familiar with the term "crossover", which is
what happens when one series crosses over the top of
Trade Interceptor Charting 3.3 is a trading support application developed by Riflexo Ltd - Copyright ©Riflexo Ltd 2007
40
another series as depicted in the image on the right.
Many technical indicators such as the MACD for
example, have a "signal line". A buy or sell signal is
generated when the signal line crosses over or under
the technical indicator.
The CROSSOVER function helps you one series has
crossed over another.
For example, we can find the exact point in time when
one moving average crossed over another by using the CROSSOVER function:
SET MA1 = SimpleMovingAverage(CLOSE, 28)
SET MA2 = SimpleMovingAverage(CLOSE, 14)
CROSSOVER(MA1, MA2) = TRUE
The script above will evaluate to true when the MA1 vector most recently crossed
over the MA2 vector. And we can reverse the script to the MA1 vector crossed
below the MA2 vector:
CROSSOVER(MA2, MA1) = TRUE
Key Reversal Scripts
Finally, let's create a script that finds Key Reversals, so that you can see firsthand how
TradeScript™ can be used to create trading systems based upon complex rules.
The definition of a Key Reversal is that after an uptrend, the open must be above
the previous close, the most current bar must make a new high, and the last
price must be below the previous low. Let's translate that into script form:
# First make sure that the stock is in an uptrend
TREND(CLOSE, 30) = UP
# The open must be above yesterday's close
AND OPEN > REF(CLOSE, 1)
# Today must be making a new high
AND HIGH >= ALL_TIME_HIGH
# And the last price must be below yesterday's low
AND LAST < REF(LOW, 1)
Ironically, the script minus comments is actually shorter than the English
definition of this trading system. Key Reversals do not occur frequently but they
are very reliable when they do occur. You can experiment by removing the line
AND HIGH >= ALL_TIME_HIGH, or you can replace it with other criteria. This script
can also be reversed:
# First make sure that the stock is in a downtrend
Trade Interceptor Charting 3.3 is a trading support application developed by Riflexo Ltd - Copyright ©Riflexo Ltd 2007
41
TREND(CLOSE, 30) = DOWN
# The open must be below yesterday's close
AND OPEN < REF(CLOSE, 1)
# Today' must be making a new low
AND LOW <= ALL_TIME_LOW
# And the last price must be above yesterday's high
AND LAST > REF(HIGH, 1)
Again, the signal seldom occurs but is very reliable when it does.
Trade Interceptor Charting 3.3 is a trading support application developed by Riflexo Ltd - Copyright ©Riflexo Ltd 2007
42
Select Parameters / Run BackTest
Now that you've selected a security item, and inserted your trading system formula, you can select the Back
Test parameters and run the back test:
1. First select the back test history timescale by clicking on the Timescale drop-down list
2. Select the history price you'd like the back test to be calculated on (AVG:average price; BID or ASK
price), by clicking on the price drop-down list and selecting a price
3. Then press the "Run Backtest" button
Backtest Outputs will be automatically displayed in a separate pop-up window:
Example of BackTest Output:
Trade Interceptor Charting 3.3 is a trading support application developed by Riflexo Ltd - Copyright ©Riflexo Ltd 2007
43
See also sections:
Save a Back Test Formula
Delete a Back Test Formula
Export outputs on Excel
Export outputs on TradeInterceptor charts
Optimize a Trading System
Export back test outputs on Excel
To export back test outputs on Excel Worksheets, you should :
- first run a backtest
- select the starting cell of the Excel Worksheet where you'd like the table outputs to be exported
- click on the export button of the Back Test Output window
The Back Test statistics and trade logs will be instantly transfered to your Excel Worksheet.
Example: how to export back test outputs on Excel
Trade Interceptor Charting 3.3 is a trading support application developed by Riflexo Ltd - Copyright ©Riflexo Ltd 2007
44
Results will also automatically be sent to TradeInterceptor Charting. See section: Exporting Trading Signals
on TradeInterceptor Charting
See also section: Optimize Trading Systems
Save Back Test Formula
From the Back Test Output window, you have the possibility to save a trading formula, which you'll be able to
retrieve from the Back Test User Form.
To save a formula:
- click on the Save button of the Back Test Output window
Trade Interceptor Charting 3.3 is a trading support application developed by Riflexo Ltd - Copyright ©Riflexo Ltd 2007
45
- insert a name for this formula in the appropriate Save box
- click on the Save button
The formula will be automatically be saved in the Back Test User Form and you'll be able to retrieve it
anytime from the formula list.
You can repeat the operation to save several trading formulas.
See also section:
Delete Back Test Formulas
Trade Interceptor Charting 3.3 is a trading support application developed by Riflexo Ltd - Copyright ©Riflexo Ltd 2007
46
Delete Back Test Formulas
To delete trading formulas which you previously saved on the Back Test User Form:
1. select the formula you'd like to delete, by clicking on the arrow to open the formula list drop-down menu
of the Back Test User Form
2. click on the Delete button
The trading formula will be automatically removed from the Back Test User Form formula list.
Optimize Trading Systems
Optimization pertains to the ability to determine the combination of trading system parameters which results
in the most favorable performance for that trading system.
These optimization parameters include a variety of technical indicator like periods, periodicity, stops, targets
and more.
Let's take an example of a simple moving average trading system.
To optimize a trading system:
1. open the Back Test User Form, by clicking on the on the button
Menu Bar.
, located on TradeInterceptor
2. Select a trading formula which you previously saved in the Back Test User Form, or create a new formula,
referring to TradeScript programming language
(see sections Insert Trading Formula and Select Back Test Item)
Example of trading formula:
Trade Interceptor Charting 3.3 is a trading support application developed by Riflexo Ltd - Copyright ©Riflexo Ltd 2007
47
Instead of a 21-period Moving Average, we would like the Optimizer to find the best performance of this
system between 10 and 30 periods-based moving averages.
So for this we have to select a variable (let's use the first variable name available: %1%) in the Optimizer
box, and insert the parameters referring to the periods of the moving average that the optimizer should use
to calculate the best performance:
%1% : from 10 to 30
Each optimization allows up to three variables (%1%, %2%, %3%) to be used as parameters.
Then we have to replace the period "21" in our trading formula with variable %1% in order for the optimizer to
start making calculations and find the best performance of moving averages with periods between 10 and
30.
Trade Interceptor Charting 3.3 is a trading support application developed by Riflexo Ltd - Copyright ©Riflexo Ltd 2007
48
Then let's press the "Run Back Test Optimizer" button.
The Optimizer gives you:
- the moving average period registering the highest performance for this system: in this case a 28 period
moving average
- and the highest trading performance based on that period: in this case: 34,416% profit
It is possible to export optimizer results on Excel, by simply selecting the cell of the worksheet where the
data should be exported, and by pressing the Export button.
Trade Interceptor Charting 3.3 is a trading support application developed by Riflexo Ltd - Copyright ©Riflexo Ltd 2007
49
Export TS on Charting 3.1
When you export Trading Systems Back Test outputs on an Excel Worksheet, the systems also
automatically sends the trade log outputs to TradeInterceptor Charting 3.1
1. If you already have TradeInterceptor Charting application open while running your backtest and
exporting the outputs, you'll automatically see a pop-up window asking you if you'd like to open the back test
outputs and export the signals on a chart.
If the pop-up window is hidden, just click on the Quotes & Analytics window icon of your charting
application.
To export results on a chart, press "OK" and a chart will automatically be displayed, showing all buy and sell
trading signals.
To ignore the request, and continue working on your charting application without importing the backtest
outputs on a chart, simply click on "Cancel", to close the pop-up window.
2. If your TradeInterceptor Charting application isn't open when you run your backtest and export
outputs, the system will automatically send a request which will remain in the memory of your charting
application until you open it.
Next time you'll open your charting application, you'll see the export request pop-up window appear, and
you'll have the possibility to import trading signals or not on the chart, by simply clicking either on "OK" or on
"cancel".
Trade Interceptor Charting 3.3 is a trading support application developed by Riflexo Ltd - Copyright ©Riflexo Ltd 2007
50
Setting alerts
There are various ways to set alerts through TradeInterceptor Excel 1.0.
You can create programmatic alerts, which are based on historical data and which can allow you, for
example, to program trading signal alerts based on trading systems formulas.
Or you can set up real-time alerts, which are based on the real-time data feed and can advise you in realtime, when a currency has reached a pre-defined price.
Both history and real-time alerts can be saved, deleted or edited.
They can be configured to either show a message, send a sound, and/or send a voice message.
To see how to use history alerts, see section Programmatic History Alerts
To see how to use real-time alerts, see section Real-Time Alerts
Programmatic History Alerts
To set programmatic alerts, use the Programmatic Alerts User Form
To open the Programmatic Alerts User Form, click on the
Menu Bar.
button, located on TradeInterceptor
This window will allow you to:
- Select a security
- Insert an alert formula
- Configure and Test an Alert
- Save an Alert
- Edit alerts
- Activate Alerts
- Delete Alerts
Select security
To create an alert based on historical data, you should first select a security.
1. Open the Programmatic History Alerts User Form, by clicking on the button
TradeInterceptor Menu Bar.
, located on
2. Select a feed provider from the feed provider menu (see area 1 on the image below)
The currency list of this feed provider will automatically appear in the item list below.
Trade Interceptor Charting 3.3 is a trading support application developed by Riflexo Ltd - Copyright ©Riflexo Ltd 2007
51
3. To find a security, you can either:
• use the scroll bar, located on the right side of the Symbol list,
• sort the Symbol list, either by name of by item provider, by clicking on the column's header
• or use the Search Box located in the top left corner of the Programmatic History Alerts User Form.
To see how to search for a specific symbol, see section Find Securities
4. Add a security by simply double-clicking on an item, and it will be automatically displayed in the item box
below (see areas 2 and 3 on the image below)
Now that you've selected an item, click on the following link to see How to Insert an Alert Formula
Insert Alert Formula
TradeInterceptor Excel 1.0 gives you the possibility to create any advanced trading systems-based alerts
through the use of TradeScript language.
To create a history alert formula:
1. create your formula referring to TradeScript User Guide
2. insert the alert conditions in the Alert box.
In the example below, the alert will be sent when the 14-day CMO indicator has been up-trending for at least
20 days.
Trade Interceptor Charting 3.3 is a trading support application developed by Riflexo Ltd - Copyright ©Riflexo Ltd 2007
52
Next steps, see sections:
- save your alert in the alerts list
- configure your alert
- activate your alert
- edit alerts
- delete history alerts
Save History Alert
You can prepare and save history alerts to be able to retrieve them easily and activate them instantly by
simply adding them to the alert list.
To prepare and save an alert.
1. First create your alert by inserting the formula in the Alert box (see section Insert Alert Formula)
2. Click on the save button located under the alert insertion box
3. Give a name to this alert
Trade Interceptor Charting 3.3 is a trading support application developed by Riflexo Ltd - Copyright ©Riflexo Ltd 2007
53
The alert will automatically appear in the alert drop-down menu, next to the "Delete" button.
You can delete an alert from the list of prepared alerts by simply selecting it and pressing the "Delete" button.
Note that this won't deactivate the alert, but it will erase it from the list of saved alerts and remove it from the
Alert User Form. So you won't be able to retrieve it anymore after deleting it. (If you want to Deactivate and
alert, see section Delete History Alert )
Configure/Test History Alert
Now that you've created and saved your history alert, you can configure its parameters and test it before
activating it.
- First select the timescale, by clicking on the arrow on the right of the Timescale drop-down list (see area 1
on the image below)
- Then select the price update : average, bid of ask price, by clicking on the arrow on the right of the Price
drop-down list (see area 2 on the image below)
- Select the type of alert: message and/or sound and/or voice alert, by ticking the selected boxes (see area 3
on the image below)
- Finally you can test the volume and the speed of the voice alarm by clicking on the "Test" button, and you
can adjust both volume and voice speed by using the "Rate" and "Volume" buttons (see area 3 the image)
Trade Interceptor Charting 3.3 is a trading support application developed by Riflexo Ltd - Copyright ©Riflexo Ltd 2007
54
You're now ready to Activate the alert.
Activate History Alerts
Once you've selected the security, inserted the alert formula, configured you alerts parameters, you only
have to click on the "OK" button , at the bottom of the window, to activate the alert.
Once the alert has be sent, it will automatically appear in the "Last Sent Alerts" list, located in the bottom part
of the window (see example below).
Trade Interceptor Charting 3.3 is a trading support application developed by Riflexo Ltd - Copyright ©Riflexo Ltd 2007
55
See also how to edit and delete alerts in the following sections:
- Edit Alerts
- Delete Alerts
Edit Programmatic Alerts
You can edit active alerts conditions and properties, by:
- selecting an alert from the List of Active alerts (see area 1 on the image below)
- changing the conditions and/or alert type (see area 2 and 3 on the image below)
- then press the "Edit" button to save the changes (see area 4)
The new conditions will automatically be corrected and shown in the List of active alerts.
Trade Interceptor Charting 3.3 is a trading support application developed by Riflexo Ltd - Copyright ©Riflexo Ltd 2007
56
Delete History Alerts
There are 2 ways to delete programmatic alerts:
1. You can delete an alert from the List of Active Alerts. This will remove the alert from the active alerts
and deactivate it.
Select it from the List of Alerts, then press the Delete button located above the List of Alerts and it will be
instanlty deactivated.
This will only deactivate the alert, but it won't erase it from the list of saved alerts which appears in the top
right part of the window.
2. You can delete an alert to erase it from the prepared alerts, which will definitely remove the alert from
the Alerts User Form and you won't be able to retrieve it anymore.
To erase and delete an alert from the Alerts User Form, select it from the drop-down list and press the
"Delete" button.
Trade Interceptor Charting 3.3 is a trading support application developed by Riflexo Ltd - Copyright ©Riflexo Ltd 2007
57
Real-Time Alerts
To set real-time alerts, use the Real-Time Alerts User Form
To open the Real Time Alerts User Form, click on the
located on TradeInterceptor Menu Bar.
This window will allow you to:
- Select a security
- Insert an alert
- Set Alert Properties
- Save and Delete Alerts
- Activate/Deactivate an Alert
- Edit acitve alerts
Select Security
To create a real-time alert, you should first select a security.
1. Open the Real-Time Alerts User Form, by clicking on the button
TradeInterceptor Menu Bar.
, located on
2. Select a feed provider from the feed provider menu
The currency list of this feed provider will automatically appear in the item list below.
Trade Interceptor Charting 3.3 is a trading support application developed by Riflexo Ltd - Copyright ©Riflexo Ltd 2007
58
3. To find a security, you can either:
• use the scroll bar, located on the right side of the Symbol list,
• sort the Symbol list, either by name of by item provider, by clicking on the column's header
• or use the Search Box located in the top left corner of the Real-Time Alerts User Form.
To see how to search for a specific symbol, see section Find Securities
4. Add a security by simply double-clicking on an item, and it will be automatically displayed in the
appropriate item box
Trade Interceptor Charting 3.3 is a trading support application developed by Riflexo Ltd - Copyright ©Riflexo Ltd 2007
59
Now that you've selected an item, click on the following link to see How to Insert an Alert
Insert RT Alert
To create a real time alert, simply insert the price conditions in the appropriate box.
For the final steps, see sections:
- save and delete alerts
- set alert properties
- activate real time alerts
- Edit active alerts
Trade Interceptor Charting 3.3 is a trading support application developed by Riflexo Ltd - Copyright ©Riflexo Ltd 2007
60
Save/Delete RT Alerts
After you created an alert by inserting the conditions, you can save it by simply clicking on the "Save" button
and giving a name to the alert.
Press the "OK" button and the alert will automatically be saved in the Real-Time User Form, so that it can be
easily retrieved from the alert drop-down menu.
You can delete a real-time alert from the list of prepared alerts by simply selecting it and pressing the
"Delete" button.
Note that this won't deactivate the alert, but it will erase it from the list of saved alerts and remove it from the
Alert User Form. So you won't be able to retrieve it anymore after deleting it.
Trade Interceptor Charting 3.3 is a trading support application developed by Riflexo Ltd - Copyright ©Riflexo Ltd 2007
61
If you want to Deactivate an alert, see section Activate/Deactivate Alerts
See also section: Set alert properties and Edit active alerts
Set RT Alert Properties
To set real time alerts properties:
- first select the alert type (message, sound, voice) by ticking the appropriate boxes in the bottom left corner
of the Real Time Alerts User Form
- If applicable, you can test the voice alarm volume and speed by opening the Properties tab, and clicking on
the "Test" button.
You can adjust voice speed and volume by using the Rate and Volume buttons.
Trade Interceptor Charting 3.3 is a trading support application developed by Riflexo Ltd - Copyright ©Riflexo Ltd 2007
62
Before confirming the changes, and pressing the "OK" button, make sure you check that you've activated the
alert. (If you press the "OK" button before you've added alerts to the list of active alerts, this won't activate
the alert, but it will only save the properties changes)
To ignore properties changes, press "Cancel"
To activate the alert, go back to the Alert Taba and see section Activate/Deactivate Alerts.
Activate/Deactivate Alerts
1. To activate real time alerts, select alerts one by one from the alert drop down list, (or insert a new alert,
as explained in section Insert RT Alert), and press the "Add" button to add the alert to the List of activated
alerts.
Trade Interceptor Charting 3.3 is a trading support application developed by Riflexo Ltd - Copyright ©Riflexo Ltd 2007
63
When the alert is being sent, it is automatically deactivated and removed from the list of activated alerts.
2. To deactivate real time alerts, select an alert from the list of active alerts and press the Delete button.
Trade Interceptor Charting 3.3 is a trading support application developed by Riflexo Ltd - Copyright ©Riflexo Ltd 2007
64
Edit RT Alerts
You can edit an active alert's conditions and properties, by:
- selecting it from the List of Active alerts (see area 1 on image below)
- changing the conditions and/or alert type (see area 2 and 3 on image below)
- then press the "Edit" button to save the changes (see area 4 on image below).
The new conditions will automatically be edited and shown in the List of active alerts.
Trade Interceptor Charting 3.3 is a trading support application developed by Riflexo Ltd - Copyright ©Riflexo Ltd 2007
65