1
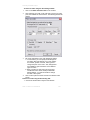
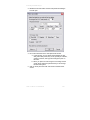
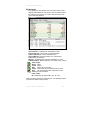
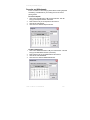
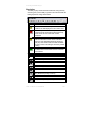
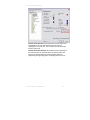
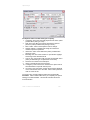
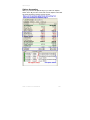
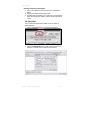
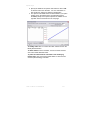
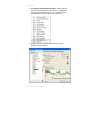
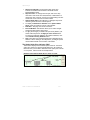
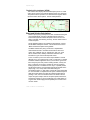
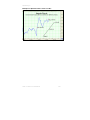
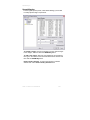
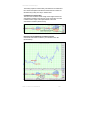
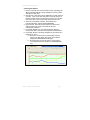
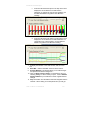
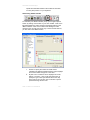
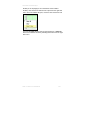
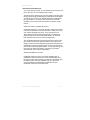
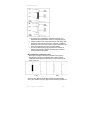
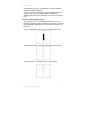
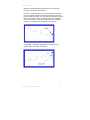
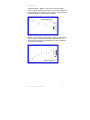
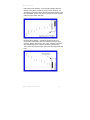
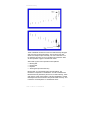
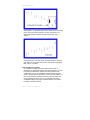
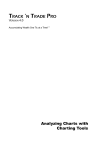
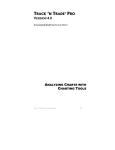
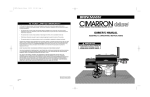
Accounting & Simulator Plug-In TRACK ‘N TRADE PRO VERSION 4.0 Accumulating Wealth One Tic at a Time! ® ACCOUNTING & SIMULATOR PLUG-IN Track ‘n Trade Pro 4.0 User Manual 249 Accounting & Simulator Plug-In Track ‘n Trade Pro 4.0 User Manual 250 Accounting & Simulator Plug-In ACCOUNTING & SIMULATOR PLUG-IN Track your Account Profits/Losses with Ease Introduction: The Accounting & Simulator Plug-In enables you to place orders, deposits, and withdrawals using the historical and/or current data. Traders will find this Plug-In very helpful in getting to know the markets and testing different trading strategies. This Plug-in also allows you to play charts forward and backward using VCR style buttons, which is called simulation. Requirements: In order to place futures orders or simulate trading using Track ‘n Trade Pro, you will need to purchase the Accounting and Simulator Plug-In. Call us at 1-800-862-7193 to reach the sales department and order the plug-in today! Placing a Futures Order Once you have opened a chart using the Commodity Tab, you are ready to place an order. There are two ways in which an order can be placed in Track 'n Trade Pro: 1. 2. Order Placement Tool. Order button in My Account Window. This section will step you through placing orders both ways. Order Placement Tool Track ‘n Trade Pro 4.0 User Manual 251 Accounting & Simulator Plug-In To Place an Order using the Accounting Toolbar: Click on the Order Placement Tool on the Toolbox. 1. 2. Click and drag your order on the chart until you find your order point, then release the mouse button. The following window will appear. 3. Fill out the information in the order placement window. a. In this window, you can specify the brokerage fee (per side), date order placed, buy or sell, quantity of contracts, symbol of contact, order type and change the price on the order. Also, Help options are available to give instructions on the different types of orders. b. When you place an order using the Accounting Toolbar the screen above will be pre filled with default settings. You will not be able to change the date or the symbol. 4. Click on OK to place the order and Cancel to dismiss order screen. To Place an order using the Accounting Tab: 1. Click on the Order button in My Account Window: Track ‘n Trade Pro 4.0 User Manual 252 Accounting & Simulator Plug-In 2. Release the mouse button and the order placement dialogue box will open: 3. Fill out the information in the order placement window. a. In this window, you can specify the brokerage fee (per side), date order placed, buy or sell, quantity of contracts, symbol of contact, order type and change the price on the order. b. When you place an order using the Accounting Tab the screen above will not be pre filled and you can change the date and symbol. 5. Click on OK to place the order and Cancel to dismiss order screen. Track ‘n Trade Pro 4.0 User Manual 253 Accounting & Simulator Plug-In To Edit an Unfilled Order: To edit an order on a chart, right click on the order and select Settings to view the order placement window. 2. To edit an order in My Accounts Window, right click on the order and select Settings to view the order placement window. 1. A Filled Order: When you order is filled, the triangle will fill in red on the chart (see chart below). In My Account Window, the icon will fill green and an F will appear after the icon. See My Account Window for more details. Example of orders displayed on the Chart: Track ‘n Trade Pro 4.0 User Manual 254 Accounting & Simulator Plug-In My Account From the My Account Window, user's can place orders, make deposits and withdrawals. This window also has overall totals for the trading account and for the current contract that you have open in the Chart Window. Accounting Date: Date that the current chart is played to. Open Order P/L: Profit/Loss on trades that are open. Closed Order P/L: Profit /Loss on completed trades. Order Commissions: Total commissions paid. Account Balance: All closed Profit /Loss, Commissions, Withdrawals, and Deposits Margins: Requirements in placing & maintaining an order. Current Position: Market position (not in market, long, or short) Color Codes: Green Filled Yellow Placed Red Placed, but in the future. Faded Order exists, but was deleted from the chart. Gray The chart that this order was placed on was deleted from the Chartbook. Letter Codes: W – Withdrawal D – Deposit B – Buy S – Sell Orders are also noted on the commodity tab. The following symbols represent the different orders placed. Track ‘n Trade Pro 4.0 User Manual 255 Accounting & Simulator Plug-In Each order is listed on the My Account tab by Date, Commodity, Details, and Placed On. To modify an Order: Right-click the entry and select Settings from the menu. To Cancel or Delete an Order: Right-click on the order listed in My Account and click on Delete from the menu. Note: If you delete an order from a chart in the Chart Window, this simply hides the order; orders need to be deleted in the My Account window. Also, if you delete a chart in the Commodities Window, any orders placed on that chart will not be deleted from your book. To Hide/Show an order on a Chart: Right -click on the order listed in My Account and select Hide/Show from the menu. Note: If you would like to hide/show all orders use the Hide All/Show All from the menu. Track ‘n Trade Pro 4.0 User Manual 256 Accounting & Simulator Plug-In Deposits and Withdrawals Track 'n Trade Pro's Accounting systems allows entering deposits and making a withdrawals in your trading account as well as placing orders. To Place a Deposit: Click on the Deposit button in My Account Window. This will bring up the Deposit window. See below 2. Next select the day of the deposit and the amount. 3. Click OK to enter deposit. 4. Click Cancel to dismiss Deposit Window. 1. To Make a Withdrawal: Click on the Withdrawal button in My Account Window. This will bring up the Withdrawal window. (see below) 2. Next select the day of the withdrawal and the amount. 3. Click OK to enter withdrawal. 4. Click Cancel to dismiss Withdrawal Window. 1. Track ‘n Trade Pro 4.0 User Manual 257 Accounting & Simulator Plug-In Deleting Deposits/Withdrawals: Right-click on the deposit or withdrawal and select Delete from the menu to remove. Editing a Deposit/Withdrawal: Right-click on the deposit or withdrawal and select Settings, you can change the date, amount or order type. Trade Log The Accounting and Simulator Plug-In also includes a trade log that tracks the changes that you make to orders in a Chartbook. This trade log will list new orders placed, orders cancelled as well as any order that you have moved. To generate the trade log, click on the Trade Log button on the Accounting Tab. Next, select the date range for the trade log from the drop down menus. This will give you the changes in the orders placed within that date range. You also can filter the trade log by All Charts or by one of the contracts being traded. You can print and/or save this trade log by clicking on the corresponding button in the upper left corner. Track ‘n Trade Pro 4.0 User Manual 258 Accounting & Simulator Plug-In Simulation The ability to play charts forward and backward, using the Play Controls, gives you the ability to go back in time and simulate the trading experience using historical data. Icon Action Lock Charts to Date. This option will “lock” all the charts to the date displayed on the current chart . Red – Play to End: Never. This option will open saved charts at the last date viewed before they were saved and new charts with no data displayed. Yellow – Play to End: New Charts. This option will leave the data in saved charts at the date that they were last displayed before saved and play any new charts to end of the data available for that contract. This setting is the factory default setting. Play to End: All Charts. This option will display all available data on both saved and new chart that are selected. Play Buttons: Icon Action Go to First Day in Chart Back One Month Back One Day Reverse Fast Play Backward (one day at a time) Stop Play Forward (one day at a time) Track ‘n Trade Pro 4.0 User Manual 259 Accounting & Simulator Plug-In Fast Forward Forward One day Forward One Month Go to the Last Day in the Contract Chart Option Buttons Icon Action Center Chart with in Chart Window Daily Chart Weekly Long-Term Chart Monthly Long-Term Chart Smooth Scroll: The Smooth Scroll option changes the way that the chart “plays” when coming to the right edge of the chart window. The default is for this feature to be selected. This option is located on the Appearance tab in the Program Options. Track ‘n Trade Pro 4.0 User Manual 260 Accounting & Simulator Plug-In Smooth Scroll Selected: As the data nears the right edge of the Chart Window, the chart will shift to the left one price bar displaying the new price bar. This continues in a smooth motion from the right to left. Smooth Scroll Not Selected: As the data nears the right edge of the Chart Window, the chart will shift to the left so that the last price bar is centered and then continues playing data until approaching the right edge again, causing the process to recur. Track ‘n Trade Pro 4.0 User Manual 261 Accounting & Simulator Plug-In Track ‘n Trade Pro 4.0 User Manual 262 Accounting & Simulator Plug-In TRACK ‘N TRADE PRO VERSION 4.0 Accumulating Wealth One Tic at a Time! ® OPTIONS PLUG-IN Track ‘n Trade Pro 4.0 User Manual 263 Options Plug-In Track ‘n Trade Pro 4.0 User Manual 264 Options Plug-In OPTIONS PLUG-IN Implementing Options Strategies in Your Trading Introduction: The Track ‘n Trade Pro Options Plug-in gives you the ability to place put/call orders on the futures chart, calculate profit/loss on an option or on an option strategy, calculate the “Greeks”, plus two indicators that display the option as under or over valued. Options Requirements: In order to place options orders or use any of the options tools, you will need to also own the Accounting & Simulator Plug-in. See the Accounting & Simulator Plug-in Chapter for more information. Call us at 1-800-862-7193 to reach the sales department and order the plug-in today! Placing an Options Put/Call Order: Option orders can be placed by selecting the Options Put or Options Call order tools in the Accounting Toolbar or in the OS Calculator. Call Order 1. 2. 3. Put Order Select either the Call or Put Accounting Tool. Click onto the futures chart and hold down the mouse button. When you drag the order tool along the futures chart, you will notice that the cursor skips from striker price to strike price. When you have reached the desired strike price release the mouse and the Options Order Window will open. Track ‘n Trade Pro 4.0 User Manual 265 Options Plug-In The Options Orders window allows you to specify: 1. Commodity: This is the commodity Symbol for the chart. (Value pre-filled when placing on chart) 2. Date: This is the date of the futures chart that the option is placed on (Value pre-filled when placing on chart) 3. BUY or SELL: Click on the dropdown menu to change. 4. Quantity: Default 1, Highlight and change to increase the number of Options to purchase. 5. Strike Price: Value of the Strike Price (Value pre-filled when placing on chart) 6. Brokerage Fee: This value is based on “per side fee” highlight and change value. Default is $0.00. 7. CALL or PUT: Choose the order type from the dropdown menu. (Value pre-filled with type of option order tool chosen) 8. Premium: Point value for the strike price. 9. Value: The Dollar amount of the Premium 10. Contingency Order: If this box is check then the option order is executed based on a specific Futures price. 11. On Screen Text: This section controls the text that is displayed on the chart window next to the order. Click on OK to place the order or Cancel to exit. The second way of entering Options orders is through the OS Calculator. Click on Place orders when you complete your options strategy in the OS Calculator. See the OS Calculator section for more information. Track ‘n Trade Pro 4.0 User Manual 266 Options Plug-In Changing Properties of an Options Order To change the properties of an order, right click on the diamond shape representing an options order on the chart window. Font: Changes the Font, Size, Style, and Color of the 1-5 and ABC points. Show Text: Select to view or hide the 1-5 and ABC points. Settings: Select to view the Options Order window. Send to Back: Changes the layer of the tool. This option is used when more than one tool is in the same area of the chart. Click on Send to Back when you need to access a tool under the Elliot Wave Drawing. Exercise: Select on a Put or Call Buy order to “exercise the option”. This will place a futures order for the underlying contract. Hide: Select/Unselect this option to hide or view the order on the chart window. Once you have hidden the order you can rightclick on the order listed in the My Account Tab and toggle the Hide option to show the order on the chart again. Track ‘n Trade Pro 4.0 User Manual 267 Options Plug-In Options Accounting When you purchase the Options Plug-in you add on an Options section to the “My Account” tab as well. Plus the Options orders that are placed are listed in the My Account window. Track ‘n Trade Pro 4.0 User Manual 268 Options Plug-In Options Tab: The Options Tab is located in the Control Panel after the Data Tab. It looks like a green up and purple down arrow. Once you click on this tab, it will expand and display “Options”. See the screenshot below for further clarification: Viewing Options Data: When you first click on the Options Data Tab it defaults to the “Date View” which contains the options data available. Instructions: 1. Open the corresponding futures chart in the Commodity Tab for the options pricing that you are interested in viewing. 2. After opening the futures chart, you will notice that the Options Tab is now populated with values, included in this tab: a. Strike: The price at which the futures contract underlying an option is to be bought or sold upon exercise. b. Type: Type of options order – Put or Call. c. Premium: Value (in points) to purchase the Option. d. $Value: Dollar amount for the Premium value. e. Change: The difference between yesterday and today’s strike. f. Diff: Dollar amount for the Change. g. IVOL: Implied Volatility of the underlying futures contract. h. Delta: Measures how much the options price changes when the underlying futures contract changes by one point. Track ‘n Trade Pro 4.0 User Manual 269 Options Plug-In i. j. k. l. Gamma: Measures how much the delta changes when the underlying futures contract changes by one point. Theta: Measures time decay of an option. Vega: Measures how a change in volatility affects the price of an option when all other factors remain the same. Rho: Measures how a change in a short-tem risk free interest rate affects the price of an Option. *If you DO NOT have a contract open, the only item available in Options Tab is the Interest Rate History. Viewing the Strike Price History: The Options Tab defaults to the “Date View”, which shows a list of all strike prices available for that day. To see the history for a particular strike price: 1. Click on the Strike button and a dropdown box will appear below the buttons. 2. Click on the dropdown box to choose the specific Put/Call Strike price. 3. Once this value is selected, the history for that price is generated. Track ‘n Trade Pro 4.0 User Manual 270 Options Plug-In Interest Rate History: The Options Tab defaults to the Date View, which shows a list of all strike prices available for that day. To view the Interest Rates history, click on the Rate button to the right of the Strike button. The historical interest rate data consists of the monthly average interest rate of the three month Treasury Bill secondary market rates. Interest rates are used by the Black Scholes (More information is available in the Black & Scholes description at the end of this section.) options formulas to determine the theoretical options price. Note: Because most futures contracts expire in under a year, we have not noticed the interest rate to make a large difference on the dollar value of an options price. Adding an Interest Rate: Interest rates are updated by Gecko Software, Inc. on a regular basis however, if you would like to add a new interest rate follow these instructions: 1. Click on the Add Interest Rate button and the “Add Interest Rate” Window will open. 2. Chose the date for the effective date dropdown menu, then type the new interest rate in the input box. 3. Click on Ok to save or Cancel to exit from this window. Track ‘n Trade Pro 4.0 User Manual 271 Options Plug-In Deleting an Existing Interest Rate: 1. Click on and select the interest rate that you would like to delete. 2. Click on the Delete Interest Rate button. 3. A window will open asking you to verify that you would like to delete this interest rate. Click on YES to continue and NO to cancel. OS Calculator The OS Calculator Determines Profit/Loss on an Option or Option Strategy: 1. Click on the CALC button to open the OS Calculator. 2. Click on the Add New button to add an option order to the calculator. This will open the Option Order window. Track ‘n Trade Pro 4.0 User Manual 272 Options Plug-In 3. Specify the details of the options order and then click on OK to add the order to the calculator. For more information on this window see “Placing an Options Put/Call Order”. 4. The options order details have now been added to your option strategy list on the left side of the OS Calculator and the Profitability Graph of the Option Expiration is available on the right side. See the screenshot on the next page. To modify orders click on to select the order and then click on the Modify Selected button. To delete orders from the calculator, click on the order and then click on the Delete Selected button. To place the orders from the calculator on the underlying futures chart, click on the Place Orders Button or click Cancel to exit the Options Strategy Calculator. Track ‘n Trade Pro 4.0 User Manual 273 Options Plug-In The Profitability of Option Strategy at Expiration: The OS Calculator enables you to enter an Option Strategy to see the potential profit/loss of that strategy/order. See diagram below with the details of the OS Calculator. OSV & STRK Options Indicators Determining if your Option is Over or Under Valued? The Options Plug-in contains two indicators used to determine if an option is over or under valued. The indicators available are Options Strike Value and Strike Price. Selecting the OSV or STRK Indicator: To view the Options Indicators you may choose to display them from in three separate locations: 1. The Indicator Button Bar: To select the OSV or STRK Indicators, click on the corresponding button on the Indicator bar. You may also change the put/call strike that the indicator is based on from the Indicator Bar. See screenshot below: Track ‘n Trade Pro 4.0 User Manual 274 Options Plug-In 2. The Right-Click Indicator Window Menu: Simply right-click inside the Indicator Window to view the menu. Highlight and then left-click to select the indicator. You will notice that the selected indicator is shown with a check mark below: 3. OSV/STKE Section under the My Defaults or My Chart Settings in Program Options. Track ‘n Trade Pro 4.0 User Manual 275 Options Plug-In 1. 2. 3. 4. 5. 6. 7. 8. Strike Price Indicator: The lines that make up the OSV indicator are the Black and Scholes Theoretical and the Reported Market Value Style and Color: To change the line style, click on the drop down menu and choose from solid, dashed, or dotted lines. To change the color of the line, click on the corresponding color box and choose a new color from the Color Palette. Options Strike Value: This indicator is a histogram style chart measuring Under and Over Valued Options. To Display the Strike Price Indicator or the Options Strike Value, select the check box in front of the indicator. Ruler Bar – See page 247 for full instructions Preview Window: This Window allows you to make changes and preview them before saving them. To apply the changes you made to all open chart (listed in your Active Charts list) click on the Apply to active charts button. To restore the software defaults to the Options Indicators, click on the Restore Factory Defaults button. Help: Information from the Manual has been integrated into the software. When clicking on the Help button, you will get specific documentation based on the location of the button. The Option Strike Price Indicator (OSV) This indicator displays the theoretical option values vs. the actual option price value for a specific put/call strike price. By looking at these two lines you are able to determine if the option price is under or over priced. Take a look at the example below: Example of the Options Strike Price in Track ‘n Trade: Track ‘n Trade Pro 4.0 User Manual 276 Options Plug-In The Strike Price Indicator (STRK) This Indicator also displays the theoretical option prices vs. actual option prices however; this indicator displays them as a histogram. The positive values represent over valued and the negative values represent under valued options. See the example below: Black and Scholes Calculations Modern option pricing techniques are often considered among the most mathematically complex of all applied areas of finance. Financial analysis has reached the point to where we are now able to calculate, with alarming accuracy, the fair market value of a financial option. Gecko Software employs the calculations developed in 1973 by Fischer Black and Myron Scholes. This model is known as the “Black and Scholes Options Pricing Model.” The Black and Scholes pricing model uses a sophisticated mathematical formula to calculate the theoretical value of an option using variables such as; market open, high, low, close values, interest rates, volatility calculations and other such information to give us these all important values. Track ‘n Trade Pro puts to use these unique abilities in several different ways. First and foremost, Track ‘n Trade Pro is a trading simulation software application where you are able to go back in time nearly 30 years and “practice” trading forward, one day at a time. In essence we are giving a trader 30 years of simulated trading experience in a matter of hours, days, or possibly weeks. We allow the trader to use actual historical futures market OHLC (Open, High, Low, Close) data to simulate trading the commodities market. In that regard, it would be nearly impossible for us to assemble a complete set of 30 years of historical options data which would allow users this same historical data training privilege. Also, due to the massive amount of data this would require and given today’s limits of computer speeds, hard drives, and storage capacity, trying to provide this type of data history to a typical user would simply put this capability out of reach for the common trader. Track ‘n Trade Pro 4.0 User Manual 277 Options Plug-In This is where the Black and Scholes pricing model comes into play. Our skilled computer scientists at Gecko Software have created a way for us to use the data generated by the Black & Scholes data formula to recreate “on the fly” historical options data as needed by the user. This way a trader using our software can recall acutely accurate “simulated” options data from 30 years ago without actually having hundreds of megabytes of options data history stored on their computer. The trader can then simulate trading the financial options market with unparalleled accuracy. This unparalleled capability allows new traders the ability to learn and practice basic trading strategies that can then be taken to the actual markets. It also allows experienced traders the ability to create and back test advanced simulated trading models and systems. Another way in which Gecko Software computer scientists have implemented the Black & Scholes formulas to help our traders is with two very unique indicators which sit below a chart of the underlying financial asset. As the Black and Scholes formula dictates what the actual “theoretical” value of an option should be on any given day, Track ‘n Trade will plot the “actual” value of the option along side the Black & Scholes model, creating an overvalued or undervalued indicator, letting our users know, from a simple graphical representation, if the current price of an option is inline with market sentiment and trading at a premium or a discount. One stumbling block that Gecko Software engineers had to overcome when creating our options trade simulator was that options data is often times very spotty and full of holes, and due to the enormous amount of data generated by the options exchanges there is very little done to try and repair these holes or bad data ticks. When options trade, they begin a data stream where they generate an open, high, low and close for each day’s trading range, but some options, which are usually further out of the money, don’t trade every single day, which causes gaps or holes in the data stream. One way or another, these gaps or holes are either filled, or just left blank. Often times, these gaps are filled by data vendors who simply pull yesterdays values forward to today, often times doing this for weeks on end which only serves to create a very inaccurate and unreliable value stream, a stream of data that would be difficult to use in any kind of simulated trading environment or to provide much real-market value. Track ‘n Trade Pro 4.0 User Manual 278 Options Plug-In Just like the genetic scientists did in the classic movie Jurassic Park, where they filled the gaps in the dinosaurs DNA strand with frog DNA which allowed them to recreate or clone a dinosaur; our computer scientists here at Gecko Software fill the gaps in the live options market data stream with Black & Scholes “theoretical” prices, giving a more accurate representation of the actual options value, which in turn allows our users the ability to have a more complete and highly accurate representation of what actual market data would have been on any given day. To differentiate the fictitious theoretical data within the data stream, we tag it with a trailing asterisk (*) so our users will know when they are looking at actual market data reported by the exchange, or a theoretical value inserted into a gap by the Black & Scholes model. In keeping with the classic movie Jurassic Park, the process that creates and inserts the theoretical data into the actual data stream is code named “Frog Data.” Track ‘n Trade Pro 4.0 User Manual 279 Seasonals Plug-In Track ‘n Trade Pro 4.0 User Manual 280 Seasonals Plug-In TRACK ‘N TRADE PRO VERSION 4.0 Accumulating Wealth One Tic at a Time! ® SEASONALS PLUG-IN Track ‘n Trade Pro 4.0 User Manual 281 Seasonals Plug-In Track ‘n Trade Pro 4.0 User Manual 282 Seasonals Plug-In SEASONALS PLUG-IN Using Seasonal Trends to Improve Your Trading Introduction The seasonal markets consist of the commodities that began the futures industry. Wheat was the first commodity traded as a futures contact on the futures market. Commodities like Crude, Corn, Gold, Cattle, etc. have been around longer than financial commodities. Because they have been around longer, the seasonal commodities have more historical data. Being able to analyze that historical data gives you an advantage when you are trading a seasonal commodity. The Seasonal Plug-In consists of three separate indicators: Seasonal Trends Historical Averages Market Probability Seasonal Trends The seasonal trend indicator represents the “normal” historical behavior of the market. The indicator is calculated on the specific contract month, showing you behavior of that specific chart. This is very important in agricultural markets with new and old crop contracts; such as wheat or corn. The charts depict behavior on a relative basis, meaning the actual prices are not forecasted, just the relative position of the market versus its contract high and low. On the seasonal charts, the high is depicted as 1.0, or 100%, while the low is depicted as 0.0 or 0%. All similar trading days are lined up for X number of years (the default in Track ‘n Trade Pro are 10 years for Trend 1, and 15 years for Trend 2) and are analyzed in terms of where each day falls as a percentage of the highest and lowest price of either the last 12 months or the life of the contract for each specific contract. These prices are then averaged and the average is depicted in the indicator window. When the trend line is at 100% or 1.0, it indicates where the contract has on average been at its highest value for specified time range and scale period. Interpretation: When the trend line is at 0% or 0.0, it indicates where the contract has on average been at its lowest value for the specified time range and scale period. The averages use data from all previous years and are not affected by the current year's trend. Track ‘n Trade Pro 4.0 User Manual 283 Seasonals Plug-In Displaying the Seasonal Trend Indicator: Once you have your settings the way you would like them in the Program Options window, you can display the Market Probability indicator anytime you wish. Just click on the SEAS button located in your indicators menu bar (shown below). Historical Averages The Historical Average indicator is very similar to a moving average indicator, except that it is based on the average price of the specific contract lined up by date. The charts are made for specific contract months, so that the trader can see the behavior of the specific contract they are looking at. This detail is important in a market with new and old crop contracts, such as the agricultural commodities. Unlike the seasonal average prices, the Historic Average lines depicted in this feature are based on price, not a relative basis. In essence, what this feature does is give you the average price on a specific day. This chart will have the same basic feel and theme as the seasonal chart, except instead of prices being scaled on a relative basis (0 to 100%) they are the average historical price for that day. This feature also may help traders divine value in a commodity, in that with a quick look not only can the trader see how current prices line versus average prices historically, but they can also see seasonal trends. By simply checking the Historical Average check box within the Seasonals tab, displays the average line in the main Track ‘n Trade Pro 4.0 User Manual 284 Seasonals Plug-In chart window. You may also change the number of years, the color, and line style in which the indicator is displayed. The weighted box can be selected to provide more significance to the latter years than the earlier years. The un-weighted is a simple average, giving equal significance to each year included in the study. Example of Historical Averages: Displaying the Historical Average Indicator: To display the Historical Average on your chart simply right click on the chart window and select Historical Averages from the menu. To unselect, use the same process; right click and select Historical Averages. Track ‘n Trade Pro 4.0 User Manual 285 Seasonals Plug-In Market Probability The historic Market Probability indicator shows the cumulative number of times the market in question has settled higher, lower, or the same on a specific date compared to the previous trading day's settlement price. For example, if you are looking at a five year market probability indicator with a reading of +1, then the market in question may have historically settled higher three times and lower two times on this trading day than the previous trading day, or settled higher twice, lower once, and the same twice. The +1 reading is derived by subtracting the number of negative settlements from positive settlements, resulting in a net number of positive (+) or (-) settles. In other words the +1 reading in these examples would be indicative of a market which has settled higher one more time than it has settled lower. If the market settled at the same price as the previous day, the total is not changed. Displaying the Market Probability Indicator Click on the PROB button located in your indicators menu bar (shown below). Track ‘n Trade Pro 4.0 User Manual 286 Seasonals Plug-In Customizing Seasonal Indicators To customize your seasonal indicators pull up your Program Options Screen by clicking on this button on your main Toolbar. Click on the My Default Settings to make changes to the default options on the Seasonal Indicators. Click on the Current Chart Settings to make changes to the currently open chart only. In each of these sections, you can click on the Seasonal section. 1. 2. 3. 4. 5. Seasonals Program Options Seasonal Trends: The Trend 1 and Trend 2 boxes determine if either or both of the Seasonal Trend lines are active. To change the number of years the trend is based on select the number from the drop down menu. Style & Color: Trend lines can be displayed as a solid, dashed, or dotted line. Click on the drop down menu to specify the type of line style desired. Next to the drop down menu is the color box, click on this box to open a panel and change the line color. Fill Background: If you would like to fill the area from the Trend line selected to the bottom of the indicator window check this option and then choose the trend line to apply it to. Scale Seasonal To: This setting will base the scaling on the highest point in the entire contract or the last 12 months and the lowest point on the option selected. Track ‘n Trade Pro 4.0 User Manual 287 Seasonals Plug-In 6. Historical Averages: This section changes the properties for calculating the average lines for the Historical Averages Indicator on the Chart Window. 7. Market Probability: This section changes how the Market Probability indicator is displayed in the Indicator window properties. 8. Displaying the Indicators: Click on the check box in front of the indicator that you would like to display. 9. Click on Apply to active charts if you would like to see your selecting settings on all the charts you open. Click on Restore Factory Defaults if you would like to restore original software settings. 10. Help: When you click on this button, a pdf file will open showing the printed manual. If you do not have Adobe Acrobat Reader on your computer, visit: http://www.adobe.com Track ‘n Trade Pro 4.0 User Manual 288 Spreads Plug-In TRACK ‘N TRADE PRO VERSION 4.0 Accumulating Wealth One Tic at a Time! ® SPREADS PLUG-IN Track ‘n Trade Pro 4.0 User Manual 289 Spreads Plug-In Track ‘n Trade Pro 4.0 User Manual 290 Spreads Plug-In SPREADS PLUG-IN Expand your Trading Options Introduction The futures markets provide a variety of trading opportunities. In addition to profiting from rising prices by purchasing futures options or from falling prices by selling futures contracts, there is an opportunity to profit from the relationship between different contracts, or SPREAD. A Spread refers to the simultaneous purchase and sale of two or more different futures contracts. When establishing - or "putting on" - a spread, a trader looks at the price differential of the spread rather than the absolute contract price levels. The contract that is viewed as "cheap" is purchased or a long position is established. The contract that is viewed as "expensive" - or "dear" - is sold - or a short position is established. If market prices move as expected, meaning the long position gains in value relative to the short position, the trader profits from the change in the relationship between the prices. Remember, the concern for a spread trader is the change in the relationship between contract he or she is long and the one that he/she is short, not the absolute price level of the commodity in question. Of course, just because you are trading a spread does not guarantee or eliminate losses. If the long contract decreases in value RELATIVE to the short position, then the spread trader will incur losses. The key to spread trading is in the relative performance of one futures contract to another. Though some spreads have a basic market bias, known as bull and bear spreads, the absolute price level of the underlying commodity contracts is not important, only the relative performance of one contract versus the other. In other words, a spread trade is a speculation that one contract will out perform another contract. Available online: Introduction Video to the Spreads Plug-in. Visit us at: http://www.trackntrade.com/tour.htm and select the Spreads video. To view this video you will need a copy of Microsoft’s Media Player. Track ‘n Trade Pro 4.0 User Manual 291 Spreads Plug-In Example of a Spreads Chart in Track ‘n Trade: Track ‘n Trade Pro 4.0 User Manual 292 Spreads Plug-In The Spreads Plug-In includes: Spreads Tab in the Control Panel Margins Section in the Program Options Opening a Spreads Chart: Step One: Select the Spreads tab in the Control Panel. Step Two: Select the two futures contracts from the drop down menu that you would like to use in generating a spread chart. Step Three: When you have made your selections, click the Open Chart button and the Spread chart will be displayed. The Spread will be listed in the Spread Chart list and the individual contracts will be listed in the Commodity Tab. These Spreads that you open will be part of your Chartbook when you save and close it. Track ‘n Trade Pro 4.0 User Manual 293 Spreads Plug-In Spread Margins: In the Program Options panel, under Global Settings you are able to modify spread margin requirements. To modify a margin: Click on the margin in the list, make changes to the margins, and then select the Add/Modify button. To add a new margin: Select the commodities for the spread and then type in the values for the Initial and Maintenance amounts and then click the Add/Modify button. Restore factory defaults: To restore the margins to software defaults click on the Restore factory defaults button Track ‘n Trade Pro 4.0 User Manual 294 Commitment of Traders Plug-In TRACK ‘N TRADE PRO VERSION 4.0 Accumulating Wealth One Tic at a Time! ® COMMITMENT OF TRADERS PLUG-IN Track ‘n Trade Pro 4.0 User Manual 295 Commitment of Traders Plug-In Track ‘n Trade Pro 4.0 User Manual 296 Commitment of Traders Plug-In COMMITMENT OF TRADERS PLUG-IN Know what the Industries are trading In this graph, you will notice the red bars, which indicate that the commercials are all selling, going short while the trend of the market is going up; that is what this COT graph is representing. (The Commercials are using the futures market to "hedge" either the cash market, or their current inventory, that's why they are going short or selling during an uptrend.) You'll also notice that the blue lines, which are representative of the large speculators, do follow the trend of the market more closely, and that's because they are speculators, not hedgers, that's why when the market goes up, the large speculators go long, or buy the market in an attempt to capture profits from buying low and selling high. But, the commercials, or hedgers go short. Again, in an attempt to price protect their cash crop or inventory. You'll notice that the small green bars represent the small speculators. What you generally find is that the large speculators and the professional traders will use the small speculators as a contrarian indicator, if the small speculators are all buying the market, (lines extend above the zero line.), then they begin to sell, if they say sell, then they consider being a buyer. (This is not always true, the small speculator is not always contrary to the general market direction, but unfortunately for the small speculator, it is more true than not.) The best thing about COT, is that it is not based on the market’s price whatsoever. The JBCOT (Jake Bernstein proprietary buy/sell indicator.) does not even take the markets price into account. This is strictly an indicator that looks at what the largest industry players are doing, and then simply points out their actions. The COT reports provide a breakdown of each Tuesday's open interest for markets in which 20 or more traders hold positions equal to or above the reporting levels established by the CFTC. Track ‘n Trade Pro 4.0 User Manual 297 Commitment of Traders Plug-In The weekly reports for Futures-Only Commitments of Traders and for Futures-and-Options-Combined Commitments of Traders are released every Friday at 3:30 p.m. Eastern time. Commitment of Traders Key The outer most numbers are the range of the largest of the three commitment of traders (Commercial, Large, and small). The inner numbers are the range of the Open interest of all of the commitment of traders (shown below). Displaying the Commitment of Traders Indicator Click on the COT button located in your indicators menu bar (shown below). Track ‘n Trade Pro 4.0 User Manual 298 Commitment of Traders Plug-In Methods of Displaying the COT Indicator 1) Bearish/Bullish – This type of chart displays as the COT as bearish or bullish postion. It is calculated by taking the number of Long positions minus the number of Short positions. If it is positive, then more trades are long, if it is negative more trades are short, if it is zero then it is equal. 2) Total Position – This type of chart displays the COT values as a stacked column. The long position number on top and the short position number on bottom. Customizing Commitment of Traders Indicator To customize your Commitment of Traders indicator pull up your Program Options Screen by clicking on this button on your main Toolbar. Click on the My Default Settings to make changes to the default options on the COT Indicator. Click on the Current Chart Settings to make changes to the currently open chart only. In each of these sections, you can click on the COT section. Track ‘n Trade Pro 4.0 User Manual 299 Commitment of Traders Plug-In COT Program Options 1. Period: To specify the number of weeks used in calculating the JBCOT Buy/Sell Indicator, simply highlight the current number and type in a new value. 2. Style & Color: Trend lines can be displayed as a solid, dotted, or none line. Click on the drop down menu to specify the type of line style desired. Next to the drop down menu is the color box, click on this box to open a panel and change the line color. 3. The three Commitment of traders: Commercial, NonCommercial(Large), and Non-Reportable(Small). 4. Open Interest: The total number of futures or futures and options contracts of a given commodity for all three Commitment of traders. 5. COT Graph Dataset: You can have the data be either the Futures Only data or the Futures and Options combined data. 6. COT Graph Shows: This setting will graph the COT either as a Histogram or a Line. a. As shown in screen shot on previous page, the first option in the drop down menu is the COT Indicator displayed as Bullish/Bearish histogram. b. As shown below the second option in the drop down menu displays the COT Indicator as a Bullish/Bearish line. Track ‘n Trade Pro 4.0 User Manual 300 Commitment of Traders Plug-In c. As shown below the third option in the drop down menu displays the COT Indicator as a Total Position Histogram. To change the color of short positions, use the slider bar labeled “Long/Short color difference shading”. d. As shown below the forth option in the drop down menu displays the COT Indicator as a Total Position line. To change the color of short position, use the slider bar labeled “Long/Short color difference shading”. 7. To display the indicator in the chart window, click the check box. 8. Ruler Bar – See the Ruler Bar at the end of this section. 9. Preview Window: This Window allows you to make changes and preview them before saving them. 10. Click on Apply to active charts if you would like to see your selecting settings on all the charts you open. Click on Restore Factory Defaults if you would like to restore original software settings. 11. Help: Information from the Manual has been integrated into the software. When clicking on the Help button and you will get Track ‘n Trade Pro 4.0 User Manual 301 Commitment of Traders Plug-In specific documentation based on the location of the button. You may also press F1 on your keyboard. Customizing JBCOT Indicator To customize your JBCOT indicator pull up your Program Options Screen by clicking on this button on your main Toolbar. Click on the My Default Settings to make changes to the default options on the JBCOT Indicator. Click on the Current Chart Settings to make changes to the currently open chart only. In each of these sections, you can click on the JBCOT section. 1. 2. Period: To specify the number of weeks used in calculating the JBCOT Buy/Sell Indicator, simply highlight the current number and type in a new value. Style & Color: Trend lines can be displayed as a solid, dotted, or none line. Click on the drop down menu to specify the type of line style desired. Next to the drop down menu is the color box, click on this box to open a panel and change the line color. Track ‘n Trade Pro 4.0 User Manual 302 Commitment of Traders Plug-In 3. The drop-down menu for Show Buy/Sell Arrows allows you to select either Always Show Arrows or Only When Indicator is Visible to view the buy/sell signals or Never Show Arrows to never see the JBCOT arrows. 4. To display the indicator in the chart window, click the check box. 5. Ruler Bar - See the Ruler Bar at the end of this section. 6. Preview Window: This Window allows you to make changes and preview them before saving them. 7. Click on Apply to active charts if you would like to see your selecting settings on all the charts you have open. Click on Restore Factory Defaults if you would like to restore original software settings. 8. Help: Information from the Manual has been integrated into the software. When clicking on the Help button and you will get specific documentation based on the location of the button. You may also press F1 on your keyboard. Ruler Bar The Ruler Bar inside the Program Options windows for the indicators that are displayed in the Indicator window, allows user's to create highlighted regions or horizontal lines within the indicator window. To create a highlighted region: Click at either end of the Ruler bar and drag either up or down to the end point of the region. To place a line: Click in side the ruler bar and drag the line to the desired point. To change the color of the highlighted region: You must rightclick on either the bottom edge (if it is on the top of the indicator Track ‘n Trade Pro 4.0 User Manual 303 Commitment of Traders Plug-In window) or the top edge (if it is on the bottom of the indicator window). Next choose the “Select Color” option from the right-click menu. The Color Palette will open, choose a color and click on OK. You may also Clear the item that you right-clicked on or Clear All items in the Indicator window by selecting these items from the rightclick menu. Track ‘n Trade Pro 4.0 User Manual 304 Commitment of Traders Plug-In TRACK ‘N TRADE PRO VERSION 4.0 Accumulating Wealth One Tic at a Time! ® CANDLESTICK CHARTING Track ‘n Trade Pro 4.0 User Manual 305 Candlestick Charting Track ‘n Trade Pro 4.0 User Manual 306 Candlestick Charting CANDLESTICK CHARTING An Introduction to Japanese Candlestick Charting By Erik Gebhard Introduction…a New Way to Look at Prices Would you like to learn about a commodity price chart that is possibly more effective than the type you are probably currently using? If so, keep reading. If you are brand new to the art/science of chart reading, don’t worry, this stuff is really quite simple to learn. Technical Analysis…a Brief Background Technical analysis is simply the study of prices as reflected on price charts. Technical analysis assumes that current prices should represent all known information about the markets. Prices not only reflect intrinsic facts, they also represent human emotion and the pervasive mass psychology and mood of the moment. Prices are, in the end, a function of supply and demand. However, on a moment to moment basis, human emotions…fear, greed, panic, hysteria, elation, etc. also dramatically effect prices. Markets may move based upon people’s expectations, not necessarily facts. A market "technician" attempts to disregard the emotional component of trading by making his decisions based upon chart formations, assuming that prices reflect both facts and emotion. Standard bar charts are commonly used to convey price activity into an easily readable chart. Usually four elements make up a bar chart, the Open, High, Low, and Close for the trading session/time period. A price bar can represent any time frame the user wishes, from 1 minute to 1 month. The total vertical length/height of the bar represents the entire trading range for the period. The top of the bar represents the highest price of the period, and the bottom of the bar represents the lowest price of the period. The Open is represented by a small dash to the left of the bar, and the Close for the session is a small dash to the right of the bar. Figure #: Candlesticks - Standard Bar Chart Example Track ‘n Trade Pro 4.0 User Manual 307 Candlestick Charting Candlestick Charts Explained You may be asking yourself, "If I can already use bar charts to view prices, then why do I need another type of chart?" The answer to this question may not seem obvious, but after going through the following candlestick chart explanations and examples, you will surely see value in the different perspective candlesticks bring to the table. In my opinion, they are much more visually appealing, and convey the price information in a quicker, easier manner. What is the History of Candlestick Charts? Candlestick charts are on record as being the oldest type of charts used for price prediction. They date back to the 1700's, when they were used for predicting rice prices. In fact, during this era in Japan, Munehisa Homma become a legendary rice trader and gained a huge fortune using candlestick analysis. He is said to have executed over 100 consecutive winning trades! The candlesticks themselves and the formations they shape were give colorful names by the Japanese traders. Due in part to the military environment of the Japanese feudal system during this era, candlestick formations developed names such as "counter attack lines" and the "advancing three soldiers". Just as skill, strategy, and psychology are important in battle, so too are they important elements when in the midst of trading battle. What do Candlesticks Look Like? Candlestick charts are much more visually appealing than a standard two-dimensional bar chart. As in a standard bar chart, there are four elements necessary to construct a candlestick chart, the OPEN, HIGH, LOW and CLOSING price for a given time period. Examples of candlesticks and a definition for each candlestick component are located below. Track ‘n Trade Pro 4.0 User Manual 308 Candlestick Charting The body of the candlestick is called the real body, and represents the range between the open and closing prices. A black or filled-in body represents that the close during that time period was lower than the open, (normally considered bearish) and when the body is open or white, that means the close was higher than the open (normally bullish). The thin vertical line above and/or below the real body is called the upper/lower shadow, representing the high/low price extremes for the period. Bar Compared to Candlestick Charts Below is an example of the same price data conveyed in a standard bar chart and a candlestick chart. Notice how the candlestick chart appears 3-dimensional, as price data almost jumps out at you. ( 3a ) (3b) The long, dark, filled-in real bodies represent a weak (bearish) close ( 3a ), while a long open, light-colored real body represents a Track ‘n Trade Pro 4.0 User Manual 309 Candlestick Charting strong (bullish) close ( 3b ). It is important to note that Japanese candlestick analysts traditionally view the open and closing prices as the most critical of the day. At a glance, notice how much easier it is with candlesticks to determine if the closing price was higher or lower than the opening price. Common Candlestick Terminology The following is a list of some individual candlestick terms. It is important to realize that many formations occur within the context of prior candlesticks. What follows is merely a definition of terms, not formations. The Black Candlestick -- when the close is lower than the open. The White Candlestick -- when the close is higher than the open. The Shaven Head -- a candlestick with no upper shadow. Track ‘n Trade Pro 4.0 User Manual 310 Candlestick Charting The Shaven Bottom -- a candlestick with no lower shadow. Spinning Tops -- candlesticks with small real bodies, and when appearing within a sideways choppy market, they represent equilibrium between the bulls and the bears. They can be either white or black. Doji Lines -- have no real body, but instead have a horizontal line. This represents when the Open and Close are the same or very close. The length of the shadow can vary. Candlestick Reversal Patterns Just as many traders look to bar charts for double tops and bottoms, head-and-shoulders, and technical indicators for reversal signals, so too can candlestick formations be looked upon for the same purpose. A reversal does not always mean that the current uptrend/downtrend will reverse direction, but merely that the current direction may end. The market may then decide to drift sideways. Candlestick reversal patterns must be viewed within the context of prior activity to be effective. In fact, identical candlesticks may have Track ‘n Trade Pro 4.0 User Manual 311 Candlestick Charting different meanings depending on where they occur within the context of prior trends and formations. Hammer: a candlestick with a long lower shadow and small real body. The shadow should be at least twice the length of the real body, and there should be no or very little upper shadow. The body may be either black or white, but the key is that this candlestick must occur within the context of a downtrend to be considered a hammer. The market may be "hammering" out a bottom. Hanging Man -- identical in appearance to the hammer, but appears within the context of an uptrend. Track ‘n Trade Pro 4.0 User Manual 312 Candlestick Charting Engulfing Patterns -- Bullish -- when a white, real body totally covers, "engulfs" the prior day's real body. The market should be in a definable trend, not chopping around sideways. The shadows of the prior candlestick do not need to be engulfed. Bearish -- when a black, real body totally covers, "engulfs" the prior day's real body. The market should be in a definable trend, not chopping around sideways. The shadows of the prior candlestick do not need to be engulfed. Track ‘n Trade Pro 4.0 User Manual 313 Candlestick Charting Dark-Cloud Cover (bearish)-- a top reversal formation where the first day of the pattern consists of a strong white, real body. The second day's price opens above the top of the upper shadow of the prior candlestick, but the close is at or near the low of the day, and well into the prior white, real body. Piercing Pattern (bullish) -- opposite of the dark-cloud cover. Occurs within a downtrend. The first candlestick having a black, real body, and the second has a long, white, real body. The white day opens sharply lower, under the low of the prior black day. Then, prices close above the 50% point of the prior day's black real body. Track ‘n Trade Pro 4.0 User Manual 314 Candlestick Charting These candlestick formations consist of a small real body that gaps away from the real body preceding it. The real body of the star should not overlap the prior real body. The color of the star is not too important, and they can occur at either tops or bottoms. Stars are the equivalent of gaps on standard bar charts. Stars make up part of four separate reversal patterns: Morning Star Evening Star Doji Star Shooting Star (Inverted Hammer) Morning Star-- this is a bullish bottom reversal pattern. The formation is comprised of 3 candlesticks. The first candlestick is a tall black real body followed by the second, a small real body, which gaps (opens), lower (a star pattern). The third candlestick is a white real body that moves well into the first period's black real body. This is similar to an island pattern on standard bar charts. Track ‘n Trade Pro 4.0 User Manual 315 Candlestick Charting Evening Star --- a bearish top reversal pattern and counterpart to the Morning Star. Three candlesticks compose the evening star, the first being long and white. The second forms a star, followed by the third, which has a black real body that moves sharply into the first white candlestick. Doji Stars -- When a doji gaps above a real body in an uptrend, or gaps under a real body in a falling market, that particular doji is called a doji star. Two popular doji stars are the evening star and the morning star. Track ‘n Trade Pro 4.0 User Manual 316 Candlestick Charting Evening Doji Star: a doji star in an uptrend followed by a long, black real body that closed well into the prior white real body. If the candlestick after the doji star is white and gapped higher, the bearishness of the doji is invalidated. Morning Doji Star -- a doji star in a downtrend followed by a long, white real body that closes well into the prior black real body. If the candlestick after the doji star is black and gapped lower, the bullishness of the doji is invalidated. Track ‘n Trade Pro 4.0 User Manual 317 Candlestick Charting Shooting Star -- a small real body near the lower end of the trading range, with a long upper shadow. The color of the body is not critical. Not usually considered a major reversal sign, only a warning. Inverted Hammer-- not really a star, but does look like a shooting star. When occurring within a downtrend, may be a turning signal. Body color is not critical. Final Thoughts and Credits It is important to realize that this introduction is just that, an introduction to candlestick analysis. After having read this, you will have merely scratched the surface of the many patterns and variables that can go into candlestick analysis. No attempt was made to provide a thorough analysis of each and every pattern. In fact, many formations were left out as they cross the border into more complicated analysis. For a more complete overview of candlestick analysis, it is highly recommended that you read the book that is referred to below. Track ‘n Trade Pro 4.0 User Manual 318 Candlestick Charting A large portion of the material in this introduction is taken from an excellent book called Japanese Candlestick Charting Techniques: A Contemporary Guide to the Ancient Investment Techniques of the Far East. (You can find this book in The PitMaster's Bookstore.) In some cases, sentences were taken almost verbatim, as there was no better way to say what Mr. Steve Nison, the author, already said. In his book, Mr. Nison, completely explains candlesticks and their formations, but more importantly explains how to combine candlestick analysis with traditional technical analysis. It is highly recommended that you consider purchasing this book. As traders, we need as many trading tools in our arsenal, and a basic knowledge of candlesticks provides a trader much needed ammunition. Also remember that no matter what the trading tool, no matter how advanced or ancient; it is only effective when put into practice properly. This is, of course, your job as the trader. Track ‘n Trade Pro 4.0 User Manual 319