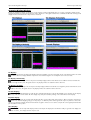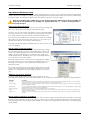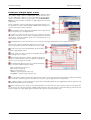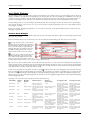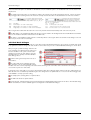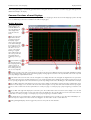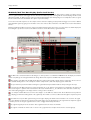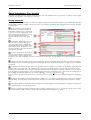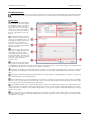
1
SBench 6.2.12
Data Acquisition Software
for Windows and Linux
Software Manual
English version
September 21, 2015
SPECTRUM SYSTEMENTWICKLUNG MICROELECTRONIC GMBH · AHRENSFELDER WEG 13-17 · 22927 GROSSHANSDORF · GERMANY
PHONE: +49 (0)4102-6956-0 · FAX: +49 (0)4102-6956-66 · E-MAIL: [email protected] · INTERNET: http://www.spectrum-instrumentation.com
(c) SPECTRUM SYSTEMENTWICKLUNG MICROELECTRONIC GMBH
AHRENSFELDER WEG 13-17, 22927 GROSSHANSDORF, GERMANY
SBench and digitizerNETBOX are registered trademarks of Spectrum Systementwicklung Microelectronic GmbH.
Microsoft, Visual C++, Visual Basic, Windows, Windows 98, Windows NT, Window 2000, Windows XP, Windows Vista, Windows 7,
Windows 8 and Windows 10 are trademarks/registered trademarks of Microsoft Corporation.
LabVIEW, DASYLab, Diadem and LabWindows/CVI are trademarks/registered trademarks of National Instruments Corporation.
MATLAB is a trademark/registered trademark of The Mathworks, Inc.
Keysight VEE, VEE Pro and VEE OneLab are trademarks/registered trademarks of Keysight Technologies, Inc.
FlexPro is a registered trademark of Weisang GmbH & Co. KG.
PCIe, PCI Express and PCI-X are trademarks of PCI-SIG.
LXI is a registered trademark of the LXI Consortium.
Revision History
Detailed information is found in the support area of our website:
http://spectrum-instrumentation.com/en/sbench-6-software-changelog
Version
Date
Changes
6.2.12
31th July 2015
Support of new hardware average version, Easy Generator improvements
More than 20 bug fixes
6.2.11
4th June 2015
Support of M4i.66xx AWG, Support of M4i Multiple
Recording SW trigger, function generator improvements-
Import + display imrpovements,
more than 60 bug fixes
6.2.10
27th February 2015
M4i.44xx digital input feature, small improvements
More than 30 bug fixes
6.2.09
28th January 2015
Shortcuts for cursor movement
More than 10 bug fixes
6.2.08
17th December 2014
ASCII Import improvements
Harmonics Cursor Improvements
6.2.07
9th December 2014
Improvements of display and export
More than 40 bug fixes
6.2.06
8th October 2014
Support of M4i.22xx series, Moveable comments
Small improvements, more than 40 bug fixes
6.2.05
29th July 2014
Autostore Round Robin
More than 70 bug fixes
6.2.04
7th May 2014
digitizerNETBOX name shown in selection screen
Bug fixes
6.2.03
17th April 2014
Zero Padding for FFT, Acces of write protected files
Bug fixes
6.2.02
21th March 2014
Base License now supports synchronization
Dim display channels feature, bug fixes
6.2.01
4th February 2014
Support of PXI synchrnoization via PXI trigger bus
6.2.00
28th November 2013
Support of M4i series
Hardware Calibration as button
6.1.11
21th August 2013
Bug fixes for digitizerNETBOX remote access
6.1.10
12th August 2013
User definable font size for displays
Bug fixes
6.1.09
3rd June 2013
Support of remote products: digitizerNETBOX
New function Moving Average
Display comment formats changable
6.1.08
18th April 2013
Support of MX.49xx and MC.49xx series
ASCII export: precision can be defined
Flush for timestamp implemented
XY display: Exchange x and y by drag and drop
Store path and last setup file
6.1.07
4th December 2012
Automatic card selection when starting with setup
Paper orientation in print dialog
6.1.06
31th October 2012
X/Y Display added
Improved Mode Dialogue
Improved Split File Settings
Added support for M2i.49xx series
Automatic start of channel conversion on drag and drop
SB6 can handle channels from multiple files at the same time
Source channels for calc can be changed from context menu
Digital displays can handle analog signals and vice versa
Import Wave/ASCII asks for missing header information
6.1.05
24th January 2012
Jump to position from calculation results
Printouts show Cursor Information
New X-Axis setup dialogue (right click)
Output mode implemented for MC/MX/MI series
New Zoom Function „Zoom to Range“
SBench 5 export format improved
6.1.04
4th October 2011
New calculation: Powerful Formula Interpreter
Easy Generator for simple output signals
Display: History mode for segmented signals
New export: VCD (standard for digital data)
New calculation: signal concatenation
Autostore for calculations implemented
Highlighting of signals with cursor
6.1.03
7th July 2011
Displays can be set up as tabbed windows
Source display can be selected for calculations
New setup dialogue for spread display offset/range
Scroll up/down in display with mouse wheel
Automatic FIFO online display limit added (user settings)
6.1.02
11th April 2011
New display: enhanced spread waveform display
New calculation functions: FIR filters, acceleration
UNICODE support for names, units, comments: Japanese, Chinese, Greek, Cyrillic and other character sets
supported.
ASCII export: signal header information added
Span of x-axis user definable in FIFO mode
Split files import: import chunk only or complete signal
Digital Display: highlighting of high levels by command
Print area between cursors
6.1.01
3rd February 2011
Add comments to displays and signals.
Support of PXI synchronization and MX.9010.
Drag and Drop of signals and configuration files to SBench 6.
License improvement: license is shared even for single cards.
Support of new hardware features: D/A output signal conversion,
M2i new trigger mode.
Better handling of loaded signals, placed under own node.
Output modes improved and bug fixed.
2
SBench 6 Software Manual
Window names can be changed
Display line data width can be changed
Version
Date
Changes
6.1.00
9th November 2010
Output mode added for analog and digital data: replay
of singleshot and FIFO data with all hardware modes
supported.
Using latest version of common user control library increases display speed and adds more windows control features
Digital Display: jump to bus value added
Channel Setup: Device name can be changed by user
New feature: Zoom bookmarks added
New feature: Show channel information
Several bugs fixed
6.0.10
9th September 2010
Linux Debian achieve missing
Some display bugs fixed
6.0.09
31th August 2010
Additional digital bus formats available
New calculation: average of multi segment signals
Harmonics cursor reworked and extended
Trigger enable command available
New digital calculations NAND, NOR, NXOR
Display scaling reworked and improved
Digital Display Jump to Edge functions added
Analog display allows to show source signal trigger levels
Several bugs fixed
6.0.08
10th June 2010
More settings stored in config file
ABA mode shows slow data in FIFO
Calculations results stored into cache to increase speed
Calculation improvements
Several bugs fixed
6.0.07
12th March 2010
Segmented Display for Multiple Recording, Gated Sampling, Timestamps, ABA
Support of ABA mode with slow and fast signals
2nd color palette added for printing colors
Combination of multiple digital signals to bus
Digital signals can be sorted in display
Software Manual available
Several bugs fixed
6.0.06
1st December 2009
Export of digital signals
New calculation: Signal average
Export of signal parts
Internal engine settings accessible for speed optimization
Several bugs fixed
6.0.05
29th October 2009
Support of MI, MC, MX cards added
User Settings interface reworked
New calculation: Sine Info
Cursor Track, Spread Signals Display
Context Menus enhanced
Display colors can be changed
6.0.04
18th August 2009
Help files added
Display synchronization
Toolbar editor
New calculations, new functions
New import/export functions: ASCII, Wave, Pure Binary
Automatic file split added
Continuous streaming into different file formats
Several bugs fixed
6.0.03
9th July 2009
Hardware and software buffer fill size shown in FIFO mode
Window expansion state store in config file
Support of M2i.70xx series (acquisition only)
Several bugs fixed
6.0.02
1st July 2009
Linux version available for 32 bit and 64 bit systems
Basic help system added
Digital data display added
Calculation functions show more information
Demo version supports multiple cards
Histogram display added
FFT dynamic parameters
Several bug fixes
6.0.01
25th May 2009
First version available to customers
Support of M3i.32xx/41xx
6.0.00
7th May 2009
First internal version.
Support of M2i.20xx/30xx/31xx/40xx/46xx/47xx
(c) Spectrum GmbH
3
Installation ........................................................................................................................ 8
Windows ............................................................................................................................................................................
Install ............................................................................................................................................................................
Uninstall ........................................................................................................................................................................
Linux...................................................................................................................................................................................
Install ............................................................................................................................................................................
Uninstall ........................................................................................................................................................................
8
8
8
9
9
9
General ........................................................................................................................... 10
Platform Overview..............................................................................................................................................................
System Requirements.....................................................................................................................................................
Supported Cards and Features .......................................................................................................................................
Licensing ...........................................................................................................................................................................
License ........................................................................................................................................................................
Order information.........................................................................................................................................................
Ordering hints..............................................................................................................................................................
License Examples:.........................................................................................................................................................
Version Overview .........................................................................................................................................................
Installing License on hardware .......................................................................................................................................
Command line parameters (file types supported by SBench 6)............................................................................................
Localization (Language support) ...........................................................................................................................................
First Start ...........................................................................................................................................................................
No instrument found at first start .....................................................................................................................................
Installing and removing Demo cards ...............................................................................................................................
Discovery of Remote Cards and digitizerNETBOXes..........................................................................................................
10
10
10
11
11
11
11
11
12
12
12
13
14
14
14
15
Getting help .................................................................................................................... 16
Manual ....................................................................................................................................................................... 16
Help ........................................................................................................................................................................... 16
Tooltips ....................................................................................................................................................................... 16
Data Acquisition Overview .............................................................................................. 17
Hardware and Channel windows ...................................................................................................................................
Main Toolbar ...............................................................................................................................................................
Preview .......................................................................................................................................................................
Analog Display Window ...............................................................................................................................................
Display Channel Selection .............................................................................................................................................
Display Toolbar............................................................................................................................................................
Information Window .....................................................................................................................................................
17
17
17
17
18
18
18
Data Replay Overview .................................................................................................... 19
Theory ..............................................................................................................................................................................
Data replay steps .........................................................................................................................................................
Overview ..........................................................................................................................................................................
Generating Signals.............................................................................................................................................................
Easy Generator ............................................................................................................................................................
Function Generator .......................................................................................................................................................
Using I/O cards.................................................................................................................................................................
4
19
19
19
20
20
20
21
SBench 6 Layout and Setup ............................................................................................. 22
Layout and Configuration Concept .......................................................................................................................................
Overview ....................................................................................................................................................................
User Layout File Handling ..............................................................................................................................................
Configuration File Handling ...........................................................................................................................................
Arranging Setup Windows ............................................................................................................................................
Arranging Display Windows..........................................................................................................................................
Showing Displays in Tab Bar .........................................................................................................................................
Switching Display Elements............................................................................................................................................
Individual Toolbars .......................................................................................................................................................
Individual Short-cuts (Professional Version) .......................................................................................................................
Behavior on SBench 6 Exit.............................................................................................................................................
Main Toolbar and Menu Functions .......................................................................................................................................
File Menu ....................................................................................................................................................................
New Menu ..................................................................................................................................................................
Hardware Menu...........................................................................................................................................................
Settings Menu ..............................................................................................................................................................
Windows Menu ...........................................................................................................................................................
File Settings .......................................................................................................................................................................
Working Directory ........................................................................................................................................................
File Format...................................................................................................................................................................
Location ......................................................................................................................................................................
Preview .......................................................................................................................................................................
Internal Settings..................................................................................................................................................................
Settings Dialogue .........................................................................................................................................................
Engine Settings.............................................................................................................................................................
GUI Settings.................................................................................................................................................................
22
22
22
23
23
26
27
27
27
28
29
29
29
31
31
32
32
35
35
35
36
36
37
37
37
38
Hardware Setup Dialogues.............................................................................................. 39
Running Hardware .......................................................................................................................................................
Input Channel Dialogue ......................................................................................................................................................
Overview ....................................................................................................................................................................
Activating/Deactivating Input Channels for Acquisition .....................................................................................................
Input Channel Hardware Setup ......................................................................................................................................
Changing the Device Name...........................................................................................................................................
Showing information of loaded signals............................................................................................................................
Combination of Digital Signals to a Bus...........................................................................................................................
Input Mode Dialogue ..........................................................................................................................................................
Common Mode Dialogue ..............................................................................................................................................
Individual Mode Dialogue .............................................................................................................................................
Clock Dialogue ..................................................................................................................................................................
Internal Clock Modes ....................................................................................................................................................
External Clock Modes ...................................................................................................................................................
Reference Clock Modes.................................................................................................................................................
Analogue Cards Trigger Dialogue ........................................................................................................................................
General Trigger Setup...................................................................................................................................................
Trigger Mode and Level Setup........................................................................................................................................
Digital Cards Trigger Dialogue ............................................................................................................................................
Timestamp Dialogue ...........................................................................................................................................................
39
40
40
41
42
44
45
46
47
47
48
49
49
50
50
51
51
52
54
56
5
Display Windows ............................................................................................................ 57
Different Display Windows ............................................................................................................................................
Generating Displays .....................................................................................................................................................
Common Functions of most Displays .....................................................................................................................................
Display Overview .........................................................................................................................................................
X-Axis Setup.................................................................................................................................................................
Y-Axis Setup.................................................................................................................................................................
Adding and Deleting Signals .........................................................................................................................................
Reference Signals .........................................................................................................................................................
Zoom Functions ............................................................................................................................................................
Miscellaneous Display Functions.....................................................................................................................................
Zoom Bookmarks..........................................................................................................................................................
Scrolling......................................................................................................................................................................
Display Comments ........................................................................................................................................................
Cursor Measurement.....................................................................................................................................................
Context Menu ..............................................................................................................................................................
Display Synchronization ................................................................................................................................................
Display User Settings ....................................................................................................................................................
Analog Display ..................................................................................................................................................................
Overview ....................................................................................................................................................................
Preview .......................................................................................................................................................................
History Mode (Eye diagram) ..........................................................................................................................................
Spread Function ...........................................................................................................................................................
Miscellaneous functions .................................................................................................................................................
Segmented View (Professional Version) ...........................................................................................................................
ABA Mode/Dual Time Base Display (Professional Version) ................................................................................................
FIFO Mode Preview ......................................................................................................................................................
X-Y Display ........................................................................................................................................................................
Spread Display ..................................................................................................................................................................
Overview + Cursor Functions .........................................................................................................................................
Scaling a signal (mouse wheel) ......................................................................................................................................
Organizing Signals ......................................................................................................................................................
Context Menu ..............................................................................................................................................................
Offset and Scale Settings Dialog ....................................................................................................................................
Digital Display ...................................................................................................................................................................
Overview ....................................................................................................................................................................
Sorting Digital Channels................................................................................................................................................
HIGH level highlighting (shadow display) ........................................................................................................................
Combination of Digital Signals to a Bus...........................................................................................................................
Jump Commands ..........................................................................................................................................................
Segmented View (Professional Version) ...........................................................................................................................
FFT Display........................................................................................................................................................................
Overview ....................................................................................................................................................................
FFT Calculation ............................................................................................................................................................
Harmonics Cursor.........................................................................................................................................................
Histogram Display ..............................................................................................................................................................
Overview ....................................................................................................................................................................
Histogram Calculation Setup..........................................................................................................................................
Special Histogram Display Functions...............................................................................................................................
57
57
58
58
59
59
60
61
61
62
63
63
64
66
67
69
70
72
72
72
73
73
74
75
77
78
80
81
81
81
82
83
83
84
84
85
85
85
86
88
90
90
91
92
93
93
94
94
Calculations..................................................................................................................... 95
Calculation Functions .......................................................................................................................................................... 95
Adding a Calculation from the Channel Dialogue............................................................................................................. 95
Adding a Calculation from the Menu .............................................................................................................................. 96
Setup of a Single Value Calculation ................................................................................................................................ 96
Setup of a Signal generating Calculation......................................................................................................................... 96
Different Calculation Areas ............................................................................................................................................ 98
Additional Calculation Commands.................................................................................................................................. 98
Nested Calculations.................................................................................................................................................... 100
6
Calculation Function List................................................................................................. 101
Simple Measurements .......................................................................................................................................................
Cycle Based Measurements (Pro Version) ............................................................................................................................
Theory.......................................................................................................................................................................
Settings .....................................................................................................................................................................
Cycled Calculation Example ........................................................................................................................................
Function List ...............................................................................................................................................................
Enhanced Measurements (Pro Version)................................................................................................................................
Signal Calculations (Pro Version)........................................................................................................................................
Analog Calculation.....................................................................................................................................................
Digital Calculation ......................................................................................................................................................
FFT ...........................................................................................................................................................................
Histogram..................................................................................................................................................................
FIR Filter ....................................................................................................................................................................
Function Generator .....................................................................................................................................................
Concatenate Signals ...................................................................................................................................................
Signal Conversions (Pro Version) ........................................................................................................................................
Copy as Reference .....................................................................................................................................................
Convert to digital........................................................................................................................................................
Convert to Analog ......................................................................................................................................................
Signal averaging (Pro Version)...........................................................................................................................................
Signal average...........................................................................................................................................................
Moving Average ........................................................................................................................................................
Multi Average ............................................................................................................................................................
Dynamic Parameters (Pro Version) ......................................................................................................................................
General Information....................................................................................................................................................
Functions ...................................................................................................................................................................
101
101
101
101
102
103
104
105
105
106
107
108
109
110
112
113
113
113
113
114
114
114
115
116
116
116
Export/Import ............................................................................................................... 117
Overview ........................................................................................................................................................................
Streaming........................................................................................................................................................................
Import .............................................................................................................................................................................
Header definition .......................................................................................................................................................
Showing information of loaded signals..........................................................................................................................
Export.............................................................................................................................................................................
Export Data Formats available .....................................................................................................................................
Export channels directly from the channel dialogue.........................................................................................................
Export Data and General Setup....................................................................................................................................
ASCII Export (Pro Version) ...........................................................................................................................................
VCD Export .....................................................................................................................................................................
Print/Screenshot...............................................................................................................................................................
Changing Print Colors .................................................................................................................................................
Print / Print Cursor Area..............................................................................................................................................
Screenshot (Professional Version)..................................................................................................................................
117
117
118
118
119
119
119
119
120
121
122
122
122
122
123
7
Windows
Installation
Installation
SBench 6 is delivered as one file installer and can be either found on CD in the directory /Install/SBench6 or in the internet under www.spectrum-instrumentation.com. Please check for the latest version of the software and manual before continuing. SBench 6 is under permanent
development and new releases with new features and bug fixes will be released frequently. To properly run the software, you are requested
to use the latest drivers which can also be found under www.spectrum-instrumentation.com/driver_download.html.
Windows
SBench 6 will run under all Desktop and Server Windows releases starting with Windows XP and including Windows Vista, Windows 7,
Windows 8 and Windows 10. SBench 6 is able to run under 32 bit and also under 64 bit Windows systems (but still being 32 bit Windows
program).
Install
We recommend installing software in the following order depending on the intended usage of SBench 6. Please follow the recommendations
for your system setup:
Driver
Control Center
SBench 6
Spectrum M2i/M3i/M4i cards
installed
Spectrum MI/MC/MX cards
installed
Install latest driver from CD or the
internet using the Windows device
manager and the update button.
The driver update is explained in
the hardware manual.
An installation of the control center
is recommended to see hardware
details and run maintenance tools.
Please update the control center first
before installation of SBench 6
Install latest driver from CD using
the Windows device manager and
the update button. The driver
update is explained in the hardware manual.
not available for MI/MC/MX cards
Install the latest version of SBench 6
Install the latest version of SBench 6
Spectrum digitizerNETBOX or
M2i/M3i/M4i demo cards
installation
No driver install needed
Location
The control center is mandatory for
demo card installation and is used
by SBench 6. Please install the Control Center prior to SBench 6 installation. The Control Center will
install the matching driver dll for
demo card run.
Install the latest version of SBench 6
CD:\Install\Win\spcmcontrol_install.exe
CD:\Install\linux\spcm_control_center\
Please download the latest version of the installer and start the exe file or directly start
the installer from the CD. You need to be logged in with administrator rights for the
installation. Please just follow the instructions of the installer. The installer will install
SBench 6 and all needed libraries.
The installer will also add file links to the SBench 6 file formats that are supported:
*.sb6dat for data files, *.sb6cfg for setup files and *.sb6usr for user files. Double
clicking of one of these files will then automatically start SBench 6 with this file type.
Uninstall
SBench 6 is uninstalled using the Windows control panel - standard software remove
feature. SBench 6 installer also installs a driver dll in the system directory to support
demo cards. This driver dll is not uninstalled automatically to avoid corrupting existing driver installations. If necessary these drivers have to be deleted manually. They
are located in the Windows/System32 on 32 bit systems or in the Windows/
SysWOW64 folder on 64 bit systems.
8
SBench 6 Software Manual
CD: \Driver
CD:\Install\Win\SBench6_install.es
CD:\Install\linux\SBench6\
Installation
Linux
Linux
SBench 6 will run under all Linux distributions starting with Kernel version 2.6 and Gnome or KDE desktop extension. It may also run under
different desktop extension or under plain X server. SBench 6 has been tested under different Linux distributions from OpenSuse, Fedora,
Ubuntu and Debian, kernel 2.6, 3.x and 4.x, in both the 32 bit and 64 bit version, with either Gnome or KDE running.
Install
SBench6 requires the installation of the driver and the Spectrum Control Center first. Please see according information in the hardware manual.
SBench6 is packaged as rpm (for rpm-based distributions like openSUSE and Fedora) and as deb (for debian-based distributions). The package is available in different versions matching the installed stdlib C++ and the system width (32 bit or 64 bit).
To install it simply run as root the install_sbench6.sh script in the SBench6 directory on the CD. The script will determine the correct package
for your system.
If you downloaded the matching package yourself, install it with your system's package manager.
For rpm-based distributions:
rpm -Uhv <package_name>.rpm
For debian-based distributions:
dpkg -i <package_name>.deb
Uninstall
If your distribution provides graphical software management tools you can use them to remove SBench6. Otherwise run the following command as root:
For rpm-based distributions:
rpm -e SBench6
For debian-based distributions:
dpkg -r SBench6
(c) Spectrum GmbH
9
Platform Overview
General
General
Platform Overview
System Requirements
Supported platforms
•
•
•
•
•
Intel x86 and x64, AMD (no ARM)
Windows XP, Vista, 7, 8, 10 - 32 bit platform
Windows XP, Vista, 7, 8, 10 - 64 bit platform
Linux with kernel 2.6.x, 3.x or 4.x - 32 and 64 bit platform
Linux with KDE/Gnome
Hardware recommendations
The following recommendations are based on experience and test installations. In general SBench 6 will run on all machines that support the
above mentioned platforms but may become slow if not sticking to the hardware recommendations.
• CPU
• All Intel CPUs starting with Pentium 4, Core2Duo, Core2Quad, Core i3, Core i5, Core i7, Xeon + Celeron counterparts.
• All AMD CPUs starting with Athlon 64: Athlon, Opteron, Sempron (K8 series), Athlon 64 X2 (K9 series), Phenom, Athlon, Opteron,
Sempron (K10 series).
• Memory
• Standard acquisition: 1 GByte.
• Usage with high channel counts: 2 GByte.
• Fast FIFO streaming: 3 GByte.
• Hard disks and hard disk space
• Program and supporting files about 40 MB.
• Temporary data and acquisitions depending on selected acquisition length. May be up to several GBytes.
• Special High-Speed FIFO streaming requirements:
• Recommended: 1 processor core for each acquisition card in the system.
• Separate hard disk array for data using RAID 0.
• Data throughput of hard disk array at least 20% higher than planned acquisition speed.
• SATA, SAS or SSD hard disks.
Supported Cards and Features
The following table lists all cards and features that are supported by SBench 6. Note that it may be necessary to purchase a Professional
license to use the feature, so please refer to the following version overview for more information. SBench 6 is under permanent development
- please check the latest version of the data sheet on the Internet at www.spectrum-instrumentation.com/sbench6.html to see which new features are supported.
Supported Cards
M2i.20xx + M2i.20xx-Exp
M3i.21xx + M3i.21xx-Exp
M2i.30xx + M2i.30xx-Exp
M2i.31xx + M2i.31xx-Exp
M3i.32xx + M3i.32xx-Exp
M2i.40xx + M2i.40xx-Exp
M3i.41xx + M3i.41xx-Exp
M2i.46xx + M2i.46xx-Exp
M2i.47xx + M2i.47xx-Exp
M3i.48xx + M3i.48xx-Exp
M2i.49xx + M2i.49xx-Exp
M2i.60xx + M2i.60xx-Exp
M2i.61xx + M2i.61xx-Exp
10
series
series
series
series
series
series
series
series
series
series
series
series
series
M2i.70xx + M2i.70xx-Exp series
M2i.72xx + M2i.72xx-Exp series
MI/MC/MX.20xx series
MI/MC/MX.30xx series
MI/MC/MX.31xx series
MI/MC/MX.40xx series
MI/MC/MX.45xx series
MC/MX.46xx series
MC/MX.47xx series
MX.49xx series
MI/MC/MX.70xx series
MX.9010
M4i.44xx-x8
M4i.22xx-x8
M4i.66xx-x8
Supported Features
All analog input settings (range, termination,
coupling, offset)
Supported digitizerNETBOX products
All digitizerNETBOX models are supported and
come with a pre-installed SBench 6 Professional
license.
Multiple Recording/Multiple Replay
Gated Sampling/Gated Replay
All output setting (offset, range , filter, stoplevel) Timestamps (not for MI, MC, MX cards)
All clock and trigger settings
ABA mode (not for MI, MC, MX cards)
All memory, pretrigger, posttrigger, segment
Synchronization Star-Hub (one system)
settings
Digital Inputs/Outputs
Standard + FIFO Mode
Multi Purpose I/O Lines (M3i, M4i only)
All Memory options up to 2 GSample (4 GByte) BaseXIO Trigger Lines (M2i and M3i only)
SBench 6 Software Manual
General
Licensing
Licensing
License
The base license is free available and can be used at any time with all supported cards. The installer contains all license types. The professional license adds a lot of features and functions and is locked to the serial number of a card. A professional license can be purchased at
any time and will then run with the card that it was purchased for. If you like to test the features of the professional version you may either
request a demo license at Spectrum that will allow 30 starts of the software or you may use the software with a demo card giving you full
professional features.
Using multiple cards connected with synchronization Star-Hub an additional -Multi license option is needed. This license option is installed
on the card holding the synchronization Star-Hub and allows to use any number of cards synchronized with that Star-Hub. The -Multi license
option needs the SBench 6 professional license and cannot be combined with the base license.
Order information
SBench6
Order no.
SBench6
SBench6-Pro
SBench6-Pro3
SBench6-Pro5
SBench6-Pro10
SBench6-Multi
Base version which supports standard mode for one card
Professional version for one card: FIFO mode, export/import, calculation functions
3 Licenses of professional version for one card each
5 Licenses of professional version for one card each
10 Licenses of professional version for one card each
Option multiple cards: needs Professional version. Handles multiple synchronized cards
in one system.
SBench6-Mul3
SBench6-Mul5
SBench6-Mul10
3 Licenses of option multiple cards
5 Licenses of option multiple cards
10 Licenses of option multiple cards
Ordering hints
• The software license is stored on-board the Spectrum card and cannot be transferred to another card. Moving a card to another system
will also move the license together with the card.
• Each single independent card needs its own Professional licence.
• Systems with multiple synchronized cards (Star-Hub) only need one Professional (Pro) and one Multi (-Multi) license.
• Systems of multiple synchronized cards that are already equipped with a Professional and Multi license can be extended with no extra
cost.
• Multiple license packages - also with a different number of licences - can be combined in any way to get the desired number of total
licenses.
License Examples:
System 1
1 Card
3 Cards with Star-Hub
1 Card
3 Cards with Star-Hub
3 Cards with Star-Hub
System 2
1 Card
4 Cards with Star-Hub
2 Cards with Star-Hub
System 3
1 Card
1 Card
(c) Spectrum GmbH
Professional License
1 x Pro License
1 x Pro License
3 x Pro License
2 x Pro License
3 x Pro License
Multi License
1 x Multi License
2 x Multi License
2 x Multi License
11
Licensing
General
Version Overview
The Base version (with no time limit) is included in the delivery of each card and can also be freely downloaded from Web page
www.spectrum-instrumentation.com/sbench6.html. The Professional version requires a license purchase. Updates within an SBench version
can be downloaded from the web page at any time free of charge to take advantage of software operational improvements.
Base
Professional
Operating Systems
Windows XP/Vista/7/8
Linux + KDE Environment
Linux + Gnome Environment
Supported
Supported
Supported
Supported
Supported
Supported
Card + Configuration
Single Card
Multiple Cards (one system)
License
Project Load/Store
Supported
Supported
free
Supported
Supported
Option -Multi
purchase
Supported
License
Modes and Features
Standard Acquisition/Replay
FIFO Acq of several GSamples
Firmware Block Average
Multiple Recording/Replay
Gated Sampling/Replay
ABA Mode
Timestamp
Digital Inputs/Outputs
Supported
n.a.
n.a.
Simple display
Simple display
Simple display
n.a.
Supported
Supported
Supported
Supported
Segmented display
Segmented display
Segmented display
Supported
Supported
BaseXIO trigger lines
n.a.
Supported
Setup Functions
Channel Setup
Clock Setup
Trigger Setup
Mode + Memory Setup
Streaming Setup
Timestamp Setup
Included
Included
Included
Included
n.a.
n.a.
Included
Included
Included
Included
Included
Included
Display Windows
Preview Display
Analog Waveform Display
Spread Waveform Display
Digital Waveform Display
History Mode
FFT Display
X/Y Display
Timestamp Table
Layout/Auto Layout Functions
Define Shortcuts
Included
Included
Included
Included
Included
n.a.
n.a.
n.a.
Included
Fixed set
Included
Included
Included
Included
Included
Included
Included
Included
Included
Configurable
File functions
Auto Storage
Split Files
Round Robin Storage
Prof
Prof
Prof
Acquisition format
SBench 6
Wave File (*.wav)
Pure Binary File
Base
Prof
Prof
Export Functions
SBench 6
MATLAB
SBench 5.
ASCII
Wave File (*.wav)
Pure Binary File
Signal cut-off
VCD
Base
Prof
Prof
Prof
Prof
Prof
Prof
Prof
License
Basic Calculations
Min/Max
Average
Peak-Peak
Effective
Signal Info
Slope
Base
Base
Base
Base
Base
Prof
Cycle based Calc
Number of Cycles
Frequency/Period
Duty Cycle
Pos/Neg Width
Cycle Min/Max
Cycle Average
Cycle Peak-Peak
Cycle Effective
Cycle Rise/Fall Time
Prof
Prof
Prof
Prof
Prof
Prof
Prof
Prof
Prof
Math Signals
Import Functions
SBench 6
SBench 5
ASCII
Wave File (*.wav)
Pure Binary File
Base
Prof
Prof
Prof
Prof
Documentation
Screenshot
Reports
Print
Prof
Prof
Base
Display Features
Cursor Measurement
Physical Units
Digital Signals Bus
Digital Bus Inspection
FFT Harmonics Cursor
Movable Comments
Base
Prof
Prof
Prof
Prof
Prof
ADD/SUB/MUL/DIV
AND/OR/XOR
NAND/NOR/XNOR
Copy as Reference
Conversion A-to-D
Conversion D-to-A
Signal Averaging
Multi Averaging
FIR Filter
Concatenate
Formula Interpreter
Prof
Prof
Prof
Base
Prof
Prof
Prof
Prof
Prof
Prof
Prof
Frequency Calc
FFT
SNR/THD/SINAD
SFDR, ENOB
Prof
Prof
Prof
Enhanced Calc
RMS Noise
Histogram
Prof
Prof
Installing License on hardware
If you buy the software license together with the hardware everything is already installed and you can immediately start using the software
together with your hardware.
If you buy a software license for an already delivered card you will get an installation code. The license is installed using the Spectrum card control center. Please see
the hardware manual for detailed information. Please note that the SBench 6 license
is installed on the Spectrum hardware itself and it is not necessary to re-install the
license after moving the card to another PC.
Command line parameters (file types supported by SBench 6)
SBench 6 can be started with some command line parameters to set up a desired environment directly. You may add any of these parameters
in the properties page of your program link:
• User settings file: -[Name].sb6usr
• Configuration file: -[Name].sb6cfg
• Data file(s): -[Name].sb6dat
Example: SBench6.exe -test.sb6cfg -mylayout.sb6usr
You may also start SBench 6 directly with these files by double clicking the file (Windows only).
12
SBench 6 Software Manual
General
Localization (Language support)
Localization (Language support)
Program language
The default language of SBench 6 is english. It is possible to change the program language after the installation from the Settings menu. All
available languages are installed and are then listed here. Please check with your local sales partner if you need a localized SBench 6 version.
UNICODE support
Starting with version
6.1.02 SBench 6 has full
unicode support for all
names and comments. It is
possible to use any unicode text for signal names,
device names, signal units
and comments. The unicode characters are stored
to configuration files and
data files and are restored
when loading any of
these. Please use the Windows/Linux unicode programs to get unicode
characters into the text entries. Under Windows a good choice is the system program „charmap“, which is installed together with Windows as a default.
Please note that some file formats (like standard ASCII) do not support unicode characters. If the unicode character isn’t supported the internal
name is used.
(c) Spectrum GmbH
13
First Start
General
First Start
When starting SBench 6 you will get a card selection window as
shown on the right. SBench 6 only supports single cards or a synchronized group of cards. It is not possible to handle independent
cards or sets of cards under one SBench instance.
The Start screen allows you to select the cards to run and their license you wish to run. If you do not have a professional license installed you may select whether to run with base license or with
professional demo license. Please keep in mind that each start of
the demo license will decrease the demo start counter until it reaches zero. In that case you either have to continue with base license
or purchase a professional license for that card or group of cards.
You may mark the „Hide on next start“ checkbox to directly start
SBench 6 with the last selection that was made. This start window
is available from the menu under „Settings“ -> „Start Settings“
No instrument found at first start
When starting SBench 6 with no hardware locally installed and no
digititerNEZBOX „discovered“ (see next chapter) and no demo cards
installed it will show the message shown on the right stating that no
card is found.
It is now possible to start SBench 6 without any hardware to examine
already acquired data.
If starting SBench 6 to test the software it is now requested to install
a demo card to the system. If a digitizerNETBOX is installed in the
LAN but not recognized yet it is necessary to first „discover“ it.
Therefore one starts the „Spectrum Control Center“ that has been installed together with SBench 6 and the needed driver libraries. The control
center can be started directly from the SBench 6 welcome dialogue.
The Spectrum control center allows to install one or multiple M2i, M3i and M4i cards as a demo card in the system. When installing multiple
demo cards please be sure to also add the option Star-Hub to one of the installed demo cards. Otherwise SBench 6 will only support a single
card in demo mode.
After doing the demo card installation please be sure to once hit the „Refresh“ button to reload all demo driver details.
Installing and removing Demo cards
With the help of the card control center one can install demo cards
in the system. A demo card is simulated by the Spectrum driver including data production for acquisition cards. As the demo card is
simulated on the lowest driver level all software can be tested including SBench, own applications and drivers for third-party products
like LabVIEW. The driver supports up to 64 demo cards at the same
time. The simulated memory as well as the simulated software options can be defined when adding a demo card to the system.
Please keep in mind that these demo cards are only meant to test software and to show certain abilities of the software. They do not simulate the complete behavior of a card, especially not any timing
concerning trigger, recording length or FIFO mode notification. The
demo card will calculate data every time directly after been called
and give it to the user application without any more delay. As the
calculation routine isn’t speed optimized, generating demo data
may take more time than acquiring real data and transferring them
to the host PC.
Installed demo cards are listed together with the real hardware in the main information tree as described above. Existing demo cards can be
deleted by clicking the related button. The demo card details can be edited by using the edit button. It is for example possible to virtually
install additional feature to one card or to change the type to test with a different number of channels.
14
SBench 6 Software Manual
General
First Start
Discovery of Remote Cards and digitizerNETBOXes
The Discovery function helps you to find and identify the Spectrum LXI instruments like digitizerNETBOX available to your computer on the network. The Discovery function will also locate Spectrum card products
handled by an installed Spectrum Remote Servers somewhere on the network. The function is not needed if you only have locally installed cards.
Please note that only remote products are found that are currently not used
by another program. Therefore in a bigger network the number of Spectrum products found may vary depending on the current usage of the
products.
Execute the Discovery function by pressing the „Discovery“ button. There
is no progress window shown. After the discovery function has been executed the remotely found Spectrum products are listed under the node Remote as separate card level products. Inhere you find all hardware
information as shown in the next topic and also the needed VISA resource
string to access the remote card.
Please note that these information is also stored on your system and allows Spectrum software like SBench 6 to access the cards directly once
found with the Discovery function.
After closing the control center and re-opening it the previously found remote products are shown with the prefix cached, only showing the card
type and the serial number. This is the stored information that allows other
Spectrum products to access previously found cards. Using the „Update cached cards“ button will try to re-open these cards and gather information of it. Afterwards the remote cards may disappear if they’re in use from somewhere else or the complete information of the remote
products is shown again.
Wake On LAN of digitizerNETBOXes
Cached digitizerNETBOXes that are currently in standby mode can be waked up, by using the
„Wake remote device“ entry from the context menu.
The ControlCenter will broadcast a standard Wake On LAN „Magic Packet“, that is send to the
device’s MAC address.
It is also possible to use any other Wake On LAN software to wake a digitizerNETBOX by sending such a „Magic Packet“ to the MAC address, which must be then entered manually.
It is also possible to wake a digitizerNETBOX from your own application software by using the
SPC_NETBOX_WAKEONLAN register. To wake a digitizerNETBOX with the MAC address
„00:03:2d:20:48“, the following command can be issued:
spcm_dwSetParam_64 (NULL, SPC_NETBOX_WAKEONLAN, 0x00032d2048ec);
(c) Spectrum GmbH
15
Getting help
Getting help
Manual
This manual is updated regularly and new features are added to the documentation a short time after they have been added to the software.
Please download the latest SBench 6 manual from the Spectrum website to have access to new features and more detailed function descriptions.
Help
The most recent documentation
is available through the help
function of SBench 6 itself. Help
text will give you a short description of the functionality including cross references to
related functions.
To access the software help one
can use the F1 key while pointing the mouse cursor to the element of interest.
The help system of SBench 6
also includes printing capabilities, bookmarks for topics that
need to be looked up more often, cross reference and search
functions to move from one topic of interest to the next one.
As the help system is a standard
function of the underlying class
library it is available in different languages and will adopt to the installed system language then.
Tooltips
Tooltips are the fastest way to get helping information on parts of the software. A
tooltip is a short help message that will directly appear on top of the window and
that contains a very brief explanation of the functional part. The usage of tooltips is
very helpful to see what functionality the buttons of the toolbar have or what meaning
the different input fields of a settings dialogue have.
To access tooltips one simply moves the mouse cursor over the field of interest and
then stops the mouse movement for a couple of seconds. The tooltip will appear directly at the mouse position.
16
SBench 6 Software Manual
Data Acquisition Overview
Data Acquisition Overview
This chapter gives you a brief overview on the general structure and functionality of SBench 6. It shows the usage of the different areas. More
details are found in the dedicated chapters.
The following screenshot is the default view after starting the software with an acquisition card and having made a single shot acquisition.
Please use the green arrow in the top toolbar (2) once to have the same view on the software. The available settings and the number of
channels may vary with your specific card.
Hardware and Channel windows
The tabbed window on the left contains all hardware settings as well as a channel list that acts as a source for connecting channels with
the display windows. After the first start all channels that are found in the system are automatically added to the display window (4). If
channels should be added to a display window later on it is simply necessary to drag and drop these channels with the mouse to the desired
display window.
Settings on the „Channels“ tab can be made by double clicking on a channel or by using the context menu that is hidden behind the right
mouse button to set up a single channel or a group of channels selected by holding either the ctrl-key or the caps key while pressing the left
mouse button for selection.
On each tab of the hardware window there is one group of hardware settings available. The hardware settings can be done for a group of
cards or it is possible to individually setup cards that are synchronized in one system.
Main Toolbar
The main toolbar on top of the software contains all general hardware and setup related buttons. Using one of the green arrow buttons
one can start the hardware either with single shot or in a loop. This toolbar also contains display and screen layout buttons which allow
to generate additional display windows or arrange the currently shown display windows.
Preview
The preview window shows the complete acquired signal including the current selection in the display window. The preview window
always acts for the currently selected display window and will change its content if changing from one display window to the next one.
It is possible to change the zoom area and to move the selected display area with one mouse button. The currently selected display area is
marked in light gray inside the preview window.
Analog Display Window
The display window is used to show the signals, to zoom into details and to measure signals with cursors. New display windows can be
generated using the main toolbar (2) or the menu on top of SBench 6. Signals are added to a display window simply by dragging them
(c) Spectrum GmbH
17
Data Acquisition Overview
from the „Channel“ window (1) to the display window of interest. The display window shows the current signal selection while the preview
window (3) always shows the complete signal including a marking for the current display signal area.
Using the display toolbar on the right (6) one can select different zoom modes or select measurement cursors. More than 10 different zoom
functions are available. Please see point (6) for details.
Switching to the cursor measurement mode one has two cursors that are moved using the left and the right mouse button. Measurement results
are shown in the general information window (7). The cursors can be moved freely inside the display window or they can be locked to acquired signals to show the exact signal value. Cursor locking is explained in point (5) in more detail.
Display Channel Selection
On top of the display window one finds the channel selection that is displayed inside the window. All channels that have been dragged
to the display window are shown here. Using the left mouse button on one of the channels will bring this channel to the foreground showing the channel on top of all other signals then.
Using the right mouse button there are several channel related functions available through the context menu. The channel functions can either
be used for one channel only or for a selection of channels which can be made using the ctrl-key together with the left mouse button.
The channel context menu gives access to the cursor locking functions. Each of the two cursors can be locked to one signal and will then show
the exact signal values in the information window (7).
Display Toolbar
The display toolbar contains display related buttons that are used to zoom the signals, to select different view aspects of the display and
to select the cursor measurement mode.
After doing a zoom function the last zoom selection is stored inside SBench 6. It is possible to undo and redo zoom settings using the undo
button. With this function it is possible to jump between different settings.
Information Window
All cursor measurement results of the different display windows as well as calculation function results are shown in the information window. It is possible to reduce the selection of displayed results by using the „settings“ mode accessible through the right mouse button. In
settings mode each measurement and calculation block can be deactivated from display without deactivating the measurement itself.
If displaying a calculation result inhere it is possible to copy result lines to clipboard or to setup the calculation function from here by using
the context menu of a result which is available through the right mouse click.
18
SBench 6 Software Manual
Data Replay Overview
Theory
Data Replay Overview
Theory
Data replay with SBench 6 can be used as stand-alone replay, in combination with data acquisition cards or as a feature of an i/o card that
can perform data acquisition and data replay like a digital I/O card.
Data replay steps
For each replay setup the following steps have to be performed:
• Acquire, generate, load or import existing data to SBench 6. The available data is shown in the input channel list be it acquired data or
loaded data.
• Assign the data to the output channels by dragging the data to the output channel list.
• (automatically) Re-format the data to the required output format. It may be necessary to change the resolution (e.g. acquired 12 bit A/D
data should be replayed on 14 bit D/A device) or to change the data ordering when changing the channel ordering or combining signals from different sources. This step is automatically done by SBench 6 before the data replay is started.
• Set up the required output mode. All settings dialogs are available for output channels also. Please check the following chapters for
details on these.
• Start the output by clicking on one of the start buttons.
The Spectrum D/A cards have internal hardware data conversion between 12, 14 and 16 bit. This feature is
supported by SBench 6. Please update to the latest hardware firmware to have this feature available on your
card.
Overview
Please see the data acquisition overview to have a general overview about the SBench 6 window and dialogue structure. In this chapter we
only concentrate on the additional dialogs and settings that are visible when using a data generation card be it an arbitrary waveform generator or a pattern generator.
The input channel
dialogue shows the
available signals that
have been acquired or
loaded/imported before and that can be assigned to an output
channel.
The output channel
has its own dialogue
showing the channel
name, the assigned
data channel and the
channel settings.
In our example two
of the output channels
already have assigned
output data files. Valid
signals are simply
dragged and dropped
from the input channel
list to the output channel
list to assign the data to an output channel. In the example the output channel AO-Ch0 will replay the data of the input channel AI-Ch0 which
has been loaded before.
Output channels that don’t have data assigned so far are greyed out to indicate that they’re not valid.
The output channel list also shows the settings of the output channel and allows to change the settings as explained further below when
looking at the hardware setup dialogues.
The information window shows calculation results and cursor measurement information as explained further below.
In our example the loaded input channels are also displayed to see which data will be replayed. Display handling is explained in full
detail in a separate chapter.
(c) Spectrum GmbH
19
Generating Signals
Data Replay Overview
Generating Signals
Easy Generator
The easy generator allows to define and output some standard waveforms. It turns your arbitrary waveform generator in a multi channel
function generator using SBench 6 as the control panel. To keep things easy the control panel takes over complete control of the hardware
and defines all necessary settings from the easy generator control panel itself. It is no longer necessary to setup any of the hardware features
while using the easy generator.
The base frequency defines the highest
output frequency of the easy generator.
Multiple channels can have slower output
frequencies derived by a divider from this
base frequency.
Each output channel has its own settings which is available using the tab windows. All channels can have different
output signals and signal settings.
Each output channel can be enabled or
disabled for the output.
Each output channel can have its own
signal frequency as a divided value from
the base frequency (1).
If the hardware has signal filters installed a matching filter can be set here.
Each output signal can have different
waveforms which are selected by the buttons. If selecting a waveform shape the waveform parameter area (7) will change according to the waveform shape.
The waveform parameter area shows a matching selection of settings for the selected waveform shape (6). Inhere output levels, rise times,
phase shifts and duty cycles can be defined.
The start button will setup the hardware to match all selected settings and start the output of the define waveforms. To change settings
one must first stop the output again and then select different settings.
The setup of the easy generator can be stored separately from SBench 6 to have easy and fast access to different easy generator setups.
Function Generator
The most powerful way to generate output signals inside SBench 6 is the universal function
generator. The function generator is called
from the menu New -> Signal Calculations ->
Function Generator:
Define the calculation function for the
newly generated output signal here. All standard mathematical steady functions can be
used and some unsteady functions. More details and some examples are found in the separate chapter „Calculation Functions“
The scaling and length of the signal is setup here.
Give the newly generated function signal
a name that will be used all throughout
SBench 6
Once you finish the function dialogue
with Ok a new time domain signal is generated. To change the function beneath this signal
please use the right mouse click and select the
Calculation Settings.
By dragging the generated time domain signal to the output channel you set the connection and define this signal to be used as an output
signal for this channel.
20
SBench 6 Software Manual
Data Replay Overview
Using I/O cards
Using I/O cards
When using I/O cards that can do data acquisition and data replay the mode dialogue is doubled to allow the setup of different input and
output modes. To select either input or output one has to enable the channels of either direction automatically disabling the channels of the
opposite direction.
The input channel
dialogue shows the activated input channels
with their setup. In the
current state as shown in
the screenshot the I/O
card is ready for data
acquisition.
As the input channels are activated the input mode dialogue is
also active and allows
the setup of input related mode settings.
All output channels
already have been assigned the input channels to replay the
acquired data. At the
moment the output channels are de-activated as the input direction is still active.
The output mode dialogue is empty as the direction is currently set to input. The output mode dialogue will automatically become active
as soon as the output channels are activated.
(c) Spectrum GmbH
21
Layout and Configuration Concept
SBench 6 Layout and Setup
SBench 6 Layout and Setup
Layout and Configuration Concept
Overview
SBench 6 allows each user to set up the layout of the windows, dialogues and toolbars individually to match the specific needs of the application. The layout can be saved and restored separately from the configuration in an user file. This user file can be used as an individual
base for different SBench configurations and can also be used as a default SBench 6 layout for new measurement configurations.
In contrary to this the configuration file *.sbcfg contains the current setup of the hardware, all calculation routines with their setup, all display
configurations and all general SBench 6 settings like the file settings. To handle different measurement configurations the config file also contains the current window state.
Both file types can be used as a start-up parameter making it possible to start SBench 6 with individually selected layout and configuration
just from the shortcut.
User Layout File Handling
The user file *.sb6usr contains all user and layout specific settings. After installation a default user file settings is used and taken as a template
for new SBench 6 starts and configurations. The user file settings can be accessed from the menu under „Settings“ -> „User Settings“ -> Tabulator „User file“
The shown user settings dialogue handles the
different user files. It is possible to use different user settings files to individually change
the look and feel of SBench 6 and to adopt
the surface to different needs:
The dialogue shows The currently used
user file is shown here. Using the button next
to the file name it is possible to select and
load a different user file which will be used
immediately then.
The button allows to go back to he initial
user layout that is stored in the current user
file. This can be helpful if the layout has been
changed a lot during interactive work with
SBench 6 and one wants to go back to a
dedicated setup layout without losing the current configuration.
Using the „Store current...“ buttons will
store the current layout (settings) in the currently selected user file. This function should
be used after layout and all settings have
been altered to the desired look and feel and
no more changes are planned to these settings.
If one likes to work with different user layout files a copy of the current layout can be stored to hard disk creating a new user file. When
doing the create command one can select which components of the current user settings are written to the new user file. After creation of a
new user file this one is automatically used as the current user file.
22
SBench 6 Software Manual
SBench 6 Layout and Setup
Layout and Configuration Concept
Configuration File Handling
The SBench 6 configuration file *.sb6cfg contains the individual hardware, calculation and general setup. The software can handle an unlimited number of different configuration files which can be stored and loaded at any time. Please note that settings that do not match the
currently installed hardware are ignored.
The following three functions handle the configuration files. Each of these functions is either available through the file menu or from the main
toolbar:
Setup Load
A configuration file *.sb6cfg can be selected from hard disk. The configuration stored there is loaded and all dialogues and settings are
changed to the previously saved state.
Setup Save
The current configuration is stored into the currently selected setup file *.sb6cfg overwriting the former content. If selected as SBench 6
exit behavior this is also done automatically when SBench 6 is closed. If no setup file has been selected the button has the same functionality like the Save as... button.
Setup Save as...
The current configuration is stored into a new setup file *.sb6cfg. The former setup file is left unchanged and can be loaded again at any
time restoring the original setup.
Arranging Setup Windows
SBench 6 is based on a very powerful underlying window and layout manager. Each window can be individually arranged and all layout
settings can be stored to the above mentioned user file. All setup dialogues can be either used as a free floating window, a docked window
or as a tabbed window. The size of the different windows and dialogues can also be individually set up while some setup dialogues have a
minimum size.
Tabbed Window to Floating Window
At the first start all setup dialogues are displayed in one tabbed window. Each setup dialogue then has its own page where the dialogue is
shown. To move a dialogue out of the tabbed window the title of the window is pointed with the left mouse button and the dialogue is dragged
to an empty space inside or outside SBench 6. Using this function allows to place all setup dialogues onto a second screen (if connected) to
have one screen available for signal display only.
(c) Spectrum GmbH
23
Layout and Configuration Concept
SBench 6 Layout and Setup
Docking Windows
Dragging a floating setup dialogue or a already docked/tabbed setup dialogue with the left mouse button to a border of SBench 6 automatically docks this window at this side. The docking area is shown in gray pointing to the position the window will be located as soon as the
mouse button is released. It may be necessary then to resize the different areas or the window itself to see all elements of the setup dialog.
24
SBench 6 Software Manual
SBench 6 Layout and Setup
Layout and Configuration Concept
Tabbing Window
Dragging a floating setup dialogue or a already docked/tabbed setup dialogue with the left mouse button to another setup dialogue will add
this dialogue as a new tab to the previously selected dialogue as soon as the mouse button is released. The complete tabbed dialogue where
the new window is dragged to is highlighted in gray then showing where the dragged window will land when releasing the mouse button.
At the bottom of the newly generated tabbed window a small tab is shown for each page that is stacked inhere. Clicking with the left mouse
button on one of the tabs will change the page.
(c) Spectrum GmbH
25
Layout and Configuration Concept
SBench 6 Layout and Setup
Arranging Display Windows
Besides the standard possibilities of Windows to resize and move windows individually there are a couple of automatic display window
arrangements that are accessible through the menu under „Windows“ or through the toolbar. These commands will affect all currently opened
display windows and will leave the setup windows untouched.
Tile Displays
The tile displays function will arrange all displays tiled on the available screen area. All signals shown in any display window are visible
then at the same time. Display Windows may then be moved and changed in size to adopt the view to the user needs.
Tile Displays Horizontally
This function tiles all displays in the work space horizontally. Displays will then have the full screen width for x-axis but will share the
screen height for their y-axis. All signals shown in any display window are visible then at the same time.
Tile Displays Vertically
This function tiles all displays in the work space vertically. Displays will then have the full screen height for y-axis but will share the screen
width for their x-axis. All signals shown in any display window are visible then at the same time.
Cascade Displays
This function cascades all displays one after the other. Each display will have nearly the full available screen area but only the display
on top of all others will be visible. All other displays may easily be reached by clicking on the visible title bar of the display.
Duplicate Display
The command duplicates the currently active display with all its current settings and signal selections. After pressing this command you
will have two identical displays giving you an easy way to see different portions of the signals with only a very few mouse clicks. This
can be very useful if for example start and end of a bunch of signal is of interest or one wants to compare the current signal part with another
part at a different x-axis position.
Close Displays
This button closes all currently visible display windows and empties the display area of SBench 6 totally. To generate new display windows one of the „new display“ functions may be used.
26
SBench 6 Software Manual
SBench 6 Layout and Setup
Layout and Configuration Concept
Showing Displays in Tab Bar
The tab bar window display needs to be activated in the user file settings: Menu Settings -> User Settings -> Tab Display Settings -> Entry
„Show display windows in tab bar“. Inhere it is also possible to select
the position of the tabulator bar.
After activation of the tab display view the above explained tile functions are no longer available. Each display window is fully maximized. Switching between display windows is done using the tab
bar.
Switching Display Elements
When working with SBench 6 it may be often necessary to switch between a setup view where some or even all setup dialogues are accessible
and a second view where the signal display window should occupy all of the screen area to show the signal in a pixel resolution as high as
possible. As all elements of SBench 6 can be individually enabled and disabled it is possible to set up the software with the needed windows
with a few mouse clicks. To switch very fast between different screen layouts there are some additional commands and buttons that allow
switching with a single mouse click or keystroke:
Toggle Setup Windows
The function will toggle between a screen layout with all setup dialogues (channels, trigger, mode, clock) and a screen layout without
these dialogues. The current view state of the preview area as well as the information window (showing cursor measurement results and
calculation results) will be kept unchanged.
Toggle Setup and Info
The function will toggle between a screen layout with all setup dialogues (channels, trigger, mode, clock) including the information window (showing cursor measurement results and calculation results) and a screen layout without any setup dialogue and without the information window. The current view state of the preview window will be kept unchanged when using this function.
Toggle Setup and Info and Preview
The function will toggle between a screen layout showing all setup dialogues (channels, trigger, mode, clock), the information window
(showing cursor measurement results and calculation results) and the preview window and a second screen layout only showing the signal
display windows. Using this function will maximize the visible area of the signals and will show the signals display with the best resolution
available with your screen.
Individual Toolbars
SBench 6 is started with a default set of toolbars. If
needed these toolbars can be individually changed
to have functions that are often used directly accessible with one mouse click only. The setup of the toolbars can either be done calling the toolbar setup
dialogue from the menu „Settings“ -> „Setup Toolbar“. A second method to setup the toolbar is by using a right mouse click inside the toolbar that should
be changed. Depending on the way the toolbar setup
has been called either all toolbars can be changed
from the setup dialogue or only the toolbar where one
has called the setup function with a right mouse click.
The toolbar selection is stored in the user file *.sb6usr
and can then be used throughout all SBench 6 work.
The following description is done for the setup dialogue called from the menu containing all toolbars.
Please just ignore step 1 if called directly from inside
a toolbar:
On top of the setup dialogue all available toolbars are listed. Please select the one you want to change by clicking on the tab. Please
note that inhere also toolbars are shown that are not visible on the screen. This might occur if not all types of display windows are shown
at the same time. The toolbar selection is not visible if calling the setup function directly from inside a visible toolbar.
Each line of the list corresponds to one command including the icon of that command as shown in the toolbar and the command text
itself. The meaning of the different commands is described later on in this chapter.
In front of each command line is a checkbox which defines whether this command and the icon is shown in the selected toolbar or not.
The toolbar can be set up individually by checking the commands that are needed and unchecking the commands that should be hidden.
The sorting of the icons cannot be changed in SBench 6.
(c) Spectrum GmbH
27
Layout and Configuration Concept
SBench 6 Layout and Setup
If all iconbars have been individually set up one can close the dialogue using the „close“ button. This will automatically take over the
changes. To store the changes to hard disk one has to store the user file as described further above.
Individual Short-cuts (Professional Version)
SBench 6 has the ability to run commands on different short-cuts
to speed up the interactive work with the software and especially
with the display. Using different short-cuts for functions that are
often used has the advantage that it is not necessary to search
the matching button from the toolbar or from the menu and the
mouse pointer can stay at the very exact position it is.
The short-cuts can be set up individually if using the Professional
version. The Base version has a fixed set of short-cuts that already cover most functions that may be needed.
The circuits selection is stored in the user file *.sb6usr and can
then be used throughout all SBench 6 work.
The default set of short-cuts at the time this manual has been written is as follows:
• Arrow Left, Right, Up, Down: scrolls the current display area
in the direction the key is showing. The signals will then move
in the opposite direction.
• F2: Change the mode to cursor mode. Now both cursors can
be move with the left and right mouse button.
• F3: Zoom to full scale. The full acquisition area is shown
including the full resolution of the input independent of the
currently measured signal.
• F4: Zoom to best fit. The full signals are shown and the current display area is adapted to the currently shown signal levels.
• F5: Change the mode to rectangle zoom mode. The left
mouse button will now define a zoom area.
• F6: Undo the last zoom step.
• F7: Redo the last zoom step.
• F9: Start the hardware once in singleshot.
• F10: Start the hardware in loop mode.
The individual short-cuts setup is reached using the command
from the menu „Settings“ -> „Short-cuts“:
The left part of the short-cuts list contains the key that has been associated with the command. It is possible to use single keys like the
function keys or any combination of a single key together with the ALT, SHIFT or CTRL key.
The right part of the short-cuts list contains the command that is emerged when pressing the key shown in the left column. The details of
the commands are shown later in this manual in the menu overview.
Using the „Add shortcut“ button will request to press a key or an ALT/SHIFT/CTRL plus key combination which is afterwards added to
the list with the command currently selected under (4) If pressing a shortcut that is already implemented this setting is overwritten and the
old command is deleted.
The tree list shows all available commands that can be used for the shortcuts. To define a command for a shortcut from the list simply
drag and drop the command from here to the line containing the key/shortcut combination (1)/(2)
Single short-cuts may be removed from the list using the „Remove short-cuts“ button. After pressing this button one has to select the shortcut
that should be removed with a second mouse click.
Using the „Remove All“ button will empty the complete list of short-cuts allowing you to start from scratch entering short-cuts.
Using the „Close“ button will close the short-cuts setup window and store the changed short-cuts to SBench 6. To store the changes to
hard disk one has to store the user layout file as described further above.
28
SBench 6 Software Manual
SBench 6 Layout and Setup
Main Toolbar and Menu Functions
Behavior on SBench 6 Exit
The behavior on exit can either be set up using the „Settings“ -> „User Settings“ dialogue as described at the beginning of its chapter or it can be
individually defined on exit. As a default SBench 6 will ask for one of the
different selections shown below separated between user configuration
and config file:
User File
• „Save layout & settings“: will automatically save both the user layout
as well as the currently used configuration to the currently used files.
Using this modes allows you to automatically continue work with the
very exact settings and layout that was used when exiting SBench 6.
• „Save only settings“: the current settings are stored but any changes to
the user layout will be discarded. When starting SBench 6 next time
the user layout is reset to the original layout that was store to the user
file.
• „Ask for saving“: every time SBench 6 is closed and the layout or settings have been changed you’re asked what to do, whether to store
the settings or whether to discard changes.
• „Never save layout or settings“: all changes are discarded and user
layout file as well as configuration file will be kept unchanged. Both
files then need to be stored explicitly whenever the state has been
reached that should be used as a base for further work.
Config File
• „Always save to current config file“: stores all current settings as all hardware and display configuration including calculations. Using this
modes allows you to automatically continue work with the very exact settings and layout that was used when exiting SBench 6.
• „Ask for saving“: every time SBench 6 is closed and the configuration has been changed you’re asked what to do, whether to store the
configuration or whether to discard changes.
• „Never save to current config file“: all changes are discarded and the configuration file is kept unchanged. The original configuration
stored in the current config file can be used again.
Remember choice
Using the box „Remember choice“ will use your selection for any future exits of SBench 6. To change the behavior again one needs to use
the user settings dialogue from the menu.
Main Toolbar and Menu Functions
The following commands are all available from the main menu of SBench 6. Most of these functions can also be put into the main toolbar as
described under the chapter „Individual Toolbars“ before. Nearly all of these functions can also be used as a shortcut command as described
in the chapter „Individual Short-cuts“ before.
The functions are explained in more detail in the dedicated chapters later in this manual.
File Menu
The file menu contains all file and general system related functions like configuration and signal handling, export and import and screenshots
or print commands:
Setup Load
A configuration file *.sb6cfg can be selected from hard disk. The configuration stored there is loaded and all dialogues and settings are
changed to the previously saved state.
Setup Save
The current configuration is stored into the currently selected setup file *.sb6cfg overwriting the former content. If selected as SBench 6
exit behavior this is also done automatically when SBench 6 is closed. If no setup file has been selected the button has the same functionality like the Save as... button.
Setup Save as...
The current configuration is stored into a new setup file *.sb6cfg. The former setup file is left unchanged and can be loaded again at any
time restoring the original setup.
Export SBench 6
This function will store a signal selection as a SBench 6 data file with the extension *.sb6dat. The signals to be stored can be selected
from a list containing all signals with valid data in it.
(c) Spectrum GmbH
29
Main Toolbar and Menu Functions
SBench 6 Layout and Setup
Export SBench 5
This function will store a signal selection as a SBench 5 data file. The data format is used by the previous version of SBench and is also
used throughout some third party products. The data format is documented in detail in the SBench 5 software manual. Please contact the
Spectrum support team to get a copy of this manual if needed. The signals to be stored can be selected from a list containing all signals with
valid data in it.
Export Matlab
This function will store a selection of signals directly as MATLAB binary file. It is then possible to do further analysis and more powerful
calculations with the MATLAB software. The signals to be stored can be selected from a list containing all signals with valid data in it.
Export ASCII
This function will store a selection of signals in an ASCII file format. The ASCII export function has very powerful setup routines to define
the export file for interaction with different third party programs. The ASCII file can be used with any text editor or it can be imported
into Microsoft Excel. The signals to be stored can be selected from a list containing all signals with valid data in it.
Export Wave
This function will store a selection of signals in the common wave file format (*.wav). The wave format is a standardized open format
that is supported by a huge number of commercial and free software world-wide. The signals to be stored can be selected from a list
containing all signals with valid data in it.
Export Pure Binary
This function will store a selection of signals in a pure binary format. The pure binary format can be imported in different third part products including FlexPro from Weisang. Together with the binary file *.bin an additional text file *_header.txt is stored to hard disk containing general signal header information for the binary file. The signals to be stored can be selected from a list containing all signals with
valid data in it.
Export VCD
The function will export the current digital signal selection as a standard VCD (Value Change Dump) file. The VCD file can be used with
many EDA and kernel tracer tools to display and analyze digital data streams. Depending on the data the VCD file can be significantly
smaller than an ASCII export of the same data.
Import SBench 6
This function will load a previously stored SBench 6 data file and add the containing signals to the general channels window. From here
the loaded signals can be used for display or calculations then.
Import SBench 5
This function will import a SBench 5 format data file. The data file can come from any software that is able to write SBench 5 compatible
data files including both pure SBench 5 file *.sb5 as well as streaming files *.sbs. The data format is used by the previous version of
SBench and is also used throughout some third party products. The data format is documented in detail in the SBench 5 software manual.
Please contact the Spectrum support team to get a copy of this manual if needed.
Import ASCII
This function will import an ASCII file that contains column based signal data. The function will try to determine the data format and
converts the data into a valid signal then. The ASCII import function has been tested with all formats that are available from the ASCII
export function.
Import Wave
This function will import a standard wave file *.wav as standardized world-wide. One or multiple signals are derived from the wave file
and displayed within SBench 6. Data information that is not included in the wave file is set to a standard value.
Import Binary
This function will import a pure binary file containing only signal data with no header information. The function will look for an additional
header as written by SBench 6 and will use the information stored here. If no header file is found the basic information of the import file
is asked by dialogue.
Print
Calls the printout dialogue which allows to print the current display area including the signals, axis, cursors, signal names and comments
as a selectable option. The printout dialogue is explained in a separate chapter (print/screenshot) at the end of the manual.
Print Cursor Area
Calls the printout dialogue which allows to print the area between the two cursors of the current display including the signals, axis, cursors, signal names and comments as a selectable option. The printout dialogue is explained in a separate chapter (print/screenshot) at
the end of the manual. This command is only available if the cursors are displayed.
Screenshot
Generates a screenshot of the display window. A screenshot can either be stored to clipboard or in different file formats on hard disk.
The screenshot functions allows to also show the signal names.
30
SBench 6 Software Manual
SBench 6 Layout and Setup
Main Toolbar and Menu Functions
Exit
This function closes SBench 6. Depending on the selected behavior at exit layout and/or configuration is automatically stored to disk then. If
data is stored to cache only any acquired data that has not been stored to disk is lost on exit.
New Menu
This menu generates display windows as well as calculation functions. All calculation functions are either available directly from the channels
dialogue or through this menu. Calculation functions are documented in more detail in a separate chapter and are therefore not listed here.
New U(t) Display
This command generates a new analog display to show analog signals over time. Any analog signal either being acquired, loaded with
an import function or generated from one of the signal calculations can be dragged to this display. After first start with any analog acquisition card be it either real hardware or a demo card one analog display is automatically generated with all analog signals already added
to it.
New FFT Display
This command generates a new FFT window which shows one or multiple FFT spectrums over signal frequency. If adding a FFT calculation
to SBench 6 a new FFT display is automatically added containing the newly generated FFT signals.
New Digital Display
This command generates a new digital data display which shows digital signals over time. Any digital signal either being acquired,
loaded with an import function or generated from one of the signal calculations can be dragged to this display. After first start with any
digital acquisition card be it either real hardware or demo hardware one digital display is automatically generated with all digital signals
already added to it.
New Histogram Display
This command generates a new histogram window which shows one or multiple Histogram files over the data range. If adding a histogram calculation to SBench 6 a new histogram display is automatically added containing the newly generated histogram signals.
New Spread Display
This command generates a new spread display to show multiple analog signals over the time. Any analog signal either being acquired,
loaded with an import function or generated from one of the signal calculations can be dragged to this display.
New X-Y Display
This command generates a new X-Y display to show multiple signals as a pair of X and Y values. One signal is used as X axis values for
a number of signals that generate the Y axis values then.
Multiple Displays
This command allows to generate multiple displays without issuing the same command several times. It is possible to generate all different
kinds of display windows listed before at the same time.
Hardware Menu
This menu contains all hardware related commands:
Singleshot
Using this command the hardware is started once with the current setup and will do a single acquisition. After end of this acquisition the
hardware is stopped and will wait for the next acquisition.
Loop
This command starts the hardware in a loop. After one acquisition is done the hardware is immediately started again for the next acquisition running in loop mode. Signal display is updated after each acquisition run.
Stop
The stop command stops a previously started acquisition loop. The current acquisition will be finished when pressing the stop button. After
pressing this button once it will change to the „Abort“ button allowing to even abort the currently running last acquisition. The hardware
is in idle state again. The loop can also be stopped pressing the loop button again.
Abort
The abort button aborts the current acquisition immediately with all data acquired so far being lost.
Force Trigger
This command forces a trigger on the hardware. If the hardware is waiting for a trigger event that is not detected a force trigger command
will issue a software trigger to the hardware allowing to finish the acquisition without losing previously acquired data.
(c) Spectrum GmbH
31
Main Toolbar and Menu Functions
SBench 6 Layout and Setup
Reset Hardware
This command issues a reset command to the connected hardware in case that something with the programming went wrong. Using a
reset command brings the hardware in a defined state as also present directly after system start. If logging driver commands for comparison with own programming a reset command is recommended to have both hardware settings based on the very exact same level.
Trigger Enable
If supported by the hardware this command allows to disable and enable the complete trigger engine on the hardware while already
running. If multiple trigger events are processed (e.g. Multiple Recording or Gated Sampling mode) and the trigger is disabled the hardware will ignore all trigger events until enabled again.
Calibration
This command starts the internal calibration routines of the hardware. Results and commands are shown in a separate window showing the
calibration progress and the reached results.
Easy Generator
The Easy Generator is a simple tool to generate waveforms for arbitrary waveform generator cards. It can only be used together with
these AWG cards (D/A cards) and allows to generator different pre-defined waveforms with different amplitudes, offsets and frequencies
as simple benchtop generators do.
Settings Menu
The settings menu contains the different setup dialogues that define the general behavior of SBench 6. The dedicated functions of this menu
are described in more detail inside this chapter:
Languages
SBench 6 can run with different languages installed. Using this menu topic one can switch from one language to another. The once selected
language is used automatically at the next start again. Please check with your local distributor to request different language support.
Start Settings
This command allows to access the start settings of SBench 6 again. The start settings are used to select the supported hardware and the
license to run and can be deactivated by checking. Once deactivated the start settings are only accessible using this command. Details on
the start settings are found in the install chapter.
Shortcuts
This command allows to set up individual shortcuts for commands. After installation a default set of shortcuts is installed which can be changed
if having a Professional license of SBench 6. Please see the topic before to get details on shortcuts setup.
Setup Toolbars
This command allows to set up individual toolbars throughout SBench 6. If using this command a toolbar setup dialogue will appear allowing
to modify all toolbars that are available through SBench 6. Please see the topic before to get details on toolbar setup.
User Settings
This command issues the user settings dialogue which handles user layout, shortcuts and toolbar settings. The user settings dialogue is explained in more detail at the beginning of this chapter.
File Settings
The file settings dialogue handles all file related settings of SBench 6 like cache, storage format, automatic preview calculation and others.
Please see the next topic to have more details on the file settings.
Internal Settings
Internal settings contain general engine and GUI settings. The engine handles hardware and all data transfers including streaming to disk.
The engine settings allow to change some internal parameters to optimize system performance. These settings affect overall system speed,
streaming speed as well as reaction time and system stability. The settings should only be changed carefully.
Windows Menu
This menu topic will handle all window and arrangement functions. Besides the commands shown below all currently generated display windows are also shown here and may be activated and brought to top by clicking on the name inside the menu.
Tile Displays
The tile displays function will arrange all displays tiled on the available screen area. All signals shown in any display window are visible
then at the same time. Display Windows may then be moved and changed in size to adopt the view to the user needs.
Tile Displays Horizontally
This function tiles all displays in the work space horizontally. Displays will then have the full screen width for x-axis but will share the
screen height for their y-axis. All signals shown in any display window are visible then at the same time.
32
SBench 6 Software Manual
SBench 6 Layout and Setup
Main Toolbar and Menu Functions
Tile Displays Vertically
This function tiles all displays in the work space vertically. Displays will then have the full screen height for y-axis but will share the screen
width for their x-axis. All signals shown in any display window are visible then at the same time.
Cascade Displays
This function cascades all displays one after the other. Each display will have nearly the full available screen area but only the display
on top of all others will be visible. All other displays may easily be reached by clicking on the visible title bar of the display.
Duplicate Display
The command duplicates the currently active display with all its current settings and signal selections. After pressing this command you
will have two identical displays giving you an easy way to see different portions of the signals with only a very few mouse clicks. This
can be very useful if for example start and end of a bunch of signal is of interest or one wants to compare the current signal part with another
part at a different x-axis position.
Close Displays
This button closes all currently visible display windows and empties the display area of SBench 6 totally. To generate new display windows one of the „new display“ functions may be used.
Show All
The command will show all sub-windows on their last position if any of the sub-windows have been closed in between. It has no function if
all sub-windows are currently visible.
Show Preview
The command will enable or disable the view of the signal preview window on top of SBench 6. The preview window can also be closed
using the normal window close button in the upper right corner of the window.
Show Input Channels/Show Output Channels
The command will enable or disable the view of the input or output channels setup dialogue. The channels dialogue can also be closed using
the normal window close button in the upper right corner of the dialogue. To enable/disable the view of all setup dialogues one can also
use one of the toggle functions described below.
Show Info
The command will enable or disable the view of the information window which show cursor measurement results and calculation results. The
info window can also be closed using the normal window close button in the upper right corner of the dialogue. To enable/disable the view
of all setup dialogues together with the info window one can also use one of the toggle functions described below.
Show Input Mode/Show Output Mode
The command will enable or disable the view of the input or output mode setup dialogue. The mode dialogue can also be closed using the
normal window close button in the upper right corner of the dialogue. To enable/disable the view of all setup dialogues one can also use
one of the toggle functions described below.
Show Clock
The command will enable or disable the view of the clock setup dialogue. The clock dialogue can also be closed using the normal window
close button in the upper right corner of the dialogue. To enable/disable the view of all setup dialogues one can also use one of the toggle
functions described below.
Show Trigger
The command will enable or disable the view of the trigger setup dialogue. The trigger dialogue can also be closed using the normal window
close button in the upper right corner of the dialogue. To enable/disable the view of all setup dialogues one can also use one of the toggle
functions described below.
Toggle Setup Windows
The function will toggle between a screen layout with all setup dialogues (channels, trigger, mode, clock) and a screen layout without
these dialogues. The current view state of the preview area as well as the information window (showing cursor measurement results and
calculation results) will be kept unchanged.
Toggle Setup and Info
The function will toggle between a screen layout with all setup dialogues (channels, trigger, mode, clock) including the information window (showing cursor measurement results and calculation results) and a screen layout without any setup dialogue and without the information window. The current view state of the preview window will be kept unchanged when using this function.
Toggle Setup and Info and Preview
The function will toggle between a screen layout showing all setup dialogues (channels, trigger, mode, clock), the information window
(showing cursor measurement results and calculation results) and the preview window and a second screen layout only showing the signal
display windows. Using this function will maximize the visible area of the signals and will show the signals display with the best resolution
available with your screen.
(c) Spectrum GmbH
33
Main Toolbar and Menu Functions
SBench 6 Layout and Setup
Help Menu
The help menu contains all information and help files on SBench 6 itself:
Help Contents
This command starts the help system of SBench 6 with an interactive and cross linked help on all topics of SBench 6. To get specific help
on one part the F1 key can be pressed while pointing on the topic of interest.
SBench 6 Manual
Invokes the installed SBench 6 PDF manual which has more information about the features and functions of SBench 6 in it. This command
needs a PDF viewer installed to work.
Info
The info screen gives detailed information on the current SBench 6 version, the installed license and the versions of the used drivers.
Please check here to see whether you have installed the latest version of SBench 6.
Using the Info dialogue it is also possible to send a predefined support email which includes the installed versions of SBench 6 and the drivers.
Please use this email to give our support team the details that are needed to serve your request quickly.
34
SBench 6 Software Manual
SBench 6 Layout and Setup
File Settings
File Settings
The file handling and formats of SBench 6 can be individually set up to support the desired application in the best way possible. The powerful
settings described here are substantial for best performance and should be understood completely before changing details here.
The file settings are available from the menu „Settings“ -> „File Settings“ and are split up in four different pages:
Working Directory
This tab window includes all settings for the
working directory. To have fastest acquisition
possible it is necessary to select a directory on
the fastest hard disk (RAID array) inhere.
The field shows the current working directory
where all data from acquisition, calculation and
export is stored to. Please be sure to select a directory that is large enough to hold all data that
you like to store.
Using the „...“ button opens a standard file
dialogue to select a new data storage directory.
It is also possible to directly type the path into the
working directory field.
The button „Clear working directory“ will
erase all SBench 6 files from the working directory including data files, export files, screenshots
and temporary calculation results.
File Format
The file format tab window allows to select different file
formats for data storage inside SBench 6.
SBench 6 can directly store data into different binary file formats. This storage is used when activating FIFO
mode as well as when activating standard acquisition
mode. As all these offered file formats are pure binary
file formats without resorting or recalculation of data the
file data storage speed is similar on all formats.
As the default format SBench 6 contains most signal and
data information it is recommended to use this format.
However if doing long acquisitions it may be more suitable to directly stream to a data format that is supported
by third party products like pure binary or wave format.
When activating the „split at file size“ radio button
the data is written into split files of a defined length. The
data is consistent meaning that there is no gap between
the last sample of one file and the first sample of the next
file. Due to some file handling and header overhead using split files is slightly slower than using one big file for
all data. Please fill in the maximum file size into the according text field. After data storage has reached this
size the current file is closed and a next file is opened. All files except the one where data is currently stored to can immediately be accessed
by third party products making some parallel data storage and processing with third party products possible.
When activating the „Split at number of samples“ option the files are split into data files each containing exactly the defined number of
samples for all active channels. The file size itself can be estimated by multiplying the [number of samples] by [number of active channels]
by [bytes per sample]. Depending on the selected file type some additional bytes are needed for the file header. This option can be used to
have a defined time into one split file or to have a defined number of Multiple Recording segments into one split file.
(c) Spectrum GmbH
35
File Settings
SBench 6 Layout and Setup
Location
This tab defines the file location, name and the
file mode in which is stored.
The default mode „Store to cache“ tries to
keep data in the memory cache to speed up processing. Data files up to 1 MSample can be hold
in data cache. If more data is acquired it will be
automatically stored to a temporary file on hard
disk.
The „Store always to file“ mode of SBench 6
will always store data to one defined file. The
File settings of Point (4) to (6) define the behavior
of this mode.
The „Auto Store“ mode will generate a new
file on each acquisition run of SBench 6. Please
note that no files are deleted and your hard disk
may rapidly fill with data files if using this mode.
The different auto storage modes are programmed under point (7) and (8).
This field contains the data file name in
which data is stored every time. As a default the file is placed into the standard working directory which has already been documented above.
Using the „...“ button allows to select a new file name and location to store the data file to. The file name can also be directly changed
in the file name field under (4).
If checking the „Always overwrite“ box the selected file is overwritten automatically without any user requesting on each acquisition run.
Old data is the lost.
This auto storage mode will write a new file with date and time and index information on each acquisition. The file index is simply counted
from zero beginning with the first data acquisition. Date and time are taken from the system timer and will then allow to see the exact second
at which the acquisition data has been taken.
The second auto storage mode allows you to select a file name which may describe your experiment. SBench 6 will the add the file index
to this name on each acquisition run. To limit the number of files that should be stored to disk a „Maximum number of files“ can be defined.
If the maximum number of files is reached the index will be set back to zero and the waveform files are overwritten from the beginning (Round
Robin). Using this mode always the last xxx acquired waveforms are present on disk. Older waveforms are gone.
Preview
The preview tab window defines the automatic behavior concerning
calculation of preview data. The calculation of preview data may
need some time as all data of the last acquisition must be analyzed
and recalculated for the preview area. Using this setup one can define the desired behavior globally:
• „Ask to calculate preview data“: if selected the user is asked if
preview data of the last acquisition should be calculated as soon
as the data extends a certain length of acquisition.
• „Never calculate preview data“: the preview data is never calculated and the preview window will remain empty as soon as
the data extends a certain length of acquisition.
• „Always calculate preview data“: the preview data is calculated
in any case independent of the data acquisition length. This may
result in a couple of seconds or even a couple of minutes of preview data calculation on very long acquisitions.
36
SBench 6 Software Manual
SBench 6 Layout and Setup
Internal Settings
Internal Settings
The internal settings contain additional settings tabs that allow some professional setup of the SBench 6 engine and the behavior of SBench
6. Each group of settings like „Engine“ or „GUI“ is located on its own page.
Settings Dialogue
The dialogue shown on the right allows you to access all internal settings that may be changed. Please see further below for an explanation
of the different settings.
On top of the dialogue one selects the settings group that one wants
to change.
On the left the dialogue shows all settings that are available with
their short names. A brief explanation of the setting is available with the
tooltip function. Please just hoover the mouse cursor over the line containing the setting of interest and wait until the tooltip appears.
To change a setting one has to double click into the value field and
then has access to the available settings for that field.
The default button will reset all settings to the default state making
sure that SBench 6 is running stable again. The default settings are chossen to have the best streaming performance for differetn hardware
combinations.
To take over the changes one has to click the „Ok“ button. The „Cancel“ button will discard all changes and go back to the engine setup
that has been used before.
Engine Settings
The engine settings give access to internal settings of the SBench 6 engine. It can be used to optimize system performance and to get best
performance out of your system. In addition there are some special test modes implemented that help you examine the system performance
that can be reached and that help you to compare your system with reference systems and to locate bottlenecks inside the data chain.
In case that something went wrong with the settings and the system becomes unstable or the performance
drops extremely it is recommended to go back to default settings before proceeding any further.
The below list shows all available setting that has been in the setup dialogue at the time this manual was updated last. There may have be
additional settings added in between.
Setting Name
CacheAutoSetup
CacheRawData_MB
Affects
Acquisition and Generation
Acquisition and Generation
CacheRawTimestamp_MB
CacheRawABAData_MB
WaitCardReady
Acquisition
Acquisition
Acquisition
SimulatedHDWrite
Acquisition
OutputWrapAround
Generation
BufferAutoSetup
Acquisition and Generation
BufferBlockSize_kB
Acquisition and Generation
BufferSWBuf_kB
Acquisition and Generation
BufferHWBuf_kB
Generation
FIFOSpeedTest
Acquisition and Generation
Explanation
All cache settings are done automatically by SBench 6. This setting has to be set to „False“ if the cache settings (CacheRaw...) below are overwritten. If the CacheAutoSetup is „True“ any changes to the cache settings will be ignored.
This setting defines the cache size for the raw A/D and D/A data inside SBench 6. Using a larger cache size will
result in a more stable hard disk data transfer and will reduce any buffer overruns or underruns caused by a hard disk
with non-linear transfer speed behavior. Please note that the CacheAutoSetup must be turned off if changes are made
to this setting.
This setting does the same as „CacheRawData_MB“ for the timestamp data acquired by the hardware
This setting does the same as „CacheRawData_MB“ for the ABA data acquired by the hardware
If set to „True“ the engine will wait until all data has been acquired to on-board memory before transferring data to the
PC. This eliminates any bus transfers during acquisition and leaves the bus free for other tasks as long as the acquisition is running.
If set to „True“ all hard disk writes are just simulated and not executed. This setting allows to determine the system performance between hardware, card memory, PC memory and SBench 6 data handling. It is useful to determine whether
the hard disks itself are the bottleneck if streaming mode doesn’t reach the performance expected.
If the end of an output file is reached and the programmed output length has not been reached the output again starts
from the beginning of the output file leading to a wrap-around of the data. If the option is disabled the output will automatically finish at the end of the output file.
All buffer setting are done automatically by SBench 6. This setting has to be set to „False“ if buffer settings
(BufferBlockSize_kb, BufferSWBuf_kb and BufferHWBuf_kb) below are overwritten. If the BufferAutoSetup is „True“
any changes to the buffer settings will be ignored.
The buffer block size is the size after which an interrupt is emerged. In the hardware manual this is found as „NotifySize“. This block size is heavily affecting the system reaction and overall transfer performance. The buffer block size
should be selected to a large value like 256k if very fast data acquisition is running which may stress the system to the
edge of the performance. If using slow data acquisition with only a few channels this setting should be set to a small
value like 16k or 8k to increase the update rate of the system.
Please note that the BufferAutoSetup must be turned off if changes are made to this setting.
This setting defines the size of the DMA buffer where data from/to card memory is transferred to/from. The larger the
DMA buffer is defined the more stable the transfer from card to PC memory is running.
This settings is only used on generator cards. It defines the internal size of the hardware buffer which affects the
latency between start of data transfer and start of output. Please see the hardware manual of the generator card to get
more details on the usage of the hardware buffer size.
If set to „True“ the hardware is set to a special FIFO speed test mode where data is transferred as fast as the bus interface allows it. No real data is acquired then. Using this mode will show you the maximum performance the hardware
can reach in your system. Please be sure to set this test mode back to „False“ after finishing a speed test. Otherwise
you will only see corrupted data.
(c) Spectrum GmbH
37
Internal Settings
SBench 6 Layout and Setup
Setting Name
StopAtABAOverrun
Affects
ABA Acquisition
ConvOutputOnDisk
Generation
DataPrefetch
Generation, Display, Calc
Explanation
If enabled the complete acquisition will automatically stop if the slow A-data of the ABA mode has an overrun and
data is lost there. If disabled the acquisition of the fast B-data will continue even if the A-data gets lost. As a result one
than has fast B-data without any slow A-data around it at the end of the acquisition data.
If active, output data that is imported from any source is converted completely and stored to disk in a file format that
the selected output card can directly use. The advantage is that there’s no conversion delay when pressing the start button. The disadvantage is the conversion delay and disk space usage after assigning the output data to the output channel.
Data is prefetched from disk to speed up all data handling. Not yet tested in detail, may lead to invalid data if activated.
GUI Settings
These settings allow to define the general GUI behavior on a detailed level.
The below list shows all available setting that has been in the setup dialogue at the time this manual was updated last. There may have be
additional settings added in between.
Setting Name
DisplayRAWData
Affects
Display Windows
DisplayCustomUnitRawData
UnlimitedZoom
Display Windows
Display Windows
38
Explanation
If enabled the raw data values are shown in addition to the voltage/unit values. Raw data represents the very exact
acquired value in integer or hexadecimal value without any scaling or re-calculation on it.
Set to true if you want to see the voltage values for cursor on channels with custom units.
If activated one can zoom-in into the signal area of a display windows with now limits even if at the end only a single
sample is visible in the full screen. Activating this option the maximum zoom level is limited to a reasonable zoom
stage.
SBench 6 Software Manual
Hardware Setup Dialogues
Hardware Setup Dialogues
This chapter explains all hardware related settings of SBench 6. Please note that SBench 6 is an universal software that supports several
different card families. Therefore the inhere described setup windows may contain settings that are not suitable for your hardware. Please
just ignore the settings that are not available on your special hardware.
The hardware setup dialogues are per default shown as tabbed windows on screen. Each hardware dialogue can simply be moved to other
locations as a docking window or even as a free floating window by dragging the window to the desired location.
Running Hardware
The hardware can be started in different modes also known from oscilloscopes. The run commands are accessible from the menu as well as
from the main toolbar or even through short-cuts:
Singleshot
Using this command the hardware is started once with the current setup and will do a single acquisition. After end of this acquisition the
hardware is stopped and will wait for the next acquisition.
Loop
This command starts the hardware in a loop. After one acquisition is done the hardware is immediately started again for the next acquisition running in loop mode. Signal display is updated after each acquisition run.
Stop
The stop command stops a previously started acquisition loop. The current acquisition will be finished when pressing the stop button. After
pressing this button once it will change to the „Abort“ button allowing to even abort the currently running last acquisition. The hardware
is in idle state again. The loop can also be stopped pressing the loop button again.
Abort
The abort button aborts the current acquisition immediately with all data acquired so far being lost.
Force Trigger
This command forces a trigger on the hardware. If the hardware is waiting for a trigger event that is not detected a force trigger command
will issue a software trigger to the hardware allowing to finish the acquisition without losing previously acquired data.
Reset Hardware
This command issues a reset command to the connected hardware in case that something with the programming went wrong. Using a
reset command brings the hardware in a defined state as also present directly after system start. If logging driver commands for comparison with own programming a reset command is recommended to have both hardware settings based on the very exact same level.
Trigger Enable
If supported by the hardware this command allows to disable and enable the complete trigger engine on the hardware while already
running. If multiple trigger events are processed (e.g. Multiple Recording or Gated Sampling mode) and the trigger is disabled the hardware will ignore all trigger events until enabled again.
Calibration
This command starts the internal calibration routines of the hardware. Results and commands are shown in a separate window showing the
calibration progress and the reached results.
Easy Generator
The Easy Generator is a simple tool to generate waveforms for arbitrary waveform generator cards. It can only be used together with
these AWG cards (D/A cards) and allows to generator different pre-defined waveforms with different amplitudes, offsets and frequencies
as simple benchtop generators do.
When starting the hardware for data acquisition the current settings of the hardware setup dialogues explained in this chapter are used.
While running the hardware in a loop one can change the settings on the fly. New settings are immediately used for the next acquisition to
start.
(c) Spectrum GmbH
39
Input Channel Dialogue
Hardware Setup Dialogues
Input Channel Dialogue
The channel dialogue is the main dialogue for handling all data channels and for setting up all input related settings. The channel dialogue
also contains calculated signals and loaded signals. From here signal channels are dragged to display windows to show data there. The
main features of the channels dialogue are:
•
•
•
•
•
•
•
•
Activating/Deactivating input channels for acquisition
Setting up the input channel related hardware settings
Dragging channels to display windows
Changing signal color
Access to calculated signals
Access to loaded signals
Combining of digital signals to a bus
Changing Device Names
The setup dialogue stays on screen and changes will immediately take effect. The dialogue can either be docked to other setup dialogues,
can be placed somewhere on the screen (or even on a second screen) when using the freely floating version of it or can be hidden using one
of the „Toggle“ commands.
Please see the chapter „Arranging Setup Windows“ to see how the setup window can be placed at different locations and how the show
and toggle commands work.
Overview
For demonstration purposes we installed a demo card with two analog input channels and eight digital input channels.
The analog hardware channels have their own top level folder
( ) grouping all analog input channels of all installed cards (including demo cards). The folder can be extended by using the button
or hidden using the button.
Beneath the top level tree all cards (one M2i.3027 in our example) are listed with their input channels. The serial number of the card
is also shown to separate between multiple cards of the same type.
Beneath each card all analog input channels are shown with a
brief overview of the analog input settings that are accessible at the
moment inside a table. The columns of the input settings table may
be changed by the user as explained later on.
The digital inputs - if available on your hardware - have their own
tree ( ) showing all digital input channels. The folder can be extended by using the button or hidden using the button.
Digital input channels are grouped for their hardware as the analog channels are.
Beneath each card all digital input channels are shown with a brief overview of the digital input settings if there are some. In our example
the digital input channels are passive channels without any additional settings available.
The imported channels have their own top node. Imported channels are grouped by file they’re loaded from. The type of loaded signal
can be seen by the image that is shown in front of the signal name.
Calculated signals are also shown under a separate top node. They are grouped by the type of signal. In our example there are two
calculated FFT signals.
40
SBench 6 Software Manual
Hardware Setup Dialogues
Input Channel Dialogue
Activating/Deactivating Input Channels for Acquisition
Each channel can be individually activated or deactivated for the next acquisition. Please note that some cards have higher sampling rates
if only a part of the channels is used for acquisition. In that case the higher sampling rates are available as soon as some channels are deactivated. Please also note that the on-board memory of the cards is shared between all activated channels leaving more memory for a single
channel if less channels are activated.
Directly
A single channel can be activated or deactivated by pointing on the
channel name using the mouse wheel to change between activated
and de-activated. As an alternative one can also change the channel
activation by using the middle mouse button. A double click on the
channel name will activate the setup dialogue as shown further below.
Channel 0 is activated showing the input connector symbol with
no cross on it.
Channel 1 is de-activated showing the input connector symbol crossed out.
Using Context Menu
Input channels can also be activated or de-activated using the context menu of the inputs. This context menu has the advantage that it also
operates on group of channels or on complete sub-trees like all analog inputs of one card or even all inputs of one group (analog/digital)
together. The context menu is accessed using a right mouse click on the input channel selection one has made.
Multiple channels can be
selected in different ways:
Selecting the root tree element („Analog Input“ or
„Digital Input“) will select
all channels of that type for
further setup.
Selecting a whole card will
affect all channels of that
particular card.
Selecting a single channel
will only affect this single
channel then.
All these kinds of selections
can be combined by using
the CTRL (non adjacent
channels) or the SHIFT (adjacent channels only) key
while left clicking on the entries. With the help of the
CTRL and SHIFT keys multiple channels or multiple
cards with their channels
can be selected for further
setup or dragging.
Using the right mouse on the channel selection will open a context menu which allows to select the enable/disable state of the selected channel as well as some other settings. The current activation state is shown by a check next to the enable/
disable command.
(c) Spectrum GmbH
41
Input Channel Dialogue
Hardware Setup Dialogues
Input Channel Hardware Setup
All input channel related settings are available through the channel dialogue. It is possible to access single channel settings as well as multiple
channels. Channel input settings are most likely to be changed during measurement work and are therefore easiest to access in different ways
for a fluent workflow. The following sub-chapters will show the different ways how to access the settings.
When using multiple cards of different types each card type may have different input settings available. Settings that are not available for one card type are simply marked with a „---“ and are not changed when
accessing this input.
Setting up the displayed columns
The columns of the channel dialogue gives you an overview of all current settings and
allows you to directly change the settings as explained further below.
However in some cases there may be settings that you will never alter at all and that
just occupy view area of your screen. To de-select columns just right clock somewhere
in the columns header and check/uncheck the columns that should be shown.
The same stting is also available via the context menu. The context menu is called by
right clicking on an entry. The last entry of the context menu „show“ allows you to
select the columns that are shown inside the channel dialogue.
The changes will affect the display immediately and shown columns are also stored
in the user settings file.
Changing Settings with Context Menu
Besides the Enable/Disable capabilities one also has the opportunity to change
the input settings using the context menu. All available settings (as listed in the
columns of the channel dialogue) form an entry with sub-entries in the context
dialogue. Using the context dialogue it is possible to change settings of one
channel, multiple channels, all channels of one card or even all input channels
of one type as shown in the above chapter.
Beneath each entry listed in the context menu are all settings that are available
for this entry. Clicking on one selection will change all marked channels to use
that setting. In our example we see all channels of the card being set to +/100 mV input range.
The currently selected setting is shown with a check if all channels are actually
set to the same setting. If the channels have different settings no check is shown.
Clicking on one setting will of course then change all channels to use the same
setup.
Additional context menu commands
Besides the enable/disable commands and the input settings there are some
more additional commands that can be invoked directly from here. The commands are explained in more detail in the dedicated chapters.
Command
Calculation
Copy as Reference
Add to displays
Remove from displays
Settings...
Change colors...
Description
Invokes a calculation for the current channel selection. Located beneath the calculation command are all available calculations for the selected channel(s). After invoking the calculation some further dialogues will open to set up the calculation details.
Generates a copy of the current signal that can be used as a reference for further acquisitions. The copied signal is shown inside the channel dialogue
and can be dragged to a display.
The current signal selection is added to all matching displays that are currently shown inside SBench 6. You can also add signals to a display by dragging them with the left mouse button pressed to the target display.
The current channel selection is removed from all displays where it is currently shown.
Calls the setup dialogue for the current channel selection. this can also be done by double clicking on the channel. See the next sub chapter for more
explanation on the setup dialogue.
Changes the color for the current signal selection. Please note that the color of all selected signals will be the same if using this command for multiple
channels.
Changing Settings with Mouse Scroll Wheel
When working interactive in laboratory work or research it is often necessary to change some input parameters like termination or input range
frequently. For these applications the mouse wheel allows a very fast access to settings. Just marking the appropriate column with left mouse
button and using the wheel steps through all settings available. It is possible to access single channels, whole cards or even all analog inputs
with this method:
42
SBench 6 Software Manual
Hardware Setup Dialogues
Input Channel Dialogue
Marking one channel will only change the setting of that channel independently
from the other. In the example on the right the „termination“ column is marked
and any mouse wheel change the termination between 50 Ohm and 1 MOhm.
It is also possible to mark multiple channels to access the setting of multiple channels at the same time with the mouse wheel. Marking multiple channels is explained above. Please note that you need to mark the channel at the position of
the setting that you like to change afterwards.
Marking the card name with the mouse button allows to access all channels of
that card with just one mouse wheel turn. In the example on the right the „termination“ column is marked and one can change between 50 Ohm and 1 MOhm
termination.
If channels have different settings at the beginning the first turn of the mouse
wheel will change the setting of the first channel to the next setting and will automatically set all other channels to the same setting. Starting with the second
mouse turn all channels will change settings simultaneously.
Even all inputs of one group (Analog Inputs or Digital Inputs) can be changed
simultaneously with the mouse wheel. Please mark the appropriate root line at
the column position that you like to change.
If channels have different settings at the beginning the first turn of the mouse
wheel will change the setting of the first channel to the next setting and will automatically set all other channels to the same setting. Starting with the second
mouse turn all channels will change settings simultaneously.
Changing Settings with Setup Dialogue
Double clicking on an input channel (outside the enable/disable area) will invoke the setup dialogue of the current channel selection. The
same setup dialogue can be invoked using the context menu „Settings...“ entry. In the dialogue all settings of the input channel including the
custom unit can be defined. The custom unit is explained later in this chapter in more detail.
Multiple channels are selected with the setup dialogue by first making the channel selection as explained above and then double clicking on
one of the channels while still holding the CTRL/SHIFT key.
In the name field the name of the selected
channel(s) are shown all together. The setup
dialogue will only work on the channels
shown here. If a single channel is selected the
channel name can be changed here. The default channel remains under (3) and can be reset by pressing (4)
The „color“ button let you select a display
color for the signal. This color is used everywhere throughout SBench 6.
Please note that the color of all selected signals will be the same if using this button for
multiple channels.
Inhere the default channel name is shown.
The name can be reset to default by using the
button to the right.
Using the „Reset Name“ button will reset
a changed channel name to the default name.
In this area the input settings are shown.
Please note that you will see all input settings that are available for the complete Spectrum data acquisition card range here. Input settings
that are not supported by your hardware are disabled and shown in gray.
The input setting area shows the current setup if all channels have the same setup. If channel setup is differing it will show a default setup.
Changes made here will affect all selected channels.
The „Set Custom Unit“ checkbox will enable the custom unit settings. If checking this box the settings under (7) will be available and can
be altered. The signal will then have a custom scaling and unit as explained in more detail in the next sub-chapter.
The custom unit settings area is available as soon as the „Set Custom Unit“ checkbox is activated (6). Please see the next sub-chapter for
details on custom scaling and units.
(c) Spectrum GmbH
43
Input Channel Dialogue
Hardware Setup Dialogues
Custom Specific Scaling and Units (Professional Version)
In real life applications the input signals normally represents some kind of sensor signal. The sensor scales a physical unit to a voltage output
which is then acquired by the hardware and shown in the measurement displays. Using the custom specific scaling and unit allows to re-scale
the input signal showing the exact physical value that is represented by the voltage level. A second application area for the scaling is the use
of oscilloscope probes with integrated attenuators. The custom scaling can also re-scale the attenuator of the probes to show real world values
then.
The custom scaling and unit is used everywhere in SBench 6. The scaled signal will be shown with the custom scaling in the displays, measurement cursors will show the custom scaling and unit as well as calculation functions like average or minimum, maximum.
The „Set Custom Unit“ checkbox will enable the custom
scaling and unit settings. If disabled the pure voltage levels
of the analog input will be shown.
The source amplitude will show which voltage signal level is re-scaled. The voltage levels inhere do not need to correspond to the selected input range as the scaling is done
based on the voltage level. The maximum voltage level inserted here is scaled to the maximum custom value (3) and the
minimum voltage level inhere is scaled to the minimum custom value (3)
Please note that source values are expected in mV for the scaling.
The custom value base shows the re-scaled values that are used instead of the source amplitude values (2). Custom minimum and maximum values are given in the selected unit. Please enter a minimum custom value that should be used instead of the minimum amplitude and
a maximum custom value to be used instead of the maximum amplitude.
The custom unit entry defines the unit that is used throughout SBench 6 for the scaling. Please note that the unit is just a name and is not
checked for consistency.
Make sure to only enter the basic form of the unit not using any qualifier as SBench 6 will add qualifiers
automatically. If for example 1 V is scaled to 200 mA please enter 0.2 A as scaling and not 200 mA. SBench
6 will automatically change the A to mA for values beneath 1.
The probe/amplifier buttons will set the custom scaling to a selected attenuator/amplifier. Pressing one of the probe/amplifier buttons
will use the currently selected input range as a source amplitude (2) and will then set the custom value to a scaling factor of either 1:1, 1:10,
1:100, 20 dB, 40 dB, 60 dB, 80 dB or 100 dB. The custom unit is set back to Voltage. The 1:1 probe button can also be used to set a default
scaling which is then defined in more detail.
Changing the Device Name
When using several cards in one system it is useful to change the names of the cards
according to the used cabling. A simple example may be to just number all cards in
a system from left to right to know which channel is located where at the connection
panel. Unfortunately the PC itself doesn’t give a defined location info. As a default
SBench 6 is showing the card type and the serial number as a device name. This can
be changed to any name that may be suitable for the user.
44
SBench 6 Software Manual
Hardware Setup Dialogues
Input Channel Dialogue
Please use the following steps for changing device name:
•
•
•
•
•
Select the card which name should be changed
Right click to open the context menu
Select the „Change device name...“ command
Give a new name to the device.
Press ok button
Showing information of loaded signals
After loading/importing a signal it is possible to read out and display all channel
information that has been found inside the file. This function is also available for
activate channels of acquisition cards.
Please use the following steps to show the channel information:
•
•
•
•
•
Go to the Input Channels dialog
Select the channel of interest with the mouse
Right click to open the context menu
Select the „Info ...“ command
A popup dialog will appear showing all channel information in list form
(c) Spectrum GmbH
45
Input Channel Dialogue
Hardware Setup Dialogues
Combination of Digital Signals to a Bus
SBench 6 handles digital signals as single signals allowing to add them individually to multiple displays. However as digital signals often represent a bus structure, be it address bus or data bus, it is more comfortable to view these digital
signals as a combination and not as single signals. Using the Channel Dialogue it is possible to add bus combinations to digital signals and use them like
a signal itself.
The bus combination is done by marking all single signals that should be combined with left mouse button and either SHIFT or CTRL key then invoking the context menu and using the combine command.
All signals that should be combined are marked with the mouse. One bus can
combine at maximum up to 64 digital channels.
A right mouse click will open the context menu. The context menu shows the
bus combine command as soon as more than one digital signal has been marked
with the mouse. Issuing the „Combine signals to bus“ command will open a separate dialogue as shown below.
Already defined buses are listed under their own root node also showing all signals that have been combined into this bus.
After issuing the combine command the dialogue shown on the right
will open up and allow to define more details on the new bus signal:
A name can be given to the signal that defines the bus and that is
used in the digital display window.
The bus signal color can be selected from all available system colors by clicking on the color button.
Defines the bit ordering of the signal for calculation of the bus values. Choose which bit of the bus is the most significant one (MSB) and
which one is the least significant one (LSB)
The display format defines how the value is calculated for display.
Choose one of the available formats for display:
•
•
•
•
•
HEX = hexadecimal view (base 16)
BIN = binary view (base 2)
OCT = octal view (base 8)
SIGNED = signed integer value (base 10)
UNSIGNED = unsigned integer value (base 10)
The „subordinate“ checkbox will group the single channels under the new bus signal inside the channel dialogue making it immediately
visible where these channels belong now. Uncheck this box if you like to group single channels into multiple buses.
If „Add bus to displays“ is checked the new bus signal will be automatically added to all open digital display windows without the need
to manually drag and drop them to the display.
When checking the „Remove signals“ box all signals that have been combined for a bus will no longer be visible as single signals. This
is a good choice if one has a huge number of digital signals and wants to improve the clearness of the channel dialogue. Even if removed
from the original list the single digital signals are still accessible under the newly generated bus name.
46
SBench 6 Software Manual
Hardware Setup Dialogues
Input Mode Dialogue
Input Mode Dialogue
The mode dialogue allows to set up the basic acquisition and replay mode as well as the memory, pre- and posttrigger settings. The mode
dialogue is available in two different formats depending on the selection taken. The common mode dialogue is standard for one single card
as well as for a group of multiple cards. All settings are similar for all cards when using this mode dialogue. If using multiple cards in one
system the mode dialogue may be switched to an individual mode dialogue allowing to give each card individual memory settings.
The setup dialogue stays on screen and changes will immediately take effect. The dialogue can either be docked to other setup dialogues,
can be placed somewhere on the screen (or even on a second screen) when using the freely floating version of it or can be hidden using one
of the „Toggle“ commands.
Please see the chapter „Arranging Setup Windows“ to see how the setup window can be placed at different locations and how the show
and toggle commands work.
Common Mode Dialogue
The common mode dialogue is the standard for single cards as well as for multiple cards. When using this mode with multiple cards all cards
will use the same settings.
Please note that depending on the selected mode some of the input fields are disabled and greyed off as shown in the screenshot.
The main acquisition mode is shown on top.
Changing this mode will affect all entry fields of
the mode dialogue. Please note that inhere only
modes are shown which are supported by all
hardware and which are installed on the card.
The FIFO (streaming) based modes need the
SBench 6 Professional version to be selected.
These (up to) four input fields form the memory settings. Depending on the selected mode
some of them will be disabled and not visible.
Values are entered in either samples or time unit.
Switching between the both inputs is done using the Samples/Time button (3).
One can select one of the pre-defined values from the drop-down list of the field or one can enter any value directly into the field. SBench 6
will then change this value automatically to the nearest matching value taking the modifier into account as shown under (3). A third method
of entering values is the usage of the up/down buttons just right next to the field. These buttons will go step by step through the valid values
of this field and allow a very fine tuning of the memory settings.
In front of some input fields are lock symbols. If a value is locked ( ) it will stay at this value when changing the other input fields. If an input
field is unlocked ( ) it will automatically change when changing other input fields. As an example: in standard single record mode the memsize value is locked and Pre-Trigger and Post-Trigger are unlocked. Changing Pre-Trigger will now adopt automatically Post-Trigger while
Memsize will stay as before. Locking Post-Trigger will unlock Memsize. If now changing Pre-Trigger Memsize will be adopted automatically
while Post-Trigger stays fixed.
Depending on the selected mode the input fields have the following meaning:
Selected Mode
SBench 6
License
HW-Option
Required
Memsize/Segment
Number of
Segments/Gates
Pre-Trigger/Pre-Gate
Post-Trigger/Post-Gate
Standard Single
Base
none
Defines the length of the
acquisition per channel
not used
Standard Multi
Base
Multiple Recording
Defines how many segments
should be acquired
Standard Gate
Base
Gated Sampling
Defines the amount of data
to be acquired on one trigger event
Defines the overall length of
the acquisition per channel.
Standard ABA
Base
ABA Mode
FIFO Single
Professional
none
Defines the number of samples to be acquired AFTER
the trigger event
Defines the number of samples to be acquired AFTER
the trigger event
Defines the number of samples to be acquired AFTER
the gate ends
Defines the number of samples to be acquired AFTER
the trigger event
not used
FIFO Multi
Professional
Multiple Recording
Defines the amount of data
to be acquired on one trigger event
FIFO Gate
Professional
Gated Sampling
not used
FIFO ABA
Professional
ABA Mode
Defines the amount of data
to be acquired on one trigger event
Defines the number of samples to be acquired BEFORE
the trigger event
Defines the number of samples to be acquired BEFORE
the trigger event
Defines the number of samples to be acquired BEFORE
the gate starts
Defines the number of samples to be acquired BEFORE
the trigger event
Defines the number of samples to be acquired BEFORE
the trigger event
Defines the number of samples to be acquired BEFORE
the trigger event
Defines the number of samples to be acquired BEFORE
the gate starts
Defines the number of samples to be acquired BEFORE
the trigger event
Defines the amount of data
to be acquired on one trigger event
Defines how much data is
acquired until the FIFO mode
stops
not used
Defines how many segments
should be acquired
not used
Defines how many segments
should be acquired before
FIFO mode stops
Defines how many gate segments should be acquired
before FIFO mode stops
Defines how many segments
should be acquired before
FIFO mode stops
(c) Spectrum GmbH
Defines the number of samples to be acquired AFTER
the trigger event
Defines the number of samples to be acquired AFTER
the gate ends
Defines the number of samples to be acquired AFTER
the trigger event
47
Input Mode Dialogue
Hardware Setup Dialogues
Please note that not all options are available on all hardware series. If a hardware option is not installed the mode won’t be shown in the
drop-down list.
The Samples/Time button allows to switch between samples entry and time entry for all input fields like memsize, segment, pre-trigger
and post-trigger. When switching between the modes the currently selected value will be recalculated and shown in the new unit then.
If selected to samples input the field will
accept pure samples values or entries with a
samples modifier input of „k“, „M“, „G“:
192 S
16 kS
4 MS
2 GS
192 Samples
16 kilo Samples = 16 x 1024 = 16384 Samples
4 Mega Samples = 4 x 1024 kS = 4 x 1024 x 1024 Samples
2 Giga Samples = 2 x 1024 MS = 2 x 1024 x 1024 x 1024 Samples
If selected to time input the field will accept
pure time values which are recalculated to
samples value automatically using the currently selected sampling rate. Time values are entered as seconds or fractions of. The modifiers „m“, „u“, „n“ are accepted.
10 s
10 seconds
20 ms
20 milli seconds = 0.020 seconds
30 us
30 micro seconds = 0.03 ms = 0.000030 seconds
500 ns
500 nano seconds = 0.5 us = 0.0000005 seconds
When using another modifier than allowed for the current entry mode the field will automatically switch to the other entry mode.
The ABA divider is only available if the ABA mode has been selected. It defines the dividing factor between fast B-data and slow A-data.
Please see the hardware manual for further details on the ABA mode.
This button is only available if multiple cards are controlled by SBench 6. Pressing this button will switch the mode dialogue to the individual setup as shown in the next sub-chapter.
Individual Mode Dialogue
This dialogue is only available if multiple cards are used in SBench 6. The Individual Mode Dialogue only needs to be used if the cards should
be programmed to different settings. If all cards should run with a similar setup one can use the Standard Mode Dialogue as shown above.
After pressing the „Individual Settings“ button the dialogue will change to a table based entry with one line
for each card that is in the system. For better understanding are all sub areas of this dialogue given the
matching numbers as already used in the Standard
Mode Dialogue above.
Definition of the general acquisition mode as explained above.
The settings table for the individual card setup.
Each card has it’s own line with all available settings.
The table shows three columns depending on the selected mode. Clicking on the serial number of the card will show the card type for a few
seconds in the top left corner of the table.
To change the entries of the table it is necessary to first activate the table cell for editing by double clicking on the value. Afterwards the one
table cell will turn into a standard input field allowing the same editing features as explained above. In our screenshot the Post-Trigger value
of SN 100000 is currently opened for editing.
The Samples/Time switching button as explained above.
The ABA mode divider as explained above.
De-activating the „Individual Settings“ button will switch back to the Standard Mode Dialogue that is shown above. The individual settings
of each card will be store and are available again if switching back to Individual Mode Dialogue.
48
SBench 6 Software Manual
Hardware Setup Dialogues
Clock Dialogue
Clock Dialogue
The clock dialogue allows to set up all clock related settings including the sample rate and multiple cards running with different divided sampling rates. Depending on the used hardware the clock dialogue may look a little different with less options available.
Please note that the available sampling rates may depend on the currently selected channels. Some cards
like M3i.4142 or M2i.3025 or others allow higher sampling rates when only activating half of the channels.
To access these higher sampling rates it is necessary to de-activate the channels inside the Channel Dialogue
first. Afterwards the higher sampling rates are available in the clock dialogue.
The setup dialogue stays on screen and changes will immediately take effect. The dialogue can either be docked to other setup dialogues,
can be placed somewhere on the screen (or even on a second screen) when using the freely floating version of it or can be hidden using one
of the „Toggle“ commands.
Please see the chapter „Arranging Setup Windows“ to see how the setup window can be placed at different locations and how the show
and toggle commands work.
Depending on the selected clock mode the dialogue will slightly change and offer different settings elements. The three different clock dialogues that may be shown are handled separately:
Internal Clock Modes
When switching the card to one of the internal clock modes one of
the dialogues on the right is shown. The top level dialogue is shown
for single cards only. The bottom level dialogue is shown if multiple
cards are located in the system and these cards support the usage of
different sampling rates per card.
This setting is only available if multiple cards are used. Inhere one
selects the master card that generates clock information for all other
cards. If using external clock be sure to have the clock signal connected to the selected card. All settings (2), (3) and (4) are made for the
master card only. Slave card settings are located in (6).
The clock mode is defining the additional settings needed. In this
sub-chapter all internal clock modes are shown. External and reference clock modes are shown in the next sub-chapters.
One selects a clock mode from the drop down list. The list shows all
clock modes that are available on the selected master card.
When using internal clock mode one has to select the clock mode
from one of the pre-defined entries in the drop-down list. One may
also enter the desired clock into the input field allowing SBench 6 to
select the nearest matching clock that is supported by the hardware. As a third way one may use the up/down arrows to go in 1% steps of
the currently selected clock range up and down.
The Clock/Time button allows to switch between clock entry (Hertz) and time entry for manual clock entry. When switching between the
modes the currently selected value will be recalculated and shown in the new unit then.
If selected to clock input the field will accept pure
Hertz values or entries with a frequency modifier
input of „k“, „M“, „G“:
200 Hz
150 kHz
2 MHz
1 GHz
200 Hertz
150 kilo Hertz = 150000 Hertz
2 Mega Hertz = 2000000 Hertz
1 Giga Hertz = 1000000000 Hertz
If selected to time input the field will accept pure
time values which are recalculated to clock value
automatically. Time values are entered as seconds
or fractions of. The modifiers „m“, „u“, „n“ are accepted.
10 s
10 seconds (10 mHz)
20 ms
20 milli seconds = 0.020 seconds (50 Hz)
40 us
40 micro seconds = 0.04 ms = 0.000040 seconds (25 kHz)
500 ns
500 nano seconds = 0.5 us = 0.0000005 seconds (2 MHz)
When using another modifier than allowed for the current entry mode the field will automatically switch to the other entry mode.
Checking this will enable the clock output of the internally generated sampling clock. The output clock may be a multiple of the sampling
clock due to card structure and ADC restrisctions. The clock frequency that is available at the connector is shown next to the output checkbox
as figure as soon as the output is activated. Please be sure not to connect a input signal at the same time to the I/O connector.
This setting is only available if multiple cards are used: inhere one can select a different sampling rate for each slave card. The „SampleRate“ setting shows the sampling rate this slave card is running with. The „Divider“ value shows the internal divider value. One may change
either of these to get a divided sampling rate. Please note that the available divider values are limited depending on the used hardware.
Details on the available divider values are shown in the hardware manual.
(c) Spectrum GmbH
49
Clock Dialogue
Hardware Setup Dialogues
External Clock Modes
When switching the clock mode to one of the external clock modes
the clock dialogue will slightly change showing some new additional
settings that have to be set correctly for operation. There again is a
single card dialogue as well as a multiple cards dialog. The operation of these is similar to the internal clock mode allowing us to only
show the single card dialogue here and concentrating on the differences in clock mode:
The clock mode is defining the additional settings needed. In this
sub-chapter all external clock modes are shown. Internal clock and
reference clock modes are shown in the previous and the next sub-chapters.
The Clock/Time button allows to switch between clock entry (Hertz) and time entry for external clock entry (3). When switching between
the modes the currently selected value will be recalculated and shown in the new unit then.
If selected to clock input the field will accept pure
Hertz values or entries with a frequency modifier
input of „k“, „M“, „G“:
200 Hz
150 kHz
2 MHz
1 GHz
200 Hertz
150 kilo Hertz = 150000 Hertz
2 Mega Hertz = 2000000 Hertz
1 Giga Hertz = 1000000000 Hertz
If selected to time input the field will accept pure
time values which are recalculated to clock value
automatically. Time values are entered as seconds
or fractions of. The modifiers „m“, „u“, „n“ are accepted.
10 s
10 seconds (10 mHz)
20 ms
20 milli seconds = 0.020 seconds (50 Hz)
40 us
40 micro seconds = 0.04 ms = 0.000040 seconds (25 kHz)
500 ns
500 nano seconds = 0.5 us = 0.0000005 seconds (2 MHz)
When using another modifier than allowed for the current entry mode the field will automatically switch to the other entry mode.
The driver needs to know what external clock is fed in to set up the hardware correctly for the clock. Enter the external clock rate as
precise as possible to select the correct external range. This value is also used to scale the x axis of the signal correctly. The signal display
as well as calculations and export functions need to know the exact external clock frequency to show correct values.
This field shows the selected external clock range as written to hardware. The external clock range is automatically selected by the driver
based on the entered external clock frequency (3). Please check with the hardware manual to understand external clock ranges.
This checkbox activates the clock input termination. Especially high frequency clocks may need a correct termination to avoid noise and
overshoot/undershoot. Please be sure that your external clock source is capable of driving the load.
Reference Clock Modes
The reference clock mode is a kind of special external clock mode
where the internal clock is derived from the external clock by the usage of a PLL. Therefore the clock dialogue has an additional input
field:
The clock mode is defining the additional settings needed. In this
sub-chapter the reference clock mode is shown. Internal and external
clock modes have been shown in the previous sub-chapters.
The Clock/Time button allows to switch between clock entry
(Hertz) and time entry for clock (3) and reference clock entry (4). When switching between the modes the currently selected value will be
recalculated and shown in the new unit then.
If selected to clock input the field will accept pure
Hertz values or entries with a frequency modifier
input of „k“, „M“, „G“:
200 Hz
150 kHz
2 MHz
1 GHz
200 Hertz
150 kilo Hertz = 150000 Hertz
2 Mega Hertz = 2000000 Hertz
1 Giga Hertz = 1000000000 Hertz
If selected to time input the field will accept pure
time values which are recalculated to clock value
automatically. Time values are entered as seconds
or fractions of. The modifiers „m“, „u“, „n“ are accepted.
10 s
10 seconds (10 mHz)
20 ms
20 milli seconds = 0.020 seconds (50 Hz)
40 us
40 micro seconds = 0.04 ms = 0.000040 seconds (25 kHz)
500 ns
500 nano seconds = 0.5 us = 0.0000005 seconds (2 MHz)
When using another modifier than allowed for the current entry mode the field will automatically switch to the other entry mode.
Select the desired sampling clock that should be derived from the external reference clock. Please note that there may be limitations in
the clock section of the card that may not allow the very exact sampling clock that is desired. After entering the correct reference clock (4)
and the desired sampling clock SBench 6 will select the nearest possible sampling clock that can be generated by hardware.
This value is also used to scale the x axis of the signal correctly. The signal display as well as calculations and export functions need to know
the exact external clock frequency to show correct values.
The driver needs to know what reference clock is fed in to set up the desired internal clock based on this reference correctly. Enter the
reference clock rate as colsely matching as possible.
50
SBench 6 Software Manual
Hardware Setup Dialogues
Analogue Cards Trigger Dialogue
This checkbox activates the clock input termination. Especially high frequency clocks may need a correct termination to avoid noise and
overshoot/undershoot. Please be sure that your external clock source is capable of driving the load.
Analogue Cards Trigger Dialogue
The trigger dialogue allows to set up all trigger modes of the hardware. The powerful dialogues can set simple trigger like single external
source or even multiple trigger conjunction of several channels located on multiple cards.
General Trigger Setup
The general trigger setup shows the complete current setup in table form and allows to manipulate the trigger settings of every available
source. Trigger source settings can be either done directly in the table or using the Trigger Mode Setup as shown further below.
The setup dialogue stays on screen and changes will immediately take effect. The dialogue can either be docked to other setup dialogues,
can be placed somewhere on the screen (or even on a second screen) when using the freely floating version of it or can be hidden using one
of the „Toggle“ commands.
Please see the chapter „Arranging Setup Windows“ to see how the setup window can be placed at different locations and how the show
and toggle commands work.
The dialogue on the right shows a standard
trigger setup on two cards with a OR trigger
conjunction of two channels.
The general trigger mode allows to
switch between software trigger, single hardware source or the versatile multiple hardware sources with AND/OR mask based
trigger conjunction.
If selecting software trigger the card will immediately start acquisition after pressing the
start button.
The single source is intended for all applications where a single trigger source is sufficient. Selecting single source makes setup
easier as some setup elements are hidden.
The multiple hardware sources AND/OR
masked trigger allows to set up any trigger conjunction that is supported by hardware.
If selecting multiple hardware sources AND/OR mask trigger mode under (1) both check boxes are accessible. Inhere one can enable/
disable the two trigger source conjunctions globally without changing the detailed source setup. This is suitable if setting up a complicated
trigger conjunction and having the need to disable this for a short time without losing the setup.
The tabs of the table show the different trigger source groups. In our example we have external trigger sources available as well as channel trigger sources. Clicking on the appropriate page tab will bring the matching list to the front for setup. The setup inside the list itself is
saved and won’t get lost if changing the pages.
The „Auto Trig“ checkbox enables the auto trigger mode. In auto trigger mode the hardware will wait for a trigger event for the time
defined below the checkbox. After the time has elapsed the card will automatically generate a software trigger event and will issue one acquisition. After this software trigger the card will be re-armed (if running in loop mode) and will again wait the time defined until a trigger
event occurs. The time is programmed in milli seconds in the field below the check box.
The Delay field defines a trigger delay in either samples or time value depending on the setting of (6). The detected trigger will be delayed
by that value until forwarded to the acquisition firmware.
The Samples/Time button allows to switch between samples entry and time entry for pulse width and delay entries in the trigger table.
When switching between the modes the currently selected value will be recalculated and shown in the new unit then.
If selected to samples input the field will
accept pure samples values or entries with a
samples modifier input of „k“, „M“, „G“:
192 S
16 kS
4 MS
2 GS
192 Samples
16 kilo Samples = 16 x 1024 = 16384 Samples
4 Mega Samples = 4 x 1024 kS = 4 x 1024 x 1024 Samples
2 Giga Samples = 2 x 1024 MS = 2 x 1024 x 1024 x 1024 Samples
If selected to time input the field will accept
pure time values which are recalculated to
samples value automatically using the currently selected sampling rate. Time values are entered as seconds or fractions of. The modifiers „m“, „u“, „n“ are accepted.
10 s
10 seconds
20 ms
20 milli seconds = 0.020 seconds
30 us
30 micro seconds = 0.03 ms = 0.000030 seconds
500 ns
500 nano seconds = 0.5 us = 0.0000005 seconds
When using another modifier than allowed for the current entry mode the field will automatically switch to the other entry mode.
(c) Spectrum GmbH
51
Analogue Cards Trigger Dialogue
Hardware Setup Dialogues
The left column of the table shows the cards and the different channels which can be used as a trigger source. Pressing the button next
to the card type and serial number will expand the card channels for setup. Pressing the button will collapse the channel list of that card
again.
If using single sources an additional checkbox is available in front of each trigger source to select this source as the single source for the next
run.
A double click on the trigger source name will open the enhanced Trigger Mode dialogue which is explained in more detail in the next subchapter.
If selecting AND/OR masked trigger the different trigger sources are added to one of the masks by checking the box in the appropriate
column. In our example AI-Ch0 and AI-Ch1 are added to the trigger OR mask for the next run.
These four columns show the current setup of the different trigger sources. It is also possible to directly change the setup here without
using the enhanced Trigger Mode dialogue. To set up the trigger source it is necessary to first double click on the setting to be changed. As
the availability of level and pulsewidth settings depend on the selected trigger mode it is recommended to first select the trigger mode of that
source from the drop down list and then to select levels and pulsewidth.
Trigger Mode and Level Setup
Instead of setting up the trigger sources inside the table the more comfortable way is to use the dedicated Trigger Mode setup dialogue which
also shows a diagram of the mode and the resulting trigger events as an example. The trigger mode dialogue is invoked by either doubleclicking on the trigger source (channel or external) name shown under (7) in the last sub-chapter or by clicking on the „...“ button when entering a channel trigger mode.
Please note that the
comfortable trigger
mode dialogue only
shows an example for
the trigger source setup and not real world
data.
The general
mode selection
groups the available
trigger modes to have
a comfortable way of
selecting the appropriate trigger mode. If
selecting one of the
groups the available
modes under (2) will
change.
Shows the different trigger modes that
are available for the
under (1) selected
trigger mode group.
The inhere selected trigger mode will define which setup elements are available under (3) to (8).
Manual entry of the both trigger levels. Values can be directly entered as mV value or as the selected custom unit of the signal. In both
cases SBench 6 is selecting the nearest matching trigger level. By moving the trigger level step by step using the up and down arrows the
trigger levels can be changed in the smallest steps possible. As an alternative the trigger level can also be entered using the sliders shown
under (5).
When activating the lock levels the difference between both trigger levels is locked to the current value and any change of one trigger
level will automatically also change the second one while keeping the difference between them fixed.
The both sliders left and right of the mode picture are used to move the trigger levels graphically through the available range. The input
fields under (3) show the very exact level where the sliders are currently located. It is also possible to manually enter the trigger levels under
(3).
If a trigger mode needs a pulse width entry this can be done here. The pulse width can either be entered as samples or time value depending on the selection of (7). The pulse width can also be changed by the usage of the slider under (8).
52
SBench 6 Software Manual
Hardware Setup Dialogues
Analogue Cards Trigger Dialogue
The Samples/Time button allows to switch between samples entry and time entry for the pulse width entry. When switching between the
modes the currently selected value will be recalculated and shown in the new unit then.
If selected to samples input the field will
accept pure samples values or entries with a
samples modifier input of „k“, „M“, „G“:
192 S
16 kS
4 MS
2 GS
192 Samples
16 kilo Samples = 16 x 1024 = 16384 Samples
4 Mega Samples = 4 x 1024 kS = 4 x 1024 x 1024 Samples
2 Giga Samples = 2 x 1024 MS = 2 x 1024 x 1024 x 1024 Samples
If selected to time input the field will accept
pure time values which are recalculated to
samples value automatically using the currently selected sampling rate. Time values are entered as seconds or fractions of. The modifiers „m“, „u“, „n“ are accepted.
10 s
10 seconds
20 ms
20 milli seconds = 0.020 seconds
30 us
30 micro seconds = 0.03 ms = 0.000030 seconds
500 ns
500 nano seconds = 0.5 us = 0.0000005 seconds
When using another modifier than allowed for the current entry mode the field will automatically switch to the other entry mode.
The pulse width slider acts as an alternative to (6) allowing to set up the pulse width with a mouse move.
The picture in the middle shows an example of the selected trigger modes including currently selected trigger levels and pulse width.
Moving the levels and pulse width you can determine how exactly the trigger mode is working. Please keep in mind that the picture shown
is only an example and no real world data.
If „Update Directly“ is active any change to the trigger setup like changing trigger level will be written to hardware immediately. If the
hardware is running in a loop the effect of the changes will be shown instantly.
(c) Spectrum GmbH
53
Digital Cards Trigger Dialogue
Hardware Setup Dialogues
Digital Cards Trigger Dialogue
The trigger dialogue allows to set up all trigger modes of the hardware. The powerful dialogues can set simple trigger like single external
source or even multiple trigger conjunction of several channels located on multiple cards. The digital trigger setup shows the complete current
setup in table form and summary form and allows to manipulate the trigger settings of every available source directly inside the dialogue
window.
The setup dialogue stays on screen and changes will immediately take effect. The dialogue can either be docked to other setup dialogues,
can be placed somewhere on the screen (or even on a second screen) when using the freely floating version of it or can be hidden using one
of the „Toggle“ commands.
Please see the chapter „Arranging Setup Windows“ to see how the setup window can be placed at different locations and how the show
and toggle commands work.
The general trigger mode allows to
switch between software trigger, single
hardware source or the versatile multiple
hardware sources with AND/OR mask
based trigger conjunction.
If selecting software trigger the card will
immediately start acquisition after pressing
the start button.
The single source is intended for all applications where a single trigger source is sufficient. Selecting single source makes setup
easier as some setup elements are hidden.
The multiple hardware sources AND/OR
masked trigger allows to set up any trigger
conjunction that is supported by hardware.
If selecting multiple hardware sources
AND/OR mask trigger mode under (1)
both check boxes are accessible. Inhere
one can enable/disable the two trigger
source conjunctions globally without
changing the detailed source setup. This is
suitable if setting up a complicated trigger
conjunction and having the need to disable this for a short time without losing the setup.
The tabs of the table show the different trigger source groups. In our example we have external trigger sources available as well as channel trigger sources. Clicking on the appropriate page tab will bring the matching list to the front for setup. The setup inside the list itself is
saved and won’t get lost if changing the pages.
The „Auto Trig“ checkbox enables the auto trigger mode. In auto trigger mode the hardware will wait for a trigger event for the time
defined below the checkbox. After the time has elapsed the card will automatically generate a software trigger event and will issue one acquisition. After this software trigger the card will be re-armed (if running in loop mode) and will again wait the time defined until a trigger
event occurs. The time is programmed in milli seconds in the field below the check box.
The Delay field defines a trigger delay in either samples or time value depending on the setting of (6). The detected trigger will be delayed
by that value until forwarded to the acquisition firmware.
The Samples/Time button allows to switch between samples entry and time entry for pulse width and delay entries in the trigger table.
When switching between the modes the currently selected value will be recalculated and shown in the new unit then.
If selected to samples input the field will
accept pure samples values or entries with a
samples modifier input of „k“, „M“, „G“:
192 S
16 kS
4 MS
2 GS
192 Samples
16 kilo Samples = 16 x 1024 = 16384 Samples
4 Mega Samples = 4 x 1024 kS = 4 x 1024 x 1024 Samples
2 Giga Samples = 2 x 1024 MS = 2 x 1024 x 1024 x 1024 Samples
If selected to time input the field will accept
pure time values which are recalculated to
samples value automatically using the currently selected sampling rate. Time values are entered as seconds or fractions of. The modifiers „m“, „u“, „n“ are accepted.
10 s
10 seconds
20 ms
20 milli seconds = 0.020 seconds
30 us
30 micro seconds = 0.03 ms = 0.000030 seconds
500 ns
500 nano seconds = 0.5 us = 0.0000005 seconds
When using another modifier than allowed for the current entry mode the field will automatically switch to the other entry mode.
54
SBench 6 Software Manual
Hardware Setup Dialogues
Digital Cards Trigger Dialogue
Inhere the trigger mode and pulsewidth length can be programmed. A double click on the [Mode] line will show the available trigger
modes like „Pattern Trigger“, „Long Pattern Trigger“,... If a mode is selected which also uses the pulsewidth counter the pulsewidth [PW] line
is activated and a pulsewidth can be defined by doubleclicking here.
The [Edge] value defines the edge for which should be checked. It is possible to check for rising edge, falling edge or both edges. The
edge settings is valid for all active channels that are marked for edge detection. Please see (10) for this.
The three lines show the original pure values that are used to define the selected trigger mode. It is possible to set these mask manually
according to the details found in the hardware manual. A doubleclick on one of the lines allows to enter the value manually. All values are
written as hexadecimal values. Normally you don’t need to touch these settings. Instead it is possible to cross-check these settings with own
programming if the meaning of the digital trigger masks in the manual is not clear.
Inhere all digital trigger channels are shown in table form. For trigger detection one can define for each digital channel whether it should
be taken into the pattern mask or whether it should be monitored for the defined edge to occur or whether it should not be used for trigger
detection.
To add a channel to the pattern mask the corresponding check must be made in the „Pattern“ column and a pattern that should be present
need to be selected in the „Level“ column. The pattern is changed by simply clicking on the pattern level (LOW, HIGH).
To add a channel to the edge detection the corresponding check must be made in the „Edge“ column. The edge to be detected is defined
(8) and is valid for all selected channels. For reference the selected edge is shown in the „Level“ column.
(c) Spectrum GmbH
55
Timestamp Dialogue
Hardware Setup Dialogues
Timestamp Dialogue
Timestamps can be used to stamp the trigger event either in segmented or gated mode. The timestamp dialogue is only available if the timestamp option is installed on the card. If using a segmented or gated acquisition mode it is highly recommended to add the appropriate timestamp acquisition to add further information to your signals.
The timestamp mode is defined here. As a default the timestamp acquisition is turned off and need to be activated for acquisition.
Depending on the selected timestamp acquisition mode different input
fields of the dialogue are active.
The timestamp needs a counter to run. As default the sampling rate
of the card is used. If a reference clock inpout is installed on the card the
timestamp counter can also run with a reference clock in addition. Using
the timestamp reference clock input allows to synchronize the trigger recognition with external events. A common feed for timestamp reference clock input is the seconds signal of a timing device like GPS receiver
or IRIG-B receiver.
If timestamp reference clock is selected one can define the timeout time for the clock recognition here.
To scale the timestamps according to the reference clock one has to define the frequency of the reference clock fed in. Standard seconds
signal will need the 1.000 Hz setup as shown in the screenshot.
The reset button allows to set the timestamp counters manually to zero if using the standard mode. Otherwise the counter will run for ever.
If the optionm BaseXIO is installed on the hardware it is possible to acquire the BaseXIO lines with each timestamp. This is useful if some
additional status informations are present for each acquired segment.
56
SBench 6 Software Manual
Display Windows
Display Windows
SBench 6 has different signal displaying windows which can be generated and deleted independently. As default SBench 6 is starting with
one or two displays matching the installed hardware (analog display for analog data acquisition cards and digital display for digital data
acquisition cards). All available channels are already added to the default display giving you a fast start. This chapter explains the different
display types and how to handle them. The „Common Functions“ sub-chapter explains functions and commands that are available for all (or
at least most) of the different display types.
Different Display Windows
SBench 6 has six different displays to handle different data signals:
Display Window
Analog Display
License
Base
Signals
Analog A/D signals, calculated analog signals
X-Y Display
Professional
Analog A/D signals, calculated analog signals
Spread Display
Professional
Analog A/D signals, calculated analog signals
Digital Display
Base
Acquired digital signals,
calculated digital signals
FFT Display
Professional
Frequency based FFT signals
Histogram Display
Professional
Histogram data
Description
The standard analog display shows all continuous analog signals as well as segmented analog
signals (generated using Multiple Recording or Gated Sampling option). The analog display is in
conjunction with the preview display which shows the complete signal as a preview. Signals are
using shared axis with a common scaling defined by the signal ranges.
The X-Y display shows one or more varying analog signal versus another analog signal. This is
especially useful for graphing current versus voltage characteristics as well as Lissajous patterns.
Lissajous patterns can be used to track phase differences between multiple input signals.
The special analog spread display shows all continuous analog signals as well as segmented
analog signals (generated using Multiple Recording or Gated Sampling option). In the spread display each signal has its own space showing all the signals stacked inside the window. Signals
can be sorted and scaled and signals can even overlap each other.
The digital display shows continuous digital signals as well as segmented digital signals (generated using Multiple Recording or Gated Sampling option). The digital display has some additional features for digital signals like logic analyzer like signal combination or special edge
search functions.
The FFT display shows frequency based signals as generated from the FFT functions. The x-axis
shows the frequency while the y-axis shows the signal level. The FFT display can show signals
with logarithmic y-axis as well as linear y-axis.
The histogram display can show histogram data as generated by the histogram function.
Generating Displays
After first start of SBench 6 all acquisition channels are already added to a matching display that is generated automatically. It is however
possible to add multiple displays to organize signal views in different ways. It is possible to add signals to multiple displays showing different
parts of the signal or to only show a small number of signals in one display.
New displays are generated using the main toolbar or from the menu:
New U(t) Display
This command generates a new analog display to show analog signals over time. Any analog signal either being acquired, loaded with
an import function or generated from one of the signal calculations can be dragged to this display. After first start with any analog acquisition card be it either real hardware or a demo card one analog display is automatically generated with all analog signals already added
to it.
New FFT Display
This command generates a new FFT window which shows one or multiple FFT spectrums over signal frequency. If adding a FFT calculation
to SBench 6 a new FFT display is automatically added containing the newly generated FFT signals.
New Digital Display
This command generates a new digital data display which shows digital signals over time. Any digital signal either being acquired,
loaded with an import function or generated from one of the signal calculations can be dragged to this display. After first start with any
digital acquisition card be it either real hardware or demo hardware one digital display is automatically generated with all digital signals
already added to it.
New Histogram Display
This command generates a new histogram window which shows one or multiple Histogram files over the data range. If adding a histogram calculation to SBench 6 a new histogram display is automatically added containing the newly generated histogram signals.
New Spread Display
This command generates a new spread display to show multiple analog signals over the time. Any analog signal either being acquired,
loaded with an import function or generated from one of the signal calculations can be dragged to this display.
New X-Y Display
This command generates a new X-Y display to show multiple signals as a pair of X and Y values. One signal is used as X axis values for
a number of signals that generate the Y axis values then.
Multiple Displays
This command allows to generate multiple displays without issuing the same command several times. It is possible to generate all different
kinds of display windows listed before at the same time.
(c) Spectrum GmbH
57
Common Functions of most Displays
Display Windows
A FFT or histogram display is automatically generated if a FFT or histogram calculation is first time issued. The newly generated signal is then
added automatically to the display.
Common Functions of most Displays
The functions and method shown in this sub-chapter are common for most display types. Please also check the display type specific sub-chapter to see additional special functions available for the different display types.
Display Overview
The overview shows an
analog display to describe the different areas of the display. All
other displays have
mostly the same elements.
This area shows the
signal names that are
currently presented in
the display. Signal
names can be changed
in the channel dialogue
if necessary. It is possible to add/remove signals here or to lock
cursors on the signals.
Clicking on a signal
name will bring this signal to the top in the display which allows to
completely see this signal.
Just beneath the signal names the progress
bar for display pixel calculation is shown. If
large signals are shown
the re-scaling of the signals to screen may take a while. The progress bar shows the progress of that process.
Left of the screen the y-axis of the current signals is shown. There may be up to four different y-axis if showing signals with different scalings
inside one display window (using custom unit of analog signals). Pressing right mouse button on the very left of the scale invokes a special
y-axis setup dialogue explained further below.
At the bottom of the screen the x-axis is shown. All signals in one display share the x-axis. All signals are aligned to the zero point of the
x-axis which can be any where inside the display area or even outside. Depending on the display type there may be a trigger line shown at
the zero point (8). A right click on the x-axis will invoke a special setup dialogue for the x-axis. The dialogue is described in the next chapter.
The scrollbar at the bottom of the display shows the position of the display cut-off inside the complete signal. The scrollbar slider can be
moved to move the display or one can click on the arrows at the end moving the screen by 10% of the x-axis into that direction. By using the
right mouse click a context menu will show up that allows to scroll by one page or scroll step by step or jump to beginning or end of the scroll
bar.
The scrollbar at the right of the display area controls the y-axis. The scrollbar slider can be moved to move the display or one can click
on the arrows at the end moving the screen by 10% of the y-axis into that direction. By using the right mouse click a context menu will show
up that allows to scroll by one page or scroll step by step or jump to beginning or end of the scroll bar.
The display has its own toolbar which is initially located next to the display area. It is possible to set up the toolbar individually as explained in a previous chapter. The toolbar can also be dragged to an other location inside or outside SBench 6.
Analog and digital displays show the trigger time (x-axis zero time) with an extra dotted line.
58
SBench 6 Software Manual
Display Windows
Common Functions of most Displays
X-Axis Setup
The special x-axis setup dialogue allows to individually define the x-axis
span of the display window:
Issuing a right click inside the x-axis of the display window will invoke
the x-axis setup dialogue.
The Samples/Time button allows to switch between samples entry
and time entry for the border input fields.. When switching between the
modes the currently selected value will be recalculated and shown in the
new unit then.
If Samples setup is selected the drop down box of field (3) defines which
signal of the display is used to define the sample borders in case that the
x scaling of the signals differs from each other.
Used to define the source signal for the Samples selection under (2) in case that the x scaling of the signals differs from each other.
In here the left and right borders of the display x-axis span can be defined directly in either time or samples input depending on (2).
Y-Axis Setup
The special y-axis setup dialogue allows to individually define the y-axis span of the display window:
Issuing a right click inside the y-axis of the display window will invoke the y-axis setup dialogue.
In here the top and bottom borders of the display y-axis span can be defined directly in
either voltage or custom signal unit depending on the setup of the signal input.
(c) Spectrum GmbH
59
Common Functions of most Displays
Display Windows
Adding and Deleting Signals
There are three ways to add or remove signals to displays.
(1) Channel Dialogue
The easiest way to add signals is to drag and
drop them from the channel dialogue to the
display window they should be shown. Deleting a signal from a display can be done by
simply dragging that signal out of the display
window.
When dragging a different signal type to a
display window SBench 6 will automatically
invoke a matching conversion job and show it
for setup. This allows for example to drag a
analog signal to a FFT window starting a FFT
calculation or to drag a digital signal to an analog window starting the signal conversion
job.
Dragging the two marked signals with the
mouse to the Analog Display will add these
two signals there.
Dragging one signal from the top of the
display just somewhere outside will delete that
signal from the display.
Dragging a signal to another display type
like inhere an analog signal to a FFT window
will start a conversion/calculation job.
The new calculation for the FFT signal is added to the channel list and can be added, deleted, dragged like all other signals.
(2) Add To Displays
A second way is to right click on the signals in the channel dialogue and issue the „Add to displays“ command to add this signal. Using the
context menu it is also possible to remove signals from all displays where they are shown.
Both ways can also be used with multiple signals selected from the channel dialogue:
(3) Channel Area of Display Window
The third way of getting signals into display windows is the context
menu of the channel area. A right mouse click will open the context
menu here.
If clicking into the empty space of the channel area one has the option
to add channels to the display or to remove all channels from the display. After selection of the „Add channels“ command a list with all available signals is shown giving you the opportunity to mark and add
channels to the display.
Channels can be either removed by issuing the „Remove all channels“ command or by right clicking on a single channel and issuing the
„Remove channel“ command. Multiple channels can also be removed by marking all of them with the CTRL key and left mouse button and
then right clicking on one of the channels calling the „Remove channel“ command.
Single channels can also be removed from a display by dragging them outside of the display. It is also possible to move single channels from
display to display with drag and drop of the channel name.
60
SBench 6 Software Manual
Display Windows
Common Functions of most Displays
Reference Signals
SBench 6 offers an easy way to generate reference signals for
all displays. Any signal can be copied as a reference signal
by using the context menu from the channel list.
Select one or several signals and press the right mouse
button to open the context menu. To generate reference signals the function „Copy as Reference“ need to be selected
The copied signal will show up in the list of calculated and
loaded signals and can be used for any purpose. It can be
dragged to a display window or it can be used for further calculations. One can for example issue a math function SUB using the live signal and the reference signal to see the changes
in relation to the reference signal.
The copied reference signal is shown inside the display as
a standard analog signal.
Zoom Functions
All display windows allow a huge number of different zoom functions to cope all different needs that may occur. It may be a good idea to
put the zoom functions that are suitable for you on some shortcuts to have them at a finger tip. Adding new shortcuts is explained in the
previous chapter „Layout and Setup“
Please note that the display toolbar has a limited set of zoom functions per default. If you like to add further functions to the zoom bar you
can simply edit it by right clicking somewhere in the toolbar.
The following functions are available for zoom:
Define Zoom Area
Pressing this button will change to the define zoom area (rectangle zoom) mode. The mode will stay active until
another mode like cursor measurement or mouse wheel zoom is activated or the mode is deactivated again by releasing the button.
In this mode the mouse can be used to define the exact area to which one wants to zoom. The area is defined by moving
the mouse over the area of interest with the left mouse button pressed. After releasing the mouse button the display will
zoom into the freshly defined are.
Define Zoom X-Area
This is a special define zoom mode (rectangle zoom) where only the x-axis will be zoomed. The y-axis settings will be left unchanged
making it possible to just concentrate on the sample positions without changing the voltage range that is displayed.
Define Zoom Y-Area
This is a special define zoom mode (rectangle zoom) where only the y-axis will be zoomed. The x-axis settings will be left unchanged
making it possible to just concentrate on the voltage range of the signals without changing the sample position that is displayed.
Mouse Wheel Zoom Mode
Pressing this button will change to the mouse wheel zoom mode. The mode stays active until another mode like cursor measurement or
define zoom area mode is activated or the mouse wheel zoom mode is deactivated again by releasing the button.
While the mouse wheel zoom mode is active it is possible to zoom in and out with the mouse wheel in either direction. Pressing the left mouse
button will change between x axis and y axis zoom. The currently selected zoom direction is shown by the mouse cursor.
Zoom to Cursor Area
This zoom mode will change the x-axis display area to the area that is currently span by the both cursors. The y-axis range won’t be
changed.
Zoom In X and Y Axis
This command zooms both x axis and y axis in by factor 2.
Zoom Out X and Y Axis
This command zooms both x axis and y axis out by factor 2.
Zoom Full Area
If issued the command will show the full area that is spanned by the currently shown signals. If showing analog signals the full area in y
direction is defined by the selected input range of the signal independent whether the acquired signal uses the complete input range or
not. In x direction the complete signal area is shown from 1st sample to last sample.
(c) Spectrum GmbH
61
Common Functions of most Displays
Display Windows
Zoom Full Signal
This command will show the full area that is spanned by the currently shown signals taking into account the data that the signals contain.
It will search for signal minimum and maximum and zooms the display to show all signal points without showing unused area. Small
signals will automatically have a big zoom factor. If one of the signals goes up to the limit of the input range this command will exactly behave
like the „Zoom Full Area“ command.
Zoom Full X Signal
This command will show the full area that is spanned by the currently shown signal in x direction. The y direction will stay to the current
zoom factor.
Zoom Full Y Signal
This command will show the full area that is spanned by the currently shown signal in y direction taking into acount the data that the
signals contain. It will search for signal minimum and maximum and zooms the display to show all signal points without showing unused
area. Small signals will automatically have a big zoom factor. The x direction will stay to the current zoom factor.
Zoom In X Axis
The x axis is zoomed in by factor 2. The y axis zoom will stay unchanged.
Zoom Out X Axis
The x axis is zoomed out by factor 2. The y axis zoom will stay unchanged.
Zoom In Y Axis
The y axis is zoomed in by factor 2. The x axis zoom will stay unchanged.
Zoom Out Y Axis
The y axis is zoomed out by factor 2. The x axis zoom will stay unchanged.
Jump to Trigger Position
This function is only available for analog and digital displays having a trigger position. The current display area is scrolled to show the
trigger event in the middle of the x axis. The current zoom factor will stay unchanged.
Undo Zoom
All zoom and scroll positions are stored inside a list to have access to the last signal areas. Pressing the „undo zoom“ button will step
backwards in time through the zoom positions. It is also possible to use the mouse wheel back and forward function to undo/redo zoom
steps.
Redo Zoom
This function is available as soon as one has used the „undo zoom“ function. It will go forward in time through the zoom positions. Using
the both functions „undo zoom“ and „redo zoom“ allows to change between two or multiple zoom positions.It is also possible to use the
mouse wheel back and forward function to undo/redo zoom steps.
Miscellaneous Display Functions
Highlight Channel Name near Cursor
When activated the name of the nearest channel is shown for a short period of time as a popup near the current cursor position. The
channel name is fading out. The time it is shown can be defined in the user settings dialogue.
62
SBench 6 Software Manual
Display Windows
Common Functions of most Displays
Zoom Bookmarks
When examining a signal one will
determine certain areas of interest
which need to be marked or where
one likes to have a shortcut to go
back to this area.
This is implemented within SBench 6
by the use of zoom bookmarks. The
function is available from the context menu and shows the defined
bookmarks inside the signal as rectangles with a label at it:
The zoom bookmark is already
defined and is labelled by the user.
A double click inside the zoom
bookmark area will jump to this
zoom area and shows the sole inside of the bookmark as display area.
The „show zoom bookmarks“
icon allows to hide and show all defined zoom bookmarks.
The zoom bookmarks are found
in the display context menu as an
extra sub menu. To invoke the context menu a simple right clock somewhere inside the display is
sufficient.
Using the „Add bookmark“ command the zoom area that is currently displayed will be added as a new bookmark by giving it a user
definable name.
All previously defined zoom bookmarks are listed at the bottom of the menu. A click on one of the entries will jump to this area and show
the complete book marked zoom area as a new display area.
Show/Hide Zoom Bookmarks
The „show zoom bookmarks“ icon allows to hide and show all defined zoom bookmarks.
Scrolling
The current display view can be scrolled in either direction using the mouse or keyboard. When scrolling the signal
area the maximum scrolling length is limited by the complete signal view. If reaching the edge of this are scrolling will
stop.
Scrolling in X- and Y-direction is done totally independent with the individual scroll bars as shown in the overview:
The up and down arrows (left and right on x scroll bar) will scroll the display area in this direction by 10% of the
display width (x direction) or 10% of the display height (y direction)
Using the slider button allows to directly scroll to an area of interest by dragging the slider to the position inside the
scroll bar.
Clicking on the scroll bar between slider and button will scroll by 100% of the current display area in that direction.
The 10% scroll functions are also per default located on short-cuts. Please use the up/down arrow to scroll the display area up or down and
use the left/right arrows to scroll the display area to the left or to the right.
(c) Spectrum GmbH
63
Common Functions of most Displays
Display Windows
Display Comments
Each display window can get additional comments
that describe the current experiment or setup or
points of interest inside the signals. The comments
are located inside the display window. There are
three different types of comments:
General display comments
The display comments stick to the selected display.
If the display comment is not fixed to a particular
time position it is located on top left of the display
screen allowing to give some general information
about the display. The position remains the same independent of signal zooming or scrolling.
Fixed display comments
The fixed display comments also stick to the display
but are fixed at a particular time position. The comments stay at this time position and will move when
doing zoom or scroll operations.
Fixed channel comments
The channel comments are fixed to a particular
channel and time position and directly point to the
sample on this position. It can be used to describe
interesting signal parts or measured and calculated
figures by using drag-and-drop.
The display comments stay at the display even if a new acquisition is made. The channel comments are only valid for signal data they’ve
been fixed to. If a new acquisition is done these comments are deleted as the data has changed.
Channel comments are saved within the data file and are available again after loading of the file.
All comments that are visible are printed together with the signals if using the print or screenshot function.
Comments Setup
Using the context menu from the right mouse inside the Display window one can
add new comments to the display.
Select the radio button to place a channel comment.
Select one of the channels that are on display to place a channel comment to
it. The Y position is taken from the channel data while the X position is taken from
the location of the mouse cursor when issuing the add comment command.
Select this radio button to place a display comment.
If checking the „Fixed position“ checkbox the comment will be sticking to the X
and Y position defined by the mouse cursor when issuing the add command. If the
checkbox remains unchecked the display comment will be positioned floating in the
top left corner of the display window.
Type in the comment text here.
The remaining counter shows how many letters are available for the comment.
A comment can have a maximum of 1024 letters.
Edit or delete a Comment
To delete or edit a comment it is necessary to open the comment setup again by double-clicking somewhere inside the comment window. It
is now possible to edit the comment text inside the text window or to delete the comment completely:
Pressing the delete button will delete the comment permanently from the display and the data file.
Show/Hide Comments
The button from the toolbar allows to hide all comments. Comments are not deleted then but can be shown again by pressing the button
a second time.
64
SBench 6 Software Manual
Display Windows
Common Functions of most Displays
Setup Comment Format
The comment format of each display can be changed individually per display. In the global display settings a defualt style for the comments can be defined. To change the display comment format inside the display please use the context menu of that display by
right clicking somewhere in the display area and select the Comments -> Setup Comments
command. The setup is done separately for the channel based comments and for the display based comments.
The following formats are available:
Draw border, position marker and comment text
Draw borde and comment text
Draw position marker and text
Draw text
(c) Spectrum GmbH
65
Common Functions of most Displays
Display Windows
Cursor Measurement
Each display window has two measurement cursors that can either be moved freely within the window or that can be locked to the similar
signal or to two independent signals. If locked to a signal the measurement cursor will show the exact signal values at the current position
and will stay on this signal if moved in either direction.
Cursor Activation
The cursor mode is activated from the tool bar or from the context menu with the appropriate command. The mouse arrow will stay in the
cursor measurement mode until it is deactivated or another mode like „Define Zoom Area“ is selected.
Overview
The cursor measurement mode is active as a standard. The button will hide the cursors in case that you need to the see the signal only
without the two cursor lines.
Cursor A (red cross) is moved freely inside the display area while the left mouse button is pressed. Current cursor values are shown under
(7) in the matching color. The cursor will stay at the position even if the signal is updated.
The signal list allows to lock cursors to a signal (shown in the next sub chapter). In our example cursor B (blue cross) is locked to signal
AI-Ch00. The locked cursor is indicated by the small rectangle top of the signal name.
Cursor B is moved by holding the right mouse button and will stay on the signal it is locked to. Moving the cursor in X direction will move
from sample to sample with the cursor following the signal shape. Current cursor values are shown under (8) in the matching color. In our
example the RAW data display is activated. RAW data display can be activated under „Internal Settings“ - GUI section.
If the cursor is locked the current raw measurement value is shown at the end of the cursor cross with the number of sample currently
locked to and the raw value as decimal and hexadecimal value. These raw values are taken directly from the hardware and are not recalculated in any kind.
The information dialogue shows a section for each display that is currently on the screen. All displays are grouped for their general type
(analog, digital, FFT, histogram) allowing to select the display information of interest to be shown.
The free moving cursor A shows X and Y value as directly taken from the display coordinates. In our example we show an analog display
having time and voltage level as X and Y axis of the display
The locked cursor B shows the X and Y value taken from the signal it is locked to. The values are shown in display coordinates as under
(7) as well - if used - as custom unit values. It is also possible to show the data in raw values directly from the hardware as shown in the
example. Therefore it is necessary to activate the raw data display under Menu -> Settings -> Internal Settings -> GUI -> DisplayRawData.
The cursors can directly be used to measure differences as the difference between cursor B and cursor A is always directly shown in the
display information. In our example the difference is shown in voltage, time and frequency. If both cursors are locked to a signal the difference
is also shown in raw and custom unit values.
66
SBench 6 Software Manual
Display Windows
Common Functions of most Displays
Lock Functions
The lock functions are found in the signal overview on top of the main display window. Right clicking on
a signal name will show the Add/Remove and Cursor Lock menu. Each cursor can be individually locked
to a signal or both cursors can be locked to the same signal. A locked cursor is shown in the menu with
a check in front of it. The signal name the cursor is locked to gets an extra rectangle in cursor color just
above the name.
Context Menu
Each display window has an additional context menu which offers direct access to some mayor functions and some additional functions as
well as color setup of the screen.
The context menu is issued clicking with the right mouse button somewhere inside the display area. Please be
sure to not move the cursor while right clicking as this may be interpreted as cursor measurement or define
zoom if one of these modes are active.
The following commands are available from the context menu:
Zoom mode
Enables and disables the zoom rectangle mode to allow a user defined zoom window with the left mouse button.
Zoom mode X
Enable and disable the zoom rectangle mode for X-axis. This mode allows to define a
new zoom area with the left mouse button while not touching the current Y-axis zoom
setting.
Enable and disable the zoom rectangle mode for Y-axis. This mode allows to define a
new zoom area with the left mouse button while not touching the current X-axis zoom
setting.
If activated the difference between the both cursor positions will stay the same allowing to move both cursors simultaneously with the left mouse button. The right mouse
button allows to redefine the cursor difference then.
The tile displays function will arrange all displays tiled on the available screen area.
All signals shown in any display window are visible then at the same time. Display
Windows may then be moved and changed in size to adopt the view to the user
needs.
This function tiles all displays in the work space horizontally. Displays will then have
the full screen width for x-axis but will share the screen height for their y-axis. All signals shown in any display window are visible then at the same time.
This function tiles all displays in the work space vertically. Displays will then have the
full screen height for y-axis but will share the screen width for their x-axis. All signals
shown in any display window are visible then at the same time.
This function cascades all displays one after the other. Each display will have nearly
the full available screen area but only the display on top of all other will be visible.
All other displays may easily be reached by clicking on the visible caption of the display.
Automatically synchronizes all displays for zoom and cursor positions as described in
the next sub chapter.
Zoom mode Y
Cursor track
Arrang Displays: Tile displays
Arrang Displays: Tile horizontally
Arrang Displays: Tile vertically
Arrang Displays: Cascade
Sync all displays
Show channels
Show progressbar
Setup display colors...
Screenshot
Change display name
Show Report Template Name
Zoom area bookmarks
Comments: on/off
Comments: Add
Comments: Setup
Data line width ...
Cursor line width ...
Dim Background Channels
Grid line width ...
Sample draw mode: Line
Sample draw mode: Point
Sample draw mode: Point + Line
Show: Show cursors
Disables and enables the signal name view on top of the display window. The signal
names are needed to lock cursors to a signal.
Disables and enables the progress bar view between display area and signal name
area. The progress bar will show the progress of recalculating signal data to display
data.
Allows to setup all display colors like cursors, axis, names, trigger line, background.
Opens the screenshot dialogue for the current display allowing to save or copy a
screenshot.
Allows to change the name of the display to a user defined text. As a standard the
display name is something like „Analog Display (0)“
Shows the name under which this element and its sub-elements is access inside the
report template
Allows to add and remove zoom area bookmarks and also lists all bookmarks to
directly jump to the bookmarked area. Please see the special chapter about zoom
bookmarks above.
Enables/disables the view of the comments. If disabled the comments are not deleted
but just not drawn to the display area. An enable command will bring hem back on
screen
Allows to add comments to the display. Please see the above chapter for more information about display comments.
Setup the display comment format for this display. Comment formats are explained in
more detail in the display comment chapter above.
Defines the width of the data shown in display. As standard the data line width is 1
pixel what may be too small to be visible on a projector it during a presentation.
Defines the width of the cursors shown in display. As standard the cursor line width is
1 pixel what may be too small to be visible on a projector it during a presentation.
If activated the background channels are dimmed to a darker color to emphasize the
currently selected channel.
Defines the width of the grid shwon in display. As standard the grid line width is 1
pixel what may be too small to be visible on a projector during a presentation.
The signals are writen as a solid and continuous line. The dedicated sample points
are not visible within the signal.
All single sample points of the signals are shown as dots with no connection. This display mode needs a high zooming factor to have several display pixels for one sample point.
All single sample points of the signals are shown as dost with an additional line connection between them. This display mode need a high zooming factor to have several
display pixels for one sample point.
The cursor lines can be hidden by this command. To show a cursor again it is only
necessary to move a cursor with the mouse by holding a mouse button and moving
the mouse inside the display window.
(c) Spectrum GmbH
67
Common Functions of most Displays
Show: Show trigger line
Show: Show trigger levels
Show: Hide Y scale
Show: Popup channel names
Show: Show grid
Show: Show timestamp lines
Display Windows
The trigger position is marked with an extra dashed line. The trigger position is determined to be the zero time position of the signal. Using this tool command one can
show and hide the trigger line.
When activated the selected trigger level of the signal is shown in the signal color as
a dotted line inside the display giving you the chance to compare the trigger level
directly with the signal acquired.
The Y Scale of the display can be hidden/shown with this command.
When activated the name of the nearest channel is shown for a short period of time
as a popup near the current cursor position. The channel name is fading out. The time
it is shown can be defined in the user settings dialogue.
The oscilloscope like grid shows grid lines in fixed distances corresponding to certain
time or voltage levels. If using a spread display the div scaling (grid) is the only way
to determine voltage levels from the display
This command activates/deactivates the display of the timestamp line and timestamp
value.
Show: Show segment border lines This commands activates/deactivates the display of the segment start and end borders. If showing several segments on the screen it might be better visible if not showing the segment borders with an extra line.
History mode
Enables and disables the history mode. Signals are written over each other as long as
the history mode is active and as long as no zoom setting have been changed
Spread Y axis
Stream Mode Settings
68
If pressed all current channels are spread in y direction on the display. Each channel
gets a space in y direction that corresponds with the complete theoretical signal
swing. Please consider the dedicated spread display instead!
Opens the stream mode settings dialogue which is explained later in this chapter.
SBench 6 Software Manual
Display Windows
Common Functions of most Displays
Display Synchronization
Overview
Each display has its own zoom settings, its own
scrolling position and its own measurement cursors. All of these are running totally independent
making it possible to have different displays with
different signals in different zoom states. Sometimes it is necessary to have the same zoom and
scroll settings on multiple displays. If one for example wants to see the same portion of signal of
mixed mode analog and digital signals or one
has a huge number of signals making it more
comfortable to split them across multiple displays.
To obtain an easy way of synchronization between different displays two or even several displays can be linked together using the display
synchronization. As soon as displays are synchronized zoom and scroll position will be
shared.
The icons handle the display synchronization and allow to set up synchronization, to split
up the displays or to temporarily take out one
display from synchronization.
All synchronized displays are marked in the display window title. It is possible to have multiple synchronization groups.
The position of the displays and the zoom factors are now synchronized and moving the slider of one display will also move the slider
of the other display.
Setup Display Synchronization
This icon calls the general setup dialogue for display synchronization. It allows to add sync groups and to add or delete displays from
the sync groups.
Enable/Disable Display Synchronization
Using this icon one can temporarily disable the display synchronization for the currently active display. This can be helpful if one
wants to examine a detail in one display without changing the setup of the other displays. After enabling the synchronization again
the old zoom and scroll settings will be restored.
Advanced Synchronization
Activating the advanced synchronization option all current display modes will be synchronized. This included cursor measurement
mode and history mode for example. If not activated one can use the measurement cursors in a single display without showing
cursors in the other displays.
Setup Dialogue
The display synchronization is set-up within a dedicated dialogue. It
is possible to just sync all with one button click as well as to define
multiple display sync groups and add displays individually:
The easiest setup is to synchronize all active displays to one
group. A single button click and all the work is done and all matching
displays are synchronized in a newly build group.
For individual setup one has to first create a new display synchronization group. Groups are numbered starting with the display type.
After having created the display synchronization groups each
display has to be added to one of the groups for synchronization.
The title line of the dialogue shows to which group the currently
active display is synchronized.
A display can be removed from a synchronized group here.
The clear all button will delete all generated display sync groups.
(c) Spectrum GmbH
69
Common Functions of most Displays
Display Windows
Display User Settings
Some special user based display settings are available inside the general user settings dialogue which can be called from the „Settings“ menu:
The user display setting are grouped into multiple tab pages.
Please select the tab page which matches your display settings
to be changed.
The display windows can be shown as sub windows (default) or browser-like as tabbed windows. Use Show display windows in tab bar to switch between these settings. Tab position
defines the position of the tab bar in tabbed mode.
Inhere you define the behaviour of the channels if added or
removed to/from the display windows:
„Add enabled channels“: as soon as channels are enabled by
the user for acquisition these are automatically added to the display windows. If this option is disabled the user needs to manually add the channels to the display windows.
„Remove disabled channels“: as soon as a channel is disabled
for acquisition it is removed from the display windows. If this option is not active disabled channels with data from a past acquisition will stay visible inside the display window mixing up with
newly acquired data of enabled channels.
„Add imported channels automatically“: as soon as a channel is
imported it will be automatically added to the display windows.
If this option is disabled the user needs to manually add the channels to the display windows.
„Convert unsupported channels“: If active you can drag and
drop channels to different display windows starting a matching
conversion job automatically. It is for example possible to drag
an analog channel to a FFT window, starting the FFT or to drag
digital channel to an analog display starting a digital to analog
conversion.
„Dim background channels“: If activated the background channels are dimmed to a darker color to emphasize the currently selected channel.
„Popup channel name fade-out“: Defines the time how long a
channel name is shown near a signal if the mode is activated.
The mode can be activated by the button from the tool bar (Show
channel name if cursor near signal).
To optimize FIFO data acquisition it is possible to limit the
FIFO online display data. It is either possible to ask for this display disable or to automatically disable the FIFO data display.
Please note that online FIFO data display consumes a lot of processing power and may cause an overrun if using high FIFO
streaming rates.:
„Set Fifo online display limit“: Set the limit for online Fifo data
display to a value of MBytes/s of streaming speed.
„Ask to disable Fifo display at limit“: If the above set limit is reached, the user is asked to deactivate online Fifo data display.
„Always disable Fifo display at limit“: If the above set limit is reached, the online Fifo data display is automatically switched off.
The default display comment settings define how a display comment is drawn when adding it to a display. After adding the comment the
settings can be changed for each individual display by using the context menu.
The painting defaults define the line thickness of the various elements of a display. The line thickness of each display can be changed
individually using the context menu of that display.
The digital display settings are grouped on their own tab page:
„Show max. number of channels“: If active the maximum number of channels is shown inside the digital displays optimizing the space per
channel and stacking channels with the minimum space next to each other.
70
SBench 6 Software Manual
Display Windows
Common Functions of most Displays
The spread display settings are grouped on their own tab:
„Sow max number of channels“: If active the maximum number of channels is shown inside the spread displays optimizing the space per
channel and stacking channels with the minimum space next to each other.
„Enable handle to adjust space“: The space for each channel inside the spread display can be adjusted by
dragging the handle between the channel names as shown on the right. This option enables/disables the
usage of the handle for the spread display. If disabled the space for each channel cannot be adjusted by
the user.
„set height for handles“: The height of the adjustment handle can be defined in display pixels. The larger
the handle is, the easier it can be dragged.
(c) Spectrum GmbH
71
Analog Display
Display Windows
Analog Display
Overview
The analog U(t) display shows any analog signals that have a time based x axis. The analog display is the main display for acquired or
calculated analog signals. It is possible to show different kinds of signals with different scalings and different x-axis in one display as well as
showing segmented signals (like Multiple Recording or Gated Sampling) signals together with continuous signals.
Please have a look at the „Common Functions“ sub-chapter to get general information and to see how displays are generated, how signals
are added to displays, how scrolling and zooming is used, how cursor measurement functions are used and how display synchronization is
working. This chapter will only concentrate on the special functions of this display type.
Preview
The analog display window has a preview area on top of the standard display which shows the complete signal area and which is used to
easily move and resize the current display view. The preview window can be activated or de-activated from the menu „Windows“ -> „Show“
-> „Show Preview“
Overview
The preview window shows data of the currently active analog display window. If changing the active window the preview area will
also change its content. The current selection
shown in the display window is shown as
brackets inside the preview window giving a
good overview when navigating inside huge
amounts of data.
The current display area is marked inside
the preview window.
The x-axis scale of the current display window is exactly matching the preview selection
while the y-axis scale can be changed individually without changing the preview selection.
Using preview window to define display area
Moving the mouse with right button pressed inside the preview area one can
select a new zoom area for the display. After finishing the selection the potential new area is marked in gray as shown in the picture.
A mouse click inside the gray area will finally select this marking as new display area then. The current display will change and show the newly selected area. All scrollbars are updated.
When pointing somewhere inside the current selection the mouse cursor will
change to a double cross indicating that the preview selection can now be
moved. When moving the selection the size won’t change but the x position.
To move the selection point inside the area and drag and drop the selection
to the new area of interest. After releasing the left mouse button the newly selected area is shown and all scrollbars are updated.
If pointing to the border of the selected area in the top or lower region the
mouse cursor will change to a left/right arrow indicating that it is now possible to resize the selected area. Please note that the middle border area is used
for moving in case that the selection is too small to show two borders. For resizing it is necessary to clearly point above or below the middle region of the
border.
With drag and drop the selected area can be resized. As soon as the mouse button is released the newly selected area is shown and the
scrollbars are updated.
72
SBench 6 Software Manual
Display Windows
Analog Display
History Mode (Eye diagram)
The history mode allows to plot several shots
of the same signal over each other. This shows
signal variation and signal exceptions without
doing additional analysis or complicated
checking routines.
A simple display screen shows all the variation and exceptions helping to find problems
in the signal or worst case scenarios. The measurement cursors can be sued to quantify variations or to measure single exception signals
directly.
This is for example very helpful when analyzing digital data streams. A history plot over
several shots will show a characteristic eye diagram of the signal allowing to analyze the
data signal concerning noise, distortion and
phase jitter.
History Mode Enable
The button from the display toolbar enables and disables the history mode. Signals are written over each other as long as the history mode is active and as long as no zoom
setting have been changed. In contrary to real oscilloscopes the data threshold is every time infinite and no programmable threshold is available.
Spread Function
As a default all signals shown in one display are written over each other allowing to directly compare the signals with each other (y offset is
zero). To have all signals separately the spread button allows to automatically spread the signals over the y axis giving the single signal
enough room to be shown independently.
Spread Activation
If pressed all current channels are spread in y direction on the display. Each channel gets a space in y direction that corresponds with
the complete theoretical signal swing. Adding or removing signals from the display or changing of the input range will automatically
update the spreaded signals and the y ordering.
Please note that with version 6.1.02 a new display type „Spread Display“ has been added which allows to
scale and re-arrange spread signals with a lot of functions. Please consider using the dedicated spread display instead of the simple spread signal function inside the standard display window.
(c) Spectrum GmbH
73
Analog Display
Display Windows
Miscellaneous functions
The following commands allow to show or hide different parts of the display windows.
Trigger line
The trigger position is marked with an extra dashed line. The trigger position is determined to be the zero time position of the signal.
Using this tool command one can show and hide the trigger line.
Hide Cursors
The cursor lines can be hidden by this command. To show a cursor again it is only necessary to move a cursor with the mouse by holding
a mouse button and moving the mouse inside the display window.
Trigger level display
When activated the selected trigger level of the signal is shown in the signal color as a dotted line inside the display giving you the
chance to compare the trigger level directly with the signal acquired.
Hide Y Scale
The Y Scale of the display can be hidden/shown with this command.
Grid (divisions grid)
The oscilloscope like grid shows grid lines in fixed distances corresponding to certain time or voltage levels. If using a spread display the
div scaling (grid) is the only way to determine voltage levels from the display.
74
SBench 6 Software Manual
Display Windows
Analog Display
Segmented View (Professional Version)
This is a description of the display of segmented signals as generated when doing an acquisition with Multiple Recording mode, Gated Sampling mode or ABA mode. The segmented display is only available if at least
one signal shown in the display has been acquired with one of the segmented modes. The segmented display
is not available when doing single acquisitions.
This display mode will show the segments of the signal incorporating timestamp values if acquired and allows additional navigation inside
the signal based on the segments. The standard display will automatically switch to a segmented display if a segmented signal acquired with
Multiple Recording, Gated Sampling or ABA mode is shown inside the display. Timestamp values will be used for display if they have been
acquired. Please check to have timestamp acquisition activated if you like to have the timestamp information of the signals shown.
Hardware Setup
The signal segmentation is selected inside the
Mode setup window as shown in button (1).
Segmented display is available for standard as
well as for FIFO signals and works for Multiple
Recording, Gated Sampling with Timestamps
and ABA mode.
Please note that there is no segmented view if
using Gated Sampling with no Timestamps activated. As the length of the gates is depending
on an external signal SBench 6 has to know the
length of the gate signals by acquiring timestamps to show any segment information then.
The timestamp mode has to be activated in addition to this if timestamp
information is interesting for the user. Any of the available timestamp
modes can be selected from the drop-down list under (1).
If Gated Sampling is activated the timestamp information is needed to
show segmented information. Multiple Recording signals can also be
shown without timestamp information just showing the segment borders
with no time position information then.
Overview
The preview shows the complete segmented signal including
all gaps that come from the dead
time between the segments. Zooming and scrolling is done as before.
All segment control commands
as shown under (3) and further below are operating on the marked
signal and are taking positions and
segment sizes from this signal.
Marking of a signal is done by simply left clicking on the name. The
marked signal is highlighted with a
border in the signal color.
If a signal is marked as source
for segment control as shown under
(2) these additional segment control
buttons appear. The segment control buttons can also be added to
the toolbars by just using the standard toolbar editing functions. The
control buttons are explained in further detail in the next chapter.
Segments are shown separately showing exact start and end sample of the segment marked with a gray line. The delimiter lines can be switched off using a dedicated button as shown below.
(c) Spectrum GmbH
75
Analog Display
Display Windows
The void area between the segments is defined by the timestamps from the hardware. Segments are positioned depending on the timestamps read for this segment. The void space can be switched off by a dedicated button as shown below having the original signal shown
stacked again.
If activated the exact timestamp position (indicating the trigger position of the segment) is shown on screen. The timestamp display can
be activated/deactivated using a dedicated button as shown below.
Segmented View Commands
The following buttons are shown in a small form also in the segment control bar on top of the display as listed under topic (3) in above overview. The buttons can also be added to the standard display toolbar using the normal toolbar edit commands.
All jump commands will not change the zoom settings. Jumping to another segment will scroll the screen to that segment having the same x
offset from the beginning of the segment as before:
Icon from toolbar
Icon from segment
control bar
Description
Jump to first acquired segment of the signal
Jump to previous acquired segment of the signal
Jump to a given segment number. After pressing this button an input dialogue is shown where you can enter the number of the
segment where to jump to. Segment numbering starts with zero.
Jump to next acquired segment
Jump to last acquired segment
Show complete segment. The command will change the zoom settings of the x axis to show the full segment that is currently leftmost inside the display window. The left border of the visible area is the start of the segment and the right border is the end of the
segment.
Jumps to trigger position inside the current segment. The trigger position will be in the middle of the screen afterwards
The following commands are available in the display toolbar and are visible as soon as a segmented signal is shown:
This commands activates/deactivates the display of the segment start and end borders. If showing several segments on the screen it might
be better visible if not showing the segment borders with an extra line.
This command activates/deactivates the display of the timestamp line and timestamp value.
Using this command one can switch off the segmented display and show the signal without gaps related to timestamps. Each segment
will directly be followed by the next segment then. The x-axis will no longer show the real time scale but a compressed one without taking
the timestamps into account.
76
SBench 6 Software Manual
Display Windows
Analog Display
e
ABA Mode/Dual Time Base Display (Professional Version)
The ABA mode generates two data channels out of each input. One data channel (called „B“ data) contains a multiple recording acquisition
with one segment of data for each trigger that was detected. The B data acquisition is running with the selected sampling rate. The second
data channel (called „A“ data) is running continuously with a divided sampling clock and acquiring a slower sampled but continuous signal.
The time relation between A and B data is done by the acquired timestamps.
As a result one has a full acquisition over the complete run time with slow A sampling clock (5) and at each trigger event one has in addition
a fast sampled B segment (6) giving more information on the area of interest. More information on the ABA mode is found in the hardware
manual.
Changing to ABA mode affects mode setup, channel setup and the display itself as shown in the screen shot. Please note that the display has
been changed to spread view to better see the difference between slow A data and fast, segmented B data;
The ABA mode is activated inside the mode dialogue. It is either possible to use standard or FIFO ABA mode. The display as well as the
channel setup dialogue are changed to ABA mode settings after the first acquisition with ABA mode has been finished.
After activation of the ABA mode the ABA divider defines the relation between fast B segments and slow A acquisition. Please select one
of the available dividing factors. In the example the A data is sampled with 1/100 of the sampling speed of the B data.
The input channel represents the B data containing the segmented fast acquired data and allows all input settings for this input.
If an acquisition with ABA mode has been made each channel gets a „sub channel“ representing the slow A data. The sub channel can
be accessed using the + symbol from the normal channel. The slower A channel has a „_A“ suffix on his name and can be used like any
other channel being dragged in some display windows or being used for calculations.
In our example A and B data are shown in the same display to see the differences between them. The A data has been acquired with
slow sampling speed therefore lacking details in the signal shape. The A data is a continuous data stream through the complete acquisition
time.
The B data shows only the data segments having a much higher sampling rate and therefore a far better x axis resolution. The signal
shows more details but is limited to the segment area around the trigger event. As already shown in the segmented view chapter the segment
is limited by two lines showing the segment border as well as a trigger and timestamp information.
The segmented signal part can be selected to allow segment based zoom and scroll commands.
The segment commands are similar to the one shown in the „Segmented View“ chapter and work on the selected signal (7).
(c) Spectrum GmbH
77
Analog Display
Display Windows
FIFO Mode Preview
SBench 6 is mainly designed for scope mode, transient capture and high speed streaming. It is not specifically a data logger with online
display and calculation. However when using FIFO (streaming) mode there is a continuous data preview to check incoming data. The main
focus is still on fast hard disk streaming and therefore the FIFO preview is limited in the functionality and may not work with all streaming
speeds.
FIFO mode preview is automatically used as soon as a FIFO data acquisition is started and the signals are shown inside a display window.
The zoom factors cannot be changed and will always show complete signal area.
The FIFO mode is activated inside the mode window. The FIFO data preview will work with all kinds of different FIFO mode runnings.
The data is shown scrolling to the left with the x axis scale being updated while scrolling. This gives an overview of the currently sampled
data at the inputs. Display can be selected to be spread display as shown on the screenshot by using the standard „spread display“ button.
After stopping of the FIFO data acquisition the display will turn back to normal display mode as described before.
While FIFO acquisition is running the status bar shows the amount of data that has been acquired so far, the fill size of the different
buffers, the current transfer speed and the overall average transfer speed. These informations will help finding bottlenecks inside the FIFO
data acquisition.
While FIFO mode is running the standard data preview display is de-activated. As soon as FIFO data acquisition has stopped the preview
data is calculated and the complete acquired signal is shown in the overview.
78
SBench 6 Software Manual
Display Windows
Analog Display
Changing x-span of FIFO preview (stream mode settings(
The x-axis span is fixed during complete FIFO acquisition and shows a preview of the acquired data. It
is possible to change the x-axis matching the customers needs as well as the update cycle from the display
area itself:
• Please note that changes to the x-axis settings have to be done before the acquisition is started as the
selected x-span is fixed for the complete acquisition.
• Right click inside the display window
• Select the „Stream Mode Visible X Range...“
• Set up time span and update as shown below
• Please note that a time span which is too small will result in an data overrun very fast.
The stream mode settings define the FIFO preview setup for the current
display. It is possible to have different FIFO preview displays having
different stream mode settings.
Per default the visible time interval is automatically determined
from the channel and sampling rate settings of the acquisition. It is possible to set this to manual setup giving access to (2).
Fill in a time span for the visible length of the display window.
Please note that a time interval being too small may result in a data
loss very fast.
If running Multiple Recording or Gated Sampling this time interval is
the sum of the segments being shown. A value of 100 ms while having
a Multiple Recording segment of 10 ms will result in exactly 10 segments shown in the preview independent of the time they’ve been acquired.
The update interval for the display can be defined in pixel per update. A larger number would generate far less CPU charge while a
smaller value while make the visible update process more smooth but may result in data loss or a FIFO preview what is no longer time correlated with the acquisition process.
(c) Spectrum GmbH
79
X-Y Display
Display Windows
X-Y Display
The X-Y display sets two signals into relation to each other using the values of one signal as x-axis values and the corresponding values of
one or multiple other signals as y-axis. The resulting Lissajous figures showing the phase difference can be used to analyze the data further.
A standard application for the X-Y display would be the I-V curve of a component such as a capacitor, inductor or diode.
By dragging the first signal to a
X-Y display one defines the x-axis
signal for all pairs. The x-axis signal
is shown left of the delimiter. Signals
can be dragged to the display or
added using the context menu as explained further above.
All further signals that are added to a X-Y display will be shown on
the y-axis plotted over the x-axis signal (1)
The X-Y display shows the plots.
Each X-Y plot gets the color of the ysignal. The axis scalings are according to the signal range and scaling
and custom unit. In our example
both y-signals are current signals
and have a custom unit of A (Ampere).
The X-Y display has two freely
moving cursors which show the current position and which can be used
to measure more precisely the position of the plots. A cursor locking to
the signal is not available.
Cursor position results are
shown in the standard info window
giving the original voltage values as
well as the custom unit and scaling
values in the second line.
80
SBench 6 Software Manual
Display Windows
Spread Display
Spread Display
The special analog spread display shows all continuous analog signals as well as segmented analog signals (generated using Multiple Recording or Gated Sampling option). In the spread display each signal has its own space showing all the signals stacked inside the window.
Signals can be sorted and scaled and signals can even overlap each other.
The spread display is very useful if a larger number of signals should be shown in one display window. As all signals have their own display
space it is possible to see all signals at the same time without overlapping. The y scaling is purely based on a unit per division scaling and
the spread display can therefore handle a different y-scaling and y-unit for all signals displayed here.
Please have a look at the „Common Functions“ sub-chapter to get general information and to see how displays are generated, how signals
are added to displays, how scrolling and zooming is used, how cursor measurement functions are used and how display synchronization is
working. This chapter will only concentrate on the special functions of this display type.
Overview + Cursor Functions
Each signal cane be scaled individually. Each signal can also have its
own custom unit without any restrictions in combining signals inside a
spread display.
On the left part of the display the
signals are listed in a stacked view.
Each signal has its own space whilst
signals can also overlap.
Signals are locate done the right
hand site. The zero axis is located
just in the middle of the signal name.
Each signal can have an individual scaling independent of the used
unit. The current scaling is shown just
behind the signal name in unit per division.
Unlocked signals show the y-position related to the signal area they’re just in. To make this visible to the user the signal that is actually
used by the cursor and also shown inside the info window is marked by two dashed lines.
Locked signal get a locking indicator as already shown in the standard display. The locked cursor can only move on the signal that it is
locked to and the info window shows the exact value of the signal (including custom units) that is present at the cursor position.
Scaling a signal (mouse wheel)
Signals can be scaled easiest by using the mouse wheel.
Once marked with the mouse (rectangle in signal color
around the name as shown in the screenshots) one can use
the mouse wheel on the signal name to increase or decrease the scaling of the signal.
Signals can be scaled individually and can also overlap
each other to give an important signal more visible space
than an unimportant one.
(c) Spectrum GmbH
81
Spread Display
Display Windows
Organizing Signals
Besides the possibility to scale the signals signals can be also organized inside the spread display window in different kinds.
Changing the signal spaces
The area of the signal names can be individually setup with a few
mouse clicks. All borders are elements that can be dragged holding
the left mouse button to change the position and with this to change
the space the signal name gets. As signals itself are located with
their zero level at the middle of the name the signal then also has
more visible space around.
The upper border of the signal name list can be dragged to increase or decrease the empty space at the top of the list.
Dragging the delimiter which is located in between signal
name list and signal display area allows to change the spacing of
each for best visibility.
Both borders of the signal name entry can be changed with the
mouse button down to a minimum size to allow more space for a
single signal. If changing the borders all other signal spaces are
pushed or pulled and their size will adopt to the new space that is
available. Please see the next sub-chapter to learn how to get more
signals into the visible area or how to get rid of single signals from
here.
The lower border of the signal name list can be dragged to increase or decrease the empty space at the bottom of the list.
Handling the number of visible signals.
All signals get a default space when added to the display. The
available space can be changed as explained above.
If more signals are added to the display than visible by default a
scrollbar (1) appears at the right side to access the signals not visible at the moment.
In addition signals can be added and removed from the visible area
to the area that is not visible at the moment by using two special
buttons (2) and (3):
Use the scrollbar to access the signals that are not visible inside
the display area at the moment. The scrollbar is only available if
more signals are in the display window than actually fit into the visible area.
Use the button to add the next signal in the list to the visible area. Adding a signal to the visible area will push all other signal
spaces to get some space for the new signal.
Use the button to remove the bottom most signal from the visible
area. Removing a signal from the visible area will pull all other signal spaces and will distribute the new space between them.
A marked signal can be dragged to another location to sort the
signals according to the system setup needs.
82
SBench 6 Software Manual
Display Windows
Spread Display
Context Menu
By right clicking on the signal name a context menu opens up which allows to invoke some additional commands related to the selected signal:
Add channels
Remove channel
Remove all channels
Calls the add channel dialogue to add channels to the display that are currently not visible
The selected channel is removed from the display.
All channels are removed from the display. The display is empty afterwards and can be refilled with channels
again.
Settings ...
Calls the signal display offset and range setup screen that is explained below.
Scale division (+)
The scaling of the selected channel is increased: the unit per division will go to the next smaller step (e.g. from 1V/
div to 500mV/div. The same function can be directly invoked when using the mouse wheel on the selected channel.
Scale division (-)
The scaling of the selected channel is decreased: the unit per division will go to the next larger step (e.g. from 1V/
div to 2V/div. The same function can be directly invoked when using the mouse wheel on the selected channel.
Offset Zero Level (+)
The channel is offset shifted by 10% of it’s range. The signal will move up on the display.
Offset Zero Level (-)
The channel is offset shifted by 10% of it’s range. The signal will move down on the display.
Offset Zero Level Reset The channel offset is reset and the channel offset will be set to zero again. The zero axis of the channel is located at
the middle of the signal name again.
Lock Cursor A
Cursor A is locked to the selected signal. Cursor A (left mouse button) will stay on the signal when moved and the
info dialogue will show the exact matching values of the signal including custom units if applicable.
Lock Cursor B
Cursor B is locked to the selected signal. Cursor B (right mouse button) will stay on the signal when moved and the
info dialogue will show the exact matching values of the signal including custom units if applicable.
Lock Cursor A+B
Both cursors are locked to the selected signal.
Offset and Scale Settings Dialog
The dedicated setup dialogue allows
to defined the view of the spread signals in detail:
All channels are selected here for
which the settings should be
changed. One can either check/uncheck the channels one by one or use
one of the buttons located on top of
the list to check/uncheck all channels.
The scale division defines the
scale per shown division. Inhere the
base unit (voltage) is shown. This
function can also be performed using
the mouse wheel while marking a
channel name.
The display offset of the signals can be defined as a fraction of the division. In our example the offset 0.2 divisions. As the scale division
is 5 V this will result into 1 V of signal display offset.
The display offset can also directly be set using the context menu as shown above. Using this setup dialogue it is possible to define the
step size of the context menu settings.
(c) Spectrum GmbH
83
Digital Display
Display Windows
Digital Display
Overview
Please have a look at the „Common Functions“ sub-chapter to get general information and to see how displays are generated, how signals
are added to displays, how scrolling and zooming is used, how cursor measurement functions are used and how display synchronization is
working. This chapter will only concentrate on the special functions of this display type.
Digital signal scan are acquired by pure digital data
acquisition cards as well as
by using additional digital
inputs at digitizer cards.
Digital signals are displayed in a digital display
that has some special features compared to the analog display. A digital
display offers logic analyzer like features like bus signals or edge detection. The
bus signal setup is explained in the next subchapter. The right hand
overview shows the look of
this feature and the use of
the display navigation buttons:
Single signals are
shown with their name as
defined inside the channel
dialogue. See the next
chapter to see how to sort
signals inside the display.
One signal is marked.
by clicking with the left
moose button on it. The
marked signal is used for
the edge commands under
(3).
Some special navigation commands are available on top of the display as soon as a signal is marked as explained under (2). The commands allow to jump from edge to edge as explained below.
Bus signals are shown with the name of the signal which is defined when defining a bus signal.
Each change of bus value is shown with a transition inside the display. If there is enough room to print the current value of the bus is
shown on the display. To see more values one can simply zoom into the screen.
Just right to the digital display a tool bar with zoom functions that work on the display is shown.
84
SBench 6 Software Manual
Display Windows
Digital Display
Sorting Digital Channels
All digital channels are
shown in the display in the order that they have been added to the display. To have a
better visibility it is possible to
sort the channels by dragging them one by one to a
new location.
Channel „ADR[3]“ is
dragged with the left mouse
button pressed to a new location inside the digital display.
The gray arrow shows
the location where the channel is inserted to. After releasing the left mouse button
channel „ADR[3]“ will be located between „Check“ and
„Valid“ then.
HIGH level highlighting (shadow display)
If showing a huge number of digital channels in one display it may become difficult to
distinguish between the different signals as the low level of one signal is located near
the high level of the next signal.
Using the special high level highlighting function all signal high levels get a shadow
which allows to easily distinguish between high and low parts of the signals.
The left side button enables/disables the highlighting mode. The display window is
repainted immediately. Please note that the display painting speed is slower with the
mode enabled as much more graphic objects have to be painted.
Combination of Digital Signals to a Bus
SBench 6 handles digital signals as single signals allowing to add them individually to multiple displays. However as digital signals often represent a bus structure, be it address bus or data bus, it is more comfortable to view these digital
signals as a combination and not as single signals. Using the Channel Dialogue it is possible to add bus combinations to digital signals and use them like
a signal itself.
The bus combination is done by marking all single signals that should be combined with left mouse button and either SHIFT or CTRL key then invoking the context menu and using the combine command.
All signals that should be combined are marked with the mouse. One bus can
combine at maximum up to 64 digital channels.
A right mouse click will open the context menu. The context menu shows the
bus combine command as soon as more than one digital signal has been marked
with the mouse. Issuing the „Combine signals to bus“ command will open a separate dialogue as shown below.
Already defined buses are listed under their own root node also showing all signals that have been combined into this bus.
(c) Spectrum GmbH
85
Digital Display
Display Windows
After issuing the combine command the dialogue shown on the right
will open up and allow to define more details on the new bus signal:
A name can be given to the signal that defines the bus and that is
used in the digital display window.
The bus signal color can be selected from all available system colors by clicking on the color button.
Defines the bit ordering of the signal for calculation of the bus values. Choose which bit of the bus is the most significant one (MSB) and
which one is the least significant one (LSB)
The display format defines how the value is calculated for display.
Choose one of the available formats for display:
•
•
•
•
•
HEX = hexadecimal view (base 16)
BIN = binary view (base 2)
OCT = octal view (base 8)
SIGNED = signed integer value (base 10)
UNSIGNED = unsigned integer value (base 10)
The „subordinate“ checkbox will group the single channels under the new bus signal inside the channel dialogue making it immediately
visible where these channels belong now. Uncheck this box if you like to group single channels into multiple buses.
If „Add bus to displays“ is checked the new bus signal will be automatically added to all open digital display windows without the need
to manually drag and drop them to the display.
When checking the „Remove signals“ box all signals that have been combined for a bus will no longer be visible as single signals. This
is a good choice if one has a huge number of digital signals and wants to improve the clearness of the channel dialogue. Even if removed
from the original list the single digital signals are still accessible under the newly generated bus name.
Jump Commands
The digital display offers powerful data navigation functions that allow to jump to specific edges or signal changes with a single mouse clicks.
Furthermore these jump commands also allow to specify how many edges one wants to jump and what is the base anchor for the jump commands.
Jump Overview
Jump commands allow to search for specific edges with just a mouse click and to
navigate very fast inside the digital data.
In general the jump function can detect
positive edges, negative edges, any level
change and pulses of specified length.
The jump command moves one of the both
cursors. As a default the cursor that has
been last touched by the user is moved
with the next command if not selecting a
cursor manually.
The cursor need to be locked to a signal to use the jump buttons. Cursor are
locked by right-clicking on the signal
name and selecting one of the lock commands from the menu. The lock state is
shown by a small dot in cursor color just
above the signal name.
After the cursors have been locked the
jump commands operate on the cursor that has been moved latest. This cursor is shown on the top leftmost position of the display. If necessary
one can switch cursors by clicking here to jump to the other cursor.
On the top of the display some direct jump buttons are located that operate edge by edge. The direct jump commands are explained
further below.
After issuing a jump the cursor is moved to that edge and the edge is shown as small arrow directly on the signal.
For more detailed and powerful jump commands a special jump dialogue is available which is explained below.
86
SBench 6 Software Manual
Display Windows
Digital Display
Direct jump buttons
As shown in the overview there are some jump buttons located on top of the digital display. These jump buttons allow to jump from edge to
edge in any direction. Each command will be executed for the cursor that has been moved last. For example: to place cursor B three positive
edges to the right one then has to move cursor B and press three times the jump to next rising edge button.
Icon from toolbar
Icon from segment
control bar
Description
Jump to the previous rising edge of the marked signal
Jump to the previous falling edge of the marked signal
Jump to the next rising edge of the marked signal
Jump to the next falling edge of the marked signal
Jump to the next level change being either positive or negative edge of the marked signal
Jump to the previous level change being either positive or negative edge of the marked signal
Extended jump dialog
The extended jump dialogue can be issued by clicking the command button from the tool bar. The dialogue can be left open for
navigation purposes and can be docked anywhere inside the window.
Inhere the currently active cursor is shown that will be moved when
issuing a jump command. Automatically the cursor is selected that has
been used latest. By clicking one of the radio buttons one can directly
select a cursor for the next jump operation.
The drop-down list selects the start point for the issued jump command. The different start points are shown below.
Three different edges can be searched by the jump command. The
first line is positive edge, the second line is negative edge while the
third line is any edge (positive or negative)
For each edge command (and pulse also) one can define how
many edges (pulses) should be jumped. Entering a 5 here would move
the cursor by 5 edges of that type in the selected direction.
The left button of each line jump to the previous edge (pulse)
The right button of each line jumps to the next edge (pulse)
When jumping to pulses one can define whether the pulse to detect has to be larger or smaller as a specified time. Using this powerful
function one can by example jump to failure conditions where a pulse is too long than expected.
As soon as the active cursor is locked to a bus signal the „jump to bus value“ feature is enabled. Inhere one can directly jump to a dedicated value that is formed by the bus signals. The value is entered in the same radix that has been defined to show the bus signal.
Jump start points
The jump commands are issued in relation to a position. This position is normally the current cursor position but can also be changed inside
the dialogue. The changed jump anchor is only suitable for commands issued inside the jump dialogue and not for the small jump buttons
that can be directly clicked inside the digital display.
The following anchor types are available inside the drop down menu:
Cursor
Data start/end
Current view start/end
This is the default anchor mode. The current cursor position is used to execute the jump command. The cursor is automatically moved with the jump
allowing to navigate through all data
Beginning/End of the signal is used as a anchor for the jump command. This allows for example to easily jump to a dedicated edge of the signal
acquired.
The current view area inside the display is used as a base. This base will change if you move the current view.
Please note that using a different jump anchor than „cursor“ will mean that the edges/pulses are always counted from that anchor when
issuing a jump command. Jumping to the third pulse when selecting „data start“ will always end up at the third pulse. Issuing the jump command several times will not change the position but one than has to change back to „cursor“ anchor to navigate further.
(c) Spectrum GmbH
87
Digital Display
Display Windows
Segmented View (Professional Version)
This is a description of the display of segmented signals as generated when doing an acquisition with Multiple Recording mode, Gated Sampling mode or ABA mode. The segmented display is only available if at least
one signal shown in the display has been acquired with one of the segmented modes. The segmented display
is not available when doing single acquisitions.
This display mode will show the segments of the signal incorporating timestamp values if acquired and allows additional navigation inside
the signal based on the segments. The standard display will automatically switch to a segmented display if a segmented signal acquired with
Multiple Recording, Gated Sampling or ABA mode is shown inside the display. Timestamp values will be used for display if they have been
acquired. Please check to have timestamp acquisition activated if you like to have the timestamp information of the signals shown.
Hardware Setup
The signal segmentation is selected inside the
Mode setup window as shown in button (1).
Segmented display is available for standard as
well as for FIFO signals and works for Multiple
Recording, Gated Sampling with Timestamps
and ABA mode.
Please note that there is no segmented view if
using Gated Sampling with no Timestamps activated. As the length of the gates is depending
on an external signal SBench 6 has to know the
length of the gate signals by acquiring timestamps to show any segment information then.
The timestamp mode has to be activated in addition to this if timestamp
information is interesting for the user. Any of the available timestamp
modes can be selected from the drop-down list under (1).
If Gated Sampling is activated the timestamp information is needed to
show segmented information. Multiple Recording signals can also be
shown without timestamp information just showing the segment borders
with no time position information then.
Overview
All segment control commands as shown under (3) and
further below are operating on
the marked signal and are taking
positions and segment sizes from
this signal. Marking of a signal is
done by simply left clicking on the
name. The marked signal is highlighted with a border in the signal
color.
If a signal is marked as
source for segment control as
shown under (2) these additional
segment control buttons appear.
The segment control buttons can
also be added to the toolbars by
just using the standard toolbar editing functions. The control buttons are explained in further
detail in the next chapter.
Segments are shown separately showing exact start and
end sample of the segment
marked with a gray line. The delimiter lines can be switched off using a dedicated button as shown below.
The void area between the segments is defined by the timestamps from the hardware. Segments are positioned depending on the timestamps read for this segment. The void space can be switched off by a dedicated button as shown below having the original signal shown
stacked again.
88
SBench 6 Software Manual
Display Windows
Digital Display
If activated the exact timestamp position (indicating the trigger position of the segment) is shown on screen. The timestamp display can
be activated/deactivated using a dedicated button as shown below.
Segmented View Commands
The following buttons are shown in a small form also in the segment control bar on top of the display as listed under topic (3) in above overview. The buttons can also be added to the standard display toolbar using the normal toolbar edit commands.
All jump commands will not change the zoom settings. Jumping to another segment will scroll the screen to that segment having the same x
offset from the beginning of the segment as before:
Icon from toolbar
Icon from segment
control bar
Description
Jump to first acquired segment of the signal
Jump to previous acquired segment of the signal
Jump to a given segment number. After pressing this button an input dialogue is shown where you can enter the number of the
segment where to jump to. Segment numbering starts with zero.
Jump to next acquired segment
Jump to last acquired segment
Show complete segment. The command will change the zoom settings of the x axis to show the full segment that is currently leftmost inside the display window. The left border of the visible area is the start of the segment and the right border is the end of the
segment.
Jumps to trigger position inside the current segment. The trigger position will be in the middle of the screen afterwards
The following commands are available in the display toolbar and are visible as soon as a segmented signal is shown:
This commands activates/deactivates the display of the segment start and end borders. If showing several segments on the screen it might
be better visible if not showing the segment borders with an extra line.
This command activates/deactivates the display of the timestamp line and timestamp value.
Using this command one can switch off the segmented display and show the signal without gaps related to timestamps. Each segment
will directly be followed by the next segment then. The x-axis will no longer show the real time scale but a compressed one without taking
the timestamps into account.
(c) Spectrum GmbH
89
FFT Display
Display Windows
FFT Display
Overview
Please have a look at the „Common Functions“ sub-chapter to get general information and to see how displays are generated, how signals
are added to displays, how scrolling and zooming is used, how cursor measurement functions are used and how display synchronization is
working. This chapter will only concentrate on the special functions of this display type.
The following screenshot gives an overview on a typical FFT setup including time domain signals, FFT calculation, FFT display and additional
FFT spectrum based calculations:
The time signals are located in the channel dialogue group by the data acquisition card they have been generated by. The signals are
shown in an analogue display window.
The FFT signals that are generated are also listed in the channel dialogue and have their own branch there. In our example one FFT
spectrum is calculated from AI-Ch0. The FFT spectrum is shown in an extra FFT display that is shown at the bottom of the tiled display.
The FFT window has its own two measurement cursors which shows the related frequency as well as the related level in the selected
scaling factor. The measurement cursors are moved by left and right mouse buttons.
The info dialogue has a new branch for the cursor measurement results of the FFT display(s). Results of the current location of cursor A
and cursor B are shown as well as the difference between both cursors.
In our example we have issued two additional calculations (SNR and THD) based on the FFT spectrum. These are listed under the signal
itself and are updated automatically as soon as the FFT spectrum is updated.
90
SBench 6 Software Manual
Display Windows
FFT Display
FFT Calculation
Please see the „Calculations“ chapter to see more
general information about
calculations.
A FFT Display is automatically generated as soon as
a FFT calculation is issued.
A FFT calculation is started
from the channel dialogue
for one or more channels
at the same time by marking the channels with the
mouse and clicking the
right mouse button. The
FFT calculation is located
under the „Signal Calculations“ folder inside the calculations tree.
The same FFT calculation
can be found if going through the menu „New“. Inhere the analog signals for which the FFT calculation should be done must be selected
manually.
The FFT calculation has its own setup dialogue that allows to select different scalings for the signal, a weighting window and some other
options:
This area shows the selected signals for the calculation.
Each calculation can be issued for one or several signals, each
running the calculation independent then. To modify the list of
source signals the „Select Channels“ button can be used.
The destination channel name is the name under which the
newly generated signal is used. As default the name is automatically generated by a function prefix and the source signal name
as postfix. It is possible write into this input field o give the newly
generated signal an other name.
The store to cache option is the default setup for a signal calculation. Calculated data is stored into cache in memory giving
the best performance. If the cache is full data is stored into a temporary file. In either way, once calculated the new signal can always be exported to a file.
Using the store to file option data is always stored on the
hard disk. This file is a valid SBench 6 file and can be opened
for other purposes. If checking the „Autostore“ option the files
will get an ascending index and each calculation (meaning
each new acquisition) a new data file is generated.
The Calculation Area defines the part of the source signal
that is used for calcualtion. It is possible to use the complete signal what is the default as well as just using the part of the signal
that is the current view in the display window or the part of the signal that is located in between the two measurement cursors. Using one of
the latter calculation areas the calculation automatically restarts as soon as the area has been changed by zooming/moving the cursors. If
calculating single values the used calculation area is shown next to the resulting figure in the info dialog. The following symbols are used:
complete signal ( ), current view ( ) and cursor ( ).
If using one of the calculation areas „current view“ or „between cursors“ one has to select the source display from which these settings are
taken.
Checking this box (default) will automatically update the calculation as soon as the base signal will change its content or the calculation
area will change. Unchecking this box would only start the calculation once and hold the calculated figure until the calculation is started
again.
Add to displays (default checked) will automatically add the new calculated signals to a matching display. If no display is currently shown
a new matching display is automatically generated.
(c) Spectrum GmbH
91
FFT Display
Display Windows
The weighting window is used to optimize the FFT results. Different kinds of pre-defined weighting windows are available that pre-filter
the source analog signal before doing the FFT calculation.
5 different signal y axis scalings are available to show the FFT spectrum in the preferred scaling in screen:
• Voltage: pure linear voltage result of the FFT spectrum.
• dBFS (full scale): logarithmic scaling related to the theoretical maximum (full scale) of the source signal.
• dBc (carrier): logarithmic scaling related to the carrier frequency which is examined as largest frequency part in the signal without taking
DC level into consideration.
• dBm: logarithmic scaling related to 1mW.
• dBuV: logarithmic scaling related to 1 micro Volt.
THe Zero Padding function will add a zero signal around the selected signal source. This will increase the frequency resolution and decrease the shown signal level. Zero Padding can be used if a small peak like an Ultrasound burst should be analyzed with FFT with a fine
frequency resolution.
Harmonics Cursor
A special cursor mode is available for the FFT display: the harmonics cursor. Inhere the cursor is multiplied by additional cursor lines each
located at one of the harmonics frequencies of the current cursor position. Using this cursor one can easily see which of the frequency lines
is just a harmonics line of a carrier and which one is a spurious part having another source.
The harmonics cursor is activated by right clicking into the FFT display and selecting the „Setup
harmonics cursor...“ from the context menu. Each of the two measurement cursors can be programmed separately:
The checkbox is used to activate the harmonics cursor mode for cursor A. After checking all
the detailed harmonics cursor settings are active and can be set below.
The number defines the harmonic frequencies that should be shown on top of the base cursor.
As high frequency harmonics parts that are outside the FFT plot on terms of frequency may
be mirrored into lower frequency it is possible to automatically extend the harmonics cursor into
mirror frequencies. If activated harmonic cursor lines that reach the right end of the FFT plot are
not invisible any more but will return as a mirror frequency cursor.
When using the mirror cursor function it is necessary to know the nyquist frequency of the
FFT plot. If the cursor is locked to a FFT signal the nyquist frequency of that signal is used. Otherwise as a standard the highest frequency shown in the plot is used. But as the mirrored parts
may also come from some external components one can also type in the nyquist frequency by himself.
The lower box shows all the same settings for cursor B. Each cursor can be individually programmed to show harmonics lines.
The harmonics cursor shows the normal cursor line as full
line with a arrow marker at the bottom of the line. The
number of harmonics is shown as dotted lines in the correct x axis position related to the current position of the
main cursor.
The main cursor is moved by the mouse as before. The
harmonics cursor will automatically locate the position of
potential harmonic frequencies related to the current cursor position.
In our example we see that the main cursor is placed directly next to full scale sine signal and two spurious parts
of the frequency signal can be determined as harmonics
2 and harmonics 3 of this full scale sine signal.
The cursor is placed directly next to the signals for better
visibility.
92
SBench 6 Software Manual
Display Windows
Histogram Display
Histogram Display
Overview
Please have a look at the „Common Functions“ sub-chapter to get general information and to see how displays are generated, how signals
are added to displays, how scrolling and zooming is used, how cursor measurement functions are used and how display synchronization is
working. This chapter will only concentrate on the special functions of this display type.
The histogram function analyzes and displays a source signal concerning the density of the data. Each potential state the signal can have
is correlated to one data bin of the same value. For example a 12 bit A/D converted analog signal will therefore have 4096 data bins
ranging from -2048 to +2047. The histogram display can be used to analyze source signals.
The time signals are located in the channel dialogue group by the data acquisition card they have been generated by. The signals are
shown in an analogue display window.
The histogram signals that are generated are also listed in the channel dialogue and have their own branch there. In our example one
histogram signal is calculated from AI-Ch0. The histogram signal is shown in an extra histogram display that is shown at the bottom of the
tiled display.
The histogram window has its own two measurement cursors which shows the related data bin as well as the related value. The measurements cursors are moved by left and right mouse buttons.
The info dialogue has a new branch for the cursor measurement results of the histogram display(s). Results of the current location of cursor
A and cursor B are shown as well as the difference between both cursors.
In our example we have issued an additional calculation (Maximum) based on the histogram signal. The result is listed under the signal
itself and is updated automatically as soon as the histogram signal is updated.
(c) Spectrum GmbH
93
Histogram Display
Display Windows
Histogram Calculation Setup
A calculated signal has the following general calculation settings:
This area shows the selected signals for the calculation. Each calculation can be issued for one or several signals, each running the calculation
independent then. To modify the list of source signals
the „Select Channels“ button can be used.
The destination channel name is the name under
which the newly generated signal is used. As default
the name is automatically generated by a function
prefix and the source signal name as postfix. It is possible write into this input field o give the newly generated signal an other name.
The store to cache option is the default setup for
a signal calculation. Calculated data is stored into
cache in memory giving the best performance. If the
cache is full data is stored into a temporary file. In either way, once calculated the new signal can always
be exported to a file.
Using the store to file option data is always stored on the hard disk. This file is a valid SBench 6 file and can be opened for other purposes.
If checking the „Autostore“ option the files will get an ascending index and each calculation (meaning each new acquisition) a new data file
is generated.
The Calculation Area defines the part of the source signal that is used for calcualtion. It is possible to use the complete signal what is the
default as well as just using the part of the signal that is the current view in the display window or the part of the signal that is located in
between the two measurement cursors. Using one of the latter calculation areas the calculation automatically restarts as soon as the area has
been changed by zooming/moving the cursors. If calculating single values the used calculation area is shown next to the resulting figure in
the info dialog. The following symbols are used: complete signal ( ), current view ( ) and cursor ( ).
If using one of the calculation areas „current view“ or „between cursors“ one has to select the source display from which these settings are
taken.
Checking this box (default) will automatically update the calculation as soon as the base signal will change its content or the calculation
area will change. Unchecking this box would only start the calculation once and hold the calculated figure until the calculation is started
again.
Add to displays (default checked) will automatically add the new calculated signals to a matching display. If no display is currently shown
a new matching display is automatically generated.
Special Histogram Display Functions
Bar sample display
The button changes between standard display with a line connecting each value and a bar
display as shown on the right side where each value is shown as a rectangle.
94
SBench 6 Software Manual
Calculations
Calculation Functions
Calculations
SBench 6 is capable of doing a lot of calculations on the acquired or loaded data. Calculation results as well as cursor measurement functions
are shown in the information window. Details on cursor measurement commands are shown in the display window chapter.
Calculation Functions
Calculation functions offer a very fast and versatile way to analyze data without the need for additional software tools. SBench 6 is permanently enhanced by new calculation functions. Please check the latest software version to have access to all calculation functions.
Spectrum Is open to add new calculation functions on customer request. Please check with our team what
additional calculations are possible if you have the need for something not yet implemented.
Adding a Calculation from the Channel Dialogue
Using the channel dialogue is the
preferred way to generate new
calculations as this allows to directly select the source signal.
With the new signal selection one
can use the context menu to start a
new calculation. Please note that
the context menu will only show
calculations that can run with the
current signal selection.
The context menu is started clicking with the right mouse button on
the signal selection.
All calculations are grouped beneath the „Calculation“ menu entry.
A calculation can be started for
single signals as well as for multiple signals each having the same
calculation setup as the others. Please select either a single signal or multiple signals as explained below:
Multiple channels can be
selected in different ways:
Selecting the root tree element („Analog Input“ or
„Digital Input“) will select
all channels of that type for
further setup.
Selecting a whole card will
affect all channels of that
particular card.
Selecting a single channel
will only affect this single
channel then.
All these kinds of selections
can be combined by using
the CTRL (non adjacent
channels) or the SHIFT (adjacent channels only) key
while left clicking on the entries. With the help of the
CTRL and SHIFT keys multiple channels or multiple
cards with their channels
can be selected for further
setup or dragging.
(c) Spectrum GmbH
95
Calculation Functions
Calculations
Adding a Calculation from the Menu
All calculations are also accessible from the main menu as shown on the right
hand side. The calculations are found under the menu tab „New“.
When using this way to generate a new calculation one needs to select the signals which are used for the calculation manually from the calculation setup
screen which will open directly after having selected the new calculation.
Setup of a Single Value Calculation
Single value calculation have one or multiple single values as a result like signal minimum and maximum. The resulting values are shown
inside the information window which is described further below.
A single value calculation has the following general calculation settings:
This area shows the selected signals for the calculation. Each calculation
can be issued for one or several signals, each running the calculation independent then. To modify the list of source signals the „Select Channels“ button
can be used.
This area contains individual calculation settings which are depending on
the type of calculation. The individual settings are exlained in detail in the calculation list.
It is possible to define a number of acquisitions that should be performed
to get an averaged calculation result. The resulting value is the average of the
values for each single acquisition then. As an example: a „Maximum“ calculation with an averaging factor of „1“ will change the value on each acquisition and return Max[current data]. A „Maximum“ calculation with an
averaging factor of „2“ will change the value on each second acquisition and
will return (Max[current data] + Max[last data]) / 2.
The Calculation Area defines the part of the source signal that is used for calcualtion. The used calculation area is shown next to the
resulting figure in the info dialog. It is possible to use the complete signal ( ) what is the default as well as just using the part of the signal
that is the current view in the display window ( ) or the part of the signal that is located in between the two measurement cursors ( ).
Using one of the latter calculation areas the calculation automatically restarts as soon as the are has been changed by zooming/moving the
cursors.
If using one of the calculation areas „current view“ or „between cursors“ one has to select the source display from which these settings are
taken.
Checking this box (default) will automatically update the calculation as soon as the base signal will change is content or the calcualtion
area will change. Unchecking this box would only start the calculation once and hold the calculated figure until the calculation is started
again.
Setup of a Signal generating Calculation
Some calculation functions not only generate single result values but generate new signals again like the FFT function or the histogram function.
These signals can be used for further calculations or can be shown directly inside a matching display window.
96
SBench 6 Software Manual
Calculations
Calculation Functions
A calculated signal has the following general calculation settings:
This area shows the selected signals for the calculation. Each calculation can be issued for one or several signals, each running the calculation
independent then. To modify the list of source signals
the „Select Channels“ button can be used.
The destination channel name is the name under
which the newly generated signal is used. As default
the name is automatically generated by a function
prefix and the source signal name as postfix. It is possible write into this input field o give the newly generated signal an other name.
The store to cache option is the default setup for
a signal calculation. Calculated data is stored into
cache in memory giving the best performance. If the
cache is full data is stored into a temporary file. In either way, once calculated the new signal can always
be exported to a file.
Using the store to file option data is always stored on the hard disk. This file is a valid SBench 6 file and can be opened for other purposes.
If checking the „Autostore“ option the files will get an ascending index and each calculation (meaning each new acquisition) a new data file
is generated.
The Calculation Area defines the part of the source signal that is used for calcualtion. It is possible to use the complete signal what is the
default as well as just using the part of the signal that is the current view in the display window or the part of the signal that is located in
between the two measurement cursors. Using one of the latter calculation areas the calculation automatically restarts as soon as the area has
been changed by zooming/moving the cursors. If calculating single values the used calculation area is shown next to the resulting figure in
the info dialog. The following symbols are used: complete signal ( ), current view ( ) and cursor ( ).
If using one of the calculation areas „current view“ or „between cursors“ one has to select the source display from which these settings are
taken.
Checking this box (default) will automatically update the calculation as soon as the base signal will change its content or the calculation
area will change. Unchecking this box would only start the calculation once and hold the calculated figure until the calculation is started
again.
Add to displays (default checked) will automatically add the new calculated signals to a matching display. If no display is currently shown
a new matching display is automatically generated.
(c) Spectrum GmbH
97
Calculation Functions
Calculations
Different Calculation Areas
The calculations under SBench 6 can run for different calculation areas giving you a wide variety of application areas using calculations,
cursors and display windows all together.
Complete signal area, shown in the calculation results as
. Inhere the complete signal is used for the calculation independent of the
current display view or the cursor position. In our example the complete signal has 9 full signal cycles which is shown as a calculation result
in the information window under (1).
The complete signal area is the default setup for new calculations. Using the complete signal for calculation base may lead into long running
calculations if using large signals.
Current view, shown in the calculation results as
. Inhere the area of the signal is used for the calculation that is shown inside the
display window. If the zoom factors or the scrolling position of the signal is changed the result will be recalculated. In our example 4 full
cycles are shown inside the display which is shown as a calculation result in the information window under (2).
Calculation between cursors, shown in the calculation results as
. Inhere the area of the signal is used for the calculation that is in
between the two measurement cursors. If the cursors are not activated the calculation will show no result. If the cursors are move the the base
for the calculation is changing and the result is recalculated. In our example only one full cycle is shown between the cursors which is shown
as a calculation result in the information window under (3)
Additional Calculation Commands
Once started the calculations have some commands available like edit, delete, start and
stop which can be issued using the context menu of the calculation. The context menu is invoked by right clicking on the calculation result entry in the information dialogue.
Calculation Start
This command restarts the calculation if it has been stopped before and is done in a loop
or it starts the calculation one time to get a result based on the current signal.
Calculation Stop
This allows to stop the automatic re-calculation of the result as it is done if the „keep in the
loop“ checkbox is activated when starting the calculation. After stopping the calculation the
last result is freezed and no longer changed if the source signal is updating.
Calculation Reset
Some calculations require a reference level for further calculations. Using the rest command
this reference level is reset to the starting condition again.
Calculation Settings...
Calls the initial start-up settings of the calculation again allowing to change the calculation area or some additional calculation settings.
98
SBench 6 Software Manual
Calculations
Calculation Functions
Copy to Clipboard
Using this function the current result including the calculation name is copied to the clipboard
for further documentation. It is possible to mark several lines of the information window with
the CTRL key and the left mouse button to copy multiple result lines to the clipboard.
The clipboard can then be pasted into a document to have the results directly available for
further documentation or for further calculations using a spreadsheet program like Microsoft
Excel.
Below is the resulting past command from a text editor:
Signal Info
Average:
Effective:
Maximum:
Minimum:
Peak-Peak:
25.381 mV
659.978 mV
933.105 mV
-933.594 mV
1.867 V
Delete
The delete command deletes the running calculation from SBench 6. Please have a look at the next command entry to see how to just temporarily disable the view of a calculation result without deleting the calculation and all its settings from the system.
Settings...
The settings command allows to temporarily hide entries from the information window while still
keeping them in the calculation and update loop. This allows to get maximum overview without
loosing extended calculation settings.
After issuing the „Settings...“ command the information window turns into the right hand giving
each element which is displayed here its own show/hide checkbox.
In our example we hide the cursor information of Cursor B and Cursor B-A and also all calculation results of channel AI-Ch01. These hidden result lines are printed in gray to indicate that
they’re no longer visible.
After pressing the „Ok“ button the new setup will be selected for the information window and
will stay valid until changed again.
Jump to Position in...
Using the jump command one can show the found calculation results
inside a display window. This command is only available if the calculation returns a single position inside a signal like Minimum or Maximum does.
When issuing the command one is asked to select one of the current
displays to show the position in. The display area is shifted to have the
x-axis position in the middle of the screen. The zoom settings are not
changed for this.
(c) Spectrum GmbH
99
Calculation Functions
Calculations
Nested Calculations
Each calculated signal can be the source for a new calculation again forming a nested calculation tree. In the example we have one FFT
calculation running with an additional „Maximum“ calculation and an additional „SNR“ calculation running on the FFT itself:
AI-Ch00 is the source signal for the FFT calculation. The waveform of AI-Ch00 is displayed on the top right window in the display area.
The FFT calculation has been issued from here with the context menu.
The FFT signal is shown under its own branch as analog signal. The FFT spectrum is displayed in the lower right window in the display
area.
If starting new calculations on the FFT signal by using the context menu directly from the channel window a new branch is shown in the
information window grouping all results that are based on the FFT_AI-Ch00 signal.
The calculation results are shown beneath the signal branch (3) and show the results based on the FFT signal. Inhere calculations can be
deleted an edited.
100
SBench 6 Software Manual
Calculation Function List
Simple Measurements
Calculation Function List
Simple Measurements
The simple measurements are already available in the base license of SBench 6 and offer basic measurement functionality as known from
simple oscilloscopes. They calculate single values from the input signal.
Within the calculation setup one can specify the number of acquisitions that are used to average the result. If for example 4 acquisitions are
entered the resulting maximum value will be (Max[Acq1] + Max[Acq2] + Max[Acq3] + Max[Acq4]) / 4
Name
Signal Info
Absolute Maximum
Absolute Minimum
Maximum
Minimum
Average
Peak-Peak
Effective
Slope
Icon
Description
Gives a signal information list combination of all relevant sub calculations under this chapter. Using the signal info will generate a summary including
maximum and minimum, average, peak to peak and effective.
This special function will run through the number of acquisitions specified in the average loop and instead of giving the average maximum as the standard maximum function is doing it will return the absolute maximum (the highest maximum that was calculated through the acquisition loop)
Returns the absolute minimum which is the lowest minimum found in an acquisition loop.
Returns the signal maximum within the specified area. The function returns the maximum value as well as the position where this maximum value was
found
Returns the signal minimum including the position within the specified area.
Returns the signal average value by summing all samples of the signal and dividing them through the number of samples.
Returns the difference between maximum and minimum of the signal.
Returns the effective value of the peak to peak value being (Max - Min) /2 / SQRT(2)
Returns the slope between left side and right side of calculation area. If using the cursors as calculation area one can calculate the acceleration of the
signal as [voltage difference] / [time difference]
Cycle Based Measurements (Pro Version)
Theory
The cycle based measurements only work on periodical signals like sine, rectangle, triangle or
something like this and first analyze the signal to detect the cycles of the signal. The functions
will then analyze each cycle for itself returning the requested value. All cycle values are then
analyzed in a final step returning the minimum, maximum, average and deviation of each of the
values.
Using this functionality one can analyze periodical signals very deeply with seeing the variation
of the signal characteristics and detection potential problems by examination of minimum and
maximum returned figures.
In our example we see a very small frequency variation throughout our analyzed signal and see that the signal is only varying between
585.674 Hz and 585.942 Hz with an average frequency of 585.821 Hz and a very small deviation (difference from the average value) of
only 79.860 mHz.
Settings
There are some special individual level settings needed for all cycled calculations.
The level settings can be automatically derived from the signal (default behaviour) or they can be individually programmed to matching values depending
on the source signals. Individual level programming can for example be used
if the zero level of the source signal is known and may be at a different place
to the calculated one due to signal attenuation or overshoots.
Each level definition is shown inside the setup dialogue as seen on the right.
The signal zero level is needed for all cycled calculations as the cycle detection itself is based on this value and cycle start/end transitions are detected
when crossing this level.
The low level is used for all transition calculating functions like the rise time
and fall time calculation. The low level defines the lower border from which
these figures are calculated of (rise time for example is the time the signal
needs to come from low level to high level.
The high level is used for all transition calculating functions like the rise time and fall time calculation. The high level defines the higher
border from which these figures are calculated of
A click on the „...“ button next at the right end of each setup line opens an additional dialogue that allows to program these settings very
detailed:
(c) Spectrum GmbH
101
Cycle Based Measurements (Pro Version)
Calculation Function List
The crosslevel setup allows to either program the crosslevel relatively or absolute:
Marking this checkbox defines the level relatively to the current signal
min and max value. The level is then recalculated on every new acquisition
according to the new signal shape.
Enter the relative level in percent of the min to max range. A level of
50% will therefore be directly in the middle between min and max.
Marking this checkbox defines the level as an absolute voltage value independent of the current signal shape or level.
Enter the voltage value for the level in mV. Please be sure to select a value that is in the range of the current signal. If the signal is outside
the defined levels the calculation won’t return correct results.
Cycled Calculation Example
As a first step the zero transitions
are detected to split the signal
into single cycles.
Therefore a level can be programmed which is used as a zero
level of the signal or the calculation routine can calculate this
zero level automatically by measuring max and min value and
setting the zero level in relation to
this (in our example 50%). The
behavior can be programmed in
the settings as shown above.
End of a cycle/start of next cycle
is detected as soon as a transition
over the zero level has taken
place. The very exact transition
position is calculated by a linear
approximation between the samples.
After the exact cycle transitions
have been detected each cycle is
determined for himself calculating the figures of interest for each
cycle.
In our example we see the different minimum and maximum calculations for each cycle.
102
SBench 6 Software Manual
Calculation Function List
Cycle Based Measurements (Pro Version)
As the last step all cycle based results are analyzed and form the
results.
All single values of each cycle are
examined for the highest and
lowest value, summed and averaged and the deviation is calculated.
As a result one has 4 different values for each selected cycled calculation.
Function List
The following list shows all cycle based calculations that have been available when printing this manual. Please note that each single calculation will return 4 values: Average (shown as the direct calculation result), highest (maximum), lowest (minimum), deviation:
Name
Cycle Signal Info (AV)
Num Cycles
Frequency
Period
Duty Cycle
Pos Width
Neg Width
Description
Drawing
Shows a summary of all the following single calculation functions
but only showing the average value for each entry without minimum, maximum or deviation.
Calculates the number of full cycles that is visible within the calculation area. A full cycle is either starting with a rising crossing through
the zero level and ending with the next rising crossing or it is starting with a falling crossing and ending with the next falling crossing.
The frequency calculated as 1/period given in Hertz.
The exact time for one cycle given as time value in either nano seconds (ns), micro second (us) or milli seconds (ms)
The relation of positive width (high pulse) to negative width (low
pulse) given as a percentage value.
The width of the high pulse being the part of the signal above the
zero level given as time value
The width of the low pulse being the part of the signal below the
zero level given as time value.
(c) Spectrum GmbH
103
Enhanced Measurements (Pro Version)
Name
Cycle Min
Cycle Max
Cycle Average
Cycle Peak-Peak
Cycle Effective
Cycle Rise Time
Cycle Fall Time
Calculation Function List
Description
Drawing
The minimum signal level within this cycle given in the unit of the
signal itself.
The maximum signal level within this cycle given in the unit of the
signal itself.
The average signal level within one cycle given in the unit of the signal itself. The average level is calculated by summing all samples
within the cycle and dividing them by the number of summed samples.
The difference between maximum and minimum level within one
cycle given in the unit of the signal itself.
The effective value of the peak to peak value being (Peak - Peak) /
2 / square root (2)
The rise time is defined to be the time the signal needs from crossing
the low level (normally 10% of signal swing) to high level (normally
90% of signal swing). The value is given as a time value.
The fall time is defined to be the time the signal needs from crossing
the high level (normally 90% of signal swing) to the low level (normally 10% of signal swing). The value is given as a time value.
Enhanced Measurements (Pro Version)
Inhere some special functions are grouped that offer extended functionality and that don’t fall under one of the other calculation groups:
Name
RMS Noise
Sine Info
Description
Calculates the RMS (root mean square) value of the selected source signal. The result is the deviation from the zero level. When using the calculation function
on an open A/D input one gets the zero noise level of the input.
This special calculation function is working on pure sine signals and gives some basic information of the measured sine signal like maximum and minimum, peak to peak and effective level as well as the signal offset.
As a special function the current sine signal level is calculated as an attenuation to a reference level. This is helpful if checking filter plots or checking analog parts that have filtering
characteristics.
During the calculation setup one has the option to select a reference level as peak to peak
value on which the attenuation is calculated or one simply enters a zero value to tell
SBench 6 using the measured value of the first calculation as reference for following calculations.
This function will react to the reset command (issued from the context menu of the calculation result by clearing the reference level and taking the next measurement after the reset signal for a new reference.
104
SBench 6 Software Manual
Calculation Function List
Signal Calculations (Pro Version)
Signal Calculations (Pro Version)
The following calculation functions generate a new signal as a result of the calculation. The new signal can be used like an acquired signal
as base for new calculations, export, displays or print outs.
Analog Calculation
The analogue calculation function allows to combine two analogue signal channels sample by sample by using standard mathematical functions like addition, difference, multiply or division. The result is a new analogue signal which can be displayed and used as a base for further
calculations then.
This area shows the selected signals for
the calculation. This calculation needs a defined number of signals as source. Each signal
is shown in its own line explaining the source
signal on the left and showing the selected signal on the right. The signal selection is
changed by double clicking in the signal
name.
The destination channel name is the name
under which the newly generated signal is
used. As default the name is automatically
generated by a function prefix and the source
signal name as postfix. It is possible to write
into this input field or to give the newly generated signal an other name.
The store to cache option is the default setup for a signal calculation. Calculated data is
stored into cache in memory giving the best
performance. If the cache is full data is stored into a temporary file. In either way, once calculated the new signal can always be exported
to a file.
Using the store to file option data is always stored on the hard disk. This file is a valid SBench 6 file and can be opened for other purposes.
If checking the „Autostore“ option the files will get an ascending index and each calculation (meaning each new acquisition) a new data file
is generated.
The Calculation Area defines the part of the source signal that is used for calcualtion. It is possible to use the complete signal what is the
default as well as just using the part of the signal that is the current view in the display window or the part of the signal that is located in
between the two measurement cursors. Using one of the latter calculation areas the calculation automatically restarts as soon as the area has
been changed by zooming/moving the cursors. If calculating single values the used calculation area is shown next to the resulting figure in
the info dialog. The following symbols are used: complete signal ( ), current view ( ) and cursor ( ).
If using one of the calculation areas „current view“ or „between cursors“ one has to select the source display from which these settings are
taken.
Checking this box (default) will automatically update the calculation as soon as the base signal will change its content or the calculation
area will change. Unchecking this box would only start the calculation once and hold the calculated figure until the calculation is started
again.
Add to displays (default checked) will automatically add the new calculated signals to a matching display. If no display is currently shown
a new matching display is automatically generated.
Inhere the operation that should be performed on the two signals is selected. Please choose one operation from the drop down list. The
function allows addition (ADD), substraction (SUB), multiplication (MUL) and division (DIV) of two signals.
(c) Spectrum GmbH
105
Signal Calculations (Pro Version)
Calculation Function List
Digital Calculation
The digital calculation routine allows the logical combination of two digital signals sample by sample:
This area shows the selected signals for
the calculation. This calculation needs a defined number of signals as source. Each signal
is shown in its own line explaining the source
signal on the left and showing the selected signal on the right. The signal selection is
changed by double clicking in the signal
name.
The destination channel name is the name
under which the newly generated signal is
used. As default the name is automatically
generated by a function prefix and the source
signal name as postfix. It is possible to write
into this input field or to give the newly generated signal an other name.
The store to cache option is the default setup for a signal calculation. Calculated data is
stored into cache in memory giving the best
performance. If the cache is full data is stored into a temporary file. In either way, once calculated the new signal can always be exported
to a file.
Using the store to file option data is always stored on the hard disk. This file is a valid SBench 6 file and can be opened for other purposes.
If checking the „Autostore“ option the files will get an ascending index and each calculation (meaning each new acquisition) a new data file
is generated.
The Calculation Area defines the part of the source signal that is used for calcualtion. It is possible to use the complete signal what is the
default as well as just using the part of the signal that is the current view in the display window or the part of the signal that is located in
between the two measurement cursors. Using one of the latter calculation areas the calculation automatically restarts as soon as the area has
been changed by zooming/moving the cursors. If calculating single values the used calculation area is shown next to the resulting figure in
the info dialog. The following symbols are used: complete signal ( ), current view ( ) and cursor ( ).
If using one of the calculation areas „current view“ or „between cursors“ one has to select the source display from which these settings are
taken.
Checking this box (default) will automatically update the calculation as soon as the base signal will change its content or the calculation
area will change. Unchecking this box would only start the calculation once and hold the calculated figure until the calculation is started
again.
Add to displays (default checked) will automatically add the new calculated signals to a matching display. If no display is currently shown
a new matching display is automatically generated.
Inhere the operation that should be performed on the two signals is selected. Please choose one operation from the drop down list. The
function allows logical and combination (AND), logical or combination (OR) and logical exclusive or combination (XOR), as well as their
respective inverting pendants NAND, NOR and XNOR.
106
SBench 6 Software Manual
Calculation Function List
Signal Calculations (Pro Version)
FFT
The FFT calculation has its own setup dialogue that allows to select different scalings for the signal, a weighting window and some other
options:
This area shows the selected signals for the calculation.
Each calculation can be issued for one or several signals, each
running the calculation independent then. To modify the list of
source signals the „Select Channels“ button can be used.
The destination channel name is the name under which the
newly generated signal is used. As default the name is automatically generated by a function prefix and the source signal name
as postfix. It is possible write into this input field o give the newly
generated signal an other name.
The store to cache option is the default setup for a signal calculation. Calculated data is stored into cache in memory giving
the best performance. If the cache is full data is stored into a temporary file. In either way, once calculated the new signal can always be exported to a file.
Using the store to file option data is always stored on the
hard disk. This file is a valid SBench 6 file and can be opened
for other purposes. If checking the „Autostore“ option the files
will get an ascending index and each calculation (meaning
each new acquisition) a new data file is generated.
The Calculation Area defines the part of the source signal
that is used for calcualtion. It is possible to use the complete signal what is the default as well as just using the part of the signal
that is the current view in the display window or the part of the signal that is located in between the two measurement cursors. Using one of
the latter calculation areas the calculation automatically restarts as soon as the area has been changed by zooming/moving the cursors. If
calculating single values the used calculation area is shown next to the resulting figure in the info dialog. The following symbols are used:
complete signal ( ), current view ( ) and cursor ( ).
If using one of the calculation areas „current view“ or „between cursors“ one has to select the source display from which these settings are
taken.
Checking this box (default) will automatically update the calculation as soon as the base signal will change its content or the calculation
area will change. Unchecking this box would only start the calculation once and hold the calculated figure until the calculation is started
again.
Add to displays (default checked) will automatically add the new calculated signals to a matching display. If no display is currently shown
a new matching display is automatically generated.
The weighting window is used to optimize the FFT results. Different kinds of pre-defined weighting windows are available that pre-filter
the source analog signal before doing the FFT calculation.
5 different signal y axis scalings are available to show the FFT spectrum in the preferred scaling in screen:
• Voltage: pure linear voltage result of the FFT spectrum.
• dBFS (full scale): logarithmic scaling related to the theoretical maximum (full scale) of the source signal.
• dBc (carrier): logarithmic scaling related to the carrier frequency which is examined as largest frequency part in the signal without taking
DC level into consideration.
• dBm: logarithmic scaling related to 1mW.
• dBuV: logarithmic scaling related to 1 micro Volt.
THe Zero Padding function will add a zero signal around the selected signal source. This will increase the frequency resolution and decrease the shown signal level. Zero Padding can be used if a small peak like an Ultrasound burst should be analyzed with FFT with a fine
frequency resolution.
The FFT signal that is generated can be displayed in an FFT display window as already explained further above in the Display chapter. Please
see this chapter for more information on the signal display features.
(c) Spectrum GmbH
107
Signal Calculations (Pro Version)
Calculation Function List
Histogram
The histogram function analyzes and displays a source signal concerning the density of the data. Each potential state the signal can have
is correlated to one data bin of the same value. For example a 12 bit A/D converted analog signal will therefore have 4096 data bins
ranging from -2048 to +2047. The histogram display can be used to analyze source signals.
A calculated signal has the following general calculation settings:
This area shows the selected signals for the calculation. Each calculation can be issued for one or several signals, each running the calculation
independent then. To modify the list of source signals
the „Select Channels“ button can be used.
The destination channel name is the name under
which the newly generated signal is used. As default
the name is automatically generated by a function
prefix and the source signal name as postfix. It is possible write into this input field o give the newly generated signal an other name.
The store to cache option is the default setup for
a signal calculation. Calculated data is stored into
cache in memory giving the best performance. If the
cache is full data is stored into a temporary file. In either way, once calculated the new signal can always
be exported to a file.
Using the store to file option data is always stored on the hard disk. This file is a valid SBench 6 file and can be opened for other purposes.
If checking the „Autostore“ option the files will get an ascending index and each calculation (meaning each new acquisition) a new data file
is generated.
The Calculation Area defines the part of the source signal that is used for calcualtion. It is possible to use the complete signal what is the
default as well as just using the part of the signal that is the current view in the display window or the part of the signal that is located in
between the two measurement cursors. Using one of the latter calculation areas the calculation automatically restarts as soon as the area has
been changed by zooming/moving the cursors. If calculating single values the used calculation area is shown next to the resulting figure in
the info dialog. The following symbols are used: complete signal ( ), current view ( ) and cursor ( ).
If using one of the calculation areas „current view“ or „between cursors“ one has to select the source display from which these settings are
taken.
Checking this box (default) will automatically update the calculation as soon as the base signal will change its content or the calculation
area will change. Unchecking this box would only start the calculation once and hold the calculated figure until the calculation is started
again.
Add to displays (default checked) will automatically add the new calculated signals to a matching display. If no display is currently shown
a new matching display is automatically generated.
The histogram signal that is generated can be displayed in a histogram display window as already explained further above in the Display
chapter. Please see this chapter for more information on the signal display features.
108
SBench 6 Software Manual
Calculation Function List
Signal Calculations (Pro Version)
FIR Filter
In signal processing, there are many instances in which an input signal to a system contains extra unnecessary content or additional noise
which can degrade the quality of the desired portion. In such cases one may remove or filter out the useless samples. FIR, Finite Impulse
Response, filters are one of the primary types of filters. FIR filters are said to be finite because they do not have any feedback.
FIR filters are based on coefficients, a set of constants, also called tap weights, used to multiply against delayed sample values. For an FIR
filter, the filter coefficients are, by definition, the impulse response of the filter. The SBench 6 FIR filter function allows to either set the filter
coefficients manually to define the very exact shape of the filter or using SBench 6 to calculate the filter coefficients by defining filter type,
order and the cutoff frequencies.
This area shows the selected signals for the calculation. Each
calculation can be issued for one or several signals, each running
the calculation independent then. To modify the list of source signals the „Select Channels“ button can be used.
The destination channel name is the name under which the
newly generated signal is used. As default the name is automatically generated by a function prefix and the source signal name
as postfix. It is possible write into this input field o give the newly
generated signal an other name.
The store to cache option is the default setup for a signal calculation. Calculated data is stored into cache in memory giving
the best performance. If the cache is full data is stored into a temporary file. In either way, once calculated the new signal can always be exported to a file.
Using the store to file option data is always stored on the hard
disk. This file is a valid SBench 6 file and can be opened for other
purposes. If checking the „Autostore“ option the files will get an
ascending index and each calculation (meaning each new acquisition) a new data file is generated.
The Calculation Area defines the part of the source signal that
is used for calcualtion. It is possible to use the complete signal
what is the default as well as just using the part of the signal that
is the current view in the display window or the part of the signal
that is located in between the two measurement cursors. Using
one of the latter calculation areas the calculation automatically restarts as soon as the area has been changed by zooming/moving
the cursors. If calculating single values the used calculation area is shown next to the resulting figure in the info dialog. The following symbols
are used: complete signal ( ), current view ( ) and cursor ( ).
If using one of the calculation areas „current view“ or „between cursors“ one has to select the source display from which these settings are
taken.
Checking this box (default) will automatically update the calculation as soon as the base signal will change its content or the calculation
area will change. Unchecking this box would only start the calculation once and hold the calculated figure until the calculation is started
again.
Add to displays (default checked) will automatically add the new calculated signals to a matching display. If no display is currently shown
a new matching display is automatically generated.
The filter type defines the general function of the filter together with the cutoff frequencies. It is possible to select one of the pre-defined
filter types or the „User defined“ selection to edit the FIR coefficients manually.
The cutoff frequencies define the shape of the filter. The FIR coefficients are automatically calculated based on the selected cutoff frequency
and the sampling rate of the source signal.
The order of the selected filter. The number of coefficients (tap weights) is one higher. Please note that the calculation time is depending
on the number of samples and the filter order.
The weighting window is used to optimize the FIR filter results. Different kinds of pre-defined weighting windows are available that prefilter the source analog signal before doing the FIR filtering.
It is possible to manually overwrite the coefficients to have an individual filtering. Filter coefficients can be calculated with third party
software or using web based calculations.
(c) Spectrum GmbH
109
Signal Calculations (Pro Version)
Calculation Function List
Function Generator
The powerful function generator allows to define calculation functions using recorded or loaded signals and using a wide list of mathematical operations on these. The result of the function generator is a new function that can be used for display, further calculations or
export.
Function Setup
This area shows the selected signals
for the calculation. The function generator can handle up to four source signals
for calculation. A double click in the
right column allows to select a different
channel for one of the source signals. It
is only necessary to select channels for
the source signals that are used in the
function.
The destination channel name is the
name under which the newly generated
signal is used. As default the name is automatically generated by a function prefix and the source signal name as
postfix. It is possible to write into this input field or to give the newly generated
signal an other name.
The store to cache option is the default setup for a signal calculation. Calculated data is stored into cache in
memory giving the best performance. If
the cache is full data is stored into a temporary file. In either way, once calculated the new signal can always be
exported to a file.
Using the store to file option data is
always stored on the hard disk. This file
is a valid SBench 6 file and can be opened for other purposes. If checking the „Autostore“ option the files will get an ascending index and
each calculation (meaning each new acquisition) a new data file is generated.
Checking this box (default) will automatically update the calculation as soon as the base signal will change its content or the calculation
area will change. Unchecking this box would only start the calculation once and hold the calculated figure until the calculation is started
again.
Add to displays (default checked) will automatically add the new calculated signals to a matching display. If no display is currently shown
a new matching display is automatically generated.
In this text field the function is typed as a standard expression. Please see the below list to get an impression what operators are available.
The text you type is spell-checked on the fly and the result is shown in red just beneath the function text field. Using the context menu (right
mouse click) one gets a list of all available functions and operators.
As a standard the manual setup is switched off. Then SBench 6 determines the signal setup from the first source signal and will use the
very same settings for the calculation result. By activating the manual setup one can overwrite these settings and change the result signal
characteristics. This is for example necessary if the function generator is used to generate a signal just with mathematical expressions without
having a source signal.s
These settings define the result signal if the manual setup (8) is activated. It is possible to define sampling rate, resolution, data length
and trigger position as well as the virtual signal amplitude. If using the function generator without a source signal these settings need to be
set to define the result signal.
110
SBench 6 Software Manual
Calculation Function List
Signal Calculations (Pro Version)
Function List
All functions work an argument. The standard argument is the x (current sample) which runs from zero to [length-1]. The argument can also
be modified using another expression. This allows to manipulate the time base of the result signal.(
Source Signals
sig0(x)
value
sig1(x)
value
sig2(x)
value
sig3(x)
value
of
of
of
of
source
source
source
source
signal 0
signal 1
signal 2
signal 3
Signal Settings
length
length of signal
post
posttrigger length
samplerate
defines samplerate
range
defined amplitude range
resolution
defined resolution
Operators
+
Addition
Subtraction
*
Multiplication
/
Division
%
Modulo
^
Power
&
bitwise AND
|
bitwise OR
<<
bitwise left shift
>>
bitwise right shift
Steady Functions
sin(x)
Sine
cos(x)
Cosine
tan(x)
Tangent
asin(x)
Arc Sine
acos(x)
Arc Cosine
atan(x)
Arc Tangent
sinh(x)
Hyperbolic Sine
cosh(x)
Hyperbolic Cosine
tanh(x)
Hyperbolic Tangent
ln(x)
Logarthmus Naturalis
abs(x)
Absolute
Non-Steady Functions
if (x, min, max)
if x >=min and x<=max the
result is 1.0, otherwise zero
sign (x)
is -1.0 if argument is negative,
+1.0 if argument is positive
tri (x,d)
Triangle with d% of one
period rising, the other 100d% falling
rect (x,d)
Rectangle with d% of one
period high, the other 100-d%
low
rand()
Returns a random number
The bitwise functions AND, OR, SHIFT can only be used on signals or on other bitwise functions but it is not possible to use them on steady
functions.
Constants
Two constants are pre-defined:
e = Euler’s number = 2.7182...
pi = PI = 3.14159 ...
One can define own constants inside the function with:
const SpeedOfLight=299792458;
Comments
Comments can be inserted into the formula by using /* and */ mark (C language style comments). Feel free to add blank lines or line feeds
to structure the formula
Formula Examples
sig0(x) + sig1(x)
Addition of two signals.
abs (sig0(x) - sig1(x))
The difference between two signals as absolute value (no negative results)
/* Define the resistance here */
const Resistance=120;
Power calculation with given resistance
/* Power calculation */
sig0(x)^2/Resistance
sin(2*PI*x/2048) *
sin(20*2*PI*x/2048)
sig0(2*x)
if (x,1000,2000)*sin(2*PI*x/1000)
Modulated sine signal without any source signal. This signal can be used for output cards
or as a comparison signal. The manual signal setup should be used for this signal
Copy the source signal using only each second sample. The signal frequency is half after
that. Please note that the number of samples need to be set to half manually.
A sine cycle in the middle of the signal (between sample no. 1000 and sample no. 2000),
the rest of the signal is zero. Signal length must be manually set to >= 2000 samples.
(c) Spectrum GmbH
111
Signal Calculations (Pro Version)
Calculation Function List
Concatenate Signals
The concatenate function is available for analog and digital signals. It concatenates two or more signals seamless and generates
a new signal out of it. It is also possible to repeat the concatenate
function to even concatenate the signals for several times:
This area shows the selected signals for the calculation. Each
calculation can be issued for one or several signals, each running
the calculation independent then. To modify the list of source signals the „Select Channels“ button can be used.
The destination channel name is the name under which the
newly generated signal is used. As default the name is automatically generated by a function prefix and the source signal name
as postfix. It is possible write into this input field o give the newly
generated signal an other name.
The store to cache option is the default setup for a signal calculation. Calculated data is stored into cache in memory giving
the best performance. If the cache is full data is stored into a temporary file. In either way, once calculated the new signal can always be exported to a file.
Using the store to file option data is always stored on the
hard disk. This file is a valid SBench 6 file and can be opened for other purposes. If checking the „Autostore“ option the files will get an
ascending index and each calculation (meaning each new acquisition) a new data file is generated.
The Calculation Area defines the part of the source signal that is used for calcualtion. It is possible to use the complete signal what is the
default as well as just using the part of the signal that is the current view in the display window or the part of the signal that is located in
between the two measurement cursors. Using one of the latter calculation areas the calculation automatically restarts as soon as the area has
been changed by zooming/moving the cursors. If calculating single values the used calculation area is shown next to the resulting figure in
the info dialog. The following symbols are used: complete signal ( ), current view ( ) and cursor ( ).
If using one of the calculation areas „current view“ or „between cursors“ one has to select the source display from which these settings are
taken.
Checking this box (default) will automatically update the calculation as soon as the base signal will change its content or the calculation
area will change. Unchecking this box would only start the calculation once and hold the calculated figure until the calculation is started
again.
Add to displays (default checked) will automatically add the new calculated signals to a matching display. If no display is currently shown
a new matching display is automatically generated.
The number of repetitions define how many times the function is executed. The resulting signal will contain the concatenated source signals. If the number of repetitions is higher than one, the concatenation will repeat itself, e.g. if you have four source signals and select two
repetitions the resulting signal will look like this: Source0Source1Source2Source3Source0Source1Source2Source3.
112
SBench 6 Software Manual
Calculation Function List
Signal Conversions (Pro Version)
Signal Conversions (Pro Version)
Copy as Reference
The copy function allows copy the currently selected signal and therefore keep it as a static reference for comparisons between measurements.
The copied signal will not be updated with any consecutive measurements.
Convert to digital
This function allows to convert an analog signal to its respective digital representation. Depending on the resolution of the analog channel to
be converted SBench will automatically generate as much digital channels as needed and combine these digital channels to a bus. The resulting digital channels as well as the bus can then be displayed in a digital display.
Convert to Analog
The function allows to convert digital channels into an analog channel by interpreting the single digital channels as bits of an analog signal.
This area shows the selected signals for the calculation. This
calculation needs a defined number of signals as source. Each
signal is shown in its own line explaining the source signal on
the left and showing the selected signal on the right. The signal
selection is changed by double clicking in the signal name.
The destination channel name is the name under which the
newly generated signal is used. As default the name is automatically generated by a function prefix and the source signal name
as postfix. It is possible to write into this input field or to give the
newly generated signal an other name.
The store to cache option is the default setup for a signal calculation. Calculated data is stored into cache in memory giving
the best performance. If the cache is full data is stored into a temporary file. In either way, once calculated the new signal can always be exported to a file.
Using the store to file option data is always stored on the
hard disk. This file is a valid SBench 6 file and can be opened
for other purposes. If checking the „Autostore“ option the files
will get an ascending index and each calculation (meaning each
new acquisition) a new data file is generated.
The Calculation Area defines the part of the source signal that is used for calcualtion. It is possible to use the complete signal what is the
default as well as just using the part of the signal that is the current view in the display window or the part of the signal that is located in
between the two measurement cursors. Using one of the latter calculation areas the calculation automatically restarts as soon as the area has
been changed by zooming/moving the cursors. If calculating single values the used calculation area is shown next to the resulting figure in
the info dialog. The following symbols are used: complete signal ( ), current view ( ) and cursor ( ).
If using one of the calculation areas „current view“ or „between cursors“ one has to select the source display from which these settings are
taken.
Checking this box (default) will automatically update the calculation as soon as the base signal will change its content or the calculation
area will change. Unchecking this box would only start the calculation once and hold the calculated figure until the calculation is started
again.
Add to displays (default checked) will automatically add the new calculated signals to a matching display. If no display is currently shown
a new matching display is automatically generated.
These two values define the scale of the resulting analog signal that will be used for display, cursor functions, further calculations and
export functions. The two values define the maximum and minimum value that can be reached if using the complete resolution span that is
theoretical possible: If converting 8 bit into an analog signal the complete resolution span will go from -128 to +127 with 256 steps in between. The analog range is defined for the complete span of 256 steps independent of the real data that is inside the digital channels.
If selecting the single bit mode, each digital channel will be converted into a single analog channel only representing one bit. The zero
value will be shown as the minimum range defined under (8) and the one value will be shown as the maximum range defined under (8).
(c) Spectrum GmbH
113
Signal averaging (Pro Version)
Calculation Function List
Signal averaging (Pro Version)
Signal average
The average functions takes multiple acquisitions of one signal and averages all of them making the resulting signal more detailed and also
eliminating noise peaks and seldom signal distortions.
This area shows the selected signals for the calculation. Each calculation can be issued for one or several signals, each running the
calculation independent then. To modify the list of source signals the
„Add“ and „Remove“ button can be used.
The store to cache option is the default setup for a signal calculation. Calculated data is stored into cache in memory giving the best
performance. If the cache is full data is stored into a temporary file.
In either way, once calculated the new signal can always be exported to a file.
Using the store to file option data is always stored on the hard
disk. This file is a valid SBench 6 file and can be opened for other
purposes.
The destination channel name is the name under which the newly
generated signal is used. As default the name is automatically generated by a function prefix and the source signal name as postfix. It
is possible to write into this input field or to give the newly generated
signal an other name.
The „Count“ value defines how many runs of the source signals
should be averaged together. As soon as the „Count“ value has been reached the average loop will start over and average the next couple
of source signals.
The „Update“ value defines after how many averaging loops the display of the new generated signal should be updated. If writing a
zero the update is done at the very end of the averaging. Using a different value than zero allows to watch average process while running.
Add to displays (default checked) will automatically add the new calculated signals to a matching display. If no display is currently shown
a new matching display is automatically generated.
Moving Average
The moving average (smooth) function takes a an average around the current sample of the sample itself and a defined number of neighbour
samples. As a result ranom noise is reduced:
The „Window Width“ parameter define how many samples around the current sample are used for averaging. A vlaue of 5 for example will
result in the following average function:
new_sample[x] = (sample[x-2] + samples[x-1] + sample[x] + samples[x+1] + sample[x+2]) / 5
114
SBench 6 Software Manual
Calculation Function List
Signal averaging (Pro Version)
Multi Average
The Multi Average calculation allows to average
consecutive segments of a
Multiple Recording Acquisition. The resulting signal
is again a Multiple Recording signal containing
multiple segments each
being an averaged segment of the several segments of the source
signal.
In our example on the
right we have a source
signal on top with 8 segments and an Multi Average function running that
averages each 4 consecutive segments to a new
segment. The resulting signal therefore has 2 segments marked in red and
green each of these being an average of the 4 segments marked in corresponding color of the source signal.
Please note that this function will only work on segmented signals being acquired with the Multiple Recording function.
Setup
This area shows the selected signals for the calculation. Each
calculation can be issued for one or several signals, each running
the calculation independent then. To modify the list of source signals the „Select Channels“ button can be used.
The destination channel name is the name under which the
newly generated signal is used. As default the name is automatically generated by a function prefix and the source signal name
as postfix. It is possible write into this input field o give the newly
generated signal an other name.
The store to cache option is the default setup for a signal calculation. Calculated data is stored into cache in memory giving
the best performance. If the cache is full data is stored into a temporary file. In either way, once calculated the new signal can always be exported to a file.
Using the store to file option data is always stored on the hard
disk. This file is a valid SBench 6 file and can be opened for other
purposes. If checking the „Autostore“ option the files will get an
ascending index and each calculation (meaning each new acquisition) a new data file is generated.
The Calculation Area defines the part of the source signal that is used for calcualtion. It is possible to use the complete signal what is the
default as well as just using the part of the signal that is the current view in the display window or the part of the signal that is located in
between the two measurement cursors. Using one of the latter calculation areas the calculation automatically restarts as soon as the area has
been changed by zooming/moving the cursors. If calculating single values the used calculation area is shown next to the resulting figure in
the info dialog. The following symbols are used: complete signal ( ), current view ( ) and cursor ( ).
If using one of the calculation areas „current view“ or „between cursors“ one has to select the source display from which these settings are
taken.
Checking this box (default) will automatically update the calculation as soon as the base signal will change its content or the calculation
area will change. Unchecking this box would only start the calculation once and hold the calculated figure until the calculation is started
again.
Add to displays (default checked) will automatically add the new calculated signals to a matching display. If no display is currently shown
a new matching display is automatically generated.
Define how many consecutive segments should be averaged to a new segment. The default setting is „all“ which will generate a signal
containing only one segment being the average of all segments of the source signal.
(c) Spectrum GmbH
115
Dynamic Parameters (Pro Version)
Calculation Function List
When checked the resulting average signal will be divided by the number of average loops and will therefore have the very exact resolution as the source signal.
Dynamic Parameters (Pro Version)
General Information
The dynamic parameters will analyze a FFT signal for different dynamic figures. It is
assumed that the base signal for the FFT is a sine signal. Please see the related application note „Measuring of Dynamic Figures“ to learn how these values are calculated
and how the results are judged.
Please see the general description for single value calculations to see how the general
setup of the function is done.
The number of harmonics defines how many of the harmonics spectrum parts are
counted as harmonics level and not as noise levels. A standard value is 6 harmonics
meaning that harmonics number #7 (if there is a visible harmonics level) is already counted as noise signal.
The bin size is used for asynchronous signals where source signal frequency and
sampling frequency is not synchronized in any kind. The FFT plot result is not a single
peak but a signal with a large base getting mode narrow on top. To calculate all the energy inside one spurious components this bin size is used for calculation.
Functions
Name
All Dynamic parameters
SNR
THD
SFDR incl.
SFDR excl.
SINAD
ENOB (SNR)
ENOB (SINAD)
116
Description
Calculating all of the below listed dynamic parameters together listing then as one block of figures
Signal to Noise Ratio: defining the ratio between the carrier frequency (highest peak in the frequency spectrum) to the noise floor with the exception of harmonics signals
Total Harmonic Distortion: defining the harmonic distortion for the number of harmonics signals as specified in the setup
Spurious Free Dynamic Range (including harmonics): the complete spurious free range between the highest spurious component including harmonics and the
carrier signal.
Spurious Free Dynamic Range (excluding harmonics): the complete spurious free range between the highest spurious noise component excluding harmonics
and the carrier signal.
Signal Noise and Distortion (also called THD+N): A combination of SNR and THD value.
Effective Number of Bits calculated from SNR.
Effective Number of Bits calculated from SINAD.
SBench 6 Software Manual
Export/Import
Overview
Export/Import
Overview
Data is transferred through different buffers and caches to improve throughput speed.
The streaming engine is optimized for high throughput and
directly controls the hard disk or RAID hard disk array. Different
binary data formats are offered to directly stream with high speed
to disk.
Data can be imported in different file formats from disk. The
import/load function can handle files generated by SBench 6 as
well as files generated by third party products.
The export/save function is working on already acquired
and stored data and offers a huge variety of export filters that
have some additional settings to cover all potential needs.
Streaming
SBench 6 offers different direct storage formats that can be used to directly stream data into it. These formats are binary with additional
header informations. The default format is the special SBench 6 data format with the extension sb6dat. This is the preferred data format as
all information that is needed is in here and this data format is optimized for data streaming.
Using one of the other data formats may be helpful if one likes to open streamed data directly with an other program and has an existing
import filter for the supported data format.
The following storage data formats are available:
Name
SBench 6
File Extension
*.sb6dat
Description
This is the native SBench 6 data format which includes all details of the acquired data, timestamps and ABA samples as well as detailed
information on the data scaling, names and descriptions. The SBench 6 data format is the default format for streaming as it is optimized for
fast data storage, contains all signal and setup information and also contains data preview information.
Pure Binary
*.bin
The pure binary data format just contains the multiplexed binary data as it is acquired by the hardware. A lot of third party products can
directly read and write binary data with universal import filters. The binary data format is therefore an easy way to exchange data with
other products without the need of generating new import or export filters. If storing binary files from SBench 6 an additional text file header
is generated which contains the main information on the binary data like number of multiplexed channels, trigger position or sampling rate.
Wave
*.wav
The wave file format is an international standardized file format for storing audio and A/D sample data within a file also containing basic
scaling information as sampling rate or vertical range. It is based on the Resource Interchange File Format (RIFF) specification and is supported by nearly all measurement and analysis software on the market as well as a lot of freeware audio tools. If storing wave files from
SBench 6 an additional text header information file is generated which contains all data scaling information that is not included in the wave
file itself.
The setup of the streaming file format is done inside the file settings dialogue which is explained in more detail in one of the previous chapters.
Once used as streaming data the resulting files can be opened by third party software as well as opened and displayed inside SBench 6. If
using the streaming mode there is no difference in the SBench 6 behavior. You still have FIFO preview as well as preview window and data
is opened inside the display window automatically directly after streaming data acquisition has ended.
(c) Spectrum GmbH
117
Import
Export/Import
Import
The import function allows to import different formats into SBench 6 to have reference signals or to compare loaded signals with acquired
ones.
The following import formats are available. Please see further below for more details on the file formats:
Name
SBench 6
File Extension
*.sb6dat
Description
This is the native SBench 6 data format which includes all details of the acquired data, timestamps and ABA samples as well as detailed
information on the data scaling, names and descriptions. The SBench 6 data format is the default format for streaming as it is optimized for
fast data storage, contains all signal and setup information and also contains data preview information.
SBench 5
*.dat
This is the file format of SBench version 5. SBench 5 files can be read and written giving acccess to previously stored data in the new SBench
6 software as well as third party products that already have import or export filters for this file format. The file format is open to public and
documented in detail inside the SBench 5 user manual.
Pure Binary
*.bin
The pure binary data format just contains the multiplexed binary data as it is acquired by the hardware. A lot of third party products can
directly read and write binary data with universal import filters. The binary data format is therefore an easy way to exchange data with
other products without the need of generating new import or export filters. If storing binary files from SBench 6 an additional text file header
is generated which contains the main information on the binary data like number of multiplexed channels, trigger position or sampling rate.
Wave
*.wav
The wave file format is an international standardized file format for storing audio and A/D sample data within a file also containing basic
scaling information as sampling rate or vertical range. It is based on the Resource Interchange File Format (RIFF) specification and is supported by nearly all measurement and analysis software on the market as well as a lot of freeware audio tools. If storing wave files from
SBench 6 an additional text header information file is generated which contains all data scaling information that is not included in the wave
file itself.
ASCII
*.txt
ASCII files are the simplest way to exchange data. Each sample is printed as a readable character having the great advantage that data can
be viewed and edited even with simple text editors. Nearly all available data acquisition and analysis software is able to handle ASCII files
in different formats. ASCII as printed text format offers a huge variety of different value printing formats which are explained in more detail
in the file format chapter.
Header definition
SBench 6 needs some additional header information for every binary, wave and ASCII import (The SBench 5 and SBench 6 format already contain these header informations). If the file has been
exported prior with SBench 6, a header text file is placed in the
same directory holding the needed information about the file. If the
import is done from a different source this header file is not there
and the basic values for the import are questioned from the user with
an extra dialogue. The right hand screenshot shows the header definition dialogue for the ASCII import. Other import formats use a
subset of this import defintion dialogue:
[ASCII, Binary, Wave] Select this section if the source signal
contains time based data and define the number of analog and digital channels which are found inside the opened file.
[ASCII] Select this section if the source signal contains frequency
based signals (FFT) and define the number of channels which are
found inside the opened file.
[ASCII, Binary] As a standard the length of the signal is automatically derived from the file by counting the available data. If necessary the length can be manually set. The posttrigger value defines
the trigger position inside the data. The trigger position is set as the
zero on the x-axis when displaying data.
[ASCII, Binary] The samplerate defines the x-span between two
samples. Please set the value matching the original x-axis resolution.
[ASCII, Binary] The ADC resolution has to be defined to scale
the data correctly.
[Binary, not shown] The Data Coding input is needed to interpret the
binary data correctly. The binary standard is Two’s complement whcih spans data from -max to +max.
[ASCII, Binary, Wave] These settings are needed to scale analog channels from the file. Please select the values matching the analog
channels.
[ASCII] Additional ASCII import settings that are needed to cover all kind of ASCII source files. Please see the ASCII export chapter to
learn more about the settings.
[ASCII, Binary, Wave] The restore last setup button allows to recall teh previously made setup which is stored in the configuration file.
118
SBench 6 Software Manual
Export/Import
Export
Showing information of loaded signals
After loading/importing a signal it is possible to read out and display all channel
information that has been found inside the file. This function is also available for
activate channels of acquisition cards.
Please use the following steps to show the channel information:
•
•
•
•
•
Go to the Input Channels dialog
Select the channel of interest with the mouse
Right click to open the context menu
Select the „Info ...“ command
A popup dialog will appear showing all channel information in list form
Export
The export functions work on already stored data and offer a lot of settings to perfectly match the users need. Please contact the manufacturer
if you need additional export formats to be supported by SBench 6.
Export Data Formats available
The following different formats are available as export formats. Please see further below for more details on these formats:
Name
SBench 6
File Extension
*.sb6dat
Description
This is the native SBench 6 data format which includes all details of the acquired data, timestamps and ABA samples as well as detailed
information on the data scaling, names and descriptions. The SBench 6 data format is the default format for streaming as it is optimized for
fast data storage, contains all signal and setup information and also contains data preview information.
SBench 5
*.dat
This is the file format of SBench version 5. SBench 5 files can be read and written giving acccess to previously stored data in the new SBench
6 software as well as third party products that already have import or export filters for this file format. The file format is open to public and
documented in detail inside the SBench 5 user manual.
MATLAB
*.mat
SBench 6 offers a direct export into matlab files. These data files can directly be opened with MATLAB and data can be examined and displayed within this professional math package. The generated matlab files are compatible to all current versions of MATLAB.
Pure Binary
*.bin
The pure binary data format just contains the multiplexed binary data as it is acquired by the hardware. A lot of third party products can
directly read and write binary data with universal import filters. The binary data format is therefore an easy way to exchange data with
other products without the need of generating new import or export filters. If storing binary files from SBench 6 an additional text file header
is generated which contains the main information on the binary data like number of multiplexed channels, trigger position or sampling rate.
Wave
*.wav
The wave file format is an international standardized file format for storing audio and A/D sample data within a file also containing basic
scaling information as sampling rate or vertical range. It is based on the Resource Interchange File Format (RIFF) specification and is supported by nearly all measurement and analysis software on the market as well as a lot of freeware audio tools. If storing wave files from
SBench 6 an additional text header information file is generated which contains all data scaling information that is not included in the wave
file itself.
ASCII
*.txt
ASCII files are the simplest way to exchange data. Each sample is printed as a readable character having the great advantage that data can
be viewed and edited even with simple text editors. Nearly all available data acquisition and analysis software is able to handle ASCII files
in different formats. ASCII as printed text format offers a huge variety of different value printing formats which are explained in more detail
in the file format chapter.
VCD
*.txt
The Value Change Dump is an ASCII-based format for digital data dumps. It can be read by various VHDL simulators and kernel tracers. The
data file is a fully readable ASCII file consisting of a header section, a variable definition section, a dumpvars section for initial values of all
variables and the value change section. The generation of the data file may take some time as all acquired data has to be analyzed and
converted to the change dump.
Export channels directly from the channel dialogue
It is either possible to start an export from the file menu / tool bar by clicking on the
appropriate export function. Or one can directly start the export from the channel hardware dialogue.
When selecting export by the context menu all currently marked channels are selected
for the export.
(c) Spectrum GmbH
119
Export
Export/Import
Export Data and General Setup
The export functions are found in the File menu. Each export filter
has some general settings to select data channels to be exported
and the signal area that is of interest:
This area shows the selected signals for the calculation. Each
calculation can be issued for one or several signals, each running the calculation independent then. To modify the list of
source signals the „Add“ and „Remove“ button can be used.
The export part of the signals can be individually defined. It
is possible to export the complete signal (default), a user defined
part (3), the display area or the signal part between the two measurement cursors. Please select the requested part of signal inhere.
These values define the individual part of the signal that
should be exported. The export area can be defined sample by
sample by selecting the appropriate values inside these input
fields.
The Samples/Time button allows to switch input mode of (3) between samples input and direct time input:
If selected to samples input the field will
accept pure samples values or entries with a
samples modifier input of „k“, „M“, „G“:
192 S
16 kS
4 MS
2 GS
192 Samples
16 kilo Samples = 16 x 1024 = 16384 Samples
4 Mega Samples = 4 x 1024 kS = 4 x 1024 x 1024 Samples
2 Giga Samples = 2 x 1024 MS = 2 x 1024 x 1024 x 1024 Samples
If selected to time input the field will accept
pure time values which are recalculated to
samples value automatically using the currently selected sampling rate. Time values are entered as seconds or fractions of. The modifiers „m“, „u“, „n“ are accepted.
10 s
10 seconds
20 ms
20 milli seconds = 0.020 seconds
30 us
30 micro seconds = 0.03 ms = 0.000030 seconds
500 ns
500 nano seconds = 0.5 us = 0.0000005 seconds
When using another modifier than allowed for the current entry mode the field will automatically switch to the other entry mode.
This field defines the selected export file. As a default all export files will be exported to the common data folder. Please use the „...“
button to select a export file location manually.
120
SBench 6 Software Manual
Export/Import
Export
ASCII Export (Pro Version)
SBench 6 contains a versatile ASCII export function which allows to define the data format of the ASCII text file in deep detail to allow easy
import into third party products. Please note that the ASCII exported files will be multiple times larger than the original binary files.
This area shows the selected
signals for the calculation. Each calculation can be issued for one or
several signals, each running the
calculation independent then. To
modify the list of source signals the
„Add“ and „Remove“ button can be
used.
The export part of the signals
can be individually defined. It is
possible to export the complete signal (default), a user defined part
(3), the display area or the signal
part between the two measurement
cursors. Please select the requested
part of signal inhere.
These values define the individual part of the signal that should be
exported. The export area can be
defined sample by sample by selecting the appropriate values inside
these input fields.
The Samples/Time button allows to switch input mode of (3) between samples input and direct time input:
If selected to samples input the field will
accept pure samples values or entries with a
samples modifier input of „k“, „M“, „G“:
192 S
16 kS
192 Samples
16 kilo Samples = 16 x 1024 = 16384 Samples
If selected to time input the field will accept
pure time values which are recalculated to
samples value automatically using the currently selected sampling rate. Time values are entered as seconds or fractions of. The modifiers „m“, „u“, „n“ are accepted.
10 s
10 seconds
20 ms
20 milli seconds = 0.020 seconds
4 MS
2 GS
4 Mega Samples = 4 x 1024 kS = 4 x 1024 x 1024 Samples
2 Giga Samples = 2 x 1024 MS = 2 x 1024 x 1024 x 1024 Samples
30 us
500 ns
30 micro seconds = 0.03 ms = 0.000030 seconds
500 nano seconds = 0.5 us = 0.0000005 seconds
When using another modifier than allowed for the current entry mode the field will automatically switch to the other entry mode.
This field defines the selected export file. As a default all export files will be exported to the common data folder. Please use the „...“
button to select a export file location manually.
Select the combination of values that should be printed in the ASCII file. It is possible to print out y-values (of all channels), x-values (time
or frequency) or index values (just a numbering of the samples beginning with 0) or a combination of these value fields.
Select the separation between the columns in the ASCII file. Most 3rd party programs (like Microsoft Excel) cope with „separated by tabs“
best.
Select the data format for the different local regions. It is possible to either use the dot as a separator between number and fraction or to
use the comma as a separator. Please check with your installation and your software to see which one is the correct choice. If not choosing
the correct data format the numbers may be recognized as strings only and cannot be computed further.
Define the character for the new line command. Depending on the used operating system a combination of „ new line“ and „carriage
return“ or either of it may be useful.
Inhere one define the precision for the exported values. This is helpful in case of very small signals at high resolutions.
When checking the „Print Channel Header“ box some channel information is printed above the ASCII data showing name, units and
scales of the data for each column.
(c) Spectrum GmbH
121
VCD Export
Export/Import
VCD Export
SBench 6 Professional supports the VCD (Value
Change Dump) format for digital data export to
standard programs:
This area shows the selected signals for the
calculation. Each calculation can be issued for
one or several signals, each running the calculation independent then. To modify the list of
source signals the „Add“ and „Remove“ button
can be used.
The export part of the signals can be individually defined. It is possible to export the complete signal (default), a user defined part (3), the
display area or the signal part between the two
measurement cursors. Please select the requested part of signal inhere.
These values define the individual part of the
signal that should be exported. The export area
can be defined sample by sample by selecting
the appropriate values inside these input fields.
The Samples/Time button allows to switch
input mode of (3) between samples input and direct time input:
If selected to samples input the field will
accept pure samples values or entries with a
samples modifier input of „k“, „M“, „G“:
192 S
16 kS
192 Samples
16 kilo Samples = 16 x 1024 = 16384 Samples
If selected to time input the field will accept
pure time values which are recalculated to
samples value automatically using the currently selected sampling rate. Time values are entered as seconds or fractions of. The modifiers „m“, „u“, „n“ are accepted.
10 s
10 seconds
20 ms
20 milli seconds = 0.020 seconds
4 MS
2 GS
4 Mega Samples = 4 x 1024 kS = 4 x 1024 x 1024 Samples
2 Giga Samples = 2 x 1024 MS = 2 x 1024 x 1024 x 1024 Samples
30 us
500 ns
30 micro seconds = 0.03 ms = 0.000030 seconds
500 nano seconds = 0.5 us = 0.0000005 seconds
When using another modifier than allowed for the current entry mode the field will automatically switch to the other entry mode.
This field defines the selected export file. As a default all export files will be exported to the common data folder. Please use the „...“
button to select a export file location manually.
The analog settings define the format of analog data. If „Wire“ is selected the signal will be defined as wire with the number of bits equal
to the resolution of the channel. If „Integer“ is selected the signal will be defined as integer.
The digital settings define the format of digital data. With „Single Bit“ each digital channel will appear as a one bit wire in the VCD file.
If the number of channels to export exceed a certain amount, they are automatically grouped together. Selecting „Group“ mode each 32
digital channels are grouped as a 32 bit wire.
Print/Screenshot
The Print/Screenshot functions offer you the opportunity to document the current display either by using one of the installed printers, an internal
PDF creator or by generating an image file or clipboard copy.
Changing Print Colors
SBench 6 works with two different color palettes offering best display results when working on the screen as well as best printout/screenshot
results. To access the second palette, a dedicated toolbar button is available:
The different palette entries are selected inside the standard color setup dialogue which can be called from within the context menu. The
context menu can be called by right clicking inside the display area. The toolbar offers a button to change between the standard palette
and a second, printing optimized color palette. This button is not visible by default but needs to be added to the toolbar in case that it is
intended to use it. Adding commands to the toolbar is described in a previous chapter.
Print / Print Cursor Area
The print function work for the currently active display window. It calls the printout dialogue explained below which allows to set-up the printout details. The printout is highly configurable and can contain all signals, signal names, axis, grid, comments, title and footer lines. The print
functions are found in the file menu:
122
SBench 6 Software Manual
Export/Import
Print/Screenshot
The command prints the currently shown display area which is visible inside the window.
The command prints the area between the two cursors of the currently shown display area.
If using the SBench 6 Professional version the print dialogue can also export images or copy the display content to clipboard.
The printout dialogue looks the same independent of the selected print area:
Select the print target here. A display
print can either be printed using one of the installed printers or a PDF can be generated using the integrated PDF creator or it can be
directly copied to the clipboard to be pasted
into some other documentation software or it
can be stored as a file. Depending on the target selection the available settings under (3)
may change.
Printout title (only available for printer
and PDF). Define any text title for printout. Be
sure to have the „Print Title“ option activated
under (5).
Select the options for the printout. The
printer can be selected here and the standard
printer setup dialogue of the operating system can be called to change paper feed, orientation or size.
Select the display color here. The screenshot can either be taken in color in one of the two available color palettes or it can be taken completely in black and white increasing the
contrast of the print-out if using black and white only printers.
The option checkboxes allow to define the elements of the display window that are added to the screenshot. Changing the options will
immediately change the screenshot preview (7).
Printout footer. As a default the footer is filled with print date and time and the SBench 6 version. The text can be overwritten by the user.
Be sure to have „Print Footer“ option activated under (5).
The printout preview shows how the screenshot will look like including the activated options under (5).
Use the buttons to execute the screenshot command, to use the printer preview or to cancel.
Screenshot (Professional Version)
The screenshot utility allows to make a screenshot of the currently activated display offering
different settings and file formats:
Select the screenshot target here. A
screenshot can either be directly copied to
the clipboard to be pasted into some other
documentation software or it can be stored as
a file. Depending on the target selection the
available settings may change.
Select a path and a file name to save the
screenshot in. As a default screenshots are
saved to the SBench 6 application data folder.
Select the screenshot file format and quality here. Different standard image formats are
supported by SBench 6 like jpg, png, tif or
bitmap. The Quality figure defines the image
quality in percentage if one has selected a
compressing file format like jpg.
Select the display color here. The screenshot can either be taken in color in one of the two available color palettes or it can be taken
completely in black and white increasing the contrast of the print-out if using black and white only printers.
(c) Spectrum GmbH
123
Print/Screenshot
Export/Import
The option checkboxes allow to define the elements of the display window that are added to the screenshot. Changing the options will
immediately change the screenshot preview (6).
The screenshot preview shows how the screenshot will look like including the activated options under (5).
Use the buttons to execute the screenshot command or to cancel.
124
SBench 6 Software Manual