1
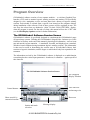
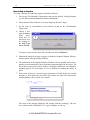
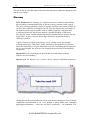
GO2Altitude® HYPOXICATOR
(High Altitude Simulator)
PC SOFTWARE MANUAL
© 2003 BIOMEDTECH Australia Pty Ltd
GO2Altitude® Software Manual
1
TABLE OF CONTENTS
THE GO2ALTITUDE® SOFTWARE SESSION SCREEN ....................................................2
THE GO2ALTITUDE® SOFTWARE HISTORY SCREEN ...................................................3
REAL-TIME SCREEN FUNCTIONS.......................................................................3
REAL-TIME SCREEN FUNCTIONS.......................................................................4
OVERVIEW ...................................................................................................................4
The Graphical Display Window ...............................................................................4
FUNCTION CONTROLS ..................................................................................................4
Control Buttons.........................................................................................................4
Message Display Window.........................................................................................5
Time Interval and Message Size Buttons ..................................................................6
SpO2 Baseline Levels ................................................................................................6
Heart Rate and Show Buttons...................................................................................7
Station and Mode Selection ......................................................................................7
HYPOXIC TEST .............................................................................................................8
Messages Displayed..................................................................................................9
HISTORY SCREEN FUNCTIONS .........................................................................10
OVERVIEW .................................................................................................................10
Loading session data ..............................................................................................10
The Graphical Display Window – Session Statistics ..............................................12
FUNCTION CONTROLS ................................................................................................12
Control Buttons.......................................................................................................12
Data Manipulation and Export...............................................................................13
The Graphical Display Window – Global Statistics...............................................14
CONTROL BUTTONS ...................................................................................................15
Course Statistics .....................................................................................................16
OPERATION OF THE GO2ALTITUDE® SOFTWARE ....................................17
PRELIMINARIES ..........................................................................................................17
Recording a Session................................................................................................18
“SKIN” DISPLAY OPTIONS ..........................................................................................19
GLOSSARY..................................................................................................................20
© 2003 BIOMEDTECH Australia Pty Ltd
2
GO2Altitude Software Manual
Program Overview
GO2Altitude® software consists of two separate modules – a real-time Graphical User
Interface (GUI) used to monitor hypoxic training sessions, and another GUI specifically
designed to view, manipulate, access, and store data from a history of hypoxic training
sessions. Each module is selected from a specific icon located on the computer desktop
during installation of the software. Each of these systems will be explained in turn. The
user may also select from two distinctive “skins” for their GO2ALTITUDE® display,
when the program is started. For the sake of clarity, this manual will use the “CRT” skin
(see the Skin Display Options section for further information).
The GO2Altitude® Software Session Screen
GO2Altitude® software is specifically designed to complement the GO2Altitude® range
of hypoxicator systems. Utilising the GO2Altitude® integral Pulse Oximeter (see Pulse
Oximeter in Glossary at the end of this manual), physiological information - such as heart
rate and arterial oxygen saturation - is monitored, recorded, and displayed on a standard,
Windows-based computer during intermittent hypoxic training sessions. This information
is then used to assist in determining the current state of an individual’s fitness, their
reaction to hypoxic stimulation, and the degree to which their body has responded to the
treatment.
The information received by the GO2Altitude® software is displayed on a multi-function
screen that plots the various input parameters – heartbeat, O2 saturation – against specified
time intervals.
The GO2Altitude Software Session Screen
The Graphical
Display Window
Time intervals
and message size
Control buttons
Show arterial O2
saturation baseline
Heart rate
Station and mode
selection
Message display
© 2003 BIOMEDTECH Australia Pty Ltd
GO2Altitude® Software Manual
3
The GO2Altitude® Software History Screen
In addition to the Software Session Screen, the GO2Altitude® Software System also
allows the user to access and compare stored data from a history of hypoxic sessions,
to assist in the analysis of their training regime. The information displayed may be
stored on the host computer, be printed as required, or manipulated in a variety of
other ways, including export to a spreadsheet program (such as MS Excel) or to a
database (such as MS Access), as a delimited text file.
Each of the functional areas shown will be discussed in turn in the following sections of
this manual.
Graphic display
window
Statistics mode
buttons
Time intervals
Graph control
buttons and Help
User and session
selection
Data manipulation
and export
© 2003 BIOMEDTECH Australia Pty Ltd
4
GO2Altitude Software Manual
Real-time Screen Functions
Overview
The GO2Altitude® Software User Screen is accessed from its specific
icon on the computer desktop:
To more clearly describe the screen functions, the main screen will be
explained in two sections corresponding to the titles shown in the
graphic,GO2Altitude® Software User Screen. The first section describes the Graphical
Display Window, whilst the second section describes the Function Controls and the
smaller Message Display screen:
The Graphical Display Window
Heart rate
scale
SpO2 level
Hypoxic air versus
ambient air intake
Station
monitored
Current user
Elapsed
session time
As illustrated, the Graphical Display Window shows the real-time data of the Selected
Station (see Stations in the section Function Controls) in a comparative graphical form.
As such, this window shows the variance in Heart Rate and Arterial Oxygen Saturation
(SpO2 ) over a given period of time.
Function Controls
Control Buttons
The Control Buttons are located on the lower left section of
the GO2Altitude® Hypoxicator software screen. The
function of each of these buttons is as follows:
© 2003 BIOMEDTECH Australia Pty Ltd
GO2Altitude® Software Manual
5
Help Calls the GO2Altitude® Hypoxicator online help manual
Alarm Enables the warning buzzer to indicate that oxygenation levels
are too low. The inbuilt green light glows when the button is activated.
The Reset button clears resets the software and clears the screen to allow
taking of new measurements.
Messages Selecting this button enables messages in the Message Display
window:
Message Display Window
Located to the right below the Control Buttons, is the Message Display Window:
SpO2
SpO2
Heart rate
Station(s) activity
Heart rate
The Message Display Window shows the information obtained from a selected station,
and is a real-time textual representation of the information shown in the Graphical Display
Window.
The data exhibited includes the Station Number being used – represented as a number with
a hash (#) on the left of the display, and as a list number on the right side of the window.
The SpO 2 is shown as a percentage, and the heart rate is given in Beats Per Minute (BPM).
The information is displayed in a larger form to the left of the window to allow for reading
from a distance, for example when the user is seated some distance from the computer.
© 2003 BIOMEDTECH Australia Pty Ltd
6
GO2Altitude Software Manual
Time Interval and Message Size Buttons
The Time interval and Message Size buttons are
located on the lower right portion of the
GO2Altitude®
Software
Session
screen,
previously described.
The Display button simply enables the viewing of the larger message on the
left-hand portion of the Message Display Window previously described (see
Message Display Window). The inbuilt green light glows when the button is
activated.
The Time Interval buttons alter the time increment shown
on the Graphical Display Window. Each interval can be
changed to a preset selection of 10, 30, or 60 minutes, as
shown in the following section from the Graphical Display
Window:
Time
increments
Total = 10
minutes
SpO2 Baseline Levels
Show – This button enables the display of Saturated blood O2 levels.
SpO2 – These scroll buttons permit the setting of the baseline level of
the percentage of arterial blood oxygen saturation, below which level
the software will start to alarm the operator.
© 2003 BIOMEDTECH Australia Pty Ltd
GO2Altitude® Software Manual
7
Heart Rate and Show Buttons
Simply, these buttons set the baseline Heart Rate, above which the
program starts to alarm.
Station and Mode Selection
The Station and Mode Selection buttons are located
in the lower portion of the GO2Altitude® Software
User Screen, directly to the left of the Message
Display Window. The function of these buttons is as
follows:
Stations – Dependent on the model of hypoxicator
used, if more than one station is in use, this function
allows the operator to select which station
information is to be displayed. Clicking this button to display the details of the station
monitored will also result in the illumination of a confirmation “on” light, next to the
button concerned.
If no stations are activated, the selection buttons are
unavailable (greyed out).
When a station is activated and the program of
treatment is started, its corresponding button becomes active.
Mode Selection - The New Session button simply
allows the operator to initiate a new session, and
select a station (if applicable).
The Stop and Stop All buttons put a halt to any current session or sessions, respectively.
The user must select the New Session button to reinitiate a session.
The Hypo. Test button is used to start the special mode; Hypoxic Test.
© 2003 BIOMEDTECH Australia Pty Ltd
8
GO2Altitude Software Manual
Hypoxic Test
In order to determine a user’s respiratory condition and to determine the base level
reference of their fitness health level, a hypoxic test is recommended.
The information is collected over a maximum period of ten minutes, where the Pulse
Oximeter (finger clip-on sensor) is used to measure heart rate and SpO 2, levels and the
results are displayed graphically using the GO2Altitude® software. This is performed in
real-time, with a one second sampling frequency:
SpO2 scale
SpO2 base level set
Heart rate base level set
Heart rate scale
Station in use
Person being tested
Elapsed time
The Hypoxic Test helps indicate an individual’s reaction to low-oxygen respiration. By
default, or by connection, the oxygen saturation base line is set automatically to 85% for
all people (Please refer to the main Hypoxicator User Manual for further information).
The results of this test are also displayed textually in the Message Display window,
simultaneously:
Combined results
SpO2
Heart rate
© 2003 BIOMEDTECH Australia Pty Ltd
Station activity
GO2Altitude® Software Manual
9
Messages Displayed
The Hypoxic Test screen continuously plots a graph of SpO 2 and Heart Rate on the screen
at one-second intervals as the hypoxic test is being conducted:
One result of this test is known as the Time to Descend – or Td.
This figure is displayed constantly in the lower right-hand portion of
the Hypoxic Test display window (as shown), and actively refers to
the time taken for the user’s SpO2 level falls below 85%.
NOTE As a rule-of-thumb, the length of the Td parameter reflects the level of general
respiratory and aerobic fitness of an individual. Generally, the longer the Td, the higher the
fitness level of the person under test.
Once the Td has been reached, the user is advised by the software to remove the mask, and
revert to breathing ambient air. From here, the recovery test is started when an SpO 2 level
of 95% is reached, and is measured as Tr, or Time to Recovery, and is shown with the Td
measurement in the display window, as illustrated.
Once the Hypoxic Test
has been conducted, a
dialog box will be
displayed showing both
the Td and Tr results (as
shown at left). From
here, the user may elect
to save, print, or email
the information.
© 2003 BIOMEDTECH Australia Pty Ltd
10
GO2Altitude Software Manual
History Screen Functions
Overview
To access the History screen, the operator selects the GO2Altitude®
History icon from their PC desktop, as shown at left.
Loading session data
Once the GO2Altitude® History icon has been selected, a dialog will display as follows:
For new users,
click on the OK
button only
For previous users, click on the Import V.2 sessions… button to load saved session data
from previous versions of the software.
This will then display a dialog in which the operator may browse for suitable files:
Once the appropriate
files have been
selected, click on the
Import button to load
them to the
GO2Altitude®
History screen.
When complete, a message window will
display, confirming the number of files
imported.
Files may now be accessed directly from
within the GO2Altitude® History display
from selected training sessions.
© 2003 BIOMEDTECH Australia Pty Ltd
GO2Altitude® Software Manual
11
User and Session Selection
To access an individual session, or sessions, the operator now chooses from a group of
drop-down boxes:
Directly below the Measurement
Control buttons is a series of
drop-down boxes that contain
information pertinent to the data
being displayed on the Graphical
Display Window.
The first of these windows
displays the User selected, to
display their hypoxic test history. Only those users whose data is stored may be accessed.
Each session is stored separately,
and may be accessed from this
drop-down list.
The Test Session, containing the
date, time, and standard oxygen
concentration level, are selected
here.
As illustrated, this Window shows the collected history data of the Selected session in a
comparative graphical form. As such, this window shows the variance in Heart Rate and
SpO2 levels over a given period of time, during a selected session:
Saturated O2 scale
Test session details
Heart Rate scale
Precise point
measurement
Time to
Descend
© 2003 BIOMEDTECH Australia Pty Ltd
Person in test history
Time to
Recovery
12
GO2Altitude Software Manual
The Graphical Display Window – Session Statistics
To more clearly describe the screen functions, the main screen will be explained in two
sections corresponding to the titles shown in the graphic, GO2Altitude® Software
History Screen. The first section describes the Graphical Display Window, whilst the
second section describes the Function Controls and the smaller Message Display screen.
The GO2ALTITUDE® History Software Graphical Display Window consists of several
distinct functions. There are two displays from which to choose, the Session Statistics
function, and the Global Statistics function, each of which is selected from the button
found in the centre of the display, directly below the
Graphical Display Window.
These buttons toggle between the two functions, and the
display and controls change accordingly. The first of
these, the Session Statistics mode, is as follows.
Function Controls
Control Buttons
The Control Buttons are located on the lower left
section of the GO2ALTITUDE® History software
screen. The function of each of these buttons is as
follows:
Help Calls the GO2Altitude® Hypoxicator online help manual
Measurements Calls into action the precise point measurement lines
used to display detailed data at a given section of the displayed graph. By
positioning the cursor at the point required and clicking the left mouse
button, a line of measurement will be inserted, and the data for that point
displayed:
© 2003 BIOMEDTECH Australia Pty Ltd
GO2Altitude® Software Manual
13
These precise point measurements are particularly useful in
displaying the heart rate or an exact percentage of SpO2 at any
given time. Each measurement line is movable across the range,
and multiple measurement lines may be inserted.
The Move buttons control the incremental
movement of the measurement lines. Clicking the
button denoting a left or right direction will move
the line in that direction. Dragging with the mouse
will also effect this.
The Time Interval buttons alter the time increment shown on
the Graphical Display Window. Each interval can be changed to
a preset selection of 10, 30, or 60 minutes
Data Manipulation and Export
Directly to the right, and on the same level of the Message Display boxes, are the Function
Buttons:
The Clean-up Data checkbox smooths the graphical data
displayed, by averaging the measurements to remove the strictly
linear appearance.
The Print Graph button outputs the graphical display directly
to a printer connected to the computer.
The Export to Excel button allows the user to transfer the
history results directly into the spreadsheet program, MS
Excel, as a delimited text file. This results in the user being
able to further manipulate, store, and display the collected history data:
© 2003 BIOMEDTECH Australia Pty Ltd
14
GO2Altitude Software Manual
The
information
shown in Excel may
be then transformed
into any of the
graphical
display
methods available,
including
graphs,
and pie, column, and
line charts.
The Graphical Display Window – Global Statistics
The inverse toggle to the Session Statistics mode is the
Global Statistics mode. This mode displays a summary of
all sessions undertaken. Selecting this mode changes the
Graphical Display Window contents, as well as the function
and selection buttons relevant to use in this mode:
Independent of the session(s) selected, the Graphical
Display Window will display certain parameters:
SpO2 scale
Overall Session(s) statistics
Heart rate scale
Average SpO2 achieved
Minimum SpO2
Maximum Heart rate
Average Heart rate
User selected
Time to
Descend
© 2003 BIOMEDTECH Australia Pty Ltd
Time to
Recovery
GO2Altitude® Software Manual
15
Control Buttons
The functions allocated in Global Statistics mode are fundamentally the same as those
available in the Session Statistics mode (see Control Buttons in the section Session
Statistics for the correct use of these buttons), with the exception of an additional
checkbox:
The full STAT, or “Full Statistics”, button is used to display all
recorded sessions as a function of saturated blood oxygen levels and
heart rate linearly:
The user is also able to print, store, and export to MS Excel, all the data contained within
this screen. From within MS Excel, the user may also manipulate the data to display other
types of graphs, for example:
© 2003 BIOMEDTECH Australia Pty Ltd
16
GO2Altitude Software Manual
Course Statistics
Within the GO2Altitude® History display screen, there
is also the Course Statistics checkbox.
Located directly to the right of the Global and Session Statistics buttons, the Course
Statistics checkbox, when selected, displays the statistical averages recorded over a
range of hypoxic training sessions:
Each Hypoxic training session is displayed in a range scaled according to the number
of sessions, with the date and time details shown on the lowermost part of the graph,
and the SpO2 and Heart Rate parameter minimums and maximums displayed in the
uppermost portion of the same window. Again, data may be exported to another
program for table and/or graphical manipulation.
© 2003 BIOMEDTECH Australia Pty Ltd
GO2Altitude® Software Manual
17
Operation of the GO2Altitude® Software
Preliminaries
After the installation of the software to the computer and the supplied serial cable is
connected to both the GO2Altitude® Hypoxicator machine and the computer itself, the
software is ready to use.
The COM port through which the Hypoxicator and the user’s computer communicate, is
set at default to “COM port 1”. The user is prompted to change this, should that particular
port be in use for other equipment, by opening the Communications menu and selecting a
different port from the available drop-down list:
From here you may
also select the “skin”
for the display (see the
section “Skin Display
Options” for more
information),
You may also import
sessions from previous
versions of the
software for use by the
GO2Altitude® History
display (see the
“History Screen
Functions” section for
more information.
From the same window, the operator may also elect
the model of the Hypoxicator used; whether it is a
1-, 2-, or 4-person system.
© 2003 BIOMEDTECH Australia Pty Ltd
18
GO2Altitude Software Manual
Recording a Session
To record a session, the following sequence should be followed:
1. Turn on the GO2Altitude® Hypoxicator and start the desired Training Program
(see the full Operational Manual for further information).
2. Ensure that the Pulse Oximeter is securely clipped to the user’s finger.
3. Set the same O2 concentration in the software as that on the GO2Altitude®
Hypoxicator.
4. Choose a user
from the Select
User
dropdown box, or
add a new user
by clicking on
the Add User
button. NOTE
To remove a user from the same list, select the user and click Remove.
5. Information should now begin to appear in both the Graphical Display Window,
and the smaller Message Display Window.
6. The information in the Graphical Display Window will now steadily resolve into a
graph at a rate determined by the incremental resolution applied to the screen. The
line at the lowermost part of this window will display whether the user should be
breathing hypoxic air (with mask), in red, or ambient air (without the mask), in
green.
7. If the value of the user’s arterial oxygen saturation level falls below the selected
baseline, or if the heart rate rises above the baseline an alarm will sound and a
warning display will be issued. For example:
Take note of the message displayed, and comply with the warning(s). The user
must take the mask off and take 2 to 3 regular breathes, in and out.
© 2003 BIOMEDTECH Australia Pty Ltd
GO2Altitude® Software Manual
19
8. To manipulate the graph, see the relevant sections elsewhere in this manual
NOTE Operation of the GO2Altitude® system may be found in much greater detail in
the full Operations Manual accompanying the GO2Altitude® Hypoxicator equipment.
“Skin” Display Options
The GO2Altitude® Software System comes with two separate display options to suit
individual user’s tastes. Each of these options functions in exactly the same way in all
respects, excepting that the display itself has different styles of buttons, display, and
location of functions:
Standard CRT Display Screen
Optional Blue Display Screen
© 2003 BIOMEDTECH Australia Pty Ltd
20
GO2Altitude Software Manual
The user is able to select the required skin from the drop-down option box displayed at the
start of every session.
Glossary
Pulse Oximeter Pulse oximetry is a simple non- invasive method of monitoring
the percentage of haemoglobin (Hb) in the blood that is saturated with oxygen.
The pulse oximeter generally consists of a probe attached to the patient's finger or
ear lobe that is linked to a computerised unit. The unit displays the percentage of
Hb saturated with oxygen together with an audible signal for each pulse beat,
a calculated heart rate and in some models, a graphical display of the blood
flow past the probe. Audible alarms that may be programmed by the user can also
be provided. A pulse oximeter detects hypoxia before the patient becomes
clinically cyanosed.
A pulse oximeter works by generating a source of light at two wavelengths
(650nm and 805nm). This light is partly absorbed by haemoglobin, by amounts
that differ depending on oxygen saturation levels. By calculating the absorption at
the two wavelengths, the processor can compute the proportion of haemoglobin
oxygenated.
Hypoxicator A device designed to provide the user with reduced oxygen
(hypoxic air) for breathing.
Hypoxic test The hypoxic test is used to assess a person’s individual response to
Hypoxic Hypoxia. That is, their response to breathing air with a reduced O2 content.
During this test, the person under test is first required to breath hypoxic air of a known
composition (recommended to be 11%) through a mask, whilst their individual
physiological parameters – heart rate and SpO2 , specifically – are monitored. The
© 2003 BIOMEDTECH Australia Pty Ltd
GO2Altitude® Software Manual
21
normal reaction to this test is a gradual decline in SpO2 ; how much oxygen the blood
carries.
The time taken to reach the baseline level set is known as the “time to descend” or
“Td”. Once the baseline level has been reached, the software prompts to remove the
mask.
Upon removing the mask, the person under test will once again be breathing ambient
air, and their SpO2 level should start to return to a level of 95% (or more). The time
taken to return to this “normal” level of SpO2 is known as the “Time to recover” or
“Tr”.
Based upon the results observed, an IHT practitioner can determine an
individual’s sensitivity to hypoxic breathing, general level of fitness, and – in
athletes and mountaineers – the level and effects of training.
SpO2 The percentage level of haemoglobin saturated with oxygen in the user’s
system. This is an indication of the level of oxygen being carried by the
bloodstream in a given Hypoxic training session.
Td Time to Descend. The time period taken for the user’s SpO2 levels decrease
from their normal values of around 95% to 100% at sea level, below the pre-set
value (normally set at 85%).
Tr Time to recovery. The time period elapsed from the point where the user
reverts to breathing ambient air until their SpO2 levels rise to 95%, or more.
© 2003 BIOMEDTECH Australia Pty Ltd