1
2.0 Installation Transmitted Light Drop Analyser (TLDAOcean) User Manual Version: 1.3 Thank you for purchasing the Drop Technology TLDAOcean. Your instrument has been manufactured with the utmost care and has been tested prior to dispatch. For technical support please contact your local representative or go to www.droptechnology.com Please ensure that you know your instrument model and individual serial number before you get in contact. NOTE: It is strongly recommended that you read this manual fully prior to using your instrument. REGISTRATION: Please register your product. Drop Technology periodically publishes information relating to this product. We can alert you of these updates if you are on our user list. All information supplied to Drop Technology is completely confidential. You can register at www.droptechnology.com Drop Technology Ltd., Tallaght Business Park, Whitestown, Dublin 24, Ireland. Tel: +353 1 4523293 Fax: +353 1 4523967 Email: [email protected] www.droptechnology.com CONTENTS 1.0 Introduction......................................................................... - 1 1.1 About the TLDAOcean. .............................................................................................- 1 1.2 Index of Parts ........................................................................................................- 2 1.3 TLDAOcean Inspection and Environment.................................................................- 5 1.4 Safety Notices .......................................................................................................- 5 1.5 Theory ...................................................................................................................- 6 - 2.0 Installation ......................................................................... - 14 2.1 TLDAOcean Assembly .............................................................................................- 14 2.2 Software Installation...........................................................................................- 16 - 3.0 Software ............................................................................ - 25 3.1 Basic Function Buttons........................................................................................- 25 3.2 Settings Tab.........................................................................................................- 27 3.2 Calibration Tab ....................................................................................................- 31 3.3 DNA/RNA tab ......................................................................................................- 38 3.4 Protein Tab..........................................................................................................- 40 3.5 UV-Vis tab............................................................................................................- 43 3.6 Information .........................................................................................................- 45 3.7 Software Upgrade ...............................................................................................- 47 - 4.0 General Operation ............................................................. - 48 4.1 TLDAOceanFunctionality ........................................................................................- 48 4.2 Sample Evaporation ............................................................................................- 48 4.3 Taking a measurement .......................................................................................- 49 - 5.0 Maintenance...................................................................... - 55 5.1 Cleaning the Plinth ..............................................................................................- 55 5.2 Method of Cleaning the Plinth............................................................................- 55 5.3 Replacing the Plinth ............................................................................................- 56 5.4 Method of Replacing the Plinth ..........................................................................- 57 - 6.0 Appendix............................................................................ - 60 6.1 Solvent Compatibility..........................................................................................- 60 6.2 TLDAOcean Specifications.......................................................................................- 61 6.3 Troubleshooting ..................................................................................................- 62 6.4 Parts that Require Re-order ................................................................................- 63 6.5 Pipetting Technique ............................................................................................- 64 6.6 Warranty .............................................................................................................- 67 - 1.0 Introduction 1.0 Introduction 1.1 About the TLDAOcean. The TLDAOcean® is a simple to use UV-Visible instrument based on the physics of drops which leads naturally to more reliable instruments. • The abbreviation ‘TLDA’ stands for ‘Transmitted Light Drop Analyser’. The TLDA® instrument can be purchased as either an accessory, as is the case with the TLDAC50® and the TLDAOcean® or as a complete integral laboratory instrument, which is the case with the TLDAµV®. • In traditional UV-Visible spectrophotometers, a sample is placed within a cuvette whereas within the TLDA instrument the cuvette is replaced with a microvolume drop sample (1-4µl). • It relies upon the TLDA® patented technology. This is based on the physics of surface tension which holds the microvolume drop sample in place. The sample is in the form of a sessile drop that in the TLDAOcean® adheres very strongly to the edge of the hydrophilic plinth. Importantly, the drop shape is virtually constant regardless of the liquid-under-test because of the dominance of this surface tension force over the gravitational force. The gravitational force is symmetric and therefore so is the micro-drop about its vertical axis. • Upon closing the lid of the TLDAOcean, the light source and spectrometer are aligned so that the light path between them is vertical. The light is focussed as it passes through the sample drop on the plinth. The pathlength of the drop is directly related to the volume of the drop selected. • The design of the TLDAOcean eliminates the need for cuvettes (both standard size and low volume cuvettes) as in conventional spectrophotometers. The cleaning of cuvettes is time consuming and can introduce errors. The TLDAOcean allows for rapid clean up with no measurable sample carryover. • Due to the small sample size it has the capability to measure highly concentrated or highly absorbing samples without dilution. -1- Drop Technology Version 1.3 1.0 Introduction • The TLDAOcean system is designed for a wide range of applications, from nucleic acids and protein quantification to any general UV-Visible measurements. • The Drop Technology TLDAOcean unit is an accessory instrument designed to be used in conjunction with an Ocean Optics Spectrophotometer and an Ocean Optics light source (both with a fibre SMA905 connector). • The Drop Technology accessory enables the user to measure microlitre drop samples (≤4μl) with a high degree of accuracy and precision. • The TLDAOcean is ideally suited to applications where sample is limited, samples are highly concentrated or have a high absorbance and speed and analysis of the sample is important. • The principal of operation of the Drop Technology TLDAOcean is patent protected. 1.2 Index of Parts Fig 1.1. Fig 1.1: TLDAOcean Accessory. Part Number: DT0600-100209 Fig 1.2. Fig 1.2: Fibre Optic Cable to carry light from the light source to the drop via the Fibre Optic Connector on the top of the TLDA. Part Number: DT0800-300101 Fig 1.3. Fig 1.3: Drop Technology 10µL Pipette (0.5µL- 10µL range) Part Number: DT0820-300107 Version 1.3 Drop Technology -2- 1.0 Introduction Fig 1.4. Fig 1.4: Box of 96 Pipette Tips Part Number: DT0820-300108 Fig 1.5. Fig 1.5: Drop Technology Accessory Kit Part number: DT0600-100204 (Cleaning and Reference Standard kit combined - shipped initially with the instrument). Fig 1.5(a) Fig 1.5(a): Drop Technology Plinth Cleaning Solution Part Number: DT0810-300112 Fig 1.5(b) Fig 1.5(b): Drop Technology Reference standard kit including the standards: - Drop Technology RM1 - Drop Technology RM2 - Drop Technology Blank Solution Part Number: DT0810-300105 (can also be shipped individually, See Section 5.4) Fig 1.5(c) Fig 1.5(c): Cleaning Tool Part Number: DT0900-200120 -3- Drop Technology Version 1.3 1.0 Introduction Fig 1.5(d) Fig 1.5(d): 8mm Spanner used to tighten the fibre connection. Part Number: DT0700-400105 Fig 1.5(e) Fig 1.5(e): Specially designed tool for Removing and replacing the Plinth. Part Number: DT0900-200105 Fig 1.5(f) Fig 1.5(f): Cleaning Cloths in an assortment of colours. Part Number: DT0900-200121 Fig 1.6 Fig 1.6: Lint free tissue Part Number: DT0820-300110 Fig 1.7 Fig 1.7: Workstation (Optional) Part Number: DT0900-200115 Version 1.3 Drop Technology -4- 1.0 Introduction 1.3 TLDAOcean Inspection and Environment • Before beginning any installation or operation of the TLDAOcean accessory, the user must ensure that all the parts are suitable for use. Nothing should be visibly cracked, broken or scratched. Packaging and seals should be intact and unopened. • Inspect the TLDAOcean itself for any visible faults, i.e. the unit should not be marked or dented. If there are any manufacturer faults evident or any damage has arisen from transportation contact your supplier immediately. • Remove the TLDAOcean from its packaging and stand it on a rigid, flat surface and check that it is fully stable in its place. • The Drop Technology TLDAOcean is developed for indoor use only in laboratories in which there is stable environmental conditions. The ambient temperature should be between 10˚C and 35˚C and the humidity should be between 8% and 80%. It is important that there is no visible condensation on the instrument. • If the Drop Technology TLDAOcean accessory has just been unpacked or has been stored in a cold environment, it should be allowed to come to thermal equilibrium for 2-3 hours in the laboratory before use. This will prevent the possibility of failure as a result of internal condensation. • Contact your supplier immediately if you experience any unexpected difficulties with the Drop Technology TLDAOcean. 1.4 Safety Notices NEVER LOOK DIRECTLY INTO THE BEAM OF UV-VIS LIGHT FROM THE LIGHT SOURCE. It could cause permanent or temporary blindness. ENSURE THAT THE LAMP IS SWITCHED OFF PRIOR TO CONNECTING AND DISCONNECTING THE FIBRE OPTIC CABLE. This will avoid eye damage caused from exposure to the light source. NOTE: BEFORE MEASURING SAMPLES ALLOW THE LAMP IN THE LIGHT SOURCE TO WARM-UP (Recommended time varies according to the lamp). NOTE: If the solutions to be tested with the TLDAOcean instrument are flammable, corrosive, toxic or otherwise harmful, all due care and attention must be practiced while working with such substances to minimise risk to the operator and the instrument, i.e. (good laboratory practice and consultation with the Solvent Compatibility Table in Section 5.1). If the MSDS for dangerous samples can be attained, it is recommended that it is read and fully understood prior to using the sample. -5- Drop Technology Version 1.3 1.0 Introduction • If the accessory is used in a manner not specified or in environmental conditions not appropriate for its safe operation, the protection provided may be impaired and accessory warranty may be withdrawn. 1.5 Theory 1.5.1 Background Subtraction For the Nucleic acid module in the TLDAsoft® software, a background reading at 320nm is deducted from the absorbance to reduce noise on the baseline. This 320nm background subtraction is used because spectra may be offset from the baseline during readings. When this is the case, the calculated nucleic acid readings may be higher than their true values. It is a standard practice to have a background subtraction in these types of measurements. A similar background subtraction at 340nm is performed for protein measurements. These features are enabled by default (in both cases) in the software but can be disabled if required. 1.5.2 Blank measurement In order to use the TLDAOcean instrument, we must first zero the device. As with any spectrophotometer, this is done by measuring a reference (blank) solution. This solution contains everything except the compound of interest which absorbs light. Thus, by zeroing the machine using the "Reference", any measured absorbance is only due to the presence of the solute or suspension of interest. When the reference measurement is taken, it is retained in the memory of the TLDAsoft®. Once the reference is attained, the sample can be loaded and measured. 1.5.3 Principal of measurement on the TLDAOcean The TLDAOcean instrument measures the amount of light that is absorbed by solutes or suspensions in a solution without the need for a cuvette or a large amount of sample. It measures the intensity of a light beam after it is transmitted through and emerges from sample drops and compares this intensity to a reference measurement to create an absorbance value by employing the standard absorbance formula. I Absorbance = Log 10 blank I sample Where: Iblank = the intensity of the light detected after being transmitted through the blank sample. Isample = the Intensity of the light detected after being transmitted through the sample. The amount of light absorbed is directly proportional to the concentration of the absorbing solutes or particles in that sample relative to the blank. Version 1.3 Drop Technology -6- 1.0 Introduction 1.5.4 Beer’s Law (The Beer- Lambert Law) Beer’s law is employed to calculate the concentration of a sample. This equation correlates the known absorbance and the concentration of the sample. It takes into account the extinction coefficient of the sample tested and the pathlength of light through the sample. Hence a quantitative measurement can be obtained from a spectrophotometric system: A = εCL Where A = Absorbance (AU, Absorbance Units) ε = the molar extinction coefficient (L mol-1 cm-1) C = the concentration (mol/L) L = the pathlength (cm) (This is usually represented as 1cm) According to Beer’s Law an extinction coefficient is a constant for a given substance dissolved in a given solute and measured at a given wavelength. It is an intrinsic property of a substance that will be the same for differing samples of the same substance. Conventional spectrophotometers usually have a minimum pathlength of 10 mm (1cm) but the pathlength of the TLDAOcean is much less than this. To comply with Beer’s Law and convention, the TLDAsoft® calculates a result for a sample based on a 1 cm pathlength. TLDAsoft® does this using a mathematical model that is based on the actual pathlength of the light through the sample within the TLDAOcean instrument. This small pathlength feature of the TLDAOcean instruments design gives the TLDAOcean the ability to measure samples that are: 1. Many times more concentrated than a conventional spectrophotometers upper detection limit. 2. Have a very high absorbance value 3. Much lower in volume than conventional spectrophotometers. Note: The actual pathlength on the TLDAOcean instrument is dependant on the volume of sample placed on the plinth. It is therefore very important to input the correct volume loaded on the plinth in to the software interface and pipette accurately. 1.5.5 Nucleic Acid Quantitation Purines and pyrmidines in nucleic acid show maximum absorbance of UV light around 260 nm (eg: dATP: 259nm; dCTP: 272nm; dTTP: 247nm). Nucleic acids are known to have a maximum absorption at 260nm which is an average of the absorption of the individual nucleotides. -7- Drop Technology Version 1.3 1.0 Introduction Beer’s law is applied to the absorbance value recorded in conjunction with the selected/inputted extinction coefficient and the pathlength of light through the sample to determine the concentration in ng/µL. Therefore, the amount of light absorbed is directly proportional to the concentration of nucleic acid in the sample. The manipulation of Beer’s Law gives the concentration in the form: C= Therefore A εL C= concentration measured in mg/mL A = Absorbance (AU) ε = mass extinction coefficient (µL/ng)cm-1 L = pathlength in cm. The generally accepted mass extinction coefficients for the most abundant nucleic acids are: Double stranded DNA: 0.02 (µL/ng) cm-1 Single- stranded DNA: 0.03 (µL/ng)cm-1 RNA: 0.025 (µL/ng)cm-1 Hence, for a 1cm pathlength, the optical density at 260nm equals 1.0 for the following solutions: A 50ng/µl solution of dsDNA A 33ng/µl solution of ssDNA, and A 40 ng/µl solution of RNA TLDAsoft® calculates the concentration [ng/µL] from the equation: C = A260 * Factor Where: A260 = absorbance value at 260nm (for a 1cm path length) 1 Factor = εL Therefore, the Factor for the common nucleic acids (based on a 1cm pathlength) will be: dsDNA = 50 ng/µL ssDNA = 33 ng/µL RNA = 40ng/µL The TLDAsoft® package automatically defaults to the last mass extinction coefficient that was used in the DNA/RNA module in the previous session. Version 1.3 Drop Technology -8- 1.0 Introduction 1.5.6 Purity and Ratios Nucleic acids have a broad peak at 260nm and so they can be measured accurately and easily, provided that there is no source of foreign contamination affecting the peak. Fig. 1 Screenshot of pure nucleic acid read with no visible source of protein contamination at 280 nm It is common for nucleic acids to be contaminated with other molecules; hence we can assess the degree of purity of the nucleic acids by examining the absorption at other wavelengths rather than 260nm. Due to the fact that these contaminating molecules such as protein and polysaccharides have their own, known, absorption maxima, the absorbance at other wavelengths is often compared to the absorbance at 260nm. Due to the fact that proteins have an absorbance maximum at 280nm and many polysaccharides absorb at 230nm, the A260/A280 and A260/A230 ratios may be used for their detection. This is the standard method to determine if the nucleic acid sample is contaminated. The equations for calculating these ratios take into account the effect of turbidity at 320 nm. Neither nucleic acids nor proteins absorb light at 320nm, so this wavelength in used to correct the readings and remove the turbidity effect. Turbidity causes light to be scattered and affects quantification of DNA and RNA. (The Turbidity absorbance may also be measured at 340 nm for Protein measurements). A260 ( A260 − A320 / 340 ) = A280 ( A280 − A320 / 340 ) A260 ( A260 − A320 / 340 ) = A230 ( A230 − A320 / 340 ) Where A230 = Absorbance of a sample at 230nm A260 = Absorbance of a sample at 260nm A280 = Absorbance of a sample at 280 nm A320/340 = Absorbance due to turbidity:A320 for nucleic acids or A340 for protein • An A260/A280 ratio of ~1.8 is generally accepted as ‘pure’ for DNA • An A260/A280 ratio of ~2.0 is generally accepted as ‘pure’ for RNA • The A260/A230 ratio should be greater than the A260/A280 ratio. The A260/A230 ratio should not be lower than 1.8 in any case. The A260/A230 ratio usually falls in the range of 1.8-2.2. If the ratio is much lower than expected, it may indicate the presence of contaminants which absorb at 230nm. • A230:260:280 ratio should be around 1:2:1 for ‘pure’ RNA • A230:260:280 ratio should be around 1:1.8:1 for ‘pure’ DNA -9- Drop Technology Version 1.3 1.0 Introduction The A260/A280 ratio is commonly used to detect contamination by relatively small amounts of nucleic acid (DNA) in protein solutions since proteins (particularly aromatic amino acids) absorb light strongly at 280nm. The reverse however is not true; it takes a relatively large amount of protein contamination to significantly affect the A260 /A280 ratio of a nucleic acid solution. Typical A260 /A280 ratio values for protein contaminated nucleic acid and nucleic acid contaminated protein samples can be found in the tables below: Table 1: Protein vs. Nucleic Acid ratio table % Protein 100 95 90 70 % Nucleic acid 0 5 10 30 Table 2: Nucleic Acid Vs. Protein ratio table A260 /A280 0.57 1.06 1.32 1.73 A260 /A280 ratio has a high sensitivity for Nucleic acid contamination in Protein. % Nucleic acid 100 95 90 70 % Protein A260 /A280 0 5 10 30 2.00 1.99 1.98 1.94 A260 /A280 ratio lacks sensitivity for Protein contamination in Nucleic Acids. This difference exists because at 260nm and 280nm, nucleic acids have a much higher extinction coefficient than protein. For this reason relatively high concentration of protein will contribute relatively little to the absorbance at 260nm and 280nm, i.e. the nucleic acid will dominate results. While the protein contamination cannot be reliably assessed with an A260 /A280 ratio, this also means that it rarely contributes to error in the quantitation of nucleic acids. Fig. 2 Screenshot of nucleic acid sample with Protein contamination at 280nm. The TLDAsoft® package automatically measures, calculates and records the A260 /A280 ratio for each sample so the purity can be determined via the ratio or by sight in some cases by viewing the graph. A user can interpret a graph such as Fig 2 as showing an overshadowing of the 260nm peak with a higher absorbance peak at 280nm. This implies that there is a higher concentration of protein than nucleic acid in the sample which in extreme cases could lead to the 260 measurement being affected as well as a poor A260 /A280 ratio. Version 1.3 Drop Technology - 10 - 1.0 Introduction 1.5.7 Contaminants affecting results • As well as protein and peptide contamination at 280nm, results can be affected by the presence of other impurities. • Absorption at 230 nm can be caused by contamination by phenolate ion, thiocyanates, and other organic compounds. • Phenol contamination: Phenol is commonly used in nucleic acid purification but it can significantly throw off quantification estimates. Phenol absorbs with a peak at 270 nm and an A260 /A280 ratio of 1.2. Nucleic acid preparations uncontaminated by phenol should have an A260/280 ratio of around 2. Contamination by phenol can significantly contribute to overestimation of DNA concentration. • Particulate contamination: Absorption at 330 nm and higher indicates particulates contaminating the solution, causing scattering of light in the visible range. The value in a pure nucleic acid sample should be zero. • Negative values: these values could result if an incorrect solution was used as a blank. Alternatively, these values could arise due to fluorescence of a dye in the solution. 1.5.8 Protein Quantitation Protein quantitation is performed at 280nm on the TLDAOcean system. Absorption of radiation in the near UV (280 nm) by proteins depends on the concentration of the amino acids with aromatic side chains present in the sample such as Tyrosine and Tryptophan but also to a lesser extent Phenylalanine and disulfide bonds. Readings do not require the generation of a standard curve as is the case with colorimetric methods of quantifying proteins such as the Bradford, Lowry, BCA and Biuret assays. NOTE: Extreme care should be taken to eliminate nucleic acids from the sample before reading protein samples as the extinction coefficients of nucleic acids in the 280nm region may be as much as 10 times that of protein at their same wavelength, and hence, a few percent of nucleic acid can greatly influence the absorbance and concentration result. In the implementation of Beer’s law for protein quantitation, the extinction coefficient is generally (but not always) referred to as a molar extinction coefficient. The molar extinction coefficient of a peptide or protein is related to, and calculated by its amino acid composition. The molar extinction coefficients of the amino acids: Tryptophan, Tyrosine and Cysteine at 280 nm are generally accepted to be 5540, 1480 and 134 respectively. These values are then weighted with their amount within the protein and summed to give the molar extinction, εmolar, of that Protein. - 11 - Drop Technology Version 1.3 1.0 Introduction εmolar = (nA×5540) + (nB×1480) + (nC×134) where: nA = the ratio of Tyrtophan residue relative to the other two nB= the ratio of Tyrosine residue relative to the other two nC= the ratio of Cysteine residue relative to the other two 5540, 1480 and 134 = the amino acid molar extinction coefficients of Tryptophan, Tyrosine and Cysteine at 280 nm Applying this molar extinction coefficient and the value for the measured absorbance of a solution yields an expression for the molar concentration: A ε molar = Molar Concentration when L=1cm In practice, many suppliers of standard proteins do not provide molar extinction coefficients. Instead, they provide absorbance (A280nm) values for 1% (=1 g/100 ml) solutions measured in a 1 cm cuvette. These values can be described as mass extinction coefficients (εmass) or percent solution extinction coefficients having units of (g/100 ml)-1 cm-1 instead of M-1cm-1 or Lmol-1cm-1 or (ml/µg)cm-1 as referred to earlier. Consequently, when these values are applied as extinction coefficients in the general formula, the units for concentration, C, are in terms of percent solution (i.e., 1% = 1 g/100 ml = 10 mg/ml). A ε mass = Percent Concentration The relationship between molar extinction coefficient (εmolar) and mass extinction coefficient (εmass) is as follows: ε molar = (ε mass ) x( MW ) 10 Where MW = the molecular weight of Protein (KDa) If one wishes to report concentration in terms of mg/ml, then an adjustment factor of 10 must be made when using these percent solution extinction coefficients (e.g., one must convert from 10 mg/ml units to 1 mg/ml concentration units). A 10= Concentration in mg/ml ε mass NOTE: As there is such variation in reporting styles of proteins, it is very important to carefully read stated vales to be sure that the unit of measure is understood and applied correctly. Version 1.3 Drop Technology - 12 - 1.0 Introduction Although the same revision of the equation is used for Beer’s law as was employed for nucleic acids. Convention dictates slightly different unitary nomenclature within the law be utilised for protein concentration, so proteins are measured in the units of mg/ml. A C= εL Therefore C= concentration measured in mg/ml or g/100ml A = Absorbance (AU) ε = molar extinction coefficient M-1 cm-1 or mass extinction coefficient Lg-1cm-1 L = pathlength in cm. The TLDAsoft® package calculates protein concentration for the end users in mg/ml. It has 3 predefined user selectable coefficients: • BSA: Unknown Bovine Serum Albumin protein concentrations are calculated using the mass extinction coefficient of 6.67 at 280nm for a 1%(10mg/ml) BSA solution • IgG: Unknown Immunoglobulin G concentrations are calculated using the mass extinction coefficient of 13.7 at 280nm for a 1%(10mg/ml) IgG solution • Lysozyme: Unknown Lysozyme protein concentrations are calculated using the mass extinction coefficient of 26.4 at 280nm for a 1%(10mg/ml) Lysozyme solution It also has 2 user definable molar and mass extinction coefficient options: • Other Protein (εmolar & MW): User defined values for molar extinction coefficient (M-1 cm-1) and molecular weight (MW) in KiloDaltons (kDa) for their respective protein reference. The εmolar and M.W. should be entered prior to making measurements. • Other Protein (E 1%): User defined values for mass extinction coefficient (Lgm-1cm-1) for a 10mg/ml (1%) solution of the respective protein reference. The appropriate extinction coefficient should be entered prior to making measurements. NOTE: Due to the patented design and principal of operation of the TLDAOcean optics, the unique sampling method ensures exceptional accuracy and reproducibility of results. NOTE: It also means that the volume loaded dictates the pathlength through the sample. In order to get the maximum accuracy from these optics, it should therefore be understood that lower volumes confer more accuracy at higher concentrations and conversely, higher volumes confer more accuracy at lower concentrations (e.g. For nucleic acids, if the sample is very dilute (<100 ng/µl) a volume of 3µl could be loaded and inversely if the sample is very concentrated (>2,000ng/µl) a volume of 1.0µl could be loaded to reduce error. - 13 - Drop Technology Version 1.3 2.0 Installation 2.0 Installation 2.1 TLDAOcean Assembly Fig 2.1. STEP 1 Screw one end of the fibre optic cable onto the SMA905 connector on the lid of the TLDAOcean. Once finger tight, use the 8mm spanner to tighten another 30˚ . The other end of this fibre connects to the light source used. Fig 2.1. NOTE: The fibre must not be loose Fig 2.2. STEP 2 Using a screwdriver unscrew the clamp at the rear of the TLDAOcean Fig 2.2. Fig 2.3. STEP 3 Fit the clamp around the fibre optic cable and screw it back into place. Fig 2.3. This retention clamp is designed to minimise any risk of damage to the fibre. Fig 2.4(a) STEP 4 Place the TLDAOcean along with the light source and spectrometer on the workstation. Fig 2.4(a) Version 1.3 Drop Technology - 14 - 2.0 Installation Fig 2.4 (b) STEP 5 Screw the other end of the fibre optic cable from the top of the TLDA to the light source. Screw one end of the shorter fibre optic cable to the SMA 905 connector on the bottom of the TLDAOcean and the other end to the spectrometer. Fig 2.4(b) STEP 6 Make sure the light source is switched on and that it is connected to the spectrometer if pulsed light is required. Connect the USB B connector to the spectrometer and the USB A connector to the computer. Fig 2.5. STEP 7 The TLDAOcean is now connected and ready for use. Fig 2.5. - 15 - Drop Technology Version 1.3 2.0 Installation 2.2 Software Installation WARNING: The spectrometer must be connected via a USB cable to the computer before the ‘TLDASoft’ software can be loaded onto the PC. The requirements to install TLDASoft are as shown below. Requirements: • PC with 32-bit or 64-bit Windows 8, 7, Vista or XP • Spectrometer from Ocean Optics (USB4000, USB2000+ or HR4000) • Free USB port (2.0) • TLDASoft (File: tlda_setup.exe (8.8MB)) • Approximately 35MB available space on a hard-disk (drive C:) • Administrator rights on your PC NOTE: To enable all functions of TLDASoft the user must register with Drop Technology (www.droptechnology.com). They will then receive by email a software registration key based on the serial number of their spectrometer supplied. 2.2.1 Software Installation To properly install the TLDA software: 1 Close all programs and make sure that the Spectrometer is connected, via the USB cable, into the computer. Make sure any previous versions of TLDASoft have been uninstalled from your computer (see section 2.2.2 to uninstall previous versions of TLDASoft). 2 Insert the operating software CD or USB key in the CD drive or USB slot of the PC. The software installation menu should appear automatically. Click on tlda_setup.exe (TLDAsoft application software). If this menu does not appear, choose ‘My Computer’ to view the contents of the CD or USB key. Double click on the file named ‘tlda_setup.exe’. On the Welcome window click Next. Version 1.3 Drop Technology - 16 - 2.0 Installation 3 Please read the License Agreement carefully. Before you can proceed to the next window by pressing Next, you have to agree to the terms and conditions. 4 The Choose Destination Location screen appears. If there is a folder C:\droptech on your machine already you should move its content to a different location. The TLDA installer will overwrite any content in an existing folder C:\droptech or creates a new one in order to save the program and data files in it. Click the Browse button to customize your installation location, or click the Next button to accept the default location and continue. 5 Please wait until the TLDASoft installer has copied all the files to your hard-disk. - 17 - Drop Technology Version 1.3 2.0 Installation 6 The window above disappears automatically and the libusb-win32 Inf-Wizard starts with the preparations of the USB device driver. You should connect a spectrometer to a USB port of your PC if you have not done so already. Please click Next. 7 If your spectrometer from Ocean Optics is not listed as shown in the example below, although it is connected to one of the USB ports of the PC, you should disconnect it and wait for about a minute. When this time is elapsed reconnect the spectrometer to the same USB port as previously and wait again for about one minute. If the device from Ocean Optics is still not visible in the list below there must be something wrong with the USB port or the spectrometer. Please try a different USB port proceeding in the same manner as explained above. Please contact customer service if the problem persists, otherwise click on the Ocean Optics device in the list before you click Next. 8 The Manufacturer Name in the window below can be changed (optional) before pressing Next. Version 1.3 Drop Technology - 18 - 2.0 Installation 9 The information about the USB device driver has now been collected and must be stored somewhere on the PC. You can freely choose a location, but the file name extension (.inf) must not be changed. 10 Before you click Install Now..., as shown on the screen-shot below, make sure that you have chosen the correct device for which the USB device driver will be installed. The most obvious indicators are the Vendor ID: 0x2457 and the Device description: Ocean Optics USB4000, as in the example below. Please click Install Now... 11 The files for the USB device driver are now been stored in the system folders of the Windows operating system. Please wait, this might take some time. - 19 - Drop Technology Version 1.3 2.0 Installation 12 When the installation process is finished successfully the window below pops up on the screen and indicates that TLDASoft can now be started. Please click OK to shut the small window. You have now installed the TLDASoft package but without full functionality. If the software does not start properly, refer to the “Troubleshooting” section for possible solutions. 13 The Windows start menu should now include the folder tlda32_64. In the folder you will find two entries (TLDAsoft, Uninstall) among a few other menu items. 14 The TLDASoft icon on the Windows start menu starts the TLDASoft application. Please choose the Information tab of this application and check whether the spectrometer is linked to the application software or not. In the example below it states Yes for a USB4000 device. This indicates that the spectrometer is properly communicating with the software. In the case of a No in the Linked column, the device is either not connected to a USB port of the PC or the communication between the software and this particular device is corrupted. Please contact the customer service if you require any help. Version 1.3 Drop Technology - 20 - 2.0 Installation 15 If the connection between the application software and the spectrometer is properly established TLDASoft is ready to be activated. Currently the user can measure data, read the information of the help system and get familiar with TLDASoft, but no absorbance data can be acquired because the Blank button is disabled. 16 To enable all functions of the software you have to contact Drop Technology for the software registration key. You should start the software and go to the information tab and note the serial number of your spectrometer. This serial number may also be visible as a sticker on your spectrometer. 17 Register your product, by emailing the serial number of the spectrometer to Drop Technology. They will return by email a 30 digit Registration key and administration name and password. 18 Return to the information tab of TLDASoft and once you enter in the supplied Administrator Name and Password the box for the registration Code becomes accessible. 19 Enter in the 30 digit registration key and then click the activate button. 20 Your TLDASoft package should now be ready for operation with your TLDA. - 21 - Drop Technology Version 1.3 2.0 Installation 2.2.2 Software Uninstallation Uninstall can be chosen from the Windows start menu and the process starts with the message as shown below. Please be really sure that you want to uninstall TLDASoft from your PC before you click Next. When you have clicked the Next button the process cannot be stopped again. Only a re-installation of TLDASoft can return it to a working application. To uninstall the TLDA software: 1 By pressing Next in the Welcome window shown above starts the application USBDeview. This tool allows you to uninstall any USB driver. So, be careful to choose the correct one from the list. Currently connected and activated USB devices show a green dot on the left hand side. Only click on an entry that includes the name Ocean Optics before you choose 'Uninstall selected devices' from the File menu of the USBDeview application. If you are not one hundred percent certain whether to do delete the Ocean Optics device driver please contact customer service. Version 1.3 Drop Technology - 22 - 2.0 Installation 2 If you decided to uninstall the device driver as shown in the previous step another window pops up. This gives you the opportunity to cancel the uninstallation process or proceed with that choice. Please exit the USBDeview application by choosing Exit on the File menu of the window shown in step 1, whether you have uninstalled the device driver or not. 3 At this point in time you have pressed Exit on the File menu of the USBDeview application and the uninstallation process continues with the deletion of the TLDASoft files. Please wait, this can take a little while. 4 The next window allows you decide whether you want to delete some or all of your data, log and configuration files, which have accumulated during the time when TLDASoft was installed on your PC. If you delete all of these files the folder droptech is removed from the PC otherwise it will remain. - 23 - Drop Technology Version 1.3 2.0 Installation 5 Click the Finish button when the uninstallation is complete. If the USB device driver was uninstalled you can now disconnect the spectrometer and use the vacant USB port for different USB devices, or you can connect the spectrometer to a different USB port and use it with another software application. Version 1.3 Drop Technology - 24 - 3.0 Software 3.0 Software 3.1 Basic Function Buttons Sample Name: This field is present in all of the measurement tabs (DNA/RNA, Proteins and UV-Vis). It allows for specific sample identification. By double-clicking in this field a virtual keyboard will appear to assist the inputting of the desired name. If the sample name is not changed for new tests it will automatically add an underscore and number on to the end. This is convenient for time-saving in instances when repeat measurements on the same drop or repeat measurements on another sample of the same solution are required. For Example: ‘DNA200’ will default to ‘DNA200_1’ once the ‘Accept’ button has been pressed. Blank: A blank must be carried out before measurements on any sample are taken. When taking the blank, place a drop of deionised water or the relevant buffer (depending on the application) on the plinth, close the lid and press ‘Blank’ (See section 1.5). The blank file is a measurement of the intensity of light versus wavelength. It may be useful to refer to the blank file at a later point during sample measurement. The blank file gets automatically saved to the file directory, it is assigned the sample name but with the file extension ‘.bk*’ i.e. .bkd for dna work and .bkp for protein work. To locate the blank (or any other file) open the ‘File Manager’. Decline: The decline button declines either the intensity or absorbance spectrum displayed on the screen. - 25 - Drop Technology Version 1.3 3.0 Software Measure: The measure button sends the command to the system to take a spectral reading. Once the button has been pressed an absorbance spectrum will appear on the graph. Measure can be pressed more than once, until the user is happy with the spectrum. Accept: This button accepts the generated absorbance spectrum and saves it to the system memory with the file extension ‘.*dna’ or ‘*.prt’ i.e. .dna for dna work and .prt for protein work. Note: This action also saves the samples intensity data in the form ‘.*sg’ i.e. .dsg for dna work and .psg for protein work. Reset: This icon rests all samples to factory default settings should the user wish to return the instrument to its default configuration. This button resets the graphical display i.e. a new blank must be saved for absorbance spectrums to be acquired. Help: Help buttons are present in each tab to provide supplementary assistance to the user depending on the application. Shutdown: This shuts down the TLDAsoft® program. This must be done before the TLDAOcean is switched off. Version 1.3 Drop Technology - 26 - 3.0 Software 3.2 Settings Tab This software tab contains the basic user-defined settings for the TLDAsoft®. Users should take care to check the ‘Settings´ tab prior to taking any measurements to ensure that all fields represent the desired setting values. Time and Date: The Time and Date on the TLDAOcean is set by the manufacturer prior to shipment of the unit but it can be adjusted by the user at any point. To set the Date and Time press the ‘Set’ button on the left hand side of the Time and Date field, this stops the clock. Press ‘OK’ to accept the prompt window that appears. Place the Cursor in the Time and Date field and highlight the increment to be changed. Use the up arrow and the down arrow to increase or decrease the increments of time and date. Press the asterisk again to accept the time and date and restart the clock from this point onwards. Ensuring that the Time and Date is set correctly is important because, by default, data files are saved in chronological order. This will lead to confusion identifying data if the time and date is incorrect. NOTE: The time and date does not reset itself to take account of daylight saving time. - 27 - Drop Technology Version 1.3 3.0 Software Save Folder: This Field details the location for which the data is to be saved. If the user wants to organise sets of measurements into a folder for ease of identification afterwards they can input a folder name here. Once a folder name is created all sample data will be saved into this folder until the folder is changed or returns to default. The default for this is an empty field. By default files automatically get saved to the root directory with the date and time recorded if no folder is specified. Help: This provides information for the user in regards to all functions in the settings tab. Reset: This button resets the TLDAOcean system to its default settings for the sample volume, integration time, average and boxcar width. Sample Volume: This is the drop size in microlitres. The up and down arrows can be used to adjust the Volume. The Volume is set to 3µL by default. NOTE: Ensure that the value shown agrees with the drop size set on the pipette. Integration Time: The integration time, represents (in milliseconds) the amount of time for which the detector sums up the incoming photons. A larger integration time results in higher peaks in the graphical spectrum because more light is detected so a greater intensity of light is recorded. If saturation is a problem a smaller integration time should be used to lessen the effect that the high Version 1.3 Drop Technology - 28 - 3.0 Software intensity of the light source is having on readings. Average: The integration time is set to a default of 10 milliseconds. The Average field represents the number of discrete spectral results that are collected by the detector before it takes an average spectrum. The average spectrum is the only one sent to the software and stored. Discrete traces are not stored in the software. A larger Average number will reduce noise as the Signal-Noise ratio improves by the square root of the number of Averages. However, resolution decreases as the Average number increases. The average number is set to a default of 5. Boxcar Width: The Boxcar Width represents the number of pixels that are averaged together to give a smoother spectral acquisition. The number shown represents that number of pixels to the left and that number of pixels to the right averaged together. Boxcar width is applied to the acquisitions after they have been averaged. Increasing this may give a smoother plot but decreases the resolution of the plot. The Boxcar width is set to a default of 5. Shutdown: This shuts down the TLDASoft® program. This must be done before the TLDAOcean is switched off. File Manager: File Manager opens up the typical ‘Windows Explorer’ window that contains all the data files. From this window files can be copied, deleted or opened from the PC’s memory. They can also be transferred to a USB for exporting. - 29 - Drop Technology Version 1.3 3.0 Software Files Types: Version 1.3 For any particular sample there are four data files saved with that name. The data files are distinguished by their extension. Extensions are: • Name.bk*: This is the data acquired from the blank measure. When exported and opened in excel column A is the wavelength and column B is the respective intensity. .bkd for dna work and .bkp for protein work. • Name.dr*: This is the data from the dark current measurement (this is automatically obtained by the software prior to testing). When exported and opened in excel column A is the wavelength and column B is the respective intensity. .dkd for dna work and .dkp for protein work. • Name.dna or Name.prt: This file is the absorbance of the sample. When exported and opened in excel Column A lists the wavelength in increasing increments and Column B lists the corresponding Absorbance at that wavelength. .dna for dna work and .prt for protein work. • Name.*sg: This file is the intensity of the sample. When exported and opened in excel Column A lists the wavelength in increasing increments and Column B lists the corresponding Intensity at that wavelength. .dsg for dna work and .psg for protein work. Drop Technology - 30 - 3.0 Software 3.2 Calibration Tab This tab is used for Calibration of the TLDAOcean. It acts to ensure that the instrument is performing optimally. Two levels of verification can be preformed within this tab to give the user full confidence in all results that are attained. The Reference Standard kit that is provided with the TLDAOcean instrument contains the solutions that are to be used as the standards of calibration. This tab contains two sub tabs: • 5 pt Performance check. • 10 pt Validation. The specific protocols for both procedures are contained within the ‘Help’ tab. These protocols should be read thoroughly prior to calibration and can be referred to at any stage during the process by clicking the ‘Help’ button. NOTE: Make sure the plinth has been cleaned before beginning calibration. - 31 - Drop Technology Version 1.3 3.0 Software 3.2.1 5 Point Performance Check A 5 point performance check requires a minimum of 5 repeatability tests that can be regarded as a quick pre-measurement approval. This check will establish that the TLDAOcean instrument is performing to specifications and will give confidence in subsequent measurement results. To carry out a 5 point performance test you must first enter a Sample Name for the reference tests going forward. You must then ‘blank’ the instrument. To do so, pipette a drop of the blank solution onto the plinth and press ‘Blank’. ‘BLANK’ is now displayed on the screen in between the blank and decline buttons. You must then press the now enabled ‘accept’ button to store the blank spectrum data in memory as .bkc file. Version 1.3 Drop Technology - 32 - 3.0 Software ‘DARK’ is now displayed on the screen in between the blank and decline buttons. You must then press the ‘accept’ button to store the dark spectrum data in memory as .dkc file. The measure button is now enabled. Wipe off the blank drop using a lint free wipe and pipette the first drop of the Reference Solution (RM1) on the sample plinth and press ‘Measure’. If you are happy with the absorbance spectrum press ‘Accept’. If not click ’Measure’ again to record a new absorbance spectra. Alternatively, you may click on ‘Decline’ which will bring you back to the intensity spectrum and all aspects of the software will be enabled. This will store the data for the absorbance spectrum in memory as a *.cal file. The corresponding intensity data will then also be stored as a *.csg file. The table of data will populate as the reference measurements are taken. The Absorbance of the sample drop is retrieved at three different preconfigured wavelengths. Graphical representation of each drop’s spectrum is also displayed on the screen. The spectrum covers the 200nm-750nm range. - 33 - Drop Technology Version 1.3 3.0 Software The previous steps are repeated for 5 individual drop measurements of RM1. The five spectra are shown colour coded and overlayed on the screen with the absorbance data. After 5 readings have been accepted TLDAsoft® will automatically calculate the mean and standard deviation for each wavelength which is displayed at the bottom of the table of data. Once you double click in the table of data, the data table will fill the screen. TLDASoft® will state whether the TLDAOcean instrument has passed or failed. The test can be repeated with the second reference fluid if desired. If the second reference standard (RM2) is run, you must blank the system again and pipette five drops of the RM2 standard. The data will be populated on the screen and a pass or fail status displayed. In the event of failure see Section 6.3 Troubleshooting. Version 1.3 Drop Technology - 34 - 3.0 Software 3.2.2 10 Point Validation Check A 10 point validation check is an all-inclusive check that ensures that the whole system is performing optimally. It takes longer to execute than a 5 point check as it requires 10 repeatable points for full validation. This thorough check may be carried out by a service engineer when calibrating the machine. Firstly, the user must select from the drop down menu either RM1 or RM2. The specifications for both reference standards are stored within the software memory and thus the software itself can determine whether the TLDAOcean system passes the validation or not. You must then ‘blank´ the Instrument. To do so, pipette a drop of the blank solution onto the plinth and press ‘Blank’. ‘BLANK’ is now displayed on the screen in between the blank and decline buttons. You must then press the now enabled ‘accept’ button to store the blank spectrum data in memory as .bkv file. - 35 - Drop Technology Version 1.3 3.0 Software ‘DARK’ is now displayed on the screen in between the blank and decline buttons. You must then press the ‘accept’ button to store the dark spectrum data in memory as .dkv file. The measure button is now enabled. Wipe off the blank drop using a lint free wipe and pipette the first drop of the reference solution onto the sample plinth and press ‘Measure’. If you are happy with the absorbance spectrum press ’Accept’. If not click ’Measure’ again to record a new absorbance spectra. Alternatively, you may click on ‘Decline’ which will bring you back to the intensity spectrum and all aspects of the software will be enabled. By pressing ’Accept’, the data for the absorbance spectrum will be stored in memory as a *.val file. The corresponding intensity data will then also be stored as a *.vsg file. The table of data will populate as the reference measurements are taken. The absorbance of the drop is displayed at three different pre-configured wavelengths. An absorbance spectrum for each drop sample is displayed on the screen. The spectrum covers the 200nm-750nm range. Version 1.3 Drop Technology - 36 - 3.0 Software The previous steps are repeated for 10 individual drop measurements of the reference material. The absorbance spectra are shown colour coded and overlayed on the screen. After ten readings have been accepted, TLDAsoft® will automatically calculate the mean and standard deviation for each wavelength which is displayed at the bottom of the table of data. Once you double click in the table of data, the data table will fill the screen. TLDAsoft® will state whether the TLDAOcean instrument has passed or failed based on the reference standard specifications. The test should be repeated as above with the second reference fluid. You will have to select the second reference from the drop down menu, reblank the system and measure ten drop samples. The data will be displayed on the screen and a pass or fail status displayed. In the event of failure see Section 6.3 Troubleshooting. - 37 - Drop Technology Version 1.3 3.0 Software 3.3 DNA/RNA tab To measure nucleic acid samples select the ‘DNA/RNA’ application tab. These samples can be easily checked for concentration and purity using the TLDAOcean spectrophotometer. Baseline Correction: The TLDAOcean system automatically incorporates a Baseline Correction - this normalises the data at 320nm i.e. the absorbance value at 320nm is deducted from all absorbance values at all wavelengths. This is the data plotted to the screen and displayed in the necessary information boxes. This can be disabled so that the raw absorbance data is recorded. Sample Name: Sample Type: Wavelength: Version 1.3 An appropriate sample name ought to be inputted here. The user must select the type of nucleic acid being measured. The options that appear in the drop down list are: • dsDNA – double stranded DNA • ssDNA – single stranded DNA • RNA • Nucleic Acid – for other nucleic acids. If this is selected the user has to enter the constant value between 15 and 150. The constant value is the inverse of the molar extinction coefficient and this will be set by the type of sample being tested. If the absorbance at a particular Drop Technology - 38 - 3.0 Software wavelength needs to be known, it can be selected here. The wavelength can be selected by using the up/down arrows to the right of the wavelength box or clicking in the wavelength box and manually entering in the value. The absorbance value displayed will correspond to the wavelength selected. The user selected wavelength and absorbance value are not used in any calculations. Ratios: The nucleic acid purity factors - A260/A230 ratio and the A260/A280 ratio are calculated by the TLDASoft®package and displayed. Concentration: The nucleic acid concentration in ng/µl is displayed based on its absorbance at 260nm and the selected constant. Graph: An absorbance spectrum is displayed covering the wavelength range 200400nm. If a reading outside this wavelength range is required, the UV-Vis tab should be used. - 39 - Drop Technology Version 1.3 3.0 Software 3.4 Protein Tab 3.4.1 Absorbance Assay (280nm) The measurement of proteins is carried out using this tab. It is based on the absorbance of proteins at a wavelength of 280nm. This absorbance assay is fast and convenient, since no additional reagents or incubations are required. No protein standard need be prepared and it does not require the generation of a standard curve. This µApp displays the UV spectrum (200-400nm), the absorbance at 280nm and calculates the concentration (mg/ml). The absorbance value at 280nm is approximated to a 1 cm pathlength within the software. Baseline Correction: For protein quantification, the TLDAOcean system automatically incorporates a Baseline Correction - this normalises the data at 340nm i.e. the absorbance value at 340nm is deducted from all absorbance values at all wavelengths. This is the data plotted to the screen and displayed in the necessary information boxes. This can be disabled so that the raw absorbance data is recorded. Sample Name: An appropriate sample name ought to be inputted here. Version 1.3 Drop Technology - 40 - 3.0 Software Sample Type: The user must select the type of Protein being measured. The options that appear in the drop down list are: • BSA • IgG • Lysozyme • Other Protein (εmolar & MW) • Other Protein (E 1%) In the cases of ‘Other Protein’ the user needs to input the respective values prior to taking the measurements. For ‘Other Protein (εmolar & MW)’ the user must input a Molar Extinction Coefficient, εmolar and a Molecular Weight, MW for that Protein sample. For ‘Other Protein (E 1%)’ user must input a value for the Mass Extinction coefficient based on a 10mg/mL sample. For BSA, IgG and Lysozyme the mass extinction coefficients are preconfigured See Section 1.6 Theory. Wavelength: If the absorbance at a particular wavelength needs to be known, it can be selected here. The wavelength can be selected by using the up/down arrows to the right of the wavelength box or clicking in the wavelength box and manually entering in the value. The absorbance value displayed will correspond to the wavelength selected. The user selected wavelength and absorbance value are not used in any calculations. A280: Proteins absorb significantly at 280nm, so the absorbance at a 280nm is always measured and displayed here. This absorbance values displayed are equivalent to a sample with a 1 cm pathlength. - 41 - Drop Technology Version 1.3 3.0 Software Ratio: The A260/A280 is a ratio of the absorbance values at these two wavelengths calculated by TLDAsoft® and displayed. Concentration: The protein concentration in mg/ml is calculated based on its absorbance value at 280nm and the relevant selected extinction coefficient. Graph: An absorbance spectrum is displayed covering the wavelength range 200-400nm. If a reading outside this wavelength range is required, the UV-Vis tab should be used. Version 1.3 Drop Technology - 42 - 3.0 Software 3.5 UV-Vis tab This tab enables the TLDAOcean to operate as a conventional spectrophotometer. Any measurements in the ultraviolet-visible range of light (200-800nm) can be measured. Absorbance can be found at up to three different wavelengths. The tab also displays the maximum and minimum absorbance at their respective wavelengths across the 200-800nm spectrum. Baseline Correction: Baseline correction can be enabled at any wavelength within the range for UV-Vis measurements. This normalises the data at the wavelength selected i.e. the absorbance value at the wavelength selected is deducted from all absorbance values at all wavelengths. This is the data plotted to the screen and displayed in the necessary information boxes. If selected, the user must set the wavelength at which they want the Correction to be taken. By default this value is set to 630nm. If No Baseline Correction is required the box may be deselected and the wavelength field will be inactivated. In this case the raw absorbance data is recorded. - 43 - Drop Technology Version 1.3 3.0 Software Wavelength and Absorbance The user can select the wavelength(s) at which they want the absorbance to be displayed. The wavelength can be selected by using the up/down arrows to the right of the wavelength box or clicking in the wavelength box and manually entering in the value. The absorbance value displayed will correspond to the wavelength selected, equivalent to a 1cm pathlength. The user selected wavelength and absorbance value are not used in any calculations. By default these wavelengths are set to 230nm, 420nm and 650nm. Maximum Absorbance: The TLDASoft® interface automatically displays the wavelength and absorbance values at which the sample had the greatest absorbance. After measurement populate. Minimum Absorbance: these fields will As with the maximum absorbance the TLDASoft® interface automatically displays the wavelength and absorbance values at which the sample had the lowest absorbance. After measurement populate. these fields will Graph: The graphical representation of results from the sample in this tab is displayed from 200nm-800nm. Version 1.3 Drop Technology - 44 - 3.0 Software 3.6 Information The top half of this tab contains the details and status of connected devices. The bottom half of this tab contains tools that facilitate the upkeep of the TLDA instrument. Connected Devices: The name of the Device is listed under ‘Device’ section. The ‘Linked’ section shows whether or not the device is connected and responsive. ‘Yes’ means it is connected and ‘No’ means that the device has not yet been detected. ‘Identification’ lists the serial number of individual components parts. This is particularly important in the case of the spectrometer and light source as the manufacturers may need to refer to these at a later date. NOTE: The spectrometer serial number is needed to produce your software registration key which is required for the software to be operational. - 45 - Drop Technology Version 1.3 3.0 Software Refresh: When ‘now’ is clicked within the ‘Refresh’ section, the software is prompted to scan the system for devices and updates the status of all devices found. It may be used to detect the presence of a new device such as: • A USB storage key: - If the device details are not present on the list, after clicking refresh, try clicking refresh again. After retrying if it still does not pick up the USB details you should try an alternative USB key. • If the software does not pick up the identification number of the spectrometer, click refresh again or reboot the system. If it is still not present you should contact the distributor. Help: This provides information for the user in regards to all functions in the information tab. Reset: This button resets the TLDAOcean system to its default settings. Administrator Name and Password: For certain functions to be carried out the user must acquire the relevant ‘Administrator Name’ and ‘Password.’ For access to these please contact your local distributor or Drop Technology. Version 1.3 Drop Technology - 46 - 3.0 Software 3.7 Software Upgrade Drop Technology makes periodic upgrade of its software; TLDASoft®. These upgrades are available for download at www.droptechnology.com. The software upgrade can be downloaded onto your PC or saved onto a USB key which is then connected to the PC. The updated software must be downloaded directly onto the PC or saved onto a USB key which is then connected to the PC. You must firstly uninstall the previous software version (see section 2.2.2) and then install the updated software as per instructions in the manual. NOTE: It is important to follow the manual instructions or else driver files etc. could be deleted mistakenly. - 47 - Drop Technology Version 1.3 4.0 General Operation 4.0 General Operation 4.1 TLDAOceanFunctionality • The top of the TLDAOcean body can be rotated by 120˚to reveal the sample chamber. Clockwise or counter-clockwise rotation will open left handed or right handed sample chambers to aid both left and right handed users. • The size of the drop is defined by the user. The Drop Technology Pipette must be set to the required sample volume (1-4 µL). Drop Technology recommends an optimum drop size of between 2µL and 3µL. • Pathlength is dependant upon drop size. The Pathlength-volume relationship is determined by a mathematical physical model of the TLDAOcean system. • The Drop Technology 10 µL pipette is recommended for use with all TLDA® instruments. 4.2 Sample Evaporation NOTE: Evaporation of the sample may become an issue with the use of certain samples. If the samples have a high vapour pressure or a long timeframe is used, measures must be taken to ensure that they do not evaporate during the reading as this would have a detrimental effect on the result. • The TLDAOcean design incorporates a circular channel (highlighted in red below) in the plinth enclosure that can be filled with liquid to create a saturated atmosphere within the closed testing chamber. This evaporation well can be filled with the sample liquid or deionised water, depending on the requirements. Fig 4.1. Saturation channel highlighted on plinth • The desired liquid once pipetted into the well and left to equilibrate will act to slow down the evaporation rate within the chamber and lead to better results. Version 1.3 Drop Technology - 48 - 4.0 General Operation 4.3 Taking a measurement NOTE: Before taking any measurements, make sure that you have your blanking solution, sample solution, pipette, pipette tips and lint free tissues ready. Delays during the measurement process could affect results if samples have a high vapour pressure. NOTE: Laboratory gloves must be worn at this point. Fig 4.2. STEP 1: In the TLDASoft® open the ‘Settings’ tab. Fill in or change the available fields highlighted opposite: Integration Time Average Boxcar Sample Volume Sample Folder Fig 4.3. STEP 2: Go the relevant measurement tab. Fill the required fields for measurement: DNA/RNA: • Sample Name • Sample type (and factor if it is required) • Arbitrary wavelength at which absorbance can be found if required • Baseline Correction – deselect if you don’t want it enabled Fig 4.4. Protein: • Sample Name • Sample Type (and Factor(s) if required) • Baseline Correction – deselect if you don’t want it enabled • Arbitrary Wavelength at which absorbance can be found if required. - 49 - Drop Technology Version 1.3 4.0 General Operation Fig 4.5. UV-Vis: • Baseline Correction • Sample Name • Wavelengths 1, 2 and 3 Fig 4.6. STEP 3: On the TLDAOcean reveal the preferred sample chamber according to your preference for left or right handed operation. Fig 4.6. Fig 4.7. STEP 4: Pipette the drop of the relevant blanking solution onto the raised centre of the quartz plinth. Fig 4.7. NOTE: Ensure that there are no bubbles in the sample. NOTE: The Drop Technology pipette should be used in accordance with good pipetting technique (see section 6.5). Version 1.3 Drop Technology - 50 - 4.0 General Operation Fig 4.8(a) STEP 5: The drop must be a stable sessile drop for accurate results to be obtained. The drop should stand upright on the plinth, be proud of the quartz surface and be of uniform shape. The drop must be similar to the drop shown in Fig 4.8(a). Fig 4.8(b) If the drop is similar to the drop shown in Fig 4.8(b), It must be removed and a new sample must be pipetted. NOTE: If the drops are consistently like those shown in Fig 4.8(b) it may be due to contamination of the plinth. In this case cleaning or changing of the plinth may be necessary (See section 5.0 Maintenance). Fig 4.9. STEP 6: Rotate the lid back so that it clicks into place with the light source directly over the plinth. Fig 4.9. NOTE: Do not rotate the lid more that 120˚ at one time. Always allow for the lid to click into place before moving it again. - 51 - Drop Technology Version 1.3 4.0 General Operation Fig 4.10 STEP 7: Press ‘Blank’ on the TLDASoft®interface. The blank spectrum will appear on the screen. ‘BLANK’ is now displayed on the screen in between the blank and decline buttons. You must then press the now enabled ‘accept’ button to store the blank spectrum data in memory. This will save the blank measurement to memory, with the Sample name given, with the extension ‘.bk*’ i.e. .bkd for dna work and .bkp for protein work. Fig 4.11 STEP 8: ‘DARK’ is now displayed on the screen in between the blank and decline buttons. You must then press the ‘accept’ button to store the dark spectrum data in memory as .dk* file. The measure button is now enabled. Fig 4.12 STEP 9: Once the blank is completed open the sample chamber. If desired the sample can be retrieved using the Drop Technology Pipette. Alternatively, the sample area can be cleaned using lint free absorbent wipes (Fig. 4.12). These or similar wipes are recommended by Drop Technology for their highly absorbent and their lint free properties. This simple wiping with a lint free tissue should be all that is required to sufficiently minimise sample carryover between successive measurements. Version 1.3 Drop Technology - 52 - 4.0 General Operation Fig 4.13 STEP 10: Pipette the drop of sample solution onto the raised centre of the quartz plinth. Fig 4.13. Refer to Fig 4.8a and Fig 4.8b to ensure that the drop pipetted is suitable. Fig 4.14 STEP 11: Press ‘Measure’ on the TLDASoft® to measure the absorbance of the sample drop. An absorbance spectrum is displayed covering the relevant wavelength range. If you are happy with the absorbance spectrum press ‘Accept’. If not click ’Measure’ again to record a new absorbance spectra. Alternatively, you may click on ‘Decline’ which will bring you back to the intensity spectrum and all aspects of the software will be enabled. The result values will populate in their designated boxes. By pressing ‘Accept’, the data for the absorbance spectrum will be saved to the memory of the PC. Fig 4.15 STEP 12: Once this measurement is completed open the sample chamber. If desired the sample can be retrieved using the Drop Technology Pipette. Alternatively, the sample area can be cleaned using lint free tissues (Fig. 4.15). Lint free tissues are recommended by Drop Technology for their highly absorbent properties and because the presence of lint could affect the absorbance result. NOTE: The sample plinth must be cleaned properly using these wipes between each sample. - 53 - Drop Technology Version 1.3 4.0 General Operation STEP 13: The procedure is then repeated for the subsequent sample drops. The absorbance values will be displayed at the selected wavelengths. Version 1.3 Drop Technology - 54 - 5.0 Maintenance 5.0 Maintenance 5.1 Cleaning the Plinth • Though an absorbent lint free tissue used between samples removes sample carryover, decontamination of the plinth surface should be carried out regularly. • If a sample is (i) high in concentration, (ii) biological, (iii) a protein or (iv) a large amount of samples are tested, the plinth should be cleaned between each set of tests with the Drop Technology Cleaning Fluid. The cleaning interval is best determined according to the conditions of use. • It is good practice to periodically clean the sample plinth to prevent the possibility of contaminant build up. The cleaning interval will depend again upon the nature of the samples being measured and the amount of use the instrument receives. 5.2 Method of Cleaning the Plinth Fig. 5.1. STEP 1: NOTE: Laboratory gloves should be worn at this point. Place one piece of cleaning cloth over the head of the tool. Fig. 5.1. Fig 5.2. STEP 2: Fix the circular ring securely over the cleaning cloth and the tool head. Fig 5.2. Fig 5.3. STEP 3: Place one drop of cleaning fluid onto the plinth. Fig 5.3. - 55 - Drop Technology Version 1.3 5.0 Maintenance Fig 5.4. STEP 4: Rub the surface gently in alternating circular movements. Stop when the surface appears dry and all the fluid has been absorbed. Fig 5.4. STEP 5: If a small number of samples are tested or the samples are of a low concentration, deionised water provides sufficient cleaning. However, after cleaning with the cleaning fluid, deionised water must then be used to rinse the surface. When using deionised water repeat STEPS 1-4 but replace the cleaning fluid with deionised water. 5.3 Replacing the Plinth • If the recommended cleaning procedures are followed the plinth should only need to be changed once a year. • It may be the case that there is an evident scratch on the surface of the plinth or that an extremely corrosive sample has damaged the quartz surface finish. In this instance it is up to the user’s discretion to replace the plinth as required. Version 1.3 Drop Technology - 56 - 5.0 Maintenance 5.4 Method of Replacing the Plinth Fig 5.5. STEP 1: NOTE: Laboratory gloves must be worn at this point. Unscrew the SMA connector that connects via fibre optic cable from the light source to the lid of the instrument. Fig 5.5. Fig 5.6. STEP 2: Unscrew the centre screw fully and remove. Fig 5.6. Fig 5.7. STEP 3: Lift off the lid of the TLDAOcean to reveal the plinth underneath. Fig 5.7. Fig 5.8. STEP 4: Using the tool provided. Fig 5.8. Fig 5.9. - 57 - Place the tip of the tool under the lip of the plinth and gently lift out the old plinth. Fig 5.9. Drop Technology Version 1.3 5.0 Maintenance Fig 5.10. STEP 5: Open the box that contains the new plinth. Fig 5.10. Try to avoid touching the quartz plinth directly. Fig 5.11. Invert the new plinth and place over circular indentation on the top of the TLDAOcean body. Fig 5.11. Fig 5.12 STEP 6: Press the new plinth firmly into place and ensure that it is fitted securely. Fig 5.12. Fig 5.13. STEP 7: Lift off the attachment that came with the new plinth. If the plinth is fitted correctly this attachment should lift off easily revealing the new plinth underneath. Fig 5.13. Fig 5.14. STEP 8: Place the lid of the TLDAOcean back on top of the body. Fig 5.14. Version 1.3 Drop Technology - 58 - 5.0 Maintenance Fig 5.15. STEP 9: Screw the centre screw back fully. Fig 5.15 Screw the fibre back into the SMA connector (Fig 5.16) and tighten another 30° with the spanner provided. Fig 5.16. STEP 10: The TLDAOcean is now ready for use. - 59 - Drop Technology Version 1.3 6.0 Appendix 6.0 Appendix 6.1 Solvent Compatibility The TLDAOcean is compatible with most solvents used in a laboratory: Solvent Material Quartz (Plinth) Acetal (Plinth Housing) Acetic Acid (dilute) Acetone Benzene Butanol Carbon Tetrachloride Chloroform DMF (Dimethyl Formamide) Ethanol Ether HCl (dilute) Hexane Isopropanol Methanol Sodium Hydroxide (dilute) THF (Tetrahydrofuran) Toluene R R R R R R R R R R R R R R R R NR R R R R R NR R R LR R R R R R LR Version 1.3 Drop Technology R = Resistant LR = Limited Resistant NR = Non Resistant - 60 - 6.0 Appendix 6.2 TLDAOcean Specifications INSTRUMENT TYPE: TLDAOcean SAMPLE SIZE: 1μl to 4μl PATHLENGTH: Dependent on sample size. Pathlength determined from mathematical physical model and verified experimentally. LIGHT SOURCE: Pulsed Xenon DETECTOR TYPE: CCD array WAVELENGTH RANGE: 200 - 750 nm SPECTRAL RESOLUTION: 1.5 nm ABSORBANCE ACCURACY: < 2% DETECTION LIMITS: 2.0 ng/µl (dsDNA), 0.05mg/ml (BSA) MAXIMUM CONCENTRATION: 1,000 ng/µl (dsDNA) TYPICAL REPRODUCIBILITY: (96 REPLICATES) 8 mg/ml BSA: SD = 0.4mg/ml, CV = 4.9% 400 ng/µl DNA: SD = 10ng/µl, CV = 3.9% MEASUREMENT/SAMPLE LOADING AND CLEANING TIME: <10 seconds DIMENSIONS: D: 454mm(17.9”) X 250mm(9.9”) X H: 330mm(13”) WEIGHT: 11Kg SAMPLE PEDESTAL MATERIAL: Quartz OPERATING VOLTAGE: UNIVERSAL INPUT 100 TO 220 VAC / 50- 60 HZ, OUTPUT 12VDC/19VDC (3AMP / 3.5AMP) (MAX) FIBRE OPTIC CONNECTION TYPE: SMA 905 - 61 - Drop Technology Version 1.3 6.0 Appendix 6.3 Troubleshooting Air bubble interference If air bubbles are contained within the sample or blank drop during measurement, this will cause the light to scatter and will adversely affect the result. Particular attention should be paid to samples containing high protein concentrations; these samples are prone to the formation of micro bubbles. Detergents are also noted to cause bubble/foam formation. If high concentration protein measurements or samples containing detergent are to be analysed, replicate readings are recommended to offset and identify anomalous results due to these phenomena. Hydrophobic sample surface The quartz sample loading surface on the plinth is designed to be hydrophobic so that the sample drop sits up proud from the quartz surface and forms a sessile drop prior to measurement. Due to carryover, adherence or drying of the sample on the quartz surface, this property of the loading surface can be temporarily lost. This leads the quartz surface to act in a hydrophilic manner which can produce poorly formed drops (see Fig 3.4(b)). These phenomena can be exacerbated after working with high concentration protein samples due to their adherent nature. The hydrophobic properties can be restored easily if the cleaning procedure is performed (Section 4.1). Version 1.3 Drop Technology - 62 - 6.0 Appendix 6.4 Parts that Require Re-order Part Description Part Number Replacement Plinth Package Plinth Removal Tool Fibre optic cable DT0600-100205 DT0900-200105 Reference Standard Kit containing: Drop Technology RM1 Drop Technology RM2 Blank Drop Technology RM1 Drop Technology RM2 Drop Technology Blank Solution Cleaning Kit containing 2x 50ml cleaning solutions Cleaning cloths Cleaning tool Drop Technology Plinth Cleaning Solution DT0600-100206 DT0810-300103 DT0810-300104 DT0810-300102 DT0600-100204 DT0810-300112 Drop Technology Cleaning Tool DT0900-200120 Drop Technology Cleaning Cloths DT0900-200121 DT0700-400105 DT0820-300107 8mm spanner (required for SMA cables) Drop Technology P10 Pipette Drop Technology P10 tips (Box of 96) Plinth Removal Tool Lint free tissue Drop Technology Workstation - 63 - DT0800-300101 Drop Technology DT0820-300108 DT0900-200105 DT0820-300110 DT0900-200115 Version 1.3 6.0 Appendix 6.5 Pipetting Technique Accurate pipetting is of critical importance in all areas of science, this is also the case when using TLDA instruments. What follows are a number of tips that will improve TLDA results and generally should be adopted in experiments. Without accurate pipetting, experiments would be non-reproducible; stock solutions would be inaccurate and assays would have such large errors that comparisons would be meaningless. The accuracy of pipettes depends on their operator. An operator needs to practice good technique and have a thorough understanding of how their pipettes work before results obtained using such pipettes can be described as accurate. • Understanding how a pipette works – More than likely, in the vast majority of applications in a modern laboratory, an air displacement pipette is used. An air displacement pipette is a bit like a syringe, except that there is an air-filled cushion between the piston and the sample. The air cushion prevents the piston from coming into contact with the solutions, which is good, but it also puts some limitations on the pipette. The volume of the air cushion is affected by temperature and pressure, and volatile solvents can evaporate into it. Each of these affects pipetting accuracy. The barrel of an air displacement pipette is also vulnerable to contamination by the pipetted solution. This can be an issue if you are working with corrosive or biohazardous materials. The drawings below show how an air displacement pipette works: (a) (b) (c) (d) (a) The piston moves to the appropriate position when the required volume is set. (b) The button is pressed to the first stop prior to sample aspiration. The piston descends and expels a volume of air equal to that indicated on the volume setting. (c) After immersing the tip into the liquid the button is released. This creates a partial vacuum inside the tip and the pressure forces the volume of liquid into the tip. (d) To dispense the sample, the button is pressed to the first stop again. The air pressure increases inside the shaft and the tip. The compressed air pushes the liquid out of the tip. To empty the tip completely the button is pressed to the second stop (blow out). • Consider another pipette type (depending on your application!). The information in this section relates to air displacement pipettes, but in certain situations a positive displacement pipette may be a better option. Positive displacement pipettes also Version 1.3 Drop Technology - 64 - 6.0 Appendix work like a syringe, but unlike air displacement pipettes, they don’t have an air cushion. This makes them more accurate for pipetting volatile solvents, and more suitable for pipetting corrosives and bio-hazardous material. They are expensive because the barrel is replaced as part of the tip, but they can be a good option in some cases. A cheaper alternative is to use and air displacement pipette with barrier tips, however these only address some of the issues. The below picture shows 2 positive displacement tips/plungers Practice Good Pipetting Technique Know how to pipette properly. - Pipette with a slow, smooth action. - Hold the pipette vertically when drawing liquid in. - Only immerse the tip slightly when drawing liquid in – otherwise the outside of the tip will be coated with liquid, which will be transferred along with the volume inside the pipette. - When dispensing the liquid, hold the pipette vertically but keep the sidewall of the receiving vessel at 45 degrees. - Pipette against the sidewall or into the liquid that’s already there. • End users should check the accuracy of pipetting by dispensing 100µls onto a fine balance. The mass of the droplet you make should be around 0.1 g. Now do the same thing 10 times and record the masses obtained. If the variation is more than +/- 0.5% the pipette may need to be looked at or more practice is required! • Pre-wet the tip. When dispensing liquid from the pipette a coating of the sample is left on the tip, making the expelled volume slightly less than it should be. Pre-wetting the tip before pipetting will help this. Just draw up the liquid into the pipette then dispense it back into the original vessel. The coating is now on the tip so when liquid is drawn up again and dispensed into the receiving vessel, none of it will be lost to wetting. This is only recommended for volumes greater than 10µls. Maintain, inspect and store pipettes properly • Have pipettes serviced every 6-12 months, or more frequently, depending on the accuracy required. The service should include re-calibration, greasing of the moving parts and replacement of any worn out seals or other parts. It’s best to have this done by an experienced pipette engineer. Pipettes should be wiped down with 70% ethanol before they are used every day. Pipettes should be disassembled and cleaned internally and externally with 70% ethanol on a weekly basis. - 65 - Drop Technology Version 1.3 6.0 Appendix • Inspect pipettes daily for damage to the nose of the barrel (where the tip is fitted) or any other obvious damage. If there is an issue, have it serviced because it is unlikely to be fit for purpose. • Store pipettes vertically, using a pipette holder. This prevents any liquids that have sneaked into the barrel of the pipettes from getting any further inside and corroding them. Use the correct technique for the sample type being pipetted (See forward and reverse techniques outlined below). Forward Pipetting Press the operating button to the first stop. Dip the tip into the solution just under the liquid surface to a depth of 2-3mm, and slowly release the operating button. Wait 1-2 seconds and withdraw the tip from the liquid, touching against the edge of the reservoir to remove excess liquid. Dispense the liquid onto the plinth by gently pressing the operating button to the first stop and then after a short delay press the operating button to the second stop. This action (blow-out) will empty the tip. Release the operating button to the ready position. Suitable for: Standard liquids – aqueous and nucleotide solutions (Genomic DNA & PCR products). Reverse Pipetting Press the operating button to the Second stop. Dip the tip into the solution just under the liquid surface (2-3mm), and slowly release the operating button. Wait 1-2 seconds and withdraw the tip from the liquid, touching against the edge of the reservoir to remove excess liquid. Dispense the liquid onto the plinth by gently pressing the operating button to the first stop. This volume is equal to the set volume. Hold the button in this position. The liquid that remains in the tip should not be included in the delivery. The remaining liquid should now be discarded with the tip or delivered back into the reservoir. Release the operating button to the ready position. Suitable for: High viscosity or foaming liquids – protein and highly concentrated nucleic acid solutions. Pipette slowly to avoid bubble formation. Version 1.3 Drop Technology - 66 - 6.0 Appendix Never: • Put pipettes on their side with liquid inside the tip. The liquid might get into the pipette barrel and cause some serious corrosion damage. • Set the dial past the stated upper limit of the pipette (on variable volume pipettes) as this could offset the calibration • Use more pressure than is needed on the plunger as this could damage the piston over time Always: • Take the ambient temperature into account. Pipettes are calibrated at room temperature. When working at a different temperature (e.g. in a cold room), pipettes will not dispense the displayed volumes. • Take the sample temperature into account. In a recent Nature Methods publication, Millet and Barthlen observed a strange phenomenon where, when repeatedly pipetting cold samples, the first dispensed volume is always larger than expected, but subsequent pipetting with the same tip gave the correct volume. The reverse was true for hot samples, the first dispensed volume was smaller than expected. Their solution was simple – dispense the first volume back into the original vessel, then start pipetting. • Use a sensible pipette for the volume to be dispensed. The accuracy of a pipette decreases as the dispensed volume approaches the minimum volume of the pipette. So for dispensing 15µls, for example, a 1mL pipette would be terrible, a 200µl pipette not so good and 20µl pipette ideal. We recommend the Drop Technology P10 pipette for use with TLDA instruments as the instrument has been optimised for use with this pipette. • Use well-fitting tips. Poorly fitting tips allow air to escape when drawing up and dispensing, leading to inaccurate results. 6.6 Warranty All TLDAOcean spectrophotometers and accessories manufactured by Drop Technology are warranted against manufacturing defects in parts and labour for a period of one year. This is a return to base Warranty and a proof of date of purchase should be provided with returned goods. Please contact Drop Technology or the distributor before you return an item. - 67 - Drop Technology Version 1.3 Drop Technology Ltd. Tallaght Business Park Whitestown Dublin 24 Ireland Ph: +353 (0) 1 452 3297 Fax: +353 (0) 1 452 3967 [email protected] www.droptechnology.com


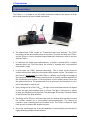


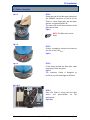


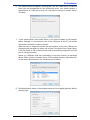
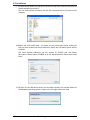
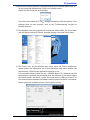

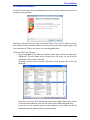
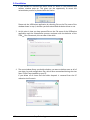
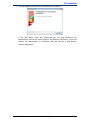
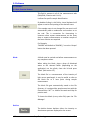


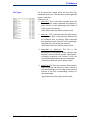


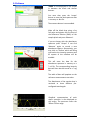

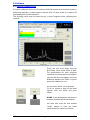
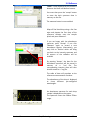


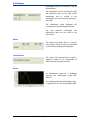

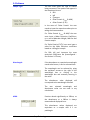


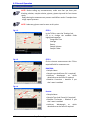
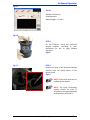

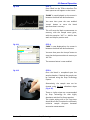
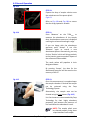

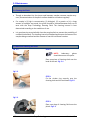

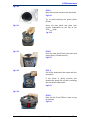


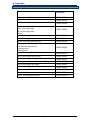
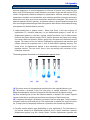


![CAST for PSI user`s manual [v07]](http://vs1.manualzilla.com/store/data/005903758_1-a858c2dfda3ffb28451a6ec48d1cfa02-150x150.png)