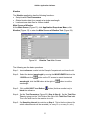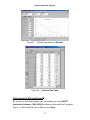
1
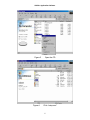
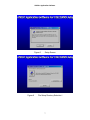
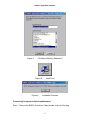
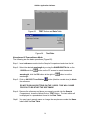
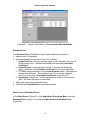
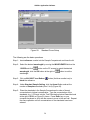
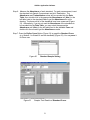
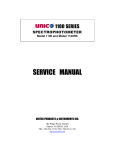
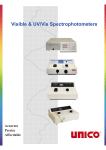
1100 SERIES
SPECTROPHOTOMETER
SOFTWARE USER’S MANUAL
Version SS-1.11
United Products & Instruments, Inc.
182 Ridge Road, Suite E
Dayton, NJ 08810, USA
TEL: 732-274-1155 FAX: 732-274-1151
http://www.unico1.com
UNICO® Application Software
Table of Contents
Introduction………………………………………………………………………………….……
Minimum Computer Requirements………………………………………………
Software Installation………………………………………………………………………
Loading to Computer……………………………………………………………………
Connecting Computer to Spectrophotometer……………………………….
3
3
4
4
8
Main Screen Display………………………………...…………………………………….. 10
Functions of Drop-down Menu, Text Field and Icon Button………….. 10
Basic Operation……………………………………………………………………………….
Absorbance, %Transmittance, Concentration………………………………
Main Screen of A/%Trans/Conc……………………………………….
Absorbance/%Transmittance Mode……………………………………
Concentration/Standard Mode…………………………………...………
Concentration/Factor Mode………………………………………………
Standard Curve……………………………………………………………………………
Main Screen of Standard Curve…………………………………………
Kinetics…………………………………………………………………………………………
Main Screen of Kinetics…………………………………………………….…
13
13
14
16
17
17
19
19
23
23
Data import to Microsoft Excel®………………………………………………….... 25
2
UNICO® Application Software
Introduction
The UNICO® Application Software--VIS1100RS has been designed to operate
with UNICO® Spectrophotometer Model 1100RS. The software runs on a PC
(personal computer) with Windows® 95/98/Me/NT/2000/XP operating system
installed.
The UNICO® Application Software package includes:
• One CD containing the software (VIS1100RS)
• Software User’s Manual
• A 6’ null modem connection cable with 9-pin and 25-pin female connector’s
on both ends.
The UNICO® Application Software performs the following methods for analysis:
Absorbance/%Transmittance/Concentration: measure the Absorbance,
%Transmittance, Concentration/ Standard, or Concentration/Factor at a
single wavelength within the range of 335~1000 nm.
Standard Curve: create a calibration curve (choice of 4 curve fits) with up
to 8 standard solutions at a single wavelength to determine concentrations
of unknown samples.
Kinetics (Absorbance vs. Time Kinetics): measure a sample’s
absorbance change over a selected period of time, store the results in a
data table, and display the results graphically.
Minimum Computer Requirements
To properly install and operate the enclosed software, it is required to have the
following minimum computer configuration:
PC with:
• 16MB RAM
• Pentium or faster processor
• 10 MB of free space on memory
• VGA Color Monitor
• PS/2 mouse and keyboard
NOTE: The UNICO® Application Software provided will NOT function with a Macintosh /
Apple or Linux computer.
3
UNICO® Application Software
Software Installation
Loading Software to Computer
To install the software, please close any open programs and disconnect from the
Internet if online, then follow the instructions below.
Step 1: Insert UNICO® Application Software CD into the CD drive of your PC. If
the software can start the Automatic Setup Screen as Figure-1, go to Step
4. If it can not, go to Step 2.
Step 2: Double click My Computer icon of your PC and locate the CD Drive as
Figure-2 indicates.
Step 3: Right click the CD Drive Label and click Open as shown in Figure-3
Step 4: Click setup.exe as Figure-4 shown or click SETUP shown in Figure-1
Step 5: The Setup Screen (Figure-5) will then display a “Welcome” message
reminding you to close any open programs. If all programs are closed, then
click OK and go to Step 6. If other programs are open and operating, click
Exit Setup, close the open programs and return to Step 2.
Step 6: Choose the Directory and Program Group where you want the software to
be installed as shown in Figure-6 and Figure-7. The File Setup Directory
1 (Figure-6) will then appear. If the File Path selection is OK, then go to
Step 7.
NOTE: if you wish to change the location of the installation, then click Change Directory
and specify the desired directory. If you are unsure and need to examine your computer files,
click on Exit Setup and go to Windows® Explorer to make sure no duplication or improper
storage of the files will occur.
Setp 7: Click the Install Icon (Figure-8) to start installation VIS1100RS, click
Continue to finish the installation.
Step 8: Wait for the message stating the software was installed successfully as
shown in Figure-9. Click OK, re-start your PC.
Congratulations! You have now installed your UNICO® Application Software
VIS1100RS in your PC for your Model 1100RS Spectrophotometer.
4
UNICO® Application Software
Figure-1
Automatic Setup Screen
Figure-2
Locate CD Drive Screen
5
UNICO® Application Software
Figure-3
Figure-4
Open the CD
Click “setup.exe”
6
UNICO® Application Software
Figure-5
Figure-6
Setup Screen
File Setup Directory Selection I
7
UNICO® Application Software
Figure-7
File Setup Directory Selection II
Figure-8
Figure-9
Install Icon
Installation Success
Connecting Computer to Spectrophotometer
Step 1: Remove the RS232 Connection Cable (double end) out of the bag.
8
UNICO® Application Software
Step 2: Locate the RS-232C port on the back of your PC. Connect the female 9-pin
(small) connector (one end of the Connection Cable) to the male 9-pin of
your PC and secure with the built-in screws. If your PC does not have a
male 9-pin connection, use the male 25-pin connector.
ONLY USE The 25-pin connector if your PC does not have a male 9-pin
connector (common for older, upgraded computers).
Step 3: The 1100RS Spectrophotometer has a male 9-pin RS-232C port on the
back panel, located to its left side. Connect the other end of the connection
cable to your 1100RS and secure tightly.
Step 4: Turn on your PC (if not already on) and your 1100RS (if not already on and
let it warm up for fifteen minutes).
Step 5: Click the Start button on your PC, scroll to Programs, UNICO® Application
Software and locate the VIS1100RS (Figure-10), and click it.
Step 6: The Start-up Screen of VIS1100RS will appear as Figure-11 shown.
Step 7: Place the Reference (test tube etc.) in the Sample Compartment, push the
ENT key on the 1100RS panel, select the proper port, and then click OK* on
your Computer Screen. The VIS1100RS will initialize and go to the main
screen (Figure-12).
Figure-10
Open the Software
9
UNICO® Application Software
* WARNING: If you do not have a test tube or something in the Sample
Compartment, the light shutter will be closed, the VIS1100RS will not work. If
you do not push the ENT, the proper connection between the VIS1100RS and
1100RS will not be made, and it will also cause problems when using the
VIS1100RS.
CAUTION: Do NOT use any button on the 1100RS panel while the
VIS1100RS is running and connected with the 1100RS. Otherwise the data
collected may not be correct!
Figure-11
Start-up Screen
Main Screen Display
After your 1100RS is connected to your PC, and VIS1100RS is running, your PC
will show the Main Screen Display like Figure-12. Type your User Name in the
Text Field at the right of the User Name (U): label or leave it blank, then click
the OK button to login as Figure-13 shown.
Functions of Drop-down Menu, Text Field, and Icon Button
Drop-down Menu
Two Drop-down Menus: File (Figure-14) and Application (Figure-15) are
illustrated below.
10
UNICO® Application Software
Figure-12
Figure-13
Main Screen Display
Main Screen Display After User Login
Figure-14
File Drop-down Menu
11
UNICO® Application Software
Figure-15
Application Drop-down Menu
File Drop-down Menu has six functions: New User, New, Load, Save as, Print,
and Exit. All of them have hot keys except the first one.
• New User: change user name
• New: reset Text Parameter and begin new test
• Load: open any saved file (.tst)
• Save as: save the setup or data displayed
• Print: print all information shown in the Data Screen and any data
collected.
• Exit: quit the VIS1100RS
Application Drop-down Menu can select three Analytical Methods of the
1100RS Spectrophotometer: A/%Trans/Conc, Kinetics, and Standard Curve.
• A/%Trans/Conc: measure Absorbance, %Transmittance,
Concentration/Standard, or Concentration/Factor.
• Kinetics: measure a sample’s Absorbance change over a selected
period of time, store the test results in data table, and display the results
graphically.
• Standard Curve: create a calibration curve (choice of 4 curve fits) with up
to 8 standard solutions to determine Concentrations of unknown samples.
Text Field
Three Text Fields are just below File Drop-down Menu and under the label:
Current WL (nm), Abs, and %Trans (Figure-16).
Figure-16
Text Field
Current WL(nm) Text Field: display the last selected wavelength of the
spectrophotometer.
Abs Text Field: display the current data in Absorbance.
%Trans Text Field: display the current data in %Transmittance.
12
UNICO® Application Software
Icon Button
Seven Icon Buttons are below the Text Field (Figure-17).
Figure-17
Icon Button
The four Icon Buttons counting from the left end of the Figure-17 have the same
functions as New, Load, Save as, Print of the File Drop-down Menu.
0A/100%T Icon Button: set 0 Absorbance and 100%T. Insert reference into
Sample Compartment and click
button (blue colored) (move cursor on to the
blue cuvette icon--the fifth icon from left end of Figure-17 and right touch the
mouse, it will show 0A/100%T sign) (Figure-18).
Figure-18
0A/100%T Icon Button
0%T Icon Button: set 0%T. Remove Cuvette from Sample Compartment before
button (black colored) (move cursor on to the black cuvette icon--the
clicking
sixth icon from left end of Figure-17 and right touch the mouse, it will show 0%T
sign) (Figure-19).
Figure-19
0%T Icon Button
Reset Button: unlock the screen. If the screen frozen due to improper
operations, BLANK may show in the Text Fields below Abs and %Trans labels
(Figure-16), click
button to reset them and unlock the screen.
Basic Operation
Three Analytical Methods--Absorbance/%Transmittance/Concentration,
Standard Curve, and Absorbance vs. Time Kinetics are illustrated below.
Absorbance, %Transmittance, Concentration
The Absorbance, %Transmittance, Concentration
(A/%Trans/Conc) method has the following three modes of operation:
¾ Absorbance/%Transmittance
¾ Concentration/Standard
¾ Concentration/Factor
13
UNICO® Application Software
Main Screen of A/%Trans/Conc
At the Main Screen (Figure-13), click Application Drop-down Menu, and click
A/%Trans/Conc (Figure-15) to enter the Main Screen of A/%Trans/Conc
(Figure-20).
Figure-20
Main Screen of A/%Trans/Conc
The A/%Trans/Conc Analytical Method has five operation functions: Test
Wavelength Text Field, Test Parameter Test Field, TEST Button, Data Table,
and Test Date:
•
Test Wavelength Text Field: select the desired wavelength by moving the
dial on the spectrophotometer and clicking
button on the PC screen,
button to set the
click OK button (Figure-21) at the right of
wavelength (Figure-22). The wavelength will be shown both in the Text
Field below Current WL (nm) label and Text Field at the right of the Test
Wavelength label.
•
Test Parameter Text Field: If standard is available, type the
concentration values of the standard into the Text Field at the right of
Conc/Std label, insert the standard into Sample Compartment and click
the OK button. Spectrophotometer will take measurement of the
standard and display factor value. The unknown sample concentrations
can then be measured. If factor value is available, enter the factor value
into the Text Field at the right of Factor label for the unknown sample
concentrations calculation (Figure-21).
14
UNICO® Application Software
•
TEST Button: record the readout of a given sample (Figure-23).
•
Data Table: record ID, Name, Abs, %Trans, Conc, and Factor related
with the test (Figure-23)
•
Test Date: Test Date will be displayed automatically. To alter it, simply
click it at the left corner of the screen and enter the desired date (Figure24).
Figure-21
Figure-22
Test Wavelength and Test Parameter
Wavelength and Reference Setting
15
UNICO® Application Software
Figure-23
TEST Button and Data Table
Figure-24
Test Date
Absorbance/%Transmittance Mode
The following are the basic operations (Figure-25).
Step 1: Insert reference cuvette into the Sample Compartment and close the lid.
Step 2: Select the desired wavelength by moving the WAVELENGTH dial on the
1100RS and click
button on the PC screen to match the desired
wavelength, click the OK button at the right of
wavelength.
Step 3: Click on 0A/100%T Icon Button-the reference.
button to set the
button (the blue cuvette icon) to blank
DO NOT PUSH ANY BUTTONS ON THE 1100RS. THIS WILL CAUSE
FOR YOU TO RE-START THE SOFTWARE.
Step 4: Remove the reference and place your sample cuvette into the Sample
Compartment, close the lid and click on TEST Button. The test results will
be displayed in a spreadsheet format in the Data Table.
Step5: You may type in sample name or change the sample name under the Name
label inside the Data Table.
16
UNICO® Application Software
Figure-25
Sample Test Results of Absorbance/%Transmittance Mode
Concentration/Standard Mode
The purpose of this test is to determine the Concentration of the unknown
samples by comparing the samples’ Absorbance/Transmittance to that of the
standard solution.
Repeat Step 1 to 3 in Absorbance/%Transmittance Mode section.
Step 4A: Type in the known concentration of the standard solution in the Text Field
at the right of Conc/Std label.
Step 5A: Place the standard in the Sample Compartment and close the lid.
Step 6A: Click the OK Button in Test Parameter section. This will measure the
Absorbance of the standard and set its conversion Factor for measuring
the unknown samples (Figure-26).
Step 7A: Place your sample(s) in the Sample Compartment and click the TEST
Button for each sample to be measured. Absorbance, Transmittance
and the Concentration of the samples will be displayed in the Data Table
(Figure-27).
Concentration/Factor Mode
The purpose of this test is to measure the Concentration of samples with known
multiplication factor to calculate the Concentration.
Repeat Step 1 to 3 in Absorbance/%Transmittance Mode section.
Step 4B: Type in the desired Factor in the Text Field at the right of the Factor label.
Step 5B: For each sample, be sure to place the sample in Sample Compartment
and close the lid. Click the TEST Button to record
Results. The Absorbance, Transmittance and Concentration will be
displayed in the Data Table (Figure-28).
17
UNICO® Application Software
Figure-26
Figure-27
Standard Solution Absorbance Measurement
Sample Test Results of Concentration/Standard Mode
18
UNICO® Application Software
Figure-28
Sample Test Results of Concentration/Standard Mode
Standard Curve
The Standard Curve (Calibration Curve) method allows the operator to
• Measure up to 8 standards
• Calculate standard curves with 4 curve fits, including:
1. Linear Thru Zero: set the y-intercept equal to zero; therefore, the curve is
forced through zero. Calculate and display the slope and Correlation
Coefficient.
2. Linear Squares: Linear regression model. Calculate and display the
slope, y-intercept, and Correlation Coefficient for the given standards.
3. 2nd Order: second derivative of the Linear Squares model. Calculate and
display the coefficients. This method is used for non-linear standard
curves or curves with a Correlation Coefficient of less than 0.9.
4. Segmented: straight line. Use the standards as nodes to connect each
point. No data is displayed or calculated.
• Select and view existing standard curves
• Calculate the Concentrations of unknown samples
Main Screen of Standard Curve
At the Main Screen (Figure-13), click Application Drop-down Menu, and click
Standard Curve (Figure-15) to enter the Main Screen of Standard Curve
(Figure-29).
19
UNICO® Application Software
Figure-29
Standard Curve Setup
The following are the basic operations.
Step 1: Insert reference cuvette into the Sample Compartment and close the lid.
Step 2: Select the desired wavelength by moving the WAVELENGTH dial on the
1100RS and click
button on the PC screen to match the desired
wavelength, click the OK button at the right of
wavelength.
Step 3: Click on 0A/100%T Icon Button-blank the reference.
button to set the
button (the blue cuvette icon) to
Step 4: Under Standard Sample Setting, click the Arrow Button and set the
number of Samples standards (from 2 to 8) (Figure-30).
Step 5: Place the standards in the Sample Compartment in order of lowest
concentration to highest concentration. Type the concentration of the
standards (e.g. 0.14 here) into the Text Field starting below Conc label and
at the right of ID 01 as Figure-31 shown. Press Enter key on your
computer keyboard or click with the mouse to move to the next cell. Repeat
the same operation until all concentrations of the standards have been
entered.
20
UNICO® Application Software
Step 6: Measure the Absorbance of each standard. For each measurement, insert
the standard into Sample Compartment and click Test button. The
Absorbance and Transmittance values will be recorded into the Data
Table; then, double click in the appropriate Absorbance cell (Abs) (in the
left table) next to the standard Conc to get the Absorbance for curve
drawing. Continue until all of the standards have been measured (Figure31). Alternatively, if you do not want the Absorbance of the standards to
be recorded into the Data Table, you may select the appropriate
Absorbance cell (Abs) (in the left table) next to the standard Conc and
double click the mouse to get the Absorbance results.
Step 7: Press the Define Curve Button (Figure-31) to graph the Standard Curve
(e.g. WaterS-1 to WaterS-6 are the standards) (Figure-32). You may save it
for future use.
Figure-30
Figure-31
Standard Sample Setting
Sample Test Results of Standard Curve
21
UNICO® Application Software
Figure-32
Standard Curve Graph Display
Your standards have now completed setup. To use the graph and measure the
samples with unknown concentrations, please be guided by the steps below:
Step 1: Select the desired Standard Curve by clicking on one of the four buttons
(Figure-33). Shown in Figure-32 is Linear Squares (Least Squares
Method). Items in the equation next to the Linear Squares title on the
graph are Abs, the slope, and y-intercept as well as Correlation
Coefficient
Abs = slope *C + y-intercept
Corr. Coef = Correlation Coefficient
Step 2: (optional) Click Print button: print the graph and labels of the slope, yintercept and Correlation Coefficient as seen on the screen.
Step 3: When ready to measure samples of unknown concentration, press
(arrow return button) to return to the main Standard Curve screen
(Figure-31).
Step 4: To measure the concentration of unknowns, place the samples in the
Sample Compartment and click on Test button (Figure-31), located at the
bottom-left portion of the screen.
Step 5: To save the data with the Standard Curve fit selected, click on the
(Save Icon), name the file, and click Save.
Figure-33
Buttons for Standard Curve Test
22
UNICO® Application Software
Kinetics
The Kinetics application has the following functions:
• Setup kinetics Test Parameters
• Obtain kinetics data for a sample at a single wavelength
• Load and save data files for further studies
Main Screen of Kinetics
At the Main Screen (Figure-13), click Application Drop-down Menu; click
Kinetics (Figure-15) to enter the Main Screen of Kinetics Test (Figure 34).
Figure-34
Kinetics Test Main Screen
The following are the basic operations.
Step 1: Insert reference cuvette into the Sample Compartment and close the lid.
Step 2: Select the desired wavelength by moving the WAVELENGTH dial on the
1100RS and click
button on the PC screen to match the desired
wavelength, click the OK button at the right of
wavelength.
Step 3: Click on 0A/100%T Icon Button-blank the reference.
button to set the
button (the blue cuvette icon) to
Step 4: Set the Test Parameters (Figure-35) (Step 4~Step 8). Set the Total Run
Time by typing into the Text Field on the right of the Total Run Time label.
This is the total time for the reaction to occur.
Step 5: Set Sampling Interval time similar as Step 4. This is the time interval for
which measurements will be recorded (i.e. every 10 s, or every 3 s, etc.).
23
UNICO® Application Software
Step 6: Set an Initial Time Delay similar as Step 4. The purpose of this step is to
delay the beginning of data collection. (i.e. Sample must be injected, and
reaction will not begin for 20 s).
Step 7: Set a Conc Factor (multiplication factor--dilution factor) similar as Step 4.
This allows for a factor to be used when calculating the Concentration of
the solution.
Step 8: Set the High and Low Limits of the graph similar as Step 4. This is the
selection of the minimum and maximum Absorbance range for the graph of
the data.
Step 9: Place your sample in the Sample Compartment and click the Start Button
once all the Test Parameters have been set and you are ready to start your
measurement (Figure-36).
Figure-35 Test Parameters Setting
Notes: Data Table: once measurements have been made, clicking this button
will allow you to view the data collected (Figure-38). Only Cell 2 of the Data
Table is currently used to store the data collected, other are for future
applications.
Stop Button: stops the data collection at any given moment.
24
UNICO® Application Software
Figure-37
Sample Test Results of Kinetics
Figure-38
Kinetics Data Table
Data import to Microsoft Excel®
By referring to the following steps, you can transfer any of the UNICO®
Application Software—VIS1100RS test data to a Microsoft Excel® program:
Step 1: In Microsoft Excel, click on File and click Open.
25
UNICO® Application Software
Step 2: Select any saved file you wish to import.
Step 3: After the Excel Text Import Wizard appears, select Delimited, select the
row from which you want the import to start, and click on the Next button as
shown in Figure-39.
Step 4: Uncheck the Tab delimiter and select Comma delimiter as shown in Figure40, then click the Next button.
Step 5: Click the Finish button and the test data will be imported into your Excel
spreadsheet. Here, further calculations can be performed from the “raw”
data collected.
Step 6: Save the imported file under a DIFFERENT FILE Name if you still want to
keep and open the original UNICO® data file in VIS1100RS. Otherwise, the
original UNICO® data file (.tst file) will be modified by the Excel® format
during importing and the modified file cannot be opened from VIS1100RS.
Figure-39 Excel Text Import Wizard I
26
UNICO® Application Software
Figure-40 Excel Text Import Wizard II
27