1
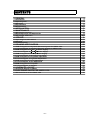
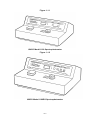
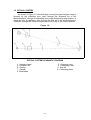
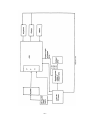
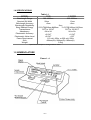
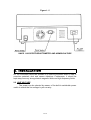
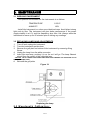
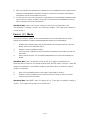
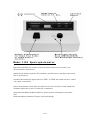
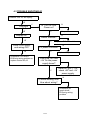
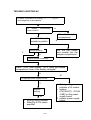
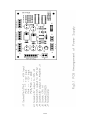
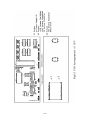
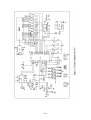
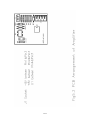
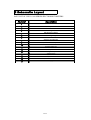
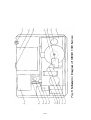
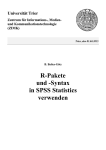
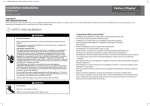
UNICO 1100 SERIES SPECTROPHOTOMETER Model 1100 Spectrophotometer Model 1100RS Spectrophotometer SERVICE MANUAL UNITED PRODUCTS & INSTRUMENTS INC. • MANUFACTURER OF QUALITY OPTICAL SYSTEMS CONTENTS 1. GENERAL 3 1.1 Introduction 1.2 Optical System 1.3 Electronic 1.4 Specifications 1.5 Nomenclature 3 4 5 6 6-7 2. INSTALLATION 3. MAINTENANCE 7 8 3.1 Working Environment 3.2 Replacing Lamps And Adjustments 3.3 Wavelength Calibration 8 8 8-9 4. SERVICE 9 4.1 Operating Procedure Check 4.2 Physical 4.3 Troubleshooting 9-10 10 11-19 5. DRAWING AND DIAGRAM 20 5.1 PCB Arrangement of Synthetic Electronic System for UNICO 1100 5.1.1 Circuit Diagram of Synthetic Electronic System for UNICO 1100 5.2 PCB Arrangement of ±15v, +9v Power Supply 5.2.1 Circuit Diagram of ±15v, +9v Power Supply 5.3 PCB Arrangement of W Lamp Power Supply 5.3.1 Circuit Diagram of W Lamp Power Supply 5.4 PCB Arrangement of Logarithm Adjustment 5.4.1 Circuit Diagram of Logarithm Adjustment 5.5 PCB Arrangement of 0%T Adjustment 5.5.1 Circuit Diagram of 0%T Adjustment 5.6 PCB Arrangement of Amplifier 5.6.1 Circuit Diagram of Amplifier 6.1 Schematic Diagram of UNICO 21 22 23 24 25 26 27 28 29 30 31 32 33 34 7. ELECTRONIC PARTS FOR UNICO 1100 35 7.1 Electronic Parts list for UNICO 1100 35 6. SCHEMATIC LOYOUT 36-2 1. GENERAL 1.1 INTRODUCTION The UNICO model 1100 Series spectrophotometers are single beam general purpose instruments designed for use in conventional laboratories. The instruments are ideal for various applications such as: Clinical Chemistries, Biochemistry, Food and Beverage Laboratories, Environmental Protection, Water and Waste Water Labs and other fields of quality control. The UNICO 1100 Series spectrophotometers cover the visible wavelength range from 335nm to 1000nm. The analytical grating system has 1200 lines/mm for higher dispersion of the spectrum. 36-3 Figure 1-1.1 UNICO Model 1100 Spectrophotometer Figure 1-1.2 UNICO Model 1100RS Spectrophotometer 36-4 1.2 OPTICAL SYSTEM As shown in Figure 1-2 the white light coming from the Halogen Lamp is focused by the collecting lens, pass through the Entrance slit of the Monochromator, through a collimating lens to the Analytical grating where it is dispersed into its spectrum, then through the Exit slit of the monochromator, continues through the Sample compartment and finally to the Photo detector. Figure 1-2 OPTICAL SYSTEM SCHEMATIC DIAGRAM 1. Halogen Lamp 3. Entrance Slit 5. Grating 7. Sample 9. Photodiode 2. Collecting Lens 4. Collimating Lens 6. Exit Slit 8. Collimating Lens 36-5 1.3 ELECTRONIC SYSTEM The photo detector receives the monochromatic light and generates photocurrent. A direct current signal which is proportional to the amount of light energy to the photo detector. The signal is then amplified and processed. The processed signal is sent to the digital display and also to the external outputs 0 Volt to 1 Volt analog output and an RS-232C output. Figure 1-3-1 and Figure 1-3-2 demonstrates the electronic systems of Model 1100 and Model 1100RS respectively 36-6 36-7 36-8 1.4 SPECIFICATIONS Table 1-1 MODEL 1100 1100RS Wavelength Range Spectral Slit Width Wavelength Accuracy Wavelength Readability Stray Radiant Energy Transmittance Absorbancy Photometric Accuracy Photometric Noise Level Power Requirement Size Weight 335-1000nm 20nm ±2nm 335-1000nm 10nm ±2nm 2nm ≤0.5%T@340nm &400nm ≤0.5%T@340nm & 400nm 0%T to 125%T 0%T to 125.0%T 0A to 2A 0A to 2A ±2.0%T ±1.0%T ±2.0%T ±1%T 115-volt, 60Hz, or 230-volt, 50Hz 408mm(W)×308mm(D)×180mm(H) 5.5kg Specifications subject to change without notice 1.5 NOMENCLATURE Figure 1- 4 36-9 Figure 1- 5 UNICO 1100 SPECTROPHOTOMETER AND NOMENCLATURE 2. INSTALLATION 2.1 The instrument should be installed in a clean environment which is free of corrosive materials, dust and severe vibrations. Furthermore, it should be kept away from any strong electric magnetic fields and high frequency fields. 2.2 LINE VOLTAGE The power can be selected by means of the built-in switchable power switch to match the line voltage in your country. 36-10 3. MAINTENANCE 3.1 WORKING ENVIRONMENT The optimum environment for the instruments is as follows 5-35° C 85% TEMPERATURE HUMIDITY Install the instrument in a clean non-vibrational area. Avoid direct strong light and air flow. The instrument will give better performance if the power supply stability is at 1% and line frequency less than 1Hz. Always allow the instrument to warm up for 20 minutes prior to taking any readings. 3.2 REPLACING LAMPS AND ADJUSTMENTS 1. 2. 3. 4. 5. Turn off and unplug the instrument. Turn the instrument upside down. Remove the grill plate on bottom of the instrument by removing fixing Screw. Unplug the lamp from the white connector. Insert the new lamp, pushing it in as far as it will go. The lamp filament should face the center of the collecting lens. CAUTION: DO NOT HANDLE HALOGEN LAMP WITH BARK FINGERS. USE TISSUE OR CLOTH WHEN HANDLING LAMP. 8. Reinstall the grill plate. Figure 3-1 Replacing the lamp 3. 3 W a v e l e n g t h Cal i b r a t i o n : 36-11 Normallythe UNICO 1100 Series spectrophotometerretains its wavelength calibration indefinitely. However if the instrument receives a severe shock or is abused, use the following methods to check wavelength calibration. Please note thatthis test requires the UNICO Didymium filter,p/n 1100-110, or the Holmium Oxide filter,p/n 1100-109. In the filtermethod, the didymium filterhas two distinctabsorbance peaks at 529nm and 807nm. The Holmium filterhas a distinctpeak at 361nm. When the instrument is calibrated properlyyou willfind minimum Transmittance (maximum Absorbance) at the range +2nm from these peaks. Note thatthe specific Transmittance values are not importantas you are only looking forthe wavelength where the minimum transmittance (maximum Absorbance) occurs. Holmium Oxide Filter Method: 1. Turn instrument on and allowit to warm up for15 minutes. 2. Selectthe Absorbance operating mode. 1. Set the wavelength to 350nm. 2. Make sure the cuvette holderis empty and place it in the sample compartment. Close the sample compartment lid. 3. Set zero Absorbance by pressing the 0A/100%T. Wait a few seconds while the display flashes ‘BLA’. The reading should then be 0.000A. If not, repeat step 5. 4. Remove the cuvette holderand insertthe Holmium filterinto it. Place it in the sample compartment and close the lid. 5. Record the Absorbance reading on the digitaldisplay. 6. Advance the wavelength setting by 1nm and repeat steps 4 to 7. 7. Repeat step 8 untilthe wavelength setting reaches 370nm. 8. Look forthe maximum absorbance reading obtained, and this should be found between 359 and 363nm. The wavelength accuracy of the 1100/1100RS is + 2nm. Didymium Filter Method: 1. Set the Wavelength to 800 nm. 2. Make sure the cuvette holderis empty and place it in the sample compartment. Close the sample compartment lid. 3. Set zero Abs by pressing the 0A/100%T. Wait a few seconds while the display flashes ‘BLA’. The reading should then be 0.000A. If not, repeat step 3. 36-12 4. Remove the cuvette holderand insertthe Didymium filterinto it. Place it in the sample compartment and close the lid. 5. Record the Absorbance reading on the digitaldisplay. 6. Advance the wavelength setting by 1nm and repeat steps 2 to 5. 7. Repeat step 6 untilthe wavelength setting reaches 815nm. 8. Look forthe maximum absorbance reading obtained, and this should be found between 805 and 809nm. The wavelength accuracy of the 1100/1100RS is + 2nm. 9. If a “middle” wavelength check is desired, set the wavelength to 522nm (optional) 10. Make sure the cuvette holderis empty and place it in the sample compartment. Close the sample lid. 11. Set zero Abs by pressing the 0A/100%T button. Wait a few seconds while the display flashes ‘BLA’. The reading should then be 0.000A. If not repeat step 11. 12. Remove the cuvette holderand insertthe Didymium filterinto it. Place it in the sample compartment and close the lid. 13. Record the absorbance reading on the digitaldisplay. 14. Advance the wavelength setting by 1nm and repeat steps 10 to 13. Repeat step 14 untilthe wavelength setting reaches 536nm. Again, look for the maximum absorbance reading. It should be between 527 and 531nm. Absorbance Accuracy Checks Specification: +2% at 1A (1100), +1% at 1A and 2A (1100RS). The absorbance accuracy should be checked against a set of neutraldensity filters accuratelycalibrated to the NIST standards. Contactyour UNICO representative formore information (800-588-9776). An alternative method using potassium dichromate is described below. Due to the many factorsthatmight affectthe results(i.e. temperature, bandpass, weighing and diluting errors), this method is less accurate and should only be used as a guide. Reference: Johnson E A Potassium Dichromate as an absorbance standard PSG Bulletin1967, No. 17, page 505 36-13 1. Make up N/100 sulfuricacid as the solventand use partof it to make a solution containing 120 +0.5mg/litreof potassium dichromate. 2. Wash out a square cuvette with solvent, and fillwith solvent. 3. Put the cuvette in the adapter into the sample compartment and close the lid. 4. Set the wavelength to 350nm. 5. Set the MODE button to A. 6. Set the reading to 0.000A using the 0A/100%T button. 7. Empty the cell. Wash out with dichromate solution, and fillwith dichromate solution. 8. Put the cuvette in the adapter into the sample compartment and close the lid. 9. Read the absorbance of the standard from the display. The value should be 1.288 + 0.04A. Refer to the notes above when interpreting the result. 36-14 Stray Light Check Specification: Less than 0.5%T at 340nm by ASTM E 387 A good indication as to whether the stray lightlevelis within specification may be obtained as follows: 1. Set the wavelength to 340nm. 2. Set the MODE switch to %T. 3. With the square celladapter in the sample compartment, but no cell,close the lid and press the 0A/100%T button to set the display to 100.0%. 4. Remove the celladapter from the sample compartment and close the lid. Make a note of the reading thatshould be at or near 00.0. 5. Prepare a solution containing 50gm/L of sodium nitrite(NaNO 2) in distilledwaterand filla square cuvette with this solution. 6. Insertthe cuvette into the adapter and place in the sample compartment. Close the lid. The display should read<0.5%T. Note thatif the reading obtained in step 4 is greaterthan 00.0, this value should be subtracted from the displayed reading to give the correctreading forthe stray lightvalue. 36-15 SERIVCE 4.1 PHYSICAL INSPECTION Thoroughly inspect the instrument for physical indications that might cause a malfunction. The following categories are usually checked: Apparent damage, Dirty Optics, Broken wire, loose connection, P.C. Board loose, Broken lands on pc board, any sign of overheated components. 4.2 OPERATING PROCEDURE CHECK Each time an instrument has a malfunction, the operating procedure should be checked. If necessary such procedures should be repeated to see the patterns that the malfunction occurs. The basic operating procedure is as follows: Bas i c Ope r a t i o n : Simple operating instructions are printed on the frontpanel of your UNICO 1100/1100RS. A. Pr e p a r e t h e spec t r o p h o t o m e t e r 1. Turn on the spectrophotometerby pressing the Power Switch (IO). Allow15 minutes forthe instrument to warm up. 2. Selecteither the %Transmittance or Absorbance operating mode by pressing the %T/A selectorbutton (MODE) untilthe red lightforT or A is on. 3. Selectthe desired wavelength by turning the wavelength controlknob (WAVELENGTH). B. P r e p a r e Sa m p l e 4. Make a blank reference solution by fillinga clean cuvette (or test tube) halffullwith distilledor de-ionized wateror otherspecified solvent. Wipe the cuvette with tissue to remove the fingerprints and droplets of liquid. 5. Fit the blank cuvette into the square cuvette adapter and place the adapter in the sample compartment, aligning the guide mark (if present) with the guide mark at the frontof the compartment. Close the lid. 6. Set 0.000A or 100%T with the (0A/100%T) controlbutton. NOTE: This step fulfills the instruction on the frontof the spectrophotometer…(Set FullScale). 7. Remove the blank cuvette or test tube. Set it aside in the case thatyou may need to adjust the (0A/100%T) controlbutton later(i.e. change the wavelength). 36-16 C. A n a l y z e Sa m p l e 8. Rinse a second cuvette with a smallamount of the sample solution to be tested. Fill the cuvette halffulland wipe it. 9. Put the sample cuvette in the sample compartment. Close the lid. 10. Read the %Transmittance or Absorbance from the digitalreadout window. Remove the sample cuvette or test tube. 11. If you are to test the same sample at otherwavelengths, repeat steps 3 to 10 for each wavelength. 12. For each new sample you analyze, repeat steps 2 to 11. A d d i t i o n a l Fea t u r e s of Mo d e l 1 1 0 0 R S Although operating basicallythe same as the Model 1100, the 1100RS spectrophotometer offerstwo more features (Concentration Mode and FactorMode) as follows: Concentration (C) Mode for determining the concentration of unknown samples. NOTE: This method should only be used when the relationship between Absorbance and Concentration is known to be linear. The concentration of the Standard solution used to calibrate the instrument should be higher than the most concentrated sample. 1. 2. 3. 4. 5. 6. Selectthe desired wavelength by turning the wavelength controlknob. Using the MODE button, selectAbsorbance (A) mode. Insertthe cuvette containing the blank solution. Set 0.000A with the (0A/100%T) controlbutton. Using the MODE button, selectC (concentration) mode. Inserta cuvette containing a standard solution of known concentration in the sample compartment and adjust the digitalreadout window to the value of the standard by using the ∧ and ∨ arrows. 7. Press the Enter button. NOTE: If the reading changes, the factor required is too high (i.e. >1999) to be displayed. In this case, divide the concentration by 10, re- select the C mode by successive presses on the Mode button, cycling through the F, %T, and A modes, and follow step 2 above to set the concentration of the standard to the reduced value. 36-17 8. With the standard concentration set, determine the concentration values of samples with unknown concentration by inserting the sample cuvette into the sample compartment and reading the value directfrom the display. 9. To read the value of the multiplierused to convertAbs to Concentration, aftermeasuring allthe samples, change the Mode to Factor(F) and read the multiplierfrom the display. Keep a record of this value forfutureuse. Operational Note: if the mode switch is changed to read Factor or Absorbance, the Concentration (C) reading is “frozen”, and cannot be changed. This requires the operator to re- start at step 1. Fac t o r (F ) Mo d e This is a special mode formeasuring concentration values of unknown samples using a previously determined factorto convertAbsorbance readings to concentration. 1. 2. 3. 4. Aftersetting the wavelength, and setting zero Abs on the blank solution, using the MODE button, selectfactor(F) mode. Inserta cuvette containing a sample. Using the ∧and ∨ arrows, set the digitalread-out window to the desired value of the multiplier. Press the ENT button. The spectrophotometerswitches to the Concentration (C) MODE. Operational Note: If the Concentration of the sample is too high to be displayed, the instrument will not switch to Concentration Mode when the ENT button is pressed. Dilute the sample and multiply the concentration reading by the dilution factor to obtain the original sample concentration. 5. 6. Read the concentration value of the sample directfrom the display. Inserta cuvette containing the next sample and read the result. Repeat untilall samples have been measured. Operational Note: If the MODE switch is changed to A or T, then the concentration reading is “frozen”. This requires the operator to re- start at step 1. 36-18 Mo d e l 11 0 0 Spec t r o p h o t o m e t e r : Mode Indicator:Allows the operator to know the measurement mode currently in use (%Transmittance, Absorbance) . MODE Button: Switches between %Transmittance and Absorbance operating modes at any time of measurement. 0A/100%T Button: Adjusts digital readout to 100%T or 0.000A when blank reference solution is in sample compartment. Sample Compartment: Insert 10mm test tube and close lid or fit 10mm cuvette adapter and fit adapter (with holder to left of cuvette) into compartment. Wavelength ControlKnob (WAVELENGTH): Selects desired wavelength in nanometers (nm). Wavelength Readout Window: Displays desired wavelength. 36-19 Mo d e l 11 0 0 R S Spec t r o p h o t o m e t e r : Mode Indicator:Allows the operator to know the measurement mode currently in use (%Transmittance, Absorbance). MODE Button: Switches between %Transmittance and Absorbance operating modes at any time of measurement. 0A/100%T Button: Adjusts digital readout to 100%T or 0.000A when blank reference solution is in sample compartment. 0%T Button: When in transmittance (T) mode and sample compartment is empty, a flap blocks the beam. Pressing button adjusts readout to 00.0%T. PRINT Button (ENT): First press after selecting Concentration mode enters reading on digital readout. Other presses cause output of reading to printer. If using UNICO Application Software, press this button to communicate with software. If operating in Factor (F) Mode, then press to enter factor. This causes the Mode to enter the factor number and change to Concentration mode. Sample Compartment: Insert 10mm test tube and close lid or fit 10mm cuvette adapter and fit adapter (with holder to left of cuvette) into compartment. 36-20 Wavelength ControlKnob (WAVELENGTH): Selects desired wavelength in nanometers (nm). Wavelength Readout Window: Displays desired wavelength. . 36-21 4.3 TROUBLE SHOOTING #1 Problem:Turn on, No display N Pilot light on? N Y Display on? N Is 115V or 230v Power on? Y Line power on N Switch function? N Y Replace R13-69A switch Check if LCD display and wiring OK? PC power Function? N A:Replace CPU board B:Sloving wiring problem or replace socket A2,A3 N Y Replace PC power Check the +8V and –8V On the power supply board? Y Refer to Fig.5.1.1 to check +8V and –8V power supply supply Is diode working fine? How about wiring? N A:Replace φ3 green diode B:Sloving wiring problem 36-22 TROUBLE SHOOTING #2 Problem:Instrument is on, Display 0.000(%T)or 1---(A) N Halogen lamp on? N Check lamp OK? Y Y N Anything in sample comparment blocking the light? Replace lamp Check output of lamp Power supply, is it Between +1.6V to 6.2V Y Remove it Is cell holder and Cuvette in position? Y Refer Fig.5.3 to check W lamp power supply N Install cell holder cuvette N Shutter operation? Repair shutter Y N Halogen lamp peaked? Y Amplifier detector Working fine? Y Y Adjust the lamp position(keep shutter open,put a white paper into optical path in sample comparment) at 525nm,you should see bright green light on paper A:check S1227K photocell B:refer Fig.5.3.1 to check amplifier C:solving wiring problem 36-23 TROUBLE SHOOTING #3 Problem:Turn on,put in cell holder and cuvette ,display “<<10.0”, press “100%T”,display not change Is the position of halogen lamp right? N Y Adjust the position of halogen lamp,put a piece of white retangle paper into sample comparment(open the shutter),can see a whole,clear,bright facula Is the light road out of the position N Y Right filter in position? N Adjust light road with right way, put apiece of white retangle paper(open the shutter),can see a whole,clear,bright facula Adjust the filter with right way 36-24 TROUBLE SHOOTING #4 Problem: Instrument on Display “1— — —”(T%) or show negative at absorbance Is sample compartment cover closed? N Y Is cell holder and cuvette in positior Close the sample compartment N Y Y Put the cell holder and cuvette into the sample compatrment Shutter working N Repair shutter assembly Press “100%”,after display “100.0” open the sample compartment cover if the display changde? N N Is regulate power supply normal Y Anplifier working N 1. Solving wiring problem. 2. Refer Fig.5.6 to check amplifier. 36-25 1. Solving wiring problem of J5 socket. 2. replace IC4(74LS07)、IC5(40 51BE) on the power supply board. 3. replace power supply board. TROUBLE SHOOTING #5 Problem: Instrument on → “100.0” display not stable (T) N Enough warm up time? Warm up at least 20 min Y Groounding OK? Y Power supply OK N Improuve grounding N Y After changed wavelength stable time full Get rid of possible interference facters N After 5 min press “100%” again Y ±12V power supply work stable Y Regulate power supply working Y Electric eye working Amplifier working Y N Replace PC power supply N Refer to Fig5.3.1 to check regulate power supply of N halogen lamp Replace the same electric eye (S1227K) N Check amplifier 36-26 type TROUBLE SHOOTING #6 Problem:measuring recelts incorrect(not stable,repeatability,etc) Is sample preparation adjust right? Y Is sample preparation Installed correctly? Y N a b c d e f use right procedures to prepare samples make sure no bubble in sample test only after sample stability select right wavelength get rid of possible interference factors Are cuvettes used matched? Y N Install the compartment correctly Is wavelength accurate? N Y Use matched cuvetter Diference should be Within 0.5%T Are %T and 100%T correct? Y Is photometric accuracy maintained? N Use right procedue to set N 36-27 N Calibrate wavelength 5.Drawing&diagram 5.1 PCBif Arrangement of Power Supply 1. Check the monochromator light passed onto the detector at right angle and right position (area) of the detector if not, adjust 5.1.1it. Circuit Diagram of Power Supply 2. Amplifier output voltage (static): 20mV-30mV, put black body to light from of light way, refer to Fig5.3 to adjust the 5.2 prevent PCB the Arrangement CPU potentiometer W to change the output voltage to the voltage between pin3 and pin4). 5.2.120mV-30mV(measure Circuit Diagram of CPU 3. Replace detector SI1227K. 4. Use NBS930D filter to check. 5.3 PCB Arrangement of Amplifier 5. If the value of display too big, check the control single of halogen lamp 5.3.1 Circuit of Amplifier solving Diagram wiring problem of socket J5 replace IC4 IC5 on the power supply board replace power supply board 36-28 36-29 36-30 36-31 36-32 36-33 36-34 6 Schematic Layout PART LIST OF UNICO 1100 SERIES SPECTROPHOTOMETERS Number Description 1 2 3 4 5 6 7 8 9 10 11 12 13 14 15 16 17 On/Off Switch Pc-power Power socket Wavelength disc Wavelength indicator Part of grating Monochromator Sample compartment Filter drive strap Filter commutation cam Amplifier dark box Amplifier Halogen lamp Junction-box Transistor Radiator Power supply board 36-35 36-36