1
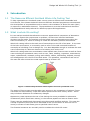
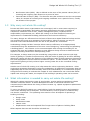
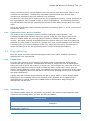
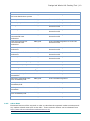
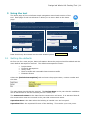
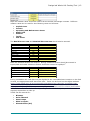
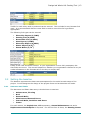
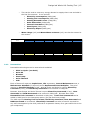
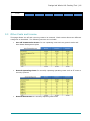
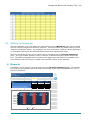
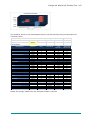
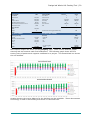
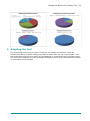
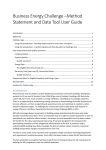
Design led Whole Life Costing Tool User Manual Created for: Resource Efficient Scotland Prepared by: Emma Hutchinson of GEP Environmental Ltd Design led Whole Life Costing Tool | 2 Contents Disclaimer 3 1 Introduction 4 1.1 The Resource Efficient Scotland Whole Life Costing Tool 4 1.2 What is whole life costing? 4 1.3 Why carry out whole life costing? 5 1.4 What information is needed to carry out whole life costing? 5 1.5 The Whole Life Costing Tool 6 2 Preparing to use the Tool 7 2.1 Deciding on the approach 7 2.2 Data gathering 8 3 Using the tool 11 3.1 Setting the defaults 11 3.2 Setting the baseline 13 3.3 Other Costs and Income 16 3.4 Setting up Maintenance Schedules 17 3.5 Setting up Scenarios 18 4 Reports 18 5 Adapting the Tool 21 Design led Whole Life Costing Tool | 3 Disclaimer IMPORTANT NOTICE IN RELATION TO THE LIABILITY OF ZWS IN RESPECT OF THIS TOOL This Tool has been prepared by or on behalf of Zero Waste Scotland Limited (“Zero Waste Scotland”) and is provided for general information purposes only by users (“Recipients”). Whilst reasonable steps have been taken by Zero Waste Scotland to procure that the content and information contained in this Tool is correct in all material respects, such content and information may be incomplete, inaccurate and/or out of date. Accordingly, reliance should not be placed on this Tool by the Recipient (or any other person) and the Recipient is recommended to seek its own advice in connection with the purposes for which it intends to use the Tool. The entire liability of Zero Waste Scotland to the Recipient in respect of any loss or damage arising from or in connection with this Tool (including any negligence and any delictual act or omission in respect of it) shall in no event exceed the greater of (a) the amount paid (if any) by the Recipient to Zero Waste Scotland specifically for the preparation of this Tool and (b) £500. ZWS shall not be liable in respect of (a) any loss of profits, damage to goodwill, loss of business, loss of revenue, loss of contracts, loss of anticipated savings or increased costs or expenses or (b) any type of special, indirect or consequential loss or damage howsoever caused. No warranties, representations, guarantees or undertakings are given in respect of this Tool and all warranties, conditions or other terms implied by statute or common law are excluded to the fullest extent permitted by law. Nothing presented within this Tool is intended to be or should be interpreted as an endorsement or recommendation of any supplier, service or product. Notwithstanding any of the above, the liability of Zero Waste Scotland to the Recipient for any death or personal injury caused by negligence, for fraudulent misrepresentation or for any other matter for which liability cannot be limited or excluded by law shall not be limited or excluded in any way. Design led Whole Life Costing Tool | 4 1 1.1 Introduction The Resource Efficient Scotland Whole Life Costing Tool To help organisations in Scotland create a more resource efficient and sustainable built environment, Zero Waste Scotland’s Resource Efficient Scotland programme commissioned the development of a spreadsheet tool to assist in the evaluation of whole life costs (WLC) in response to stakeholder demand. The spreadsheet is provided unlocked and therefore fully adaptable and easily tailored for different projects and applications. 1.2 What is whole life costing? It is an analysis method that allows the economic appraisal and comparison of alternative solutions to a particular requirement or problem, so that more informed and better decisions can be made. The analysis must be based upon the alternatives providing the same functionality i.e. levels of cooling to create the necessary internal environment. Whole life costing refers to the total cost of ownership over the life of an asset. In the case of the built environment, it is normally used to refer to the total costs and benefits of ownership of a building over its design life. It is also adaptable enough to evaluate the total cost of ownership of a discrete element of a building such as the roof. Whole life costing takes into consideration initial capital costs, finance costs as well as future costs including all operational costs, such as rent, rates, cleaning, inspection, maintenance, repair, replacements, renewals, energy and utilities, carbon, dismantling, disposal, security and management over the life of the built asset. The operation, maintenance and end of life costs will often exceed the initial capital costs by a factor of 5. Figure 1: Relationship between initial capital costs and operational costs The timing of future costs must be taken into account in the comparison of options. Future cost flows are discounted by a rate that relates present and future money values - which may include an allowance for inflationary changes. Opportunity costs represent the cost of not having the money available for alternative investments (which would earn money) or the interest payable on loans to finance work. These costs are totalled and discounted using discounted cashflow analysis. This uses the concept of present value that can be described as the current worth of a future sum of money or stream of cash flows given a specified rate of return. Two financial measures are normally used to evaluate the whole life costs: Design led Whole Life Costing Tool | 5 1.3 Net Present Value (NPV): NPV is defined as the sum of the present values (PVs) of incoming and outgoing cash flows over a period of time. Internal Rate of Return (IRR): The discount rate that reduces to zero the net present value of a stream of incoming and outgoing cashflows over a period of time, usually the lifetime of the project. Why carry out whole life costing? Private and Public sector organisations are encouraged, and in some cases required, to improve their sustainability and carbon emission performance through a number of compliance measures such as CRC, carbon management plans, corporate social responsibility requirements, etc. Whole life costing is an ideal method of ensuring an improvement in sustainable building performance and resource efficiency. Too many designs are influenced on the basis of short term capital financial outlays and do not consider the longer term operation of the building. Value for money can only be achieved if the costs associated with the life of the product are considered. Undertaking a design led WLC exercise allows resource efficiency to be appropriately considered during the assessment of the true cost of designing, constructing and operating a building/works. WLC factors in the costs associated with running the building for its expected life time and enables designers to test different design choices to determine the impact on building construction and operating costs. For example, a design team may be considering using either a steel structure with high levels of glazing or a timber frame structure with low levels of glazing for an office building. Whole life costing will allow the factoring of the different costs of these options to determine the most appropriate resource efficient investment option. In this scenario, the option with high levels of glazing is likely to have higher running costs due to the increased cooling requirements. Another use of whole life costing is to help assess the value engineering decisions. Value engineering processes frequently involve the substitution of materials or equipment that are supposedly like for like and unfortunately reduce the sustainability of a construction project. Using whole life costing to evaluate the impact of such substitutions can reveal that whilst capital cost savings are made, the impact of the building’s operating costs can be severe. 1.4 What information is needed to carry out whole life costing? Whole life costing requires the input of good quality, precise and accurate data to obtain valuable numerical results. It needs data about the cost of individual activities and components plus data about the timing of future events e.g. capital equipment replacement costs and dates. To carry out whole life costing on a new building, both the capital/revenue and operating costs of the building will be analysed. Income streams, such as grants or entrance fees, can also be considered. The operating costs need to cover all aspects of operating a building including: Design costs Utility costs Maintenance costs Labour costs Replacement costs and expected life of major items of plant or building fabric Other aspects that can and should be included are: Design led Whole Life Costing Tool | 6 Rates Information technology costs Fixtures, fittings and furnishing replacement costs Manufacturing or process equipment costs Staff costs The capital costs can include the cost of each of the main elements of the building, construction costs such as ground works and any associated professional fees. The other factors that need to be considered before embarking on whole life costing are the financial assumptions that are going to be used for inflation rates, discount rates, utility prices, carbon costs and any renewable energy support mechanisms. 1.5 1.5.1 The Whole Life Costing Tool Why it has been developed Whilst there are a number of tools for carrying out whole life costing available, they often do not fully encompass resource use during operation. The ZWS Whole Life Costing Tool incorporates normal whole life costing functionality but also allows energy and water use to be incorporated into the analysis allowing design decisions to be tested and energy supply options to be evaluated. 1.5.2 Who should use it Whole life costing is used by public sector and private organisations to analyse their investments and the tool is suitable for use by any organisation. Examples of its use are for the construction of a new office building and for an options appraisal for energy supply to a leisure centre. Accountability and responsibility for completing the whole life costing The project owner will normally specify the use of the whole life costing tool at the inception of every project and hand the responsibility for undertaking whole life costing to the technical delivery team. Typically the project manager is accountable for completion of the whole life costing however, the tool will be compiled and used by a combination of the following design team members: The project manager (PM) The quantity surveyor (QS) The M&E engineer (M&E) Cost data will normally be provided by the QS and performance data by the M&E. The PM should “own” the model and be responsible for ensuring that it is correctly used. 1.5.3 How it should be used For new builds, the first financial decisions are made at RIBA stage 0, Strategic Definition and the initial whole life costing model should be produced at the outset. Only a high level assessment is required at this stage reflecting capital costs, approximate utility consumption and operating costs. This will ensure that the delivered building will be affordable to run and maybe used to justify the Business Case. Design led Whole Life Costing Tool | 7 At stages 0 and 1, the model can be used to inform site selection with different sustainable aspects of the sites such as the potential for ground-works material re-use and the availability of renewable resources being evaluated. Once a site is selected, options for different building orientations and forms can be modelled. At this stage of design an initial thermal model of the building is required to determine the optimal configuration. Where different options are explored, each of these can be evaluated using the whole life costing model using information from the thermal model combined with high level costing assumptions. Once the project moves on through the project stages, the model is refined and more detail added such as detailed energy balances and the introduction of renewable technologies until the design is finalised. At the value engineering stage, any substitutions can be evaluated to ensure that they do not have a detrimental impact on building operating costs or resource efficiency. Finally, the model can be used as part of the post occupancy evaluation, in order to evaluate the financial impact of any differences between design performance and actual performance. 1.5.4 Excel Version The tool is designed to work in Excel 2010 and 2013. 2 2.1 Preparing to use the Tool Deciding on the approach In order to use the tool, decisions will need to be made about the methodology used to evaluate the project. These decisions will cover the scope of the assessment and financial assumptions. 2.1.1 Scope The model can be used in two ways, either the whole building can be modelled, or a single aspect can be assessed. The second of these options is more appropriate for refurbishments, for example boiler replacement options could be modelled. In addition, it is possible to only model the costs of the building or to include any income such as grants, operating budgets or gate fees. Including income in the analysis can help evaluate whether the building is affordable. 2.1.2 Financial index rates and discount rates To assess the impact of differing inflation rates for different elements of the model, you will need to enter in expected inflation rates for: Capital costs Income Operating and maintenance costs Staff costs Utilities Renewable energy tariffs CRC costs Design led Whole Life Costing Tool | 8 These could all be set to a single inflation rate such as the retail price index (RPI) or each could be set individually. Setting them individually allows factors such as fuel costs increasing at a different rate from inflation to be reflected. The discount rate used will be determined by your organisation’s policy. It may be based on the organisation’s cost of capital or may be set by management. The difference between the real discount rate and the nominal discount rate is often based on the retail price index (RPI). Add in the typical public sector discount rate from the treasury book i.e. 3.5% (note correct in February 2015) 2.1.3 Opportunity costs- Real or Nominal The model is set up to analyse projects on both a real and a nominal basis. The fundamental difference between these two options is that the real analysis ignores the effect of inflation whilst the nominal analysis factors in inflation rates for all costs and income. We would normally recommend that the nominal analysis is used as it allows the potential for utility costs to increase at a greater level than normal inflation to be included. Consulting with your Finance Manager at an early stage will help to buy commitment to whole life costing and will also provide direction on main financial assumptions. 2.2 Data gathering Once the scope and main financial assumptions have been made, detailed cost data is gathered for entry into the tool. 2.2.1 Capital costs For each main element of the building, the capital costs of that element along with its expected life will be required. Consideration will also be required of how its replacement cost at the end of its life will relate to its initial cost. For example, the initial cost of a roof including its supporting structure could be £100,000 and it could have a thirty year life. When it needs replacing in thirty years, the replacement cost may only be 60% of the initial cost as the supporting structure will last for the life of the building and only the roof panels will need replacement. Capital costs will normally be provided by the QS or public sector in-house design teams. Estimates for the expected life of main elements of the building can be obtained from manufacturers or typical values from CIBSE Guide M: Maintenance Engineering and Management can be used. 2.2.2 Operating costs The following table shows the information required for the model for each separate major element of the building fabric, services and any renewables: What you need What units should it be in Where will you find it Annual Maintenance Costs £/year From manufacturers and facility managers Periodic Equipment Replacement Costs and £/year From manufacturers and suppliers Design led Whole Life Costing Tool | 9 Maintenance 2.2.3 Utility Costs £/year Quotes from suppliers, corporate contracts Staff Costs £/year Finance department Other Costs e.g. rates, IT provision £/year From suppliers Income Where it is decided to include income streams within the model, up to ten different income streams can be included. It is not possible to vary the income year on year other than by increasing it by inflation. 2.2.4 Energy balance The energy balance is a very important part of the model. It shows how energy is used in the building and its source. Many design decisions impact on energy use and may result in increased building operating costs. This can be by increased heat losses through building fabric or increased electricity costs due to low levels of natural light. In order to create the energy balance you will need to know where the energy will be used in your building. Almost all buildings that are undergoing renovation and all new builds have a statutory requirement to evaluate their energy consumption using either an SBEM model or a dynamic simulation model. These thermal models produce an energy performance certificate for the building that must be submitted as part of the building warrant process. They also produce a Brukl report which details u-values and the air permeability of the buildings. Working out what your net energy use by each element of the buildings can be achieved by one of two methods: 1. Interrogation of the thermal model to determine the required values. Most software packages will produce a report detailing the required information 2. Use the u-values and air permeability from the Brukl report to calculate the energy consumption attributable to those elements. The data required for creating the energy balance for the model is: What you need What units should it be in Where will you find it The annual heat losses attributable to the: kWh/year Can be found by: Walls Floor Roof Windows and doors The annual ventilation losses for the building kWh/year Interrogating the thermal model Manual calculation using uvalues Rules of thumb for early stage models Can be found by: Interrogating the thermal model Manual calculation using air permeability Rules of thumb for early stage Design led Whole Life Costing Tool | 10 2.2.5 The distribution losses from the heat distribution system kWh/year models From the M&E engineers Heat exported kWh/year From the M&E engineers Electricity exported kWh/year From the M&E engineers Solar gains kWh/year From the M&E engineers or from the thermal model Internal gains kWh/year From the M&E engineers or from the thermal model Total heat produced from conventional heat production kWh/year From the M&E engineers or from the thermal model Total fuel required for conventional heat production kWh/year From the M&E engineers or from the thermal model Electricity used for heat production kWh/year From the M&E engineers or from the thermal model Electricity used for DHW production kWh/year From the M&E engineers or from the thermal model Electricity used for cooling kWh/year From the M&E engineers or from the thermal model Electricity used for lighting kWh/year From the M&E engineers Other electricity usage kWh/year From the M&E engineers Water usage m3/year From the M&E engineers Waste water to sewer m3/year From the M&E engineers Installed capacity of renewables kW From the M&E engineers Electricity generated from each renewable/CHP kWh/year From the M&E engineers Heat generated from each renewable/CHP kWh/year From the M&E engineers DHW generated from each renewable kWh/year From the M&E engineers Electricity consumed by each renewable/CHP kWh/year From the M&E engineers Renewable fuel consumed kWh/year From the M&E engineers Other Data Emissions factors will be required in order to calculate the expected carbon emissions and any carbon related costs such as the CRC. These emission factors can be obtained from http://www.ukconversionfactorscarbonsmart.co.uk/ . Design led Whole Life Costing Tool | 11 3 Using the tool The home page of the tool allows simple navigation around each section of the tool. Each page of tool has a button to allow you to return back to the home page. Zero Waste Scotland Whole Life Costing Tool Version 2.0 Mar 2015 Introduction This tool is designed for evaluating the whole life cost of a new build or refurbishment project. It allows a baseline to be set and then up to two scenarios created. The scenarios can be used to test the impact of different design choices. See the accompaning guide for detailed instructions. Step 1: Set the Defaults You will need to know inflation rates, energy prices, emission factors and feed in tariff or renewable heat incentive tariffs (if eligible projects included) Set the Defaults Add Other Costs and Income Step 2: Set the baseline Step 5: Review your assumptions and the results You will need to know capital costs, operating costs, energy consumption, heat and ventilation losses and any energy generation. You will also need to know the life expectancy of the main elements of the building Set the Baseline Step 3: Set up the scenarios Vary which ever parameters you want to for each scenario. Scenario 1 Step 4: Add any other costs or income This sheet can be used for recording other construction costs such as fees and site waste management costs. Other annual costs and any annual income can also be entered here. Project Summary Cashflow At any stage you can click on the home button to return to this menu. Scenario 2 Data should only be entered into the cells shaded yellow 3.1 Graphs . Setting the defaults On first use for a new project, basic information about the project should be added and the main default assumptions entered. The default assumptions include: Project dates Financial assumptions Utility costs Feed in tariffs and renewable heat incentive tariffs Emission factors Select the [Default Assumptions] tab and enter the project name, version number and the date. The main dates should then be entered. The Project Start is the year that the cashflows will be discounted to and will normally be the current year. The Construction Start is the date that the construction will start. It is assumed that all the construction costs are incurred in the year that construction starts. Operation Start is the date when the building is handed over and occupied. Operation Life is the expected life time of the building. This can be up to 100 years. Design led Whole Life Costing Tool | 12 Next the inflation rates should be entered as the annual percentage increase. Different inflation rates can be used for the following costs and incomes: Capital Costs Income Operating and Maintenance Costs Staff Costs Utilities Tariffs CRC Costs The Real discount rate and Nominal discount rate should also be entered. Inflation Rates & Discount Rates Base Inflation Rate Capital Costs Income Operating & Maintenance Costs Staff Costs Utilities RHI/FiT Tariffs CRC Costs Real discount rate Nominal discount rate Notes 2.5% 2.5% 2.5% 2.5% 2.5% 6.0% 2.5% 2.5% 3.5% 6.0% Next the emission factors are entered. Energy emissions factors should be entered in kgCO2/kWh and water emissions factors should be entered in kgCO2/m3. Emission Factors Heating Fuel Notes 0.1845574 kgCO2e/kWh Defra 2014 Electricity 0.5331000 kgCO2e/kWh Defra 2014 Biomass 0.0118383 kgCO2e/kWh Defra 2014 Water 0.3441000 kgCO2/m3 Defra 2014 Waste Water 0.7085000 kgCO2/m3 Defra 2014 If any renewables are used that may be eligible for the renewable heat incentive or the feed in tariff, the appropriate tariff should be used. These can be found on the Ofgem website https://www.ofgem.gov.uk/environmental-programmes/non-domestic-renewable-heatincentive-rhi/tariffs-apply-non-domestic-rhi-great-britain and https://www.ofgem.gov.uk/environmental-programmes/feed-tariff-fit-scheme/tariff-tables . It should be noted that these differ depending on the installed capacity and are revised regularly dependent on take up. Tariffs can be entered for: Biomass Solar Thermal Heat Pumps Wind or Hydro PhotoVoltaics (PV) Design led Whole Life Costing Tool | 13 Tariffs for each utility used or produced can be entered. This includes for any biomass fuel used. It is recommended that the notes field is used to record the fuel type where appropriate. The following fuel types can be entered: Electricity Import (£/kWh) Heating Fuel (£/kWh) Renewable Fuel (£/kWh) Heat Export (£/kWh) Electricity Export (£/kWh) Water Import (£/m3) Waste Water (£/m3) Finally a CRC cost should be entered. If your organisation is not a CRC participant, this should be set to zero. The cost will depend on whether your organisation chooses to buy its carbon allowances in the forecast sale or the buy to comply sale. 3.2 Setting the baseline The baseline represents the base case assumptions for the model at each stage of the project. It will change as the design of the project forms and as decisions are made. 3.2.1 Structure and Fabric The Structure and Fabric data entry is divided into six sections: Substructure, Flooring Roof External Walls Windows and External Doors Internal Walls, Partitions and Doors Frame For each section, the Capital Cost, Life expectancy, Annual Maintenance cost and a Replacement Cost Multiplier is required. For the first four of these, the Heating Losses Design led Whole Life Costing Tool | 14 Attributable in kWh/year will also be required. Finally it is possible to assign a Maintenance Schedule (A to H) to each section (see section 3.4 below). 3.2.2 Building Services The building services should then be inputted and these have been divided into six sections each of which will require a Capital Cost, Life expectancy, Annual Maintenance cost, a Maintenance Schedule (if required) and a Replacement Cost Multiplier. Each one also requires information on its impact on the energy balance as follows: Conventional Heat Production (e.g. boilers or storage heaters) o Electricity Consumption (kWh/year) and/or; o Heating Fuel Consumption (kWh/year) For HVAC For Domestic Hot Water (DHW) o Heat supplied from electricity (kWh/year) o Heat supplied from heating fuel (kWh/year) Ventilation and Distribution Losses (e.g. plant room losses, distribution pipework losses) o Electricity consumption (e.g. distribution pump electricity usage) o Heating demand/losses (kWh/year) (e.g. heat losses from distribution pipework and losses due to ventilation) Cooling (e.g. split unit energy consumption, cooling to AHU) o Electricity consumption (kWh/year) Electricity consumption for cooling Electricity for ventilation and air handling units Electricity used by heat pumps not classified as renewable o Cooling demand/losses (kWh/year) Cooling requirement Losses from distribution pipework o Free Cooling (kWh/year) Lighting o Electricity consumption (kWh/year) DHW Production (kWh/year) o Electricity consumption (e.g. point of use water heating) o Heating fuel consumption (e.g. direct gas fired water heater) o Heating demand/losses (e.g. standing losses from calorifier) o Any heating fuel consumption can be included in the Conventional Heat Production Column if it is supplied from the boiler or can be entered in the heating fuel consumption cell in the DHW Production column o Heat supplied from electricity (kWh/year) (the demand for DHW from electrical sources) o Heat supplied from heating fuel (kWh/year) (the demand for DHW from heating fuel sources) Other Design led Whole Life Costing Tool | 15 o This can be used to enter any energy demand or supply that is not included in the first five sections. It can include: Electricity consumption (kWh/year) Heating fuel consumption (kWh/year) Heating Demand Losses (kWh/year) Solar Heat Gains (kWh/year) Internal Heat Gains (kWh/year) Heat Export (kWh/year) Electricity Export (kWh/year) o Water Usage (m3) and Waste Water to Sewer (m3) can also be entered in this section Services Conventional Heat Production Ventilation & Distribution Losses Cooling Lighting DHW Production Other Capital Cost Life (years) Annual Maintenance Maintenance Schedule Electricity Consumption kWh Heating Fuel Consumption kWh Heating Demand/Losses kWh Cooling Demand/Losses kWh Solar Heat Gains/free cooling kWh Internal Heat Gains kWh Heat supplied from electricity kWh Heat supplied from heating fuel kWh Heat Export kWh Electricity Export kWh Water Usage m3 Waste water to sewer m3 Replacement Cost Multiplier 3.2.3 Renewables Renewable technologies can be entered and modelled: Wind or Hydro (not both) Solar PV Biomass Heat Pump Solar Thermal CHP Each of these will require a Capital Cost, Life expectancy, Annual Maintenance cost, a Maintenance Schedule (if required) and a Replacement Cost Multiplier. They also require an Installed Capacity in kW. Wind & Hydro and Solar PV require Electricity Consumed (if any) and Electricity Generated to be entered in kWh/year. Biomass, Heat Pumps and Solar Thermal require Electricity Consumed (if any), Heat Generated and DHW Generated to be entered in kWh/year. Biomass also needs Renewable Fuel Consumed to be added in kWh/year. Fossil Fuel Consumed can be added in kWh/year for the heat pump option (for gas fired heat pumps). The CHP requires Heating Fuel Consumed, Electricity Generated, Heat Generated and DHW Generated to be entered. Electricity Consumed can also be used if required for any self-consumption by the CHP (referred to as parasitic losses, for a gas turbine this is the gas compressor). Design led Whole Life Costing Tool | 16 Renewables Wind & Hydro Solar PV Biomass Heat Pump Solar Thermal CHP Capital Cost Life (years) Annual Maintenance Maintenance Schedule Installed Capacity kW Electricity Consumed kWh Electricity Generated kWh Fossil Fuel Consumed kWh Heat Generated kWh DHW Generated kWh Renewable Fuel Consumed kWh Replacement Cost Multiplier 3.3 Other Costs and Income This page allows one off and recurring costs to be entered. Each section allows ten different categories to be added. The following sections are included: One off Construction Costs: for non-repeating costs such as ground-works and Site Waste Management plans Annual Operating Costs: for annually repeating operating costs such as IT costs or security systems Annual Staff Costs: for annually repeating staff costs Design led Whole Life Costing Tool | 17 Annual Income Streams: for annually repeating income such as gate fees or an operating budget. End of Life Costs/Income: for any income or costs associated with disposal of building. End of Life Costs/Income Disposal Value Deconstruction/Disposal Costs Total 3.4 Baseline Scenario 1 Scenario 2 £0 £0 £0 Setting up Maintenance Schedules Maintenance schedules allow cost profiles to be set up for individual items that require periodic renovation or major parts replacing. Items such as windows requiring painting or part of a heat pump needing replacing should be included. Each maintenance profile (A, B, C, D, E, F, G and H) can then be assigned to a different element of the building, services or renewables. Enter the appropriate costs into the required year. For example, if the windows need painting every ten years at a cost of £10,000 per year, that amount should be entered into year 10, year 20, year 30 etc. Design led Whole Life Costing Tool | 18 3.5 Setting up Scenarios Once the baseline is set, the data from each table from the [Baseline] page can be copied into the scenario pages and varied as required. This can be done by simply clicking on the ‘Copy from Baseline’ button. For example, the roof construction could be varied resulting in an increased capital cost but decreased heat losses and maintenance costs. Once the scenarios are set up the results can be compared on the [Project Summary] page. The type of NPV analysis (real or nominal) is selected from the yellow drop down box. The table and graphs then summarise the capital cost and NPV for the baseline and two scenarios and the change in capital cost and NPV relative to the baseline. 4 Reports A summary of the project can be printed from the [Project Summary] page. This shows the results of the analysis and also shows a summary of the main assumptions for one of the three scenarios. Project Summary: Test Building Version: v1 Date: 16-Mar-2015 Results Analysis Type: Real Scenario Improved Substructure u1,000,000 -£ 1,000,500 5,667,292 -£ 5,620,764 -£ 500 £ 46,528 £ 93.06 Baseline Capital Cost Real NPV Capital Cost Change NPV saving (+ve = saving, -ve = increased cost) Spend to save ratio: Every one pound spent saves -£ -£ Improved wall uvalue 1,100,000 5,528,855 100,000 138,437 1.38 -£ -£ -£ £ £ Project Capital Cost and NPV £-£1,000,000 -£1,000,000 -£1,000,500 -£1,100,000 -£2,000,000 -£3,000,000 -£4,000,000 -£5,000,000 -£6,000,000 -£5,620,764 -£5,667,292 Baseline Improved Substructure uvalue Capital Cost Real NPV -£5,528,855 Improved wall u-value Design led Whole Life Costing Tool | 19 The scenario shown in the assumptions section can be selected using a drop down box coloured yellow. Assumptions (Annual costs and income based on first full year of operation) Selected Scenario Baseline Costs and Lifespan Building Element Structure and Fabric Substructure Roof External Walls Windows & External Doors Internal Walls, Partitions and Doors Frame Total Services Heat Production Distribution Losses Ventilation & Cooling Lighting DHW Production Other Total Renewables Wind & Hydro Solar PV Biomass Heat Pump Solar Thermal CHP Total Other Costs and Income Other Capital Costs Other Income & Costs Total Grand Total Annual Maintenance Maintenance Schedule Used? 60 25 60 15 30 60 £0 £0 £0 £1,000 £0 £0 £1,000 No No No Yes No No £500,000 £300,000 £200,000 £100,000 £50,000 £50,000 £1,200,000 15 15 15 20 15 25 £5,000 £2,000 £3,000 £1,000 £500 £750 £12,250 No No No No No No £50,000 £0 £0 £0 £100,000 £0 £150,000 25 0 0 0 15 0 No No No No No No £38,803 £1,000 £0 £0 £0 £0 £0 £1,000 £830,000 £830,000 £868,803 £564,250 £564,250 £578,500 Capital Cost Lifespan £60,000 £150,000 £70,000 £50,000 £30,000 £125,000 £485,000 Annual Income £2,803 £0 £0 £0 £36,000 £1,055,000 £1,055,000 £2,890,000 Finally the energy balance for the selected scenario is shown. Design led Whole Life Costing Tool | 20 HEAT DEMAND Heating & DHW HEAT INPUT kWh Heat Losses Heating & DHW 0 0 1,437,000 1,690,588 100,000 100,000 200,000 Internal Gains Roof 600,000 Heating Fuel External Walls 500,000 Electricity Ventilation & Distribution Losses Other Heat Losses 90,000 400,000 7,000 Biomass Solar Thermal CHP Other Heat Use DHW Export Total 0 0 360,000 360,000 0 0 1,897,000 2,150,588 0 Conventional Heating System Efficiency 85% 1,897,000 ELECTRICITY INPUT ENERGY Electricity (excl. heat) Electricity Ventilation and Distribution 0 100,000 ELECTRICITY DEMAND Lighting Supply 0 Substructure Windows & External Doors Demand Solar Gains 150,000 4,380 kWh Imported 836,860 Wind 17,520 Cooling 100,000 PV 0 Other 500,000 CHP 0 Export 0 Total 754,380 less heating/dhw Total -100,000 754,380 More Report outputs are shown on the [Graphs] page. These include detailed graphs showing real and nominal cash-flow breakdowns. The following graph shows the first twenty years of positive and negative cashflows for a project. The dotted black line shows the net cashflow. Graphs showing the energy balance for the building are also available. These demonstrate how energy is used in the building and where it is sourced from. Design led Whole Life Costing Tool | 21 5 Adapting the Tool The sheets within the tool have been locked but not password protected. They can therefore be easily unlocked making it possible to tailor them for use in any project. Care should be taken that the logic within the spreadsheet is understood before this takes place. The tool can be adapted to create exemplar templates such as Hotel refurbishment projects or new Health Centre designs. Design led Whole Life Costing Tool | 22