1
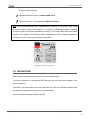
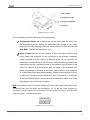
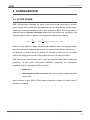
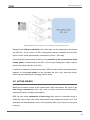
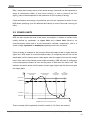
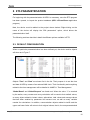
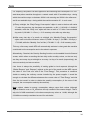
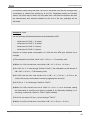
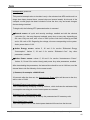
KES 1xThree-Phase (KNX Energy Saver) Three-Phase System Energy Saver Application Program Version: [2.1] User Manual Version: [2.1]_a www.zennio.com USER MANUAL ZN1IO-KES KES 3xSingle-Phase Contents Document updates ................................................................................................................... 3 1 Introduction ......................................................................................................................... 4 1.1 KES, the Energy Saver ................................................................................................... 4 1.2 Instalation .................................................................................................................... 5 1.2.1 Measuring Probe ................................................................................................... 7 2 Configuration ....................................................................................................................... 9 2.1 Active Power ................................................................................................................ 9 2.2 Active Energy.............................................................................................................. 10 2.3 Power Limits............................................................................................................... 11 3 ETS Parametrisation ........................................................................................................... 12 3.1 Default Configuration ................................................................................................. 12 3.2 General Window......................................................................................................... 14 3.2.1 Active Energy ...................................................................................................... 18 3.2.2 Active Power ....................................................................................................... 22 3.2.3 Power Limit Monitoring....................................................................................... 24 3.3 Logical Functions ........................................................................................................ 28 ANNEX I: Time Management ................................................................................................... 29 ANNEX II: Further Examples .................................................................................................... 33 ANNEX III: Comunication Objects ............................................................................................ 47 http://www.zennio.com Technical Support: http://zennioenglish.zendesk.com 2 KES 3xSingle-Phase DOCUMENT UPDATES Version Changes Pages(s) Changes in the application program: • • [2.1]_a Higher precision in the measurement of the cost if tariff switches occur during the measuring period. Improvement in the module of the Logical Functions to avoid sending unexpected values. Update of the Object Table. - 47 - 48 Revision of styles and minor clarification of certain texts. - Changes in the application program: [2.0]_a http://www.zennio.com • • New algorithm for calculating energy consumptions. Minor changes in texts. - Technical Support: http://zennioenglish.zendesk.com 3 KES 3xSingle-Phase 1 INTRODUCTION 1.1 KES, THE ENERGY SAVER The KNX Energy Saver from Zennio, KES, combines in only one device the following features: Support for single-phase and three-phase environments (two independent application programs): KES 1x-ThreePhase, destined to three-phase electric systems, where each of the measuring probes will monitor one of the phase lines. KES 3x-SinglePhase, destined to single-phase electric systems, where each measuring probe can be used to monitor three independent electric conductions (channels). 3 independent input channels for the connection of up to three measuring probes (model ZN1AC-CST60) to monitor three independent single-phase lines or one three-phase line (depending on the application program), which permits the following functions: Measuring and reporting the instant active power consumptions (kW). Calculating and reporting the active energy consumptions (kWh). Calculating and reporting the cost of the energy consumption (with the possibility of setting up 4 different tariffs) as well as the volume of the CO2 emissions required to generate such energy. Monitoring power limits. Hourly, daily, weekly and monthly report of total energy consumption, as well as upon request (through a global request object). Sending of the actual and average values of the consumed energy, the cost incurred and the corresponding CO2 emissions (every day, every week, every http://www.zennio.com Technical Support: http://zennioenglish.zendesk.com 4 KES 3xSingle-Phase month or upon request). Synchronisation through an external KNX clock. Module with up to 5 multi-operation logical functions. Note: the measurement algorithm implemented in versions 2.0 and later of KES can correctly compute power consumptions in a variety of alternating currents, including non-sine signals and signals generated by dimmers. This makes KES able to work with signals of any shape and to measure power consumptions with all kinds of appliances and devices in the home and industrial environments. Figure 1 The KES Energy Saver. 1.2 INSTALATION KES connects to the KNX bus via the bus connecting terminals. The input channels are connected to KES through the screw terminal included in the device packaging. Once KES is provided with power from the KNX bus, both the individual address and the associated application program can be downloaded. Figure 2 shows the element scheme of KES. http://www.zennio.com Technical Support: http://zennioenglish.zendesk.com 5 KES 3xSingle-Phase 1.- KNX Terminal 2.- Programming LED 3.- Programming Button 4.- Input Slot Figure 2 Element scheme. The functionality of the main elements is described below: Programming Button (3): a short press on this button sets the device into the programming mode, making the associated LED (2) light in red. If this button is held while plugging the device into the KNX bus, KES will enter the Safe Mode. The LED will then blink in red. Input Terminal (4): slot for the insertion of the screw input terminal (see figure below) and therefore for the connection of the different measuring probes provided with the device. A different probe will be required per electrical line being monitored. The two wires of each measuring probe will be inserted into the two connection points of the particular input channel to be used. For instance, if three electrical lines are going to be monitored, one probe will need to be connected to the slots 1 and 2 (referred to as “Channel A” in the Single-Phase application program), another one to the slots 3 and 4 (“Channel B”), and a third one to the slots 5 and 6 (“Channel C”). In the case of the Three-Phase version, each probe will be destined to monitor one of the three phase lines in the electrical system. Note: the insertion order of the two terminal wires from the measuring probe to the connection slots does not affect the functionality. I.e., for the first input channel it is possible to connect either one of the wires from the probe into point 1 and the other cable into point 2, or either the inverse. Figure 3 screw input terminal. http://www.zennio.com Technical Support: http://zennioenglish.zendesk.com 6 KES 3xSingle-Phase 1.2.1 MEASURING PROBE The set-up process of the ZN1AC-CST60 measuring probe (Figure 4) is described next. Figure 4 Zennio ZN1AC-CST60 Measuring Probe. The required steps are: Open the top clamp of the probe. Pass the phase wire from which the energy measures will be taken through the gap that has just been uncovered in the probe. Important: only one phase line should be inserted into the measuring probe, not the entire power cable with the neutral and other phases. Close back the top clamp of the probe. Connect the two wires of the measuring probe into the two connection slots of the KES terminal block that correspond to the desired channel. Please remember that KES only performs measurements of the power consumed by alternating current (AC) lines. Note: it is very important to keep in mind that neither ordinary power supplies (230 V) nor other external supplies should be connected to the KNX bus, nor directly to the input terminal of KES. For detailed information about the technical features of KES, as well as on security and installation procedures, please refer to the device Datasheet, bundled within the device packaging and also available at http://www.zennio.com. http://www.zennio.com Technical Support: http://zennioenglish.zendesk.com 7 KES 3xSingle-Phase Hereafter, this user manual will only refer to the KES 1xThree-Phase application program, intended for three-phase systems. The specific user manual for the KES 3xSingle-Phase application program, intended for single-phase systems, can be downloaded from the http: //www.zennio.com website. http://www.zennio.com Technical Support: http://zennioenglish.zendesk.com 8 KES 3xSingle-Phase 2 CONFIGURATION 2.1 ACTIVE POWER KES 1xThree-Phase calculates the value of the active power consumed by a threephase system whose phase lines are passed through the three ZN1AC-CST60 probes, which are connected themselves to the input channels of KES. This active power is obtained from the effective intensities measured by the probes and according to the following relation, which, in general, can be applied to three-phase systems: 𝑃𝑎𝑐𝑡 = 𝑉𝑒𝑓 √3 𝐼𝑒𝑓 · 𝐹𝑃 = 𝑉𝑒𝑓 √3 (𝐼𝑒𝑓 𝐴 + 𝐼𝑒𝑓 𝐵 + 𝐼𝑒𝑓 𝐶 ) · 𝐹𝑃 where 𝑉𝑒𝑓 is the effective voltage of three-phase installation and 𝐹𝑃 is the power factor. Both values must be defined by parameter. The values of the effective intensities, 𝐼𝑒𝑓 , are obtained, as stated above, by placing the measuring probes around the phase cables, and plugging the outputs of the probes into the input channels of KES. KES assumes an ideal situation with a sole and constant power factor (defined by parameter) for the whole three-phase installation. Moreover, the three-phase installation itself is supposed by KES to be either: Balanced, or Unbalanced and star-connected, with its central point referenced to the neutral wire, which therefore makes KES 1xThree-Phase particularly suitable for these types of systems or situations. http://www.zennio.com Technical Support: http://zennioenglish.zendesk.com 9 KES 3xSingle-Phase Figure 5 Measuring the active power consumed by a three-phase system Regarding the effective intensities, the values than can be measured by the probes are [300 mA – 60 A], which in a 380v three-phase balanced installation with a power factor of 100% would approximately correspond to [342 W – 68,4 kW]. Once beyond the aforementioned 300 mA, the resolution in the measurement of the instant power is determined by the DPT of the 2-byte floating-point object used to transmit the value to the bus (0.01 kW). In addition to measuring instant active power, KES can also monitor the highest power detected, so that power peaks can be calculated per hour, day, week and month, which may be interesting for managing historic values. 2.2 ACTIVE ENERGY Based on successive values of the instant power, KES can perform the count of the total energy consumed per hour, day, week or month, as well as calculating daily, weekly and monthly average consumptions. KES can also make estimations of the energy that would be consumed during a whole day if the current value of the instant power were constant for the 24 hours. This estimation can be expressed in terms of consumption (kWh) and in terms of cost (local currency). http://www.zennio.com Technical Support: http://zennioenglish.zendesk.com 10 KES 3xSingle-Phase Daily, weekly and monthly values of the actual energy consumed can be expressed in terms of consumption (kWh), of cost (local currency), or even in terms of the CO2 (kgCO2) sent to the atmosphere for the production of such quantity of energy. If both estimations and energy consumptions are set to be expressed in terms of cost, KES allows specifying up to four different tariff values (in cents of the local currency per kWh). 2.3 POWER LIMITS KES can also monitor the level of the power consumption in relation to certain limits, initially defined by parameter: an upper limit and a lower limit (linked to an overconsumption alarm and to a low-consumption indicator, respectively), and to a certain margin (hysteresis or deadband) regarding each of the two limits. Figure 6 shows an example of the process. When the instant power is higher than the upper limit, KES sends an overconsumption alarm (if configured) and this will not be deactivated until the instant power is back again under the upper limit minus the margin band. If the value of the instant power keeps decreasing, KES will send (if configured) a low-consumption indicator as soon as the power is lower than the lower limit. This indicator will remain active until the power is back again higher than the lower limit plus the margin band. Overconsumption Alarm ON Overconsumption Alarm OFF Low Consumption Alarm ON Low Consumption Alarm OFF Upper Limit Deadband Deadband Lowerlimit Figure 6 Power Limit Monitoring. These concepts will be explained in detail in section 3.2.3 of this user manual. http://www.zennio.com Technical Support: http://zennioenglish.zendesk.com 11 KES 3xSingle-Phase 3 ETS PARAMETRISATION For beginning with the parameterisation of KES it is necessary, once the ETS program has been opened, to import the product database (KES 1xThree-Phase application program). Next, the device must be added to the project where desired. Right-clicking on the name of the device will display the “Edit parameters” option, which allows the parameterisation itself. The following sections describe in detail the different options available in ETS. 3.1 DEFAULT CONFIGURATION When no particular parameterisation has been defined yet, the device and its objects will show as in Figure 7. Figure 7 Default Topology. Objects “Time” and “Date” are shown first in the list. Their purpose is to set the time and date of KES by means of an external KNX clock. Their functionality and everything related to the time management will be detailed in ANNEX I: Time Management. “Global Reset” and “Global Request” are listed next. When the value “1” is received by the earlier, every counter and every calculation will be reset to their default values, so every object related to instant values, estimations, total values and average values that had been enabled by parameter will become zero, as well as every variable needed for calculations. In addition, communication objects related to tariffs and the upper and lower limits will return to their original values, that is, the one parameterised http://www.zennio.com Technical Support: http://zennioenglish.zendesk.com 12 KES 3xSingle-Phase through the corresponding ETS fields. After that the measuring and calculating process will start over. The value “0” written to this object will have no effect. Regarding “Global Request”, the value “1” through this object will cause an extra sending of all the communication objects related to the power consumption which, because of having been parameterised in such way, are already being sent to the bus at certain times: instant values, accumulate values, average values, peak values, etc. In other words, a global request forces the re-sending of everything that KES, with no need of a specific external request, already sends periodically to the bus. Objects not related to a periodical sending will consequently not be sent, such as “Total Energy”, “Total Cost”, etc. In addition, when the global request takes place, objects for which a periodical sending is available but have not been parameterised in ETS will not be sent either. The behaviour of the communication objects “Tariff x” and “Switch to Tariff x”, shown by default, will be detailed later. http://www.zennio.com Technical Support: http://zennioenglish.zendesk.com 13 KES 3xSingle-Phase 3.2 GENERAL WINDOW The general screen, shown in Figure 8, permits setting generic parameters related to the operation of the Energy Saver. Figure 8 Default Configuration Screen. AC Power Supply Voltage [V]: this field is to configure the effective threephase voltage of the electric network (0-450v). The default value is 380. Power Factor [%]: this parameter defines, as a certain percentage, how the active power (the one actually consumed by the load) and the total power supplied are related (see section 2.1). The default value is 100%. Carbon Dioxide Ratio: amount of CO2 (in cents of a Kg) sent to the atmosphere to produce one unit of energy (kWh). Note: the value shown by default (0.5 kg CO2/kWh) is approximately similar to the regular ratios in Europe. It is always possible to change it by entering values more accurate for the system being monitored or by directly setting the exact value that can usually be found on the electric bill provided by the power supplier. http://www.zennio.com Technical Support: http://zennioenglish.zendesk.com 14 KES 3xSingle-Phase Tariffs. Tariff “x”. Initial Value: Initial value for tariff “x” (out of up to four different tariffs) for the calculation of the cost (estimated, actual or average) of the energy consumptions. This value should be expressed in cents of the local currency. KES permits defining up to four tariffs with different electric fees, and to switch from one to another in runtime (the active tariff by default is tariff 1). To make this possible, there are four 1-bit objects (“Switch to Tariff x”) that allow, by sending the value “1”, changing from one tariff to another. These objects may be linked to an external timer so that, for example, depending on the time band in which KES takes consumption samples, one tariff or another is used, making cost estimations more precise. It is also possible to change in runtime the value itself of each tariff. Four 2byte objects (“Tariff x”) can be found for this purpose, making it possible to update the value originally defined by parameter. Should any of the tariffs be unnecessary, the “Switch to tariff x” object can be left unlinked. Date and Time Request on Bus Voltage Recovery: defines how much time (1 to 255 seconds) KES should wait, whenever the bus voltage is recovered from a bus failure, before sending the time and date requests through the KNX bus. See ANNEX I: Time Management. Cyclical Sendings: these parameters are destined to enable/disable periodically sending certain objects related to the measurements. This includes both, a Security Sending (in other words, re-sending values that had already been calculated and reported to the bus but that can be sent again periodically) and the Continuous Sending of certain updated values. In order to better understand how KES counts these periods and the exact instant when the objects are sent, please refer to ANNEX I: Time Management. Security Sending of Last Daily Values: allows periodically re-sending the values related to the previous day, being possible to select cycle times of 1, 2, 3, 4, 6 or 12 hours (“0” disables this sending). This way, all the daily values enabled under “Active energy” (see section 3.2.1) will http://www.zennio.com Technical Support: http://zennioenglish.zendesk.com 15 KES 3xSingle-Phase not only be sent at the end of the day, but also during the following day, every time the selected period expires. Security Sending of Last Weekly Values: permits periodically resending the values related to the previous week, being possible to select cycle times of 1 to 7 days. (“0” disables this sending). This way, all the weekly values enabled under “Active Energy” (see section 3.2.1) will not only be sent at the end of the week, but also during the following week, every time the selected period expires. Security Sending of Last Monthly Values: permits enabling the periodic re-sending of the values related to the previous month, being possible to select cycle times of 1 to 30 days (“0” disables this sending). This way, all the monthly values enabled under “Active Energy” (see section 3.2.1) will not only be sent at the end of the month, but also during the following month, every time the selected period expires. Sending of Daily, Weekly and Monthly Peak Power Values: allows periodically sending the instant (updated) values of the daily, weekly and monthly peak power, being possible to select a cycle time of 1, 2, 3, 4, 6 or 12 hours (“0” disables this sending). This way, the peak power values enabled under the “Active Power” screen (see section 3.2.1) will not only be sent when corresponding to each (at the end of the day, at the end of week, or at the end of the month), but also every time the selected period expires, letting the bus know how the peak values change during the current day, week and month. Reset after Request?: when this parameter is enabled (“Yes”), the value of the communication objects and variables related to the total consumptions will be reset to zero every time KES responds to a request of the total consumption values since the last reset. This request is performed by sending the value “1” through the “Request” object. Logical Functions: after enabling this parameter, the menu on the left will include a new tab for the configuration of the logical functions. See section 3.3 for further information. Measuring Options: this parameter permits enabling different measuring alternatives: active energy, active power and power limit monitoring. These http://www.zennio.com Technical Support: http://zennioenglish.zendesk.com 16 KES 3xSingle-Phase options and their respective parameterisation will be explained in later sections. Three more 1-bit communication objects will be initially shown, independently of which of the measuring options have been enabled: “Partial Reset”, “Request” and “Disable” (not to be confused with the previously mentioned “Global Reset” and “Global Request” parameters). When the Energy Saver receives the value “1” through the “Partial Reset” object, every communication object and variables related to estimates and average / total values will be re-set to zero. Receiving the value “0” will have no effect. When the Energy Saver receives the value “1” through the “Request” object, it will report the accumulate values –since the last reset– for the energy consumption, the incurred cost and the carbon dioxide emissions. These values are reported through the “Total Energy”, “Total Cost” and “Total CO2 Emissions” communication objects, respectively, which will automatically show up when the corresponding option gets enabled in ETS. In addition, if “Reset after request” has been enabled under the General screen, whenever a “1” is received through the “Request” object, a reset process similar to the one described above will also take place. Note: the three Total objects are not intended to be read independently; their values will only be updated and sent to the bus all together, as a response to the “Request” object. The “Disable” object allows enabling or disabling power measures (according to the KNX standard, “0” corresponds to disabling the measurement and “1” corresponds to enabling it). When this measurement has been disabled, the cyclical sending of the instant power is interrupted (in case it had been previously parameterised), and the consumption is considered zero from that moment. Note that deactivating this measurement is not equivalent to simply not powering the device (which would make it not aware of time passing), but to measuring a null power consumption although time is still passing. However, in order to clarify this point, reading ANNEX II: Further Examples is encouraged (specially, Example II). http://www.zennio.com Technical Support: http://zennioenglish.zendesk.com 17 KES 3xSingle-Phase On the other hand, when the power measuring process is disabled, some more sending is interrupted, according to the table shown below: “Disable” = 0 “Disable” = 1 Cyclic sending of instant power Sending of peak power Cyclic re-sending of peak power Sending of effective consumptions Cyclic re-sending of effective consumptions Cyclic sending of estimated consumptions Sending of average consumptions Time passed counts for average values? ( 1) Real consumption counts for calculations? Table 1 Sending vs. Activation/Deactivation of Power Measures All the parameters from the Active Energy, Active Power and Power Limit Monitoring screens as well as their configurable values will be detailed in the next pages. 3.2.1 ACTIVE ENERGY This screen allows the configuration of several parameters related to the consumption of active energy (section 2.2). These are shown grouped into sections, as explained below. Estimated Values. Permits the configuration of parameters related to the estimation of the active energy consumption, expressed in kWh, as well as the estimated cost, in terms of the local currency. This estimation of the active energy consumed is made by assuming that the instant power consumption at the moment of the estimation remains constant during the 24 hours of the current day. 1 See Example II of ANNEX II: Further examples. http://www.zennio.com Technical Support: http://zennioenglish.zendesk.com 18 KES 3xSingle-Phase Figure 9 Active Energy. Estimations. Related to estimations, two communication objects come up: “Estimated Energy Consumption” and “Estimated Cost”, being possible to configure the following: Minimum Time Between Sendings: allows setting the minimum time, in seconds, that should pass between the sending of every two consecutive values of the corresponding object (“Estimated Energy Consumption” and/or “Estimated Cost”), no matter if they correspond to a cyclic sending or to a sending due to a change of the value. Valid times are [5-255] seconds. This minimum time between the two will only be taken into account if a value other than “0” is parameterised for the fields “Cycle Time” or “Send on Value Change”. Cycle Time: allows setting the period for sending the objects “Estimated Energy Consumption” and/or “Estimated Cost”, in seconds. In other words, every how much time these values will be sent to the KNX bus. Note: if the value specified here (x) is lower than the minimum time between sendings (y), the latter will prevail, resulting in a sending taking place only every “y” seconds. If “0” is parameterised for “Cycle Time”, no periodic sending of the associated communication object will take place. Send on Value Change: allows setting a certain value so that whenever a change in the estimated consumption (either in kWh or in units of the local currency) greater than this value is detected, a new sending of the corresponding communication object (“Estimated Energy Consumption” http://www.zennio.com Technical Support: http://zennioenglish.zendesk.com 19 KES 3xSingle-Phase or “Estimated Cost”) will happen. If there is no need of this feature, this field can be left with value “0”. Note: if a value other than “0” is set for the fields “Cycle time” and “Send on Value Change”, the associated objects (“Estimated Energy Consumption” and “Estimated Cost”) will also be sent to the KNX bus whenever the value “1” is received through the “Global Request” communication object. Hourly Values. From this section it is possible to enable the sending of the communication objects related to the energy consumption during the last hour, either in kWh (object “Last Hour Energy Consumption”) or as the associated cost (object “Last Hour Cost”). These objects will be shown once their own parameters have been enabled. Daily Values. From this section it is possible to enable the sending of the communication objects related to the energy consumption (kWh) during the last day, the related cost (local currency) and the related CO2 emissions (kgCO2). These objects are: “Daily Energy Consumption”, “Daily Cost” and “Daily CO2 Emissions”. It is also possible to enable the sending of the daily average values: “Average Daily Energy Consumption”, “Average Daily Cost” and “Average Daily CO2 Emissions”. Note: objects referring to average daily values (energy consumption, cost or CO2 emissions) represent the total consumption (in kWh, local currency or kgCO2) of the day divided by the number of hours of the day. In other http://www.zennio.com Technical Support: http://zennioenglish.zendesk.com 20 KES 3xSingle-Phase words, they represent the average consumption per hour during the last day. Weekly Values. The sending of the communication objects related to the energy consumption during the last week, the incurred cost and the required CO2 emissions can be enabled from here, as well as of the objects representing weekly average values. These are “Weekly Energy Consumption”, “Weekly Cost”, “Weekly CO2 Emissions”, “Average Weekly Energy Consumption”, “Average Weekly Cost” and “Average Weekly CO2 Emissions”. Note: objects referring to Average Weekly values (energy consumption, cost or CO2 emissions) represent the total consumption (in kWh, local currency or kgCO2) of the week divided by the number of days of the week. In other words, they represent the average consumption per day during the last week. Monthly Values. The sending of the communication objects related to the energy consumption during the last month, the incurred cost and the required CO2 emissions can be enabled from here, as well as of the objects representing monthly average values. These are “Monthly Energy Consumption”, “Monthly Cost”, “Monthly CO2 Emissions”, “Average Monthly Energy Consumption”, “Average Monthly Cost” and “Average Monthly CO2 Emissions”. http://www.zennio.com Technical Support: http://zennioenglish.zendesk.com 21 KES 3xSingle-Phase Note: objects referring to average monthly values (energy consumption, cost or CO2 emissions) represent the total consumption (in kWh, local currency or kgCO2) of the month divided by the number of days of the month. In other words, they represent the average consumption per day during the last month. 3.2.2 ACTIVE POWER Figure 10 Active Power. From this screen it is possible to configure several parameters related to the consumption of active power (section 2.1). These are shown grouped into different sections, as explained below: Instantaneous Power. This section is for configuring the parameters that affect the sending of the “Instantaneous Power” communication object, whose value is expressed in kW with two decimal figures. http://www.zennio.com Technical Support: http://zennioenglish.zendesk.com 22 KES 3xSingle-Phase These parameters are: Minimum Time between Sendings: permits setting the minimum time, in seconds, which should pass between the sending of two consecutive values of the “Instantaneous Power” object, no matter if they are correspond to a cyclical sending or to a sending due to a change of the value. Valid times are [5-255] seconds. This minimum time between the two will only be taken into account if a value other than “0” is parameterised for fields “Cycle time” or “Send on Value Change”. Cycle Time: allows setting the period for sending the “Instantaneous Power” object, in seconds (0 – 255). In other words, every how much time these values will be sent to the KNX bus. Note: if the value specified here (x) is lower than the minimum time between sendings (y), the latter will prevail, resulting in a sending taking place only every “y” seconds. If “0” is parameterised for “Cycle Time”, no periodic sending of the associated communication object will take place. Send on Value Change: allows setting a certain value so that whenever the difference between two consecutive measurements of the instantaneous power is found to be greater than that value, a new sending of the corresponding communication object (“Instantaneous Power”) will happen. If there is no need of this feature, this field can be set to 0. Note: if a value other than “0” is set for the fields “Cycle Tme” and “Send on Value Change”, the “Instantaneous Power” object will also be sent to the KNX bus whenever the value “1” is received through the “Global Request” communication object. Peak Power Values. This section allows the configuration of the sending of power peaks, that is, the highest instant power values detected during the last hour, day, week or month. Please note that –if enabled– hourly peak values can be sent not only at the end of the last hour but also before the end, by means of the parameters Minimum Time between Sendings, Cyclical Sending and Send on Value Change, which behave the same way as described above for “Instantaneous Power”, making it possible to inform the bus about how the hourly peak value changes throughout the http://www.zennio.com Technical Support: http://zennioenglish.zendesk.com 23 KES 3xSingle-Phase hour. Regarding daily, weekly and monthly peak values, they can be sent not only at the end of the day / week / month, but also periodically (with their updated instant values, that is, the peak value until the current portion of the current day, week or month), however in this case this must be configured under the General screen, with a unique parameterisable period for the three of them. The associated objects in this case are “Hourly Peak Power”, “Daily Peak Power”, “Weekly Peak Power” and “Monthly Peak Power” 3.2.3 POWER LIMIT MONITORING From this screen it is possible to configure several parameters related to monitoring the power consumption in relation to upper and lower limits (section 2.3). Two different sections can be found, one to configure the parameters of the upper limit and one to configure the parameters of the lower one. http://www.zennio.com Technical Support: http://zennioenglish.zendesk.com 24 KES 3xSingle-Phase Figure 11 Power Limit Monitoring. For the upper limit: Initial Value: allows setting (in tens of watts) the value that, at least in the beginning, the Energy Saver will assume as the upper limit while measuring the power. If this is set to “0”, KES will not monitor whether the power consumption exceeds or not a particular upper limit. The value of the upper limit, however, can be modified in runtime through the “Upper Limit” communication object. In the case of parameterising a value other than “0” for this field, it will be as well necessary to configure the parameters described below, which define how the upper limit monitoring behaves. When over Limit, Send: allows setting the value (“0” or “1”) that will be written to the “Over-Consumption Alarm” object when the instant power becomes greater than the value defined as the upper limit, making the user aware of this over-consumption situation in the system. http://www.zennio.com Technical Support: http://zennioenglish.zendesk.com 25 KES 3xSingle-Phase Send Object when Under Limit?: allows specifying whether the “OverConsumption Alarm” object should or should not send the inverted value (i.e., “0” if the above parameter is set to “1”) once the instant power is back again under the upper limit (or under the upper limit minus the deadband or margin configured through the parameter explained below), making the user aware of the end of the over-consumption situation. Hysteresis Under Limit: this parameter can be used to avoid consecutive over-consumption alarms every time the instant power –after having exceeded the upper limit and having activated the alarm– is no longer higher than the limit but then exceeds it again. By configuring a certain margin with a value other than “0” (in tens of watts), every time the overconsumption alarm is triggered, it will be necessary that the measured power decreases to upper limit minus margin before further overconsumptions trigger the alarm again. See Figure 6 (section 2.3). For the lower limit: Initial Value: allows setting (in tens of watts) the value that, at least in the beginning, the Energy Saver will assume as the lower limit while measuring power. If this is set to “0”, KES will not monitor whether the power consumption becomes or not lower than a particular lower limit. The value of the lower limit, however, can be modified in runtime through the “Lower Limit” communication object. In the case of parameterising a value other than “0” for this field, it will be as well necessary to configure the parameters described below, which define how the lower limit monitoring behaves. When Under Limit, Send: allows setting the value (“0” or “1”) that will be written to the “Low Consumption Indicator” object when the instant power becomes lower than the value defined as the lower limit, making the user aware of this low-consumption situation in the system. http://www.zennio.com Technical Support: http://zennioenglish.zendesk.com 26 KES 3xSingle-Phase Send Object when Over Limit?: this parameter allows specifying whether the “Low Consumption Indicator” object should send or not the inverted value (i.e., “0” if the previous parameter was set to “1”) once the instant power is again over the lower limit (or over the lower limit plus the deadband or margin configured through the parameter explained below), making the user aware of the end of the low-consumption situation.. Hysteresis Over Limit: this parameter can be used to avoid sending consecutive low-consumption indicators every time the instant power –after having become lower than the lower limit and therefore having activated the indicator– is no longer lower than the limit but then becomes lower again. By configuring a certain margin with a value other than “0” (in tens of watts), every time the low-consumption indicator is triggered, it will be necessary that the measured power reaches lower limit plus margin before further low consumptions trigger the indicator again. See Figure 6. http://www.zennio.com Technical Support: http://zennioenglish.zendesk.com 27 KES 3xSingle-Phase 3.3 LOGICAL FUNCTIONS This module is provided to perform arithmetical operations or in binary logic with incoming data from the KNX bus, so that the result is then sent through other communication objects specifically enabled in the device for this operation. Up to five different (and independent of each other) logical functions can be enabled, carrying out a maximum of four operations each. To use any of them, it is necessary to configure the following ETS window, which appears after selecting “Yes” in the Logical Functions box of the General window. Figure 12 Logical Functions. To obtain detailed information about using and parameterising the logical functions, please refer to the "Logical Functions X5” specific document, available from Zennio at http://www.zennio.com. http://www.zennio.com Technical Support: http://zennioenglish.zendesk.com 28 KES 3xSingle-Phase ANNEX I: TIME MANAGEMENT As shown in section 3.1, the objects “Date” and “Time” are displayed by default in ETS when the device is configured. The purpose of these two objects is to set KES to the date and time of an external KNX clock. However, KES features its own built-in clock, so these two objects are typically only necessary for occasional synchronisation of the internal clock to the external clock, for example after a parameter download or upon voltage recovery after bus failures (the internal clock only works under bus voltage). Therefore, in normal circumstances it is not necessary that the KNX clock sends these objects continuously. Consequently, every time KES is programmed or recovers after a bus voltage failure, two read requests are sent to the bus through these objects, with the intention of updating the internal clock to the time and date that will be received as a response from the KNX external clock. If this request receives no response after five seconds, KES will retry by sending both objects up to three more times (with a five-second delay from one to another). If no response is obtained after these four attempts, KES will assume that the current time and date are those that the internal clock had the last time it was working –or, in case KES has just been programmed– that the current date is January 1st 2000 and the current time is 0:00 am–. Regarding cyclical sending of objects –both the ones enabled from the General screen and the ones enabled from that of the other screens–, it is important to remark that all of them will always take place coinciding exactly with hour, day or week changes; never in the middle of two hours, two days, or two weeks. Example I: If one security sending has been defined for every three hours and a parameter download (as well as the consequent time set) takes place at 10:25h am, the first sending will be received at 1:00h pm (that is, three hour changes after the parameter download), not at 1:25h pm. http://www.zennio.com Technical Support: http://zennioenglish.zendesk.com 29 KES 3xSingle-Phase Example II: If one security sending has been defined for every two days and a parameter download (as well as the consequent time set) takes place on Monday at 10:25h am, the first sending will be received on Wednesday at 0:00h am (that is, two day changes after the parameter download), not at 10:25h am on Wednesday. In addition, it is important to keep in mind that the period counter is reset at the end of the time unit immediately greater than the one used for defining the sending periods. The following example illustrates this. Example III: Exactly at midnight, the daily values corresponding to the previous day will always be calculated and sent (in particular, those daily values that had been enabled in ETS). If a security sending of the last daily values has been parameterised for every four hours, the hour counter will be reset at midnight. That is why the first security sending of those values will happen at 4:00h am, no matter if a parameter download (and the consequent time set) had taken place at 10:50h pm. Example IV: Exactly every Sunday at midnight (i.e., in the exact moment the day changes to Monday) the weekly values corresponding to the previous week will always be calculated and sent (in particular, those weekly values that have been enabled in ETS). If a security sending of the last weekly values has been parameterised for every four days, the day counter will be reset during such week change. This way, the next security re-sending will happen at the end of next Thursday, that is, four day changes after the values were calculated. Considering that the number of days in a week (7) is not a multiple of 4, this behaviour allows that the security sending takes place on the same days every week (in the example, when switching from Thursday to Friday, apart from the ordinary sending at the end of the Sunday), instead of spreading a certain delay from week to week. http://www.zennio.com Technical Support: http://zennioenglish.zendesk.com 30 KES 3xSingle-Phase On the other hand, it must be also remarked that bus failures will reset the timing for the periodical sending of objects, which is anyway conditioned to the behaviour described in the two previous examples. Example V: A security sending is parameterised for every six hours. A parameter download takes place at 9:25h am, after which the internal clock is set to the current time. When it is 3:00h pm, the first periodical sending happens. After that, at 5:15h pm, a bus failure takes place (or, alternatively, the device is turned off for a few minutes). At 5:25h pm the voltage is recovered and the internal clock is set again to the current time (otherwise, it would assume that it is still 5:15h pm). Since the voltage failure has caused a reset in the timing of the periodical sending, the next security sending will happen at 11:00h pm, even if the previous one had taken place at 3:00h pm. Finally, and for a better comprehension of the behaviour of KES under hour changes (such as summer to winter & winter to summer hour corrections) or under consecutive time sets during tests, it is important to note that the timers in KES do not really count the number of hours going by, but the number of forward hour changes. Of course, all considerations that have already made will also apply here, as shown in the following examples: Example VI: A periodic sending has been parameterised for every three hours and a parameter download takes place at 9:25h am, after which the internal clock of KES is set to the current time. Five minutes later, the clock is again set, in this case to 10:15h am. A few seconds later, it is set to 1:38h pm. And a little later, it is set to 5:06h pm. Immediately after this time change, the device will throw the first periodic sending. The reason is that, according to KES, three forward hour changes have taken place since it began working: the first one, from 9h to 10h; the second one, from 10h to 1h; and the third one, from 1h to 5h. Note that if no more fictitious time changes are forced after setting the clock to 5:06h, the device will execute the second security sending when its internal clock shows 8:00h pm. Moreover, as stated before, after midnight the periodic timer will be set to zero, so the first sending of the next day will take place at 3:00h am. http://www.zennio.com Technical Support: http://zennioenglish.zendesk.com 31 KES 3xSingle-Phase Example VII: A periodic sending has been parameterised for every three hours. The device has been turned on and the internal clock has been correctly set. As soon as it is 3:00h am the periodic sending takes place. However, assuming that Today is the day when the clock jumps backward an hour for daylight saving (Summer to Winter time switch), after such sending the external KNX clock will send an order to the internal clock to jump back to 2:00h am. This backtracking does not affect the timing of the periodic sending, however. Once it is 3:00h am again, the device does consider that a new forward hour change has taken place (as it has actually happened). Because of this, the next periodic sending will take place at 5:00h am (which would be 6:00h am if no backtracking had happened). Finally, after the next midnight, the timers will be reset again, so there will not be a sending at 5:00h am anymore, but at 6:00h am. http://www.zennio.com Technical Support: http://zennioenglish.zendesk.com 32 KES 3xSingle-Phase ANNEX II: FURTHER EXAMPLES With the aim of making clear how KES works and of presenting the multiple parameterisable communication objects in their context, a few more examples will be offered next. They are intended to cover most of the doubts that may rise during the initial contact with the device. Of course, these examples are complemented with those already included in ANNEX I: Time Management. Note: a few seconds of sampling are always needed by KES before most of the objects and variables are updated. If for testing / simulation purposes several hour changes are forced with less than 5 seconds between them, KES may report incorrect or null values through the objects sent to the bus (such as “Last hour Energy Consumption”). Example I: total consumption. The simplest application of KES consists in simply calculating total consumptions. In that case, it would be enough to parameterise something like the following: General screen: only one tariff, with a cost of 15 cents per kWh, and a CO2 ratio of 50. Voltage, the one corresponding to the system. Power factor, 100. Cyclic sending disabled. Active Energy screen: values 5, 0 and 0 for section “Estimated Energy Consumption”. Values 5, 0 and 0 for section “Estimated Cost”. Parameters “Daily Energy Consumption”, “Daily Cost”, “Monthly Energy Consumption” and “Monthly Cost”, enabled. All other parameters, disabled. Active Power screen: values 5, 0 and 0 for section “Instantaneous Power” and 10, 0 and 0 for “Hourly Peak Power”. All other parameters, disabled. In such circumstances, KES will perform the following functions: 1) Sending every midnight the “Daily Energy Consumption” and “Daily Cost” objects, expressed in kWh and monetary units, respectively. 2) Sending, on the 1st day of every month at 0:00h am, the “Monthly Energy Consumption” and “Monthly Cost” objects, expressed in kWh and monetary units respectively. http://www.zennio.com Technical Support: http://zennioenglish.zendesk.com 33 KES 3xSingle-Phase For simplicity, the probes can be supposed to be measuring the consumption of a 100watt three-phase machine throughout a certain month with 22 workable days –during which the machine stays on between 8:00h in the morning and 6:00h in the afternoon– and 8 non-workable days –during which the machine remains off–. In such case: 1) Every midnight, the “Dialy Energy Consumption” object is sent to the bus with value “0” when the previous day has been non-workable, or (8h * 0.100 kW) = 0.8 kWh if workable, while the “Daily cost” object will have a value of “0” after a non-workable day and of (0.8 kWh * 0.15 m.u.) = 0.12 monetary units after any other day. 2) After every last day of a month, at midnight, the “Monthly Energy Consumption” object sent to the bus will have a value of (0 kWh * 8 days) + (0.8 kWh * 22 days) = 17.6 kWh, while the “Monthly Cost” will be (17.6 kWh * 0.15) = 2.64 monetary units. This way, after every month KES will automatically estimate in what grade the machine contributed to the consumption and to the electric expenses. Alternatively, if desired, the Security Sending function can be enabled from the General screen, which allows re-sending the last daily and/or monthly values, so that not only are they sent every day at midnight or on every 1st day of a month (respectively), but also successively on later occasions. Last, there is always the possibility of making global or local requests (through the “Global Request” and “Request”) objects at the end of the month so that KES reports the value of “the Total cost” and of the “Total Energy”. This procedure is somehow similar to reading the ordinary counter installed by the power supplier: it would be enough to calculate the difference between the current value of “Total Energy” and that from the last month in order to obtain the monthly consumption (in the case of this example, the consumption made by the machine). Note: objects related to energy consumption always report their values (although objects related to cost or CO2 emissions do not) rounded to the nearest integer. That is why the 0.8 kWh mentioned in the above example may show as 1 kWh, although the 0.8 kWh are actually considered as such for calculation. http://www.zennio.com Technical Support: http://zennioenglish.zendesk.com 34 KES 3xSingle-Phase Example II: measuring disabled. Four different cases are presented next in relation to how KES works when the measurement has been disabled: CASE 1 Let a power consumption of 3 kW happen during 24h. If 12h 3 kW 24h measurements are permanently enabled, at the end of the day: Daily Energy Consumption = 72 kWh Average Daily Energy Consumption = 72 / 24 = 3 kWh 3 kW If during the rest of the week measurements are left enabled and the power consumption keeps being 3 kW: Weekly Energy Consumption = 504 kWh Average Weekly Energy Consumption = 504 / 7 = 72 kWh CASE 2 12h 3 kW Similar situation, but one of the days the measurement stays X 24h disabled for 12 hours (no matter which). In such case, that day: Daily Energy Consumption = 36 kWh Average Daily Energy Consumption = 36 / 12 = 3 kWh 3 kW If the measurement is left enabled for the rest of the week and the power consumption remains at 3 kW, then when the week ends: Weekly Energy Consumption = 468 kWh Average Weekly Energy Consumption = 468 / 7 = 66.85 kWh ≈ 67 kWh CASE 3 Similar situation, but one of the days the measurements are left XX 12h 3 kW 24h 3 kW disabled during the whole day. In such case, that day: Daily Energy Consumption = 0 kWh Average Daily Energy Consumption = 0 kWh If measuring is enabled again for the rest of the week and the power consumption remains at 3 kW, that particular day will not be taken into account when the week ends: Weekly Energy Consumption = 432 kWh Average Weekly Energy Consumption = 432 / 6 = 72 kWh ≈ 67 kWh http://www.zennio.com Technical Support: http://zennioenglish.zendesk.com 35 KES 3xSingle-Phase CASE 4 In the case of having no consumption during a whole day (note that a null consumption is a very remote situation) although the 12h 0 kW 24h measurement stayed enabled, KES will do take into account that day for the weekly calculation. For example, assume that there 0 kW was a daily consumption of 72 kWh during the rest of the week: Daily Energy Consumption = 0 kWh Average Daily Energy Consumption = 0 / 24 = 0 kWh Weekly Energy Consumption = 432 kWh Average Weekly Energy Consumption = 432 / 7 ≈ 62 kWh A particular case is that of having, during one day, a total CASE 5 consumption of zero (note that such situation is quite improbable) and the measurement enabled for only a few X 12h 0 kW 24h 0 kW hours. In that case, for weekly calculation, that day will only be taken into account if, during the day change, the measurement is found to be active. If measuring stays disabled that day only from 7h am to 1h pm: Daily Energy Consumption = 0 kWh Average Daily Energy Consumption = 0 / 18 = 0 kWh Weekly Energy Consumption = 432 kWh Average Weekly Energy Consumption = 432 / 7 ≈ 62 kWh If measuring stays disabled that day only between 7h pm and 12h pm: Daily Energy Consumption = 0 kWh Average Daily Energy Consumption = 0 / 19 = 0 kWh Weekly Energy Consumption = 432 kWh Average Weekly Energy Consumption = 432 / 6 = 72 kWh (Assume, for the remaining six days in the week, measurement enabled and daily consumption of 72 kWh). http://www.zennio.com Technical Support: http://zennioenglish.zendesk.com 36 KES 3xSingle-Phase Example III: measuring disabled. While measuring the electric consumption of a certain device that remains always turned on and that consumes 200 W constantly, the measurement is left enabled between 0:00h am and 11:00h am on Monday. Exactly at 11:00h am, it is deactivated through the “Disable” object. When it gets to midnight, KES will consider that the total consumption during the day has been 2.2 kWh (that is, 200 watts constantly during 11 hours, since there was no measuring between 11:00h am and midnight) and that the average daily consumption has been 200 watts per hour (2.2 kWh / 11 hours). Exactly after midnight, the measurement is enabled again and remains this way indefinitely, measuring a 200 Wh consumption every hour. When the week is over (after midnight from Sunday to Monday) the earlier Monday will be considered as a regular day in order to calculate the average weekly consumption per day. In other words: - Weekly consumption = 2.2 kWh + (6 days x (0.2 kW x 24 hour)) = 31 kWh. - Average weekly consumption = 31 kWh / 7 days = 4.43 kWh per day. Suppose the device whose consumption is being measured now stays turned on only on Tuesday, Thursday and Saturday and that the measurement is always enabled. In that case, there will be a consumption of 0 kWh on Monday, Wednesday, Friday and Sunday. The total consumption for Tuesday, Thursday and Saturday will be (3 days x (0.2 kW x 24 hours)) = 14.4 kWh. However, once the week is over, the average weekly consumption will be 14.4 kWh / 7 days = 2.06 kWh. The division is by 7 because the measurement stayed enabled during seven day forward changes, including those in which there was a consumption of exactly zero. Example IV: measuring disabled. Suppose the energy consumption of an office is going to be monitored. Most of everyday consumption takes place during the 8 working hours, and although there is not a consumption of exactly 0 kWh during the rest of the day, it is not going to be measured. To achieve this, a case similar to #2 in Example 2 must be considered. Enabling the measurement only during for 8 hours a day will cause that any http://www.zennio.com Technical Support: http://zennioenglish.zendesk.com 37 KES 3xSingle-Phase consumption made during the other 16 hours is discarded, and that the average daily consumption is obtained by dividing by 8 (not 24). Regarding weekly and monthly values, only those days in which not only there was a null total consumption but also the measurement was detected disabled at the end of the day (midnight) will be discarded. Example V: tariffs. Let the following tariff parameterisation be downloaded to KES: - Initial value for Tariff 1: 15 (cents) - Initial value for Tariff 2: 16 (cents) - Initial value for Tariff 3: 0 (cents) - Initial value for Tariff 4: 0 (cents) Assume an instant power consumption of 2 kW and that KES gets switched on at midnight. 1) The estimated cost will be: 2 kW * 24h * 0.15 m.u. = 7.2 monetary units. 2) When it’s 1:00h, the last hour cost will be 2 kW * 1h * 0.15 m.u. = 0.30 m.u. 3) At 1:22h, if a “1” is sent through “Switch to Tariff 2”, the estimated cost will become 2 kW * 24h * 0.16 m.u. = 7.68 monetary units. 4) At 2:00h, the last hour cost results to be 2 kW * 1h * 0.16 m.u. = 0.32 m.u. As shown, the hourly cost has been rounded by applying the new tarif). 5) At 2:33h, a “1” is sent through “Switch to Tariff 3”. 6) When it’s 3:00h, the last hour cost is 2 kW * 1h * 0 m.u. = 0 m.u. As shown, setting the initial value of a tariff as zero does not disable it; for effectively disabling it, it is necessary to leave the “Switch to Tariff x” object unlinked. 7) At 3:14h, the value 0.20 (m.u.) is sent through “Tariff 3”. 8) When it’s 4:00h, the last hour cost will be 2 kW * 1h * 0.20 m.u. = 0.4 m.u. http://www.zennio.com Technical Support: http://zennioenglish.zendesk.com 38 KES 3xSingle-Phase Example VI: power factor. Assume a system where the power factor is 90%, i.e., where 10% of the effective energy (the power supplied by the electric company) is not actually converted into active (or useful) energy, that is, consumed by the devices. If a power factor of 90% is parameterised, the values sent by KES to the bus in relation to power and energy will correspond to those actually consumed by the system, although the amount of the effective energy that is really transmitted by the monitored line is a bit higher. If a power factor of 100% is parameterised, KES will consider the total energy detected in the line, without applying the pertinent corrections to discard the portion of energy that is not actually consumed. A parameterisation with a power factor of 80% will cause an excessive correction made by KES, which will send the bus smaller values than the effective ones and also than the active ones. Example VII: power limits. Assume a Power Limit parameterisation as follows: Upper limit: Initial Value = 200 (tens of watts) When Over Limit, Send = 1 Send Object when Under Limit = Yes Hysteresis Under Limit = 20 (tens of watts) Lower limit: Initial Value = 100 (tens of watts) When Under Limit, Send = 1 Send Object when Over Limit? = Yes Hysteresis Over Limit = 20 (tens of watts) Under this parameterisation, the following can be tested: http://www.zennio.com Technical Support: http://zennioenglish.zendesk.com 39 KES 3xSingle-Phase 1) As soon as the instant power is over 2 kW, a “1” will be sent through “OverConsumption Alarm”. 2) If the value goes down to 1.92 kW, nothing will happen. Nothing will happen either if it goes over 2 kW again. 3) If the value decreases to 1.78 kW, the inverted value (“0”) will be sent through “Over-Consumption Alarm”. If after that it increases again to over 2 kW, one “1” will be sent through the same object. 4) If the value now goes to 0.95 kW, one “0” will be first sent through “OverConsumption Alarm” and, afterwards, one “1” through “Low consumption indicator”. 5) A new value of 1.05 kW will not have an effect, nor will a later decrease to 0.95 kW. 6) If the instant power goes to 1.25 kW, the inverted value (a “0”) will be sent through “Low Consumption Indicator”. If it goes then under 1 kW, one “1” will be sent through the same object. 7) Finally, if the values “3.0” and “4.0” are sent through objects “Lower Limit” and “Upper Limit” respectively, it will become necessary that the power goes over 3.20 kW before a “0” is sent through “Low Consumption Indicator”, and that it goes over 4 kW before a “1” is sent through “Over-Consumption Alarm”. Note: Special care must be taken when writing to objects “Upper Limit” and “Lower Limit”. Values which are too close (enough to have a difference smaller than the defined margin bands) or that do not satisfy the condition Lupper> Llower will cause behaviours with no practical sense. http://www.zennio.com Technical Support: http://zennioenglish.zendesk.com 40 KES 3xSingle-Phase Example VIII: global test. This practical example aims to simulate in only a few minutes how KES would work in a longer time lapse (several hours, several days and several weeks). At the end of the example a small graph has been included to show the hour, day and week changes that are being simulated. To begin with, the following ETS parameterisation is assumed: General screen: all cyclic and security sendings, enabled and with the shortest cycle time (i.e., the most frequent) selected: every hour or every day, depending on the case. Only one tariff, with a cost of 5000 (cents of the local currency) per kWh and a CO2 ratio of 50. Regarding the voltage, the one corresponding to the system. And a power factor of 100. Active Energy screen: values 5, 30 and 0 for section “Estimated Energy Consumption”. Values 5, 30 and 0 for section “Estimated Cost”. Any other parameters, enabled. Active Power screen: values 5, 30 and 0 for section “Instantaneous Power”. Values 10, 30 and 0 for section Hourly peak power. Any other parameters, enabled. After downloading the parameters, the internal time should be set to 9:00h am, and the internal date to the first Monday of the current month. 1) Connect, for example, a 2000 W load: 30 seconds after the time set, the Instantaneous Power object will be sent to the bus, with a value of 2 kW. Estimated Energy Consumption ≈ 48 kWh. This is calculated by multiplying 2 KW by 24 hours, which indicates the estimated daily consumption assuming the current instant power as constant. Estimated Cost ≈ 2400 monetary units. This is obtained by multiplying 48 kWh by the parameterised 50 monetary units. Hourly Peak Power ≈ 2 kW This is the highest value of the instant power detected till now since the time set. http://www.zennio.com Technical Support: http://zennioenglish.zendesk.com 41 KES 3xSingle-Phase 2) After 5 minutes since 1), replace the 2000 W load with a 3000 W load and after a few seconds disconnect it, letting the consumption be null. The next Hourly Peak Power (which is sent every 30 seconds) will be 3 kW. 3) After 5 minutes since 2), connect back the 2000 W load and set the internal clock at 10:00h am. After the time change, the object Last Hour Energy Consumption will be sent, containing a value of 1 kWh. According to the device, the last hour only lasted for ten minutes, during five of which there was a consumption of 2 kW while during the remaining five minutes there was a consumption of 0 kW. Therefore, KES estimates that between 9:00h and 10:00h there should have been, proportionally, a consumption of 1 kWh. Last Hour Cost ≈ 50 monetary units. 50 is the cost corresponding to the kilowatt-hour that was estimated by the device for the period 9:00h to 10:00h. 4) After some minutes since 3), set the internal clock to next Tuesday (any time would be OK), maintaining the 2000 W load. Daily Energy Consumption = 3. According to the device, last Monday only lasted for two hours (each of which lasted itself for only a few minutes, although not the same amount in both cases), the first one with a consumption of 1 kWh and the second one with a consumption of 2 kWh. This is why the total consumption for Monday is estimated to be 1 kWh + 2 kWh = 3 kWh. Daily Cost ≈ 150 monetary units. 3 kWh * 50 m.u. = 150 m.u. Daily CO2 Emissions ≈ 1.5 kg Obtained as (50 kg * 0.01) * 3 kWh. Daily Peak Power ≈ 3 kW. This is the highest instant power value detected during the previous day. Average Daily Energy Consumption = 2 kWh. http://www.zennio.com Technical Support: http://zennioenglish.zendesk.com 42 KES 3xSingle-Phase This value represents the energy amount that, as an average, was consumed per hour during the previous day. Considering that objects related to energetic consumption are always rounded to the closest integer, this “2” is consistent with the result of dividing the 3 kWh consumed on Monday by the number of hours of that day (two). Average Daily CO2 Emissions ≈ 0.75. This value is the result of (50 kg * 0.01) * 3 kWh / 2 hours. Average Daily Cost ≈ 75 monetary units. This object indicates the cost that, as an average, will be paid per hour for the energy consumption of Monday. The value sent through this object is obtained with the following equation: 3 kWh * 50 monetary units / 2 hour 5) After some minutes since 4), set the internal clock to next Monday (any time would be OK), maintaining the 2000 W load. Weekly Energy Consumption = 5. According to the device, the last week was only 2 day long (with a different amount of hours each and with a different length each of these hours). That is why KES estimates that the total consumption for the week was 3 kWh from Monday and 2 kWh from Tuesday. Weekly Cost ≈ 250 monetary units. 5 kWh * 50 m.u. = 250 m.u. Weekly CO2 emissions ≈ 2.5 kg. Obtained as (50 kg * 0.01) * 5 kWh. Average Daily Energy Consumption = 2 kWh. According to the device, the previous day lasted only for one hour (with a consumption of 2 kWh). Therefore, the average daily consumption was 2 kWh / 1 hour = 2 kWh per hour. Average Daily CO2 Emissions ≈ 0.5 kg. This value is the result of calculating (50 kg * 0.01) * 2 kWh / 1 hour. http://www.zennio.com Technical Support: http://zennioenglish.zendesk.com 43 KES 3xSingle-Phase Average Daily Cost ≈ 100 monetary units. Obtained by multiplying 2 kWh by 50 monetary units, and dividing this by the only hour of the previous day. Weekly Peak Power ≈ 3 kW. Average Weekly Energy Consumption = 3 kWh Obtained by rounding to the nearest integer value the result of dividing the 5 kWh consumed during the previous week by the number of days of the week Average Weekly CO2 Emissions ≈ 1.25. This value comes from operating (50 kg * 0.01) * 5 kWh / 2 days. Average Weekly Cost ≈ 125 monetary units. 5 kWh were consumed at 50 monetary units per kWh, which is then divided by the two days of the previous week 6) After some minutes since 5), set the internal clock to next Monday (any time would be OK), maintaining the 2000 W load. Since the previous week contained only one day, the objects Daily Energy Consumption and Weekly Energy Consumption must have the same value, 2 kWh in this case. Average Weekly Energy Consumption = 2 kWh per day. 2 kWh in total / 1 day = 2 kWh per day. Average Weekly CO2 Emissions ≈ 1 kg per day. (50 kg * 0.01) * 2 kWh / 1 day = 1. Average Weekly Cost ≈ 100 monetary units per day. 2 kWh * 50 monetary units / 1 day = 100 m.u. Weekly Peak Power ≈ 2 kW. 7) After some minutes since 6), set the internal clock to the first day of the next month, maintaining the 2000 W load. Monthly Energy Consumption = 9 kWh. http://www.zennio.com Technical Support: http://zennioenglish.zendesk.com 44 KES 3xSingle-Phase Obtained by summing up (and rounding to the nearest integer value) 5 kWh from the first week of the previous month, plus 2 kWh from the second week, plus 2 kWh from the third one. Monthly Cost ≈ 450 monetary units. Obtained by multiplying 9 kWh by 50 monetary units. Monthly CO2 Emissions ≈ 450 monetary units. In other words, (50 kg * 0.01) * 9 kWh. Monthly Peak Power ≈ 3 kWh. This value is due to the temporary connection of the 3000 W load. Average Monthly Energy Consumption = 2 kWh per day. 2 is the nearest integer to the result of dividing 9 kWh by the number of days (4) of the previous month. Average Monthly Cost ≈ 112.5 monetary units per day. 50 u.m * 9 kWh / 4 days = 112.5 m.u. Average Monthly CO2 Emissions ≈ 1.125 kg per day. Obtained as (50 kg * 0.01) * 9 kWh / 4 days. 8) After some minutes since 7), set the internal clock to the first day of the following month (i.e., two months from now on), maintaining the same load. Monthly Peak Power ≈ 2 kW. Average Monthly Energy Consumption = 2 kWh per day. The previous month consisted of only one hour, with a consumption of 2 kWh. This total consumption is then divided by only one day. Average Monthly Cost ≈ 100 m.u. per day. Those 2 kWh consumed throughout the month have an associated cost of 50 u.m each. Then, this is divided by only one day. Average Monthly CO2 Emissions ≈ 1 kg. per day. (50 x 0.01) * 2 kWh / 1 day = 1. http://www.zennio.com Technical Support: http://zennioenglish.zendesk.com 45 KES 3xSingle-Phase Simulation scheme (Example VIII) Month 1 WEEK 1 Monday 2 kW 0 kW 2 kW |–––––– |––––––||–––––– | 5’ 5’ Daily Consumption = 1 kWh + 2 kWh = 3 kWh 5’ 2 kW Tuesday |––––––| Daily Consumption = 2 kWh WEEK 2 2 kW Monday |–––––– | Daily Consumption = 2 kWh WEEK 3 2 kW Monday |–––––– | Daily Consumption = 2 kWh Monthly Energy Consumption = 9 KWh. Average Monthly Energy Consumption = 9 KWh / 4 days = 2.25 KWh per day. Month 2 WEEK 1 2 kW First day |––––––| Daily Consumption = 2 kWh Monthly Energy Consumption = 2 KWh. Average Monthly Energy Consumption = 2 KWh / 1 day = 2 KWh per day. http://www.zennio.com Technical Support: http://zennioenglish.zendesk.com 46 KES 3xSingle-Phase ANNEX III: COMUNICATION OBJECTS “Functional range” shows the values that, with independence of any other values permitted by the bus according to the object size, may be of any use or have a particular meaning because of the specifications or restrictions from both the KNX standard or the application program itself. “1st boot” shows the cases where an object is assigned a certain value by the application program after a device download or a full reset. In case the value of such assignment can be parameterised, √ is shown in column “P”. Objects showing a hyphen (-) are not assigned a particular value and therefore can be assumed to be initialised with the value “0” or with the corresponding updated value in case they depend on an external element (sensors, etc.). Moreover, if the object is sent (or is there an option to send it) to the bus (write or read requests) after a download or a device reset from ETS, the marks (W) or (R) will be shown, respectively for transmissions or read requests. “Reboot” shows the cases where an object is assigned a certain value by the application program after a bus power failure. In case the value of such assignment can be parameterised, √ is shown in column “P”. Objects showing a hyphen (-) are not assigned a particular value and therefore can be assumed to maintain their previous value after the failure or with the corresponding updated value in case they depend on external elements (sensors, etc.). Moreover, if the object is sent (or is there an option to send it) to the bus (write or read requests) after a bus failure, the marks (W) or (R) will be shown, respectively for transmissions or read requests. Number Size I/O Flags Data Type (DPT) Functional Range 1st boot 0 3 Bytes I CT-WU DPT_TimeOfDay 00:00:00 - 23:59:59 0:00 (R) - (R) 1 3 Bytes I CT-WU DPT_Date 01/01/1990 - 31/12/2089 1/1/90 (R) - (R) Date Current Date 2 1 Bit I C--W- DPT_Reset 0/1 - - Global Reset 0=No Action; 1=Reset 3 1 Bit I C--W- DPT_Trigger 0/1 - - Global Request 0=No Action; 1=Request 4 1 Bit I C--W- DPT_Reset 0/1 - - Partial Reset 0=No Action; 1=Reset 5 1 Bit I C--W- DPT_Trigger 0/1 - - Request 0=No Action; 1=Request 6 1 Bit I C--W- DPT_Enable 0/1 - - Disable 0=Disable; 1=Enable 7 - 10 2 Bytes I C--W- Non-standardized DPT - 670760.00 - 670760.00 - - Tariff x Tariff value 11 - 14 1 Bit I C--W- DPT_Trigger 0/1 - - Switch to Tariff 4 0=No Action; 1=Switch Tariff 15 4 Bytes O CTR-- DPT_ActiveEnergy_kWh -2147483648 - 2147483647 - - Estimated Energy Consumption Estimated Energy Consumption 16 2 Bytes O CTR-- Non-standardized DPT - 670760.00 - 670760.00 - - Estimated Cost Estimated Cost 17 4 Bytes O CTR-- DPT_ActiveEnergy_kWh -2147483648 – 2147483647 - - Last Hour Energy Consumption Last Hour Energy Consumption 18 2 Bytes O CTR-- Non-standardized DPT - 670760.00 - 670760.00 - - Last Hour Cost Last Hour Cost 19 4 Bytes O CTR-- DPT_ActiveEnergy_kWh -2147483648 – 2147483647 - - Daily Energy Consumption Daily Energy Consumption 20 2 Bytes O CTR-- Non-standardized DPT - 670760.00 - 670760.00 - - Daily Cost Daily Cost http://www.zennio.com P √ Reboot P Name Time Function Current Time Technical Support: http://zennioenglish.zendesk.com 47 KES 3xSingle-Phase Number Size I/O Flags Data Type (DPT) Functional Range 1st boot 21 2 Bytes O CTR-- Non-standardized DPT - 670760.00 - 670760.00 - P - Daily CO2 Emissions Daily CO2 Emissions 22 4 Bytes O CTR-- DPT_ActiveEnergy_kWh -2147483648 – 2147483647 - - Average Daily Energy Consumption Avg. Daily Energy Consumption 23 2 Bytes O CTR-- Non-standardized DPT - 670760.00 - 670760.00 - - Average Daily Cost Average Daily Cost 24 2 Bytes O CTR-- Non-standardized DPT - 670760.00 - 670760.00 - - Average Daily CO2 Emissions Average Daily CO2 Emissions 25 4 Bytes O CTR-- DPT_ActiveEnergy_kWh -2147483648 – 2147483647 - - Weekly Energy Consumption Weekly Energy Consumption 26 2 Bytes O CTR-- Non-standardized DPT - 670760.00 - 670760.00 - - Weekly Cost Weekly Cost 27 2 Bytes O CTR-- Non-standardized DPT - 670760.00 - 670760.00 - - Weekly CO2 Emissions Weekly CO2 Emissions 28 4 Bytes O CTR-- DPT_ActiveEnergy_kWh -2147483648 - 2147483647 - - Average Weekly Energy Consumption Average Weekly Energy Cons. 29 2 Bytes O CTR-- Non-standardized DPT - 670760.00 - 670760.00 - - Average Weekly Cost Average Weekly Cost 30 2 Bytes O CTR-- Non-standardized DPT - 670760.00 - 670760.00 - - Average Weekly CO2 Emissions Average Weekly CO2 Emissions 31 4 Bytes O CTR-- DPT_ActiveEnergy_kWh -2147483648 - 2147483647 - - Monthly Energy Consumption Monthly Energy Consumption 32 2 Bytes O CTR-- Non-standardized DPT - 670760.00 - 670760.00 - - Monthly Cost Monthly Cost 33 2 Bytes O CTR-- Non-standardized DPT - 670760.00 - 670760.00 - - Monthly CO2 Emissions Monthly CO2 Emissions 34 4 Bytes O CTR-- DPT_ActiveEnergy_kWh -2147483648 - 2147483647 - - Average Monthly Energy Consumption Average Monthly Energy Cons. 35 2 Bytes O CTR-- Non-standardized DPT - 670760.00 - 670760.00 - - Average Monthly Cost Average Monthly Cost 36 2 Bytes O CTR-- Non-standardized DPT - 670760.00 - 670760.00 - - Average Monthly CO2 Emissions Average Monthly CO2 Emissions 37 4 Bytes CT--- DPT_ActiveEnergy_kWh -2147483648 - 2147483647 - - Total Energy Total Energy Consumption 38 2 Bytes CT--- Non-standardized DPT - 670760.00 - 670760.00 - - Total Cost Total Cost 39 2 Bytes CT--- Non-standardized DPT - 670760.00 - 670760.00 - - Total CO2 Emissions Total CO2 Emissions 40 2 Bytes O CTR-- DPT_Power -670760 - 670760 kW - - Instantaneous Power Instantaneous Power 41 2 Bytes O CTR-- DPT_Power -670760 - 670760 kW - - Hourly Peak Power Hourly Peak Power 42 2 Bytes O CTR-- DPT_Power -670760 - 670760 kW - - Daily Peak Power Daily Peak Power 43 2 Bytes O CTR-- DPT_Power -670760 - 670760 kW - - Weekly Peak Power Weekly Peak Power 44 2 Bytes O CTR-- DPT_Power -670760 - 670760 kW - - Monthly Peak Power Monthly Peak Power 45 2 Bytes I C--W- DPT_Power -670760 - 670760 kW - - Upper Limit Upper Limit value 46 1 Bit O CTR-- DPT_Trigger 0/1 - - Over-consumption Alarm Alarm -> Sending of "0" or "1" 47 2 Bytes I C--W- DPT_Power -670760 - 670760 kW - - Lower Limit Lower Limit value - √ √ Reboot P Name Function 48 1 Bit O CTR-- DPT_Trigger 0/1 - Low Consumption Indicator Ind. -> Sending of "0" or "1" 49 - 64 1 Bit I C--W- DPT_Switch 0/1 - - [LF] (1 bit) Data Entry 1 Binary Data Entry (0/1) 65 - 72 1 Byte I C--W- DPT_Value_1_Ucount 0 - 255 - - [LF] (1 byte) Data Entry 8 1 byte Data Entry (0-255) 73 - 80 2 Bytes I C--W- DPT_Value_2_Ucount 0 - 65535 - - [LF] (2 bytes) Data Entry 1 2 bytes Data Entry 81 - 85 1 Bit O CTR-- DPT_Switch 0/1 - - [LF] Function 5 RESULT (1 bit) FUNCTION 5 Result 86 - 90 1 Byte O CTR-- DPT_Value_1_Ucount 0 - 255 - - [LF] Function 1 RESULT (1 byte) FUNCTION 1 Result 91 - 95 2 Bytes O CTR-- DPT_Value_2_Ucount 0 - 65535 - - [LF] Function 5 RESULT (2 bytes) FUNCTION 5 Result http://www.zennio.com Technical Support: http://zennioenglish.zendesk.com 48 Join and send us your inquiries about Zennio devices: http: //zennioenglish.zendesk.com Zennio Avance y Tecnología S.L. C/ Río Jarama, 132. Nave P-8.11 45007 Toledo (Spain). Tel. +34 925 232 002. Fax. +34 925 337 310. www.zennio.com [email protected]