1
US007917233B2
(12) Ulllted States Patent
(10) Patent N0.:
Junk et a].
(54)
US 7,917,233 B2
(45) Date of Patent:
LEAD-LAG FILTER ARRANGEMENT FOR
(56)
*Mar. 29, 2011
References Cited
ELECTRO-PNEUMATIC CONTROL LOOPS
(75)
U.S. PATENT DOCUMENTS
4,417,312 A
11/1983 Cronin et a1.
Inventors: Kenneth William Junk, MarshalltoWn,
IA (US); Annette L. LatWesen,
2
5
Marshamown’ IA (Us)
(73) Assignee: Fisher Controls International LLC, St.
Louis, MO (US)
ml
a
rova
~
.
~
( ) Notice.
~
~
-
4,808,126 A *
2/1989
5,043,863 A
5,195,028 A
8/1991 Brisstgil er 31,
3/1993 Hiroi
5,394,322
Subject‘ to any disclaimer, the term ofthis
2/1995
5,406,474 A
C
Hansen
t.
d
( on “we )
This patent is subject to a terminal disclaimer.
FOREIGN PATENT DOCUMENTS
EP
0 869 104 A1
10/1998
(Continued)
(21) App1.N0.: 12/556,036
OTHER PUBLICATIONS
5911- 9, 2009
(65)
................... .. 439/607.18
4/1995 Hansen
U.S.C. 154(b) by 0 days.
Filed:
W'l
12/1993 Hayes
A
patent is extended or adjusted under 35
(22)
.
2/1989 Rodems
5,272,647 A
*
e
4,805,126 A
Instruction Manual, Form 5122, Aug. 2003, Type 2625 and 2625NS
Volume Boosters (12 pages).
Jack L. Johnson, RE, “The Final Word on Non-symmetrical Valves,”
Hydraulics and Pneumatics, Oct. 2003 (3 pages).
Prior Publication Data
US 2009/0326682 A1
Dec. 31, 2009
(Continued)
Related US‘ Application Data
(63)
Primary Examiner * Kidest Bahta
Continuation of application No. 10/595,116, ?led as
application NO. PCT/US2005/037810 011 Oct. 20,
2005, noW Pat. No. 7,593,802.
(74) Attorney/Agent] OrFirm * Marshall, Gersteimg‘ Borun
LLP
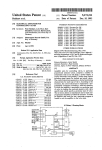
(57)
ABSTRACT
(60) Provisional application No. 60/620,537, ?led on Oct.
A lead'lag input ?lter is Connected ahead of a_ Positioner
20s 2004, provisional application NO_ 60/6 5 2,546’
feedback loop having one or more valve accessories, such as
?led on Feb 14, 2005'
a volume booster or a QEV, to overcome sloW dynamics
Int_ CL
G06F 19/00
(200601)
us. Cl. .......................................... .. 700/28- 700/65
change control or set point signals. A user interface is con
nected to the lead-lag input ?lter and enables an operator or
ether eemrel Persenne1 ‘0 View and ehenge the Operating
experienced by the accessories When receiving loW amplitude
(51)
(52)
(58) Field of Classi?cation Search
700/1’ 29*37
characteristics of the lead-lag input ?lter to thereby provide
/24. 3137/82?
the control loop With any of a number of desired response
700/55 71*74 65
701/66, 138, 105, 45, 101, 120
See application ?le for complete search history.
50 Tram, 5e,
4-2QmA
30
charactensncs
22 Claims, 5 Drawing Sheets
90 94 110 00
Pomt
55
175
1
Volume
Reference 115“
7+
10
55
I
l
Actuator
-—--
K
TQS+1 —\
,
.
ELead-Lag 20
~
Elnput Filter
:
UP
> Relay ~> Boosters! -> - — — -
8- Valve
A
QEVs
>
\
Forward Path
60
.
Gem
*\
2
Kml
User
100
‘
\105
Minor Loop
lnle?ece
/70
Feedback Gain
1 07
/
40
K
4
ks 1;
95
\7O
Velocity
Feedback Gain
K70
US 7,917,233 B2
Page 2
US. PATENT DOCUMENTS
5,504,608 A
5,504,672 A
5,511,863 A
5,521,824
5,568,389
5,576,976
5,587,896
5,615,593
5,789,987
5,838,561
5,951,240
6,085,940
6,108,609
6,198,246
6,281,650
A
A
A
A
A
A
A
A
A
A
B1
B1
6,330,483 B1
6,453,261
6,466,893
6,760,692
6,862,199
7,349,745
B2
B1
B1
B2
B2
2002/0040284
2002/0055790
2003/0105535
2004/0194101
2006/0012414
2006/0118169
2007/0162214
A1
A1
A1
A1
A1
A1
A1
EP
JP
JP
JP
JP
WO
4/1996 Neeves et al.
4/1996 Hardiman et al.
4/1996 Suh
5/1996
10/1996
11/1996
12/1996
4/1997
8/1998
11/1998
9/1999
7/2000
8/2000
3/2001
8/2001
Eagan et a1.
McLaughlin et al.
White
Hansen etal.
Anderson et al.
Mitteletal.
Owen
Mirsky et al.
Ferri, Jr.
Qian et al.
YutkowitZ
YutkowitZ
12/2001 Dailey
9/2002 Boger et al.
Latwesen et al.
Rose
Escobar et al.
Junk
10/2002
7/2004
3/2005
3/2008
4/2002
5/2002
6/2003
9/2004
1/2006
6/2006
7/2007
Junk
Havekost
Rammler
GlanZer et al.
Goldman
Junk
Junk et a1.
OTHER PUBLICATIONS
Rudolph Muijtjens, “Praktisches Positionieren mit pneumatischen
Linearantrieben,” Olhydraulik und Pneumatik, vol. 42, No. 7, MainZ,
DE (1996); (“Practical Positioning with Pneumatic Linear Drives,”
3031 Oil Hydraulics and Pneumatics, vol. 42, No. 7) (11 pages).
International Preliminary Report on Patentability for International
Application No. PCT/US2005/037810, dated Oct. 20, 2004 (1 page).
“Bridgeview,” User Manual, National Instruments, May 1998 (49
pages).
Tewksbury, “Instruments and Measurements Laboratory Facilities
Lab View Software Tool Suite Capabilities,” Feb. 26, 1999 (7 pages).
International Search Report for International Application No. PCT/
US05/37810, dated Jul. 10, 2006 (3 pages).
Written Opinion for International Application No. PCT/US05/
37810, dated Jul. 10, 2006 (3 pages).
Translation of Chinese Of?ce Action for corresponding Application
No. 200580025123 .x, dated Sep. 5, 2008 (17 pages).
J .B. Calvert, Electronics 12, “The Phase-Locked Loop” (8 pages),
Jul. 22, 2001.
ControlGlobal.com, “Three Alternative Approaches to Better Loop
Control”, (referenced by Examiner in parent case U.S. Appl. No.
10/595,116) (3 pages), 2004.
ControlGlobal.com, “Three Alternative Approaches to Better Loop
Control”, (referenced by Examiner in parent case U.S. Appl. No.
10/595,116) (6 pages), 2005.
Translation of Substantive Examination Report from Argentina
Patent Application No. P05 01 04380, May 5, 1996, Nov. 19, 1996.
“BridgeVIEWTM and LabVIEWTMiPID Control Toolkit for G Ref
erence Manual,” National Instrument (Jan. 31, 1998): URL:http://
FOREIGN PATENT DOCUMENTS
www.ni.com/pdf/manuals/320563b.pdf.
0 869 204
4-000601
7-503082
2000-39901
2002-149207
WO-93/09481
05814806, dated Jun. 11,2010.
Notice of Rejection for Japanese Patent Application No. 2007
538048, dated Nov. 16, 2010.
A1
A
T
A
A
A1
10/1998
1/1992
3/1995
8/2001
5/2002
5/1993
Supplementary European Search Report for Application No.
* cited by examiner
US. Patent
Mar. 29, 2011
Sheet 1 015
US 7,917,233 B2
FIG. 1
so
é-ZfOmA
Trave, 5e, 30
90 94 110 so
x/point
I
ea???‘ 115:}
10
I T28
as
K
6/5
55
1 Volume
IIP
!
> Relay ~> Boosters! +agi'gtg
x A
:
\
§Lead_|_ag 20
Forward Paih
Einput Filter
\
Gain
1
:
Kmi
U ser
ff
50
100
‘
"\105
Minor Lo0p_
,
We ate
/- 70
Feedback Gain
107
r
K 3
<
k R95
\70
Veiociiy
/'
40
Feedback Gain
K70
FIG. 2
130
.
310 31 5 320
,1 I’ /
l
%
U @ (q)
Latency
MW
2201\
230~ W‘ '°P°"‘" r" ck’smg ““
-
'
[éjxasts
/
Filter Response
2.9
K /L1
O Lead-Lag
3.7
1 4
205*“
~ 228
F Options .
0
O NO
LasFitter
200
120
@“iB_” 355
@‘350
@-~s45
@040
Lead/Lag Ratio
10.0:
m
'
O Aysm. Lead-L89
_
aD
___-._-.______
' 9-9 time (sec) 5-9
—Fii1er Coefficients
Q5 :
Lag Time;
_
xxx sec
App|y
214
Reset
216
Opening Ratio: xxx
0.2
Closing Ratio: xxx Q‘
r
2d?
\
260 209
200
\2i2
US. Patent
Mar. 29, 2011
Sheet 3 of5
US 7,917,233 B2
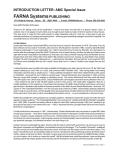
FIG. 4
0 External Stimulus
OVaiveLink Sb'muius (Square Wave)
Nominal Set Point ("1%)
Step Size [%)
Step Hoid Time (sec)
FIG. 7
Instrument Seigp
Setup Wiza Ed
?é?igilize [Optimize
Remota Tuning_____ __
9
Peffomi??ce Tum"
Enhanced Stabilize I Optimize
Lead-Lag Input Fitter
Detailed Setup
I»
Mode
)
Change Protection
Instrument Actions
7»
TraveH Pressure Control
US. Patent
Mar. 29, 2011
Sheet 4 of5
US 7,917,233 B2
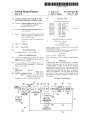
FIG. 5
I
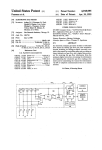
is SELECTED STIMULUS
EXTERNAL STIMULUS?
YES
I
NO
DISABLE DATA ENTRY
FIELDS FOR LEAD-LAG
FILTER COEFFICIENTS
ENABLE DATA ENTRY
FIELDS FOR LEAD-LAG
FILTER COEFFICIENTS
DISPLAY MESSAGE, E.G.:
DISPLAY MESSAGE, E.G.:
"WARNINGzTHE VALVE
WILL TRACK sET PomT.
UK To PROCEED?"
“INTERNAL STIMULUS WILL
cAusE THE VALVE To MOVE.
UK To PROCEED?"
YES
N0
YES
N0
RAMP SET PcRRT T0
VALUE m DATA ENTRY
FIELD FOR NOMINAL
sET POINT, AT RA'FE
0F 10% PER SECOND
I
DISPLAY GRAPH
PROPERTY GRAPHICS
AND INITIATE sTEP
SEQUENCE
US 7,917,233 B2
1
2
LEAD-LAG FILTER ARRANGEMENT FOR
ELECTRO-PNEUMATIC CONTROL LOOPS
such as that shoWn schematically in FIG. 1, illustrating travel
set point plotted against time, and lead-lag ?lter response
plotted against time, When the lead-lag input ?lter is disen
gage/d;
REFERENCE TO RELATED APPLICATIONS
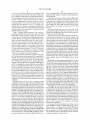
FIG. 4 is an example screen display of a menu enabling a
user to select a stimulus source for the lead/lag ?lter of the
This disclosure is a Continuation ofU.S. patent application
Ser. No. 10/595,116, ?led Feb. 21, 2006, and issued as US.
Pat. No. 7,593,802, Which Was the United States national
control loop and to input values in data entry ?elds When such
?elds are enabled;
stage (under 3 5 U. S.C. §37 1 ) of International Application No.
PCT/U S05/ 37810, having an international ?ling date of Oct.
20, 2005, and is entitled to the bene?t of the ?ling date of US.
ProvisionalApplication Nos. 60/620,537, ?led Oct. 20, 2004,
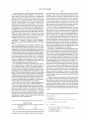
FIG. 5 is a How chart diagramming actions performed and
information displayed as a result of various inputs in a user
interface of an electro-pneumatic control system;
FIG. 6 is a How chart diagramming the status of various
input controls of a user interface in response to particular ?lter
and 60/652,546, ?led Feb. 14, 2005, as to all subject matter
commonly disclosed therein.
type selections; and
FIG. 7 is an example screen display of a menu enabling a
user to select among various instrument control settings,
FIELD OF THE DISCLOSURE
including a setting “Remote Tuning”.
This disclosure relates generally to the ?eld of servo con
trollers for use in logical processes or control loops and, more
particularly, to the augmentation of electro-pneumatic con
trol loops and other logical processes for improvement of
performance of control valves and pneumatic actuator acces
20
DETAILED DESCRIPTION OF THE PREFERRED
EMBODIMENTS
Generally speaking, a lead-lag input ?lter is provided
sories.
ahead of a positioner feedback loop in conjunction With one
BACKGROUND
25 or more valve accessories, such as a volume booster or a QEV,
Electro-pneumatic control systems are increasingly being
to overcome sloW dynamics experienced by the accessories
When receiving loW amplitude change control or set point
employed With process control devices, such as valve actua
tors and piston actuators, in order to provide better or more
optimal control of ?uid Within a process plant. Some such
other control personnel to vieW and change the operating
characteristics of the lead-lag input ?lter to thereby provide
signals. Additionally, a user interface enables an operator or
30
electro-pneumatic control systems include one or more
the control loop With any of a number of desired response
accessories for controlling valve and piston actuators such as
volume boosters and quick exhaust valves (QEVs). A volume
booster, Which is typically coupled to a pneumatic actuator
for a valve, increases the rate of air supplied to the pneumatic
characteristics. Through manipulation of the ratio of lead-to
lag of the lead-lag input ?lter, a process parameter, such as
displacement or travel of a valve stem, may be controlled, and
35
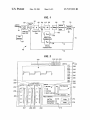
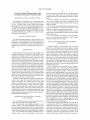
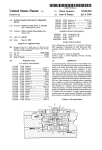
FIG. 1 illustrates a control loop 40, such as an electro
actuator, or increases the rate of air exhausted from the pneu
matic actuator. This increased air movement ampli?es the
pneumatic control loop or other logical process, having a
lead-lag ?lter 20 connected to the input thereof. In particular,
actuator stroke speed, thereby increasing the speed at Which
the actuator is able to stroke the valve plug toWard its open or
closed position, and thus enables the valve to respond more
in particular, ?ne tuned.
a reference control signal 10, such as a 4-20 mA set point
40
signal or control signal generated by a process controller or
quickly to process ?uctuations. Similar to volume boosters,
QEVs increase the speed at Which an actuator is able to stroke
user interface, is applied to the input of the lead-lag input ?lter
a valve toWard an open or closed position.
point or other control signal) to provide a ?ltered output 50
20 Which operates on the reference signal (Which can be a set
Currently, volume boosters are utiliZed With pneumatic
(also called a travel set point signal) to a summer 30 associ
actuators in a manner that makes the actuators move very 45
ated With the electro-pneumatic control loop 40. As illustrated
sloWly in response to very small set point or control signal
changes. In particular, some volume boosters are designed
With a built-in dead band to actually prevent the volume
booster from becoming active in response to small amplitude
change control signals. While some volume boosters have
small dead bands at the loWer amplitude signal range, these
volume boosters still move very sloWly in response to small
in FIG. 1, the summer 30 compares the valve travel With the
travel set point signal 50 to generate an error signal, Which is
provided to an ampli?er or gain unit 90 (called a forWard path
gain unit) Which applies a gain K. The output of the forWard
50
oped by a gain unit 95 and a minor loop feedback gain devel
oped by a gain unit 105 from the output of the forWard path
amplitude signal changes, becoming fast only in response to
larger amplitude input signals.
55
DESCRIPTION OF THE SEVERAL VIEWS OF
THE DRAWING
develop the minor loop feedback gain.
60
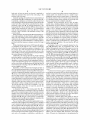
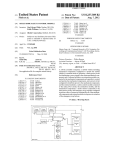
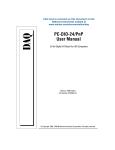
FIG. 2 is an example screen display generated by a user
interface routine of an electro-pneumatic control system,
FIG. 3 is an example screen display generated by a user
interface routine of an electro-pneumatic control system,
The pneumatic output of the relay 85 is provided to the
volume booster or QEV 65. This pneumatic signal is used to
control the valve actuator of an actuator 55 associated With a
such as that shoWn schematically in FIG. 1, illustrating travel
set point plotted against time, and lead-lag ?lter response
plotted against time, When the lead-lag input ?lter is engaged;
gain unit 90. The output 110 of the summer 94 is provided to
a current-to-pressure (I/P) transducer 80 Which develops and
provides a pneumatic or pressure signal to a pneumatic relay
85. As illustrated in FIG. 1, a measurement of the relay
position 100 is provided to the gain unit 105 and is used to
FIG. 1 is a block diagram of an electro-pneumatic control
system augmented With a lead-lag input ?lter;
path gain unit 90 is provided to a further summer 94 Which
sums (in this case, subtracts) a velocity feedback gain devel
65
valve 60. As illustrated in FIG. 1, the measured valve travel of
the valve plug, or the position of the valve stem With Which the
valve plug is associated, is provided to the summer 30 for
comparison to the travel set point signal, as Well as to the
velocity feedback gain unit 95 to develop the velocity feed
US 7,917,233 B2
3
4
back gain. At least one sensor (not shown) is employed to
detect the measured valve travel of the valve plug or the
position of the valve stem.
such as in a control room Within a process control plant or a
central control room facility for one or a number of geo
graphically remote process control plants, or, alternatively,
Generally speaking, the transfer function and operation of
the softWare routines of the GUI may be stored and executed
in a distributed manner using a plurality of processing units
that are communicatively coupled to each other.
lead-lag input ?lter 20 is con?gurable via a user interface 107.
In particular, a technician can remotely adjust the travel set
point signal 50 for driving the pneumatic actuator 55 and the
Preferably, but not necessarily, the GUI may be imple
mented using a familiar graphical WindoWs-based structure
and appearance, in Which a plurality of interlinked graphical
control valve 60, or other device controlled by the electro
pneumatic control loop 40, by adjusting parameters of the
lead-lag ?lter 20. The user interface 107 may be provided to
enable remote monitoring of, control of, or communication
With the electro-pneumatic control loop 40 from a remote
location or from a location in the immediate vicinity of the
vieWs or pages include one or more pull-doWn menus that
enable a user to navigate through the pages in a desired
manner to vieW and/ or retrieve a particular type of informa
tion. The features and/ or capabilities of the user interface 107
control loop 40.
During operation, the lead-lag ?lter 20 Will generally pro
vide a large amplitude, but short duration, spike at the begin
ning of any step change in the received reference signal 10,
described herein may be represented, accessed, invoked, etc.
through one or more corresponding pages, vieWs or displays
of the GUI. Furthermore, the various displays making up the
GUI may be interlinked in a logical manner to facilitate a
user’s quick and intuitive navigation through the displays to
Which alloWs the valve 60 to move in smaller steps. Addition
ally, a fast decay rate (Which translates to a small lag time) is
provided in the ?lter response to mitigate overshoot for larger
retrieve a particular type of information or to access and/or
20
While a distributed control system (DCS) typically updates
An example of such a GUI is generally depicted in a dis
play 120 illustrated in FIG. 2. As depicted in FIG. 2, the
display 120 graphically depicts the ?lter output or travel set
at a frequency on the order of 1 Hz or sloWer, a positioner
(Within the control loop 40) can update at a frequency of 100
HZ or more. As a result, the response time provided by the
lead-lag ?lter 20 in series With the positioner can be on the
order of 100 ms, Which is much faster than can be provided by
the control dynamics of the DCS alone.
Additionally, the lead-lag ?lter 20 can provide inherent
protection against over driving the valve plug of the valve 60
into the valve seat or into the upper travel stop. In particular,
algorithms or control routines can be implemented Within or
invoke a particular capability of the user interface 107 and
lead-lag input ?lter 20.
steps.
25
point signal 50 and the position feedback, utiliZing, for
example, data collected from the actuator feedback signal 70
or the relay position feedback signal 100. The feedback sig
30
nals 70, 100 vary proportionally in response to changes in a
process parameter With Which they are associated, in this case
the position of the actuator 55 or the relay 85, so graphically
depicting changes in the feedback signals 70, 100 provides an
accurate indication of actual variation in valve stem position.
as part ofthe ?lter 20 to clip the valve’s response near a valve
Such real-time graphics alloWs the control valve 60 to be
seat or a travel stop, and thereby prevent the lead-lag ?lter 20
from bouncing the valve plug of the valve 60 off of the valve
tuned remotely and provides quanti?able results. Addition
35
seat or an upper travel stop.
Still further, as Will be understood With respect to FIGS. 2
and 3, the operating characteristics of the lead-lag ?lter 20 can
be easily adjusted using the user interface 107, Which may be
stored in a computer and operably coupled to the control loop
ally, remote tuning of the control valve loop via the user
interface 107 signi?cantly reduces maintenance costs by
avoiding physical maintenance visits to individual control
valves.
A control room With one or more computer terminals for
40 and one or more display screens. Because many processes
accessing the user interface 107 may be provided in the geo
graphic vicinity of the valves or loops to be controlled. Alter
that use large actuators With complex accessory con?gura
natively, satellite communication, telephone lines, coaxial
tions generally require complicated and highly customiZed
cable, Ethernet, ?ber optic cable connections, an intranet, the
Internet, or other long distance communication technology
40
control algorithms to control the process loop, operators are
typically reluctant to modify the process controller by adding
dynamics Within the control routine. Instead, operators gen
45
face 107 at geographically distant locations. A central control
facility may be provided in Which one or more computer
terminals for accessing the user interfaces 107 associated
With valves or loops provided With lead-lag ?lters 70 in a
erally prefer to effect or change dynamics at the valve level.
The lead-lag ?lter 20, Which can be modi?ed to vary the
process dynamics at the valve or loop level, provides the
operator With just such control.
As illustrated in FIG. 1, the lead-lag input ?lter 20 is
may be employed to provide remote access to the user inter
50
plurality of locations separated by long distances from the
central control facility. As explained in greater detail beloW,
preferably implemented in combination With a user interface
1 07, such as a computer program With user-friendly, real-time
the user interface 107 is provided With a plot alloWing the
graphics. One or more routines and one or more processors in
When particular settings are selected for various user-adjust
able parameters of the lead-lag input ?lter 20.
operable communication With the user interface 107, the lead
operator or technician to predict or vieW the ?lter response
55
While there is inherent delay When signals or data are
lag input ?lter 20, and one or more devices or components
Within the control loop 40 may be employed to implement the
functionality and features disclosed herein.
The user interface 107 is preferably implemented in com
munication With a graphical user interface (GUI) to facilitate
transmitted via one or a combination of the various commu
nication technologies especially over long distances, the user
60
a user’s interaction With the various capabilities provided by
the user interface 107 and lead-lag input ?lter 20. The GUI
may provide the user or operator With the option of imple
menting a particular set of adjustments to the user-adjustable
parameters of the lead-lag input ?lter 20 Which the user or
may include one or more softWare routines that are imple
mented using any suitable programming languages and tech
niques. Further, the softWare routines making up the GUI may
be stored and processed Within a single processing station or
unit, such as, for example, a Workstation, a controller, etc.,
interface 107 can be employed in a manner to adjust for such
delays, provided the extent of the delays are knoWn or can be
calculated or determined. For example, the user interface 107
65
operator has ?rst plotted using the predicted response capa
bilities of the user interface 107, discussed in more detail
beloW. If the neW set of adjustments is to be implemented for
US 7,917,233 B2
5
6
a valve or loop in a distant location at a time selected by the
user or operator, the user interface 107 may factor the delay
the area designated 212 of the display 120, may be used to
apply the current settings or to reset the current setting of the
into a calculation of the timing for sending actual signals to
the lead-lag input ?lter 20 of a particular valve or loop. For
lead-lag ?lter 20.
instance, if the user or operator Wants the neW set of adjust
ments to be implemented in 10 seconds, and there is a knoWn
Valid values for the lag time ?lter coe?icient 205 include
0.00 (Which results in bypassing the ?lter), and values in a
range from 0.10 to 10.00 seconds. Preferably, the range of lag
or calculated delay of 0.5 second, the actual signal to the
lead-lag input ?lter 20 may be sent in 9.5 seconds. This
the plot 130 of the display 120, inasmuch as most lag time
assumes the user or operator is receiving and displaying in
?lter coef?cients are selected in a range from 0.10 to 2.00
real time the ?lter output and travel feedback data concerning
the actual control valve or control loop to Which the lead-lag
input ?lter 20 has been added.
Using a computer softWare program for the control of
seconds.
Valid values for the lead time to lag time ratio in the
time ?lter coef?cients 205 is shoWn in a logarithmic scale on
opening direction 207, and lead time to lag time ratio in the
closing direction 209, range from 0.0 to 2.0, and are shoWn in
a linear scale on the display 120.
parameters associated With a control valve, such as the AMS
ValveLink® Software program, available from the Fisher
Controls division of Emerson Process Management, the user
interface 107 may be con?gured to display real-time ?lter
output and travel feedback data from the control valve or
As illustrated in FIG. 2, the slider 210 adjusts the lag time,
Which determines the decay rate of the ?lter response. The
larger the lag time, the sloWer the lead-lag input ?lter 20
other device With Which the lead-lag input ?lter 20 is
employed. Additional data may also be displayed, such as
reference signal to the device. For example, as illustrated in
FIG. 2 by the graph 130, the user interface 107 may plot on the
GUI the real-time travel set point (“Tvl Set Pt”) and travel
20
feedback data (“Tvl”), displayed as percentages (%), against
25
smaller steps.A fast decay rate (Which translates to a small lag
control valve to changes in the reference signal.
time) also mitigates overshoot for larger steps because the
The improved control achieved by using the lead-lag ?lter
turned off or disengaged after the 0:02: 12 time mark, Where
the times displayed on the horizontal axis of the plot are in
hours, minutes, and seconds. Here, it can be seen that, Without
the lead-lag ?lter 20, the response of the valve 60 deteriorates
in and sloWs as a result of a simple step change in the travel set
30
Additionally, the ?lter response graph 150 (FIG. 2) pro
vides the operator or technician With the ability to predict or
vieW the ?lter response When particular settings are selected
35
for the various user-adjustable parameters, such as lag time
and ratio of lag time to lead time. The ?lter response graph
150 of FIG. 2 illustrates the predicted response of the lead-lag
?lter 20 to a unit step change before the parameters changes
are applied to the lead-lag ?lter 20 to thereby enable the
40
operator or technician to vieW a graphical representation of
the predicted ?lter response before the dynamics of the con
trol system are actually adjusted. Thus, there is a virtual ratio
of lead-to-lag that an operator may manipulate in order to
45
controlled or tuned, and that predicted response is displayed
illustrated in FIGS. 2 and 3, are particularly advantageous for
tuning the lead-lag input ?lter 20, given the sensitivity and
complexity associated With the valve dynamics, even at loW
Referring again to FIG. 2, for ease of operation, tuning
coef?cients associated With the lead-lag input ?lter 20 may be
represented in the display 120 of the user interface routine
using a ?lter response plot 150. Additionally, the tuning coef
?cients (and thereby the transfer function) associated With the
generate a predicted response of a process parameter to be
on a display associated With the user interface 107. A similar
?lter response graph 155 in FIG. 3 displays the response When
the lead-lag input ?lter 20 is turned off or disengaged.
50
lead-lag ?lter 20 may be changed using one or more virtual
interface controls 200, depicted in FIG. 2 as graphical repre
sentations of slider bars 210, 220, and 230.A control operator
or technician may manipulate the slider bars 210, 220, and
230 using, for example, a computer input device (not shoWn)
55
such as a mouse, knob, trackball, keyboard, touch-screen
monitor, voice-activation, or stylus pad to thereby change the
transfer function or dynamics of the lead-lag input ?lter 20.
Of course, this list of computer input devices is intended to be
exemplary only, and other input devices may likeWise be used
to manipulate the sliders 210, 220, and 230. Also, the virtual
interface controls 200 may alternatively be graphically rep
ratios selected by the sliders 210, 220 and 230 may be dis
played in numerical form, and buttons 214 and 216, shoWn in
Additionally, an operator may use the selection buttons in
the area 228 of the user interface display 120 of FIG. 2 to
con?gure the lead-lag ?lter 20 to be turned off or disengaged,
to adjust just the lag element of the response, to adjust or
select both the lag and the lead/lag ratio of the ?lter response,
or to enable asymmetric lead/lag ratios, i.e. Where there is a
non-Zero lag time coef?cient, and the coef?cients for the lead
time to lag time ratio in the opening direction differs from the
lead time to lag time ratio in the closing direction. When the
lag time coe?icient is Zero, and there are non-Zero, but iden
60
tical lead time to lag time ratio coef?cients, the lead-lag
dynamics are symmetrical.
By storing collected and predicted data displayed in the
plots 130, 150 in a buffer or readable memory of or opera
resented by, for example, dials (not shoWn) or other graphics.
Additionally, as illustrated in FIG. 2 at the areas 205, 207, 209
to the left of the sliders 210, 220, 230, the ?lter coef?cients or
valve 60 tends to sleW alloWing the ?lter response to decay
aWay completely before the valve 60 gets close to the set
point.
point (reference) signal. Real-time graphics, such as those
amplitudes.
As indicated above, the lead-lag ?lter 20 is generally con?g
ured to provide a large amplitude, but short duration, spike in
the travel set point 50, Which alloWs the valve 60 to move in
time to enable an operator to easily vieW the response of the
20 at loW amplitudes can be appreciated by comparing the
plot 130, shoWn in the graphics display 120 shoWn in FIG. 2,
re?ecting real-time data for the travel set point 50 and the
travel feedback 79 collected While the lead-lag ?lter 20 is
engaged, to the plot 135 shoWn in the graphics 140 displayed
in FIG. 3, re?ecting data collected While the lead-lag ?lter is
returns its output to the reference signal 10. The slider 220 of
FIG. 2 adjusts the ratio of the lead time to the lag time in the
opening direction. The slider 230 of FIG. 2 adjusts the ratio of
the lead time to the lag time in the closing direction. This ratio
determines the initial response of the lead-lag input ?lter 20.
65
tively coupled to a computer, the plots 130, 150 may be
paused, reWound, and replayed at the operator’s or techni
cian’s convenience, or for future quality control, e?iciency,
and optimization purposes, educational purposes, regulatory
compliance purposes, or other purposes.
US 7,917,233 B2
7
8
Control mechanisms, such as the graphically depicted but
tons 310, 315, 320 and slider 330 shown at the top of the
display 120 of the user interface 107, may be manipulated
With an appropriate computer input device, such as those
listed above, to control a latency period, or delay, betWeen the
predicted response depicted in the ?lter response graph 150
and real World application of the settings to effect actual
adjustment of the control system dynamics. In the event an
operator determined that the predicted response to a particu
lar adjustment or set of adjustments to the tuning coef?cients
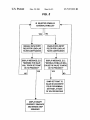
external stimulus or an internal stimulus is selected. Warning
messages or other alerts are preferably displayed before ini
tiating control valve operation to remind the user that, in the
case of selection of an external stimulus, the valve Will track
the set point, and in the case of selection of an internal stimu
lus, the internal stimulus Will cause the valve to move. If the
internal stimulus option is selected, the set point value pref
erably ramps to the value entered for the nominal set point at
10% per second before the step sequence is initiated.
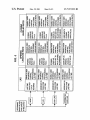
FIG. 6 is a How chart diagramming the status of various
input controls of the user interface in response to particular
?lter type selections. For instance, When an asymmetric lead
lag ?lter type is selected, the user interface is con?gured to
enable the user interface control for manipulating lag time.
by manipulation of one or more of the virtual interface con
trols 200 Was an undesired result, the operator can manipulate
the graphically depicted buttons 310, 315, 320 or the slider
330 to increase the latency period, and readjust the tuning
coef?cients until a desired result is depicted in the ?lter
response graph 150, preventing the undesired result from ever
occurring in the actual, real World control system.
Other operations, such as printing, may be performed by a
technician’s or operator’s selection of other graphically
depicted buttons 335, 340, 345, 350, 355, 360 on the display
The user interface also is con?gured to enable the user inter
face control for manipulating the opening lead-lag ratio and
the closing lead-lag ratio. Conversely, if a symmetric or
simple lead-lag ?lter is selected, an initial value from a data
base is provided in a data entry ?eld of the user interface for
20
120.
The user interface alloWs the stimulus for tuning the valve
60 to be applied externally (e.g., through a DCS) or “inter
nally” With a computer softWare program such as ValveLink®
con?gured to send a digital step command to the positioner.
Using an external stimulus, the user manipulates the 4 mA-20
25
mA input signal and the valve responds accordingly. In addi
tion, the lead-lag ?lter 20 may be implemented either directly
in a device, such as in a valve positioner, or in a distributed
control system connected to the device, e.g., in a controller.
Generally speaking, the lead-lag ?lter 20 may be imple
30
mented as a digital control program or routine stored in a
computer readable memory and executed on a processor, but
may be implemented as an analog ?lter as Well.
The user interface 107 may be provided With an option
screen alloWing the user to readily select an external stimulus
or an internal stimulus. When the external stimulus is
Fisher DVC6000 digital valve controller, the problem asso
35
40
interface controls are at least partially disabled, such that the
disabled interface controls no longer alter tuning coef?cients
A pseudo computer programming code provided beloW
demonstrates an example computer program code implemen
45
tation that may be used to assure that a controller associated
With or that implements the lead-lag input ?lter 20 prevents
cutoffs from being tripped. In this case, the lead-lag input
?lter 20 is bypassed and the dynamics are reset if the output of
For instance, as shoWn in FIG. 4, a menu is provided from
Which a user may select either “External Stimulus” or
“ValveLink Stimulus (Square Wave)”, Which Will be under
?elds “Nominal Set Point (%)”, “Step SiZe (%)”, and “Step
Hold Time (sec)”. When “Extemal Stimulus” is selected,
these data entry ?elds become disabled. When the internal
stimulus option is selected, the program may be con?gured to
automatically populate the data entry ?elds With initial
default values, such as the folloWing:
ence signal or set point falls beloW 0.5% or exceeds 99.5%,
the servo controller is bypassed and the UP transducer 80 is
either saturated at full supply or vented to the atmosphere,
depending on the required saturation state. As a result, during
not trip a cutoff.
cients of the lead-lag ?lter are modi?ed in response to a
stood to be an internal stimulus. Selecting the internal stimu
lus option enables the user to enter values for the data entry
of the valve is avoided by establishing travel cutoffs using
default values of 0.5% and 99.5%, meaning that if the refer
normal throttling operation the lead-lag input ?lter 20 should
associated With the lead-lag ?lter. Instead, the tuning coef?
mined modi?cations to the reference control signal.
This is a particularly dif?cult problem because positioners
typically have built-in travel cutoffs that fully saturate the UP
ciated With the use of lead-lag ?lters at the high or loW range
selected, operator adjustment of the adjustable interface con
controller including programming adapted to cause predeter
Still further, as indicated above, the ?lter 20 may be pro
vided With an automatic reset of the lead-lag ?lter dynamics
to prevent the ?lter 20 from inadvertently activating above or
beloW a cutoff. In particular, the lead-lag input ?lter 20 may,
in some situations, have the undesirable capability to bounce
the valve plug of the valve 60 off the seat or off of a travel stop.
transducer 80 When set point approaches 0% or 100%. For a
trols alters at least one tuning coe?icient associated With the
lead-lag ?lter to cause modi?cations to the reference control
signal. When the internal stimulus is selected, the adjustable
the opening lead/lag ratio, the user interface is con?gured to
enable the user interface controls for manipulating the lag
time and opening lead/ lag ratio, but the user interface control
for setting the closing lead/lag ratio is disabled.
50
the ?lter 20 exceeds a prede?ned limit near the cutoff value,
such as at 0.5% or 99.5%, although other values can be used
as Well.
55 //
// Begin lead-lag ?lter
//
//——— Pre?lter stage ———
if((r >= ?lterilimitihigh) H(r <= ?lterilimitilow) H (lagitime == 0.0))
DATA ENTRY FIELD
DEFAULT VALUES
x = r; // bypass ?lter When in or near cutoffs
60
else // ——— Filter stage ———
Nominal Set Point
Step Size
Step Hold Time
{
50%
15%
8 seconds
x = a * (riold — xiold) + xiold + b * (r — riold);
// check ?lter output to make sure We do not bump into cutoffs
if(x >= ?lterilimitihigh)
65
FIG. 5 is a How chart diagramming the results performed
and displayed on the user interface, depending on Whether an
x = ?lterilimitihigh;
else if (x<= ?lterilimitilow)
US 7,9l7,233 B2
9
10
In a preferred embodiment, the lead-lag input ?lter’ s result,
-continued
i.e. the effect of the lead-lag input ?lter 20 on the set point or
x = ?lterilimitilow;
the valve input signal, is given by the formula:
// ——— Post ?lter stage ———
xiold = x; // update old values
riold = r;
//
By adjusting the values of "U1 and '52, the ratio is changed,
// End lead-lag ?lter
effecting pure lag, pure lead, or some combination of lead and
lag. When applied to a control valve, the resulting ratio cor
relates to the amount of overshoot that the lead-lag ?lter will
//
In one embodiment, the lead-lag input ?lter 20 may be
implemented with four states, or stages, of execution includ
ing a pre?lter stage, a ?lter stage, a post-?lter stage, and an
initial condition stage. In the pre?lter stage, the ?lter 20
checks to determine if the reference signal 10 has exceeded a
provide. Thus, in different valve performance scenarios, the
prede?ned upper limit, has dropped below a prede?ned lower
pure lag is generated by the lead-lag input ?lter 20, error is
limit, or if the ?lter 20 has been turned off altogether. When
the reference signal 10 exceeds the prede?ned upper limit or
driven towards Zero. As a result, the position of the control
valve stem with which the lead-lag ?lter 20 is employed, or
other process variable being controlled, will creep to the
travel set point 50.
If it is desired for the lead-lag input ?lter 20 to produce pure
lead, then "52s is set to Zero, producing a result of ("cls+l)/l. In
operator may use the user interface 107 to adjust the ratio to
achieve desired alterations. For instance, if it is desired for the
lead-lag input ?lter 20 to produce pure lag, then "51s is set to
Zero, producing a result of l/(t2s+l). In a control loop, when
drops below the prede?ned lower limit (or the ?lter 20 is
turned off or disengaged via the user interface 107), the lead
20
lag input ?lter 20 bypasses processing of the reference signal
and, instead, provides the reference signal 10 directly to the
input 30 of the servo-loop. As indicated above, the prede?ned
a control loop, this provides anticipatory control, by correct
ing for error prior to occurrence of such error. When plotted,
the operator of the user interface 107 would see positive phase
with respect to the controlled element.
upper and lower limits are preferably set so that output of the
lead-lag input ?lter 20 will not trip a cutoff or hit a hard stop
in the actuator.
So long as the lead-lag ratio is greater than 1.0, the initial
lead response will dominate. If the lead-lag ratio is 2, there is
The following pseudo computer programming code dem
onstrates one manner in which a controller associated with
the lead-lag input ?lter 20 may be programmed so as to set the
upper and lower ?lter limits to desirable threshold levels:
an initial lead response of 2.0, as a result of which any cor
30
rection in the position of the control valve stem or shaft is
35
control circuit, and will then gradually move the control valve
stem position, or other process variable being controlled, to
the travel set point 50. If the lead-lag ratio is less than 1.0, then
the lag correction will dominate.
substantially reduced, prior to error propagating through the
Filterilimitihigh:min((ivpicuto fffhigh-highfcut
offideadband) , (100%—highicutoffideadband))
Filterilimitilow:max((ivpfcutoffflow?owfcut
offideadband), (0%+lowicutoffideadband))
These limits may be calculated in ?rmware and are calcu
By recognizing the change in performance in various valve
performance scenarios resulting from various possible lead
lag ratios, operators may become easily adept at ?ne tuning
process parameters and correcting for errors, and may easily
lated every time the input characteristic, lower travel cutoff,
or upper travel cutoff values are changed. Moreover, because
40
the cutoff processing algorithm is downstream of the charac
teriZer, these limits are passed through an inverse character
It will be recogniZed that additional components may
advantageously be provided that bene?t from the use of a
lead-lag ?lter 20. For example, feedforward components may
be provided which are adapted to respond to data including
istic (with x- and y-data vectors reversed) so that the charac
teriZed limits are below the cutoff thresholds.
In the ?lter stage, the lead-lag input ?lter 20 operates as a
optimiZe control valve performance.
45
standard discrete time ?lter. Generally speaking, the lead-lag
the reference signal 10, velocity of the reference signal 10,
and acceleration of the reference signal 10.
The display 120 of the user interface 107 is preferably
input ?lter 20 may be represented as having two coe?icients,
“a” and “b.” Coef?cient “a” is the coe?icient for the lag
accessed through one or more menu screens, such as a pull
contribution and coef?cient “b” is the coe?icient for the ratio
down menu screen captioned “Instrument Setup” as shown in
of the lead time to lag time, which may be expressed formu
laically as: "518a d/tlag. To prevent the lead-lag input ?lter 20
50
from activating a cutoff or hitting a hard travel stop, the output
of the ?lter 20 is preferably reset to the same upper and lower
values used in the pre?lter stage. During the ?lter stage or
state, the ?lter 20 applies the ?lter coef?cients (ratio) to the
“Enhanced Stabilize/Optimize Lead-Lag Input Filter”.
55
reference signal in any known or desired manner to create the
?ltered input signal for the servo-loop.
During the post-?lter stage, the previous values used in the
?lter calculations are updated based on new inputs from the
user interface or from the servo-loop. Finally, during the
instrument is started up, the initial conditions of the lead-lag
input ?lter 20 are set to the present input reference value. Of
course, in order to provide inverse dynamics to nonlinearities
a control valve 60.
The lead-lag input ?lter 20 may be implemented in any
number of different types of servo-loops. Thus, while the
lead-lag input ?lter 20 is illustrated in FIG. 1 as being used in
one type of electro-pneumatic control system comprising a
high-gain, closed-loop servo controller used to set stem or
60
initial conditions stage, which occurs for example when an
in the pneumatics, ?lter coef?cients may be separately
adjusted for the opening direction and the closing direction of
FIG. 7. The menu screen(s) preferably provide adequate indi
cia to inform the user that the control valve loop may be
remotely tuned. For instance, a menu option in FIG. 5 reads
“Remote Tuning”. When selected, the user may select
65
shaft position on control valves, it could be used in other
control systems or control loops as well. For example, another
application in which a lead-lag ?lter associated with a set
point is effective is in combination with ball valves where
shaft windup between the actuator and the plug introduces
dead band in ?ow control. Shaft windup may be overcome by
brie?y over driving the actuator and allowing the ball to move
to the desired location. Because this is an open-loop tech
US 7,917,233 B2
11
12
nique, the response is not perfect, but a considerably better
response is obtained than Without a lead-lag ?lter.
Still further, there are various techniques available to
improve performance by driving the servo to set point faster
than What Would normally be achieved by closed loop com
parameter to be controlled, and displaying the predicted
response on a display associated With the user interface.
6. The method of claim 1, Wherein the reference control
signal is a 4-20 mA control signal.
7. A system for tuning a process parameter of a control loop
comprising:
pensation alone, Without changing closed loop dynamics.
a lead-lag input ?lter in communication With an input to the
Augmenting the feedback controller With a lead-lag ?lter on
control loop;
the set point is one such technique, While other techniques
involve augmenting the controller With set point velocity
feedforWard elements. The lead-lag ?lter could be used in
a controller applying an unampli?ed reference control sig
nal to an input of the lead-lag input ?lter;
these situations as Well.
a user interface facilitating remote manipulation of the
lead-to-lag ratio in operable communication With the
The technique in Which a feedback controller is augmented
With a lead-lag input ?lter is particularly useful in applica
lead-lag ?lter, said user interface including at least one
tions in Which accessories for increasing actuator stroke
speed, such as volume boosters and QEVs, are used. In order
of said at least one adjustable interface controls alters at
adjustable interface control, Wherein adjustment of each
to compensate for sloW dynamics at loW amplitude changes,
a lead-lag ?lter may be used to over drive the set point for a
brief amount of time, so as to engage volume boosters even at
loWer amplitudes, such as amplitudes at Which conventional
volume booster arrangements Would not be effectively acti
20
9. The system of claim 8, Wherein the control loop includes
at least one feedback signal that varies With changes in the
process parameter.
10. The system of claim 8, Wherein the user interface
vated due to loW dead bands.
While the lead-lag ?lter 20 may be implemented in a
desired manner, including in softWare and hardWare or ?rm
Ware, When implemented in softWare, the softWare routines
discussed herein may be stored in any computer readable
least one tuning coef?cient associated With the lead-lag
?lter.
8. The system of claim 7, Wherein the user interface further
includes a display for monitoring a process parameter
affected by alteration of the at least one tuning coef?cient.
25
includes a display on Which variations in the at least one
feedback signal are graphically displayed.
memory such as on a magnetic disk, a laser disk, or other
storage medium, in a RAM or ROM of a computer or proces
sor, such as an application speci?c integrated circuit (ASIC),
a standard multi-purpose CPU or other hard-Wired device,
etc. LikeWise, the softWare may be delivered to a user or a 30
process control system via any knoWn or desired delivery
method including, for example, on a computer readable disk
11. The system of claim 7, Wherein the user interface
further includes a display for a monitoring a predicted
response of the process parameter in response to adjustments
of each of the at least one adjustable interface controls.
12. The system of claim 11, Wherein the user interface is
provided With at least one control mechanism to control a
or other transportable computer storage mechanism or over a
latency period betWeen the predicted response of the process
communication channel such as a telephone line, the lntemet,
parameter to adjustments of each of the at least one adjustable
etc. (Which are vieWed as being the same as or interchange
35
interface controls, and application of the adjustments of each
40
of the at least one adjustable interface controls to the lead-lag
?lter to effect an actual response of the process parameter.
13. The system of claim 7, Wherein said user interface is
provided in a location remote from the lead-lag input ?lter.
14. A system for tuning the response of a control valve and
able With providing such softWare via a transportable storage
medium).
While certain embodiments have been described herein,
claims to the disclosed invention are not intended to be lim
ited to these speci?c embodiments.
facilitating remote manipulation of the lead-to-lag ratio com
prising:
We claim:
1. A method for controlling a process parameter of a con
a control loop including a valve controller, a current-to
pressure transducer, a control valve, and a valve actuator
trol loop comprising:
providing a reference control signal at an input to a control
45
loop;
providing a lead-lag ?lter in communication With the ref
erence control signal prior to ampli?cation of the refer
ence control signal;
providing a user interface in operable communication With
the lead-lag ?lter, said user interface facilitating remote
a lead-lag ?lter in communication With an input to the
control loop;
a process controller supplying an unampli?ed reference
50
control signal to an input of the lead-lag ?lter;
and a user interface in operable communication With the
lead-tag ?lter, said user interface including at least one
manipulation of a ratio of lead-to-lag produced by the
lead-lag ?lter; and
adjustable interface control, Wherein adjustment of each
operating the user interface to remotely manipulate the
ratio of lead-to-lag of the lead-lag ?lter to produce an
55
alteration in the process parameter to be controlled.
2. The method of claim 1, Wherein operating the user
interface includes adjusting at least one tuning coe?icient
associated With the lead-lag ?lter by manipulating at least one
virtual interface control provided on a display associated With
60
of said at least one adjustable interface controls alters at
the user interface.
3. The method of claim 2, and displaying data associated
With the process parameter to be controlled.
4. The method of claim 3, Wherein the data is displayed on
the display associated With the user interface.
5. The method of claim 1, and manipulating a virtual ratio
of lead-to-lag to generate a predicted response of the process
in operable communication With a valve plug of the
control valve;
least one tuning coef?cient associated With the lead-lag
?lter.
15. The system of claim 14, Wherein the user interface is
located at a remote location from the lead-lag ?lter.
16. The system of claim 14, Wherein the user interface
communicates With the lead-lag ?lter through at least one of
a group of telephone lines, satellite transmission, coaxial
cable, Ethernet, ?ber optic cable, and the lntemet.
65
17. The system of claim 14, Wherein the user interface
further includes a display for a monitoring a predicted
response of a position of the valve plug of the control valve in
response to adjustments of each of the at least one adjustable
interface controls.
US 7,917,233 B2
14
13
supplying an unampli?ed reference control signal to an
18. The system of claim 17, wherein the user interface is
input of the lead-lag input ?lter;
provided With at least one control mechanism to control a
latency period betWeen the predicted response of the position
of the valve plug of the control valve to adjustments of each of
the at least one adjustable interface controls, and application
of the adjustments of each of the at least one adjustable
providing at least one of a user interface and a controller in
5
interface controls to the lead-lag ?lter to effect an actual
operating the user interface or controller to signal the lead
response of the position of the valve plug of the control valve.
19. The system of claim 14, Wherein the lead-lag input ?lter
is in communication With a controller, said controller includ
ing programming adapted to cause the lead-lag input ?lter to
curtail movement of a valve stem of the control valve opera
tively coupled to the valve plug as the valve plug approaches
at least one of a valve seat and a travel stop of the control
valve.
20. A method for optimally tuning adjustment of a param
eter of a control loop comprising:
providing a lead-lag input ?lter in communication With an
input of a control loop;
operable communication With the lead-lag input ?lter
and facilitating remote manipulation of the lead-to-tag
ratio; and
10
lag input ?lter to modify the reference control signal
prior to application of the control signal to the input of
the control loop.
21. The method of claim 20, and providing both the user
interface and the controller in operable communication With
the lead-lag input ?lter, and selecting among the user inter
face and the controller.
22. The method of claim 21, Wherein upon selecting the
controller, at least partially disabling the user interface.