1
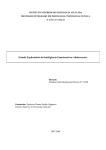
Enhancing the Perception
of Short Text Messages by Adding
Expressive Music and Pictures
IVETT
BACKLUND
Master of Science Thesis
Stockholm, Sweden 2006
Enhancing the Perception
of Short Text Messages by Adding
Expressive Music and Pictures
IVETT
BACKLUND
Master’s Thesis in Music Acoustics (20 credits)
Master Programme in Interactive Systems Engineering
Royal Institute of Technology year 2006
Supervisor at CSC was Roberto Bresin
Examiner was Sten Ternström
TRITA-CSC-E 2006:026
ISRN-KTH/CSC/E--06/026--SE
ISSN-1653-5715
Royal Institute of Technology
School of Computer Science and Communication
KTH CSC
SE-100 44 Stockholm, Sweden
URL: www.csc.kth.se
Abstract
Short text messages (SMS) have become a popular form of communication, especially
among the younger portions of the population. The limitations in length of text messages
in mobile phones have forced users to develop a language full of acronyms, phonetic shortenings and emoticons, the last of which are used to express emotions. MMS (Multimedia
Messaging Service) was created as an enhancement of SMS and allows the user to add
sound, pictures and video content to the text message. The purpose of this Thesis is to see
how the perceived emotional meaning of a short text message can be enhanced by adding
emotionally expressive music and coloured pictures.
We tested the effects of emotionally expressive music performances and coloured pictures on the perception of the emotional content of text messages. Thirty subjects (15F,
15M) rated the emotional content of three text messages (depicting a neutral, happy and
angry situation respectively) using three scales: Neutral, Happy and Angry, which were
ranging from low to high. The three text messages were presented in combination with
or without one of two coloured pictures (red triangles representing anger or yellow circles
representing happiness) and with or without one of two instrumental songs (a happy pop
song and an aggressive hard rock song) for a total of 3 × 3 × 3 stimuli.
Statistical analysis of subjects’ answers show that they recognized the emotional intentions embedded in the text messages. On the one hand emotional intentions were rated
higher when the text message was complemented with music and picture expressing the
same emotion. On the other hand when the text message was accompanied with music
and/or picture with contrasting emotion, its emotional intention received lower ratings. It
was also found that female subjects’ rated angry stimuli significantly higher compared to
male subjects ratings.
Sammanfattning
Korta textmeddelanden (SMS) har blivit ett populärt sätt att kommunicera, speciellt
bland de yngre delarna av befolkningen. Ln̈gden av ett textmeddelande i en mobiltelefon r begrn̈sad. Detta har tvingat anvn̈darna att utveckla ett språk baserat på akronymer, fonetiska förkortningar och s k emoticons. De sistnämnda används fr att uttrycka
känslor. MMS (Multimedia Messaging Servive) är en förbättrad version av SMS som tillter användaren att lägga till ljud, bilder och videoinnehåll till meddelandet. Syftet med
detta examensarbete är att ta reda på hur den upplevda emotionella meningen hos ett
kort textmeddelande kan förstärkas genom att lägga till emotionellt expressiv musik och
färgade bilder.
Vi testade effekterna av färgade bilder och emotionellt expressiva framföranden av
musik på det emotionella innehållet i textmeddelanden. 30 försökspersoner (varav 15
män och 15 kvinnor) betygssatte det emotionella innehållet i tre textmeddelanden (som
föreställde en neutral, en glad och en arg situation) på tre olika skalor: Neutral, Glad och
Arg, som gick frn låg till hög. De tre textmeddelandena presenterades i kombinationer
med eller utan en av två färgade bilder (röda trianglar fr ilska och gula cirklar för glädje)
och med eller utan en av två instrumentala musikinspelningar (en glad popsång och en
arg hårdrockssång) fr ett totalt antal av 3 × 3 × 3 stimuli.
Statistisk analys av försökspersonernas svar visar att de kände igen de emotionella
avsikterna i meddelandena. Å ena sidan betygssattes det emotionella innehållet högre
nr meddelandet komplementerades med musik och bilder som uttryckte samma känsla.
andra sidan, när meddelandet följdes åt av musik och/eller bilder som representerade en
motsatt känsla, fick det avsedda emotionella innehållet lägre betyg. Vi fann också att
kvinnliga försökspersoner betygssatte arga stimuli anmärkningsvärt högre jämfört med
manliga försökspersoner.
Acknowledgments
I would like to thank Roberto Bresin and Niklas Backlund, because without their help
and support I would not have completed this master thesis work.
List of Figures
1
2
3
4
5
6
7
8
9
10
11
12
13
14
15
16
17
18
19
20
21
22
23
24
25
26
27
28
29
30
31
Russell’s multidimensional scaling solution. . . . . . . . . . . . .
Summary of acoustic cues used to express emotions . . . . . . . .
Score for “Keine Lust” by Rammstein. . . . . . . . . . . . . . . .
Score for “Natale allo zenzero” by Elio e le Storie Tese . . . . . .
Pictures used for the stimuli. . . . . . . . . . . . . . . . . . . . .
Screen shot of the program used for presenting the stimuli. . . .
Average ”angry” rating in response to text. . . . . . . . . . . . .
Average ”angry” rating in response to music. . . . . . . . . . . .
Average ”angry” rating in response to pictures. . . . . . . . . . .
Average ”angry” rating in response to music and text. . . . . . .
Average ”angry” rating in response to picture and text. . . . . .
Average ”angry” rating in response to music, picture and text. .
Average ”neutral” rating in response to text. . . . . . . . . . . .
Average ”neutral” rating in response to music. . . . . . . . . . .
Average ”neutral” rating in response to pictures. . . . . . . . . .
Average ”neutral” rating in response to music and text. . . . . .
Average ”neutral” rating in response to picture and text. . . . .
Average ”neutral” rating in response to music, picture and text.
Average ”happy” rating in response to text. . . . . . . . . . . . .
Average ”happy” rating in response to music. . . . . . . . . . . .
Average ”happy” rating in response to pictures. . . . . . . . . . .
Average ”happy” rating in response to music and text. . . . . . .
Average ”happy” rating in response to picture and text. . . . . .
Average ”happy” rating in response to music, picture and text. .
Average ratings of category groups . . . . . . . . . . . . . . . . .
Average ”angry” rating for females and males . . . . . . . . . . .
Average ratings for gender . . . . . . . . . . . . . . . . . . . . . .
Validation of our stimuli, an overview . . . . . . . . . . . . . . .
A summary of the interaction between all the stimuli . . . . . . .
Average ratings for gender and music . . . . . . . . . . . . . . . .
Average ratings of teenagers on category groups . . . . . . . . . .
.
.
.
.
.
.
.
.
.
.
.
.
.
.
.
.
.
.
.
.
.
.
.
.
.
.
.
.
.
.
.
.
.
.
.
.
.
.
.
.
.
.
.
.
.
.
.
.
.
.
.
.
.
.
.
.
.
.
.
.
.
.
.
.
.
.
.
.
.
.
.
.
.
.
.
.
.
.
.
.
.
.
.
.
.
.
.
.
.
.
.
.
.
.
.
.
.
.
.
.
.
.
.
.
.
.
.
.
.
.
.
.
.
.
.
.
.
.
.
.
.
.
.
.
.
.
.
.
.
.
.
.
.
.
.
.
.
.
.
.
.
.
.
.
.
.
.
.
.
.
.
.
.
.
.
.
.
.
.
.
.
.
.
.
.
.
.
.
.
.
.
.
.
.
.
.
.
.
.
.
.
.
.
.
.
.
2
3
6
6
7
8
11
11
12
12
13
13
14
14
15
15
16
16
17
18
18
19
19
20
21
22
22
23
25
26
27
List of Abbreviations
AP
AM
AT
E
HP
HM
HT
MMS
NP
NM
NT
SMS
T
TT
Angry Picture
Angry Music
Angry Text
Experts
Happy Picture
Happy Music
Happy Text
Multimedia Messaging System
No Picture
No Music
Neutral Text
Short Message Service
Teenagers
Twenties/early Thirties
Contents
1 Introduction
1.1 Problem formulation . . . . . . . . . . . . . . . . . . . . . . . . . . . . . . .
1.2 Background . . . . . . . . . . . . . . . . . . . . . . . . . . . . . . . . . . . .
1.3 Outline of the report . . . . . . . . . . . . . . . . . . . . . . . . . . . . . . .
1
1
1
1
2 Literature Review
2.1 Emotions and music . . . . . . . . . . . . . . . . . . . . . . . . . . . . . . .
2.2 Affective shapes . . . . . . . . . . . . . . . . . . . . . . . . . . . . . . . . . .
2.3 Affective music and colours . . . . . . . . . . . . . . . . . . . . . . . . . . .
2
2
4
4
3 Method
3.1 Subjects . . . . . . . . . . . . . . . . . . . . . . . . . . . . . . . . . . . . . .
3.2 Stimuli . . . . . . . . . . . . . . . . . . . . . . . . . . . . . . . . . . . . . . .
3.3 Procedure . . . . . . . . . . . . . . . . . . . . . . . . . . . . . . . . . . . . .
4
4
5
8
4 Results
9
4.1 Results in general . . . . . . . . . . . . . . . . . . . . . . . . . . . . . . . . . 10
4.2 Results by subjects category . . . . . . . . . . . . . . . . . . . . . . . . . . . 17
4.3 Results by subjects gender . . . . . . . . . . . . . . . . . . . . . . . . . . . . 20
5 Discussion and Conclusion
23
6 Future Work
6.1 How to avoid a learning effect during the experiment? . . . . . . . . . . . .
6.2 How to ensure appropriate stimuli . . . . . . . . . . . . . . . . . . . . . . .
6.3 Basis for an application . . . . . . . . . . . . . . . . . . . . . . . . . . . . .
28
28
28
29
References
30
A Questionnaires
32
1
Introduction
1.1
Problem formulation
The purpose of this Master Thesis is to see how the perceived emotional meaning of
a simple text message1 can be enhanced by adding emotionally expressive music and
coloured pictures. We want to know as well if these factors can attenuate or even distort
the emotional content of the text message rather than enhance it. Finally, we want to
know whether the factors affect the perceived emotional meaning of the message in a
predictable way.
1.2
Background
There is much to be said about the evolution of mobile phones. It was in the early 80’s
when the first so called “mobile” was launched. It was particularly ugly, heavy and was
roughly the size of a briefcase [14]. Just fifteen years later, the mobile phone2 , now the size
of a credit card, has become one of the most useful and popular artefacts on the planet –
There are already more than 1.5 billion mobile phone users in the world [20]. The mobile
phones of today typically come with camera and colour display, and have software that
enables web access, games and music among other things. The newest models are the so
called multimedia handsets that support video calls and video streaming as well.3 There
is no doubt that mobile phones are becoming a necessity.
One of the first and world wide most used mobile phone features is the Short Message
Service (SMS), which is a simple facility that enables plain text messages to be sent
between mobile phones. Due to display limitations and the inherent awkwardness of
writing text using a numerical keyboard, this service has provoked the creation of its own
language based on acronyms, abbreviations, and emoticons. The use of text messaging is
also “strongly correlated with age (primary user group is the 15 to 24 age group)” [10].
The Multimedia Message Service (MMS) is an extension of SMS that allows additional
content, such as pictures, sounds, and videos, to be included in the message [2].
According to a report from the Swedish National Post and Telecom Agency4 [16], more
than 60% of Swedes used mobile content services through SMS and/or MMS during first
half of 2005, and 35% used these services on at least a weekly basis. Mobile content
services include downloads of content such as music/ringtones, images and video but also
information services such as stock quotes. Even though relatively few mobile phone users,
about 35%, have downloaded content such as ringtones to their phones, these services
stand for about 80% of the total revenues from mobile content services.
Main aim of this thesis work is to investigate if the possibility offered by modern handset of combining pictures, music and text in the same message can be used for enhancing
the emotional communication between users.
1.3
Outline of the report
In section 2 we present an overview of literature useful to support this thesis work.
1
Typically sent through a Short Message Service (SMS) or a Multimedia Messaging System (MMS).
also called handset
3
Nokia N-series devices share similar design traits as mobile phones, but they are actually powerful
pocket computers with a comprehensive set of multimedia features [15]
4
http://www.pts.se
2
1
In section 3, Method, you will find how the test subjects were selected, how the stimuli
were designed, and finally the procedure followed in order to perform the tests.
In section 4, Results, you will find the description of the output results of this experiment, including graphs and obtained data.
Section 5 is dedicated to discussion and conclusions.
Finally, in section 6, Future Work, we state possibilities for continuing the research on
this area.
2
2.1
Literature Review
Emotions and music
According to Russell [18], affective states can be represented as a circle in a two-dimensional
bipolar space, that is know as the “circumplex model of affect”. The two axes are valence
(negative to positive) and arousal (passive to active) (see figure 1). The figure presented
here is a rotated and mirrored version of the original in order to match its axis orientation with those used by Juslin in his chart summarizing cue utilization in performers’
communication of emotion in music (see figure 2).
Figure 1: Russell’s multidimensional scaling solution for 28 affect words (adapted from
[18]). The vertical axis represents valence (negative to positive) and the horizontal axis
represents arousal (passive to active).
In his work, Russell explains that greater similarity between two affect words is represented by their closeness in the space. His results have also been validated through
research on emotions and music. In studies on expressive music performance [11] and on
communication of musical structure [6], emotions have been organized in a bipolar space
almost identical to that found by Russell.
Composers encode musical ideas in notations, performers decode the notation to a
musical signal, and listeners decode the musical signal to ideas [11]. Performers may be
2
concerned about whether their interpretation of the music is perceived in the intended
way by the listeners. In searching for a predictable way of communicating emotion in
music performances, Juslin identified a set of acoustic cues, that are used by performers
to express a specific emotion. He combines categorical and dimensional approaches to
emotional expression as seen in figure 2.
Figure 2: Summary of acoustic cues used to express emotions (adapted from Juslin,2001)
Here it is shown that the expressions of happiness and tenderness have positive valence,
whereas only happiness is high in activity. Similarly, expressions of anger and sadness have
negative valence whereas only anger is high in activity. The expressive cues include tempo,
sound level, timing, intonation, articulation, timbre, vibrato, tone attacks, tone decays,
and pauses. For example, expressions of happiness are associated with fast tempo, high
sound level, staccato articulation, large articulation variability, fast tone attacks, and
bright timbre [11].
The position of the emotional expressions in the emotion space (see figure 2) suggest
that certain cues may have a larger influence on certain emotion dimensions than others.
Thus, for instance, tempo, sound level and articulation seem to be especially important
for the activity level, whereas timbre, perhaps in combination with sound level, seems
to be especially important for emotional valence. So, intermediate levels of sound and
high-frequency energy are associated with positive emotions, while more extreme levels
(e.g. very high or very low sound level) are associated with negative emotions.
While the expression of the musical performance is important, we should also consider
the influence of the musical structure itself. According to Gabrielsson and Lindström [6],
the individual structural factors of music have distinct emotional properties. The long list
of factors they analyse in their study includes intervals (harmonic and melodic), loudness,
tonality and harmonies. For example, simple/consonant harmonies evoke happiness and
serenity while complex/dissonant harmonies evoke tension and anger.
3
2.2
Affective shapes
In developing an affective evaluation tool Isbister and colleagues [9] made use of the
Russel’s circumplex model of affect. In an experimental set-up, they asked subjects to
express their emotion by grabbing objects and by relating them to pictures that were
presented to them on a computer screen. The results from this research suggest that
pointy or spiky figures got associated to pictures recalling fear and anger, while round
and smooth objects like balls and bubbles were associated to pictures recalling happiness
or tranquillity. In conclusion rounded shapes were associated with positive valence and
spiky shapes with negative valence. Smooth shapes were associated with low arousal and
bubbly or protuberant with high arousal.
2.3
Affective music and colours
In his research about music performance and colour, Bresin investigated how subjects
associate different emotionally expressive performances to different colours [3]. He used
two melodies: Brahms’ theme of the poco allegretto Op. 3 No. 3, and Haydn’s theme
from the first movement of Quartet in F major for strings, Op. 74 No. 2. These melodies
were performed with twelve different emotional intentions by musicians playing different
instruments (guitar, saxophone, and piano). The colours were used for rating each performance. The findings from this experiment suggest that Happiness in music performance
is associated to yellow, Tenderness to violet, Anger to red, and Shame to orange just to
mention some of them.
3
Method
From results presented in the previous section it is clear that (1) music can be used for
communicating different emotions, (2) colours can be associated to different emotions in
music performance, and (3) different shapes can be associated to different emotions. The
intention of the experiment presented in this section is to find out if music and pictures
can alter the perceived emotional content of a text message.
3.1
Subjects
An ethnographic fieldwork study by Berg and colleagues [2] shows that teenagers actively
use their mobile phone in their social encounters. They use it as social tie. They see their
mobile phone as an object that embodies private and particular things, like e.g. thoughts,
feelings or meaningful events. Teenagers see text messages in particular ”as sentimental
objects with emotional and social value” [2].
According to the web site of mobile content provider Aspiro [1], young people were
expected to spend 10% of their available income on mobile services in 2005. They also
estimate that in 2004, young people in Western Europe spent 426 million US dollars on
ringtones alone.
For these reasons, we chose to use Teenagers and people in their Twenties/early Thirties
as our test subjects.
A total of 30 people took part into the experiment. They were divided into three
groups: 12 Teenagers (average age 19; range: 15 to 20 years old), 12 people in their
Twenties/early Thirties (average age 30; range: 25 to 36 years old) and 6 Experts (average
4
age 28; range: 23 to 35 years old), with an even distribution between males and females
in each group.
The Teenagers were students from highschools in the Stockholm region. Some of the
Twenties/early Thirties subjects were students and other workers from different companies
in Sweden.
The Experts were students from the master program Interactive Systems Engineering,
Department of Computer and Systems Sciences (DSV). They all have knowledge about
affective systems.
The subjects were paid for their anonymous participation.
3.2
Stimuli
In order to limit the length of the experimental session, we selected only three emotions: happiness, anger and neutral5 . We chose happiness and anger because in previous
experiments on music performance perception they have been proven to be easy to discriminate [3][4]. They are also, according to Juslin [11], part of the five ’basic emotions’,
happiness, tenderness, sadness, fear, and anger.
Text. For each of the emotions we identified a text message that could characterize
them:
Angry text:
Happy text:
Neutral text:
My luggage was stolen at the airport!
I won the lottery! Let’s party tonight!
See you at 12 o’clock.
The text messages were selected based on previous experiments. The neutral message
was inspired by on a previous work by Laukka and colleagues [12]. They used the phrase
”It’s eleven o’clock” as a neutral text that was read with different emotional intensions by
professional actors.
The angry message was selected based on a previous study by Scherer and Ceshi [19].
They studied people reaction at the airport when they discovered that their baggage was
lost. In most cases people who lost their baggage got angry.
Music. We chose two pieces of music for communicating happy and angry intentions.
Since our target group is mainly consisting of young mobile phone users, we thought
that pop would have a larger emotional impact on them than classical music. Since the
experiment is about text messages in mobile telephony we chose to use ringtones, a happy
one and an angry one:
Angry music:
Happy music:
“Keine Lust” by Rammstein 6
“Natale allo zenzero” by Elio e Le Storie Tese
7
These choices may be motivated by analysing their musical structures and performance
characteristics according to the studies mentioned in section 2.1 [11][6].
“Keine Lust” is in C minor, and minor mode indicates sadness, tension or agitation,
i.e. emotions of negative valence. The lead melody only spans 7 semitones, so the pitch
5
In this context neutral means: no particular emotion
mp3 version of “Keine Lust”, http://www.mmplatform.com/samples/poly/original/18399.mp3
7
mp3 version of “Natale allo zenzero”, http://www.mmplatform.com/samples/poly/original/17721.mp3
6
5
Figure 3: Score for “Keine Lust” by Rammstein.
Figure 4: Score for “Natale allo zenzero” by Elio e le Storie Tese
6
variation is quite low, as found for compositions evoking disgust, anger or fear, which
also are negative emotions of various degrees of activity. The piece is quite loud and the
tempo is fast (139 bpm), which would indicate a high level of activity. The combination
of negative valence and high activity suggests that this musical piece could be perceived
as angry.
The key of “Natale allo zenzero” is E major which goes on the positive valence scale.
The lead melody spans an octave in range which is reasonably high, and in addition it
displays quite big rhythmic variations (shorter notes in the beginning of the phrase and
longer notes in the end). These properties indicate happiness and joy respectively. Just like
the angry piece, this one is also rather loud and fast (124 bpm) which means high activity.
The combination of positive valence and high activity indicates that this musical piece
could be perceived as happy. Note that the tempo in “Natale allo zenzero” is slower than
in “Keine Lust”, matching previous observations by Juslin in which happy performances
as a fast tempo but slower than angry ones.
Pictures According to the results from the aforementioned experiment by Bresin [3],
the yellow colour is associated with happy performances and the red colour with angry
performances. According to studies by Isbister and co-workers [9], pointy figures and spiky
shapes are associated with anger while smooth, rounded figures and shapes are associated
with happiness. Therefore, we chose three yellow circles and three red triangles as pictures
for representing happiness and anger respectively (see figure 5).
Figure 5: A) Picture with three yellow circles for communicating happiness and B) a
picture with three red triangles for communicating anger.
Three small geometric shapes were used, because the graphics would be used as background in the configuration of the mobile phone display. A single geometric shape would
have been too large so it would have drawn too much attention from the text message.
Three small shapes are enough to cover the display from side to side without taking up
too much vertical space. Additionally, the shape in the middle being smaller than the
other two, each group of figures resembles a face.
From now on, the red triangles picture and the yellow circles picture will be referred
to as angry picture and happy picture respectively.
The three components text, music and pictures were combined in a factorial design;
this was done by generating all possible combinations. 3 text conditions (happy, angry,
neutral) × 3 music conditions (happy, angry, absence of music) × 3 graphic conditions
(happy, angry, absence of pictures) produce a total of 27 experimental conditions.
7
3.3
Procedure
In order to present the 27 stimuli in an accurate and consistent way, we designed a computer program to emulate a mobile phone. The program is a simple Java GUI (Graphical
User Interface) application that reads the stimuli components (text, music and pictures)
and presents all their possible combinations in randomized order. The right half of the
GUI consists of an emulated mobile phone that displays the text message and graphics
(see figure 6). In the left half of the GUI there are three sliders associated to each of the
emotions that are used for rating the perceived emotional content of the text message.
At the bottom of the window there is a “Next” button. This button is greyed out until
the user changes the position of at least one of the sliders. This is a precaution to avoid
skipping the rating of a stimulus by mistake. If a stimulus includes music, it will be
played repeatedly until the “Next” button is pushed. There is no “Back” button. This is
intentional in order to keep the test subjects from revisiting previous stimuli.
The data gathered from each test run are saved in a text file that can easily be imported
in a statistics application such as Microsoft Excel or Statistica for analysis.
Figure 6: Screen shot of the program used for presenting the stimuli. On the right of the
GUI there is an emulated mobile phone which displays the angry text message together
with the angry picture. On the left of the GUI there are three sliders associated to each
of the emotions. They are used for rating the perceived emotional content of the text
message. At the bottom of the GUI there is a “Next” button.
The set-up for the actual tests was a computer and a pair of headphones (Panasonic
RP-HT355) in an isolated computer room. The sound level was kept constant across the
30 subjects’ tests. The order of the stimuli was randomized for each subject. Each session
lasted in average 25 minutes (including time for instructions, break and questions).
The subjects were instructed to make a judgment of the emotion of each text message
presented on the screen by rating it using the three sliders labeled Angry, Happy and
Neutral.
The first step of the procedure was to read the instructions of the experiment, which
were given to the subjects on paper. The instructions given were the following:
“In this experiment, we study how people recognize emotions communicated in
short messages such as SMS or MMS in mobile phones. Your task is to judge
8
how angry, happy and/or neutral a particular text message is. You will do
this by moving the indicator, with the mouse, on each slide bar presented on
your screen. There are three sliders: angry, neutral and happy. You can use
one, two or the three sliders to make your judgment every time a combination
is presented to you. Some of the text messages are presented with music and
pictures. If you do not hear any music in combination with a text message
it is not an error of the program! The stronger you associate a message to a
specific emotion, the nearer the indicator should be to the word: angry, neutral
or/and happy. The weaker you associate a text message to a specific emotion;
the lower the indicator on the slider should be placed. For a text message that
you associate with only one emotion, e.g. angry, you should place the indicator
near the word angry and on the other sliders far from the word neutral and
happy. Sometimes, it may feel difficult to make a judgment. Still, try to do
your best. There is no time limit for the experiment. When you feel that you
are ready with your judgment, click “Next>>”. It is not possible to go back to
the previous combination.
The experiment ends with a brief questionnaire. The questions will appear in
a dialog window.
Please feel free to ask any questions you like before we start the experiment.
Thanks in advance”
After reading the instructions, the subject was seated in front of the computer. On
the screen there was a welcome window displaying a form containing three fields: name,
birth date and nationality. After filling in the information, the test subject clicked on the
button marked “start test” to commence the test. After having rated all the 27 stimuli,
she was presented with a window informing her that she was half-way through the test
and that she could take a break before continuing. After the optional break, the same
27 stimuli were presented again in a different order. This was done in order to check the
consistency of the subject’s answers. After concluding the second test run, a window with
the text “thank you” was displayed, and the data from the test were saved to a file.
4
Results
The data were first organized using Microsoft Excel. We checked the consistency of the
answers of each test subject to see if we had to discard any of them. The limit we set was
for a minimum consistency rate of 50%, i.e. they give similar responses for at least 50%
of the stimuli in the two repetitions 8 .
Two of the subjects were close to the limit with 52% and 57% respectively, but none
were below it, so all the gathered test data could be used.
We then calculated the average values between the two test runs and transferred them
to Statistica in order to perform a one, two and three-way analysis of variance between
groups (ANOVA/MANOVA). The three components (text, music and colours) were used
as factors on the users’ ratings of each of the three adjectives (happy, angry and neutral).
8
We define here two responses as similar if they differ in absolute value less than 15% of the rating
scale.
9
In the following the means are plotted with the standard error and in all the graphs we
used 0.95 confidence intervals.
4.1
Results in general
The results of the analysis showed the following effects on respective scale:
Angry. There was a significant effect of the text component (F (2, 783) = 347.81, p =
0.00009 ). The angry text was clearly rated as the angriest compared to the happy and
the neutral texts (see figure 7). There was also a significant effect of the music component
(F (2, 783) = 111.88, p = 0.0000). The stimuli containing the angry music were clearly
rated as angrier compared to the happy one and the absence of music (see figure 8).
There was also a significant effect of the picture component (F (2, 783) = 23.871, p =
.00000). The angry picture was clearly rated as the angriest compared to the happy
and the no picture condition (see figure 9). There was a significant interaction between
music and text (F (4, 783) = 5.5588, p = .00020)(see figure 10). There was no significant
interaction between picture and text (F (4, 783) = .83873, p = .50073)(see figure 11). There
was no significant interaction between music, picture and text (F (8, 783) = .45381, p =
.88839)(see figure 12).
Neutral. There was a significant effect of the text component (F (2, 783) = 52.580, p =
0.0000). The neutral text was clearly rated as the most neutral compared to the happy and
the angry texts (see figure 13). There was also a significant effect of the music component
(F (2, 783) = 60.120, p = 0.0000). The condition without music was clearly rated as
the most neutral compared to the happy and the angry music (see figure 14). There
was also a significant effect of the picture component (F (2, 783) = 10.733, p = .00003).
The no picture was clearly rated as the most neutral compared to the happy and the
angry picture (see figure 15). There was a significant interaction between music and
text (F (4, 783) = 7.4639, p = .00001)(see figure 16). There was no significant interaction
between picture and text (F (4, 783) = .80094, p = .52472)(see figure 17). There was no
significant interaction between music, picture and text (F (8, 783) = .54957, p = .81925)
(see figure 18).
Happy. There was a significant effect of the text component (F (2, 783) = 331.40, p =
0.0000). The happy text was clearly rated as the happiest compared to the angry and
the neutral texts (see figure 19). There was a significant effect of the music component (F (2, 783) = 137.20, p = 0.0000). The happy music was clearly rated as the happiest compared to the angry one and the no music condition (see figure 20). There was
a significant effect of the picture component (F (2, 783) = 25.964, p = .00000). The
9
According to the help text of the STATISTICA program, (p-level) is “statistical significance”. The
statistical significance of a result is an estimated measure of the degree to which it is “true” (in the sense
of “representative of the population”). More technically, the value of the p-level (the term first used by
Brownlee [5]) represents a decreasing index of the reliability of a result. The higher the p-level, the less we
can believe that the observed relation between variables in the sample is a reliable indicator of the relation
between the respective variables in the population. Specifically, the p-level represents the probability of
error that is involved in accepting our observed result as valid, that is, as “representative of the population.
Typically, in many sciences, results that yield p ≤ .05 are considered borderline statistically significant
but remember that this level of significance still involves a pretty high probability of error (5%). Results
that are significant at the p ≤ .01 level are commonly considered statistically significant, and p ≤ .005
or p ≤ .001 levels are often called ”highly” significant. But remember that those classifications represent
nothing else but arbitrary conventions that are only informally based on general research experience.
F-Ratio is the ratio of two independent estimates of the variance of a normal distribution [21].
10
Figure 7: Average ”angry” rating in response to text. Here we can appreciate how the
angry text was rated higher than the neutral or the happy text on the angry rating scale.
The vertical bars denote 0.95 confidence intervals.
Figure 8: Average ”angry” rating in response to music. Here we can appreciate how the
angry music was rated higher than the no or the happy music on the angry rating scale.
The vertical bars denote 0.95 confidence intervals.
11
Figure 9: Average ”angry” rating in response to pictures. Here we can appreciate how
the angry picture was rated higher than the no or the happy picture on the angry rating
scale. The vertical bars denote 0.95 confidence intervals.
Figure 10: Average ”angry” rating in response to music and text. Here we can appreciate
a significant interaction between music and text on the angry rating scale. The vertical
bars denote 0.95 confidence intervals.
12
Figure 11: Average ”angry” rating in response to picture and text. Here we can appreciate
that there is no significant interaction between picture and text on the angry rating scale.
The vertical bars denote 0.95 confidence intervals.
Figure 12: Average ”angry” rating in response to music, picture and text. Here we can
appreciate that there is no significant interaction between music, picture and text on the
angry rating scale. The vertical bars denote 0.95 confidence intervals.
13
Figure 13: Average ”neutral” rating in response to text. Here we can appreciate how the
neutral text was rated higher than the angry or the happy text on the neutral rating scale.
The vertical bars denote 0.95 confidence intervals.
Figure 14: Average ”neutral” rating in response to music. Here we can appreciate how the
neutral music was rated higher than the angry or the happy music on the neutral rating
scale. The vertical bars denote 0.95 confidence intervals.
14
Figure 15: Average ”neutral” rating in response to pictures. Here we can appreciate how
the no picture was rated higher than the angry or the happy picture on the neutral rating
scale. The vertical bars denote 0.95 confidence intervals.
Figure 16: Average ”neutral” rating in response to music and text. Here we can appreciate
a significant interaction between music and text on the neutral rating scale. The vertical
bars denote 0.95 confidence intervals.
15
Figure 17: Average ”neutral” rating in response to picture and text. Here we can appreciate that there is no significant interaction between picture and text on the neutral rating
scale. The vertical bars denote 0.95 confidence intervals.
Figure 18: Average ”neutral” rating in response to music, picture and text. Here we can
appreciate that there is no significant interaction between music, picture and text on the
neutral rating scale. The vertical bars denote 0.95 confidence intervals.
16
happy picture was clearly rated as the happiest compared to the angry and the no
picture (see figure 21). There was a significant interaction between music and text
(F (4, 783) = 6.3323, p = .00005)(see figure 22). There was not a significant interaction
between picture and text (F (4, 783) = 1.3094, p = .26482)(see figure 23). There was not
a significant interaction between music, picture and text (F (8, 783) = .41576, p = .91185)
(see figure 24).
Figure 19: Average ”happy” rating in response to text. Here we can appreciate how the
happy text was rated higher than the neutral or the angry text on the happy rating scale.
The vertical bars denote 0.95 confidence intervals.
4.2
Results by subjects category
In this section we analyze subjects responses divided by category. For an easier reading,
we defined the following acronyms for the three subject categories:
• T = Teenagers
• TT = Twenties/early thirties
• E = Experts
The results of the analysis showed the following effects on respective scale:
Angry. There is a significant difference between T and E. Teenagers rate lower on
the angry scale than experts do (F (6, 1508) = 6.9072, p = .00000) There is no significant
difference between T and TT. Neither between TT and E, but TT rate lower on the angry
scale than E does (see figure 25).
17
Figure 20: Average ”happy” rating in response to music. Here we can appreciate how the
happy music was rated higher than the no or the angry music on the happy rating scale.
The vertical bars denote 0.95 confidence intervals.
Figure 21: Average ”happy” rating in response to pictures.Here we can appreciate how
the happy picture was rated higher than the no or the angry picture on the happy rating
scale. The vertical bars denote 0.95 confidence intervals.
18
Figure 22: Average ”happy” rating in response to music and text. Here we can appreciate
a significant interaction between music and text on the happy rating scale. The vertical
bars denote 0.95 confidence intervals.
Figure 23: Average ”happy” rating in response to picture and text. Here we can appreciate
that there is no significant interaction between picture and text on the happy rating scale.
The vertical bars denote 0.95 confidence intervals.
19
Figure 24: Average ”happy” rating in response to music, picture and text. Here we can
appreciate that there is no significant interaction between music, picture and text on the
happy rating scale. The vertical bars denote 0.95 confidence intervals.
Neutral. There is a significant difference between T and both TT and E (F (6, 1508) =
6.9072, p = .00000). T rate lower on the neutral scale than TT and than E. There is no
significant difference between E and TT when it comes to rating neutral (see figure 25).
Happy. There is no significant difference between the subjects category, but E are
rating lower on the happy scale than the other two subjects category (T and TT) (see
figure 25).
4.3
Results by subjects gender
In this section we analyze subjects responses divided by gender. The results of the analysis
showed the following effects on respective scale:
Angry. There is a significant difference between females and males. Females rate
higher on the angry scale than males (F (3, 754) = 8.7288, p = .00001) (see figure 26).
Neutral. There is no significant difference between females and males on the neutral
scale (see figure 27).
Happy. There is no significant difference between females and males on the happy
scale (see figure 27).
20
Figure 25: Average “angry”, “happy” and “neutral” ratings of category groups
Teenagers(T), Twenties/early Thirties (TT) and Experts (E). Here we can see that there
is a significant difference in the angry scale. T rated ”angry” lower than E. There is also
a significant difference between T and both TT and E when it comes to rating neutral.
Finally there is no significant difference when it comes to happy rating between the groups,
but never the less experts are rating lower on the happy scale than T or E. The vertical
bars denote 0.95 confidence intervals.
21
Figure 26: Average ”angry” rating for females (F) and males (M). There is a significant
difference between females and males. Females rate higher on the angry scale than males.
The vertical bars denote 0.95 confidence intervals.
Figure 27: Average ”angry”, ”neutral” and ”happy” ratings for female (F) and male (M).
There are no significant differences between females and males, except on the angry scale,
where females rate higher than males. Even though there are no significant differences,
females always seem to rate higher on the three different scales angry, neutral and happy.
The vertical bars denote 0.95 confidence intervals.
22
5
Discussion and Conclusion
In this section we will present the answers to the three questions we asked in the problem
formulation (refer to 1.1), and we will also highlight some other interesting findings.
Validation of stimuli. First of all, we validated our choices of stimuli (text, music
and pictures). We looked at the average emotional ratings for each element grouped by
type (angry, neutral/absent and happy). From the results we could see that there was a
significant bias toward the corresponding type for each rated emotion. A summary can
be seen in figure 28. The maximum angry ratings are enclosed in triangles, the maximum
neutral ratings are enclosed in squares, and the maximum happy ratings are enclosed in
circles.
Figure 28: This graphic includes all the elements of the stimuli rated separately for validating our choices of text (angry text (AT), neutral text (NT), happy text (HT)), music
(angry music (AM), no music (NM) and happy music (HM)), and pictures (angry picture
(AP), no picture (NP) and happy picture (HP)) on the angry, neutral and happy scales.
The maximum angry ratings are enclosed by a triangle, the maximum neutral ratings
are enclosed by a square, and the maximum happy ratings are enclosed by a circle. The
vertical bars denote 0.95 confidence intervals.
These results confirm the findings by Bresin [3] (how colours are related to emotions)
and Isbister and colleagues [9] (how shapes are related to emotions). It also confirms that
our musical choices based on studies by Gabrielsson and Lindström [6] (the influence on
emotional perception by musical structure) and Juslin [11] (the influence on emotional
perception by expressive musical performance) were correct.
23
Since we have established that the emotional interpretations of the stimuli can be
predicted, we should also be able to affect the perceived emotional content of a text
message in a predictable way.
Regarding the combined effect of the stimuli components, we can see a summary of the
results in figure 29. The diagrams show that matching stimuli combinations (consisting of
all happy, all angry or all neutral components) significantly increased the corresponding
emotional ratings by the test subjects. One of the comments we got through the questionnaire (by DT781101 on page 38) said that “there was a great difference with and without
music”.
This proves that the perceived emotional meaning of a simple text message can be
enhanced by adding emotionally expressive music and coloured pictures.
In the same summary, we can see that contrasting stimuli combinations also affected
the emotional perception of the messages. For example, when we added happy music to an
angry text message, the “angry” ratings went down significantly, i.e. the emotional content
of the message was attenuated because of the music. This produced strange feelings in
the test subjects as illustrated by the following comment (by CB700211, see page 35) we
got through the questionnaire:
“Yes, it makes a big difference, you first perceive no music, giving you an immediate feeling, so if the message does not match, like if it is a bad message with
happy music, it is really strange feeling, you know the text that is something
bad, but you feel good with the music”.
In another example, when we added happy music to a neutral text message, it was
perceived as significantly happier and significantly less neutral, i.e. the emotional content
of the message was distorted. These results prove that the stimuli factors can attenuate
or even distort the emotional content of the text message rather than enhance it.
The above conclusions answer our original problem formulation (refer to 1.1).
We already answered our three questions that were the purpose of doing this master
thesis work, but while working we found some other interesting results from this experiment. For instance, when it comes to differences between the genders, it was observed
that females rated angry stimuli significantly higher on the angry scale (see figure 26).
Even though there was not a significant difference between females and males on the other
scales, females gave higher ratings (see figure 27). This confirms results from a previous
study on emotional recognition in music performances done by Resnicow, Salovey and
Repp [17], where it was found that
“there was a tendency, albeit insignificant, for women to achieve higher scores
on both the MSCEIT10 and the music test. A small difference between sexes
in the same direction has been observed among earlier takers of the MSCEIT
[13], as well as in other studies of nonverbal communication of emotion [7][8].”
From figure 30 we can also see that females are more music driven than males; females
rated higher the emotion corresponding to the emotion in the music embedded in the
stimuli.
Another interesting result is that if we see only the teenagers group, the results showed
that in general teenagers rated significantly higher on the happy scale compared to the
10
MSCEIT means Mayer-Salover-Caruso Emotional Intelligence Test
24
Figure 29: This graphic includes all possible combinations of text, music and pictures rated
on the three emotion scales angry, neutral and happy. The maximum points are enclosed in
a triangle, which represents anger, a circle, which represents happiness and finally a square
which represents a neutral emotion. The vertical bars denote 0.95 confidence intervals.
25
Figure 30: Average “angry”, “neutral” and “happy” ratings for female (F) and male (M)
when “angry”, “neutral” and “happy” music are present. We can see that females are
more music driven than males. The vertical bars denote 0.95 confidence intervals.
other groups and almost nothing on the angry or happy scale. We conclude from this that
teenagers perceived happy situations better. There is also a significant difference between
teenagers and the other groups when it comes to rating neutral (see figure 31).
26
Figure 31: Average “angry”, “happy” and “neutral” ratings of category groups Teenagers(
T), Twenties/early Thirties (TT) and Experts (E). Here we can see that within the
teenagers (T) group, T rated higher “happy” compared to “angry” or “neutral”. There
is also a significant difference between T and both TT and E when it comes to rating
neutral. The vertical bars denote 0.95 confidence intervals.
27
6
Future Work
At the end of the oral presentation of this thesis work, a few comments and suggestions
aroused from the discussion. In the following I am presenting and discussing some of those
that I think are relevant for future development and further investigations on the matter
of this thesis.
6.1
How to avoid a learning effect during the experiment?
One of the comments that came out from the discussion when I presented this thesis was
that as we only give the subjects three different emotions to rate, how can we be sure that
they did not guess the answers we wanted and made an “honest” judgment?
One suggestion on how to avoid this type of doubts is to validate the stimuli based on
a broader range of emotions before actually using them in the test. This way you make
sure that every element actually corresponds to the emotion you are suggesting, and you
avoid having it pigeon-holed into a category where it might not belong in the first place.
Another suggestion on how to come around the learning effect (or classifying effect)
is to use the same stimuli as in this experiment, but not telling the subjects that we’re
specifically interested in the happy or angry emotions. Instead, they could rate the stimuli
in a two-dimensional plane similar to Russell’s circumplex model of affect [18] (see figure
1 on page 2). In order to make it easier on the subjects, the number of emotions displayed
could perhaps be limited to the basic 5 according to Juslin [11]: anger, happiness, sadness,
fear and tenderness. The results could then be analysed in various ways: How the points
are spread in the plane, where the average point is, and how these properties change with
different stimuli. To correlate the results with this experiment, the data could also be
analysed in relation to the coordinates of happiness and anger.
A third suggestion is to present unique music, pictures and text for each combination.
This would mean a slight departure from the factorial design paradigm, as even though
we still expose the 27 different combinations of angry/neutral/happy stimuli components,
the components themselves are not reused. This means that one or more separate tests
should be performed to rate the different components before using them in the real test.
Components that are supposed to have similar emotional meaning would have to be compared carefully, so that their differences could be taken into account when evaluating the
results. It’s a lot more work, but the benefit is that it will be a lot harder for the test
subjects to see through the test.
A final suggestion is to keep the music and picture elements from this experiment,
but using nine different text messages, three for each emotion. Then the factorial design
would consist of 81 stimuli for every block of tests. Two blocks would still be needed for
checking the consistency of the answers.
6.2
How to ensure appropriate stimuli
Another question that emerged from the presentation of this thesis work is how can we
ensure that the stimuli we used is appropriate? In this experiment we used text messages
that were chosen based on previous experiments. The situation recalled by the angry text
“My luggage was stolen at the airport!”, has already been proven to make people angry
[19]. However, it may not have such a great impact on teenagers because it may be a
situation they don’t relate to as strongly as they would for example with “My iPod was
28
stolen from my backpack!”. This could explain why teenagers rated much lower on the
angry scale than the other two groups, but this is just an hypothesis.
One solution to overcome this problem would be to validate the stimuli for all the
target groups intended for the real test.
6.3
Basis for an application
Our findings could be used for developing a content service for mobile phones using MMS
for example. The emotionally expressive music and coloured pictures could be used in the
same way as today’s emoticons for either increase or decrease the emotional intention of
the text message. Judging by the comments from our subjects, an application like this
would be useful to clarify the meaning of the message. The subject CB700211 answered
to our question about if they would use an application like this:
“Absolutely, both music and colour enhance the feeling on what you are saying.
Many times the text is ambiguous, you saying something in a nice way but it
could be understood as something bad, so it is great to have colours and music
to sort it out. I usually make use of smiles for that.”
Others answered that yes they would use it, but only if it was easy to use. Comments
from the subjects are reported in Appendix A. They could be used as input for the features
or functionality of the application.
29
References
[1] Aspiro. Marknad. Website. http://www.aspiro.com/templates/Page.aspx?id=
64#Marknads20fotnC3B6tter.
[2] S. Berg, A. S. Taylor, and R. Harper. Mobile phones for the next generation: Device
designs for teenagers. pages 433–440, 2003.
[3] R. Bresin. What is the color of that music performance? In International Computer
Music Conference - ICMC 2005, San Francisco, 2005. International Computer Music
Association.
[4] R. Bresin and A. Friberg. Emotional coloring of computer-controlled music performances. Computer Music Journal, 24(4):44–63, 2000.
[5] K. A. Brownlee. Statistical Theory and Methodology in Science and Engineering. John
Wiley, New York, 1960.
[6] A. Gabrielsson and E. Lindström. Music and Emotion: Theory and Research, chapter 10, pages 223–248. 2001.
[7] J. A. Hall. Gender effects in decoding nonverbal cues.
(85):845–857, 1978.
Psychological Bulletin,
[8] J. A. Hall. Nonverbal sex differences: Communication accuracy and expressive style.
Baltimore: Johns Hopkins University Press, 1984.
[9] K. Isbister, K. Höök, M. Sharp, and J. Laaksolahti. The sensual evaluation instrument: Developing an affective evaluation tool. 2005.
[10] A. S. Johansen and J. P. Hansen. Augmentative and alternative communication: The
future of text on the move. In ERCIMWorkshop, User Interfaces for all, 2003.
[11] P. N. Juslin. Communicating emotion in music performance: A review and theoretical
framework. In P. N. Juslin and J. A. Sloboda, editors, Music and emotion: Theory
and research, pages 305–333. Oxford University Press, New York, 2001.
[12] P. Laukka, P. N. Juslin, and R. Bresin. A dimensional approach to vocal expression
of emotion, cognition and emotion. pages 633–653, 2005.
[13] J. D. Mayer, P. Salovey, and D. Caruso. Mayer-salovey-caruso emotional intelligence
test user’s manual. Toronto, Canada: Multi-Health Systems, 2002.
[14] J. Meurling and R. Jeans. The march of the mobiles. In The Ericsson Chronicle,
pages 377–403, Stockholm, Sweden, 2003. Informationsförlaget Heimdahls AB.
[15] F. Pilato. Nokia nseries multimedia mobile phones unleashed. Website. http://www.
mobilemag.com/content/100/340/C3976/.
[16] PTS. Privatpersoners användning av innehållstjänster. 2005. http://www.pts.se/
Archive/Documents/SE/Innehallstjanster 2005 37%20.pdf.
30
[17] J. E. Resnicow and P. Salovey. Is recognition of emotion in music performance an
aspect of emotional intelligence? Music Perception, 22(1):145–158, 2004.
[18] J. A. Russell. A circumplex model of affect. Journal of Personality and Social Psychology, 39(6):1161–1178, 1980.
[19] K. Scherer and G. Ceshi. Studying affective communication in the airport: The case
of lost baggage claims. Personality and Social Psychology Bulletin, (3):26, 2000.
[20] R. Sinha. 2006: Year of multimedia mobile phones.
mobilemag.com/content/100/340/C6133/.
Website.
http://www.
[21] E. W. Weisstein. F-ratio. From MathWorld–A Wolfram Web Resource. http://
mathworld.wolfram.com/F-Ratio.html.
31
A
Questionnaires
At the end of the experimental session (see Section 3) each subject had to answer to a few
questions. The questions were:
1. Did the music enhance the messages?
2. Would you use music and colors to emotionally enhance your MMS/SMS messages
if the feature was available to you?
3. Do you have any comments about this test?
Answers from all subjects are reported in the following pages.
32
Subject id: AE730202
1. Did the music enhance the messages?
It did, but what they say makes me feel the same in almost all cases no matter what the
music was.
2. Would you use music and colors to emotionally enhance your MMS/SMS
messages if the feature was available to you?
Yes I would.
3. Do you have any comments about this test?
I liked it, it was very easy and quick.
Subject id: AF860916
1. Did the music enhance the messages?
Yes it did.
2. Would you use music and colors to emotionally enhance your MMS/SMS
messages if the feature was available to you?
If it didnt cost extra, I would probably do that.
3. Do you have any comments about this test?
The music changed the feelings mostly.
33
Subject id: AG760507
1. Did the music enhance the messages?
Yes I think the music influenced my emotions when I read the messages.
2. Would you use music and colors to emotionally enhance your MMS/SMS
messages if the feature was available to you?
Yes I think so, the sms is a very important part of our lives now and I communicate with
family and friends in that way. I would like to have music for every specially emotions for
sadness, angry or happiness. I think in that way the others can get or understand what
you mean.
3. Do you have any comments about this test?
I think it was interesting and very good. It just got confused or maybe my emotions got
more intense at the second part because I was influenced after I made the first part.
Subject id: AG781230
1. Did the music enhance the messages?
When appropriately used they did.
2. Would you use music and colors to emotionally enhance your MMS/SMS
messages if the feature was available to you?
Yes.
3. Do you have any comments about this test?
Some combinations were ambiguous.
2 or 3 tests before the real test starts.
34
Subject id: AS750614
1. Did the music enhance the messages?
Yes, a music which makes me happy combining the text changes my emotion and feeling
effectively. I guess I judged about the music more than the text.
2. Would you use music and colors to emotionally enhance your MMS/SMS
messages if the feature was available to you?
Yes, I surely will do that. Specially to me it is interesting to use this feature.
3. Do you have any comments about this test?
I guess, after passing time, I became sensetively against one of those music which made
me mad.
Subject id: CB700211
1. Did the music enhance the messages?
Yes, it makes a big difference, you first perceive no music, giving you an immediate feeling,
so if the message does not match, like if it is a bad message with happy music, it is really
strange feeling, you know the text that is something bad, but you feel good with the music.
2. Would you use music and colors to emotionally enhance your MMS/SMS
messages if the feature was available to you?
Absolutely, both music & colour enhance the feeling on waht you are saying. Many times
text is ambigous, you saying something in a nice way but it could be understood as
something bad, so it is great to have colours & music to sort it out. I usually make use of
smilies for that.
3. Do you have any comments about this test?
At the beginning I did not understand that the three sliders at the same time, so I was
using only 1, then in the middle of te test I had the need to express that something was
neutral a bit & highly happy, then I did try to move both sliders, & I did understand I
was meant to do.
35
Subject id: CS860714
1. Did the music enhance the messages?
Yes, a lot.
2. Would you use music and colors to emotionally enhance your MMS/SMS
messages if the feature was available to you?
Yes I would!
3. Do you have any comments about this test?
It was very interesting and fun to do.
Subject id: DJ860405
1. Did the music enhance the messages?
Yes, alot.
2. Would you use music and colors to emotionally enhance your MMS/SMS
messages if the feature was available to you?
Depends on the added cost. If it is free or cheap Id use it.
3. Do you have any comments about this test?
No.
36
Subject id: DS731017
1. Did the music enhance the messages?
Yes.
2. Would you use music and colors to emotionally enhance your MMS/SMS
messages if the feature was available to you?
No, I dont think so.
3. Do you have any comments about this test?
I think I wasnt very consistent with my answers. . .
Subject id: DS860516
1. Did the music enhance the messages?
It did, but mostly with the happy messages. Its a lot harder to transmit anger with text
and music and colors than it is transmitting happiness.
2. Would you use music and colors to emotionally enhance your MMS/SMS
messages if the feature was available to you?
Not really, but then again, Im not much of a cellphone freak.
3. Do you have any comments about this test?
Interesting study.
37
Subject id: DT781101
1. Did the music enhance the messages?
Yes, there’s a great difference with and without music.
2. Would you use music and colors to emotionally enhance your MMS/SMS
messages if the feature was available to you?
Yes of course, it delivers a more powerful message.
3. Do you have any comments about this test?
Yes, maybe. A brief explanation about the method in the beginning would be nice.
Subject id: FE780604
1. Did the music enhance the messages?
Yes, definitely the music gives the message intensity and quality.
2. Would you use music and colors to emotionally enhance your MMS/SMS
messages if the feature was available to you?
Absoloutly. I would use it to transmit emotions to people.
3. Do you have any comments about this test?
I liked it a lot. Thanks!
38
Subject id: FE861010
1. Did the music enhance the messages?
Yes, I found the music very important and sometimes worked against the message.
2. Would you use music and colors to emotionally enhance your MMS/SMS
messages if the feature was available to you?
Yes, after trying this I realized how important the music and colors are.
3. Do you have any comments about this test?
It was fun and I learned a lot about emotions and how to set a mood to something.
Subject id: GG820428
1. Did the music enhance the messages?
At the beginning. After that you get annoyed by it.
2. Would you use music and colors to emotionally enhance your MMS/SMS
messages if the feature was available to you?
Sure, after trying you realise you can put colours into the messages. Sometimes its more
important the sound and shape than the meaning.
3. Do you have any comments about this test?
The ‘happy’ music is really annoying. If I ever have that system and I receive messages
that sound like that I will stop using the cellular.
39
Subject id: GH750712
1. Did the music enhance the messages?
Yes.
2. Would you use music and colors to emotionally enhance your MMS/SMS
messages if the feature was available to you?
Yes.
3. Do you have any comments about this test?
I think music combines with text message, and colors too, but colors and music dont make
difference together with a bad message or happy.
Subject id: HA800421
1. Did the music enhance the messages?
Yes.
2. Would you use music and colors to emotionally enhance your MMS/SMS
messages if the feature was available to you?
Yes, obviously.
3. Do you have any comments about this test?
Yeah this test is very interesting. As it enhances the affect of message. If sometime some
colours or music is associated it depicts the emotion of the sender of message.
40
Subject id: HB870709
1. Did the music enhance the messages?
Yes, those messages that did not have anything but text was those that gave me the least
reaction, positive and negative.
2. Would you use music and colors to emotionally enhance your MMS/SMS
messages if the feature was available to you?
Sometimes, maybe to give the message more emotion, but I usually call than write a
message.
3. Do you have any comments about this test?
It was fun and interesting to see your own reaction on the messages with music and color.
Subject id: JB790403
1. Did the music enhance the messages?
Make stronger – yes
Make better – no
2. Would you use music and colors to emotionally enhance your MMS/SMS
messages if the feature was available to you?
No
3. Do you have any comments about this test?
Hard to say, there are many questions, but the text and the music doesnt change, so
after a while you tend to rate the same text in a similar way even though colors and/or
music might be different, because you have already seen it before and thus have already
determined unconsciously that this text corresponds to this emotion. This gets even more
so the more often you answer.
Its strange to leave your name for a test, all in all it doesnt really matter who it was that
took it, I dont care that much in this situation but if it would have been a test given to
outsiders, I would have skipped the name field and leave only the year for the birthday
for purpose of anonymity.
41
Subject id: JP901009
1. Did the music enhance the messages?
Yes sometimes, but sometimes not.
2. Would you use music and colors to emotionally enhance your MMS/SMS
messages if the feature was available to you?
Not the heavy music. The glad music I would use.
The colors where nice when they related with the music.
3. Do you have any comments about this test?
No.
Subject id: KD780826
1. Did the music enhance the messages?
Yes, but not in every message. Like “luggage was stolen”. If it is a bad message like this,
music does not affect the feeling.
2. Would you use music and colors to emotionally enhance your MMS/SMS
messages if the feature was available to you?
Yes, I want to use. Because we use symbols like “:-)” to express our feelings. If music and
colors are available, I would use them.
3. Do you have any comments about this test?
Visualizations should be more clear. I was not influenced much by colors & symbols.
Then I realized their importance. When I saw red triangles, and message “see you at 12
o’clock”, I increased the level of “ANGRY”.
42
Subject id: LH860419
1. Did the music enhance the messages?
Yes it did.
2. Would you use music and colors to emotionally enhance your MMS/SMS
messages if the feature was available to you?
Yes I would.
3. Do you have any comments about this test?
It was interesting when you had to think what to answer.
Subject id: MC700120
1. Did the music enhance the messages?
Yes, but not in all cases because in some ocations the notice was good and the music so
laud that make you feel exciting but when the notice was bad and the music laod get me
more angry.
2. Would you use music and colors to emotionally enhance your MMS/SMS
messages if the feature was available to you?
Definitely yes, because the other person will recive my humor and also for me, will give
me more emotions.
3. Do you have any comments about this test?
Yes, I really hope that it works because I would like to use it.
43
Subject id: MH741012
1. Did the music enhance the messages?
Only when the message was positive and wgen it was the kind of music that I like.
2. Would you use music and colors to emotionally enhance your MMS/SMS
messages if the feature was available to you?
Yes but only if it was easy to select.
3. Do you have any comments about this test?
It can be annoying to hear the same music over and over again, and the red color made
me feel even more angry.
Subject id: ML860709
1. Did the music enhance the messages?
Yes, but it also kind of took over it all.
2. Would you use music and colors to emotionally enhance your MMS/SMS
messages if the feature was available to you?
Probably, yes.
3. Do you have any comments about this test?
No.
44
Subject id: PJ711214
1. Did the music enhance the messages?
Not so much, music had the least influence on me.
2. Would you use music and colors to emotionally enhance your MMS/SMS
messages if the feature was available to you?
Maybe colors or other types of images. . . music would be harder unless I can define (pick
the songs) myself. . .
I think it
Depends on the level of influence the consumer himself has on the graphics, images or
music. . .
3. Do you have any comments about this test?
Nope, I think it was well defined and truly hope the experiment will turn out successful.
Thanks for letting me participate.
Subject id: SB790921
1. Did the music enhance the messages?
Yes, but just in some messages, not all of them.
2. Would you use music and colors to emotionally enhance your MMS/SMS
messages if the feature was available to you?
I like to use music but not those colors.
3. Do you have any comments about this test?
It was good to use shapes like [drawing of happy face] and [drawing of angry face] instead
of colors, but music was interesting especially angry one.
45
Subject id: SZ860517
1. Did the music enhance the messages?
Very much
2. Would you use music and colors to emotionally enhance your MMS/SMS
messages if the feature was available to you?
Yes, mostly music
3. Do you have any comments about this test?
Many questions, shows how much music affects me
Subject id: TB840811
1. Did the music enhance the messages?
At times, when it wasnt contradicting the message, or it just being unrelated.
2. Would you use music and colors to emotionally enhance your MMS/SMS
messages if the feature was available to you?
Probably not, since it would take extra time and probably be awkwardly implemented as
these tings usually are. In the end short texts can only carry great emotional charge if
much work is put into it, which is kind of against the point with an sms, its supposed to
be simple.
3. Do you have any comments about this test?
It gets a bit repetitive, but I suppose that its an unavoidable feature if you are to have a
good statistical sample.
46
Subject id: TC851202
1. Did the music enhance the messages?
Yes it did. Made you fell better to get a message. But I dident like one of the nusic options
for the message. One was stressing.
2. Would you use music and colors to emotionally enhance your MMS/SMS
messages if the feature was available to you?
Yes I would. You can easy explain the emotions better to a person.
3. Do you have any comments about this test?
I would like more options to select, Because it was hard to express how you field. But the
test was easy and fast so I like that.
Thank you for letting me do this test.
Subject id: YG770530
1. Did the music enhance the messages?
Yes, it did, but sometimes, the combination of music and text was strange, sometimes the
music irritates more.
2. Would you use music and colors to emotionally enhance your MMS/SMS
messages if the feature was available to you?
Yes, I would like to have music, it gives stronger clue of my feeling, the colors doesnt
influence too much, but the shape of the objects makes me feel more accordingly to my
emotion.
3. Do you have any comments about this test?
Actually I did have more emotions rather than only 3 with the strange combinations, for
example, when I heard the happy music with yellow round objects and text “my luggage
was stolen at the airport”, I felt frustrated rather than angry.
47
TRITA-CSC-E 2006: 026
ISRN-KTH/CSC/E--06/026--SE
ISSN-1653-5715
www.kth.se