1
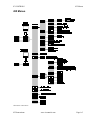
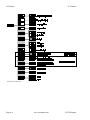
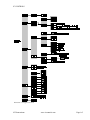
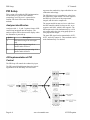
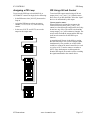
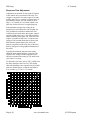
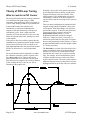
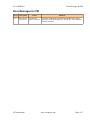
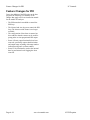
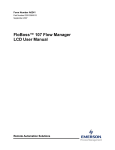
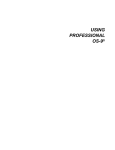
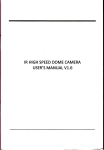
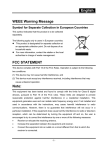
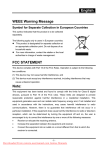
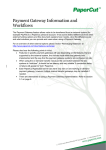
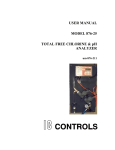
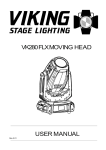
USER MANUAL
MODEL 455
PID OPTION
IC Controls
um-455-211-pid-apdx
Table of Contents
455 Menus................................................... A-3
PID Setup.................................................... A-6
Analyzer Identification............................A-6
455 Implementation of PID Control........A-6
Assigning a PID Loop............................. A-7
PID Using 4-20 mA Control................... A-7
Uses of the Alarm A Contact.................. A-8
Pump Pulser Control............................... A-8
Maximum Pulse Frequency................ A-8
Time-Proportional Control......................A-9
Cycle Time Adjustment......................A-9
Response Time Adjustment..............A-10
Control Loop Tuning Adjustments........ A-11
Which Settings to Adjust First.............. A-11
Units for PID Loop................................A-11
Scale Settings........................................ A-11
Control Direction.................................. A-11
On/Off Switch....................................... A-11
Setpoint................................................. A-11
Proportional Control..............................A-11
Integral Control..................................... A-12
Derivative Control.................................A-12
Safe Output Level..................................A-12
Using the PID Controls............................A-13
Manual Control Mode........................... A-13
Automatic Control Mode...................... A-13
Theory of PID Loop Tuning................... A-14
What to Look for in PID Control.......... A-14
Guidelines for Tuning a PID Loop........A-15
Recommended—Open Loop Tuning
Method.................................................. A-15
Error Messages for PID...........................A-17
Feature Changes for PID.........................A-18
455 Instruction Manual................................. 1
© Copyright 2005 IC Controls Ltd. All rights reserved.
Page A-2
www.iccontrols.com
455 PID option
IC CONTROLS
455 Menus
455 Menus
Illustration 1 Main menu
455 Instructions
www.iccontrols.com
Page A-3
455 Menus
IC Controls
Illustration 2 PID menu
Page A-4
www.iccontrols.com
455 PID option
IC CONTROLS
Illustration 3 Configuration menu
455 Instructions
www.iccontrols.com
Page A-5
PID Setup
IC Controls
PID Setup
This section will explain the PID implementation
for this analyzer as well as the controller
terminology used. The user is expected to be
familiar with basic PID control and tuning
methods.
Analyzer Identification
Analyzers with -1, -2, and -3 options feature a PID
control loop integrated into the analyzer. The
analyzer option will be shown on the display when
the instrument is powered up.
Option
Description
-1
PID control using 4-20 mA output
only.
-2
pump pulser output using AL.A
contact and/or 4-20 mA.
-3
time proportional output using AL.A
contact and/or 4-20 mA
represents the conductivity input which has its own
calibration and settings.
The PID loop receives a conductivity value from
the conductivity input module. The total output of
the PID loop is the sum of the proportional,
integral, and derivative components.
The output module in turn receives a value from
the PID controller which lies between 0%, or no
response, and 100%, which is full response. The
PID output can be read simultaneously by a 4-20
mA output and/or the relay using pump pulser or
time-proportional output.
The same PID signal can be transmitted to OUT1,
OUT2, and relay contact #1. These methods can be
used simultaneously if so desired.
455 Implementation of PID
Control
The PID loop will control the conductivity input.
The PID control block diagram shows the logical
organization of the PID loop. The first block
Page A-6
www.iccontrols.com
455 PID option
IC CONTROLS
PID Setup
Assigning a PID Loop
PID Using 4-20 mA Control
To activate the PID loop so that MANUAL or
AUTOMATIC control can begin, do the following:
To activate PID output control using a 4-20 mA
output select [ out ] [ out1 ] [ in ] from the menu.
Press Enter to go into edit mode. Select the “input”
that is to be transmitted by this output.
•
In the PID menu select [ON.OF], then turn the
loop on.
•
Assign the PID loop to at least one output
channel, i.e. OUT1, OUT2, or the first relay
contact.
•
In the case of OUT1 and OUT2, turn on the
output in the output menu.
Context-senstive menus:
When a PID loop is assigned to an output, the
context-sensitive frames [ unit ], [ HI ], [ LO ]
cannot be selected from the output menu since they
do not have any effect. The on/off switch and the
current output [ cur ] will continue to function. The
on/off switch for both the output and the PID loop
itself must be turned on for the PID loop to
function.
A potential useful feature is the ability to assign
the same PID loop to two 4-20 mA output signals
simultaneously. One possible use of this feature
would be to connect the actual control device such
as a valve to OUT1 and to connect a recorder to
OUT2. Since both outputs would transmit the
identical PID signal, the recorder will be recording
the signal transmitted to the control device.
455 Instructions
www.iccontrols.com
Page A-7
PID Setup
IC Controls
Uses of the Alarm A Contact
Pump Pulser Control
The relay for the time-proportional and pump
pulser output is shared with alarm A. Only one of
these 3 functions can be in use at any one time.
To select pump pulser relay functionality for the
AL.A contact, select [CONF] [AL.A] [ Func ] from
the menu, then change the setting to [ PP ].
Note: While the contact is in use by pump pulser
or time-proportional PID, alarm A will continue to
function. However, an alarm A condition will only
turn on the alarm A LED but not the contact.
Maximum Pulse Frequency
The setting for maximum pulse frequency is used
by the pump pulser output. The pump pulser puts
out no pulses at 0% output, and the maximum
pulse frequency at 100 % output. The default
setting is 70 pulses per minute. This value can be
adjusted between 50 and 120 pulses per minute.
To adjust the maximum pulse frequency, select
[ PID ] [ PULS ] from the menu and edit the
setting. Note that this setting is only visible in the
menu after PP functionality has been selected in
the configuration menu.
Page A-8
www.iccontrols.com
455 PID option
IC CONTROLS
PID Setup
Time-Proportional Control
Cycle Time Adjustment
Time proportional is useful for controlling a device
such as a valve by turning that device on a
percentage of the time using a relay. If there is 0 %
output, the relay will be off all the time, or at 100
% output the relay is powered 100% of the time.
The cycle time can be adjusted to best fit the
process that is being controlled. The default cycle
time installed in the analyzer is one minute,
meaning that while the analyzer is controlling, the
relay will be activated once each minute. At 25%
PID output the relay will be on for 15 seconds and
off for 45 seconds. If the cycle time is changed to
one hour, at 25% PID output the relay would be on
for 15 minutes and off for 45 seconds.
The figure below shows the effect on the relay
when the PID controller output is changed. Each of
the four examples shows four relay cycles using a
default 1 minute cycle time.
This type of output is called time-proportional
output because the relay is on a percentage of the
time, in proportion to the PID controller output.
To select time-proportional relay functionality for
the AL.A contact, select [CONF] [AL.A] [ Func ]
from the menu, then change the setting to [ tP ].
455 Instructions
www.iccontrols.com
Page A-9
PID Setup
IC Controls
Response Time Adjustment
Adjustment can be made for the speed of response
of the control device connected to the relay. For
example, a large ball valve may require 6 seconds
to fully open. Given a 1 minute cycle time and 1 %
PID controller output, the relay would be on for
only 1% of 1 minute or 0.6 seconds, which is too
little time for the ball valve to respond properly.
If the minimum response time setting in the
program were to be adjusted to 6.00 seconds, the
relay would not be turned on and the ball valve
would not be activated unless the on-time equals 6
seconds, which in this case is 10% PID controller
output. Similarly at the upper end, if the ball valve
requires 6 seconds to fully close, a response time
setting of 6.00 seconds means that as soon as the
PID controller output drops below 100%, the
analyzer would turn on the relay 90% of the time.
Refer to the figure for the graphical illustration of
this effect.
Typically the minimum response time setting
should be much smaller than the cycle time. The
response time setting becomes negligible when
either the response time setting is very small or the
cycle time is very long.
To adjust the cycle time, select [ Pid ] [ rESP] from
the menu, then press the Enter key. The display
shows the minimum relay response time in seconds
with two decimal places, so that the resolution is
0.01 seconds, e.g. [ 1.50 ] is 1.5 seconds.
Page A-10
www.iccontrols.com
455 PID option
IC CONTROLS
Control Loop Tuning Adjustments
percent input.
Control Loop Tuning
Adjustments
Which Settings to Adjust First
When setting up the PID loop, it is easiest to adjust
the settings in the following order. Each setting is
described individually later in this section.
Example:If the conductivity input normally stays
between 0 and 350 µS/cm, we could set [unit] to
[1E-6], [SC.L] to 0, and [SC.H] to 500. For the PID
loop the input scale is now from 0 to 500 µS/cm,
and the PID loop will control accordingly.
Control Direction
1. Determine whether to use millisiemens per
centimeter (mS/cm) or microsiemens per
centimeter (µS/cm) units for PID. Set [unit].
Normal control action is reverse acting control. For
reverse-acting control the controller output
decreases as the conductivity increases.
2. Define the input scale by setting the [SC.L]
(lowscale) and [SC.H] (highscale) settings.
These settings determine the proportional band.
The setpoint will always be within this scale.
The control direction is accessed by selecting the
[Ctrl ] frame from the PID menu. Choose between
•
[ dir ] for direct acting and
3. Determine the control direction, either direct- or
reverse-acting control.
•
[ rev ] for reverse acting control.
4. Turn on the PID loop using the [ON.OF]
control.
5. Tune the PID loop. Adjust the Proportional,
Integral, Derivative, and Setpoint settings.
6. Adjust the [SEt] (setpoint), [SAFE] safe output
level, and PID tuning parameters as necessary
during operation.
Units for PID Loop
The units setting for the PID loop is independent of
the display units for the conductivity sample
display. The [unit] setting determines the units
used for the low scale, high scale, and setpoint
settings. Either [1E-3] (mS/cm) or [1E-6] (µS/cm)
can be selected.
Scale Settings
The [SC.L] (scale:low) and [SC.H] (scale:high)
settings determine the proportional band that the
PID loop ‘sees’. The purpose of these settings is to
make the conductivity input, which is potentially
very large, more manageable. Set up the scale so
that during normal operation the conductivity input
would always be within this scale.
The PID scale settings affect only the PID loop, not
the conductivity input itself.
If the conductivity input goes below the [SC.L]
setting, the PID loop ‘sees’ 0 percent input.
Whenever the conductivity input goes above the
[SC.H] setting, the PID loop will always ‘see’ 100
455 Instructions
On/Off Switch
An on/off switch has been implemented for the
PID controller which turns the controller on or off.
When the controller is turned off the Auto and
Manual keys are disabled and controller output will
be at 0 per cent.
Setpoint
The setpoint is the control which sets the desired
conductivity of the sample. It is the task of the PID
controller to maintain the conductivity of the
sample at a level close to the setpoint.
The setpoint can be adjusted to any conductivity
value on the user-defined scale (from [SC.L] to
[SC.H]) to a resolution of 1 µS/cm or 1 mS/cm,
depending on the units selected. The setpoint is
accessed by selecting the [ SEt ] frame from the
PID menu.
Proportional Control
Proportional control is the most basic type of
control. The controller output is directly
proportional to the error input signal to the
controller. In effect there is a continuous linear
relationship between the controller input and
output.
The proportional band setting is based on the scale
defined by setting [SC.L] and [SC.H].
The proportional control parameter is specified as
per cent proportional band. Proportional control is
www.iccontrols.com
Page A-11
Control Loop Tuning Adjustments
IC Controls
also known as correspondence control, droop
control, and modulating control.
The proportional constant can be specified either
as % proportional band or as gain. The relation
between the two terms is as follows:
proportional band =
1
×100 %
gain
Practically speaking high percentages of PB
(proportional band) correspond to less sensitive
response and low percentages of PB correspond to
more sensitive response. Conversely a small gain
corresponds to less sensitive response and large
gain corresponds to more sensitive response.
The proportional band is adjustable from 1.0 to
200.0 % of scale and is accessed by selecting the
[ P ] frame from the PID menu.
Integral Control
Integral control is also described as reset action.
Integral control is really an integration or sum of
the input error. Integral control output changes
proportionally to the input error, and the time it has
been there.
The reset rate is the number of times per minute
that the effect of the proportional control is
repeated by the integral control. In the 455 the
integral control parameter is expressed as the reset
time, which is the reciprocal of the reset rate. The
455 analyzer expresses the integral control
adjustment as reset time as opposed to reset rate
since it is easier to visualize reset in terms of time.
Practically, a longer reset time corresponds to a
less sensitive response and a shorter reset time
corresponds to a more sensitive response.
The reset time is specified in mm:ss and is
accessed by selecting the [ I ] frame from the PID
menu. The reset time is adjustable from 00:00 to
99:99. A reset time of 00:00 turns integral control
off.
Derivative control output changes proportionally to
the change in the input error. It has the effect of
anticipating the change in conductivity and
adjusting the PID output accordingly.
The rate time is the time interval by which the
derivative action advances the effect of the
proportional action.
Practically, a longer rate time corresponds to a
more sensitive response and a shorter rate time
corresponds to a less sensitive response.
The rate time is specified in mm:ss and is accessed
by selecting the [ d ] frame from the PID menu.
The rate time is adjustable from 00:00 to 99:99. A
rate time of 00:00 turns derivative control off.
Safe Output Level
A control has been provided to specify a safe
output level for the PID controller in case the
conductivity input goes offscale. The safe output
level is specified in % output of the controller.
The most common causes of an electrode going
off-scale are electrode failure, electrode not being
in solution, or connection problems. While in
automatic mode, the controller output will change
to the specified safe output level as soon as the
conductivity input goes off-scale, and will return to
automatic PID control as soon as the conductivity
input comes back on scale.
This controller feature can easily be tested by
making the conductivity input go off-scale while
the PID controller is in automatic mode by
observing the controller output. If you change the
controller to manual mode while safe output is in
effect you will be able to observe that the
controller output is at specified safe output level.
Error E3.1 will show up in the error menu and the
error LED will light up as long as the safe output
level is in effect.
Derivative Control
For conductivity control purposes derivative
control is normally turned off. In the 455 analyzer
the factory default setting is to have derivative
control turned off. The function is still accessible if
needed, however.
Derivative control is also known as rate action.
Page A-12
www.iccontrols.com
455 PID option
IC CONTROLS
Using the PID Controls
Using the PID Controls
The LED marked Auto is used exclusively for PID
mode. It will turn on when the control is on
automatic.
The keys marked Manual and Auto are used to
switch the controller between auto and manual
mode. These keys will work only when one or both
PID controller loops have first been assigned to a
4-20 mA output and the on/off switch for the
controller is turned on.
Manual Control Mode
In manual mode the output of the PID controller is
under direct control of the operator. Operator
introduced manual changes are instantly sent to the
valve when Enter is pressed. The output does not
change unless changed by the operator through the
manual mode menu.
be turned off. Adjust the displayed value and press
Enter to change the output.
If pressing the Manual key has no effect then the
PID loop is not assigned to an output channel or
the PID loop is turned off. The manual mode menu,
shown at left, will come up .
From the Manual Mode Menu press either or the
Auto key to return to the conductivity display and
the regular menu.
Automatic Control Mode
In automatic mode the output of the PID controller
will change according to the tuning parameters set
in the PID menu. The Auto key works from
anywhere in the menu, just like the Sample key.
The AUTO LED will come on when the Auto key
is pressed if
•
the PID loop is assigned to an output channel
•
the on/off switch in the loop is turned on.
If the AUTO LED does not come on, check the
output assignments and the on/off switches.
The PID controller has built in windup protection.
The integral error history will not wind up any
further as soon as controller output reaches 100 per
cent.
Like the Sample key the Manual key is accessible
from anywhere in the menu. The program safely
aborts whatever it is doing and shows the PID
controller output as % output. If the PID controller
was in automatic mode then the AUTO LED will
Control
Transfer between manual and automatic control is
bumpless. The output from the loop will start at the
output level in effect in manual mode and changes
only according to the tuning parameters. This
feature avoids large, potentially hazardous changes
in PID control loop output.
Default
Adjustment Range
Setpoint
50 mS/cm
Between [ SC.l ] and [ SC.H ]
setting
Proportional Band
100 % (gain = 1)
1.0 to 200 %
Reset Time
5:00 mm:ss
00:00 to 99:99 mm:ss
Rate Time
00:00 mm:ss (off)
00:00 to 99:99 mm:ss
Control Direction
reverse-acting
reverse- or direct-acting
Safe Output Level
0%
0 to 100%
On/Off switch
on
on or off
Scale
0 mS/cm to 9999 mS/cm
0 mS/cm to 100 mS/cm
Table 1 Default settings for PID
455 Instructions
www.iccontrols.com
Page A-13
Theory of PID Loop Tuning
IC Controls
Theory of PID Loop Tuning
What to Look for in PID Control
The first problem encountered in tuning controllers
is to determine what good control is. What
constitutes good control may differ from system to
system. Some simple guidelines are presented here.
In normal PID control the controller will
continuously overshoot and undershoot the
setpoint, so that the conductivity of the process
continuously cycles. After a single upset the
controller will cause the process to cycle over and
below the setpoint many times, moving ever closer
to the setpoint.
If the process does not reach the setpoint, then the
combination of proportional and/or integral control
will need to be increased. If the overshoot is too
high (high amplitude) then the proportional control
needs to be decreased (i.e. lower proportional
band).
The most common criterion employed is to adjust
the controller so that the system’s response curve
has a decay ratio of 1/4. A decay ratio of one
quarter means that the overshoot of the first peak
(D2) in the process response curve to the overshoot
of the second peak (D3) is four to one. This is
illustrated in the graph at left.
Page A-14
Generally a decay ratio of one quarter represents a
good compromise between having a quick initial
response and having a fast line-out time. If the
initial response is too rapid then the system will
continuously overshoot. If the initial response is
too slow then it may take too long for the system to
stabilize.
There are many combinations of proportional and
integral settings which will produce a decay ratio
of one quarter. What does change is the period or
speed of the response. To decrease the period and
increase the speed of response, increase the
proportional control setting (i.e. lower
proportional band) and decrease the integral
control (i.e. longer reset time). Conversely, to
increase the period and slow the speed of response,
decrease the proportional control setting (i.e. larger
proportional band) and increase the integral control
(i.e. shorter reset time).
The dead time in a system is the time it takes for a
change in controller output to be measured by the
analyzer. The lag time is a combination of dead
time and the time it takes for a system to respond
fully. For example, an acid neutralization system
will have dead time because it takes time for the
acid to reach the sensor. The same system can have
additional lag time because it takes time to mix the
holding tank and for the acid to fully react with the
www.iccontrols.com
455 PID option
IC CONTROLS
Theory of PID Loop Tuning
process. When the controller output moves, the
sensor reading won’t change immediately as a
result but it has to wait for all the connecting
elements in between to change.
For most loops the lag time is directly related to
the period and speed of the response. The lag time
of the system determines the period. For most
loops the period is four times the lag time, e.g. P =
4L. In order to achieve maximum control, lag time
must be kept to a minimum. Some lag time is
unavoidable, but in other cases proper system
design will keep dead times to a minimum.
Sometimes lag time can be reduced simply by
strategically locating the sensor so that the analyzer
receives accurate feedback from the system as soon
as possible.
In most systems it is desirable to have a short
period so that the response is faster. A system will
take about three natural periods to recover from an
upset. A system with a lag time of 1 minute and a
period of 4 minutes (4L = P) will take about 12
minutes to recover from an upset. If the lag time
could be cut by 30 seconds the period could be
shortened to 2 minutes and the recovery would be
shortened from 12 to 6 minutes. This shows the
importance of reducing the lag time in a system.
Guidelines for Tuning a PID Loop
The need in turning a controller is to determine the
optimum values of the controller proportional band
(or gain), the reset time, and the derivative time.
Some basic rules for tuning PID controllers were
first proposed by Ziegler and Nichols in 1942.
Most tuning methods in use today are variations
and improvements of the Ziegler and Nichols
methods. The methods are based on sound
mathematics, but can be applied practically without
the need to understand the underlying principles.
The two basic tuning methods are the closed loop
and the open loop tuning method. The closed loop
method uses a PID loop with proportional-only
control. The loop is put on automatic control, and
the proportional band is increased until the loop
cycles. The period of the cycle, called the natural
period, is observed. Controller settings can then be
based on the observed natural period and the
proportional band which caused the cycle.
Recommended—Open Loop
Tuning Method
For the open loop approach, the PID loop is on
manual control and a change is made in the
controller output. The conductivity response to this
step change will look something like that shown in
the graph below. The controller settings are then
based on the apparent dead time, L, of the system,
and the slope, R.
The open loop tuning method is the quickest and
simplest. This method allows us to determine the
apparent dead time (L, lag time) of the system,
which is the time that the process requires to
respond to an upset in the system. The other
parameter is the rate of response, R. An example of
using the open loop tuning method is given below.
1. Assign the PID loop to one of the outputs. The
PID menu can now be selected from the main
menu.
2. Record the conductivity signal using one of the
4-20 mA outputs. There needs to be sufficient
time resolution on the recorder so that the dead
time and slope of the recorder trace can be
identified. If a recorder is not available, use a
watch and record the conductivity in
approximately 10 second intervals or as
appropriate.
455 Instructions
www.iccontrols.com
Page A-15
Theory of PID Loop Tuning
IC Controls
3. Wait until the system is stable.
4. Press the Manual key to put the loop in manual
mode. Introduce a change in the system by
changing the output of the controller. The
change should be large enough to cause a
significant change in the conductivity level.
Make sure to identify the start time on the
recorder output. The time that the output is
changed is the beginning of the dead time.
326×100 %
1.2×800
= 33.96 %
Integral Time=2.0×2.26 min
= 4.52 min=5 min , 31sec
Derivative Time=0.5×2.26 min
= 1.13 min=1 min , 8sec
Proportional Band =
5. Press Sample to watch the conductivity value
change on the analyzer.
6. Once the process has fully reacted to the change
in controller output, we have the data that is
needed to produce a graph like the one shown in
the example.
7. Draw a vertical line at the point where the
change was introduced. Also draw a line which
is tangent to the process reaction curve at its
steepest point. This slope is R. The tangent line
needs to cross the vertical line that marks the
start of the dead time.
8. L and LR can be read from the graph, as shown
in the illustration.
9. With these parameters, use the following
guidelines to calculate appropriate controller
settings
Proportional control only:
Proportional Band =
LR×100 %
scale
Proportional and Integral:
LR×100 %
0.9×scale
Integral Time=3.33×L min
Proportional Band =
Proportional, Integral, and Derivative:
LR×100 %
1.2×scale
Integral Time=2.0× L min
Derivative Time=0.5×L min
Proportional Band =
In the example, L = 2.26 min and LR = 326 µS/cm.
If the effective input scale is set from 0 µS/cm to
800 µS/cm ([ SC.L ] = 0, [ SC.H ] = 800,
[ unit ] = [ 1E-6 ]), then for PID control we would
obtain the following parameters:
Page A-16
www.iccontrols.com
455 PID option
IC CONTROLS
Error Messages for PID
Error Messages for PID
Error
E3.1
Description
Causes
Solutions
PID output is Conductivity
Check the conductivity input and the conductivity scaling
at safe level. input is off-scale. parameters in the PID loop (SC.L and SC.H). Take controller
action if necessary.
455 Instructions
www.iccontrols.com
Page A-17
Feature Changes for PID
IC Controls
Feature Changes for PID
Due to the addition of the PID option to the base
program, the following is a summary of the
changes that apply to the base instruction manual
for the model 455 analyzer.
•
The PID menu has been added to control the
PID loop.
•
The Manual and Auto keys now control the PID
loop. The alarm override feature is no longer
available.
•
The configuration of the alarm A contact has
been added so that the contact can be used for
pump pulser or time-proportional PID output.
•
Some 4-20 mA output functionality has been
removed, specifically output characterization
and output range switching with range number
indication using out2 or alarm contacts.
•
Some IC Net functionality such as the internal
data log and internal event logging has been
removed.
Page A-18
www.iccontrols.com
455 PID option