1
United Nations Observer Mission in Georgia (UNOMIG)
МИССИЯ ОРГАНИЗАЦИИ ОБЪЕДИНЕННЫХ НАЦИЙ ПО НАБЛЮДЕНИЮ В ГРУЗИИ (МООННГ)
გაეროს სადამკვირვებლო მისია საქართველოში
საქართველოში
GIS in UNOMIG
Short Manual
Capt. Jurg Stuckelberger
MO-664 (Swiss Army)
2009-05-10
GIS in UNOMIG
-2-
Table of Contents
1
Introduction ................................................................................................................................... 3
1.1
Why using GIS?..................................................................................................................... 3
1.2
What is the principal of GIS? ................................................................................................. 3
1.3
Different Type of spatial Data ................................................................................................ 5
1.4
Projection, Coordinate System and Grid References ............................................................ 6
1.4.1
Theoretical background of projection and Coordinate System..................................... 6
1.4.2
Coordinate Reference System “UTM” .......................................................................... 8
1.4.3
Coordinate Reference System “Pulkovo 1942” ............................................................ 8
1.4.4
EPSG Spatial Reference Index .................................................................................... 9
1.4.5
Grid Reference in UNOMIG ......................................................................................... 9
1.5
Difference between GIS and CAD ....................................................................................... 10
2
First Steps in Quantum GIS........................................................................................................ 11
2.1
What is Quantum GIS?........................................................................................................ 11
2.2
Open and adjust Quantum GIS ........................................................................................... 11
2.3
Manage QGIS Project by given geographical Data............................................................. 12
2.3.1
Create, safe and open a Project................................................................................. 13
2.3.2
Adding existing Geodata ............................................................................................ 13
2.3.3
Layer Properties, Customize Symbology, Legend ..................................................... 14
2.4
Create and editing Vector Layer.......................................................................................... 14
2.4.1
Create a new Vector Layer......................................................................................... 14
2.4.2
Edit a Vector Layer ..................................................................................................... 15
2.5
Set a georeference to an image .......................................................................................... 16
2.6
How to transform “UNOMIG false UTM” Data to “Pulkovo 1942” format............................. 18
3
Data structure ............................................................................................................................. 19
3.1
Main Structure in GALI Sector (likewise in ZUGDIDI Sector) .............................................. 19
3.2
Secondary structure ............................................................................................................ 19
3.3
3rd-order structure............................................................................................................... 20
3.4
Policy of Filenames ............................................................................................................. 20
3.4.1
File Names for Geodata ............................................................................................. 20
3.4.2
Shape File and Shape File Names............................................................................. 21
3.4.3
GIS Project File and Project File Names .................................................................... 22
3.4.4
File names for finalized maps..................................................................................... 23
3.5
Description of Shape Files Attributes .................................................................................. 23
3.5.1
Description of "Village" (GALI AOR only) ................................................................... 23
3.5.2
Description of "RFF Position" (GALI AOR only) ......................................................... 24
3.5.3
Description of "Abkhazia Posts" (GALI AOR only) ..................................................... 24
3.5.4
Description of "Heli-Pad" ............................................................................................ 24
3.5.5
Description of "Waypoints" ......................................................................................... 25
3.5.6
Description of “Roads”................................................................................................ 25
3.6
Modification for ZUGDIDI Sector ......................................................................................... 26
3.6.1
Server Space in ZUGDIDI .......................................................................................... 26
3.6.2
Description of “Village” ............................................................................................... 26
3.6.3
Description of “Civil” ................................................................................................... 27
3.6.4
Description of “Military Observations”......................................................................... 28
References and Contact .................................................................................................................... 29
R1
General GIS-References ..................................................................................................... 29
R2
QGIS References ................................................................................................................ 29
R3
Contact and Support............................................................................................................ 30
J. Stückelberger (46A)
GIS in UNOMIG
-3-
1 Introduction
The following handout is a non-scientific, extremely short introduction about Geographic Information Systems (GIS) with
the intension that every UNMO can handle spatial data in the GALI Sector of UNOMIG. It focus how to visual geographical data (crating and printing maps) and not the analysis of geographical data. It is limited on the 2-dimensional application.
1.1 Why using GIS?
GIS stands for Geographical Information System. GIS helps to manage digital data such as digitalized maps, satellite images, points, lines, and areas in order to print different maps in different
scales, to store spatial information or to make different spatial analysis. GIS helps to fetch data
from/to GPS-receiver (or GLONAS, GALILEO) to/from digital as well.
There are several different GIS-Software available, e.g. ESRI ArcGIS, Intergraph Geomedia, or
Quantum GIS (QGIS). The first 2 software costs (full version) about 20’000 USD, QGIS is a freeware program which fulfill the today’s use in GALI Sector. The big difference between commercial
programs and freeware GIS programs is in the analytical functionalities. The visualizing tools are
more or less similar in each GIS program. Spatial analyses are not required yet in GALI Sector and
that’s why QGIS is more than good enough for our purpose.
Until 2008, the maps in GALI were designed with MS PowerPoint mostly. However, PowerPoint is
a program for a slideshow and not designed for managing spatial data. Even PowerPoint is well
known it has a lot of disadvantages comparing to GIS products. For example, we are not able to
import GPS data, we are not able to plot different maps in different scales, and we are not able to
create different layers with different topics.
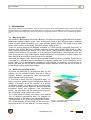
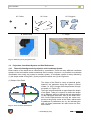
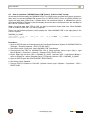
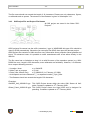
1.2 What is the principal of GIS?
In general we distinguish (i) geographical data, (ii) GIS
projects, and (iii) printable outputs. GIS tool is able to
manage different geographical data simultaneously,
define projects, and to print maps.
(i) The base of each GIS are geographical data, e.g.
maps, waypoints, satellite image. Geographical data has
always a reference about the location in a specific
coordination system. For example, when we scan a map,
we have a simple picture. When we allocate additional
information about the projection, the coordination
system, the orientation and the location of this picture,
then it becomes a map we can use in GIS.
(ii) A GIS-Project is nothing more than a user defined
“mix” of different geographical data. For example we
define a project on the base of the old digitalized map
1:100’000 of the U.S.S.R, on the next layer we include Fig. 1.1 Principal of different layers in order to
CFL, border between SZ and RWZ, on the next layer create a user defined map.
we include all RFF CP and ABK SP. For each category
J. Stückelberger (46A)
GIS in UNOMIG
-4-
of objects we can define a symbol, a color, a label, and other properties. At the end we have a user
defined map based on the old soviet map including the new data of borders and checkpoints and
security posts with our symbol.
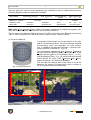
(iii) When the GIS-Project is finished, we are able to print a map. Therefore we have a print composer. We can define the focus/extract of the map, the scale, a legend, the output paper size (A4
to A0), etc.
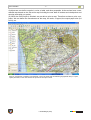
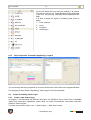
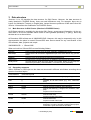
Fig. 1.2 Screenshot of Quantum GIS Software. On the left hand side the different geographical data (i.e. topics,
layers) are listed, on the main window the purview of the map is shown.
J. Stückelberger (46A)
GIS in UNOMIG
-5-
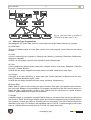
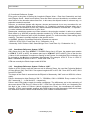
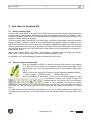
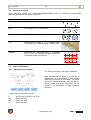
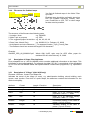
Fig. 1.3 Flow Chart of GIS. (i) GIS-Data, (ii)
GIS-Projects, (iii) Maps (ready to use)
1.3 Different Type of spatial Data
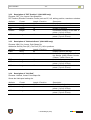
We distinguish (A) Vector Data, and non vector Data such as (B) Raster Data and (C) Images.
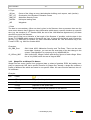
A) Vector Data
There are 3 different types of Vector Data, points, lines, and polygons. Vector Data are also called
Shapes.
A1. Point
A Point is defined by its Longitude (x, Easting) and Latitude (y, Northing). Examples: Checkpoints,
Waypoints, Helipads.
In QGIS, we can assign a specific point-symbol for each different topic.
A2. Line
A line is defined by different points (start point, multiple vertices, end point). Examples: Ceasefire
Line (CFL), Roads, Borders.
In QGIS we can assign a specific line-style (colour, line width, dash-dot) for each topic.
A3. Polygon
A Polygon is an area defined by a closed path (line, where start-point is identical with the endpoint). Examples: Minefields, AOR, a lake.
In QGIS we can assign a specific fill-style (colour, hachures, transparency)
B) Raster Data
Raster data is a grid of cells covering an area of interest. Each pixel, the smallest unit of information in the grid, displays a unique attribute. For example, the altitude of the GALI area is stored in a
Raster file with a grid resolution of 25m x 25m. Raster Data are convenient for spatial analysis.
However, spatial analysis is not part of this handout.
C) Images
A satellite image, an orthophoto (equalized aerial photo) or a scanned map can be georeferenced
and shown in QGIS. Each image contains pixels and therefore images are a kind of raster data as
well. However, images are made for visualizing and not for analysis. The size of the pixel limits the
resolution of the map. For example, the digitalized map of U.S.S.R. is good enough to print maps
down to 1:50’000; when we zoom down to 1:10’000, the maps looks fuzzy.
J. Stückelberger (46A)
GIS in UNOMIG
-6-
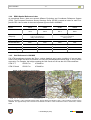
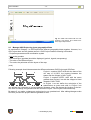
A1 Points
A2 Lines
B Raster Data
A3 Polygons
C Image
Fig. 1.4 Different types of geographical data
1.4
Projection, Coordinate System and Grid References
1.4.1 Theoretical background of projection and Coordinate System
Each location of the world can be referenced by coordinates. There are many different coordinate
systems in the world which makes sometimes the life uneasy. However, it is possible to recalculate
coordinates from mostly any system to another system. A coordinate system is manly defined by
(1) the shape model of the globe, (2) the projection method, and (3) the origin/root.
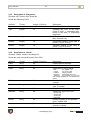
(1) Shape of the Earth
Fig. 1.5 Geoid and best fitted Ellipsoid
The shape of the Earth is nearly a spherical globe;
however, the perimeter along the equator is about
134km (i.e. 0.33%) longer than the perimeter through
the poles (c.f, Figure 1.5).
There are several methods to approximate the shape
of the Earth. Today it is common to define the shape
as an Ellipsoid, which is defined with two parameters
(a) the Equatorial semi-axis, and (b) the Polar semiaxis. Some Ellipsoid does not have the center congruent to the gravity center of the Earth, which leads
to additional 3 parameters (dx, dy, dz) indicating the
shift. All these parameters are also known as Geodetic Datum.
J. Stückelberger (46A)
GIS in UNOMIG
-7-
Over the years, the values of these parameters are redefined in order to obtain better accuracy.
Following Ellipsoid model are relevant for UNOMIG:
Shape Model
Equatorial ½ axis [m]
Polar ½ axis [m]
a
b
Sphere (16th century)
6'371'000
Krasovsky 1940
6'378'245
6'356'863
WGS 1984
6'378'137
6'356'752.314
Inverse flattening
a/(a-b)
∞
298.3
298.2572236
Shift of center [m]
dx
dy
dz
unknown
28
-121 -77
accuracy ±2cm
WGS 1984 (World Geodetic System 1984) is the today’s standard for worldwide cartography, geodesy and navigation. Most GPS receivers use WGS’84 as reference.
The old maps of the General Staff of the former U.S.S.R. are based on the Ellipsoid of Krasovsky
1942. In GALI, the difference to WGS’84 is about +200m to East, +2000m to North.
(2) Projection Methods
U
Greenwich
Fig. 1.6 Cylindrical projection
A projection method maps the curved surface of the ellipsoid to a 2-dimensional plane. The most important methods
are cylindrical-, cone-, and azimuthal- (i.e. polar-) projection. In UNOMIG the Mercator-Projection, a specific cylindrical projection, is relevant (c.f. Fig. 1.6).
For international applications, the Universal Transverse
Mercator Projection System (UTM) is used often. The UTMSystem split the globe in 60 longitudinal (Zone 1_ to 60_)
and 20 latitudinal (Zone _C to _W) zones and some special
zones around the poles (UPS, Universal Polar Stereographic Projection, not relevant in UNOMIG).
The old maps the General Staff of the former U.S.S.R are
based on the method of Gauss-Krüger which is similar to
the UTM system with minor differences.
T
S
Fig. 1.7 UTM Zones
J. Stückelberger (46A)
GIS in UNOMIG
-8-
(3) Coordinate Reference System
Every point in the globe is defined by Longitude (Degree West – East from Greenwich) and Latitude (Degree South – North from Equator), when we take in account the altitude, we need an additional value for the elevation above sea level. In this case, the ellipsoid model is relevant only, no
projection method is required.
However, a coordinate system with degrees, minutes and seconds is not very convenient for calculation. We are more familiar with rectangular (i.e. Cartesian) coordinate systems where the xvalues indicate the distance to East, the y-value indicates the distance to North and -- if required -a z-value indicates the altitude from a given level.
Rectangular coordinate systems are close related to the projection method. It refers to a specific
Earth model (e.g. WGS’84) a specific projection method (e.g. UTM) and the unit (normally meters),
the origin/root or reference point of the coordinate system (i.e. central meridian, false easting, false
northing). The latter is normally defined by the specific zones.
In UNOMIG, following Coordinate Reference Systems are relevant:
- WGS’84 / UTM, Zone 37 and Zone 38 (c.f. Subsection 1.4.2)
- Krasovsky 1940 / Pulkovo 1942, Gauss-Krüger Zone 7 and Zone 8 (c.f. Subsection 1.4.3)
1.4.2 Coordinate Reference System “UTM”
GALI-Sector lies in the Zone UTM 37 T. ZUGDIDI-Sector lies in 2 Zones, the western part remains
in UTM 37 T (36ºE to 42ºE), the eastern part lays in UTM 38 T (42ºE to 48ºE). Due to the fact the
y-Value of the coordinates is continuous starting at the Equator, the latitudinal Zone indication can
be reduced to the Northern or Southern Hemisphere. For example, UTM 37 T lies in UTM 37
North. GARMIN GPS shows UTM 37 T, QGIS uses UTM 37 N.
UTM use normally the Earth shape model WGS’84.
1.4.3 Coordinate Reference System “Pulkovo 1942”
Similar to UTM, Pulkovo split the globe as well in different Zones. He used the Projection Method
of Gaus-Krüger (GK). Zone GK-1 over spans Longitude 0ºE to 6ºE, GK-7 form 36ºE to 42ºE, GK-8
from 42ºE to 48ºE.
The shape of the Earth is assumed as the Ellipsoid of Krasowsky 1940” and not WGS’84, unfortunately.
Pulkovo introduced a false Easting of GK-7 = 7500000m, GK-8 = 8500000. Every x-value in Zone
GK-7 starts with 7…, in GK-8 with 8… respectively.
Pulkovo and UTM produce nearly the same coordinates. The differences are in the numbering of
the zones where UTM Zone 37 refers to GK-7, UTM Zone 38 refers to GK-8, etc. Neglecting the
first digit of the x-value of Pulkovo (which represents the Zone), the coordinates are identical.
However, UTM is used normally together with WGS’84 and not with Krasowsky 1940 which leads
to a difference of about +200m in East direction, and +2000m in North direction.
J. Stückelberger (46A)
GIS in UNOMIG
-9-
1.4.4 EPSG Spatial Reference Index
As mentioned above, there are several different Projection and Coordinate Reference System
(CRS). The European Petroleum Survey Geodesy Group (EPSG) created an index for each Projection/CRS. Here a table of the most important figures used in UNOMIG:
EPSG:
Short name:
32637
32638
28407
38408
WGS’84 / UTM
37 N
WGS 84 / UTM
38 N
Pulkovo 42
GK 7
Pulkovo 42
GK 8
Spheroid
(Ellipsoid):
WGS 1984
Krasowsky 1940
major-½ axis: 6378137 m
flatting: 298.257223563m
major-½ axis: 6378245m
flatting: 298.3m
Projection type:
Transverse Mercator
Central Meridian:
39ºE
45ºE
Unit:
39ºE
45ºE
m [meter]
false Easting:
500’000
500’000
7’500’000
8’500’000
false Northing:
0
0
0
0
1.4.5 Grid Reference in UNOMIG
Full UTM coordinates includes the Zone, x-value (easting) and y-value (northing). If we are interested in the height we have to introduce a z-value for the altitude above sea level. x- and y-values
are metric. For example, the bridge crossing the Gali Canal at S10 has the full UTM coordinate:
UTM 37 T
0723517 m
4724465 m
UTM 37 North
0723517 m
4724465 m
Pulk42 / GK-7 coordinates (QGIS)
WGS84 / UTM coordinates (e.g. Google Earth)
UTM 37 T
0723517 m
4724465 m
Pulkovo
7723725 m
4726470 m
Fig. 1.8 WGS’84 / UTM coordinate-system (GPS, Google Earth) and Pulkovo 1942 / UTM coordinate system used in
UNOMIG. The approximately local correction from WGS’84 to Pulkovo 1942 coordinates is about +200m East, +2000m
North.
J. Stückelberger (46A)
GIS in UNOMIG
- 10 -
Local Correction in GPS
The Grid Reference System we use in UNOMIG is the Reference System of the former U.S.S.R.
(Pulkovo 1942). This is different from the GPS which use WGS’84/UTM System. The reason is
mentioned in Subsection 1.4.1. Here in UNOMIG we work with a local correction of every GPS Receiver of +200m to East, +2'000m to North. However, this local correction is an average with works
in GALI AOR more or less well. There is a special documentation about this topic with the title
"Confusion of Maps, the Utilisation of GPS"
Example: S10
UTM 37 T
Correction
GPS Display
0723517 m
+200 m
0723717 m
4724465 m
+2000 m
4726465 m
This correction is the reason that the UTM coordinates you can see on the GPS are NOT identical
with the coordinates you can see on Google Earth.
Example former MC CP 101 at S10:
Zone
WGS84/UTM
UTM 37 T
UTM 37 T
GARMIN GPS with Correction
QGIS / EPSG 28407
GK 7
x (easting)
723517
723717
UTM +200
7723725
y (northing)
4724465
4726465
UTM +2000
4726470
37
(no information)
(no information)
7723725
237
23
4726470
264
26
Precision
1m
1m
1m
(Pulkovo 1942/ Gaus-Krüger)
old Map U.S.S.R
Grid Reference UNOMIG
Square UNOMIG
1m
100 m
1 km
1.5 Difference between GIS and CAD
GIS was developed to handle 2-dimensional geographical data. Modern GIS tools are able to include the elevation of the terrain which makes GIS 3-dimensional. However, we have still the principle of different 2-dimensional layers.
This is the big difference between GIS and CAD-Software (Computer Aided Design). The later is
able to manage 3-dimensional data properly. However, CAD program are developed for designing
buildings, structural and civil engineering, engines and similar objects mostly shorter than 1 km and
not to manage geographical data with a dimension mostly greater than several kilometers.
J. Stückelberger (46A)
GIS in UNOMIG
- 11 -
2 First Steps in Quantum GIS
2.1 What is Quantum GIS?
Quantum GIS, short QGIS, is an Open Source GIS. Open Source means that the program and the
program code is free available. Everybody may have the possibility to improve the software. There
is a QGIS developer team which voluntarily maintains the software and creates new versions compatible for LINUX, MAC and Windows.
There are several Open Source GIS. The most known is GRASS (Geographic Resources Analysis
Support System). However, GRASS is more sophisticated and therefore also more difficult to use
than QGIS. QGIS has nearly all functions we need here in UNOMIG and support the most common
types of spatial data format. Even my followers in OPS may change the GIS-System, the GIS-Data
are NOT lost. Among all GIS-Tools, QGIS has a high ranking, a good reputation and is able to include GRASS Tools.
We use the Version QGIS 1.0.0 “Kore”. This version is available under http://qgis.org/ (access:
2008-12-24). There is a User Manual (including installation guide) as well.
On Windows, you need administrator rights to execute the QGIS Setup.
2.2
Open and adjust Quantum GIS
After the installation of QGIS you should have the QGIS label on your desktop
or at least you should have in your Program-Folder the Program QGIS. Start
this program now. Your screen should show more or less the same picture than
Fig. 8.
When you open the program the first time, please activate all standard Plugins:
→ (Menu) Plugins → Manage Plugins… → (Button) Select All
After the installation of the Plugins, a lot of icons in the toolbar appear. In order
to convenient working, you should arrange the
toolbars that you can see all icons. The navigation
toolbar is very important an should be placed
somewhere at the left side. If you point the mouse courser to an icon, a text indicates the function
of the tool. e.g., with the "hand" you can move the map, with the loupe you can zoom in (+), zoom
out (-), …
The main window of QGIS has two sub-windows. On the left, a small window which displays the
Geodata loaded for the map; on the right we have the main window which shows the map in preview.
J. Stückelberger (46A)
GIS in UNOMIG
- 12 -
Fig. 2.1 QGIS main window with two subwindows. Left: legend, list of linked Geodata, Right: Map-Preview
2.3 Manage QGIS Project by given geographical Data
As mentioned in Chapter 1, a GIS-Project links different geographical data together. However, in a
GIS Project there are NO geodata stored. A GIS-Project contains following information:
- Projection parameters and coordination system
- Link to the geodata
- How each layer (geodata) should be displayed (symbol, legend, transparency)
- The order of the different layers
- The scale, the perimeter and the layout of the map
(et al.)
Following example should demonstrate the difference between GIS-Project and GIS-Data.
Project 1 contains GOLF AOR with the base of the
old map of U.S.S.R, the borders between the
teams and the villages in GOLF AOR.
Project 2 contains HOTEL AOR with the same
geodata then Project 1 but with the villages in Hotel
instead of GOLF AOR.
In Project 1 we can define the color/style of the
teamborders as green and solid, in Project 2 we
can defined the color/style as red and dashed. However, when we change the location of the border, then we change the geodata and this will effect Project 1 and Project 2 simultaneously.
Be aware if you make a change on project-level or on geodata-level. After editing/changes make
sure that you safe the project AND the geodata as well.
J. Stückelberger (46A)
GIS in UNOMIG
- 13 -
2.3.1 Create, safe and open a Project
Before adding geodata to a project, you should set the project properties first. Under
→ (Menu) Settings → Project Properties… you have two Tabs.
General:
- set Map units to Meters
The rest should be o.k.
Coordinate Reference System:
open Projected Coordinate Systems, select
Pulkovo 1942 / Gaus-Kruger zone 7 (EPSG 28407)
Now save the project. The path and the file name should correspond to the instructions given in
Chapter 3. The suffix of QGIS projects is .qgs. QGIS project files are XML text-files.
You can open a QGIS project file by opening the program, and then under
→ (Menu) File → Open Project…
In WINDOWS XP you can also define that .qgs files have to be open with QGIS.
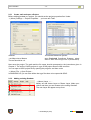
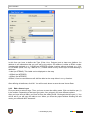
2.3.2
Adding existing Geodata
→ (Menu) Layer → …
Mostly we add Vector Layer or Raster Layer. Make your
choice and then you can browse to the exiting Geodata.
The new Layer will appear on top front.
J. Stückelberger (46A)
GIS in UNOMIG
- 14 -
On the left hand side you have the legend of all layers.
The item on the top (e.g. Team Borders) will be displayed
in the front, the end (e.g. GALI000) will be displayed in the
back.
It is wise to show the layers in following order (front to
back)
1. Point symbols
2. Lines
3. Polygons
4. Grid-Layers
2.3.3
Layer Properties, Customize Symbology, Legend
You can change the layer properties by a mouse double-click on the item in the Legend Window.
For designing a map, the tab "Symbology" and "Legend" are most important.
2.4
Create and editing Vector Layer
2.4.1 Create a new Vector Layer
In Chapter 1 we discussed the different data types for GIS-Data. As we have here in UNOMIG
useful basic maps and orthophotos (raster data), we mark new positions, new roads, and other
objects in Vector Layers.
To create a new Vector Layer, use → (Menu) Layer → New Vector Layer…
J. Stückelberger (46A)
GIS in UNOMIG
- 15 -
In this form you have to define the Type (Point, Line, Polygon) and at least one Attribute. An
attribute is an information that you can add to the object. An attribute is either a REAL number
(number with decimals, e.g. 3.14159), an INTEGER number (number without decimals, e.g. 123),
or a STRING (small Text, e.g. "ABK SP 31"). Please define for any vector layer at least following 3
attributes
- Label (as STRING): This Label can be displayed on the map
- OffSetX (as INTEGER)
- OffSetY (as INTEGER)
OffSetX,Y can be used when we will shift the label on the map either in x or y direction.
After defining all attributes, click OK. You will be ask, where to save the new Vector Data.
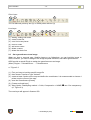
2.4.2 Edit a Vector Layer
First you have to select a layer. Then you have to start the editing mode. Click on the blue pen (1)
in the toolbox. Depending of the layer type (point, line, polygon) you have different options.
After you have done all edits, you have to leave the editing mode. Click again the blue pen (1). You
will be ask if you will save the edits or not. When you close the project without finishing the edit
mode, your edits will NOT be saved!
J. Stückelberger (46A)
GIS in UNOMIG
- 16 -
Point-Layer:
1
2
3
You can add new points by tool (2) or delete points with tool (3)
Line-Layer:
1
(1)
(2)
(3)
(4)
(5)
(6)
(7)
2
3
4
5
6
7
starting, ending edit mode
create a new line
cut a line in two pieces
move a vertex
add a new vertex
delete a vertex
delete the whole line
2.5 Set a georeference to an image
When you have a scanned map, Satellite image or an Orthophoto, you can load this image to
QGIS. However, you have to assign to the image a spatial reference, also called georeference.
QGIS provide a special Plugin to assign the georeference to an image.
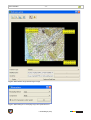
(Menu) Plugins → Georeferencer… → Georeferencer
c.f. Figure 2.2
(1) First you have to load the specific image file
(2) then choose Transform Type "Helmert"
(3) create at least 3 points on the map and define the coordinates. It is recommended to choose 4
points near the corner of the map.
(4) save the Georeference [Create]
(5) [Create and load layer]
(6) Warp Option: Resampling method = Cubic; Compression = NONE; use 0 for transparency
(c.f. Figure 2.3)
The new Layer will appear in Qantum GIS.
J. Stückelberger (46A)
GIS in UNOMIG
- 17 -
Fig. 2.2 QGIS Window for georeferencing an image
Fig. 2.3 QGIS Dialogue for resampling image with spatial reference
J. Stückelberger (46A)
GIS in UNOMIG
- 18 -
2.6 How to transform “UNOMIG false UTM” Data to “Pulkovo 1942” format
As mentioned Unfortunately the GARMIN GPS eTrex (2005) does not know the Pulkovo projection,
that’s why we use the WGS84/UTM system Zone 37 (EPSG 32637), Zone 38 (EPSG 32638) and
correct the data with +200m East / +2000m North. As mentioned before, in UNOMIG we use for
GPS false WGS84/UTM data so that the display shows the same coordinates then the old Maps of
the U.S.S.R. (Pulkovo 1942)
When we upload data from GPS to GIS, we have to transform these data from "false UNOMIG
UTM" to Pulkovo 1942 /GK 7 (or GK 8) projection.
There is a user defined projection, which display the “false UNOMIG UTM” to the right place in the
Pulkovo System:
UNOMIG_to_28407:
+proj=tmerc +lat_0=0
+units=m +no_defs
+lon_0=39
+k=1
+x_0=7499800
+y_0=-2000
+ellps=krass
Procedure:
1. Open a QGIS Project and change/verify the Coordinate Reference System to WGS84/UTM 37N
(Settings > Project Properties > CRS = EPSG 32637)
2. Add Vector Layer (Shp0) with “false UNOMIG UTM” coordinates
3. Change/verify the CRS for WGS84/UTM 37N of Shp0 (activate Vector Layer Shp0 > right
Mouse Button > Properties > General > Change CRS = EPSG 32637)
4. Export Shp0 with an other CRS = UNOMIG_to_28407. (Activate Shp0 > right Mouse Button >
save as ShapeFile > Name ShpNew [Save] > Projection Selector CRS = UNOMIG_to_28407
5. Open a QGIS Project with CRS Pulk/GK7 (ESPG 28407)
6. Add Vector Layer ShpNew
7. Change CRS of ShpNew to Pulk/GK7 (activate Vector Layer ShpNew > Properties > CRS =
ESPG 28407.
J. Stückelberger (46A)
GIS in UNOMIG
- 19 -
3 Data structure
Sections 3.1 to 3.5 describe the data structure for GALI Sector. However, the data structure is
nearly identical in ZUGDIDI Sector, there are small differences only. For example, there are no
Layers for Abkhazian Troupes on Zugdidi side, instead there are positions of MIA and Police HQ.
Section 3.6 describes the modification for ZUGDIDI Sector.
3.1 Main Structure in GALI Sector (likewise in ZUGDIDI Sector)
All GIS-data should be available for the whole GALI Sector, except secret information. At the moment there is no server available which is able to save geodata (blocked by IT policy), that's why
the data are on a shared drive.
At December 2008 all data are in \\MIG09052\GIS\. However, this may be temporarily only. In this
documentation the place is named \\Server\GIS\ were Server stands for any root-location of the
GIS software, data, projects and output.
\\MIG09052\GIS → \\Server\GIS\
When we look into \\Server\GIS\ we see following folders:
Software
BasicMaps
Here you have all files such as QGIS, Manuals, GARMIN-GPS Tools
Here there are all scanned or digitalized maps of the area without any georeference.
Here there are all geographical data with its georeference
All GIS-Project ("a user defined mix of GISData") are stored in this folder.
All maps with the finial layout are stored in this folder. Ready to use maps are
either PDF (favorable), JPG/PNG/BMP, or PowerPoint (not preferable).
GISData
GISProjects
ReadyToUse
3.2 Secondary structure
Within GISData or GISProject we the data are structured in different sub-folders according the regional or functional topics.
\GIS\GISData
\GIS\GISProjects
UNOMIG
{}
GALI
{}
GMIO
GOPS
GGolf
GMIO
GOPS
GGolf
GHotel
GHotel
GIndia
GIndia
{}
Styles
Geodata for all UNOMIG region (e.g. Waypoint of M27)
Geodata for all GALI sector (e.g. CFL, Team-Borders)
Data or Projects created by Gali Military Information
Data or Projects created by Gali Operation
Data of Golf AOR (e.g. Villages, RFF Positions, Helipad).
Projects of Golf Team base
Data of Hotel AOR,
Projects of Hotel Team base
Data of India AOR,
Projects of India Team base
A style contains the definition, how a topic should be
displayed. In order to simplify creating further project,
some basic styles are stored in this folder.
J. Stückelberger (46A)
GIS in UNOMIG
- 20 -
3.3 3rd-order structure
Some GIS-Data folders (e.g. \\Server\GIS\GISData\GALI\) have an additional sub-sub-folder
structure, grouped by the format of the data.
sub-sub-folder
Points
Point Shape file, e.g. checkpoints
Lines
Line Shape file, e.g. borderlines
Polygons
Polygon Shape file, e.g. minefields
TIFF
Georeferenced images in TIFF (Tagged Image
File Format), e.g. Satellite image of GALI-Town
Graticule
Graticules are point-shape-files or line-shape
files in order to visualize the grid reference /
coordinate system on the map.
0
10
20
30
80
70
60
3.4
3.4.1
Policy of Filenames
File Names for Geodata
You find all Geodata in the folder "GISData".
Most geodata are not stored in one file but in
different files. It is reasonable to store all files
belonged to one item in one folder. The folder
should be named identically then the files inside the folder (except the extension). For the
naming it is reasonable to apply following
structure:
1. Abbreviation for Location / Area
{}
entire zone of conflict (e.g. CFL)
GG_
Gali Golf AOR
GH_
Gali Hotel AOR
GI_
Gali India AOR
J. Stückelberger (46A)
GIS in UNOMIG
2. Topic
_VilCent
_RFF_CP
_ABK_SP
_HeliPad
_WP
- 21 -
Center of the village or town (administration building, main square, main junction)
Checkpoint of the Russian Federation Forces
Abkhazian Security Posts
Helicopter landing sites
Waypoints
3. Date
The date is not mandatory. When no date is given in the filename, then we assume there are the
most recent data we have. When we have information which stress a specific situation at a specific
time (e.g. the situation of 15th October 2008, the end of the 1994 Moscow Agreement of), the date
should be a part of the filename.
Some type of files has a limitation of the length of the filename. If possible, write the date in the
format YYYYMMDD which means 4 figures for the Year, 2 figures for the Month, and 2 figures for
the Day, e.g. 20081015 for October 15, 2008. Otherwise indicate the Year and Month only in the
Format YYDD, e.g. 0810 for October 2008.
Examples:
GH_ABK_Post
GI_VilCent_0807
GALI Hotel AOR, Abkhazian Security and Tax-Posts. There are the most
recent data. However, you can see the exact date of the last change in the
column "Date Modified" as a property of any WINDOWS file.
GALI India AOR, Village Centers with the key figures of each village. Situation of July 2008, before the war of August 2008.
3.4.2 Shape File and Shape File Names
Shape-Files are vector (points, lines, polygons) data, a subset of geodata. ESRI, the leading company for commercial GIS, has a specific structure for Shape files. Actually, a shape file contains a
bundle of different files which are stored in one specific folder. All name must be identical, the suffix is different.
Example:
CFL
Folder
CFL.shp
Shape file with spatial data
CFL.shx
indices for the spatial data
CFL.prj
projection of the spatial data
CFL.dbf
dBASE table with the attributes of the features
J. Stückelberger (46A)
GIS in UNOMIG
- 22 -
The file name should not exceed the length of 16 characters. Please use only characters, figures,
no wildcards and no spaces. The structure of the filename is given in Subchapter 3.4.1.
3.4.3
GIS Project File and Project File Names
All GIS project are stored in the folder "GISProjects"
QGIS projects file names has the suffix (extension) *.qgs. In WINDOWS this type of file should be
open by QGIS automatically. Otherwise you can open first QGIS, then open the relevant project.
QGIS project files contains in XML structure every information about projection linked geodata and
layout. For advanced users it is possible to make amendments with a text editor directly in this
XML file.
The file name has no limitation as long it is a valid file name of the operation system (e.g, WINDOWS the max. length is 255 characters, some wildcards are forbidden). However, it is reasonable to respect following structure:
1. Location / Area
e.g. GaliAOR
2. Main Topic or purpose
e.g. Heli
3. Date (Year, Month, Day)
e.g. 20090215 (i.e. February 15, 2009)
- Avoid spaces and use underscore "_" to separate Location_Topic_Data
- The filename should not exceed the length of 32 characters
Examples:
GaliAOR_Heli_20090215.qgs
This QGIS Project shows within the entire GALI Sector all Helipads. Created or updated at 15th February 2009.
GHotel_Patrol_20090215.qgis This QGIS Project shows the Hotel AOR and is designed for
patrolling. Created or updated at 15th February 2009.
J. Stückelberger (46A)
GIS in UNOMIG
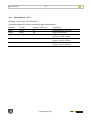
3.4.4
- 23 -
File names for finalized maps
You find all finalized maps in the folder "ReadyToUse".
Finalized map should be preferably stored as
PDF file (Portable Dokument Format). However, PowerPoint or JPG, TIFF or other image
formats are also possible.
The structure of the filename has following parts:
1. Location / Area
e.g. GaliAOR
2. Main Topic or purpose
e.g. OPS
3. The suggested paper format/size e.g. A4, A3, A2, A0
3. Date (Year, Month, Day)
e.g. 20090215 (i.e. February 15, 2009)
- Avoid spaces and use underscore "_" to separate Location_Topic_Format_Data
- The filename should not exceed the length of 32 characters
Example:
GaliAOR_OPS_A0_20090215.pdf
Whole GALI AOR, main map for OPS office, paper format/size ISO A0, date February 15, 2009.
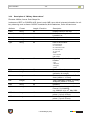
3.5
Description of Shape Files Attributes
Every shapefile has a *.dbf file (dBASE) which contains additional information to the shape. This
information is also called attribute. For example, the label "CP 201" is an attribute of the checkpoint
at S12. We can edit dBASE tabels with specific dBASE reader/editor programms, e.g. OpenOffice
Calc.
3.5.1 Description of "Village" (GALI AOR only)
Filename: VilCenter, format: Point Shape file
Indicates the center of the village (or town), e.g. administration building, school building, main
square, main junction. Even this is a point shape, the attributes contains the information for the
whole municipality.
Attribute
Name
Inhabitants
rGEO
Format
string
integer
real
Length / Precision
80
10
19
rABK
real
19
OffSetX
integer
10
OffSetY
integer
10
J. Stückelberger (46A)
Description
Display label on the map
Number of inhabitants
Ratio (0..1) of Georgia friendly
population. rGEO = 1 - rABK
Ratio (0..1) of Abkhazia friendly
population. rABK = 1 - rGEO
Horizontally shifting of the Label in
points. (1 pt ≈ 0.35 mm)
Vertically shifting of the label in
points. (1 pt ≈ 0.35 mm)
GIS in UNOMIG
- 24 -
3.5.2 Description of "RFF Position" (GALI AOR only)
Filename: RFF_Pos, format: Point Shape file
RFF Position (Russian Federation Forces) such as CP, HQ, artillery position, tranches or shelters.
Attribute
Label
Unit
TRP
OffSetX
Format
string
string
integer
integer
Length / Precision
80
80
10
10
OffSetY
integer
10
Description
Display name on the map
Name of the unit
Number of persons
Horizontally shifting of the label in
points. (1 pt ≈ 0.35 mm)
Vertically shifting of the label in
points. (1 pt ≈ 0.35 mm)
3.5.3 Description of "Abkhazia Posts" (GALI AOR only)
Filename: ABK_Pos, format: Point Shape file.
Abkhazian Security Post (SP), Tax Post (TP), HQ or positions.
Attribute
Label
Unit
Format
string
string
Length / Precision
80
80
TRP
OffSetX
integer
integer
10
10
OffSetY
integer
10
Description
Display name on the map
Name of the unit, e.g. State Security Service (SSS), Border Guards,
Custom, Traffic Control, etc.
Number of persons
Horizontally shifting of the label in
points. (1 pt ≈ 0.35 mm)
Vertically shifting of the label in
points. (1 pt ≈ 0.35 mm)
3.5.4 Description of "Heli-Pad"
Filename: HeliPad, format: Point Shape file.
Shows the Helicopter landing site
Attribute
Label
OffSetX
Format
string
integer
Length / Precision
80
10
OffSetY
integer
10
J. Stückelberger (46A)
Description
Code of the Helipad
Horizontally shifting of the label in
points. (1 pt ≈ 0.35 mm)
Vertically shifting of the label in
points. (1 pt ≈ 0.35 mm)
GIS in UNOMIG
- 25 -
3.5.5 Description of "Waypoints"
Filename: WP, format: Point Shape file.
Shows the Reporting Points
Attribute
Label
Type
Format
string
integer
Length / Precision
80
10
Descr
string
80
OffSetX
integer
10
OffSetY
integer
10
Description
Code of the Helipad
Indicates the level of the Waypoints. 0: M-27, 1: permanent waypoints in the area, 2: temporarily
waypoints
Short description of the point (c.f.
Main Location List)
Horizontally shifting of the label in
points. (1 pt ≈ 0.35 mm)
Vertically shifting of the label in
points. (1 pt ≈ 0.35 mm)
3.5.6 Description of “Roads”
Filename: Roads, format: Line Shape file.
Shows the road net and the quality of the ZOC
Attribute
Label
Name
Patrol
Format
string
string
string
Length / Precision
80
80
80
Description
Display label on the map
Name of the road
Suggestion to use for patrol.
- fast
e.g. Zugdidi - Lia
- normal
e.g. Ruchi - Rike
- possible
road to Kalagali
- restricted
not possible when wet
- adventure
only possible by good soil
and weather condition by very experienced
drivers
Softskin
binary
0/1
Hardskin
binary
0/1
Nyala
Standard
binary
string
0/1
80
Possible for soft skin vehicles (4x4,
2 tones)
Possible for hard skin vehicles
(4x4, 3.5 tones)
Possible for Nyala (11 tones)
Indicate the type of the road:
- 2-track road
- 1-track road
- gravel road
- earth road
Quality
string
80
minutes
real
19
Quality according to the standard.
good / middle / bad
Expected time to drive the sequence in minutes.
J. Stückelberger (46A)
GIS in UNOMIG
3.6
- 26 -
Modification for ZUGDIDI Sector
3.6.1 Server Space in ZUGDIDI
At the moment, the Data are stored on T:\Official Pictures Only\GIS
IT will allocate another specific server space soon.
T:\Official Pictures Only\GIS → \\Server\GIS\
3.6.2
Description of “Village”
Filename: VilCenter, format: Point Shape file
Indicates the center of the village (or town), e.g. administration building, school building, main
square, main junction. Even this is a point shape, the attributes contains the information for the
whole area of the village.
Attribute
Label
Descr
Format
string
string
Length / Precision
80
80
Name
string
80
Municip
District
Inhabit
string
string
integer
80
80
10
Rem
UpDate
string
string
80
80
OffSetX
integer
10
OffSetY
integer
10
J. Stückelberger (46A)
Description
Display label on the map
Kind of the Location. e.g. Admin.
building, School, Main junction.
Name of the Village
according the Main Location List.
Name of the Municipality
Name of the District
Number of inhabitants of the village
or town. Please do not mix up this
figure with the number of the whole
municipality.
Remarks
Date of the latest modification.
Format YYYY-MM-DD
e.g. 2009-05-10 is 10th May 2009
Horizontally shifting of the label in
points. (1 pt ≈ 0.35 mm)
Vertically shifting of the label in
points. (1 pt ≈ 0.35 mm)
GIS in UNOMIG
3.6.3
- 27 -
Description of “Civil”
Filename: Civil, format: Point Shape file
All relevant objects for civilian use including sight seeing objects
Attribute
Label
Name
Type
Format
string
string
string
Length / Precision
80
80
80
OffSetX
integer
10
OffSetY
integer
10
J. Stückelberger (46A)
Description
Display label on the map
Name of the object
Kind of the object, e.g. school, dispensary, church, castel
Horizontally shifting of the label in
points. (1 pt ≈ 0.35 mm)
Vertically shifting of the label in
points. (1 pt ≈ 0.35 mm)
GIS in UNOMIG
3.6.4
- 28 -
Description of “Military Observations”
Filename: MilObs, format: Point Shape file
In absence of RFF on ZUGDIDI AOR, there is only ONE Layer with all relevant information for military observing such as former CIS/PKF Installations, MIA Installations, Police HQ and more.
Attribute
Label
Name0
Format
string
string
Length / Precision
80
80
Name1
Name2
Type
string
string
string
80
80
80
Description
Display name on the map
Name according the actual Main
Location List
Synonym / alternative name
old or former name
Kind of the location:
HQ: Headquarter
CP: Check Point
OP: Observation Post
SP: Security Post
TP: Tax Post
Shelter
Trench System
BTR-Position
Branch
string
80
Type of group/unit who occupy the
location.
- RFF
- ABK SSS
- MIA (geo)
- Police
Unit
TRP
string
integer
80
10
SA
integer
10
HW
integer
10
Rem
UpDate
string
string
80
80
OffSetX
integer
10
OffSetY
integer
10
Name of the unit
Total number of persons (rough
estimation is enough)
Total estimated number of Small
Arms (caliber < 14.7mm)
Total estimated number of Heavy
Weapons (caliber ≥ 14.7mm)
Remarks
Date of the latest modification.
Format YYYY-MM-DD
e.g. 2009-05-10 is 10th May 2009
Horizontally shifting of the label in
points. (1 pt ≈ 0.35 mm)
Vertically shifting of the label in
points. (1 pt ≈ 0.35 mm)
J. Stückelberger (46A)
GIS in UNOMIG
- 29 -
References and Contact
R1
General GIS-References
There are many references available on-line. We know that Internet links may chang frequently.
Here are some links accessed 2009-02-15.
http://www.gitta.info/
Geographic Information Technology Training Alliance. Here
are a lot of self tutorials, training modules to learn GIS.
http://en.wikipedia.org/wiki/Geo
graphic_information_system
Wikipedia is always a good source to get a general overview
of GIS.
http://training.esri.com/gateway/
index.cfm
ESRI is one of the leading company or most probably THE
leading company in matter of GIS. Some free tutorials are
available on this site. The products it selves are very expensive. However, the prices increase year by year and the quality decrease simultaneously. That's why a lot of clients get
more and more angry about ESRI and Open-GIS gains popularity.
http://spatialreference.org/
This website provides information about every projection and
coordinate reference system.
http://freegeographytools.com
Here are several free GIS tools available, e.g. converter from
shape-files to text files, DBF editors, etc…
R2
QGIS References
http://www.qgis.org/
This is the main homepage of Quantum GIS. New updates
and user manuals are available here for free.
http://download.osgeo.org/qgis/
QGIS is an OS-Geo project. Confer this site as well for new
manuals and updates.
J. Stückelberger (46A)
GIS in UNOMIG
- 30 -
R3
Contact and Support
If you need support, do not hesitate to contact the initiator of the GIS project in UNOMIG and author of this short manual.
Capt. Jürg Stückelberger, GALI OPS
GALI, February 2009 (first version)
ZUGDIDI, Mai 2009 (latest amendments)
Military unit:
Civilian address:
Capt Jürg Stückelberger
Armed Forces International Command SWISSINT
Kaserne Wil
CH-6370 Stans-Oberdorf
Dr. sc. techn. Jürg Stückelberger
EcoEng Ldt.
Schönauring 116
CH-8052 Zürich
[email protected]
www.ecoeng.ch
J. Stückelberger (46A)