1
PSZ 19:16 (Pind. 1/07)
UNIVERSITI TEKNOLOGI MALAYSIA
DECLARATION OF THESIS / UNDERGRADUATE PROJECT PAPER AND COPYRIGHT
Author’s full name :
ANISHAZIELA BINTI AZIZAN
Date of birth
:
1th JANUARY 1988
Title
:
MOOD CONTROLLED LIGHT
Academic Session:
2010/2011
I declare that this thesis is classified as :
CONFIDENTIAL
(Contains confidential information under the Official Secret
Act 1972)*
RESTRICTED
(Contains restricted information as specified by the
organisation where research was done)*
OPEN ACCESS
I agree that my thesis to be published as online open access
(full text)
I acknowledged that Universiti Teknologi Malaysia reserves the right as follows :
1. The thesis is the property of Universiti Teknologi Malaysia.
2. The Library of Universiti Teknologi Malaysia has the right to make copies for the purpose of
research only.
3. The Library has the right to make copies of the thesis for academic exchange.
Certified by :
SIGNATURE
880101-02-5644
DR.FAUZAN KHAIRI CHE HARUN
(NEW IC NO. /PASSPORT NO.)
NAME OF SUPERVISOR
Date : 20 May 2011
NOTES :
SIGNATURE OF SUPERVISOR
*
Date : 20 May 2011
If the thesis is CONFIDENTIAL or RESTRICTED, please attach with the letter from
the organisation with period and reasons for confidentiality or restriction.
iii
“I hereby declare that I have read this thesis and in my opinion this thesis is
sufficient in terms of scope and quality for the award of
Bachelor of Engineering (Electrical-Electronics)”
Signature
:
…………………................
Name of Supervisor :
DR. FAUZAN KHAIRI CHE HARUN
Date
20th May 2011
:
MOOD CONTROLLED LIGHT
ANISHAZIELA BINTI AZIZAN
A report submitted in partial fulfilment of the
requirements for the award of the degree of
Bachelor of Engineering (Electrical-Electronics)
Faculty of Electrical Engineering
Universiti Teknologi Malaysia
MAY 2011
ii
I declare that this project entitled “Mood Controlled Light” is the result of my own
research except as cited in the references. The report has not been accepted for any
degree and is not concurrently submitted in candidature of any other degree.
Signature
:
……………………………..
Name
:
ANISHAZIELA BINTI AZIZAN
Date
:
20th MAY 2011
iii
Specially dedicated,
To my beloved mother,
Hajar Bt. Hanapiah,
To my sisters, brothers, lecturers and fellow friends
for their encouragement
iv
ACKNOWLEDGEMENT
Alhamdulillah, praise to Allah S.W.T., the Most Merciful and the Most
Compassionate for His wills and blesses along this journey of life. Peace is upon
him, the messenger of God, Nabi Muhammad S.A.W,
First and foremost, I would like to express my gratitude to my supervisor, Dr.
Fauzan Khairi Che Harun for his guidance and advice in completing this project
successfully.
My appreciation also goes to my mother and family for their supports all the
time. I would like to thank to my colleagues, Fara, Din, Nisa, Nana, Fatimah and
Syifa for helping me a lot in order to complete this project.
Last but not least, I would also like to thanks to my course mates that are
always stand by my side along these four years in UTM. Thank you to all for the
motivation and moral support.
v
ABSTRACT
Biofeedback is the most effective and widely-used performance-enhancing
disciplines used in clinical, government, and military applications. Biofeedback gives
information about the human body using externals instruments. There are many
physiological processes that can be monitor for biofeedback applications such as
temperature, heart rate, EMG (electromyography), BSR (Basal skin response),
respiration and neurofeedback (EEG). Basically, the purpose of this project is to
measure the heart rate of a person and change the environment colour in order to
stabilize back the person mood. So, the polar heart rate monitor was used to measure
the heart rate electrically. Then the compatible receiver will receive the data
wirelessly by following the rules of the orientation between the transmitter and
receiver. In order to process the information measured, the MikroC Pro was used to
program the microcontroller. In this project, there will be three range of heart rate
which are anxiety, sleepy and resting mode. As to stabilize back the person’s mood,
the LED strip used to display the output whether red, green or blue depend on the
information detected and change the environment colour. This is because; colour
therapy believable can give impact to the emotional state of human. In conclusion,
the heart rate was successfully measured and the MikroC Pro was developed to
change the environment colour as to stabilize back the emotion of a person at certain
time.
vi
ABSTRAK
Biofeedback adalah merupakan disiplin bagi meningkatkan prestasi yang
paling berkesan dan banyak digunakan dalam bidang klinikal, kerajaan, dan aplikasi
tentera. Biofeedback memberikan maklumat tentang diri kita dengan menggunakan
instrumen luaran. Terdapat pelbagai proses fisiologi yang dapat memantau aplikasi
biofeedback
contohnya
adalah
seperti
suhu,
degupan
jantung,
EMG
(elektromiografi), bsr (Basal respons kulit), pernafasan dan neurofeedback (EEG).
Pada dasarnya, tujuan projek ini dijalankan adalah untuk mengukur denyut jantung
seseorang dan menukar warna persekitaran bagi menstabilkan kembali emosi
seseorang individu. Maka, alat untuk mengukur denyut jantung jenis kutub
digunakan untuk mengukur denyut jantung secara elektrik. Kemudian penerima yang
serasi akan menerima data tanpa kabel dengan mengikuti Peraturan orientasi antara
pemancar dan penerima. Bagi memastikan maklumat yang diukur dapat diproses,
maka MikroC Pro digunakan untuk program mikrokontroler. Dalam projek ini,
terdapat julat kadar degupan janting iaitu gelisah, mengantuk dan mod rehat. Bagi
menstabilkan kembali emosi dan perasaan seseorang, LED strip digunakan untuk
memaparkan output sama ada merah, hijau atau biru bergantung kepada maklumat
yang dikesan dan kemudiannya menukar warna persekitaran. Hal ini kerana; terapi
warna dipercayai dapat memberikan kesan terhadap keadaan emosi manusia.
Kesimpulan, denyut jantung berjaya diukur dan MikroC Pro dibangunkan untuk
menukar warna persekitaran untuk menstabilkan kembali emosi seseorang pada
waktu tertentu.
vii
TABLE OF CONTENTS
CHAPTER
1
2
TITLE
PAGE
DECLARATION OF THESIS
ii
DEDICATION
iii
ACKNOWLEDGEMENT
iv
ABSTRACT
v
ABSTRAK
vi
TABLE OF CONTENTS
vii
LIST OF TABLE
ix
LIST OF FIGURE
x
LIST OF APPENDICES
xii
INTRODUCTION
1.1
Research Background
1
1.2
Problem Statement
2
1.3
Objective of Study
3
1.4
Scope of Study
3
1.5
Outline of Thesis
4
LITERATURE REVIEW
2.1
Introduction
5
2.2
Heart Rate
5
2.2.1 Manual Method of measuring Heart Rate
7
2.2.2 Monitor method of measuring Heart Rate
8
Microcontroller
9
2.3
viii
3
2.3.1 PIC Microcontroller
10
2.3.2 PIC18F452 Microcontroller
10
2.4
MikroC Pro for PIC
11
2.5
Colors and Person’s Emotion
13
2.6
Color Mood Chart
16
METHODOLOGY
3.1
Introduction
17
3.2
Project Overview
18
3.3
Hardware Development
19
3.3.1 Measuring the Heart Rate
19
3.3.2 Heart Rate Receiver
20
3.3.3 Orientation of Receiver with Polar
Transmitter
3.4
4
5
22
3.3.4 Microcontroller
23
3.3.5 LED Indicator
24
3.3.6 Liquid Crystal Display
26
Software Development
27
3.4.1 MikroC Pro
27
RESULT AND DISCUSSION
4.1
Introduction
33
4.2
Hardware
33
4.3
Software
36
4.4
Result
38
4.5
Discussion
40
CONCLUSION AND RECOMMENDATION
5.1
Introduction
41
5.2
Conclusion
41
5.3 Recommendations
43
REFERENCES
44
Appendices A
46
ix
LIST OF TABLE
TABLE NO.
TITLE
PAGE
2.1
Normal heart beat range
6
2.2
Definition of color
16
3.1
Pin descriptions of RMCM01
21
3.2
PIC18f452 pin connection
24
3.3
Pin definition of HL1606
25
3.4
LED control byte format
30
3.5
LED control bit format
31
3.6
Available color
32
4.1
Pin descriptions of SK40C
36
4.2
Result obtained from the overall project
39
x
LIST OF FIGURES
FIGURE NO.
TITLE
PAGE
2.1
Graph of heart beat
7
2.2
Manual method
7
2.3
Monitor method
9
2.4
Pin diagram of PIC18f452
10
2.5
MikroC Pro for PIC IDE
12
2.6
The Wheel of Life
13
3.1
The project’s flowchart
17
3.2
Project Block Diagram
18
3.3
T31 Transmitter
19
3.4
RMCM01
20
3.5
Diagram of RMCM01
20
3.6
Schematic of polar hear rate receiver
21
3.7
Placement of the transmitter and receiver component
22
3.8
Voltage regulator
24
xi
3.9
Schematic of PIC18F452
24
3.10
Diagram of HL1606
25
3.11
Connection of LCD display
26
3.12
2x 16 LCD
26
3.13
Flowchart of MikroC Programming
28
3.14
Flowchart of MikroC programming
29
4.1
First design by using Altium design
34
4.2
Top view
35
4.3
Side view
35
4.4
Bottom view
35
4.5
Programming for anxiety emotion
36
4.6
Programming for sleepy emotion
37
4.7
Programming for resting emotion
37
4.8
Messages in the MikroC Pro
38
4.9
Relation between the input and output
38
xii
LIST OF APPENDICES
APPENDIX
A
TITLE
MikroC Pro programming for Mood Controlled Light
PAGE
46
1
CHAPTER 1
INTRODUCTION
1.1
Research Background
Biofeedback refers to a process of measuring body natural rhythm such as
breathing and heart rate in which the electrodes placed on skin or fingertips [1]. The
result of the measurement can be analyzed by a professional where displayed on a
monitor. According to the University of Maryland Medical Centre, there are three
types of biofeedback which are electromyography, thermal feedback and
neurofeedback [1]. Electromyography measures muscle tension whereas thermal
feedback focusing on skin temperature and neurofeedback(EEG) works with brain
waves.
Emotions play an important role throughout the span of lives because they enrich
virtually all of person waking moments with either a pleasant or an unpleasant quality [2]. A
study made by Marvin Wernick in the year of 1975 has shown that there is a ring that
able to indicate the wearers' mood based on body heat and emotional state of the
wearer [3]. When you wear the ring, your mood will be determined based on the
color of the stone. As an example, if the stone turn to a dark blue color, then it shows
that you are happy. While, if you are feeling stressed, then the stone color will
change to a very black color.
2
However, in this project biofeedback application that will be used is heart rate
monitor. Once the person’s mood is known by measuring the heart rate of the
person’s, then the surrounding color of the room will change according to color
mood chart. This technique hopefully can stabilize back the person mood because
color therapy uses color to treat mental, emotional and physical problems and restore
the whole person to health and harmony [4].
“When children under detention at the San Bernardino County Probation
Department in California become violent, they are put in an 8-foot by 4-foot
cell with one distinctive feature - it is bubble gum pink. The children tend to relax,
stop yelling and banging and often fall asleep within 10 minutes”.
(Paul E. Boccumini, director of clinical services for the department)
1.2
Problem Statement
There are problem with mood rings which it cannot really show person’s
mood scientific accuracy. Actually, a mood ring stone is filled with thermo tropic
liquid crystal. The crystal is very sensitive because it changes due to changing of
surrounding temperature and atmosphere. So, the mood rings not indicate the
person’s mood accurately.
Besides, nowadays, we are able to detect someone anger but we could not
find certain way to overcome their angry.
Due to these problems, in this project the person’s mood will be determined
by measuring the heart rate and then the surrounding colour will change as to handle
well these problems.
3
1.3
Objective of Study
Based on the problem statement above, this project was designed to stabilize
the person’s emotion by changing the environment color. By managing our emotion,
it may improve our heartbeat and perhaps put us on the path to health [1].
So, as to realize this project, several objectives have been decided. The
interface between the polar heart rate transmitter and receiver with the PIC18F452 is
essential to ensure that the device able to communicate effectively. The objectives of
this project are:
1.4
•
To determine person’s mood based on biofeedback by measuring heart rate.
•
To develop a system to gather data from heart rate strap.
•
To change environment color based on persons; mood.
Scope of Study
As to achieve all of the objectives, the scope was divided into two main parts
which are hardware and software. For the hardware part, the circuit that connect the
heart rate transmitter and receiver and also the display output was build. As to know
the range of the heart rate of a person’s, the mikroC software was used to program
the PIC18F452.
4
1.5
Outline of Thesis
In this thesis, there are five chapters. The objective and scope of the project is
discussed in Chapter 1. In Chapter 2, the literature review will be discussed while
Chapter 3 will cover up the research methodology for this project. The result and
discussion will be explained in Chapter 4. The last chapter which is Chapter 5 will
conclude about this project and a few recommendations will be suggested in that
chapter.
5
CHAPTER 2
LITERATURE REVIEW
2.1
Introduction
This chapter is about the literature review that related to the work. In this
chapter, the device overview and mikroC software will be explained. There are
mainly about heart rate, microcontroller and mood color chart.
2.2
Heart Rate
Heart rate is measured in beats per minute (bpm). If we are stress, our heart
rate will increase. While when we are afraid, the beats per minute will increase more.
In the contrast, if we are in depression, the heart rate is lower. There are various ways
to measure heart rate such as by using pulse oximeter, heart rate monitor and
electrocardiograph. The beats per minute is differ for many people which depending
on the ages, body physical condition and environmental factor. Table 2.1 shows the
normal heart rate according to age.
6
Table 2.1 : Normal heart beat range
Period
Heart Rate
Newborn (baby)
100-160 bpm
Younger children (1-10 years)
70-120 bpm
Teenager (10-17years)
70-100 bpm
Adults
60-100bpm
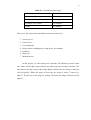
There are a few factors that can influence heart rate such as [5]:
1. Activity level
2. Fitness level
3. Air temperature
4. Body position (standing up or lying down, for example)
5. Emotions
6. Body size
7. Medication use
In this project, we will discuss how emotions will influence person’s heart
rate. There will be three range of heart rate which represent of three emotions. The
emotions are anxiety, sleepy and resting. Range of heart rate for anxiety is between
120-160 bpm[6]. While the range of heart rate for sleepy is from 57 bpm to 61
bpm[7]. The last one is the range for resting. The heart rate range is between 62-69
bpm[8].
7
Figure 2.1 : Graph of heart beat
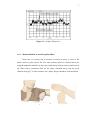
2.2.1 Manual Method of measuring Heart Rate
Heart rate of a person can be measure at where an artery is close to the
surface and at a pulse can be felt. The most common places to measure heart rate
using the palpation method is at the wrist (radial artery) and the neck (carotid artery)
[9]. Other places sometimes used are the elbow (brachial artery) and the groin
(femoral artery)[9]. To take someone else’s pulse, fingers should be used not thumb.
Figure 2.2 : Manual method
8
1.
Carotid Pulse (neck) - Place first two fingers on either side of the neck
carefully. Then, count the number of beats for a minute.
2.
Radial Pulse (wrist) - Place index and middle fingers together on the
opposite wrist, about 1/2 inch on the inside of the joint, in line with the index
finger. Count the number of beats within a one minute period once fined a
pulse.
There should be an estimation the per minute rate by counting over 10
seconds and multiplying this figure by 6, or count over 15 seconds and multiply by 4,
or over 30 seconds and doubling the result[9]. However, by using this shorthand
method there will be potential errors obviously.
2.2.2 Monitor method of measuring Heart Rate
In order to get more accurate and precise value of heart rate measurement,
heart rate monitor, ECG or EEG can be used. The motions of exercise make it the
measurement of heart rate difficult to be done manually. That is why monitor method
is important to be used during exercise especially. Besides, a heart rate monitor is
also useful in the short time periods of heart rate changing. Many heart rate monitors
require at least a little body perspiration between the chest strap and the skin for best
conduction of the signal and ensure that there is a good connection between the chest
strap and chest.[9]. As to increase the conductivity, some water or other fluid can be
added.
9
Figure 2.3 : Monitor method
2.3
Microcontroller
Microcontroller is a small computer on a single integrated circuit that
contains a processor core, memory and programmable input/output peripherals
designed for embedded system applications[10]. As to execute only single specific
task to control a single system, the microcontroller was designed. It contains all the
function required on a single chip such as:
1. Central Processor Unit (CPU)
2. RAM
3. ROM
4. Input/output Port
5. Bus System
6. Timer
7. Others special function such as ADC,PWM and USART
Microcontrollers are often used in automatically controlled product and
device such as implantable medical devices, remote controls, appliances, automobile
engine control system and toys[11].
10
2.3.1 PIC Microcontroller
PIC stands for Programmable Interface Controller originally developed by
General Instrument’s Microelectronic Division[12]. Because of its lower cost, wide
availability and serial programming capability it is become popular among industrial
and personal purposes[12]. In order to operate the design function, PIC needs to be
programmed. There are a few software that can be used to program the PIC whether
MikroC, MPlab and ICSP as example. PIC microcontroller has many families that
categorized due to its function, ability and features. The PIC 18 series is a popular
PIC microcontroller due to many applications and manufactures demand. Its features
include high pin count, high density and complex applications [13]. PIC is the most
popular 8-bit chip in the world, used in a wide variety of applications[14].
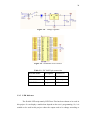
2.3.2 PIC18F452 Microcontroller
Figure 2.4 : Pin diagram of PIC18f452
For
general
purpose
applications
written
in
C,
the
PIC18F452
microcontrollers offer cost efficient solutions require a complex communication
protocol stack. PIC18F452 devices have flash program memory with 32Kbytes and
11
data memory with 256bytes which operate in a range between 2.0 to 5.0 volts. The
operating frequency is from DC to 40MHz. Figure 2.4 above shown the pin
configuration diagram of PIC18F452 (DIP package).
Besides, the PIC18F452 has five parallel ports which are PORTA, PORTB,
PORTC, PORTD, and PORTE. The PIC18F452 also have built-in hardware called
USART (universal synchronous/asynchronous receiver-transmitter) to implement a
serial communication interface which is at pin 26 (RX) and pin 27 (TX). Moreover,
this PIC also can be used for SPI mode.
2.4
MikroC Pro for PIC
The mikroC PRO for PIC is a powerful, feature-rich development tool for
PIC microcontrollers[14]. In developing applications for embedded systems without
compromising performance or control, it was designed to provide the easiest solution
for the programmer. MikroC PRO for PIC provides a successful match featuring
highly advanced IDE, ANSI compliant compiler, broad set of hardware libraries,
comprehensive documentation, and plenty of ready-to-run examples[14].
12
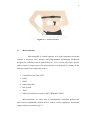
Figure 2.5 : MikroC Pro for PIC IDE
There are few features for MikroC Pro for PIC which are[14]:
1. Write your C source code using the built-in Code Editor (Code and Parameter
Assistants, Code Folding, Syntax Highlighting, Auto Correct, Code
Templates, and more.)
2. Use included mikroC PRO for PIC libraries to dramatically speed up the
development:
data
acquisition,
memory,
displays,
conversions,
communication etc.
3. Monitor your program structure, variables, and functions in the Code
Explorer.
4. Generate commented, human-readable assembly, and standard HEX
compatible with all programmers.
5. Use the integrated mikroICD (In-Circuit Debugger) Real-Time debugging
tool to monitor program execution on the hardware level.
6. Inspect program flow and debug executable logic with the integrated
Software Simulator.
7. Generate COFF (Common Object File Format) file for software and hardware
debugging under Microchip's MPLAB software.
13
8. Active Comments enable you to make your comments alive and interactive.
9. Get detailed reports and graphs: RAM and ROM map, code statistics,
assembly listing, calling tree, and more.
10. mikroC PRO for PIC provides plenty of examples to expand, develop, and
use as building bricks in your projects. Copy them entirely if you deem fit –
that’s why we included them with the compiler.
2.5
Colors and Person’s Emotion
Mood is a temporary state of mind or temper[15] . There is the Wheel of Life
which describes the emotions of change [16].
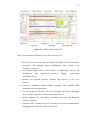
Figure 2.6 : The Wheel of Life
At the top of the wheel is a well-dressed, smiling, kingly or queenly person.
This person is in the position of Happiness which represent things are normal and
going well. The wheel turns with a clockwise movement, the same person is now
upside down and falling through space with a look of distress. This is the position of
Loss. The wheel continues its movement and at the bottom of the wheel the
individual is now nude. This is the position of Suffering. The wheel turns again and
14
rises up to the position of Hope. So, it clearly shown that there are only four
positions in life which are happy, loss, suffering and hope. People are always in one
of these positions. Many things happen in life can affect emotional health which
leads of feeling sadness, stress and anxiety. These things are include [17]:
Being laid off from job
Having a child leave or return home
Dealing with the death of a loved one
Getting divorced or married
Suffering an illness or an injury
Getting a job promotion
Experiencing money problems
Moving to a new home
Having a baby
Many people don’t realize that color can affect our physical bodies and
emotional state at certain time. As we can see, there will be a lot of warm colors on
the walls of kindergarten room. Actually, the learning become more fun with these
color because colors can stimulate brain functioning [18]. From clinical studies in
1990, flashing red lights were shown in the eyes of migraine sufferers at the start of
an attack using special goggles which the light intensity and the frequency of
flashing could be altered [4]. Ninety-three percent of patients had some relief from
the treatment with 72 percent reporting that severe migraines could be stopped within
one hour [4]. Lights of a higher intensity and greater flashing frequency were found
to be the most effective way to conduct the patient. As example, light room therapy
was effective in reducing depressive symptoms in subjects with winter depressive
mood [19].
Besides, scientist has found also that color can affect person mood not just
only used to lighten up a room [18]. Moreover, some also have found that the most
important keys lead to relaxation is color. Form the side of health practitioners, they
have experimented with color and it shows that color can impact to a person’s state
15
of mind and health. The experiment done by Researcher Robert Gerard result that,
when a person look at the red light, their blood pressure and heart rate will increase
while their blood pressure will dropped by looking at the blue light. Gerard also
found that colors with longer wavelengths (the warm colors that are red, yellow and
orange) tense up, while shorter wavelengths (cooler colors like blue, purple and
green) cool down the emotion. For the color therapist, there are many ways to apply
the properly colored light to the patient. Sometimes a color crystal torch is used by
the therapist to transmit the chosen color onto the patient's body. Some other
techniques are like direct light, gems, and jewelry, perfume, clothing and colored
glass. Besides, patients can also eat the appropriately colored foods. It shows how
significant color can give impact to the patient by color therapist.
The general perception of cool and warm colors is universal in which each
individual may have different feeling toward certain colors according on how they
affect us physically, emotionally, and spiritually. As a clear example, if your best
friend always wears blue you may relate that color with him or her, and so it may
influent you differently with others.
16
2.6
Color Mood Chart
There are some explanations about basic colors which were summarized as shown in
the table below:
Table 2.2: Definition of color[4]
Color
Blue
Green
Red
Yellow
Definition
often used in bedrooms
slows metabolic activity
pain relieving
enhance clear thinking
symbolic or nature
calming and refreshing color
can relax patients in hospitals
stimulate the heart to beat faster
increase metabolic activity
color of love
cheerful color
most people lose their tempers and anger in
yellow rooms
Purple
enhance concentration
speed up metabolism
powerful color in enhancing creativity
17
CHAPTER 3
METHODOLOGY
3.1
Introduction
Start
Identify suitable
circuit design
Develop the
hardware
End
Test and
troubleshooting the
circuit
Studying the
software needed for
this project
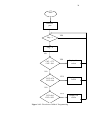
Figure 3.1 : The project’s flowchart
18
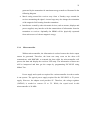
The overall project flow is shown in Figure 3.1. The project start by gathering
all data and information needed for developing the system. By knowing the right
circuit design and choose the best components to use for the hardware is the right
way to start the project. While developing the hardware, the suitable software needs
to be studied in order to ensure that the hardware development can communicate well
with the software design. After completing software and hardware design, the circuit
needs to be test and do troubleshooting to ensure that the circuit can function
successfully due to desire output. Then, the overall steps are done.
3.2
Project Overview
Heart rate strap
Receiver
LED Indicator
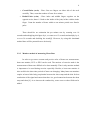
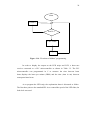
Figure 3.2 : Project Block Diagram
Microcontroller
19
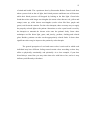
The figure 3.2 shows the project overview which consist of four basic
components. The heart rate strap was used to measure the heart rate. Then, the data
will be sent to the receiver wirelessly.
The microcontroller which is PIC18F452 has been programmed as to process
the data received by the receiver. The range of the heart beat has been divided into
three ranges which are sleepy, anxiety and last but not least is resting.
As to display the output, led strips were used. The output colour displayed is
depending on the range of the heart rate detected by the receiver whether sleepy,
anxiety or resting emotions.
3.3
Hardware Development
3.3.1 Measuring the Heart Rate
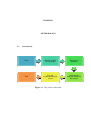
In this project, the type of heart rate monitor that will be used to measure
heart beat is Polar Heart Rate Monitor (T31 Transmitter). The heart beat will be
detected electrically by wearing the transmitter around the chest. Every heart beat
detected through two electrodes of the Polar Transmitter with ECG accuracy. The
heart rate information was then transmitted to Polar RMCM-01 receiver wirelessly
with the help of a low frequency electromagnetic field [20].
Figure 3.3 : T31 Transmitter
20
3.3.2 Heart Rate Receiver
The receiver that compatible with the Polar Heart Rate Transmitter is
RMCM01. The polar heart rate receiver received the heart rate signal from Polar
transmitter belt wirelessly. The receiver that is installed on end user equipment
receives the signal and generates a corresponding digital pulse that is operated on by
the end user equipment electronics [20].
Figure 3.4 : RMCM01
Figure 3.5 : Diagram of RMCM01
21
Table 3.1 : Pin descriptions of RMCM01
Pin Name
HR
Description
Heart beat information 3V
positive pulse, 1ms.
Reset
Reset
OSC
Crystal terminal
F32KIN
Crystal terminal or DC isolated
clock input
OSC_ON
Clock section (input/output)
WIDB_DET
Settings. Connect to Vcc.
FPLS
Pulse detector output 3V
positive pulse, 6ms nominal
width.
LX2
Antenna coil terminal
LX1
Antenna coil terminal
GND
Ground
VCC
Operating voltage
Figure 3.6 : Schematic of polar hear rate receiver
Figure 3.6 shows the schematic of polar receiver. The output from the Polar
RMCM01 module was connected to Port B pin 0 (RB0) of the development board as
an input to the microcontroller.
22
This polar receiver was used in this project due to the advantages of the receiver. The
advantages of the receiver were listed as below:
designed to be used in constant noise
small size, easy to find a place inside end user equipment
working with all Polar transmitter belts
SMD component for Pick & Place machine
Coded and non-coded receiver
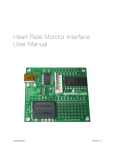
3.3.3 Orientation of Receiver with Polar Transmitter
In order to transmit data to the RMCM-01 receiver on the HRMI board, the
Polar transmitters use a magnetic field. In order to get the maximize signal transfer
between a polar transmitter and the HRMI, the following rules need to be followed
[21]:
The maximum distance between the transmitter and HRMI should not exceed
80 cm.
Figure 3.7 : Placement of the transmitter and receiver component
The magnetic field is generated and detected using coils in the transmitter and
receiver. The receiver coil should be in parallel with the magnetic flow
23
generated by the transmitter for maximum energy transfer as illustrated in the
following diagram.
Metal casing around the receiver may form a Faraday cage around the
receiver attenuating the signal. A metal cage may also change the orientation
of the magnetic field coming from the transmitter.
Interference created by other electronic devices (such as motors, displays and
power supplies) may interfere with the transmission of information from the
transmitter to receiver. Optimally the HRMI will be physically separated
from such sources of electro-magnetic energy.
3.3.4
Microcontroller
Without microcontroller, the information is useless because the desire output
cannot be generated. Therefore, the heart rate strap worn on the chest will
communicate with RMCM01 to transmit the data while the microcontroller will
process the data and display the result on LED strip. The information of heart rate
will be interpreted and then get the output by programming PIC18F452 using
MikroC Pro.
Power supply and crystal are required for a microcontroller in order to make
it can operate. The typical power supply required for the PIC18F452 is 5V power
supply. However, the adapter used provides 9V. Therefore, the voltage regulator
(LM7805) is needed to convert 9V to 5V. While, the crystal used in this
microcontroller is 20 MHz.
24
Figure 3.8 : Voltage regulator
Figure 3.9 : Schematic of PIC18F452
Table 3.2 : PIC18f452 pin connection
Port/Pin name
Description
Connect to
RB0
Input
RMCM-01
RD3-RD7
Output
LED strip
RC0-RC5
Output
LCD
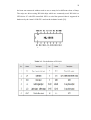
3.3.5 LED Indicator
The flexible LED strip namely LED Deco Flex has been chosen to be used in
this project. It can display a multicolour depend on the user’s programming. So, it is
suitable to be used in this project where the output need to be change according to
25
the heart rate measured without need to use so many led or different colour of lamp.
The strips are driven using HL1606 chips which are commonly used. HL1606 is a
LED driver IC with SPI controlled. SPI is a serial bus protocol that is supported in
hardware by the Atmel AVR CPU used on the Arduino boards [22].
Figure 3.10 : Diagram of HL1606
Table 3.3 : Pin definition of HL1606
26
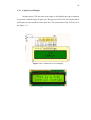
3.3.6 Liquid Crystal Display
In this project, LCD also acts as an output. It will display the type of emotion
of a person’s with the range of heart rate. The type of LCD used is 2x16 means that it
will display word or number in two lines only. The connections of the LCD are as in
the figure 3.11.
Figure 3.11 : Connection of LCD display
Figure 3.12 : 2x 16 LCD
27
3.4
Software Development
For this part, the software for microcontroller which is PIC18F452 is
discussed. The microcontroller was compiled by using MicroC Pro by using C
programming language which is one of the high levels programming language.
3.4.1 MikroC Pro
Generally, the function of microcontroller for this project is actually to detect
person’ heart rate which will be sent to it through polar receiver wirelessly. The data
received is in pulse corresponding to each heart beat. Digital pulse generated by
writing an algorithm in the programming.
28
Start
Initialize
port
YES
Flag = 1
Flag = 0
NO
YES
Display blue
colour
CNT > 375
CNT< 500
NO
YES
Display green
colour
CNT> 870
CNT< 966
NO
CNT>984
CNT< 1053
YES
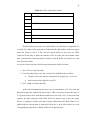
Figure 3.13 : Flowchart of MikroC Programming
Display red
colour
29
Main
Count++
Port B= 1
CNT=count
Flag=1
Figure 3.14 : Flowchart of MikroC programming
In order to display the output on the LED strips and LCD, a heart rate
receiver connected to a PIC microcontroller as shown in Table 3.2. The PIC
microcontroller was programmed in C to measure the time between heart
beats, displays the beats per minute (BPM) and the time (time in ms) between
consequent heart beats.
As to program the LED strip, the explanation about it discussed as follow.
The first three pins are the standard SPI. As to control the speed of the LED fade, the
fade clock was used.
30
Table 3.4 : LED control byte format
Bit
Definition
0
Blue LED control bits
1
2
Red LED control bits
3
4
Green LED control bits
5
6
Fade rate bit, 0 = slow (127 steps), 1 = fast (63 steps)
7
Buffer latch bit, 1 = latch, 0 = don't latch
The HL1606 has two parts, two shift buffers (A & B) and two output drivers
(A & B) [22]. Data on the input pin is shifted into the shift buffers, and then copied,
under the control of the L-1 line, into the output buffers to drive the two LEDs
connected to the chip. It shifts the contents of the A buffer into the B buffer when
data is shifted into each chip and the contents of the B buffer are passed on to the
next chip in the chain.
As to drive data to the strip, the following instructions need to be done:
1. Set L-I low to select the chip.
2. For each control byte to be sent, send the bits in MSB order as follows
Transfer a bit to the chip by setting the D-I pin high for 1, low for 0
Send a clock pulse (high/low) on CK-I
3. Set L-I high to deselect the chip.
At the start of transferring the data, it is very important to set L-I low first and
then pull it high after transferring all the bytes. This is necessary because the state of
L-I governs what is done with the data shifted in to the chip. If L-I is active the chip
transfers the data along the shift buffer chain but doesn't copy it into the output
drivers, so nothing is visible as the data is being shifted down the chain. When L-I is
pulled high the current data is transferred from the A & B shift buffers in to the
corresponding output drivers and the LEDs are lit appropriately.
31
Each LED uses two bits to specify its setting as shown in the table below. As
we can see, the first two combinations is simple, the LEDs are either fully ON or
fully OFF.
Table 3.5 : LED control bit format
Bit 0
Bit 1 Definition
0
0
LED off
0
1
LED on
1
0
LED off, fade up on fade clock
1
1
LED on, fade down on fade clock
There are eight possible colors that can be displayed by the LED strips. The
combinations are as shown in the table 3.6. However, in this project, there are only
three colors was used which are blue, red and green.
Code of programming:
Blue : Soft_SPI_Write(0b10110000)
Red
: Soft_SPI_Write(0b10001100)
Green : Soft_SPI_Write(0b10000011)
32
Table 3.6 : Available color
Red
Green Blue Visible
colour
Off
Off
Off
Off
On
Off
Off
Red
Off
On
Off
Green
Off
Off
On
Blue
Off
On
On
Cyan
On
Off
On
Magenta
On
On
Off
Yellow
On
On
On
White
33
CHAPTER 4
RESULT AND DISCUSSION
4.1
Introduction
This chapter will discuss about the result obtained from this project and some
discussion related to the output from this project. There are all about the hardware
and software of this mood controlled light project.
4.2
Hardware
To design the circuit of mood controlled light, Altium design was used. This
software was used because the size of the Printed Circuit Board (PCB) will be
smaller. However, there are some short circuit occur on that PCB which then SK40C
has been used.
34
Figure 4.1 : First design by using Altium design
SK40C is another enhanced version of 40 pins PIC microcontroller start up
kit. It is designed to offer an easy to start board for PIC MCU user. This kit is used
because it offer[23]:
Save development and soldering time
No extra components required for the PIC to function
All 33 I/O pins are nicely labeled to avoid miss-connection by users
Connector for UIC00A (low cost USB ICSP PIC Programmer) - simple and
fast method to load program
No more frustrated work plugging PIC out and back for re-programming
Perfectly fit for 40 pins 16F and PIC18F PIC
2 x Programmable switch
2 x LED indicator
LCD display (optional)
UART communication
USB on board.
And all the necessities to eliminate users difficulty in using PIC
35
Pin 1
Figure 4.2 : Top view
Figure 4.3 : Side view
Figure 4.4 : Bottom view
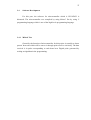
36
Table 4.1 : Pin descriptions of SK40C
4.3
Software
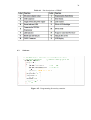
Figure 4.5 : Programming for anxiety emotion
37
Figure 4.6 : Programming for sleepy emotion
Figure 4.7 : Programming for resting emotion
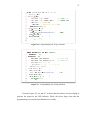
From the Figure 4.5, 4.6 and 4.7, it shows that the software was developing to
generate the output on the LED indicator. While, the below figure show that the
programming was compiled and finished successfully.
38
Figure 4.8 : Messages in the MikroC Pro
4.4
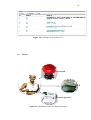
Result
• Crystal ball
• LCD
• Function generator
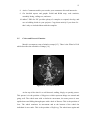
Figure 4.9 : Relation between the input and output
39
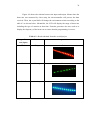
Figure 4.9 shows the relation between the input and output. Means when the
heart rate was measured by chest strap, the microcontroller will process the data
received. Then, the crystal ball will change the environment colour according to the
table 4.2 as shown below. Meanwhile, the LCD will display the range of heart rate
including the type of emotion at that time. Function generator also was used as to
display the frequency of the heart rate to ensure that the programming is correct.
Table 4.2 : Result obtained from the overall project
Range of heart
Emotion
Output colour
57-61
Sleepy
Red
62-69
Resting
Green
120-160
Anxiety
Blue
rate (bpm)
40
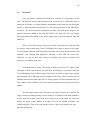
4.5
Discussion
First, the person’s mood was measured by wearing T31 Transmitter on the
chest. The distance between the transmitter and receiver need to follow the rules as
discussed in Chapter 3 to ensure that the information of the heart rate can be gained
precisely. Once the heart beat detected, it will transmit the data to the RMCM-01
wirelessly. The microcontroller interpreted the data and decided the range of the
person’s heart rate which in this case PIC18F452 was used. The PIC was already
been programmed according to the desire output and it can communicate with the
hardware.
There will be three range of heart rate which represents three emotions that
are anxiety, sleepy and resting. If the LCD display the output is anxiety in the range
of 120-160 bpm, then the LED strip will turn to blue colour. This is because blue will
stimulate clear thought and lighter[24]. Besides, it will calm the mind [24].
Therefore, we can say that, blue colour can stabilize the person’s emotion from
anxiety to cool and be more relax.
Second emotion is sleepy. The range of heart is between 57-61 bpm. Once
this range of heart rate detected, the LED strip will change to red colour while the
LCD will display sleepy with its range of heart rate. In order to make sleepy people
more energetic, the LED strips need to change to red colour. This is because red can
stimulate and raise the pulse rate[24]. So, sleepy people will feel fresh and wake up.
This condition most suitable to be used in the environment class which especially for
student.
The last emotion that will be discussed is resting. From previous research, the
range of heart rate during resting is in the range of 62-69 bpm. If the data transmit is
in this range, the output colour will turn to the green. On the hand, the LCD will
display the ouput resting, BPM= 62-69 bpm. Green is the symbol of balance and
resting mode[24]. That is why the output colour of green can stabilize the person’s
emotion in this mode.
41
CHAPTER 5
CONCLUSION AND RECOMMENDATION
5.1
Introduction
Generally, this chapter will be about the conclusion for overall of this project.
Besides, the recommendations for future development are also will be explained in
this chapter.
5.2
Conclusion
Numerous studies have demonstrated that different emotions are associated
with different patterns of autonomic nervous system (ANS) activity, as measured by
heart rate variability (HRV)[25]. Actually, emotion can affect the way of heart beat.
By managing person’s emotion, it may improve the heart beat. That is why this
project has been done.
42
The emotional state of a person is very important because it can affect health
and the activity of that person. If a person has negative emotion during attending a
lecture for example, then it can give impact to him. This is because he cannot give
attention and focusing to the lecture in front. That is why this project was carried out
and hopefully by changing the environment color the person’s mood can be handle
well. The first objective of this is to measure the heart rate of a person by using heart
rate monitor. This objective was successfully done where the polar heart rate monitor
was used. However, the result of heart rate measured is not really can be say as an
emotion. This is because from the project, the data that was gained only heart rate.
So, the value of heart rate cannot determine the emotion of a person exactly.
Moreover, the software of MikroC has successfully developed as to change
the environment color. The color will change according to the three range of heart
rate which is sleepy, anxiety and resting. If the person is sleepy, then the color will
change to red. This is because red will make the person more energetic. On the other
hand, when the person is in an anxiety mood, the LED strip will turn to blue color as
to stimulate the pulse rate. The last emotion studied in this project is resting mode.
When the person is in resting mode, the color will change to green. This is because
green is believable as a symbol of balance and resting mode.
43
5.3
Recommendations
From this project the exact emotion of a person is not really accurate. This is
because the other measurement other that heart rate also needs to be done to obtain
the correct one. Here, there are a few recommendations for future development:
•
Detect person’s mood by using other method such as measuring body
temperature.
•
Find more range of heart rate for other emotions such as happy, depression
and angry.
44
REFERENCES
1.
Callahan, C., Biofeedback. Biofeedback for Heart-Rate Variability, 2011.
2.
Pieter M.A. Desmet, D.U.o.T., Measuring Emotions. Development and
application of an instrument to measure emotional responses to products.
3.
Wikipedia, t.f.e., History. Mood ring, July 2008.
4.
ICBS, I. Color therapy. 2011; Available from:
http://www.holisticonline.com/Remedies/migraine/mig_color.htm.
5.
Edward R. Laskowski, M.D., What's a normal resting heart rate? Mayo
Foundation for Medical Education and Research
1998-2011.
6.
HeartMath, I.o. (2011) Exploring the Role of the Heart in Human
Performance.
7.
Virend K.Somers, M.D., D.Phil.,Mark E. Dyken, M.D.,Allyn L.Mark, M.D.,
and Francois M. Abboud, M.D. , Symphatetic-Nerve Activity during Sleep in
Normal Subjects. New England Journal of Medicine, 2010.
8.
Netfit, Resting Heart Rate. 2010.
9.
Topendsports (2011) Fitness Testing.
10.
Encyclopedia, t.F. Microcontroller. 2010.
11.
Banepali, R.M., Microcontroller. March 2010.
12.
The Free Encyclopedia, W. PIC Microcontroller. 2010.
13.
Ibrahim, D., Advanced PIC Microcontroller Projects in C: from USB to
ROTS with the PIC 18f Series. 2008.
14.
mikroElektronika, Introduction to mikroC PRO for PIC. 2010.
15.
Dictionary, W.E. Mood. 2011; Available from:
http://dictionary.reference.com/browse/mood.
16.
Johnston, D.H., The Emotions of Change. The Wheel Of Life, 1997.
17.
Physicians, A.A.o.F. Mind/Body Connection: How Your Emotions Affect
Your Health. 2004-2011; Available from:
http://familydoctor.org/online/famdocen/home/healthy/mental/782.html.
18.
Kosednar, K., Can Color Change Your Mood? Alaska Wellness.
45
19.
C. Rastad a, b.,
, J. Ulfberg b,c, P. Lindberg a, Light room therapy effective
in mild forms of seasonal affective disorder—A randomised controlled study.
Journal of Affective Disorders 108 (2008) 291–296, 2008.
20.
Polar Electro Inc - OEM Division, P.E.E.B., RMCM-01 Heart Rate Receiver
Component. Adding Heart to Your Technology.
21.
danjuliodesigns, Heart Rate Monitor Interface User Manual. 2008-2010.
22.
Burlison, A., How the HL1606 works. 2010.
23.
Technologies, C., SK40C. ENHANCED 40 PINS PIC START-UP KIT,
December 2010.
24.
Wikipedia, t.f.e., The common Color Mood Chart October 2010.
25.
Demaree, Heart Rate Variability. 2004.
46
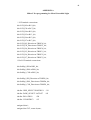
APPENDIX A
MikroC Pro programming for Mood Controlled Light
// LCD module connections
sbit LCD_RS at RC4_bit;
sbit LCD_EN at RC5_bit;
sbit LCD_D4 at RC0_bit;
sbit LCD_D5 at RC1_bit;
sbit LCD_D6 at RC2_bit;
sbit LCD_D7 at RC3_bit;
sbit LCD_RS_Direction at TRISC4_bit;
sbit LCD_EN_Direction at TRISC5_bit;
sbit LCD_D4_Direction at TRISC0_bit;
sbit LCD_D5_Direction at TRISC1_bit;
sbit LCD_D6_Direction at TRISC2_bit;
sbit LCD_D7_Direction at TRISC3_bit;
// End LCD module connections
sbit SoftSpi_SDI at RD2_bit;
sbit SoftSpi_SDO at RD6_bit;
sbit SoftSpi_CLK at RD3_bit;
sbit SoftSpi_SDI_Direction at TRISD2_bit;
sbit SoftSpi_SDO_Direction at TRISD6_bit;
sbit SoftSpi_CLK_Direction at TRISD3_bit;
#define CHIP_SELECT PORTD.F4
//LI
#define FADE_SELECT LATD.F7
//SI
#define DI LATD.F6
//DI
#define CI PORTD.F3
//CI
unsigned char i;
unsigned int CNT, count=0,state;
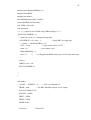
47
unsigned short DisplayBPMflag = 0;
unsigned short BPM;
unsigned int number;
char txtBPM[6],txtcount[]="00000" ;
//char txtBPM[6],txtTimems[6] ;
void TMR0_ON(void);
void interrupt()
{ //<<<<<<generate servo PPM using TMR0 intrrupt>>>>>
if(INTCON.TMR0IF==1)
{ //portc.f0=~portc.f1; //testing interrupt time
if (PORTB.F0==0){ state = 1;
// check RB7 on rising edge
// if (state ==1 && PORTB.B1==1){
CNT = count;
// Copy count2 value to CNT
count = 0 ;
// reset count2 value
DisplayBPMFlag = 1;
state = 0;
// }
// set flag that the BPM can be put to LCD in the main loop
}
count++;
TMR0L=164; //164
INTCON.TMR0IF=0;
}
}
void main(){
//
ANSEL = ANSELH = 0;
TRISB = 0x0f;
// ALL set as Digital I/O
// Set RB7 and RB6 as input, rest is output
OSCCON=0b00011101;
ADCON1 = 0X0F;
TRISC = 0X00;
TRISE = 0X00;
TRISD=0x00;
Lcd_Init();
// Start LCD
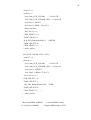
48
Lcd_Cmd(_LCD_CLEAR);
// Clear LCD
Lcd_Cmd(_LCD_CURSOR_OFF); // Cursor off
TMR0_ON();
// Write text in first row
while(1){
// program loops around in here
if(DisplayBPMFlag == 1){
DisplayBPMFlag = 0;
// clear displayBPMflag
/*CHIP_SELECT = 0;
FADE_SELECT=1;
Soft_SPI_Write(0b10001011);
FADE_SELECT=0;
CHIP_SELECT = 1;*/
// ByteToStr(number, txtcount); // convert Timems to string
// Lcd_Out(2,1,txtcount);
// display Timems string on LCD
if(CNT>375&&CNT<500){
// When heart rate is in normal range (30-
240BPM)
portb.f7 = 1;
portb.f6 = 0;
Lcd_Cmd(_LCD_CLEAR);
// Clear LCD
Lcd_Cmd(_LCD_CURSOR_OFF); // Cursor off
Lcd_Out(1,1,"ANXIETY");
Lcd_Out(2,1,"BPM = 120 to 160");
for(i=0;i<9;i++){
CHIP_SELECT = 0;
FADE_SELECT=1;
Soft_SPI_Write(0b10110000); //BIRU
FADE_SELECT=0;
CHIP_SELECT = 1; }
// delay_ms(50);
}
else if(CNT>870&&CNT<968){
49
portb.f7 = 0;
portb.f6 = 1;
Lcd_Cmd(_LCD_CLEAR);
// Clear LCD
Lcd_Cmd(_LCD_CURSOR_OFF); // Cursor off
Lcd_Out(1,1,"REST");
Lcd_Out(2,1,"BPM = 62 to 69");
delay_ms(100);
for(i=0;i<9;i++){
CHIP_SELECT = 0;
FADE_SELECT=1;
Soft_SPI_Write(0b10000011);
//GREEN
FADE_SELECT=0;
CHIP_SELECT = 1; }
// delay_ms(50);
}
else if(CNT>984 && CNT < 1053){
portb.f7 = 0;
portb.f6 = 1;
Lcd_Cmd(_LCD_CLEAR);
// Clear LCD
Lcd_Cmd(_LCD_CURSOR_OFF); // Cursor off
Lcd_Out(1,1,"SLEEP");
Lcd_Out(2,1,"BPM = 57 to 61");
for(i=0;i<9;i++){
CHIP_SELECT = 0;
FADE_SELECT=1;
Soft_SPI_Write(0b10001100);
//RED
FADE_SELECT=0;
CHIP_SELECT = 1;
}
// delay_ms(50);
}
//ByteToStr(BPM, txtBPM);
// Lcd_Out(2,1,txtBPM);
// convert BPM to string
// display BPM string on LCD
50
INTCON.TMR0IF=0;
}
else {
}
}
}
void TMR0_ON(void)
{
TMR0L=164;//TMR0H=0X80;
//give TMROH:TMROL = 32896 (maximum val
= 65535)
INTCON=0B11100000;
//enable all unmasked interrupt & TMR0 overflow int
T0CON=0B11001000;
//enable 8bit TMR0, internal clock, no prescale
} //0.05ms