1
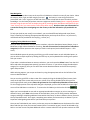
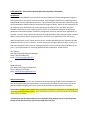
USER MANUAL: 2011 Florida Statewide Wild Turkey Population Assessment
Introduction:
The Florida Fish and Wildlife Conservation Commission’s (FWC) Wild Turkey Management Program is
seeking assistance from natural resource personnel, land managers, and others in completing a 2011
Statewide Wild Turkey Population Assessment. This assessment will assist the FWC in determining the
relative abundance and distribution of wild turkeys throughout Florida. Results of this assessment will
be compared with habitat data, prior turkey distribution data (1973, 1977, and 2001), and other
available information to assist in defining focal areas for more detailed investigation of wild turkey
populations and implementation of proactive management actions to improve turkey populations as
required. The final results of the assessment will be made available to those who participate, and each
agency or organization will be recognized for their assistance in any publications from this project.
While the application is user friendly and easy to use, we have developed this user manual to provide
detailed instruction for your reference. General instructions will appear when you log in, and you can
also access the general instructions by clicking on the help icon (?) at the top of the Grid Menu at any
time. If you have questions or are having difficulty with the application, please contact:
John Denton
FWC Upland Gamebird Research Biologist
Phone: (352) 955-2081 x122
Email: [email protected]
or
David Nicholson,
FWC Wild Turkey Program Coordinator
Phone: (850) 627-1773 x109
Email: [email protected]
General Instructions:
Only complete areas which you have visited at least 10 times during the past 3 years and where you
have knowledge of wild turkey populations. Do not provide information for areas where you do not
have knowledge during the past 3 years. Please be as detailed as possible with your selections.
Please Note: completing areas where you know turkeys are absent is as important as completing areas
where you know turkeys are present. Also, just because an area is an urban area, does not necessarily
mean turkeys are absent.
**Always press the save button when you are finished making changes or prior to selecting a new
County so that the information you have provided will not be lost.
Registration and Login:
The registration and login web page is available at:
http://35.8.125.217/turkeysurvey/2011/login.html
If you have previously registered, then just enter your Username and Password at the bottom of the
Introduction page and select Log In. If you do not remember your UserID and/or Password please email
[email protected] and include Lost Info in the subject line and include your full name in
the email.
If this is your first visit to the site you will need to register. To register, select the “Register” button at
the bottom of the screen. Please complete the requested contact information (First Name, Last Name,
Address, City, State, Zip Code, Phone Number, and Email Address) such that we can contact you if there
are questions regarding the information you provide. Your contact information will also allow us to
provide you with updates and results of the survey. Next, select an “Occupation” from the drop down
list that best describes your current position. If a suitable occupation is not listed, then select “Other”
from the bottom of the list and type in your primary occupation title in the text box that is provided.
Next, select your “Primary Affiliation” from the drop down list and select the Agency or Organization
that you are affiliated with. If your primary affiliation is not listed, then select “Other” from the bottom
of the list and type your primary affiliation in the text box that is provided. Next, select a User Id and
Password that will be required to login to the application after you register and during future visits to
the site. Note: a unique User Id is required, if the User ID you select is already taken it will indicate
the User ID already exists and you will need to select a different User ID. After all of your information
has been provided, select Submit at the bottom of the screen. If your registration was successful, a
window will display indicating the User was created successfully and that you can login. Click on OK and
you will be directed to the login page. Enter your Username and Password and then click Login to enter
the application. If your registration was not successful, review the page and supply corrected
information where red boxes occur and then select Submit.
Application Preview:
Grid On/Off
Box
Grid Menu
Map Displays
County
Drop-Down Menu
Pan Tool
Zoom Bar
*Green areas
represent
public lands
Abundance
Buttons
Delete
Button
Save Button
Map Navigation:
Use the County drop-down menu at the top of the Grid Menu to select the county of your choice. Move
the map up, down, right, and left using the pan tool
and zoom in or out using the slide bar
(vertical bar with + and – signs) on the left side of the screen to help find the areas for which you have
knowledge. Use the County drop-down menu to navigate to another County (Note: navigating between
Counties using the pan tool will not display the grid for providing turkey abundance information for the
“new” County, thus, you must use the County drop-down menu). Be sure to Save your information for
a particular County prior to navigating to a new County so that the information you provided is not
lost.
To help you visualize your area(s) in more detail, you can select different background maps (Street,
Topo, or Satellite) by selecting the appropriate Map Display at the top of the screen. As you zoom in,
more details will be provided on the map (e.g., streets, etc.).
Assigning Turkey Abundance to Areas:
Once you have identified the area you wish to complete, select the abundance button (Absent, Low, or
Moderate to High relative abundance of turkeys; see end of instructions for descriptions of abundance
categories) that best represents the majority of land in each square (each individual square = ~250
acres).
Select individual squares by pointing and clicking your left mouse button on each individual square, or
you can select multiple squares by holding the CTRL key on your keyboard while scrolling over squares
with your mouse.
If you make a mistake and want to remove a selection, you can choose the Delete button from the Grid
Menu and select the appropriate square(s) you want to remove. If you wish to change the abundance
category for a square(s), then you can select the correct abundance button and select that square(s)
again and press Save.
While selecting squares, you can pan and zoom by using the appropriate tools on the left side of the
screen as detailed above.
You can turn the grid off for a clearer view of the map by clicking the Grid On/Off box (remove check
mark) at the top of the screen and you can turn it back on by clicking Grid On/Off at the top of the
screen again (check mark present; Note: the grid must be on to input turkey abundance information).
To view a larger portion of the map while the grid is displayed, you can click on MIN in the upper right
corner of the Grid Menu to minimize it. To restore the Grid Menu just click on the Grid bar
.
When you have completed an area with an appropriate abundance category or prior to moving to a
different County, press Save at the bottom of the Grid Menu, then you can select another abundance
category and begin completing additional areas within that County or select a different County from the
County drop-down menu. Once again, completing areas where you know turkeys are absent is just as
important as designating areas where you know turkeys are present.
Once you are finished with your session, make sure you press the Save button at the bottom of the Grid
Menu and then just close your internet browser (there is no need to log out). You will be allowed to log
back in at a later time to complete additional areas or remove selections from previous sessions as often
as you want until the survey deadline (May 15, 2011). When you log back in you will be able to view the
areas you have previously completed for each individual County by selecting each County in the County
drop-down menu.
Remember, always press the Save button when you are finished making changes or prior to moving to
a new County so that the information you provided will not be lost.
Abundance Descriptions:
Absent: No sightings of turkeys or turkey sign and no turkeys have been harvested during the previous 3
years.
Low Abundance: 1-2 sightings of turkeys or turkey sign for every 10 site visits. Turkeys are seen in low
numbers or turkey harvest is low relative to the number of hunters.
Moderate to High Abundance: 3 or more sightings of turkeys or fresh sign for every 10 site visits and/or
turkeys are seen in moderate to high numbers and/or moderate to high harvest relative to the number
of hunters.
In general terms:
- Areas with low turkey abundance would typically have flocks with fewer than 5 birds, and
harvest is usually less than 1 turkey harvested per 3 hunters per season (i.e., < 33% harvest
success).
-
Areas with moderate to high abundance of turkeys would often have flocks with at least 5
turkeys and harvest is generally 1 turkey harvested per 3 hunters per season or more (I.e., > 33%
harvest success).
Note: When using turkey harvest numbers you must consider the level of hunting pressure. It is
possible that areas with moderate to high turkey populations may have lower harvest success when
there is relatively high hunting pressure and areas with low turkey abundance may have higher
harvest success as a result of very limited hunting pressure. Because of this, we recommend that
you consider both the number of turkeys and/or turkey sign observed on a property in conjunction
with available harvest data. Also, when evaluating harvest data it is useful to examine harvest over
several years, rather than just a single year since harvest can be significantly influenced by weather
and other variables during some years. The harvest information provided for abundance categories
above is only provided as a general rule for consideration.
Example of Completed Map:
Red = Moderate to High Turkey Abundance
Yellow = Low Turkey Abundance
Blue = Turkeys Absent
Other Areas are where respondent did not have knowledge of turkey populations during the previous 3 years.