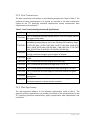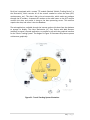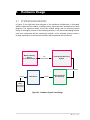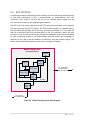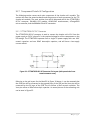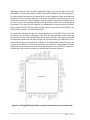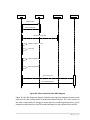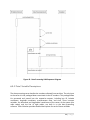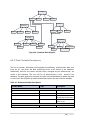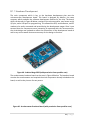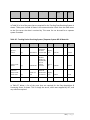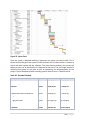
1
TRANSIT TRACKING SYSTEM (TTS)
Project Documentation
EECS Senior Design Group 7
2010-2011
Karl Banks
Chris Dorros
Monica Nguyen
Tyler Zaino
Sponsor:
David Norvell
UNIVERSITY OF CENTRAL FLORIDA
ii | P a g e
Table of Contents
1
Executive Summary .............................................................................. 1
2
Project Description ............................................................................... 2
3
2.1
PERSONNEL ................................................................................................. 2
2.2
PROJECT MOTIVATION.............................................................................. 2
2.3
GOALS & OBJECTIVES................................................................................ 3
2.4
REQUIREMENTS & SPECIFICATIONS ....................................................... 4
2.4.1
Overall System ................................................................................................... 4
2.4.2
Data Transmission ............................................................................................. 5
2.4.3
Web Application................................................................................................ 5
Research ................................................................................................ 6
3.1
3.1.1
Tracking Data Communication Methods ........................................................ 7
3.1.2
Position Detection ............................................................................................. 8
3.1.3
User Interface................................................................................................... 10
3.1.4
Microcontrollers............................................................................................... 12
3.2
4
EXISTING PROJECTS & PRODUCTS ........................................................ 13
3.2.1
Previous Senior Design Project ...................................................................... 13
3.2.2
National University of Sciences and Technology Project ............................. 15
3.2.3
General Design of Systems Available ............................................................ 17
Project Architecture Selection ............................................................ 20
4.1
POSSIBLE ARCHITECTURES & RELATED CHOICES .............................. 20
4.1.1
Possible Hardware Architecture Choices ...................................................... 20
4.1.2
Possible Software Architecture Choices ........................................................ 23
4.2
SELECTION OF INITIAL DESIGN ARCHITECTURE ................................ 25
4.2.1
Hardware Architecture Selection ................................................................... 26
4.2.2
Software Architecture Selection ..................................................................... 28
4.3
5
RELEVANT TECHNOLOGIES ...................................................................... 6
OVERALL SYSTEM ARCHITECTURE......................................................... 29
Hardware Design ................................................................................ 31
5.1
SYSTEM LEVEL DESIGN ............................................................................ 31
5.2
BUS MODULE ............................................................................................. 32
5.2.1
Component Details & Configuration ............................................................. 33
iii | P a g e
5.2.2
Circuit Schematic ............................................................................................ 40
5.2.3
PCB Layout ...................................................................................................... 43
5.2.4
Part List ............................................................................................................ 44
5.3
5.3.1
5.4
6
RECEIVING SYSTEM ................................................................................... 46
Component Detail & Configuration .............................................................. 47
DATA PROCESSING & PRESENTATION .................................................. 49
5.4.1
Data Acquisition & Processing Server Hardware Configuration ................. 50
5.4.2
Web Server Hardware Configuration ............................................................ 51
5.4.3
Client Workstation Minimum Hardware Configuration ............................... 51
Software Design ................................................................................. 52
6.1
SYSTEM LEVEL DESIGN ............................................................................. 52
6.2
MICROCONTROLLER FIRMWARECODE ................................................. 53
6.2.1
Bootloader ...................................................................................................... 54
6.2.2
UML Diagrams ................................................................................................ 54
6.2.3
Function Descriptions & I/O Variables .......................................................... 56
6.2.4
Packaged Data Format ................................................................................... 58
6.3
6.3.1
6.4
RF MODEM NETWORK.............................................................................. 60
Parameter Configuration ................................................................................ 60
DATA COLLECTION & PROCESSING SERVER ....................................... 60
6.4.1
Software Configuration .................................................................................. 61
6.4.2
Block Diagrams ............................................................................................... 63
6.4.3
UML Diagrams ................................................................................................ 63
6.4.4
Data/ Variable Descriptions ........................................................................... 64
6.4.5
Function Descriptions ..................................................................................... 65
6.5
DATABASE .................................................................................................. 66
6.5.1
Software Configuration .................................................................................. 66
6.5.2
Block Diagrams ............................................................................................... 67
6.5.3
Data/ Variable Descriptions ........................................................................... 68
6.5.4
Function Descriptions ..................................................................................... 70
6.6
WEB APPLICATION .................................................................................... 70
6.6.1
Software Configuration .................................................................................. 71
6.6.2
UML Diagrams ................................................................................................ 72
6.6.3
Data/ Variable Descriptions ........................................................................... 74
6.6.4
Function Descriptions ..................................................................................... 75
6.7
CLIENT WORKSTATION ............................................................................ 76
iv | P a g e
6.7.1
Minimum Required Software Configuration ................................................. 76
6.7.2
Final Web Application Interface..................................................................... 77
7
Design Summary ................................................................................. 78
8
Build Plan ............................................................................................ 79
8.1
9
DEVELOPMENT.......................................................................................... 79
8.1.1
Hardware Development.................................................................................. 80
8.1.2
Software Development ................................................................................... 82
8.2
PRODUCTION ............................................................................................ 85
8.3
VENDORS ................................................................................................... 85
Test Plan.............................................................................................. 86
9.1
SOFTWARE TESTING ................................................................................ 86
9.1.1
Testing Overview ............................................................................................. 87
9.1.2
Data Acquisition .............................................................................................. 88
9.1.3
Database .......................................................................................................... 94
9.1.4
Web Server ...................................................................................................... 96
9.1.5
Assembly Language ...................................................................................... 100
9.1.6
Final Software System Evaluation ................................................................ 102
9.2
HARDWARE TESTING ............................................................................. 103
9.2.1
Testing Overview ........................................................................................... 103
9.2.2
Testing Conditions ........................................................................................ 103
9.2.3
Passing Criteria .............................................................................................. 104
9.2.4
Tracking Device ............................................................................................. 104
9.2.5
Transmitter ..................................................................................................... 109
9.2.6
Receiver .......................................................................................................... 110
9.2.7
Transmitter & Receiver Unit Test.................................................................. 111
9.2.8
Power.............................................................................................................. 114
9.2.9
Final Hardware System Evaluation ............................................................... 116
9.3
OVERALL SYSTEM TESTING ................................................................... 117
9.3.1
9.4
Test Cases ...................................................................................................... 117
OVERALL SYSTEM EVALUATION ........................................................... 119
10 User Manual ...................................................................................... 119
10.1
TRACKING DEVICE .................................................................................. 119
10.1.1
10.2
Firmware ........................................................................................................ 119
RECEIVING RF MODEM .......................................................................... 121
10.2.1
Modem Parameter Configuration ................................................................ 121
v|Page
10.2.2
10.3
Verification..................................................................................................... 122
REPEATER RF MODEM ............................................................................ 122
10.3.1
Modem Parameter Configuration ............................................................... 122
10.3.2
Verification..................................................................................................... 123
10.4
TRACKING DEVICE RF MODEM ............................................................. 124
10.4.1
10.5
DATA RECEIVING & PROCESSING SERVER .......................................... 125
10.5.1
10.6
Retrieving the Source Address .................................................................... 124
Installation Instructions ................................................................................. 125
TROUBLESHOOTING............................................................................... 125
10.6.1
Tracking Device............................................................................................. 125
10.6.2
RF Modems (Receiving and Repeater) ........................................................ 126
10.6.3
Data Receiving & Processing Server ........................................................... 127
11 Budget & Financing .......................................................................... 127
11.1
BILL OF MATERIALS ................................................................................. 127
11.2
FINANCING............................................................................................... 135
12 Project Milestone Schedule .............................................................. 135
13 Final Project Summary & Conclusions .............................................. 137
14 Resources .......................................................................................... 139
14.1
CONSULTANTS & SUPPLIERS ................................................................. 139
14.2
FACILITIES & EQUIPMENT ...................................................................... 139
Appendix A: References ............................................................................. 1
A.1
REFERENCES ................................................................................................ 1
A.1.1
A.2
PERMISSIONS ............................................................................................... 1
A.2.1
A.3
Bibliography ...................................................................................................... 1
Figure Reprint Permissions .............................................................................. 1
SCREENSHOT PERMISSIONS ................................................................... 17
vi | P a g e
1
Executive Summary
In modern society the need for being able to locate where your property is or where you
are located has become a growing necessity amongst the general public. People no
longer have to get out of the car in an unfamiliar place to ask for directions to know
where they are or how to get where they are heading. Stolen or missing vehicles can
now be apprehended or found by simply using a Global Positioning System (GPS) to help
take control over or locate the desired automobile. Cellular phones can now access the
Internet and download applications, therefore providing limitless resources at ones
disposal. Many daily-utilized technologies such as cellular phones, vehicles, mp3 players,
and the Internet are becoming more and more technologically advanced. A device will
be designed for a specific function and as society becomes more technologically
advanced they will continuously include supplementary features. For example the
cellular phone, several years ago the purpose of a cell phone was to simply make and
receive phone calls, then the cell phone gained the feature of text messaging which
became a prevalent feature of the device. At present day cell phones can be used as GPS
navigational systems, provide access to the Internet, download applications to assist a
person in their daily tasks, and much more. The resources available to society today
make it possible to help improve the University of Central Florida’s Shuttling System.
At the University of Central Florida the development of a Transit Tracking System (TTS)
has been designed for the University’s shuttling system. The design of the TTS follows
the concept of an Automotive Vehicle Locating (AVL) system. An AVL system is
accomplished by mounting a small device and antenna on the vehicle that is being
tracked. The device communicates with four of the 24 satellites that orbit the earth to
triangulate that specific vehicles position. There are three main methods of real-time
communication of interval data to a host computer or web server. The GPS data
information can be transferred by using radio, cellular, or satellite communication
technologies. The University’s TTS utilizes the transfer of data through Radio Frequency
(RF), which makes it a very low cost way to monitor a shuttling fleet as there are no
monthly fees. The only cost will be the cost of the TTS system itself with no additional
cost of labor.
The University has several complimentary shuttling routes available for the students of
the institution such as Park and Ride shuttling, the Gold and Black route shuttling, and
College Affiliated apartment complex shuttling. The TTS system was designed to
increase the use of the shuttling resources available, as only a small fraction of the
University’s affiliates use it. The TTS system will also help to allow administrators of the
shuttle fleet to monitor and track where shuttling operators are and if they are
complying with operation policies. The general design of the TTS will consist of a
tracking device on each shuttle unit. Where the data from each shuttle unit will transfer
its data to a receiving station, where data will be compiled and organized, so that users
can access the web server and know where all shuttle units are and how far they are
from the user with an estimated time of arrival (ETA).
1|Page
2
Project Description
2.1 PERSONNEL
Karl Banks, CpE
[email protected]
Chris Dorros, CpE
[email protected]
Monica Nguyen, EE
[email protected]
Tyler Zaino, CpE
[email protected]
2.2 PROJECT MOTIVATION
The University of Central Florida is the second largest University in the nation, consisting
of more than 56,000 students. On campus, personal vehicles and provided shuttles are
the two main methods of transportation. There is limited parking, and the University is
constantly expanding its buildings, parking garages, and parking lots. Parking during
prime hours of the day is very hard to come by, and at times can take over half an hour
to find a spot.
The University has provided a complimentary shuttle system for traveling to and around
campus. Unfortunately, only a small fraction of students use the complimentary
shuttling system because they lack trust in it, and many students may not even know
how to use it. Students who do not have their own vehicle are limited in options and are
usually forced to use the University’s shuttle system. Many are unhappy due to
inconsistencies in the timeliness of buses, and the fact that they must rely on “faith”
that their bus will arrive on any given day so that they do not miss class or other
scheduled activities. Most students who have their own vehicle choose not to use the
UCF shuttle system even though it is available at their disposal. Why would these
students choose not to use the transportation system? It is more likely due to the fact
that they are unfamiliar with the routes and the scheduled arrival/departure times of
the buses. The most common piece of information that a student may know about the
shuttling system is that it comes “every fifteen minutes or so.” What happens when a
student waits fifteen minutes for a bus and it never shows? What if that bus arrives ten
minutes late? The student who spent his/her time giving the shuttling system a chance
may become discouraged from ever using the system again, as he/she may have been
late to class and missed something very crucial to their education.
There are several types of shuttling services that the University provides for UCF
affiliates. Some examples include Park and Ride shuttles, off-campus shuttles that are
routed to/from nearby locations and on-campus Black and Gold routes that are routed
around the school. Few people know about the shuttle system called “Park and Ride”, in
2|Page
which a shuttle will transport students from a distant parking lot nearby or on campus
to a much closer on campus location. There are also several local college affiliated
student-housing complexes that are included in the daily UCF shuttling service routes.
Finally, there are students who will park on campus for one class, and will later attempt
to move their vehicle to a new parking spot across campus that is closer to a successive
class. Whether or not taking the time to migrate in this fashion is time productive and
can be debated.
With such a large campus and population it is surprising that there are so many
resources that are at the disposal of students however many of them do not know of
these sources or do not want to trouble themselves with learning how to use the
resources available to them. There currently is no system for UCF that allows you to see
where the buses are and how long it will be until they get to you. There is also no way of
knowing where shuttles are during the day, if shuttle drivers are doing their job, and
whether or not a shuttle is missing as well.
2.3 GOALS & OBJECTIVES
The goal of this senior design project was to create a system that is a quick and easy
user-friendly system, which provides students the comfort of knowing when the next
bus will arrive. The purpose of creating a system of this nature would help increase the
use of UCF shuttling and ultimately decrease traffic around the university. As well as
allow administrators the capability of monitoring the shuttle fleet and if shuttle
operators are doing their jobs and following operation policies.
Instead of making students go through the trouble of looking at bus route maps and
learning where and when the shuttles come, they will be able to go to a web server,
ideally download an application for their phone, that will show the bus routes of where
and when the next bus is coming. By making this information quick and easy to obtain,
UCF affiliates will be more inclined to use the University’s complimentary shuttling
services. The process of getting to school would therefore be streamlined and a student
will feel as though it is less difficult and time consuming to take a shuttle to school.
Not only will the system be very beneficial to the University’s affiliates it would also be
very helpful to those in charge of UCF’s transportation line. The system would allow
administrators of work personnel to monitor where shuttle drivers are, if they are doing
their job, and ultimately where exactly the UCF shuttles are located at all times.
The objective of the TTS is to create a monitoring device that will receive power from
the shuttle’s cigarette lighter adapter, which will transmit data to a receiver on a radio
tower located on campus. Where the data will be collected by a server, get compiled
and converted to be readily available for users of the system to see where buses are
located via website. The device will transmit data with an exact location of shuttling
units at all times so that users can receive accurate information and time estimates,
3|Page
therefore reducing any lack of trust in the University’s transportation system. The
system will also be very cost effective so that all shuttle units will be able to have
monitoring systems. The Ideal device will be created would be small enough as not to
impair the process of transportation and activities that occur. This system will ultimately
reduce traffic on and around campus; as well as save UCF affiliates the hassle of parking
and the cost of a parking pass.
2.4 REQUIREMENTS & SPECIFICATIONS
For clarity and simplicity, the Transit Tracking System can be split up into several
subsystems. The following sections list the requirements and specifications for the
overall system, the data transmission subsystem, and the web application subsystem.
2.4.1 Overall System
The overall TTS system adheres to the following requirements listed in Table 1. The
objective of these requirements is to provide an overview of the overall TTS system,
specifying functional requirements, quality requirements, data requirements, and
constraints.
Table 1 - Overall System Requirements & Specifications
Req. ID
Requirement Text
TTSR-OS01
The TTS shall support all shuttles both on campus and off campus.
TTSR-OS02
The TTS shall equip all shuttles with their own unique transmitter unit.
TTSR-OS03
The TTS shall not require a monthly cellular contract to operate.
TTSR-OS04
The TTS shall operate with full functionality for all buses at any given time.
TTSR-OS05
The TTS shall provide GPS data accurate to a differential of 10 ft.
TTSR-OS06
TTSR-OS07
The TTS shall record information including but not limited to: position
coordinates, velocity, time.
The TTS shall update shuttle location data in real-time while a shuttle is
active and en route.
4|Page
2.4.2 Data Transmission
The data transmission units adhere to the following requirements listed in Table 2. The
objective of these requirements is to provide an overview of the data transmission
system for the TTS, specifying functional requirements, quality requirements, data
requirements, and constraints.
Table 2 - Data Transmission Requirements & Specifications
Req. ID
TTSR-DT01
TTSR-DT02
TTSR-DT03
TTSR-DT04
Requirement Text
The TTS transmitter unit shall operate within a 3 mile line of sight radius of
the main receiver tower.
The TTS transmitter unit shall operate on an unlicensed radio frequency
bandwidth (corresponding to one of the following ISM frequency ranges:
6.765-6.795 MHz, 13.553-13.567 MHz, 26.957-27.283 MHz, 40.66-40.70
MHz, 433.05-434.79 MHz, 902-928 MHz, 2.400-2.500 GHz, 5.725-5.875
GHz, 24-24.25 GHz, 61-61.5 GHz, 122-123 GHz, 244-246 GHz)
The TTS transmitter unit shall operate off of a standard 12V power supply
unit via connection through a cigarette lighter AC adapter.
The TTS transmitter unit shall operate with a minimum serial baud rate of
4,800.
TTSR-DT05
The TTS transmitter unit shall weigh no more than 5 lbs.
TTSR-DT06
The TTS transmitter unit shall be no larger than 12” x 12” x 5”.
TTSR-DT07
The TTS shall operate at all temperatures within the range 0° F to 120°F.
TTSR-DT08
The TTS transmitter unit shall support at a minimum an 8-bit encryption.
TTSR-DT09
TTSR-DT10
The TTS transmitter unit shall pack all collected data into packets for simple
transmission.
The TTS receiver unit shall be waterproof and thoroughly resistant to
continuous exposure to severe weather conditions.
2.4.3 Web Application
The web application adheres to the following requirements listed in Table 3. The
objective of these requirements is to provide an overview of the web application for the
TTS, specifying functional requirements, quality requirements, data requirements, and
constraints.
5|Page
Table 3 - Web Application Requirements & Specifications
Req. ID
TTSR-WA01
TTSR-WA02
TTSR-WA03
TTSR-WA04
TTSR-WA05
TTSR-WA06
TTSR-WA07
TTSR-WA08
TTSR-WA09
TTSR-WA10
Requirement Text
The TTS web application shall operate with full functionality for 10,000
users at any given time.
The TTS web application shall be cross-browser compatible, such that it will
operate and appear the same in all web browsers.
The TTS web application shall operate in a standard web browser, without
requiring any additional plug-ins or add-ons.
The TTS web application shall display each active bus route in color-coded
fashion.
The TTS web application shall transpose the real-time position of the
shuttles on a labeled map.
The TTS web application shall only display shuttles that are actively in
service and on their respective routes.
The TTS web application shall predict an estimated arrival time for each
bus stop based on current location and previously accumulated data.
The TTS web application shall allow its user to filter the map data by the
route of each bus.
The TTS web application shall allow an administrator the capability of
setting the status (in service or out of service) of a shuttle.
The TTS web application shall allow an administrator to add a new bus
route.
TTSR-WA11
The TTS web application shall allow an administrator to modify a bus route.
TTSR-WA12
The TTS web application shall allow an administrator to remove a bus
route.
3
Research
3.1 RELEVANT TECHNOLOGIES
The following section covers technologies that are relevant to the goals to be
accomplished in this project and that will be the basis for the major design decisions.
The sections are separated by the major research areas for the sections of the project.
6|Page
3.1.1 Tracking Data Communication Methods
Many methods for transmitting the tracking data from the shuttle buses back to the
campus exist. The choice of this communication method is an important one, as it
greatly impacts the reliability, cost, and performance of the design. After surveying the
possible technologies and protocols those that best fit the requirements of the design
were chosen, and are discussed in this section.
3.1.1.1 Radio Frequency
Use of radio frequency (RF) communication systems rely on established radio
frequencies to transmit data from the vehicles back to the base station. They consist of
two basic components: a radio modem and an antenna. The radio modem takes in a
digital input signal, usually a serial connection, and converts it to an analog radio
frequency signal. This signal is outputted with very high power through the antenna. The
receiving antenna captures the signal and transmits it to the receiving radio modem.
This radio modem essentially does the opposite of the transmitting modem. That is, it
converts the received analog signal to a digital signal, usually a serial connection.
Typically, RF communication modems operate in the Very High Frequency (VHF) / Ultra
High Frequency (UHF) frequency ranges and use either licensed or unlicensed bands.
Licensed frequencies provide the added benefit of preventing interference from other
devices transmitting on the same frequency due to its private, dedicated frequency.
While unlicensed frequencies on the other hand have this downside, they do not require
expensive license fees and are therefore much more popular for RF communication.
Security can be ensured when using private RF systems, even over unlicensed
frequencies, due to encryption methods available in the RF modems. This is especially
important if interception of vehicle location data presents a threat to the organization.
Existing commercial off-the-shelf (COTS) RF modems provide system designers the
ability to integrate RF communication into their design, without having to worry about
difficult the difficult technicalities of modulation and signal processing.
3.1.1.2 Cellular
Cellular communication utilizes existing cellemetry networks to provide data transfer.
This method of communication boasts many big advantages: very large range (only
limited by cell network), extremely high availability and support (due to ubiquitous use
of cell phones), and a packetized digital connection.
The use of a cellular network also aids with tracking, as assisted GPS devices can take
advantage of the cellular network to triangulate position before searching for satellites.
7|Page
Though cellular communications may be arguably the most convenient method for
vehicle tracking, it also has the most downsides. For one, it is very expensive, as it
requires a monthly service charge for each vehicle transmitting on the network. Security
is the most lacking with this method, as there is little control over the cell network
providers protocols. Additionally, cellular network coverage in rural areas is not
guaranteed, producing "dead-zones."
3.1.1.3 Satellite
Satellite communication ensures the best coverage area of all data transmission
methods. As long as the tracking device has a clear view of the sky, the range is near
100% worldwide.
Security methods available with this transmission method are similar to those of the
cellular networks and are somewhat limited to what is available by the satellite
providers.
Cost, however, is particularly more prohibitive than the other methods. Monthly service
fees are similar to that of the cellular network, but hardware and software costs are
typically much higher. Additionally, the sizes of the satellite dishes that must be
mounted on the vehicles are rather large and must be adjusted to point in the correct
direction. This makes adding a new tracking unit to a vehicle a costly and timeconsuming task.
3.1.2 Position Detection
Determining an object's position can be completed in a variety of ways, some much
more accurate than others. While GPS has become the industry and even commercial
standard, a survey of available location determination methods was conducted to
ensure a selection that best meets the requirements of the design. Brief overviews of
the top choices of methods are covered in this section.
3.1.2.1 GPS
The Global Position System (GPS) was created in 1973 by the U.S. Department of
Defense to overcome limitations with previous positioning systems. Originally created
for military purposes, the GPS system was declared as a dual-use system by President
Bill Clinton in 1996, opening it up for civilian usage.
The system consists of three main segments: space, control, and user. The space
8|Page
segment includes 24 to 32 satellites in medium Earth orbit. These satellites are
responsible for broadcasting signals which user devices can pick up. The control
segment includes a master control station, monitor stations, and antennas. Both the
space and control segments are controlled by the U.S. Air Force. The user segment
includes hundreds of thousands of military users, and tens of millions of civilian and
commercial users.
GPS satellites send three basic pieces of information: the time the message was
transmitted, precise orbital information, and the general system health and rough orbits
of all GPS satellites. The receiver uses this information to determine its latitude,
longitude, and altitude. The time provided by the GPS is widely accepted as the most
accurate time.
GPS receivers have been declining in price over the past few years and are a very
attractive method for determining location. In fact, they have become the standard for
this purpose due to their low cost, no subscription fees, high accuracy, and high
reliability. They are being manufactured so small that most modern smart phones are
equipped with embedded GPS modules.
3.1.2.2 Cellular Triangulation
Devices that utilize existing cellular networks can approximate their location using
multilateration, which is based upon triangulation. This method uses time difference of
arrival (TDOA) between three separate cell towers. By knowing the distance from each
of three towers, the object's position can be approximated.
This method is rather inaccurate and produces a large area for which the object could
possibly be in. While this is useful for some applications, it is far too inaccurate for most
vehicle tracking systems.
3.1.2.3 Radio Navigation
Radio navigation uses RF signals to determine an object general position. It works with a
base station antenna and a mobile RF receiver device. The receiver device is attached to
a directional antenna, which is rotated until the signal is the strongest. This allows the
receiver to determine its angle relative to base station antennas. It then calculates the
time it takes for the signal to arrive at the base to determine the distance away from
any one base station.
Radio navigation is a rather primitive method of obtaining an objects location in
retrospect to GPS systems. It is a rather costly and complicated method, and not well
suited for large-scale vehicle tracking systems.
9|Page
3.1.3 User Interface
The following section discusses the different types of user interfacing systems that are
available today. This section covers the different types of maps that can be used, and
Mobile applications. The difference between computer programs and web applications
is also discussed.
3.1.3.1 Maps
The most important aspect of the user interface is the map. The map is the focal point
of the web site in which the system will display the data to the users. To do this, an upto-date accurate interactive map was embedded into the website. This was done very
easily by importing an application programming interface (API). An API is an interface
that allows a piece of software to utilize another piece of software. For this design, a
map API was used. There are many different types of free map APIs currently available
to use. These would include Google Maps, Microsoft Maps, MapQuest Maps, and Yahoo
Maps. Each of these applications had their own features as well as disadvantages, but
overall they provided a very similar service. Through some thorough research, the API
that fit this system design the best was Google Maps. Google's API was tested to be the
quickest and most efficient map application, and those are two traits are points of
emphasis for this design. The Google Maps API was a very simple to learn and use so
integrating into the software was very easy. The simplicity of the API allows the
availability to add more features once the basic functionality is implemented. This
flexibility allowed the system's interface to interact with the needs of the users to allow
it to better fit their expectations.
3.1.3.2 Computer Program vs. Web Application
In considering technologies for graphically interfacing the data with the end-client, there
are really only two options: a computer program or a web-based application. Computer
software, commonly written in programming languages such as C++ and Java, can be
very powerful and highly interactive with the user. They allow for heavy customization
and a very wide range of control. On the downside, computer programs require the user
to download all the files needed for them to execute, and usually require some form of
installation. Web pages, however, do not require such an installation, nor do they
require any files to be downloaded (outside of the web browser and any plug-ins
required). As long as the user has a web browser (such as Internet Explorer, Mozilla
Firefox, Google Chrome), and internet connection, they can access web applications.
Websites are more limited in design and functionality, and are bounded to the
capabilities of the web browser and website programming language.
To provide the best performance using the easiest solutions possible, it makes most
sense to choose the web application technology over a computer program. The
software needed for the end-user in this project does not require much sophisticated
control, and would not take advantage of the heavy resources available with computer
programs. Compatibility is the key factor to consider when deciding on the better
10 | P a g e
technology, and that is why the web application is far superior to computer software.
Since web browsers are a standard on virtually every personal computer today, the
web-based option will target a much larger audience, which is ideal. Websites can be
written to be platform independent, meaning they will execute the same way on all
different types of computer configurations (both hardware and software). Additionally,
the web application would not require the user to download any supplemental files (as
noted above). This fact also applies to software updates; computer programs will
generally require the download and install of an “update package”, whereas a web page
can simply be updated by its administrator, and the changes will take effect immediately
without any effort from the client.
While not nearly as manipulative as computer programming, some website
programming technologies can be quite powerful. The highest level of website
development hierarchy can be split into two main types, client-side and server-side.
These categories are based solely on where the code is processed and compiled (either
on the server, or on the client’s computer). Client-side language implies that the web
page code is processed on the client’s computer, and the information is rendered
through their web browser. Conversely, server-side languages are used to write code
that is compiled at the server, before it reaches the client’s machine. This is very
advantageous, as it opens up an opportunity to use much greater logic that is not
possible with client-side languages. Client-side code is still needed to display web pages
in the client’s web browser; thus, server-side code generates client-side code based on
requests sent from the client’s computer, and sends it back to the client. (A request is
simply information sent from a client to a server, demanding a response based on that
information) Because of this relationship, server-side languages can be thought of as
“dynamic” whereas client-side languages are “static”. A list of the most commonly used
client-side and server-side website programming languages are provided in Table 4.
Table 4 - Common Client-Side Website Programming Languages
Client-Side
• AJAX (Asynchronous JavaScript and
XML)
• CSS (Cascading Style Sheets)
• Flash
• HTML (Hypertext Markup Language)
• JavaScript
Server-Side
• ASP (Active Server Pages)
• .NET (Dot NET)
• PHP (PHP: Hypertext
Preprocessor)
To exemplify this relationship, consider a scenario in which a user must log in to a
website. The user browses the site in his/her web browser, where they are presented
with a graphical interface containing some text and a form he/she must fill out and
submit. This interface is fully scripted in HTML (the client-side language). Upon
submitting the form, the user’s input is sent to the server, where code written in PHP
(the server-side language) authenticates the username and password. If the
11 | P a g e
authentication is successful, the PHP code will generate and send the corresponding
HTML code back to the client, such that the user is “logged in”. If the authentication
fails, the PHP will generate and send different HTML code, such that the user is “not
logged in”. This ability for the server to generate different responses based on the
client’s request is why it is considered “dynamic”, and why server-side code can be
thought of as powerful.
The web application developed for this project uses a collaboration of client-side and
server-side languages, including AJAX, CSS, HTML, JavaScript, and PHP. HTML, CSS, and
JavaScript are used to generate the visual interface that the end-user will interact with.
PHP is used to handle requests sent to the server as described above, and AJAX is used
to asynchronously update the buses on the map, thus making the tracking system “realtime”. This joint usage of multiple languages allows for the creation of a very
professional looking tool, while at the same time maintaining compatibility across all
client platforms.
3.1.3.3 Mobile Application
While the scope of this project was set to developing a web-based application, future
endeavors may be made to expand technologies by developing mobile applications for
internet-enabled smartphones. Such efforts would greatly enhance the population of
TTS users, as the popularity of smartphones and mobile applications is continuing to
rise. Mobile development for the TTS would target the two most popular cross-platform
mobile operating systems, Android and iOS. These two technologies, though very
different in the way they are written, share many similarities in both functionality and
appearance. Android-based applications are written in Java, an object-oriented
programming language. iOS programs are written in Objective-C, which can be thought
of as an object-oriented version of the C programming language (which is not objectoriented), developed by Apple. The mobile application is advantageous over simply
accessing the web application through a mobile web browser, because it increases the
accessibility and readability of the information. When creating a mobile application, the
key is to use large buttons, large fonts, and appropriate resolutions to avoid clutter and
illegible data. Should development for mobile applications take place, more extensive
research will be required to determine the syntax and schematics of the mobile
programming languages.
3.1.4 Microcontrollers
The difference between a microcontroller and a microprocessor is that a microcontroller
is essentially a specialized microprocessor that is designed to be self-sufficient as well as
cost-effective, whereas a microprocessor is typically designed to be general purpose
device. The microcontroller has the ability to execute a stored set of instructions that
will carry out user-defined tasks. The microcontroller also has the ability to access
external memory chips and both read and writes data to and from the memory.
12 | P a g e
Microcontrollers will consist of a processor core, memory, and programmable
input/output peripheral, which essentially make it a small computer on a single
integrated circuit. Microcontrollers are typically used for embedded applications such as
automobile control system engines, remote controllers, office machines, and
telephones. Embedded systems like the microcontroller typically lack interaction with
users and generally do not include screens, disks, keyboards, or any other input/output
devices of a personal computer.
Microcontrollers will generally contain several general-purpose input/output (GPIO)
pins. GPIO pins are configurable by software that will dine the pin as an input or an
output state. Almost all modern microcontrollers will have two types of memory. The
first is non-volatile memory, which is used for storing firmware, and the second is readwrite memory, which is for storing temporary data. In today’s society the microcontroller is a low cost resource and is used highly amongst hobbyist.
3.2 EXISTING PROJECTS & PRODUCTS
The following section discusses the general design of a previous project that was
developed by mechanical engineering students of the University of Central Florida in the
spring of 2009 as their Senior Design Project. This section will also cover an AVL design
that was developed by the National University of Sciences and Technology. Lastly, this
section will discuss the overall general design of AVL systems that are developed and
sold by companies in today’s modern day.
3.2.1 Previous Senior Design Project
A preceding bus tracking system, known as the GPS Shuttle Tracking and Notification
System, was developed for the University of Central Florida. The tracking system was
used to inform users, of the University’s Gold and Black routes, how long it would be
until the next shuttle arrival. The University’s Gold and Black routes, which are the two
routes that go around campus only, are two of several bus routes available to students.
The tracking system used a GPS device and several radio frequency modems, which
relayed the shuttles location to a central station that would then calculate the unit’s
estimated time of arrival. Once the ETA was calculated the information would be sent to
a solar powered kiosk sign located at the bus stops.
3.2.1.1 Design
Each bus unit utilized a Garmin GPS as well as a XTend RF modem to collect and transmit
data. Each shuttle’s GPS tracking unit was powered by the 12V cigarette lighter adapter
onboard each bus. The XTend RF modem that was chosen was a 900MHz modem that
could be programmed to act as either and transceiver or receiver. An internal and
external picture of the final bus unit for the shuttle can be seen in Figure 1 and Figure 2 .
13 | P a g e
Figure 1 - Internal View of Bus Module
Figure 2 - External View of Bus Module
It was believed that the information sent was through the local campus wireless
network with 900MHz RF modems. However, the typical radio frequency for campus
wireless fidelity (WiFi) is 2.4GHz. Four RF modem receivers were placed throughout
university grounds to act as repeaters, so if a bus in route was out of range with the
central computers RF receiver the data would be repeated through the RF modems until
it reached its destination. The 900MHz RF modem antennas used covered a distance of
at most 400 meters with the original antenna that was provided and at least 450 meters
with a high gain antenna. The four RF receivers were placed throughout campus, which
were both directional and Omni-directional. A map of the general coverage that the
previous system has can be seen in Figure 3 below.
Figure 3 - GPS Shuttle Tracking & notification System RF Modem Coverage
14 | P a g e
All campus repeater units and the kiosk sign developed were powered by solar panels.
When sunlight was present power would be used and stored into a Tempest power
security battery. All the units were developed to withstand environmental conditions.
The kiosk sign consisted of a LED screen, an electrical box, and four 60-watt solar panels.
The kiosk sign was deigned to be tamper proof and have easy access for maintenance.
The solar powered repeater that was developed can be seen in Figure 4 below. The
informational Kiosk sign that was developed for the previous design project can be seen
in Figure 5 below as well.
Figure 4 - Solar Powered Repeater
Figure 5 - Solar Powered Kiosk Sign
The data from the shuttles GPS units would be relayed to the central stations computer
via RF serial modem. The data that was transmitted included the latitude, longitude,
timestamp, and velocity of the shuttle unit. The data would then be converted into a
text file, which was read into a program that calculated the time it would take for that
specific unit to reach the next bus stop. Once the ETA was calculated it would then be
converted into another text file, which would be read into another program that
converted the data into a hexadecimal format. Lastly, the hexadecimal information was
then sent to the kiosk signs RF modem and then displayed for users to see the ETA.
3.2.2 National University of Sciences and Technology Project
A similar AVL tracking system, known as the Real-Time Fleet Monitoring System, was
developed by the National University of Sciences and Technology in Pakistan. The
system used real-time tracking to monitor their automobile fleet, which could be seen
on a geo-referenced digitalized map by users. The system that was developed consisted
of three major parts the Client Operator Units (COU), the Client Centre Workstation
15 | P a g e
(CCW), and the Communication Hardware. The COU utilized two low-cost
microcontrollers, a GPS, and a radio frequency transceiver. The information from the
automobile unit would be transferred to the CCW, where the information received
would be broken down and displayed on the geo-referenced digitalized map.
3.2.2.1 Design
A COU was placed on each unit and the speed, direction, as well as the location of the
automobile within a 10Km radius of the CCW that could be viewed on a digitalized map
that was created. A RS232 serial interface was needed for both the GPS and RF
transceiver. Therefore, the use of two microcontrollers was needed due to the fact that
each microcontroller used had only one serial port. The two microcontrollers that was
used for each tracking module was the ATmega328. The block diagram of the National
University of Sciences and Technology’s AVL tracking system can be seen in Figure 6
below.
Figure 6 - Block Diagram of AVL System
The Client Unit Board (CUB) that was developed acted as a filter between the GPS and
RF transceiver. The general design entailed a GPS that interfaced to the first
microcontrollers serial port. The first microcontroller transfers the filtered data to the
second microcontroller. Once the second microcontroller receives the filtered
information from the GPS the second microcontroller is interfaced to the RF transceiver
via RS232 serial port. In order to transfer the filtered data from the first microcontroller,
interfaced to the GPS, to the second microcontroller, interfaced to the RF transceiver, a
program called handshaking protocol was developed. The interrupt-based protocol was
developed for correlating transmission of data between both microcontrollers.
16 | P a g e
Figure 7 - Geo-Referenced Digitalized Map
The CCW monitors the automobile fleet, and is where all the data is received and
processed. The main functions provided at the CCW are navigational status, vehicle user
ID, graphical location, route graphics, current date and time, color coding for
simultaneous vehicle operation, and data storing for post processing. Once all the data
is filtered and processed the final output is seen on a geo-referenced digitalized map
that has Full roam, zoom, and centering capability. The final filtered and complied
information is outputted on a geo-referenced digitalized map that was developed and
can be seen in Figure 7 above.
3.2.3 General Design of Systems Available
There are several different types of fleet tracking systems and brands available to the
general public and private companies today. The use of fleet tracking systems are mainly
used amongst small and large companies today that have the need to monitor where
their fleet is at all times, the speed of drivers, driving habits, the number of stops
operators make and where they stop. The main component used by the majority of fleet
monitoring systems is the GPS. There are several different types of fleet tracking system,
which can also be referred to as and AVL system, configurations available. The
determining factor on which type of configuration a company would use is the
determined by the requirements needed and budget available when acquiring a system.
The two main types of an AVL tracking system design are passive and dynamic.
3.2.3.1 Passive Design
When using a passive design the GPS information is obtained and is either recorded
passively in a device or is passed on via a communication network of a host computer, a
server, or an AVL vendor. When information is recorded passively the device’s
information is essentially “downloaded” at the end of the day or at the end of a trip by
manual means or by a 900MHz RF signal.
17 | P a g e
There are two main methods of data transfer by manual means. In general when
transferring data by manual means the passive device will connect to the computer
database via RS232 serial connection and will be downloaded onto the computer’s hard
drive. Another way of transferring data by manual means is by having a passive device
that uses a memory stick. When transferring data via memory stick all the information is
collected and saved onto a memory stick that is connected to the units monitoring
device and then removed and is then interfaced to the computer database workstation.
The last method and not highly used type of passive data transfer is by the use of a
900MHz signal where information is normally received within 300ft from the computer
base. An example of a passive memory stick device can be seen in Figure 8 below.
Figure 8 - Trackstick Mini GPS Data Logger Memory Stick (With permission from
mightygps.com)
Once all the passive data is collected and available on the computer database the
information is then compiled and used. Typically the data is used to populate a
digitalized map of where the monitoring unit’s data is displayed and the path that the
vehicle took during that days tracking period. The practicality of a passive tracking
system is not ideal as it only gives the historical information about the monitored unit.
3.2.3.2 Dynamic Design
In general when monitoring an electrical utility fleet a dynamic approach is preferred
and recommended. As using a dynamic approach to transferring data allows for realtime monitoring of a fleet. There are three general approaches to recording and
transferring data dynamically for an AVL system. The location of a monitored unit will be
obtained by the same means as found passively where all methods will retrieve their
location by the use of a GPS location.
Dynamic data transferring of data is done by forwarding a vehicles position data over a
communication network to a computer in one of three timing approaches; either
transferring of data is in real-time, which is nearly instantaneous, at a present time
interval, or when queried or requested by a program by the operator. The three main
methods of data transfer are either by radio communication, cellular communication, or
by satellite communication. When choosing what type of dynamic system to use one
must consider the surroundings of the monitored area, whether or not the area is in an
urban, suburban, or rural setting.
18 | P a g e
An example of the general design of a radio communication system can be seen
in Figure 9 below.
Figure 9 - Typical Radio Communication Configuration
An example of the general design of a cellular communication system can be seen
in Figure 10 below.
Figure 10 - Typical Cellular Communication Configuration
An example of the general design of a satellite communication system can be seen
in Figure 11 below.
Figure 11 - Typical Satellite Communication ConfigurationOf the three means of dynamic
data transfer the typical recommended method would be by satellite communication.
However, with the use of either satellite or cellular communication one must take into
account monthly fees that are need to use those specific services. The use of radio
communication is the cheapest way as there would be no monthly fees associated with
it; however, the consideration of line of sight is important as well as the distance that
would need to be monitored. In general a very common fleet tracking module that
19 | P a g e
utilizes cellular communication methods is the Mighty GPS Portable Tracker by
mightygps.com. An example of the company’s cellular communication monitoring
module can be seen in Figure 12 below.
Figure 12 - Mighty GPS Portable Tracker (With permission from mightygps.com)
4
Project Architecture Selection
4.1 POSSIBLE ARCHITECTURES & RELATED CHOICES
The following section covers all of the possible hardware and software configurations
that were considered for use in the TTS senior design project. All completed research
and information found was utilized in the possible configurations covered in the section
below.
4.1.1 Possible Hardware Architecture Choices
Based on the research completed for the hardware aspect of the project, several
hardware design configurations are apparent. Due to the nature of the of the senior
design project all passive design configurations have been eliminated. Therefore the
only design configurations that will be covered in this section will be dynamic designs, as
the need for real time tracking of the University’s shuttling fleet is needed. There are
three main options for the hardware design configuration: a direct connection method,
a configuration with two micro-controllers, and a configuration with a single microcontroller.
4.1.1.1 Direct Connection Configuration
A hardware configuration that simply takes the main components necessary for data
collection and transfer will be connected together via RS232 serial port. The direct
connection method has been designed and developed by a previous senior design group
20 | P a g e
of mechanical engineers, which have been mentioned in the research portion of this
paper. The previous groups design consisted of a bus unit, as well as data-receiving
units, and a workstation where all collected data was processed.
The design that the previous senior design group developed consisted of three main
parts for the shuttling unit. The three main parts were a cigarette lighter adapter, a
Garmin GPS, and a 900MHz XTend RF modem. By simply connecting a cigarette lighter
adapter to the bus unit a 12V to 5V converter was interfaced which allowed the GPS and
RF transceiver to receive power. The GPS data of the system could then be transferred
by connecting the GPS and RF transceiver serially by a RS232 connection. An actual
picture of the direct connection can be seen in Figure 1 and Figure 2 in the research
section of the paper. The receiving of data in the previous design was done by using RF
modems and a data collection system, which interfaced to a processing computer. The
900MHz RF modems that were used covered a distance of at most 400 meters with the
original antenna that was provided and at least 450 meters with a high gain antenna.
The design needed several repeaters so that if a monitoring unit was not within
receiving distance of the main base station the data would be repeated until it reached
its destination.
The first design option that was considered based off of the previous project design
would be to have a bus monitoring unit and a receiving system. The bus-monitoring unit
would have a cigarette lighter adapter that would convert the busses 12V to 5V DC,
which would interface to the GPS unit. The GPS unit would interface to the RF
transceiver modem via RS 232. The data would be transferred to a single receiving
900MHz RF modem with a high gain antenna mounted onto a Radio tower located on
campus. Once the information is received it would be transferred to the client
workstation were the web server will process the information, and users will be able to
see a digital map of the shuttle fleets locations.
4.1.1.2 Two Micro-Controller Configuration
The second design option that was considered was the use of two micro-controllers. The
design of a PCB would be necessary for the design, as small chips would be used. The
option of adding an accelerometer was also considered for energy conservation
purposes.
The main components needed for the bus modules monitoring configuration are a level
shifter that will convert the buses 12V to 5V DC for the ability for the PCB components
to work, as all components will most likely run at 5V. Next would be the GPS, which
would provide the vital information of the shuttles location, time, speed, as well as
other information. Two ATmega328 microcontrollers, which would be programmed to
help compile, filter, and transfer the GPS’s data, would be used. An actual picture of the
ATmega328 can be seen in Figure 13 below. The last main component of the shuttles
21 | P a g e
module would be the 900MHz RF transceiver, which would transfer all the necessary
data to the RF receiving station.
Figure 13 - ATmega328 Micro-Controller (with permission from sparkfun.com)
The interfacing of the components would all be on a PCB configuration. The GPS on the
PCB would interface to one of the micro-controllers serial port, as each ATmega328 has
only one serial input/output port. The two micro-controllers would interface to each
other and use a method of handshaking protocol to be able to transfer data from on to
the other. The second micro-controller will interface to the RF transceiver via the
remaining serial port. The receiving station would compromise of two main entities. The
first would be the 900MHz RF receiver, which would be mounted onto a radio tower
located on campus, which would have a high gain antenna. The data would be
transferred to the web server where all the data would be organized, compiled, and
finally outputted onto an online digitalized map.
4.1.1.3 Single Micro-Controller Configuration
The last design option that was considered was the use of a single micro-controller. The
design of a PCB would also be very necessary for the configuration. The single microcontroller that would be used would be the ATmega2560. The last design essentially
follows the same design as the second; however, the added microcontroller would no
longer be needed due to the fact that the single microcontroller configuration that
would be used has four serial input/outputs as opposed to a single input/ output serial
port of the ATmega328.
The main components needed for the bus modules monitoring configuration are a DCDC converter that would convert the shuttles 12V to 5V DC, which would allow all the
PCB components to operate, as all components operate at 5V. Next the GPS would be
mounted onto the circuit board. A single ATmega2560 microcontroller would be used
which would be programmed to filter and help transfer needed data. The last main
component of the shuttles module would be the 900MHz RF transceiver, which would
relay the data to the receiving station.
22 | P a g e
The adding of an accelerometer as a component onto the PCB was taken into account.
The purpose of adding on an accelerometer would be solely for energy conservation
purposes. If an accelerometer was chosen to be integrated into the system it would
simply interface from the GPS and to the micro-controller. As the need to know if a
shuttle is in transit or not can be determined by the speed output provided by the GPS.
The use for the accelerometer would be to be able to tell whether or not the shuttle
unit is idle. By doing so one may know whether or not the shuttles engine is running and
if the bus has been idle for too long. An actual picture the accelerometer can be seen
in Figure 14 below.
Figure 14 - ADXL213AE Accelerometer (with permission from sparkfun.com)
The interfacing of the components would all be done on a PCB configuration. The GPS
and the accelerometer on the PCB would interface to one of the four single microcontroller’s serial ports and one of the analog I/O pins respectively. The microcontroller
would then interface to the RF transmitter via one of the three remaining serial ports
available. The receiving station would compromise of two main entities. The first would
be the 900MHz RF receiver, which would be mounted onto a radio tower located on
campus. The RF receiver that would be mounted onto the radio tower would have a
high gain antenna as to increase the receiving of data range. The data would be then
transferred to the web server where all the data would be organized, compiled, and
finally outputted onto an online digitalized map.
4.1.2 Possible Software Architecture Choices
Based on the research completed for the software aspect of the project, several
software architecture choices are apparent. While the tracking device microcontroller
code and data receiving / processing code are straight forward and have little room for
options, the data presentation to the user is flexible. Two main options for user
interfaces are available: a server/thick-client application or a web-based server and
client.
The application server and thick-client approach is a straightforward software design. An
application server is set up at the university and is connected to the database server.
The application server is the "go-to" point for the clients. A thick-client desktop
application, installed on each user's workstation, presents the user with all functionality
23 | P a g e
required to monitor the shuttles. It includes a visual map, point and click buttons and
interactivity, and enables real-time views of the shuttle positions. The client allows for
this real-time functionality by periodically making function calls to the application
server. The application server receives the request, queries the database for the
information requested, and responds with the result. This is illustrated in Figure 15
below.
Figure 15 - Application Server & Thick-Client Architecture
Thick-client applications have several advantages and disadvantages. Advantages
include ease of programming, large variety of options with very little limitations, and the
ability to fully harness the processing power of the client workstation. Some
disadvantages arise when observing the scalability of this architecture. New users must
have the client application installed on their computer, which introduces an onslaught
of maintenance tasks. Clients must be updated to latest versions, protected so that
users cannot modify important program required files, and require re-installs when new
features are added.
Web-based delivery systems attempt to answer the shortcomings of thick-client based
architectures, while losing some of the key advantages. Web application architectures
consist of a web server, which is typically split into a "front-end" and a "back-end", and a
website which clients can access via a web browser. The back-end of the web server is
very similar to the application server in the thick-client architecture in that it takes
processes requests from the front-end, queries the database, and responds with the
results. The front-end is similar to the thick-client previously discussed, except that it
encapsulates the features that a client provides and hosts it all in one place. The frontend of the web server is the user interface of the web application, or the "website."
24 | P a g e
Clients can view this page using a common web browsing application typically installed
on all workstations by default. This is illustrated in Figure 16 below.
Figure 16 - Web Server & Client Architecture
The web-based architecture improves upon the application server/thick-client based
architecture largely in the area of scalability and maintainability. Only one server, the
web-server, has to be maintained. On the client side, as long as the workstation has a
compatible browser and meets the minimum hardware requirements of the web page,
it can access the application. Downfalls of this approach are introduced when
applications require high performance or a rich functionality set. This is due to the fact
that web browsers are limited in the interactivity they provide with the user and their
minimal direct access to hardware.
4.2 SELECTION OF INITIAL DESIGN ARCHITECTURE
The following section covers the final hardware and software design configurations that
were chosen for the TTS development. The final hardware configuration that was
chosen was the single micro-controller design. The final software architecture that was
chosen was the web-based approach.
25 | P a g e
4.2.1 Hardware Architecture Selection
After considering all of the possible hardware configurations, the configuration that was
chosen was the single microcontroller architecture. The module is a non-passive
dynamic radio communication design. The main reasons for choosing this particular
configuration was due to less entities in the design, the cost effectiveness, and the
portability of the system.
One of the crucial elements of the PCB design will be the DC-DC converter. The
converter that was chosen was the Texas Instruments PT78HT205H, which converts the
shuttles 12V to a smooth and steady 5V DC. As all the components of the shuttle
module are rated to run at 5V DC.
The microcontroller that was chosen was the ATmega2560. The ATmega2560 was
chosen due to the fact that it has four serial input/output ports, which are essential for
the interfacing of parts for the TTS design. An actual picture of the ATmega2560 can be
seen in Figure 17 below. A detailed explanation of how the microcontroller is exactly
interfaced and why it was interfaced the way it is, will be covered in a later section.
Figure 17 - ATmega2560 Micro-Controller (with permission from sparkfun.com)
The GPS that was chosen was the EM-406A SiRF III by USGlobalSat. The GPS is a 20channel receiver that includes on-board voltage regulation, LED status indicator, battery
backed RAM, a 6-pin interface cable, and a built-in patch antenna. The GPS was chosen
due to the built-in patch antenna as to help minimize entities on the board. An actual
picture of the EM-406A GPS module can be seen in Figure 18.
26 | P a g e
Figure 18 - EM-406A GPS Module (with permission from sparkfun.com)
The RF modem that was chosen was the XTend 900 1W RPSMA, which can be
programmed to act as either a transceiver or receiver. A 900MHz receiver was chosen
due to the range capabilities that are permissible. The RF modem was also chosen due
to its low-power, user friendly, and coverage range. A picture of the actual RF
transceiver component that will be used can be seen in Figure 19 below.
Figure 19 - XTend 900MHz RF Modem (with permission from sparkfun.com)
The Accelerometer that was chosen was the ADXL213AE, which would be used for
energy conservation purposes. A picture of the accelerometer can be seen in Figure 14
in a previous section covered. The accelerometer would be used to detect whether or
27 | P a g e
not the shuttles engine is on or not. It would help to determine how long the shuttles
engine has been idle for or if the buses engine may be broken.
By doing a PCB design instead of using a direct connection method of parts the TTS
module will be compact and portable. The portable module will be very beneficial as all
the components will be interfaced on a single board and the module would be small
enough as to not impair any extremities internally or externally of the shuttling unit. The
PCB design will interface and receive its power from a cigarette lighter adapter, which
will connect to the shuttle unit.
The general interfacing of all the parts on the PCB design will all begin with the 2.1mm
jack which delivers a 12V power supply to the DC-DC converter. The PT78HT205H
converter will interface to the ground plane and vcc plane of the circuit board. The EM406A GPS and the ADXL213AE accelerometer both interface to the microcontroller. The
accelerometer is interfaced to one ATmega2560 microcontroller’s analog I/O ports. The
GPS interfaces to one of the microcontroller’s serial ports available. From the microcontroller the XTend RF transmitter will interface to one of the microcontrollers serial
I/O ports, which will collect all the data and transmit to the RF receiver. An extended
and more detailed interfacing explanation of the design will be covered in length in a
later section of the paper.
By developing and not purchasing a monitoring module for each shuttle the cost of an
AVL system for the University will be exponentially reduced, and to further reduce the
cost of the system the labor of research and development if essentially free. By also
choosing to create a dynamic radio communication design the elimination of any
monthly fees is added. The TTS chosen architecture will therefore be a very minimal
entity, portable, and cost effective design.
4.2.2 Software Architecture Selection
After considering the possible software architecture options, it was chosen that a webbased approach to the application is the most beneficial choice for a variety of reasons.
The main reasons include portability and maintainability.
Portability in web-based systems is abundantly apparent. One can log onto the internet
and access web pages from virtually anywhere: a desktop computer, laptop, cell phone,
tablet device, and the list continues to grow. By choosing a web application over a
legacy, thick-client one, users will be able to navigate to the shuttle tracking web
application quickly and easily, without the need for installing an application. Aside from
providing existing users with high portability, this system also encourages growth
substantially by clearing an easy path for new users to join. One must simply type in the
address of (or search for) the shuttle tracking website and is instantly presented with
the tracking map.
28 | P a g e
Maintainability in software systems is a crucial component to success. Web-based
solutions are considerably easier are more cost effect to maintain than legacy
applications. Due to the client abstraction present, client application feature updates,
security patches, bug patches, and troubleshooting at the client's site are a thing of the
past. When any changes need to be made to the application, both server and "client"
side, they are all done on one centralized point at the web server. This level of
maintainability results in extensive cost savings to the shuttle tracking system
management and increased user satisfaction due to high availability guarantees.
Additionally, the web based architecture will allow for future additions to the system to
be easily possible. A mobile phone application, for instance, can be written to interface
with the web-server to provide an optimized mobile shuttle tracking experience.
Security can be implemented as well, by using the HTTPS web standard to encrypted
HTTP traffic. Overall, the web-based implementation of the shuttle tracking system is a
key design choice that will propel the system towards a positive product.
4.3 OVERALL SYSTEM ARCHITECTURE
The overall system features a steady balance between hardware and software to
achieve its goal. The following diagram in Figure 20 shows the overall system
architecture, and how each of the components interconnects with each other.
Custom
Firmware
GPS
Microcontroller
RF Modem
RF
RF Modem
RF Modem
Accelerometer
RF Modem
Approved Web
Browser
Custom DB
Apache
MySQL
Serial
Custom SW
Windows
Linux
Any OS
Client
Workstation
Custom Web
Application
TCP/IP
Web Server
TCP/IP
Data Collection &
Processing Server
Figure 20 - Overall System Architecture Block Diagram
29 | P a g e
Each bus is equipped with a custom TTS module (labeled “Mobile Tracking Device” in
the illustration), which contains all of the sensors needed to collect the data (GPS,
accelerometer, etc.). This data is fed to the microcontroller, which sends out packages
through the RF modem. A separate RF modem at the radio tower on the UCF campus
receives this data, and passes it along to the data processing server. This machine
unpacks the data, and stores it into the database.
The web application, available through the internet, gathers this data from the database
to present its display. The client workstation (or, “Any Device with Web Browser
Installed”) accesses the web application, to provide its user with the graphical interface
for the Transit Tracking System. The diagram in Figure 21 illustrates this process systems
architecture graphically.
Figure 21 - Transit Tracking System Illustration
30 | P a g e
5
Hardware Design
5.1 SYSTEM LEVEL DESIGN
In Figure 22 the high-level block diagram of the hardware configuration is illustrated,
which includes the bus module, receiving system, data acquisition, and web server block
diagrams. The extensive details of the bus module design and the receiving system
design is thoroughly covered in the following sections. In the bus module design section
each main component will be extensively covered. In the receiving system section a
through explanation of how transmitted data will be gathered will be covered.
Mobile Tracking
Device
(x N shuttle buses)
RF
Transmission
Tracking Data Receiving
System
Serial connection
TCP/IP
Web Server
TCP/IP
Data Acquisition
& Processing
Client
Workstation
(x N users)
Figure 22 - Hardware System Level Design
31 | P a g e
5.2 BUS MODULE
A monitoring module is designed for each shuttle unit. Each monitoring module consists
of four main components: a GPS, a microcontroller, an accelerometer, and a RF
transmitter with antenna. The bus will act as the modules power supply and will
interface to the shuttle via the cigarette lighter adapter.
The GPS is the main entity necessary for the TTS tracking device module, as it provide all
the data necessary for the TTS system. The GPS module transfers its collected data to
the microcontroller through one of the four serial ports available on it. The data will
then be transferred from the microcontroller to the RF transceiver, which will also
interface to one of the four serial ports available. An additional feature that was added
to each monitoring module is an accelerometer that will enable the knowledge of
whether or not a bus is idle by detection of vibrations from the shuttles engine. The
shuttle unit module block diagram can be seen in the Figure 23 below.
Mobile Tracking Device
(x N shuttle buses)
Antenna
RF
Modem
(Client)
GPS
RF Transmission
(to Tracking Data
Receiving System)
Microcontroller
Accelerometer
DC-DC
Power
Supply
enclosure
Cigarette
Lighter
Plug
DC input from
bus cigarette lighter
Figure 23 - Mobile Tracking Device Block Diagram
32 | P a g e
5.2.1 Component Details & Configuration
The following section covers each main component of the shuttle unit's module. The
section will cover the extensive details and the purpose of each component for the TTS
shuttle unit module. The main entities that will be discussed will be the PT78HT205H
DC-DC converter, EM-406A GPS module, ADXL213AE accelerometer, ATmega2560
micro-controller, and the 900MHz XTend RF transceiver.
5.2.1.1 PT78HT205H DC-DC Converter
The PT78HT205H DC-DC converter is used to convert the shuttle unit’s 12V from the
power supply to 5V DC, where 5V is the required voltage for all the components on the
PCB design. The PT78HT205H operates from a single 5V power supply with one 10uF
ceramic capacitor and one 100uF electrolytic capacitor, and will have a low supply
current at 8mA.
Figure 24 – PT78HT205H DC-DC Converter Pin Layout (with permission from
texasintruments.com)
Referring to the pin layout for the Max232 in Figure 24 above, it can be assumed that
the COM pin will be connected to the ground layer of the PCB and the Vout pin will be
connected to the 5V layer of the PCB. The Vin utilizes a 10uF ceramic capacitor. The
Vout pin utilizes a 100uF electrolytic capacitor. An actual picture of the converting unit
can be seen in Figure 25.
33 | P a g e
Figure 25 – PT78HT205H DC-DC converting unit (with permission from
texasinstruments.com)
5.2.1.2 EM-406A GPS Module
The EM-406A GPS module will be the most crucial element of the TTS module design as
it is the component that will provide all the necessary data for the TTS. The GPS module
includes voltage regulation, LED status indicator, battery backed RAM, and a built in
patch antenna. A 6-pin interfacing cable is also included with the module. The GPS
module also supports the NMEA 0183 data protocol, which is a standard order of data
output for the GPS. The NMEA0183 data output order that will be transmitted can be
seen Figure 26 below.
Figure 26 - NMEA 0183 Protocol Data Output
34 | P a g e
The EM-406A GPS main power input is rated for 4.5V-6.5V DC, which falls well within
the 5V DC input that is provided by the circuit design. Referring to the pin layout for the
EM-406A GPS in Figure 27 below, it can be seen that the GND and VIN pins will be
connected to the GND of the PCB and the 5V of the PCB respectively.
Note that there are two GND pins on the module, pin1 and pin5, therefore it can be
concluded that both of the GND will connect to the GND of the PCB. The 5V VCC plane
output from the PT78HT205H converter will connect to the TX pin, transmitting pin, of
the GPS. The remaining two connections are the GPS data pins. The RX pin, receiving
pin, is the GPS RX command line, which will interface to the micro-controller. The 1PPS
pin is the GPS NMEA 0183 standard data output and is not used.
Figure 27 - EM-406A GPS Module Pin Layout (With permission from usglobalsat.com)
5.2.1.3 ADXL213AE Accelerometer
The ADXL213AE accelerometer will be used to tell weather of not the shuttle units
engine is idle and help to know how long it has been idle for. The ADXL213AE is a is a
low power, low cost, dual axis accelerometer with single conditioned, duty cycle
modulated outputs on one integrated circuit. The ADXL213AE measures acceleration
with a full scale rang of +/-1.2g.
Figure 28 - ADXL213AE Pin Layout (with permission from analog.com)
35 | P a g e
Referring to the pin layout of the ADXL213AE in Figure 28, it can be seen that the VS pin
and COM pin are connected to the 5V of the PCB and GND of the PCB respectively. Note
that the VS of the IC will have a 0.1uF capacitor connection and is then connected to the
5V of the PCB. The ST pin, the self-test pin, will have a miniature pushbutton connected
to it as to be able to reset and test the accelerometer when needed. Both the XFILT and
YFILT pins will have a 0.1uF capacitor connected to it which will interface to the GND of
the PCB as well. Both the XOUT and YOUT pins are not needed and will be left open.
Lastly, the T2 pin, which is the accelerometer data or set counter period, will be
connected to a 1Mohm resistor which will lead the GND of the PCB. Note that T2 pin will
interface to the microcontroller with the by transmitting its data. The functional block
diagram for the ADXL213 can be seen in Figure 29 below. Note that some of the
connection that was made for the TTS design follows the same of the functional block
diagrams interfacing.
Figure 29 - ADXL213AE Functional Block Diagram (with permission from analog.com)
5.2.1.4 ATmega2560 Microcontroller
The ATmega2560 is a low-power CMOS 8-bit microcontroller. The ATmega2560 is
powerful enough to execute instructions in a single clock cycle. The microcontroller has
non-volatile program and data memories. Some special additional features that the
controller has are a power-on reset and programmable brown-out detection. It also
offers an internal calibrated oscillator; external and internal interrupt sources, and six
different sleep modes. The ATmega2560 offers 86 programmable I/O lines, as well as a
100 lead package.
36 | P a g e
Table 5 - ATmega Port D Alternative Functions (with permission from atmel.com)
The main port section that will be used is Port D (PD0-PD7). Port D is an 8-bit bidirectional I/O port with internal pull-up resistors. Port D’s output buffer have
symmetrical drive characteristic with both high sink and source capability. When Port
D’s pins are used as inputs the pull-up resistors are activated due to the low pull of the
source current. The table for Port D’s alternative function can be seen in Table 5 above.
An extensive block diagram and functionality of the ATmega2560 can also be seen
in Figure 30 below.
Figure 30 - ATmega2560 Functional Block Diagram (with permission from atmel.com)
37 | P a g e
Referring to the pin layout of the ATmega2560 in Figure 31 it can be seen that All VCC
and GND pins will be connected to the 5V of the PCB and GND of the PCB respectively.
To reduce noise interferences all several 0.1uF ceramic capacitors were used and tied
between all VCC pins and all GND pinsl. The reason for different GND pins and VCC pins
are so that if there was a more complex circuit the option to separate the GND pins and
VCC pins if there, as to seclude and reduce the noisy parts of the circuit by reducing the
interference. The reset pin will interface to a pushbutton to reset the micro-controller
when needed. The GPS TX data output line will connect to the input of the (T0/PD7) pin
of the micro-controller. The output of the GPS
TX output line will feed though the microcontrollers pin (TXD1/NT3) PD3, which will
interface to the XTend RF transceiver. The GPS RX command data output line will
connect to the input of the (T1/PD6) pin of the microcontroller. The output of the GPS
RX command output line will feed though the microcontrollers pin (RXD1/NT2) PD2,
which will interface to the XTend RF transceiver. The ADXL213AE output data line will
connect to the AD0 pin of the microcontroller. The output of accelerometer will feed
though the microcontrollers pin AD1, which will interface to the XTend RF transceiver.
All other pins of the micro-controller are unused and have been left open.
Figure 31 - ATmega2560 Atmel Micro-controller (with permission from atmel.com)
38 | P a g e
5.2.1.5 9XTend-PKG-R RF Modem
The RF module transfers a standard asynchronous serial data stream, operates within
the ISM 900MHz frequency band, and sustains up to 115.2kbps of data, which is well
over the needed amount for the TTS.
Table 6 - XTend Pin Reference (with permission from Digi.com)
The pin configuration for the XTend RF modem can be seen in Figure 32. The
identifications for the RF modems pins can be found in Table 6.
39 | P a g e
Referring to the Xtend RF modem pin layout pin1 and pin 2 are GND and VCC
respectively, which will be connected to the GND of the PCB and 5V of the PCB
respectively as well. DI and DO are corresponding input and output pins that will
interface to the GPS TX output data. The CFG and SHDN pins of the RF transceiver will be
used as I/O pins for the GPS RX command line. The SLP and GPO2 pins of the RF
transceiver will be used as the I/O pins for the ADXL213AE accelerometer.
Figure 32 - 900MHz XTend RF Modem Pin Layout (with permission from Digi.com)
A higher frequency of the RF transceiver provides a shorter the coverage distance. The
lower frequency of the RF transceiver provides a longer coverage distance. Therefore a
900MHz XTend transceiver was chosen due to the 40-mile range capability. However
the 40-mile range capability is only with a high gain directional antenna with good line
of sight. Fortunately the range maximum distance that would need to be monitored for
the TTS is a short distance of three miles. The XTend module also utilizes Frequency
Hopping Spread Spectrum (FHSS), where the module has the ability to avoid
interference by hopping to a new frequency on every packet transmission or retransmission.
5.2.2 Circuit Schematic
The following section combines all of the entities chosen for the TTS shuttle unit’s
module. The final circuit design for the PCB of the TTS can be seen below. The schematic
of the TTS bus module shows all of the proper and necessary connections needed. All
pins that are left unused are done so intentionally as they are unnecessary pins for the
TTS shuttle unit module. The final circuit diagram can be seen on the next page of this
section.
40 | P a g e
41 | P a g e
42 | P a g e
5.2.3 PCB Layout
The following section shows the final PCB layout for the production of the TTS. Each of
the actual components will be laid out on the PCB as seen in the Figure 33 below.
Figure 33 - Final TTS PCB Layout
43 | P a g e
5.2.4 Part List
The following Table 7 is a list of the hardware parts that are to be used for the Mobile
Tracking Device.
Table 7 - Mobile Tracking Device Hardware Part List
System Item
Manufactur Part
erManufactu NumberDescri
DescriptionNumber
Qty
rer
ption
RF Modem
Digi
XT09-SI
9XTend - 1W transceiver, w/RPSMA
connector, 115000 bps, industrial
1
RF Mobile Antenna
Digi
A09-HASM-675
900 MHz, 6" half wave, (2.1 dBi)
articulating, RPSMA connector
1
GPS
USGlobalSat
EM-406A
20 Channel EM-406A SiRF III Receiver with
Antenna
1
Cigarette Adapater
MPD (Memory
Protection
Devices)
ZA5073
CORD STR W/LED 5A FUSE DC PLUG
1
RF Standoffs
Richco
MSNE-3-01
MSNE Series Nylon .1875 inch Stand-Off
Nut for 4AB Self-Tapping Screw
1
RF Mounting
Screws
Aaron's SelfTapping Screws
1013ST1413
#4-24 x 7/16 Self-Tapping Screws, Phillips
Drive, Pan Head, Hardened Steel, Zinc
Plated, Type AB, Full Thread
1
PCB Mounting
Screws
Aaron's SelfTapping Screws
1701SN0259
#4-40 x 1/4 Machine Screws, Phillips Drive,
Pan Head, 18-8 Stainless Steel, Plain Finish,
Full Thread, RoHS Compliant
1
PCB
Advanced
Circuits
(custom order)
Custom Order PCB Board
1
Microcontroller
Atmel
ATMEGA2560-16AU
ATMEL - ATMEGA2560-16AU - IC, 8BIT
MCU, AVR, 16MHZ, TQFP-100
1
Microcontroller:
Crystal Oscillator
Citizen Finetech
Miyota
HC49US16.000MABJ-UB
CRYSTAL 16.000 MHZ 18PF HC49/US
1
Microcontroller:
Capacitor
Kemet
C0805C220J5GACT
U
CAP CERAMIC 22PF 50V NP0 0805
2
44 | P a g e
System Item
Manufactur Part
erManufactu NumberDescri
DescriptionNumber
Qty
rer
ption
Microcontroller:
Capacitor
Kemet
C0805C104K1RACT
U
CAP CER .10UF 100V X7R 0805
4
Microcontroller:
Resistor
Vishay/Dale
CRCW080510K0JNE
A
RES 10K OHM 1/8W 5% 0805 SMD
1
RS232
TE Connectivity
5745781-4
CONN D-SUB RECPT R/A 9POS 30GOLD
1
RS232:Diode
Diodes Inc
1N4148-T
DIODE SWITCHING 75V 500MW DO-35
2
RS232:Transistor
Fairchild
Semiconductor
BC557
TRANS PNP 45V 100MA TO-92
1
RS232:Transistor
Fairchild
Semiconductor
BC547
TRANS NPN 45V 100MA TO-92
1
RS232:Capacitor
Panasonic
EEE1VA100WR
CAP 10UF 35V ALUM ELECT
1
RS232:Resistor
Vishay/Dale
CRCW080510K0JNE
A
RES 10K OHM 1/8W 5% 0805 SMD
4
RS232:Resistor
Vishay/Dale
CRCW08051K00JNE
A
RES 1.0K OHM 1/8W 5% 0805 SMD
1
RS232:Resistor
Vishay/Dale
CRCW08054K70JNE
A
RES 4.7K OHM 1/8W 5% 0805 SMD
1
Power
CUI Inc
PJ-102AH
CONN PWR JACK 2.1X5.5MM HIGH CUR
1
Power: DC-DC
Convertor
Texas
Instruments
PT78HT205H
REGULATOR 5V 2A 3PSIP HORZ
1
Power: Capacitor
Kemet
C0805C105Z3VACT
U
CAP 1.0UF 25V CERAMIC Y5V 0805
1
45 | P a g e
System Item
Manufactur Part
erManufactu NumberDescri
DescriptionNumber
Qty
rer
ption
Power: Capacitor
Panasonic
EEE1VA101UP
CAP 100UF 35V ALUM ELECT
1
Accelerometer
Analog Devices
Inc
ADXL213AE
IC ACCELER DUAL AXIS DGTL 8-CLCC
1
Accelerometer:
Capacitor
Kemet
C0805C104K1RACT
U
CAP CER .10UF 100V X7R 0805
3
Accelerometer:
Resistor
Vishay/Dale
CRCW08051M00JN
EA
RES 1.0M OHM 1/8W 5% 0805 SMD
1
GPS: Header
JST Sales
America Inc
CONN HEADER SH
6POS TOP 1MM TIN
BM06B-SRSS-TB(LF)(SN)
1
Enclosure
Bud Industries
BOX ABS 5.07" X
3.57"X 1.59" BLK
CU-389
1
RF Modem
mounting screws
Supplier: Ace
Hardware
Various self-tapping
screws
(various)
4
5.3 RECEIVING SYSTEM
The data retrieving design will include one receiver, several repeaters, one transmitter
per shuttle unit, and a web base station. The need for a high gain antenna for the
receiving system is required in order to obtain the maximum coverage distance of the
RF modem. Therefore, one of the receivers will have a high gain antenna that will be
connected to the University’s radio tower.
The data collected from the receiver will interface to another transceiver nearby via
serial port. Both transceiver and receiver will be on the radio tower, requiring the need
to be weather proof. The transceiver on the tower will then relay the data collected to
one last receiver on the ground interfaced with the web server. At the web server all
data is processed and analyzed. The receiving system block diagram can be seen in
the Figure 34 on the next page.
46 | P a g e
Tracking Data Receiving System
Radio
Tower
Antenna
Serial connection
(to Data Processing
and Presentation)
Waterproof RF
Modem
RF Transmission
(from Mobile
Tracking Device)
PWR/RS232
<-> Ethernet
Adapter
Waterproof
CAT5 Cable
AC input
Figure 34 - Tracking and Receiving Data
5.3.1 Component Detail & Configuration
The following section covers the main components of the receiving system
configuration. This section will cover the extensive details and the purpose of each
aspect of the receiving system for the TTS. The main components of the receiving
system that will be discussed are the receiving unit system and what the system
compromises of.
5.3.1.1 Receiving Unit System
The receiving unit system will follow a direct connection method that was earlier
discussing the research section of this paper. The receiving system will compromise of a
two waterproof XT09-4EI-RA 900MHz Xtend RF modems as well as one standard XT09PKI-R 900Mhz Xtend RF modem. To give line of sight for the receiving system the two
waterproof modems will be mounted onto a 500ft high radio tower. The most
important aspect of the system will be the A09-F8NF-M, fiberglass Omni-direction high
gain 900MHz RF antenna.
One of the waterproof XT09-4EI-RA XTend 900MHz RF modem purchased isbe mounted
on the top of the university’s TowerII dormitory complex and acts as the systems base
station. Another oneOne of the XT09-4EI-RA 900MHz RF modems is mounted on the top
of the university’s Physical Sciences building used as a repeating system. Several other
repeating systems can be mounted as well to increase range coverage. The waterproof
RF modem that accepts the received data via RS232 port will be programmed to act as a
47 | P a g e
transceiver. The reason why it will be programmed as a transceiver is so the all the
received information can be transferred though the 900MHz radio frequency to another
receiver, the XT09-PKI-R, that will be down at the base station as. The reason for doing
so is due to the fact that there are no RS232 cables long enough to interface from the
top of the radio tower down to the data acquisition station.
The choice of a fiberglass Omni-directional 900MHz high gain RG antenna was chosen to
maximize the coverage distance of the RF modems as well as to help give a good line of
sight for data transferring and receiving. The antenna is a base station antenna, with a
heavy wall, gold anodized 1 ¼” aluminum mounting sleeve. The antenna has precision
copper clad elements sealed in a white ultraviolet-inhibiting fiberglass radome for
weatherability. A picture of the high gain antenna that will be used can be seen in Fiure
35below.
Fiure 35 - A09-F8NF-M 900MHz High Gain Antenna (with permission for Digi.com)
Once the data is received by the high gain antenna receiver and transferred to the
transceiver unit on the tower a standard XT09-PKI-R 900MHz XTend RF modem will be
used as a receiver down at ground level. The XT09-PKI-R 900Mhz RF modem down at
the ground level will interface to the base station, which will have the database server
and web server units. A picture of the standard 900MHz RF modem that is used can be
seen in Figure 36 below.
48 | P a g e
Figure 36 - XT09-PKI-R XTend RF modem (with permission from Digi)
The part list for the hardware components of the receiving system can be seen in Table
8 below.
Table 8 - Receiving System Hardware Part List
System Item
Manufacturer
Part
NumberDescription
High Gain
AntennaRF
DigiDigi
A09-F8NF-MANT
DigiDigi
XT09-4EI-RAXTend
Digi
JT2N1-CL1-10F
Waterproof
RF Modem
Antenna to
Waterproof
RF modem
cable
Qty
DescriptionNumber
ANT 8.1DBI 65" BASE
STATION W/NA09
XTend-PKG 900 MHz,
NEMA 4, RS232/422/485, external
antenna connectorXT09-
11
4EI-RA
13
CONN CBL RPTNC
MALE-N C MALE 10'
1
5.4 DATA PROCESSING & PRESENTATION
The data processing and presentation aspect of the hardware design consists of one
server for processing, one database/web server, and a variable number of client
workstations for presentation of the information. Processing of the tracking data will
occur on the Data Acquisition/Database server. This server will also insert into and host
the database containing the recent tracking data. The Web Server will access the
database to collect the information for serving to clients, which are to access the
information from a workstation. Figure 37 below provides an overview of the Data
Processing and Presentation server connections.
49 | P a g e
Serial connection
(from Tracking Data
Receiving System)
Data Acquisition /
Database Server
TCP/IP
Web Server
Client
Workstation
Note: This hardware will not be part of the
design, rather it will utilize the design. It will
access the user interface via a web browser
installed on the client workstation. A list of
minimum required components for this client
is included in the design.
Figure 37 - Data Processing and Presentation
5.4.1 Data Acquisition & Processing Server Hardware Configuration
Each server will compromise of one computer unit to serve a sole purpose. The data
acquisition and data base server will utilize one computer unit and the web server will
also utilize its own computer unit. The University of Central Florida will provide a
computer module for each of the TTS receiving stations. The data acquisition and data
base server will interface to the XT09-PKI-R XTend RF Modem. All the data that has been
received and transferred to the data acquisition and processing server will be collected,
processed, sorted, and stored into the web/database server. The Data Acquisition
Server must retrieve incoming data from the receiving RF modem, process it by parsing
50 | P a g e
the data and organizing it into a usable format, and store it on a network database.
These functions require moderate processing power and disk storage. The
recommended minimum hardware specifications and configuration are listed below.
•
•
•
•
•
•
2 gigahertz (GHz) 32-bit (x86) or 64-bit (x64) processor
2 gigabytes (GBs) of random access memory (RAM)
40 gigabyte (GB) hard drive, serial-ATA (SATA) or newer interface
Universal serial bus (USB) 2.0 interface
100 megabits per second (Mbps) IEEE 802.3 Ethernet interface
Must be connected to the UCF intranet via Ethernet connection
5.4.2 Web Server Hardware Configuration
The Web Server stores and retrievesretrieve the latest tracking data for the shuttle
buses from its local database. It then displaysdisplay the objects' positions on a web
based map for serving to clients. This hardware is highly dependent on the number of
requests for the tracking site by users; therefore this server may require upgrades in the
future if user loads increase drastically. The recommended minimum hardware
specifications and configurations, assuming a moderate load of UCF employees and
students, are listed below.
•
•
•
•
•
•
•
•
2 gigahertz (GHz) 32-bit (x86) or 64-bit (x64) processor
4 gigabytes (GBs) of random access memory (RAM)
40 gigabyte (GB) hard drive, serial-ATA (SATA) or newer interface
Universal serial bus (USB) 2.0 interface
100 megabits per second (Mbps) IEEE 802.3 Ethernet interface
Must be connected to the UCF intranet via Ethernet connection
Internet connection download bandwidth of 5 Mbps
Internet connection upload bandwidth of 5 Mbps
5.4.3 Client Workstation Minimum Hardware Configuration
A client workstation, or desktop/laptop computer, is the intended viewing medium for
the tracking system. While the system is web-based and can be viewed on almost any
device with web access, the majority of the users will be UCF employees monitoring the
buses that will use desktop/laptop computers. The recommended minimum hardware
specifications and configurations are listed below.
•
•
•
•
•
1 gigahertz (GHz) 32-bit (x86) or 64-bit (x64) processor
1 gigabyte (GB) of random access memory (RAM)
10 megabits per second (Mbps) IEEE 802.3 Ethernet interface
Internet connection download bandwidth of 1 Mbps
Internet connection upload bandwidth of 0.5 Mbps
51 | P a g e
6
Software Design
6.1 SYSTEM LEVEL DESIGN
The TTS system is heavily comprised of software code written for various functionalities.
Beginning with data transmission, the microcontroller runs software to handle the
collected information. This software allows for the manipulation and formatting of the
raw data that is collected, including GPS coordinates, time, and bus ID. The
microcontroller software then transmits its generated output to the receiver on the
radio tower, via the RF modems. At the receiver side, software is utilized to accept the
transmitted data and store it into the database. This software parses the data into its
respective classes, and then stores it into the database. The database used to store our
data uses a popular Structured Query Language (SQL) for web-based applications,
MySQL. The design uses phpMyAdmin, which is an easy-to-use web-based visual tool for
managing SQL databases. However, this software is only used for managing the
database, thus the project still requires its own custom software to insert data into the
database, as mentioned above.
Once the data has been collected, processed, and stored, it is then ready for use by the
web application. This application can be thought of as the “meat” of the software for
this project. The web-based software works hand-in-hand with Google’s provided map
platform, to present real-time visual tracking of UCF’s shuttle system.
The server-side code retrieves the GPS coordinates for each bus from the database and
uses them to show where the bus is located on the map. On the client side, the user has
the option to customize their own view, by toggling the display of each route “on” or
“off”. The map updates in real-time, to display the most recent position of each bus. The
map also uses icons to indicate all the bus stops along each route. The diagram on the
next page in Figure 38 highlights the cycle of data transfer in the software system level
design.
52 | P a g e
Microcontroller Code
(Mobile Tracking
Device)
Location Data
Collection and
Processing
Bus Tracker Web
Application
(Client-side)
Database
Bus Tracker Web
Application
(Server-side)
Figure 38 - Software System Level Design
6.2 MICROCONTROLLER FIRMWARECODE
The microcontroller embedded on the tracking device board will be the central point of
control for each component.
The code written for the controller
accomplishesaccomplish several basic tasks. First, it collectscollect data from the GPS
and the accelerometer by accessing the chip’s serial interface. This data is then
converted to a format that is convenient and short enough to be quickly sent back to
campus. The code then packages this data and sends it out the interface to the RF
modem via serial communication. The Arduino microcontroller development platform
was chosen for this project. This set of development tools greatly improved efficiency
during the development stage of the project due to the code’s familiar C-like syntax,
extensive library of interface functions, and large developer base. A logical view of the
microcontroller code required for the mobile tracking device is shown in Figure 39
below.
Microcontroller Code
(Mobile Tracking Device)
GPS &
Accelerometer
Interface &
Location
Retrieval
Data
Conversion /
Packaging
RF Modem
(Client)
Interface
to Data Collection
and Presentation
Figure 39 - Micro-controller Code
53 | P a g e
6.2.1 Bootloader
The microcontroller will be fitted with a modified Arduino bootloader which will run
before the TTS code starts. The decision to include a bootloader is one that will greatly
enhance the usability of the device.
Standard microcontroller code uploads consist of a proprietary “in-system-programmer”
device, which attaches from a computer to the microcontroller through a special set of
header pins on the PCB board. This allows the developer to “flash” the firmware onto
the device. Since the TTS tracking device will be secured in an enclosure, this would
required the customer to take apart the device in order to perform any required
firmware updates for bug fixes or feature enhancement. Additionally, the user would
have to own this proprietary device and be trained on how to use it and its
accompanying software properly.
To avoid this constraint and make it much easier for the customer, an modified Arduino
bootloader has been developed for the tracking device. The modified bootloader
consists of a standard Arduino ATmega bootloader, with the addition of a 10 second
delay during startup to allow for firmware updates. The standard Arduino bootloader
does not include this delay, since it assumes an auto-reset functionality is built into the
electrical circuit that connects a special pin on the RS-232 interface to the reset
interface of the microcontroller. Since this auto-reset functionality is not implemented
in the TTS design to maintain simplicity and decrease cost, the delay during startup
circumvents this issue.
The bootloader is “flashed” onto the microcontroller during the TTS manufacturing
process and is a one step process. All subsequent TTS firmware loads, whether
conducted by the TTS team or the customer, will be done through the RS-232 interface
and during the 10 second boot-up delay.
6.2.2 UML Diagrams
This section includes Unified Modeling Language (UML) diagrams which pictorially
describe the software architecture and connections of the microcontroller code.
54 | P a g e
Accelerometer
GPS
main
RF Modem
request location
return location data
read accelerometer data
calculate if engine is running
return result
request packaged data
return packaged data
clear to send (CTS)
transmit packaged data
Figure 40 - Micro-controller code: UML Diagram
Figure 40, the UML Sequence Diagram, illustrates the high level sequence of events that
must occur for the tracking device to produce the desired output. The "main" section of
the code is responsible for acting as a central point for conducting all operations. It first
requests location data from the GPS module and waits for the response from the GPS.
55 | P a g e
This action is then repeated for the accelerometer to retrieve the acceleration data.
Once both requested data pieces are collected, the subroutine function is called that
packages all the data into a compact format for sending over the RF signal. The
packaged data is then sent to the RF modem to be transmitted.
This sequence is repeated indefinitely while the device is turned on, so that all data
collected from the tracking device is constantly sent to the receiving system. Since the
project is only interested in updating each shuttle's location on the map every few
seconds, it is not necessary to concurrently request and process the results from the
GPS and accelerometer, which would require multiple threads to be written to the
microprocessor, adding additional complications and points of failure. The time to
complete one full iteration of this sequence diagram is predicted to be in the order of
milliseconds, further justifying the sequential nature.
6.2.3 Function Descriptions & I/O Variables
This section describes the main functions that were developed for the microcontroller
to perform its main operations. There are many other functions that were written to
support all the functionality of the tracking device, however, this section highlights the
highest level ones for simplicity. Table 9 below lists these functions, their input and
output variables, and a brief description of each.
Table 9 - Main Functions
Function Name
getGpsData()
Inputs
(void)
Outputs
gpsData
Description
Contains
interface
controls to
grab data from
GPS module.
Returns in
string array
format.
updateEngineStatus()
(void)
(void)
Calls a
sequence of
other functions
to determine if
the engine is
running based
on
accelerometer
data
56 | P a g e
packageData()
gpsData
accelerometerData
packagedData
sendData()
package
(void)
Combines GPS
and
accelerometer
data into
compact
package of
data to send
over RF
interface
Sends the
packaged data
over the RF
modem.
The input and output variables for the main functions and their data types are listed
in Table 10 below.
Table 10 – Main Functions: Input/ Output Variables
Variable Name
Type
Description
getGpsData()
gpsData
string array
Raw data received from GPS
module
packageData(gpsData, accelerometerData)
gpsData
string
Raw data received from GPS
module
accelerometerData
string
Raw data received from
accelerometer module
packagedData
string
sendData(package)
package
Packaged GPS and
accelerometer data to be sent
over RF modem
string
Packaged GPS and
accelerometer data to be sent
over RF modem
It should be noted that the list is only for those functions that are custom developed.
Several functions are used which are provided by the Arduino development library that
are not listed here, however, the most heavily used functions are included in Table 11
below. These are the serial interface functions, which will allow the microcontroller to
communicate with the GPS, accelerometer, and RF modem.
57 | P a g e
Table 11 - Arduino Serial Library: Functions Used
Function Name
Serial.begin()
Inputs
speed
Outputs
(void)
Serial.end()
(void)
(void)
Serial.println()
val
(void)
Description
Sets the data rate
according to the speed
in bits per second for
the serial interface
object run against
Disables serial
communication for
the serial interface
object run against
Prints the data in val
(any data type) to the
serial port followed by
a carriage return
The Arduino serial library allows for control of the individual serial interfaces of the
microcontroller. The ability to set the data rate and control the operations of each
interface is important for the design, since the GPS, accelerometer, and RF modem will
each be connected to its own serial interface. The input and output variables for the
Arduino serial functions and their data types are listed in Table 12 below.
Table 12 - Ardunio Serial Functions: Input/ Output Variables
Variable Name
Type
Description
long
Data rate, in bits per second
(baud) for serial data
transmission
[any data type]
Value to print
Serial.begin(speed)
speed
Serial.println(val)
val
6.2.4 Packaged Data Format
This section contains information regarding the formatting of the tracking data that is
sent out through the transmitting RF modem and sent back to the campus.
The TTS tracking device will send its data over the RF modems in the following format:
<TTSBEGIN:BusID;Latitude;Longitude;Time;Date;EngineStatus:TTSEND>
The italicized items above are the variables that will be sent.
58 | P a g e
Variable
BusID
Latitude
Longitude
Time
Date
EngineStatus
Format
4 digit hex value
signed float; 6 decimal
precision
signed float; 6 decimal
precision
HHmmss
ddMMyyyy
binary value (1=running,
0=off)
Example
000A
28.599449
-81.197594
195949
19032011
1
6.2.4.1 Notes
•
•
•
•
BusID, Time, and Date will always be the same length. If single digits are present,
they will be padded with 0’s.
Latitude and Longitude values will not be padded with 0’s. They may be
preceded with a negative sign operator, following standard GPS decimal format.
The Time and Date format letters shown above follow C# DateTime formatting
convention.
The Time and Date is in Coordinated Universal Time (UTC) standard and
therefore must be converted to local time if desired.
Example
The following is a valid TTS “packet” with correct formatting and sample data:
<TTSBEGIN:000A;28.599449;-81.197594;195949;19032011;1:TTSEND>
6.2.4.2 Bad Data
Occasionally, incorrect or corrupt data may be result from a poor GPS signal or a poor RF
communication link. In this case, the TTS Data Receiving system must discard that
specific packet. The following is a list of some common cases in which the data is easily
recognizable as a poor GPS signal:
•
•
Latitude and/or longitude values of “10000.000000”
Date value of “00002000”
The following are a few cases caused by a poor RF link:
•
•
•
•
Latitude and/or longitude values including letters, such as “-1.19698.LNMM”
Data packet missing key elements such as “;” separator or a “<” or “>” in the
header/tail, respectively
Data values that are specified to be a fixed length are received with an invalid
length
Carriage Return and Line Feed not received after packet
59 | P a g e
In the event that the TTS data is not received properly, regardless of the reason, the
entire packet must be considered invalid and discarded as there is no way to validate
specific sections of the data.
6.3 RF MODEM NETWORK
The RF modems are the infrastructure for which the tracking data is transmitted from
the shuttled buses back to the campus. They must be configured properly to allow for
the RF network to function as expected.
The overall architecture of the RF network consists of one receiving RF modem, multiple
or no repeater RF modems, and one or many transmitting RF modems. Each
transmitting RF modem (equipped on a tracking device) transmits the location data for
that specific device every half a second. Since the tracking devices are initially powered
on at different times, they transmit at slightly different moments which decreases
collisions at the receiving modem. Repeater RF modems may be placed at any desired
locations around the receiving modem to increase the range of the system. Any number
of repeaters may be utilized and the data can even hop from repeater to repeater until
it reaches the end node. The RF modems chosen are designed to keep track of all
packets passed in and out to ensure that no packets will be caught in an endless cycle
due to the repeater network. The Receiving RF Modem collects all the tracking data
received from all the tracking devices and sends it to the Data Collection & Processing
Server via a serial connection.
6.3.1 Parameter Configuration
To configure the parameters used to modify the behavior of the RF modems, the
command line based AT commands are be used. The RF modems are configured by
connecting them to a computer via a serial interface, opening a serial interface terminal
window, and issuing the AT commands to the modem. The detailed instructions for this
procedure are outlined in the User Manual section of this document.
6.4 DATA COLLECTION & PROCESSING SERVER
After the data is received by the RF modem at the campus, it is transferred via serial
connection to the Data Collection server. This server hosts the Digi X-CTU software,
which allows for management, diagnostics, and data retrieval of the RF modem devices.
Custom software is written to separate and parse the input data, strip down the
information, and convert it to a format useable in Google maps. This data is then
inputted, by the custom software, to a database holding all recent tracking data. This
allows for the web application code to access the data and present it to the user. A
logical view of the software for data collection and processing is shown in Figure 41
below.
60 | P a g e
from
Microcontroller Code
Location Data
Collection
and
Processing
Database
Bus Tracker
Web
Application
(Server-side)
Bus Tracker
Web
Application
(Client-side)
Figure 41 - Data Collection and Presentation
6.4.1 Software Configuration
The main purpose of the data collector and processor is to analyze the data from the
transmitters, clean it up, and write it to the database for the use of the web server. This
phase of the software design is what drives the rest of the design. It will be constantly
receiving updates from all of the receivers on the shuttles. This means that as long as
the shuttles are running and the transmitters are sending out the current coordinates,
the data collector and processor will be running as well. This means the code had to be
extremely efficient so it did not create a bottle neck for the system.
The initial phase of the data collector is where the packets were first acquired from the
receiver. Here the code stripped down the packet that was created by the
microcontroller code so it is able to utilize the data. Initially the packet contained three
things; the shuttle id, the current longitude coordinate and the current latitude
coordinate of the bus. The data processor then took this code and created an object
from it to keep all the shuttles information for later use.
The key to the processing phase is to ensure the data stays organized to prevent any
loss of important information. If the processor loses its organization then the data could
be crossed or deleted causing a ripple effect of problems all the down to the web server.
Also in this phase of the data collector, error checks were implemented.
Two important checks were tested to see if the packet is containing two valid
coordinates within the system's physical boundary, and also a check to ensure that both
the longitude and latitude coordinates were accounted for. The system boundary check
was to ensure that if a glitch in the GPS device occurs and passes an incorrect
coordinate to the data processor, that it doesn't make its way to the web server for it to
be printed on the map. If the packet is missing a coordinate due to a glitch, it too cannot
be passed further into the system. By doing so, it is subjecting the web server to an
61 | P a g e
error that it might not be able to handle. By checking for both of these errors before
they enter deeper into the system prevented unnecessary reads and writes to the
database as well as preventing incorrect shuttle updates to the web server.
The final phase of the data collection and processor is how it moves the usable data out
of the program and into the other sections of the software design. This is done by
storing the information into a database. The database then keeps the information
organized so it can be accessed by the web server. This means that the data processor
was consistently accessing the database to write to it.
The importance to having the data organized comes largely into play here. This is
because there was existing information in the database so essentially each time the data
processor writes to it, the data was updated. This means that the shuttle id is very
important because it is be the key the database uses to find the location of where the
most current coordinates of the bus is stored.
This software will be written in the C# programming language. This is due to the fact
that when compiling and exporting the C# code it will form into a simple executable file.
This executable file is then made a system task so when the computer is booted up, the
program will be executed.
The program was then placed on a computer that is attached to the transmitter. This is
a dedicated computer that is connected by the serial port to the transmitter that is
located atop of the building. The computer will be always on, but in the event of a
power failure, the system will be set up so that it will boot up when it regains power.
A list of the software to be used for the Data Acquisition / Database Server is shown
below in Table 13.
Table 13 - Data Acquisition / Database Server Software
System Item
Manufact
urer
Description
Part Number
Quote
Source
Qty
Operating
System
Microsoft
Windows XP
Professional
32-bit
E8504026
Buy.com
1
Database
Oracle
(open
source)
MySQL Community Server
(5.1.53) – Windows version
mysql.com
1
RF modem
managemen
t software
Digi
MySQL
Community
Edition
Database
X-CTU
v5.1.4.1 - Windows version
Digi
1
62 | P a g e
6.4.2 Block Diagrams
The architectural layout for the software side of the data collection and processing is
very simple. As data is received by the RF modem receiver from the RF transmitting
units on the buses, it sends the data to the data processing server, where the
information is parsed and stored into its respective locations in the database. Figure 42
below depicts this relationship.
RF Modem
Receiver
Data Processing
Server
Database
Figure 42 - Data Collection and Processing Block Diagram
6.4.3 UML Diagrams
The sequence for data collection and processing is shown in Figure 43 on the next page.
Initially, the raw packaged data is sent from the RF Modem receiver to the data
processing server. Here, the packaged data is parsed into output variables. Built-in
coordinates for the center point of the system will be used along with the radius to
generate a circular “system boundary”. After the data processing server splits up the
received data, it checks to verify that the new coordinates are within this system
boundary. If the latitude and longitude coordinates are valid, the server then stores the
parsed outputs into the database.
63 | P a g e
Figure 43 - Data Processing UML Sequence Diagram
6.4.4 Data/ Variable Descriptions
The data processing server handles the raw data collected from each bus. The only input
to the server isis the packaged data transmitted via the RF modems. This packaged data
isis processed and parsed into the respective outputs, including bus ID, latitude
coordinate, longitude coordinate, accelerometer data, and time. Three constant
variables, the latitudinal and longitudinal coordinates of the center of the system (the
radio tower) and the line of sight radius, are built in to the data processing
software. Table 14 below provides detailed descriptions for each of these variables.
64 | P a g e
Table 14 - Data Processing Variable Descriptions
Variable Name
Type
Description
Global
ucfdb
MySqlConnection
Connection to the database
sp
SerialPort
Serial Port connection
String Array
Data after Parsing
Bus.id
Int32
Identifier to the bus
Bus.latitude
Double
Latitude Coordinate of the
Local
input
data
b
Objects
Bus
Bus.longitude
Double
Longitude Coordinate of the
Bus
Bus.Time
String
String representation of the
time
Bus.Accelerometer
Boolean
Boolean representation of
the engine status
6.4.5 Function Descriptions
This section describes the functions used by the data processing unit to receive raw data
from the buses and store it into the database. Table 15 below lists these functions, their
input and output variables, and a brief description of each.
65 | P a g e
Table 15 - Data Processing Function Descriptions
Function Name
GetConnectionString()
Inputs
connName
String
Output
dbConnect()
(none)
MySqlConnection
getInput()
(none)
void
parseInput()
input
void
dbWrite()
b
void
Description
Retrieves
the
database connection
parameters from the
XML configuration file
Creates and returns
the connection to the
database
Retrieves the data
packets from the Serial
Port
Parses and Validates
the data packet
Writes the validated
data to the database
6.5 DATABASE
The MySQL database uses six tables to store all necessary information for the TTS.
Tables beare used to store the bus info, bus status, route info, route path, bus stop info,
and administration data. The database stores the data received from the RF modems,
via the data processing server. Web administrators also have the ability to modify data
in the database. They beare able to add/remove routes, add/remove bus stops, and set
the status (active/inactive) of the buses, routes, and bus stops. This management beis
done through a password-protected interface in the web application. The database itself
is also encrypted, and not available to the public for access.
6.5.1 Software Configuration
The “bus status” table bewas created to store the real-time bus information, including
columns for ID, latitudinal coordinates, longitudinal coordinates, accelerometer data,
and last time updated. Each time a new package is received from the RF modems, the
data processing server adds the data as a new entry into the bus status table. (Note: this
is the only table that can be modified by the data processing server) By including the last
updated time in this table, the web application is easily able to get the latest
coordinates of the bus, and updates the map accordingly. The “bus info” table contains
simply the ID number of the bus, its active status, and the ID number of the route it
services. The “route info” table contains information relating to the route itself,
including the ID number, name, color (for displaying on the map), and its active status.
The “route path” table contains the latitudinal and longitudinal coordinate of each step
66 | P a g e
along the path, as well as the step number and ID number of the route. The “bus stop
info” table contains all of the information pertaining to each bus stop, including an ID
number, name, latitude coordinate, longitude coordinate, active status, and the ID
number of the route it is part of.
It is important to note the mapping of the elements in these tables; the route ID stored
in the bus info, bus stop, and route path tables all correspond to the ID stored in the
route table. This architecture allows for clean organization, and easy manipulation for
the web application. (Note: the administrator has the ability to modify the data saved in
the bus info, route info, route path, and bus stop info tables)
In addition to storing information for the transit system, the database also contains data
for the administration users. This data includes a username, password, first and last
name, email address, and the date they were added to the system. The administrator is
required to login to a private interface, from which they have the ability to modify the
transit system data in the database mentioned above. Upon submitting the login form,
the username and password entered is verified against the valid data stored in the
database. This authentication process is made very simple by the relationship between
PHP (the server-side web application code) and MySQL (the database). It should be
noted that the password field in the administration users table is encrypted, such that it
cannot be accessed by anyone.
6.5.2 Block Diagrams
The overall structure of the MySQL database can be seen in Figure 44 on the next page.
The diagram shows the main tables storing the transit system information, and their
respective columns. (Note: a sixth table is used for storing the administration user
accounts, but is not shown in this diagram) It is important to note the key mapping
between tables in the diagram, depicted as a dotted line. This mapping indicates that
the data in one table corresponds to the data in another (in this case, the ID number of
the routes and buses).
67 | P a g e
Route
ID
color
name
isActive
Bus
Route Path
routeID
step
coordX
coordY
ID
isActive
routeID
Bus Stop
Bus Status
isActive
name
ID
coordX
routeID
coordY
busID
coordX
coordY
lastUpdatedTime
accelerometerData
Figure 44 - Database Block Diagram
6.5.3 Data/ Variable Descriptions
The bus ID number, latitudinal and longitudinal coordinates, accelerometer data, and
time are all sent from the data processing server to be stored in the database.
Additionally, data for the routes and bus stops, managed by the administrator, are
stored in the database. The user info for all administrators is also stored in the
database. The web application accesses this data from the database to update the map
in real-time. Table 16 below provides detailed descriptions for each of these variables.
Table 16 - Database Variable Descriptions
Variable Name
Type
Description
ID
Name
Color
int
varchar
varchar
isActive
boolean
Route Path
routeID
ID number of the route
Name of the route
The hexadecimal code
for the color of the route
Specifies if the route is
active or not
int
Route
ID number of the route
68 | P a g e
Variable Name
Type
Description
(maps to ID in route
table)
The step number of the
path coordinates
Latitude coordinate of
the step
Step
int
coordX
varchar
coordY
varchar
Longitude coordinate of
the step
ID
routeID
int
int
ID number of the bus
ID number of the route
(maps to ID in route
table)
coordX
varchar
Most recent latitude
coordinate of the bus
coordY
varchar
Most recent longitude
coordinate of the bus
accelerometerData
varchar
Most recent
accelerometer data sent
from the bus
lastUpdated
varchar
Time that the bus data
was last updated
isActive
boolean
Specifies if the bus is
active or not
Bus Stop
ID
int
ID number of the bus
stop
routeID
int
ID number of the route
(maps to ID in route
table)
name
coordX
varchar
varchar
Name of the bus stop
Latitude coordinate of
the bus stop
coordY
varchar
Longitude coordinate of
the bus stop
isActive
boolean
Specifies if the bus stop
is active or not
Administration
ID
int
ID number of the
administrator
Username
varchar
Username of the
administrator
Bus
69 | P a g e
Variable Name
Type
Description
Password
varchar
Password of the
administrator
firstName
varchar
First name of the
administrator
lastName
varchar
Last name of the
administrator
Email
varchar
Email address of the
administrator
dateAdded
varchar
Timestamp of the time
the administrator was
added
6.5.4 Function Descriptions
This section describes the functions used by the database to send and receive
data. Table 17 below lists these functions, their input and output variables, and a brief
description of each.
Table 17 - Database Function Descriptions
Function Name
INSERT
Inputs
(varies)
Outputs
(void)
DELETE
(varies)
(void)
SELECT
(varies)
(varies)
UPDATE
(varies)
(void)
Description
Inserts a new row into
the database
Deletes specified rows
from the database
Gets data from a
specified table in the
database
Updates specified
rows in the database
6.6 WEB APPLICATION
The user interface for the TTS is strictly web-based. The web application connects
directly to the database to access the live GPS data that is sent from the RF modems.
The coordinates are used to superimpose a unique icon for each shuttle onto existing
map technology. In addition to these icons, the map also displays each bus route in
color-coded fashion. While the markers for each shuttle update in real time (as new
data is received), velocity information is utilized to predict and simulate movement
between each new coordinate transmission. Following this procedure, the movement of
the buses appears “fluid” and “steady” to the user. While the majority of the visible
70 | P a g e
screen in the application is dominated by the live action map, a panel on the side offers
the user options to “filter” through the routes; filter, meaning they can toggle the
visibility of each route on/off individually.
A second use case is implemented for administration. Secured by password protection,
this interface allows an administrator to add, edit, or remove shuttle/route information.
The ability to activate/deactivate individual buses is also implemented. Additional
information may be added to this administration interface later on, such as the ability to
view logged event data for each shuttle.
6.6.1 Software Configuration
The TTS web application software provides the user with a real-time view of the UCF
shuttle transit system. The interface presents a map of the local UCF area, with each
route highlighted in a unique color. The user has the option to toggle the visibility of
each of these routes on/off, through an options panel on the side of the screen. The
options panel lists the routes, by name, along with their corresponding color. The user
may simply click on a listed route, to toggle its visibility. On first load of the web
application, all active routes display on the tracking map. When a user first clicks a route
in the options panel, the selected route will display, and all other routes will be hidden.
After a route is selected, a “reset” option will appear, which resets the display to the
initial condition, in which all routes are shown. Only active routes display during any
given time of the day. On the map, each active bus appears with its own icon based on
the most recent coordinates sent from the RF modem. As the bus moves, the icon
updates and moves in real-time. To compensate for the lag between packages received,
the velocity and acceleration of the bus is calculated, to predict movement between
coordinates. This information is also used to assist with estimating arrival time, which is
also displayed on the TTS web application interface.
The other side of the web application software features the administration options. This
interface is only available to administrators through a password-protected login. The
administrators have the ability to modify most of the data in the system, for
maintenance and other purposes. Upon successful authentication, the administrator is
presented with a panel of options allowing them to add/remove routes, add/remove
bus stops, set/update a route’s path, set the active status of a route, set the active
status of a bus stop, and set the active status of a bus. Any modifications made by the
administrator updates the data in the database, and the changes automatically reflect in
the main user’s interface for the TTS. The administration interface also provides the
functionality to manage the list of administrators, by adding, editing, or removing user
accounts.
A list of the software to be used for the Web Server is shown below in Table 18.
71 | P a g e
Table 18 - Web Server Software
System
Item
Manufacturer
Description
Part Number
Qty
Server
Operating
System
HTTP
Server
Canonical (open
source)
Ubuntu Server Linux
10.04 64-bit
N/A
1
The Apache
Software
Foundation
(open source)
The PGP Group
(open source)
Apache HTTP Web Server
(“httpd”)
Apache HTTP Server 2.2.17
– linux version
1
PHP web scripting
language runtime
PHP 5.3.3 – linux version
1
phpMyAdmin
devel team
(open source)
MySQL management tool
phpMyAdmin 3.3.8.1 –
linux version
1
PHP
runtime
component
s
phpMyAdm
in
6.6.2 UML Diagrams
The web application consists of four main classes: Transit System, Route, Bus, and Bus
Stop. The class diagram for the web application can be seen in Figure 45 on the next
page. The Transit System contains all of the routes, as inputted by the administrator.
The Route object contains all of the bus stops along its path, as well as each of the buses
that service it. The administrator has the ability to set each of the routes, bus stops, and
buses active or inactive.
72 | P a g e
Figure 45 - Web Application UML Class Diagram
73 | P a g e
6.6.3 Data/ Variable Descriptions
The web application extracts live data from the database. The data taken from the
database includes the ID of the bus, the latitudinal and longitudinal coordinates of
each bus, the accelerometer data from each bus, and the time that the data was last
updated. This data is used to update each Bus object. Each time the Bus object is
updated, a new velocity and acceleration is calculated. The Route, Bus, and Bus Stop
objects all contain their own variable that denotes whether or not the respective object
is active. The path for each route consists of a series of latitudinal and longitudinal
coordinates. To display each route in a different color, each route object stores the
hexadecimal code for its respective color. Table 19 below provides detailed descriptions
for each of these variables.
Table 19 - Web Application Variable Descriptions
Variable Name
Type
Description
Transit System
name
Route
string
Name of the system
ID
name
path
int
string
double[]
color
string
isActive
boolean
ID number of the route
Name of the route
The path of the route,
stored as a series of
coordinates
The hexadecimal code
for the color of the route
Specifies if the route is
active or not
Bus
ID
coordX
int
double
coordY
double
velocity
double
acceleration
double
accelerometerData
string
lastUpdated
string
isActive
boolean
ID number of the bus
Most recent latitude
coordinate of the bus
Most recent longitude
coordinate of the bus
Most recent velocity of
the bus
Most recent acceleration
of the bus
Most recent
accelerometer data sent
from the bus
Time that the bus data
was last updated
Specifies if the bus is
active or not
74 | P a g e
Variable Name
Bus Stop
ID
Type
Description
int
ID number of the bus
stop
Name of the bus stop
Latitude coordinate of
the bus stop
Longitude coordinate of
the bus stop
Specifies if the bus stop is
active or not
name
coordX
string
double
coordY
double
isActive
boolean
6.6.4 Function Descriptions
This section describes the functions used by the web application to update bus
information, as well as the administrative functions to manage the routes, buses, and
bus stops. Table 20 below lists these functions, their input and output variables, and a
brief description of each.
Table 20 - Web Application Function Descriptions
Function Name
Transit System
addRoute()
Inputs
Outputs
Description
name, path, color, (void)
isActive
ID
(void)
Adds a new route to
the system
Removes a route from
the system
removeBusStop()
name,
coordX, (void)
coordY, isActive
ID
(void)
setActive()
isActive
(void)
setPath()
path
(void)
Bus Stop
setActive()
Adds a new bus stop
to the route
Removes a bus stop
from the route
Sets the route to
active or inactive
Updates the path of
the route
isActive
(void)
Bus
setActive()
Sets the bus stop to
active or inactive
isActive
(void)
Sets the bus to active
or inactive
Updates the bus data
with the most recent
information
removeRoute()
Route
addBusStop()
update()
ID, coordX, coordY, (void)
accelerometerData,
time, isActive
75 | P a g e
6.7 CLIENT WORKSTATION
Developing the client interface as a web-based application allows a user to utilize
his/her own workstation for accessing the Transit Tracking System. Virtually all
desktop/laptop computers with a web browser are able to access the TTS web
application. The website is hosted on a server at the UCF campus, which is available by
accessing its designated web domain. The user simply enters the domain URL (Uniform
Resource Locator) into their web browser, and they are able to view the real-time status
of the UCF shuttle transit system at their convenience. The web application, as
previously mentioned, features wide-scale compatibility and caters to the largest
possible user population. As long as their workstation meets the minimum required
software requirements, any client is able to have access to the TTS.
6.7.1 Minimum Required Software Configuration
Since the TTS is designed to be the most compatible for all users, the software required
for access is very minimal. Given today’s standard, nearly every personal desktop or
laptop computer should already have the required software components to browse the
TTS user interface. While the system may function on other configurations, the TTS was
only be tested and developed for Windows- or Mac-based computers. The
recommended minimum software configurations are listed below.
Supported Operating Systems
•
•
•
•
Windows XP
Windows Vista
Windows 7
Mac OS X Snow Leopard
Supported Web Browsers
•
•
•
•
Windows Internet Explorer 6 or newer
Mozilla Firefox 2 or newer
Google Chrome
Apple Safari
Additional Required Software
•
Adobe Flash Player 9 or newer
76 | P a g e
6.7.2 Final Web Application Interface
Upon accessing the web application through a web browser on their workstation, the
client is presented with the full Transit Tracking System interface. Figure 46 below
shows a screenshot of how the application appears on the client’s workstation.
Figure 46 - Interface of the TTS Web Application on Client Workstation
In this screenshot, the gold route is shown circling the campus along Gemini Boulevard.
The list of active routes is shown in the left panel, displaying the route number, route
name, and their unique color. In this screenshot, all routes besides Pegasus Landing and
the Gold Route appear dim, while the two mentioned do not. This indicates that the
user has clicked on the Pegasus Landing and Gold Route routes, to filter the
display and only show these routes on the map. The reset button is also present at the
top of the panel; clicking the reset button will toggle all of the routes to display on the
map. The balloon-shaped icon in the middle of the map indicates a bus in service. The
remainder of the functionality of the map is built-in to the software provided by Google.
The user can zoom in/out, scroll in all directions, and toggle the display (map, satellite,
or hybrid). The user also has some additional functionality not shown on this
screenshot, such as clicking on a bus or bus stop to view more information about it.
77 | P a g e
7
Design Summary
The Transit Tracking System design is comprised of a collection of intricate subsystems.
A monitoring module was designed for each shuttle unit. Each monitoring module
consists of four main components a GPS, a microcontroller, an accelerometer, and a RF
transceiver with antenna. The bus acts as the modules power supply and interfaces to
the shuttle via the cigarette lighter adapter. The GPS transfers its collected data to the
microcontroller through one of the four serial ports available on it. An additional feature
for the module that was added is an accelerometer that enables the knowledge of
whether or not a bus is idle by detection of vibrations from the shuttles engine. The
microcontroller contains embedded software to handle all the raw data that it receives.
This software packages the data together, including the bus ID number, the latitudinal
and longitudinal coordinates, the accelerometer data, and the current time. Packaging
these items together allows for a simpler transmission. The data is then transferred
from the microcontroller to the RF transceiver, which also interfaces to one of the four
serial ports available.
The data collection and processing system design includes two receivers, one
transceiver, and a web base station. One of the receivers has a high gain antenna that is
connected to the university’s radio tower. The data collected from the receiver
interfaces to another transceiver nearby via serial port. Both transceiver and receiver
are on the radio tower, requiring the need to be weatherproof. The transceiver on the
tower then relays the data collected to one last receiver on the ground interfaced with
the web server. This system takes in the packaged data, and unpacks the contents. After
the data is parsed into its respective parts, the processing server adds the information
to the database. The web application for the Transit Tracking System connects to this
database autonomously, to update the position of each bus in real-time. A map of the
UCF area, extending out to the edge of the system boundary, displays on the webpage
with a live look at the current status of each route and the buses that service them. Built
on a framework of multiple client-side and server-side programming languages, the web
application provides its user with a clear easy-to-use interface for monitoring the status
of each shuttle in the transit system. Clients have the ability to customize their own
personal view, by enabling or disabling the view of each route, via a collapsible panel on
the side of the screen. The application also provides an estimated arrival time for the
buses at each stop. Finally, the web application design supports an additional interface,
with limited access to administrators only, which allows for maintenance and
modification of the TTS system data. The diagram in Figure 47 below provides an
overview of the association between these subsystems.
78 | P a g e
Arduino Code
GPS
Microcontroller
RF Modem
RF
RF Modem
RF Modem
Accelerometer
RF Modem
Custom Web
Application
Approved Web
Browser
Apache
Any OS
Ubuntu
Client
Workstation
TCP/IP
Web Server
Custom
DB
Custom
SW
Serial
MySQL
Windows
TCP/IP
Data Processing /
Database Server
Figure 47 - Overall Hardware & Software Block Diagram for the TTS
8
Build Plan
8.1 DEVELOPMENT
During development phases of the project several products were used as tools for
prototyping. By building prototype systems the detailed design work was accomplished
much more cost effective and in much less time. For example, creating custom PCBs
each time a connection needed to be fixed would have been incredibly expensive.
Additionally, using the proper tools for software development led to greatly decreased
coding and debugging time.
79 | P a g e
8.1.1 Hardware Development
The main component which is key to the hardware development plan was the
microcontroller development board. This board is designed by Arduino, the same
company which produces the software development libraries for the chip. The board,
which can be seen in Figure 48 below, consists of the microcontroller, easy access to the
I/O pins, and a USB port for programming. This allowed the GPS, accelerometer, and RF
modem to be easily connected and tested during the development stages. Once it was
ensured that the components were interacting as expected with the microcontroller,
the circuit design was updated to reflect the connections of the development board as
well as any minor tweaks that were necessary for the design to function.
Figure 48 - Arduino Mega 2560 (with permission from sparkfun.com)
The accelerometer breakout board can be seen in Figure 49 below. The breakout board
contains the accelerometer and required electrical components already included on the
board, as well as the pin-outs for easy access.
Figure 49 - Accelerometer Breakout Board (with permission from sparkfun.com)
80 | P a g e
The GPS shield in Figure 50 below was used for easy connection of the GPS to the
microcontroller board. It sits on top of the Arduino development board, and provides a
connection which supports the GPS module.
Figure 50 - GPS Shield (with permission from sparkfun.com)
One RF modem for the tracking device, the stripped down version for custom designs,
was purchased and prototyped with the Arduino development board. The RF modem
breakout board seen in Figure 51 and Figure 52 on the next page allowed for accurate
mapping of the RF modem pins to the microcontroller board pins. Two receiving RF
modems, the fully enclosed RS-232 version, were provided by the University of Central
Florida as they are already owned. All RF modems combined allowed accurate
development and debugging of the RF communication as well as the details of sending
and receiving the tracking data via the custom TTS software.
Figure 51 - RF Modem Breakout Board Figure 52 - Breakout Board Connected to RF
(with permission from sparkfun.com)
Modem (with permission from sparkfun.com)
81 | P a g e
8.1.2 Software Development
For the software development there are several development environments that were
used, one for each different software piece that was created. The microcontroller code
will utilize the Arduino Development Environment, seen below in Figure 53. This allows
for access to all Arduino library functions and basic functionality for compiling code,
running code, and downloading code to the chip.
Figure 53 - Arduino IDE (Used with permission from Arduino)
Data collection and processing was be written in C# code and was developed in
Microsoft Visual Studio C# Express Edition. Visual Studio, seen in Figure 54 below,
provides a wide array of helpful development tools which allow for automated
organization of classes, variables, and functions.
In addition, the code completion feature saves countless hours by suggesting the
function or data you were attempting to refer to on the fly while you code. Perhaps the
most powerful feature of Visual Studio is the robust debugger, which allows for very
accurate step through of the code and a real time view of the variables as you debug.
This software tool has greatly enhance the coding process.
82 | P a g e
Figure 54 - Visual Studio 2010 (with permission from Microsoft)
Web development was written and developed using the Notepad++ text editor. While
there are many WYSIWIG (What you see is what you get) web development editors
available, the TTS team found it the best choice to develop the web components in code
only due to sometimes apparent negative rendering issues of the WYSWIG editors. The
Notepad++ text editor allows for code highlightin for all web languages used in the TTS
system including CSS, JavaScript, HTML, and PHP. Additionally, this choice saved a large
amount of cost which would have occurred with the purchase of a commercial product.
A comprehensive list of the hardware which was procured for development purposes
can be seen in Table 21 below.
Table 21 - Hardware Development Part List
System Item
Manufacturer
Description
Part Number
Qty
RF Modem
(Client)
Digi
9XTend - 1W transceiver, w/RPSMA
connector, 115000 bps, industrial
XT09-PK-RA
2
GPS
USGlobalSat
20 Channel EM-406A SiRF III
Receiver with Antenna
EM-406A GPS
1
83 | P a g e
System Item
Manufacturer
Description
Part Number
Qty
GPS Shield
SparkFun
GPS Shield
GPS-09817
1
Dev board /
shield headers
SparkFun
Arduino Stackable Header - 6 Pin
PRT-09280
5
Dev board /
shield headers
SparkFun
Arduino Stackable Header - 8 Pin
PRT-09279
5
Accelerometer
Sparkfun/Anal
og Devices
Dual Axis Accelerometer Breakout
Board - ADXL213AE +/-1.2g
SEN-00843
1
Microcontrolle
r Dev board
RF Modem /
dev board
interface
Arduino
Arduino Mega 2560
1
SparkFun
DigiXTend Modem Breakout
Arduino Mega
2560
BOB-09596
Development
workstation
(Manufacturer Development workstation computer
is irrelevant)
1
(Provided by
team)
1
A comprehensive list of the software which was procured for development purposes can
be seen in Table 22Table 21 below.
Table 22 - Software Development Part List
System Item
Manufacturer
Description
Part Number
Qty
Microcontro
ller code
developmen
t software
Data
collection
and
processing
IDE
Web Design
Code Editor
Arduino
Arduino Development
Environment
Arduino 0021 - Windows
1
Microsoft
Microsoft Visual Studio
C++ Express Edition
Visual C++ Express Edition
2010
1
Notepad++
Team (open
source)
Oracle (open
source)
Notepad++
Notepad++ 5.4.5
1
MySQL Community
Edition Database
MySQL Community Server
(5.1.53) – Windows version
1
Database
84 | P a g e
System Item
Manufacturer
Description
Part Number
Qty
RF modem
managemen
t software
PHP runtime
components
Digi
X-CTU
v5.1.4.1 - Windows version
1
The PGP
Group (open
source)
phpMyAdmin
devel team
(open source)
Oracle
PHP web scripting
language runtime
PHP 5.3.3 – linux version
1
MySQL management
tool
phpMyAdmin 3.3.8.1 –
linux version
1
Java Runtime
Environment (JRE)
JRE SE 6
1
phpMyAdmi
n
Managed
code
runtime
environmen
t
8.2 PRODUCTION
The tracking device is the central point of concern in regards to production due to the
fact that it is the only component in the design that needs to be replicated to add
shuttle buses to the system. Each subsequent bus that is added to the system requires
one additional mobile tracking device to be created. The tracking device features a
custom printed circuit board (PCB) to allow for a compact design that encompasses all
the aspects of the design. The GPS and accelerometer are glued and soldered,
respectively, to the PCB board. A compact version of the RF modem intended for
custom solutions is attached to the PCB board via the rows of pins on the modem. A
custom power supply is designed on the board, attached to an external cigarette lighter
and plugged into the shuttle bus. The entire tracking device is then placed in an
enclosure, which allows for a clean product and provided protection of the components.
All components were purchased and assembled by the team for the initial few mobile
tracking devices. If UCF decides to adapt the design to allow for tracking of all shuttle
buses, it would be the most cost effective and reliable solution to allow the TTS team to
continue the production efforts on the software and PCB while having the tracking
device enclosure and antenna installations conducted by UCF personnel or outsourced.
8.3 VENDORS
The majority of the parts for the project were purchased online. The vendors chosen are
listed in the part list in the Budget and Financing section. These vendors were chosen
based on cost, reliability, and quantity of stock on a regular basis. While the listed
85 | P a g e
vendors were the ideal choices, the most important fact is that the parts were selected
to exactly match the part numbers listed.
Most of the development hardware parts listed were purchased from the SparkFun
company. This company specializes in hobbyist, enthusiast, and student embedded
hardware design projects. Ideal to our situation, the site offers a plethora of resources
and unique prototype based products which greatly aided in the development phase of
the project. For the production, bus-ready tracking devices, large electronics suppliers
such as DigiKey were used. Since small electronic components are usually in high stock
and sold very often from these types of companies, reliability is typically high and costs
are typically low.
Almost all of the software used in the system is free of charge in either open or closedsourced versions. Most of the software, therefore, was obtained directly from the
developer companies. Use of free software obviously allows for huge cost savings in the
entire system, but also reduces time spent managing cumbersome licenses.
9
Test Plan
In order to build and manage a quality system, the design went through a great amount
of rigorous testing. This testing was very thorough to ensure that at the time the system
was delivered, it was virtually defect free. For the transit tracking system especially,
testing was a crucial part of the design of both the hardware and software due to the
amount of clients that are utilizing the system. These students are depending heavily on
not only the reliability of the tracking system, but also the accuracy and response time
of the system. If the hardware or software was ridden with defects, it would result in a
high number of risks for the users who will depend daily on the tracking of the shuttles.
To ensure the highest quality system is developed, each part of the system went
through a vast number of test cases.
9.1 SOFTWARE TESTING
The software is what drives the transit tracking system. It essentially picks up where the
hardware leaves off. Once the hardware transmits the location of the bus to the tower,
the software begins to interpret the data. From there the software does everything
from unpacking the data to transmitting it to the user. The software testing fell into four
areas; the data acquisition, the database that stores the data, the web server and
website, and the assembly language used to program the hardware. Each section was
tested extensively to ensure that the system runs at maximum efficiency.
86 | P a g e
9.1.1 Testing Overview
Testing the software was done at different stages of the design. Each type of software
was tested differently based on their need in the system. Each underwent a unique set
of tests under different conditions in the hopes to expose any defects. Many of the tests
used sample data under the assumption of how it will be passed into the code. To
simulate the software being put under a heavy load, an arbitrarily large amount of data
was consistently fed through the program. This ensured that not only the code was able
to handle a single situation, but able to maintain that efficiency regardless of the sample
size and the amount of time it takes to process the information. The tests were primarily
was broken down into two sections; the test cases for individual sections of the code,
and the final unit test. The unit test were used to ensure that each individual section of
code worked as expected collectively as well as able to handle errors being fed through
the entire unit.
9.1.1.1 Testing Environment
Due to the high amount of coding that was done for this design, each section code was
tested individually first to ensure that it works correctly before adding it to the entire
system. This ensures that the location of the defect is easily pinpointed and resolved.
Due to the nature of the design of the system, initially when testing the code for each
section, the testing environment consisted of simulated data that was passed through
the code. This is because the coding needed to begin before the hardware portion of the
design was complete. Each section of code had to pass a high amount of data efficiently
with little to no errors to the system. This simulated the working conditions the
software had to operate in.
9.1.1.2 Passing Criteria
To ensure efficient and quality testing, a passing criterion was determined before
testing began. This determinec at what point the area of testing qualifies as good
enough for the system. For the Transit Tracking System, in order for a section of
software to pass, it had to pass the data through correctly without any system halting
errors. This meant that all of the expected outputs should be received in a reasonable
amount of time.
Extreme delays in the software were viewed as a defect. This is due to the fact that the
entire system itself needed to have the best response time possible for it to be
considered efficient. Also, even if the system does not have a fatal crash or throw
warnings, the output data was also be closely examined. This was to ensure that not
only is the data able to passed through the software successfully, but it also was the
correct data being outputted.
87 | P a g e
When an error or defect was found, a guideline was set on how to approach fixing it. For
the Transit Tracking System, when an error was found during testing, it was logged.
Unless the defect is a fatal error that causes the system to crash, testing continued until
a stopping point was reached. Then once the test is stopped, the code was examined
and the list of non-fatal errors collected was attempted to be corrected. If the test
results in a crash due to an error, the test ended, and the focus was shifted to correcting
that defect. Testing in this form was in the hopes the resolving the bigger issues will in
turn also correct the smaller problems as well.
9.1.2 Data Acquisition
Data acquisition is simply how the data is accepted by the software, and unpacked for
usage. This is a very critical section of the software due to the fact that this is where all
the data originates. If this software contains errors, it could be fatal for the entire
system. This section of code was thoroughly tested with the cases listed in tables below.
The data acquisition stage is broken into two parts; the actual receiving of the packets,
and the processing of the packets.
9.1.2.1 Test Cases
One of the most important cases that were tested is if the software is able to retrieve
the data properly without throwing any errors. This test is important because the code
was receiving a consistently high amount of data at one time. If this portion is not
properly tested it could lead to a bottle neck in the system where its affects will be felt
throughout the rest of the design. This test was done with the inputs assumed to be
error-free and delay-free. The sample with ensure that the main functionality of the
code will be tested.
Test Objective 1
Test Objective #1
Test Description
Test Conditions
Expected Results
Receiving the Error-free Data
A simulated sample data must be received and accepted by the code
in order for it to be passed on to the unpacking stage. This will
ensure there are no defects in the receiving stage of the Data
Acquisition section.
The code will be fed an arbitrarily large number of packets to
simulate standard conditions.
The code should receive the large amount of records without losing
any data or throwing any errors. The output of the test is all of the
packets being inputted.
88 | P a g e
In order to ensure that the receiving portion of the code is working properly, it needed
to be tested for real-life scenarios. A particular real-life scenario would be if there are
only a few buses running, so the data is being received in chunks, separated by random
delays. This test was to ensure that the code is able to go from being used at a very high
load, down to no load, and back up to a high load without having any software glitches.
Test Objective 2
Test Objective #2
Test Description
Test Conditions
Expected Results
Receiving the Data with delays
A simulated sample data with delays must be received and accepted
by the code in order for it to be passed on to the unpacking stage.
This will ensure there are no defects in the receiving stage of the
Data Acquisition section.
The code will be fed an arbitrarily large number of packets with
random delays to simulate standard conditions.
The code should receive the large amount of records with delays
without losing any data or throwing any errors. The output of the
test is all of the packets being inputted.
The next step in the data acquisition software is the process of unpacking the data that
is being received from the transmitters. This needs to be tested to ensure that not only
are the packets being stripped down properly, but it also needs to take into account the
system under a heavy load of packets. This heavy load on the system will be tested by
using an arbitrarily large amount of simulated packets being fed through the unpacking
portion of the code. To ensure that the system is working as expected, the sample input
is only going to include packets that are error-free. This is done to eliminate the other
factors affecting the functionality that will be covered in later tests.
Test Objective 3
Test Objective #3 Unpacking Error-Free Data
Test Description A simulated sample of data will be passed through the code. This
data will be holding the longitude and latitude locations of a certain
shuttle. This data must be unpacked and sorted to be used in other
sections of code.
Test Conditions
The code will be fed an arbitrarily large number of packets to
simulate standard conditions.
Expected Results The code should unpack the coordinates and group it the with bus
number provided without any errors, so it can be passed on to other
sections of code. The output of the test is a pair of valid coordinates
bounded with its corresponding shuttle id.
89 | P a g e
This test case was covering the scenario that the transmitter returns a longitude or
latitude coordinate outside the predetermined range in which the buses are assumed to
be traveling. This procedure takes place in the unpacking stage of the data acquisition
software
The purpose of this is to ensure that these coordinates do not get passed through to the
database. Without this error check, this coordinate would take the bus completely off
the map that is displayed to the user, and not return it until the shuttle's next
coordinate is received.
Test Objective 4
Test Objective #4 Unpacking with Incorrect Coordinates
Test Description A simulated sample of data will be passed through the code. This
data will be holding the longitude and latitude locations of a certain
shuttle. However, this data will also include coordinates outside of
the predetermined area designated for the buses.
Test Conditions
The code will be fed an arbitrarily large number of packets with
random errors to simulate standard conditions.
Expected Results The code should unpack the coordinates, filter out the incorrect
ones and group the rest with bus number provided without any
errors, allowing it to be passed along to be used in other areas. The
output of the test is a pair of valid coordinates bounded with its
corresponding shuttle id.
This next case will be testing to ensure the unpacking phase will be able to detect the
internal packet error of having one of the coordinates be empty. This issue can arise
when the GPS returns the current coordinates of the bus. This error would still be
packed fine by the assembler and transmitted and received without throwing any
errors. However, once the packet reaches the unpacking stage, the error needs to be
detected and the entire package must be removed from the system. If this problem is
not fixed in this stage of the code, then the blank coordinate will still be turned into an
object and written to the database. Only when the data reaches the web server is when
the problem will be presented, but by then it will be too late, and the shuttle will
incorrectly be updated or an error will be thrown.
Test Objective 5
Test Objective #5 Unpacking with blank coordinates
Test Description A simulated sample of data will be passed through the code. This
data will only be holding either the longitude coordinate or the
latitude coordinate that will represent the location of a certain
shuttle.
Test Conditions
The code will be fed an arbitrarily large number of packets with a
90 | P a g e
Expected Results
random amount missing a coordinate.
The packets will be unpacked, but when the missing coordinate is
detected, the packet will be tossed out. The output of the test is a
pair of valid coordinates bounded with its corresponding shuttle id.
The final stage of the data acquisition software is where the stripped packet's data now
must be used to build a shuttle object in the code. In order to build this object, three
pieces of data must be known; the shuttle id, the longitude coordinate and the latitude
coordinate. These pieces of data will then be grouped together in an object so it can be
used effectively. The creation of this object is important because this is the final stage of
the data acquisition software, and now this data must be used to write to the database
to be passed on through the system.
Test Objective 6
Test Objective #6 Building the coordinates into an object
Test Description A simulated sample of data will be passed through the code. The
data will contain a pair of coordinates that are matched up with the
unique shuttle identifier.
Test Conditions
The code will be fed an arbitrarily large number of valid sample data.
Expected Results The sample data should be packed together into an object so it can
be passed through the rest of the code. The output of the test is the
created objects of all the packets.
9.1.2.2 Unit Test
Once each section of the data acquisition software is tested individually, they must be
tested as one entire system. This type of testing is a form of regression testing. This is
done to ensure that once the parts are all added together, the functionality of each
section is maintained. If an error is thrown, a section of code will be removed and the
tests will be run again. This process will continue until the desired output is received.
This procedure will be able to pinpoint relatively quickly what area of code is causing the
issue. This testing was done by following the test cases listed below.
To ensure that the entire data acquisition software is working as expected, it must be
tested all together. This first test case is used to expose any coding errors within the
software. This test will include an arbitrarily large sample of data that is error-free.
Error-free is defined as all of the data entering the software is entirely valid for the
system design. This means that all of the packets are complete and not missing any
information such as an unknown coordinate or a coordinate that lies outside the range
of the system. The reason behind the error-free data is to ensure that the main
91 | P a g e
functionality of the system is working. This means the entire sample of data being
inputted must be accounted for in the output.
Test Objective 1
Test Objective #1 Error Free Data - Full System test
Test Description A simulated error free sample of data will be passed through the
code. The data will be accepted by the software, unpacked, and
grouped with the corresponding bus number.
Test Conditions
The code will be fed an arbitrarily large number of error-free packets
Expected Results The code should receive the packets, unpack the coordinates, and
group them with bus number provided without any errors. The
output of the test is the created objects of all the packets.
As tested previously, the entire system must be able to accept and process packets with
delays. These delays could be caused by a number of things, for example, if the system
is just booting up, the packets will be received less consistently because there will be
less buses in transit. This can also be said for when the shuttles are nearing the end of
their routes for the night. Since each bus has a unique route, they will all be finishing at
different times causing there to be a drop in the rate of the packets being received. This
must be tested for the entire unit to ensure this scenario does not crash the system in
any area.
Test Objective 2
Test Objective #2 Error Free Data - Full System test with delays
Test Description A simulated error free sample of data that will include delays that
will be passed through the code. The data will be accepted by the
software, unpacked, and grouped with the corresponding bus
number.
Test Conditions
The code will be fed an arbitrarily large number of error-free packets
with delays.
Expected Results The code should receive the packets, unpack the coordinates, and
group them with bus number provided without any errors. The
output of the test is the created objects of all the packets.
As tested previously, the entire system must be able to accept and process packets that
contain coordinates that lie outside the system's boundaries. The main focus of these
tests is to ensure that not only is the coordinate error detected, but also, that the entire
packet is thrown away and not made into an object. This test differs from the individual
test case because it will show how the entire unit will react when this error is exposed
and removed.
92 | P a g e
Test Objective 3
Test Objective #3 Importing data with coordinates that lie outside the range of the
system
Test Description A simulated sample of data will be fed through the code. This data
will be checked to ensure that the coordinates lie within the systems
boundaries. If the coordinates lie beyond the limit, it will be tossed
out of the system.
Test Conditions
The software will be fed an arbitrarily large number of packets. A
random amount of packets will contain a longitude or latitude
coordinate that will lie outside of the system’s physical boundary.
Expected Results The code should check each coordinate in the packet to ensure that
it lies within the system. If the coordinate lies outside the system,
the entire packet should be tossed. If they packet is correct, it
should be retained. The output of the test is the created objects of
all the packets that contain valid coordinates.
As tested previously, the entire system must be able to accept and interpret packets
that contain an empty coordinate slot. The purpose of this case is to make sure that
these invalid packets do not go beyond the data processing phase. Based on the design
of the software of this phase, this issue will be detected in the unpacking code and from
there the packet will be disposed so it does not be made into an object and put into the
database. Testing this case on the entire unit will ensure that this problem will be
handled without causing any errors to other parts of the software.
Test Objective 4
Test Objective #4 Full System test with empty coordinate slots
Test Description A simulated sample of data that will include built-in errors that will
be passed through the code. The data will be accepted by the
software, unpacked, and grouped with the corresponding bus
number.
Test Conditions
The code will be fed an arbitrarily large number of packets with
known errors built in.
Expected Results The code should receive the packets, unpack the coordinates, and
group them with bus number provided without any errors. The
output of the test is the created objects of all the packets that
contain valid coordinates.
93 | P a g e
The final test of the entire data acquisition software is one of the most important. This
case will include a large data file that will contain all of the error previously tested. The
sample will include error-free packets, delayed packets, out of range coordinate
packets, and empty coordinate packets. Making this massive error-ridden test sample
will be the closest simulated scenario that can be used to mimic what the system will
realistically experience. The passing of this test will assume that the data acquisition
software will be ready to be incorporated with the other phases of the software design.
Test Objective 5
Test Objective #5 Importing data with all of the above previous errors together.
Test Description The entire data acquisition software will be fed a sample of data
that will contain all of the errors that the system could face during
the start operating procedure.
Test Conditions
A sample collection of packets will be fed into the start of the data
acquisition software. The set of data will include a random amount
of data that contains different errors. These errors include, delays in
the packet receiving, packets missing coordinates, and packets
containing coordinates that lie outside of the system boundary.
Expected Results The data acquisition software is expected to take in the packets,
unpack the information, interpret the data, and create objects for
the valid data. All errors must be caught before they are made into
objects. The output of the test is the created objects of all the
packets that contain valid coordinates.
9.1.3 Database
The database is used to pass the coordinates from the Data Acquisition phase to the
Web Server phase. The most important part of the database is to ensure that the entries
are not only preserved, but they are organized to allow for easy retrieval. As
emphasized throughout these tests, each section of the software must be optimized to
ensure that no section will act as a bottle neck to the system. Another issue the
database experienced is the amount of load it will have to handle. Since the system is
going to serve all of the buses on the main UCF campus, then at peak ride times the
database will be under a lot of stress processing the requests. To simulate this type of
load on the database, all of these tests were executed while the system is under a heavy
load. Despite the stopping criteria mentioned above, if a test on the database fails, then
it was ran again, but the second time the database won't be under an extreme load. This
helped pinpoint if the test was the actual defect or if it was simply the database not
being able to handle the load. The software and the functionality of the database were
tested with the cases listed in the tables below.
94 | P a g e
9.1.3.1 Test Cases
The purpose of the database in the design of the system is to provide the ability to allow
the packets being received from the transmitters to be stored in an organized location.
Based on the large amount of buses and the high amount of packets consistently being
received, writing to the database is an integral part of the design. Due to the high
demand of this action, it was tested very thoroughly to ensure it is seemingly error-free.
If problems existed in the area of writing to the database, then it could lead to small
problems such as individual buses not being systematically updated or to catastrophic
events such as bringing the system to a halt.
Test Objective 1
Test Objective #1 Writing to the database.
Test Description This test will simply write to the database to ensure that it will be
able to hold and overwrite previous data entries.
Test Conditions
The test will be done by overwriting the coordinates that are already
stored in the tables for their corresponding buses.
Expected Results Each bus in the database will be updated correctly with their new
coordinates. The output of the test is will be seen in the database in
the form of a shuttle entry.
The second primary use of the database occurs when the web server reads the stored
coordinate data. The database needs to be read as often as it is written to. Since such a
high demand lies in the process of reading from the database, it also needs to be
seemingly error-free. Problems in this stage of the database process could have lead to
improper placing of the shuttles onto the web server's map causing expired data to be
displayed to the screen.
Test Objective 2
Test Objective #2 Reading from the database.
Test Description This test will simply read from the database to ensure that it will be
able to pass the information that is stored into the database on
request.
Test Conditions
The test will be done by querying the database for an arbitrarily high
number of requests to receive data from its tables.
Expected Results Each query should return the bus number and its last updated
coordinates. The output of the test is the output of the values that
are stored in the database.
95 | P a g e
9.1.3.2 Unit Test
The database is the sole storage facility of the system. This means that it undergoes
consistent requests for both reading and writing. This means the system had to be able
to handle a great amount of requests; many of them happening simultaneously. This
scenario was a crucial part of the testing phase of the database to ensure that the
system will be stable during the peak rate of requests. Despite the database passing the
previous two objectives, without this test, it would have been left unknown if it was able
to handle when all the shuttles are updating their positioning at once.
Test Objective 1
Test Objective #1 Simultaneously reading and writing to the database
Test Description This test will read from and write to the database at the same time
to ensure that it will be able handle real working conditions.
Test Conditions
The test will be done by reading from and writing to the database
for an arbitrarily high number of requests.
Expected Results Each read and write should occur error free as well as not
experiencing any loss of data. The output of the test is going to be a
combination of updated entries in the database, as well as, the
information returned from the database.
9.1.4 Web Server
The Web Server is the main interface between the users and the database. This is the
location where the data is displayed on a map for the users to be able to track the buses
via the internet. It was very crucial for the web server to be nearly bug free since it is
where the users will be interacting with the design. Even though the data may be
correct, an error-ridden web server could derail the entire system. Unlike testing of the
previous software sections, by design, the web server only needs to be tested a unit.
The tests done on the web server are listed in the tables below.
9.1.4.1 Test Cases
One of the main goals of the entire system is to help the students that use the shuttles
daily. This means the system needs to reach out and be compatible with as many users
as possible. The web server acts as the main communication where the data from the
system is presented for the students to utilize. Currently the system is designed to be
accessed by a workstation via the internet. This means that each client could potentially
be using a different web browser to be accessing the service. Generally web browsers
96 | P a g e
are very similar, though they each react differently to how websites are set up. To
ensure that the web server is compatible with as many students as possible, it was
tested on several of the popular web browsers. These web browsers were, Mozilla
Firefox, Microsoft Internet Explorer, Google Chrome, and Apple Safari. These web
browsers accounted for nearly almost every user accessing the web server from their
unique workstation.
Test Objective 1
Test Objective #1 Website compatibility across web browser platforms
Test Description To ensure that the website can be properly accessed, it will be
loaded on multiple web browsers
Test Conditions
The most popular web browsers will be tested. This includes Mozilla
Firefox, Microsoft Internet Explorer, Google Chrome, and Apple
Safari.
Expected Results The website should be visually correct across all the test browsers.
The most basic task that the web server is required to do is print a shuttle to the screen.
This is done by the web server querying the data base and pulling the coordinates of a
particular bus id. Then based on the coordinate the bus is placed in the corresponding
location on the map. Also, the web server is responsible for coloring the shuttle based
on the unique shuttle id. The color of the shuttles is predetermined by the web server
based on the route the bus is designated to.
Test Objective 2
Test Objective #2 Print shuttles to the map.
Test Description This test will pull a bus from the database, and place it on the map
according to the coordinates stored.
Test Conditions
Multiple buses will be printed on the map at once when the web
server is refreshed.
Expected Results The shuttles should show up on the map at the correct location
based on the data stored with it.
In order to track the location of the shuttles, the web server needs to have the
functionality of updating the location of all the shuttles. This means when an updated
data entry is entered into the database, the web server needs to pull the new location
and update it on the map. This functionality is very important because it is what the
users will be viewing. With that being said, this functionality must also be very efficient.
If the buses do not update properly, the flow along the route will look very delayed and
difficult to follow.
97 | P a g e
Test Objective 3
Test Objective #3 Update the shuttles
Test Description This test will take the already printed shuttles and updated their
location in the database. This will cause the buses to move to a new
spot on the map.
Test Conditions
Multiple buses will be updated on the map at once when the web
server is refreshed.
Expected Results All of the shuttles will move from their original location, to their
updated location.
A useful feature in web server that needs to be tested is the ability to show the details
of a single shuttle by simply clicking it. Here the information of the bus is stored, for
example, the bus number, the route the bus takes, the bus's stops, etc. All of this
information is stored in the database. When a shuttle is selected, the web server takes
the bus id and queries the database for the information. Then it passes the information
from the database to the web server and into the information bubble. This needs to be
tested to ensure that the correct shuttle info is being pulled for each one. If somehow
the wrong shuttle information is being displayed, it would cause a great deal of
confusion with the users of the system.
Test Objective 4
Test Objective #4 Show the details of the shuttles
Test Description When the shuttle is selected by clicking on it, a bubble will pop-up
with the information about the bus. The information will include the
shuttle number, the route number, and any other information about
the shuttles. All of this information is stored in the database and is
pulled when the shuttle is selected.
Test Conditions
Multiple buses will be on the map at the same time so multiple
buses can be selected at the same time.
Expected Results The bubble should show the correct information relevant to the
shuttle selected.
A feature similar to one that was previously tested is the details of the stops. On the
map, the shuttle stops is labeled. When these icons are clicked on, it brings up a bubble
with the details of the stop. These details include such information as, the stop number,
the buses associated with the stop, etc. All of this information is stored in the database.
When the stop is clicked, the web server queries the database with the stop id key
associated with the stop and it pulls all the information from the tables to the bus. This
feature needs to be tested to ensure that all of the information is being pulled to the
98 | P a g e
web server correctly. If the wrong information is pulled and displayed, the same
consequences hold as the data for the shuttles, it would cause confusion with the users.
Test Objective 5
Test Objective #5 Show the details of the shuttle stops
Test Description When the stop is selected by clicking on it, a bubble will appear with
the information about the stop. This information would include, the
stop number, the route it’s associated with it, the shuttles servicing
that stop, and any other relevant information for the stop.
Test Conditions
All of the routes will be displayed on the map at once. At any one
time, multiple stops can be selected to show their information
Expected Results The bubble should show the correct information relevant to the
stops selected.
Another convenient feature implemented in the web server software is the ability to
sort the map by a single route. Since the buses are only traveling within a two mile
radius, many of the roads are multicolored where multiple shuttles are using that road
something during their route. To help the user see a single route more clearly, they will
have the ability to seemingly hide the other routes and only show the one selected. This
was to be tested to ensure that when selecting the shuttle, the proper route is
displayed.
Test Objective 6
Test Objective #6 Sort the map by a single path
Test Description A route can be selected by clicking on it. By doing this, all of the nonselected routes disappear to allow the used to view only the route
chosen.
Test Conditions
Initially, all of the routes will be placed on the map and available for
selection.
Expected Results When the route is selected, only the chosen route should be
highlighted on the map.
The main cosmetic feature of the system is the motion of the shuttles as the move along
the routes. There is software in place in the web server so when the shuttles update,
they do in a smoother fashion. Without this code in the place, the shuttles would simply
jump from coordinate to coordinate. Instead, the software is able to predict where the
next coordinate will be entered, and the bus will slowly move towards the destination
until it is updated. These location predictions will be very small so when the coordinates
do get updated, the shuttle is very close to the actual destination. This section of the
software would not only be error-free, but also be very efficient too. If the code is
99 | P a g e
delayed in anyway, it hinders the ability to estimate the location before the updated
coordinate comes in, rendering this feature useless.
Test Objective 7
Test Objective #7 Move the shuttles along a path
Test Description The database is going to be updated continually with a sample of
data that will update the shuttles on the map. When the coordinates
are updated, the web server has code in place to update the buses
as a smooth transition rather than making the buses skip along the
map.
Test Conditions
Multiple shuttles will be moving on the map at once.
Expected Results The shuttles should move along the desired path designated by the
sample file. These movements should be seemingly smooth without
any skipping.
9.1.5 Assembly Language
The assembly language code is going to be the driving force for the micro controller. The
micro controller must be programmed using the assembly language in order for it to
output the correct type of data so the rest of the software system will be able to utilize
it. The micro controller is an important component because it is what is housing the GPS
device, as well as, the transmitter that is going to be used to transmit the data to the
rest of the software system.
The assembly code has two purposes; to take the data from the GPS device and
package it and send it to the transmitter for transmission. To package the data, the code
takes the longitude and latitude coordinates from the GPS, and pairs it with the shuttle's
identification number. Once this information is in a small compact form, it is then
turned over to the transmitter where it is sent to the rest of the system. This assembly
code is where all of the information is generated. This means it is critical that this
software is error-free to ensure that the device is not transmitting incorrect data that
could potentially crash the system.
9.1.5.1 Test Cases
The first portion of the assembly software is responsible for receiving the longitude and
latitude coordinates from the GPS device. It is very important that the assembly code is
able to accept the data properly so it can be passed onto the later phases. This test is
needed to ensure that the data is properly accepted from the GPS device and
manipulated so it can be utilized further.
100 | P a g e
Test Objective 1
Test Objective #1 Receiving coordinates from the GPS
Test Description The GPS will pass the current coordinates of its location to the micro
controller. This will ensure that the GPS is connected to the satellites
and the micro controller correctly.
Test Conditions
The GPS will be connected to the micro controller and remain
stationary for the entire test.
Expected Results The output for this test case is the longitude and latitude
coordinates of the GPS device
The second phase of the assembly software is in place to package. After the data is
received in the first stage, it must be grouped together so it can be transmitted to the
rest of the software. The longitude and latitude coordinates were packaged together
along with the unique shuttle identifier. This piece of code must be very efficient for
many reasons. The package of the data needs to be as small as possible to help in the
transfer time from the transmitting device to the receiver. If the package is
unreasonably large, it will cause delays in the system. With these delays, the system will
be virtually useless because the web server will not be displaying the most up-to-date
shuttle location.
Test Objective 2
Test Objective #2 Packing the data
Test Description A simulated set of coordinates will be fed into the software. The
data will not have any restrictions on the range of the coordinates
due to testing purposes. The data will be packed into a packet with
the shuttle’s unique identification number
Test Conditions
The code will be fed an arbitrarily large number of simulated
longitude and latitude coordinates. There is no restriction on the
range of the coordinates being tested.
Expected Results The result of the test should be a collection of data packets
containing a pair of coordinates and the bus identifier. The amount
of packets leaving the system should equal the number of
coordinate pairs.
9.1.5.2 Unit Test
The assembly software is a very small piece of the entire system though due to its
location, it’s arguably the most important. Undoubtedly if any errors exist in this phase,
it would be felt throughout every other piece of software in the design. The best way to
ensure that does not happen is by running thorough test cases on the entire unit. By
putting together the two sections of the assembly software, the data from the GPS
101 | P a g e
device is accepted and then packaged for transport. This test case is designed to ensure
that this process is executed flawlessly.
Test Objective 1
Test Objective #1 Receiving the coordinates and packing the data
Test Description This is a combination of the two individual tests. The GPS will take in
its coordinates and pass it to the micro controller. Once the
coordinates are moved to the micro controller, it will then be
packaged together into a packet along with the shuttle identifier.
Test Conditions
The GPS receiver will remain stationary throughout the entire test.
The test will run for around ten minutes to allow for a large amount
of data to be processed.
Expected Results The result of the test should be a collection of data packets
containing a pair of coordinates and the bus identifier. The amount
of packets leaving the system should equal the number of
coordinate pairs.
9.1.6 Final Software System Evaluation
Software is accountable for more than half of this system's design. The key to making
the system reliable begins with testing of the software. Here is where a good portion of
the defects and errors needed to be found before it is completely assembled. By testing
the software in small units, it allows for the simpler problems to be caught quickly,
hopefully eliminating larger problems later on. This method of building the system up
piece by piece and testing along the way ensures that not only is the software sections
working properly, but also that they are compatible with each other. This system is
slated to be used by thousands of students each day, so it is crucial to deliver a quality
product. To ensure the highest quality is delivered to the users, implementing a strict
passing criterion was necessary. This meant that even though a piece of code seemed to
functioning initially, it still needs to undergo multiple test cases to ensure that the
software is indeed running as expected. Also, despite the fact that no errors are being
thrown, problems could still exist. This meant the outputs of these tests needed to be
checked to ensure that it was the correct expected output data. If that check went
undone, then finding those errors after the software blocks are put together becomes
very challenging. Quality also extends beyond defects and errors. The efficiency of the
software is also crucial aspect of the design. By nature of the system, it must be
designed with efficiency in mind for the system to be even useful. For example, if
database is unable to handle an extremely high number of requests during the peak
time students ride the bus, then the shuttle location updates will be extremely delayed
causing all of the users to be viewing seemingly expired data. A bottle neck to any phase
of the software in the system could cause it to become unusable. This is why during
each test case, quality, efficiency, reliability, and accuracy was top priority.
102 | P a g e
9.2 HARDWARE TESTING
As mentioned previously, the Transit Tracking System is broken down until two key
areas, the software and the hardware. The hardware for the system has multiple uses.
By design, the first phase of the system is primarily dominated by the hardware. First, it
is the key component in receiving the shuttle's current location by the use of a GPS
module. This information is then fed to the microcontroller. The software in the
microcontroller handles the data and prepares it for transport. The movement of this
data is handled by two hardware devices, an RF modem set to transmitting and another
RF modem at the base station that is configured to receive the data. Each shuttle will be
equipped with its own hardware unit. This unit contains the GPS receiver, a
microcontroller, and an RF modem configured for transmitting. At the base station lays
a single RF modem configured to receive data from the entire shuttles active in the
system. Each piece of hardware was tested to ensure it can handle the different
operating conditions it will be exposed to.
9.2.1 Testing Overview
The procedure on testing the hardware used in the system is different compared to the
methods used when testing software. When testing software, generally the code can be
fed a large amount of data containing known errors to see how it reacts to them.
Unfortunately this cannot be done when testing hardware. In order to expose the
hardware to a large amount of data, the tests had to have a very high run time so it has
the ability to collect the data. Also, it is very hard to force feed the hardware errors. For
the Transit Tracking System, the errors would generally come from the specification
restrictions on the functionality of the hardware. These errors could include situations
such as, the transmitting RF modem reaching its max transfer distance from the receiver
and errors can stem from environmental as well. In order to test these cases, the
hardware must be subjected to the stimuli that it will receive when the system is
operating. These types of errors can include situations such as the transmitting RF
modem trying to transfer data through an obstruction or the GPS device attempting to
connect to the satellites on a cloudy day. Also included in the testing of the hardware is
the testing of the power. Each device is powered in some way to operate so thorough
testing was also done on it. As it is seen, hardware testing calls for different types of
methods, however the goal is the same, produce and maintain a seemingly error free
system.
9.2.2 Testing Conditions
The hardware test cases will undergo two different conditions. The first condition was
used to ensure the main functionality of the device is working properly. This was done
by simply hooking the hardware up to a computer and testing its functionality. By doing
103 | P a g e
this, the devices are not being subjected to any external biases such as the movement of
a shuttle or the obstruction of a tree. Once the device is deemed working as expected, it
now can be slowly introduced to different conditions to note how the hardware reacts.
By slowing exposing the devices to the external conditions instead of just placing it into
it in the standard operating conditions allows for the source of the error to be more
easily exposed. Each of these tests was run until a significant amount of data has had a
chance to either be transmitted or received by the device. This is done to ensure that
the amount of operating time does not affect the device in anyway. Any unique testing
conditions were noted in the specific test objective.
9.2.3 Passing Criteria
Establishing passing criteria is especially crucial when testing hardware. During testing,
the devices were activated, and the data that is passing through them was constantly
monitored. In order to deem a piece of hardware passing, its data must show two
particular characteristics. These would be consistency and accuracy. This means, a
device can be deemed working as expected if the data it is either receiving or
transmitting is consistent and accurate to what the data is expected to be. For testing
the GPS, the expected data can be determined by using a known working device. To
define accuracy in the scope of testing would be ensuring that the data is falling within a
five percent range of the assumed data. If both of these characteristics are passed, then
the device can be deemed working as expected. Within the passing criteria also lies how
errors were handled. When testing the hardware and a fatal error is occurred, the
testing will stop and the error will be fixed immediately. If there is a non-fatal error
occurring in the operation of a hardware device, it was noted and the test will continue.
Only after the test is completed or if a fatal error occurs, will the non-fatal error be
addressed. This type of error handling is done in the hopes of correcting the fatal errors
will in turn also address the non-fatal ones.
9.2.4 Tracking Device
The tracking device that is used in the system is a simple GPS receiver. It essentially
connects to the satellites and passes the longitude and latitude coordinates to the micro
controller. In order to receive the correct coordinates, the GPS device must be
configured properly. Once the configuration is complete, it must be tested. The GPS
receiver needs to first be tested for its basic functionality to ensure that it is in fact
outputting the proper coordinates. The basic functionality must be tested very
thoroughly, because if the device no functioning correctly, then it will serve no use to
the system. As seen with other GPS devices, the environment in which it is placed in
plays a large role in how well it operates. This is because the device is designed to have
a line-of-sight to the sky so it has a clear path to connect to the satellites above to get
the coordinates of its location. So situations like cloudy days or physical obstructions
104 | P a g e
could possibly severely hinder the functionality of the device. Another issue that was
brought up in testing is how the GPS device will act when it is placed inside of the
shuttle, and the shuttle begins to move. All of these issues need to be covered in testing
to ensure that the GPS will be working as it should for the needs of the system.
9.2.4.1 GPS Tests
The first test the GPS device will undergo is to ensure the basic functionality is working.
This test was simply to check if the GPS is able to connect to the satellites and receive
the coordinates. Since this is a very basic test, the GPS was not moved to confirm that
just the basic functionality is being tested. To test this, the GPS was connected to a
laptop where it will simply feed the longitude and latitude coordinates so it can be
confirmed that it is in fact connected and receiving.
Test Objective 1
Test Objective #1 Receiving the coordinates from the GPS
Test Description The GPS device will be connected to the PCB board and continue to
transmit the current longitude and latitude coordinates.
Test Conditions
For the test, the GPS will remain stationary. The test will run ten
minutes while the GPS collect a sufficient amount of data.
Expected Results The test will be outputting the coordinates of the current location of
the GPS unit.
This next test took the examination of the GPS output a bit further. This test began
under the similar fashion of the stationary device being connected to a laptop to view
the coordinates. However, now with the aid of a known properly configured GPS device
was used to get a rough estimate of the current longitude and latitude coordinates the
test is taking place. From here, the data from the testing GPS was compared to the
estimated coordinates to see if the output is truly the correct location. It is known that
the coordinates would not be exactly due to the difference in the specifications of both
devices, but it was clear by the output if the tested GPS is operating correctly by
receiving the right coordinates.
105 | P a g e
Test Objective 2
Test Objective #2 Receiving the correct coordinates
Test Description This test will be run to ensure that the GPS is outputting the correct
coordinate. The general coordinate location of the GPS will be found
and compared to the output data of the GPS.
Test Conditions
The GPS will be placed in a location where the longitude and latitude
coordinates are known.
Expected Results The test will be outputting the coordinates of the current location
that will be compared to the known coordinates of the position.
To take the previous two basic tests even further, the GPS device was tested to ensure
that it will continue to consistently output the same longitude and latitude coordinates
for its current location while remaining stationary. This basic functionality is important
for many reasons. First, if the device seems to be bouncing between two extremely
different coordinates, then this means that the device is not properly receiving data
from the satellites and needs to be examined for a defect. Also, bouncing coordinates
could cause a real headache when they are updated into the database for the web
server to use. This is because within the web server, there exists code that will autoalign the coordinates to fit to the route. Therefore, if in the event a shuttle is stopped
and sitting at a boundary of two spots on the map, the bouncing will cause the bus to be
updated each time moving back-and-forth between the two positions.
Test Objective 3
Test Objective #3 Receiving the consistent coordinates from the GPS
Test Description This test is to ensure that the GPS is transmitting consistent
longitude and latitude coordinates.
Test Conditions
The GPS is to remain stationary during the entire duration of the
test. The test will run for ten minutes.
Expected Results The output of the GPS will be the current coordinates of the
transmitter. If the GPS device is configured properly, then the
coordinates should be relatively close to each other.
The next step once the GPS is confirmed to be in working condition by correctly
outputting consistent coordinates, was to submit the device to stimuli. The stimulant
the GPS is subject the most often is movement. This movement will be caused by the
shuttles moving along its route. The GPS needs to be able to handle this movement
while still staying connected to the satellites and receiving and outputting the correct
longitude and latitude coordinates.
106 | P a g e
The device will undergo the test in a similar fashion as the previous cases have
undergone. The GPS was connected to a laptop that was placed inside of a car. As the
car moves slowly down the road, the coordinates need to be consistently and efficiently
updating with the correct coordinates. Once again, to confirm that the coordinates are
true to the location, another GPS device was referenced.
Test Objective 4
Test Objective #4 Receiving Coordinates While Moving the GPS
Test Description This will test to ensure that the GPS unit could receive longitude and
latitude coordinates while moving. This will be done by bringing the
GPS device into a car and collecting the data as it moves along the
road.
Test Conditions
The GPS device will be connected to a portable computer where the
output components will be able to be viewed. The car will drive in a
three mile loop making multiple turns on the way.
Expected Results The GPS unit should return the correct coordinates as the car is
moving throughout the designated route.
Now that the GPS is functioning properly and can do so while moving, it was now tested
on the shuttle in the environment in which it will sit when the system is complete. The
reason the shuttle and the movement tests are separate is because if the GPS seems to
not function on the bus, it is unsure if it’s the movement of the vehicle that is affecting
its functionality or if it’s the actual but itself.
To preserve the consistency of the cases, the device was once again connected to a
laptop where the longitude and latitude coordinates were displayed and was confirmed
by using an addition GPS device. If the functionality changes during this test, it could be
assumed that the shuttle is playing a part in causing it.
Test Objective 5
Test Objective #5 Receiving Coordinates From the GPS Inside the shuttle
Test Description This test will be very similar to the previous. However, this will be
done inside of one of the shuttles that will be housing the system in
the future. This will ensure the shuttle does affect the GPS receiver
in any way.
Test Conditions
The GPS device will be connected to a portable computer where the
output components will be able to be viewed. The shuttle will be
moving through its designated route. The test will conclude once the
shuttle returns to the beginning of its route.
Expected Results The GPS unit should return the correct coordinates as the shuttle is
moving throughout the designated route. There should be little no
points where the GPS is unable to get the coordinates.
107 | P a g e
As mentioned previously, the GPS device needs to have a line-of-sight with the sky in
order for the coordinate data to be received from the satellites. This means that
obstructions along the routes could affect the functionality of the hardware. Since it can
be assumed that the GPS receiver is able to connect and output data while moving on a
bus, the testing location can return to a car so the obstructions can be tested multiple
times in a short period.
Since the routes of the shuttles are known, the locations of all the obstructions that the
GPS would face can be noted and tested. These obstructions would include
underpasses, dense tree cover, and buildings. It is known that the device functionality
will hinder during the period in which it is faced with this obstruction, however the test
is merely going to be done to ensure that this drop in performance is not great enough
to affect the data enough to cause errors.
Test Objective 6
Test Objective #6 Receiving Coordinates Near Obstructions
Test Description The GPS device must be able to collect data despite passing through and
Test Conditions
Expected Results
near any physical obstructions along the routes.
This test will be done with the GPS device connected to a portable
computer. For the ability to gather enough data for the test, the GPS unit
will be placed in a car instead of a shuttle. The car will then travel through
all of the obstructions that are on the planned routes of the shuttles.
The GPS device should return the correct coordinates as the car is moving
passed these obstructions. There should be no drop in performance while
passing these obstructions.
A special, unavoidable obstruction the GPS device would have to overcome is cloud
cover. Unlike the previous obstructions that were tested, cloud cover is not typically
temporary, nor is it able to be escaped. Thankfully, the system is running in Florida, so
the days with cloud cover is limited, but this was still an issue that needed to be tested.
This test was difficult to plan due to not being able to control the weather. When a
cloudy day does come, the test took place inside a car that will be driving the same
route used in Test Objective #4. The GPS was connected to the laptop once again and
the data from this case would be compared to the data gathered previously from this
route on a normal day.
108 | P a g e
Test Objective 7
Test Objective #7 Receiving Coordinates on a Cloudy Day
Test Description The GPS device must be able to collect data despite any natural
Test Conditions
Expected Results
obstructions in the sky, this includes clouds.
This test will be done with the unit inside of a shuttle on a cloudy day. If a
shuttle is not available at the time of testing, a car will be substituted in.
The GPS device will be connected to a portable computer which will be
located inside of the shuttle. The shuttle will travel through a designated
route, and the test will conclude once the shuttle returns to the starting
point.
The GPS device should return the correct coordinates as the shuttle moves
along its designated route. The drop in performance do to the cloud cover
should be minimal, allowing the system to still be fully operable.
9.2.5 Transmitter
The next phase the data makes its progression through is the transmitter hardware.
Here, the packets that were created by the assembly software that used the data from
the GPS device are sent over the air to a receiver on in another location. Each shuttle
will contain one transmitter which will send the shuttles data to the base station's
receiver. These transmitters are hardware devices known as RF modems that transmit
data across a determined radio frequency. For the system to be consistently updating
the position of the shuttles on the web server, the transmitter needs to be tested to
ensure that it will maintain functionality over several real-life situations it will have to
face when the system is running.
9.2.5.1 Test Cases
The first hardware test for the transmitter was to simply connect the device to the
serially to a laptop running the modem's software. From here another RF modem was
setup on a different laptop and acted as a receiver. Then data was tested to ensure that
it can be passed between the two. There was no movement of the modems during the
test to confirm that only the basic function of the transmitter was being tested. This
functionality was very basic, but it was necessary to test to ensure that the transmitter
can move data to the receiver.
109 | P a g e
Test Objective 1
Test Objective #1 Transmitting Data
Test Description The transmitter must be able to do its basic functionality of consistently
Test Conditions
Expected Results
transmitting packets of data.
The transmitter will be connected to a computer where it will be used to
create and pass the packets. On another computer nearby, a receiver will
be connected to receive these packets. Neither device will move during
the test. The test will commence once an arbitrarily large amount of data
is transmitted.
The transmitter must be able to transmit all of the information it is
requested to without experiencing any data loss.
9.2.6 Receiver
The receiving hardware for the system is the other end of the transport system in which
the data is traveling from the shuttles to the base station. This piece of hardware was
also an RF modem; however it was set to receive the transmitted data. Once this data is
received, it would be moved through the data processing software and through the rest
of the system. The receiver is a very import piece to the design. Unlike the transmitters,
there is only one receiver. This means if a transmitter fails, the system would still be
functional with the others, but if the receiver fails, then the entire system fails. With so
much being depended on the receiver, the testing for it was very crucial to ensure that
there is little chance that the hardware could fail.
9.2.6.1 Test Cases
The first hardware test is for the receiver was done by simply using the same setup as
Test Objective 1 from the transmitter test. This time a large amount of packets were
sent from the transmitter to the receiver. After the sending is complete, all of the
packets had to be accounted for on the receivers end. This test was to make sure the
basic functionality of the hardware is working before more in depth testing begins.
Test Objective 1
Test Objective #1 Receiving Data
Test Description The receiver must be able to do its basic functionality of consistently
Test Conditions
Expected Results
receiving packets of data.
The receiver will be connected to a computer where it will be used to
accept the packets of data. On another computer nearby, a transmitter will
be connected to transmit these packets. Neither device will move during
the test. The test will commence once an arbitrarily large amount of data
is received.
The receiver must be able to receive all of the packets transmitted without
experiencing any data loss.
110 | P a g e
Once the receiving hardware passes the basic functionality testing, it must undergo a
more crucial test. This case would involve the movement of packets similar to the
previous test; however this for this case, there would be multiple transmitters sending
packets to the single receiver. Each transmitter would be connected to a separate
computer, and they would randomly send a high number of packets to the receiver. The
receiver would then ensure that all the packets are gathered and none are lost. This test
is important because during the normal operation of the system, the receiver was
constantly hit by packets from many different transmitters. It is important to ensure
that each packet gets recognized by the receiver so no information is lost.
Test Objective 2
Test Objective #2 Receiving Data From Multiple Transmitters
Test Description The receiver must be able to accept packets that are being transmitted
Test Conditions
Expected Results
from multiple transmitters
The receiver will be connected to a computer where it will be used to
accept the packets of data. On multiple computers nearby, multiple
transmitters will be connected to transmit these packets. Neither of the
devices will move during the test. The test will commence once an
arbitrarily large amount of data is received.
The receiver must be able to receive all of the packets transmitted from
the multiple transmitters without experiencing any data loss.
9.2.7 Transmitter & Receiver Unit Test
At this point it is known that both the transmitter and receiver are both able to send
and accept data with each other. Since both devices are working together, once their
basic functionality is confirmed to be working as expected, they must be subject to
situations they would face when the system is operating. In order for the system to
transport data from the hardware on the shuttles to the software at the base station,
the transmitting and receiving hardware must be tested thoroughly to ensure that
certain conditions do not hinder their functionality.
9.2.7.1 Test Cases
For the purpose of the system, the transmitters and the receiver needed to be able to
communicate regardless of the state of the transmitting devices. This means that when
the transmitters are moving along the routes on the shuttles, they would still be able to
send the data to the receiver sitting at the base station. This must be tested thoroughly
111 | P a g e
because it’s a basic situation that will constantly occur during the system's normal
operation. To this test will be performed with the same setup as the individual test
cases; by connecting the hardware directly to a computer. The transmitters would send
packets while being moved around the receiver. The line-of-sight would never be
obstructed due to testing constraints. Once the test is complete, the receiver should be
accountable for all the packets transmitted.
Test Objective 1
Test Objective #1 Receiving data while moving
Test Description The transmitters and receivers must be able to pass data along while the
Test Conditions
Expected Results
transmitter is in motion.
Both the receiver and the transmitter will be connected to a computer.
This transmitter will be located in a car to simulate the movement of a
shuttle. The transmitter will then be transmitting packets while moving
around the line-of-sight of the receiver. The test will resume until an
arbitrarily large amount of data is passed.
The packets must be transmitted and received by both devices without
experiencing any data loss.
At this point of the testing, it is determined that the transmitters and receivers are able
to communicate with each other when being subjected to movement. Unfortunately,
the communication hardware will not always be in the line-of-sight with each other. This
next test was to determine how the devices would react when the transmitters were
subjected to obstructions. These obstructions can include trees, buildings, and hills. To
test this situation, the transmitters would now be sending packets consistently while
moving in and out of the previously listed obstructions. Once the test is complete, the
receiver should be accountable for all the packets transmitted.
Test Objective 2
Test Objective #2 Transmitting Data Near obstructions
Test Description The transmitters and receivers must be able to pass data along while the
Test Conditions
Expected Results
transmitter is passing through obstructions.
Both the receiver and the transmitter will be connected to a computer.
This transmitter will be located in a car to simulate the movement of a
shuttle. The transmitter will then be transmitting packets while moving
around in and out of the line-of-sight of the receiver by passing through
obstructions. The test will resume until an arbitrarily large amount of data
is passed.
The packets must be transmitted and received by both devices without
experiencing any data loss.
112 | P a g e
The true location of the receiver is going to be located at the highest point on campus
atop the tallest building. This means that the transfer of the packets would have to
travel up as well. Previously, the testing of the transmissions was on even ground to
ensure that the basic functionality was being maintained. Now that it can be determined
the devices are working as expected, the receiver can be moved to a high altitude above
the transmitters. Unfortunately, the building has limited access, so for testing purposes,
a parking garage on campus will serve as a higher altitude. This test will be run the same
as Test Objective 1, but now included the height separation.
Test Objective 3
Test Objective #3 Receiving Data at Different Heights
Test Description The transmitters and receivers must be able to pass data along while the
Test Conditions
Expected Results
receiver is placed at a much high elevation compared to the transmitter.
Both the receiver and the transmitter will be connected to a computer.
This transmitter will be located in a car to simulate the movement of a
shuttle. The receiver will be placed on top of a parking garage to simulate
the height disparity. The transmitter will then be transmitting packets
while moving around the receiver. The test will resume until an arbitrarily
large amount of data is passed.
The packets must be transmitted and received by both devices without
experiencing any data loss.
In order to be able to better accurately test the transmission hardware, it must be
pushed to the specified device limit to see how they react. The entire system was
covering a three mile radius around campus, so the transmission of data at times will
have to travel the maximum distance.
Again, similar to Test Objective 3, there are some testing limitations with the height of
the receiver, so this must be accounted for when testing the ranges. Since the parking
garage is not nearly as high as the radio tower, it will be assumed that the max range of
the system will be limited to a half of a mile. This will show how the transmitting packets
react when they nearing the maximum distance apart from the receiver.
113 | P a g e
Test Objective 4
Test Objective #4 Receiving Data Near the Max Transmitting Distances
Test Description The transmitters and receivers must be able to pass data along while the
Test Conditions
Expected Results
transmitter is placed traveling near the predetermined maximum distance
for transmission.
Both the receiver and the transmitter will be connected to a computer.
This transmitter will be located in a car to simulate the movement of a
shuttle. The receiver will be placed on top of a parking garage to simulate
the height disparity. The transmitter will then be transmitting packets
while moving around the receiver. The transmitter will travel out the
assumed max distance of a half of a mile while still transmitting packets.
The test will resume until an arbitrarily large amount of data is passed.
The packets must be transmitted and received by both devices without
experiencing any data loss.
9.2.8 Power
Always when designing a system that includes hardware, power must be tested. For the
shuttle tracking system, the power source is the cigarette lighter that is in each of the
buses. This lighter is active when the shuttle is running and it powers the entire
hardware unit that will be located on the bus. This hardware unit includes the GPS
device, the micro controller, and the RF modem transmitter. Since this collection of
hardware is powered together, it can be tested as one unit. The system has no control
over when the power source is active, so it is imperative that there be testing done in
the event of a power drop or loss. If these situations went untested, then the units on
the shuttles were subject to failure.
9.2.8.1 Test Cases
The first test in checking the power is to ensure the source is delivering enough
electricity for the unit to be powered. As started previously, the unit needs 5 volts of
power. Essentially, the shuttle's cigarette lighter should deliver 12 volts of power. This
test is simply going to make sure that throughout the shuttles route, it maintains its 12
volts of power.
114 | P a g e
Test Objective 1
Test Objective #1 Ensure the Cigarette Lighter is Producing Enough Power
Test Description The cigarette light must provide 10 volts of power throughout the shuttles
Test Conditions
Expected Results
entire route.
A multi-meter will be connected to the shuttle’s cigarette lighter and the
voltage of its output will be tested for the duration of the shuttles entire
route.
The cigarette lighter should provide a consistent power source of 10 volts.
Once it is confirmed that the shuttle is able to provide enough power to the system
during the entire route, it’s now time to test to ensure the system unit is converting this
power properly. This was done in a similar method as Test Objective 1, but this time the
unit was connected to the cigarette lighter. The power was then tested from the micro
controller board to ensure that not only is the shuttle providing enough power, but the
micro controller is converting this power correctly for usage.
Test Objective 2
Test Objective #2 Ensure the Power From the Cigarette Light is Converted Properly
Test Description The cigarette light converter must provide 5 volts of power throughout the
Test Conditions
Expected Results
shuttles entire route.
A multi-meter will be connected to the hardware unit’s cigarette lighter
converter and the voltage of its output will be tested for the duration of
the shuttles entire route.
The cigarette lighter converter should provide a consistent power source
of 5 volts.
The most important test dealing with power is how the system responds to power loss.
This power failure could come from different situations, such as the bus being turned off
as it waits for students to board. In the event that this occurs, the system not only
needed to be able to handle this power loss, but it also had to be able to recover quickly
once power was restored so it can continue to transmit data. This scenario did not need
to be tested directly on the shuttle; instead it can be done with any supply voltage that
meets the system unit's power specifications.
115 | P a g e
Test Objective 3
Test Objective #3 Losing Power to the Hardware Unit
Test Description The hardware unit must be able to handle a loss in power and still function
Test Conditions
Expected Results
once the power is restored.
This test does not have to occur on a shuttle. The hardware unit must be
connected to a power source. The power must then be cut for thirty
seconds, and then it will be restored. This test will occur multiple times
over a course of an hour.
The hardware unit must be able to lose power and still be able to operate
once power is restored.
9.2.9 Final Hardware System Evaluation
The hardware is the starting point of the Transit Tracking System. It begins the collection
of the data and plays the key role in the transportation of the information to the rest of
the system. If at any point the hardware fails during normal operation, then the entire
system is brought to its knees. Due to the significance of the hardware to the design, it
was tested thoroughly in order to ensure that it maintains its basic functionality
throughout the operation of the system. The method of testing began with ensuring
that the basic functionality of the each piece of hardware worked correctly. This was to
ensure that simple issues would be corrected at the beginning stages to prevent these
from causing larger problems later on in the testing process. Next the pieces of
hardware were tested together to ensure that they were able to function properly when
passing data along through each other in a neutral environment. Once again this was to
ensure it would be easier to pinpoint the issues when there is less of a bias acting on the
system.
The final and most important testing came last. This is where the entire hardware
system was pieced together and tested. This ensured that the hardware was still
functioning as expected. This setup was then tested in different environmental
conditions. These conditions mimicked the types of situations in which the system will
have to endure when operating. The challenges of testing the hardware lies in the
attempt to mirror those conditions; specifically, testing the receiver and the
transmitters. For the operational use of these pieces of hardware, the base station will
be located at a height that is hard to copy. To compensate for this issue for testing
purposes the system is tested at greatest heights available. If there are no issues, at the
lower heights, then it can be assumed that it will be able to operate at the height of the
base station. With the completion of the hardware testing, the system is now ready to
be built and ready for the overall system testing.
116 | P a g e
9.3 OVERALL SYSTEM TESTING
After the individual case testing is complete, it was time to test the complete system.
Before this can happen, the entire system had to be built and setup to how it would be
during the standard operation mode. The overall system testing was approached
different than the other testing used in this design. It was broken down into two types
of evaluations.
The first is very simple; run the system and just watch for errors. This was done over a
course of two full days to ensure that enough data is gathered to assume the system is
operating correctly. Simple issues were fixed on the fly while the larger issues were
noted and fixed after the completion of the test. After the bugs are fixed, the system
was returned to testing. This process continued until the system is no longer throwing
errors.
The next evaluation was done by manipulating the system into causing an error. This is
done because even though by then, the system had been running for some time, but
some of these situations may not occur during the time. After the system passes both of
these evaluations, it continued to run in a state in which errors will be tracked, and fixed
accordingly. Any major issues were addressed by shutting down the system until they
are fixed.
Once this testing is complete, a beta version of the system was on a limited release. This
will expose the system to a new environment. Here feedback will be gathered from the
beta users in the hopes of tracking down errors and making the system better overall.
Using this information, the system was periodically updated to address these issues.
Once the beta testing is seen as a success, the system was ready for the full operational
mode, and was open to anyone wanting to use it. Though the system may be complete
and running, issues will still come up so maintenance will need to be done on the
system. However, by testing the system thoroughly, these maintenance periods should
be much less frequent
9.3.1 Test Cases
The first test case is a simple and obvious, but very necessary test. This test is simply
setting up the system and running it. This test would expose those issues that either
weren't able to be replicated in the individual case testing, or the issues that were
simply overlooked. This test will run for two entire days. After the test has concluded
the issues were fixed, and the test was run again. This cycle would continue until the
system is able to run consistently for two days without any errors being thrown.
117 | P a g e
Test Objective 1
Test Objective #1 Base System Testing
Test Description The system must be able to collect data from the hardware, transmit it to
Test Conditions
Expected Results
the base station, interpret the data, and display it for the users to see.
The test will run for a course of two days. After the period is completed,
problems will be fixed and the test will run again. This cycle will continue
until the system can last for the entire duration without experiencing any
errors.
The entire system must operate for a long period of time without
experiencing any errors.
This next test was used to manipulate the system to evaluate how it would react. This
would test to see how the system will react to a shuttle going out of the predetermined
area of usage. Since a shuttle as not be available to perform this, a hardware unit would
be installed in a car. The car was then be driven out of the area and then back-in while
noting the affect it has on the system.
Test Objective 2
Test Objective #2
Test Description
Test Conditions
Expected Results
Forcing a Shuttle Out of the Predetermined Area
The system must be able to handle a shuttle being driven out of the
predetermined area of the system.
The test will be run by placing a hardware unit into a car. The car will then
be driven out of the predetermined area of the system.
The system must able to handle and still be able to operate when the
hardware unit is traveled out of the bounds of the system without
throwing any errors.
Similar to the case in Test Objective 2, this is another manipulation test. This test was to
see how the system reacts to the loss of power to one of the hardware units on the bus.
To test this, in the middle of a route the unit's power was cut. At this time, the web
server should to update the bus, so essentially it would remain motionless on the map.
Then the power was restored to the unit. Once the unit is back up and running, the bus
was updated on the web server and should be seen moving.
118 | P a g e
Test Objective 3
Test Objective #3
Test Description
Test Conditions
Expected Results
Cutting the Power of a Transmitter
The system must be able to handle a shuttle losing power to its hardware
unit while the system is operating.
The power of a shuttle’s hardware unit will be cut. This loss of power will
hold for five minutes. After the elapsed time, the power will be restored to
the unit.
When the power is cut from the hardware unit, the shuttle should remain
motionless on the web server. Once the power is restored, the position of
the shuttle must be initially updated, and then continually updated as it
moves along its route.
9.4 OVERALL SYSTEM EVALUATION
Testing the overall system took nearly a month. This may seem like a very long amount
of time to be testing the system, but it was necessary to ensure the system was nearly
bug-free. Since this system will be constantly used by the entire main campus of the
university, it must demonstrate reliability and efficiency. Even though the formal testing
of the system is complete, testing will still occur as needed. This would usually be the
result of a user finding an error or the system crashing for an unknown reason. When
this occurs, the system would undergo maintenance based on the urgency of the issue.
If the problem can be fixed on the fly, then it would be done so without any effect on
the operation of the system. If the problem is more critical, then the issue would need
to be addressed by shutting down the system and fixing the issue as quickly as possible
to minimize the amount of downtime the users will have to experience. Testing is an
ongoing process in the design of the system, but the amount of testing can be
minimized by proper case testing when designing the system.
10 User Manual
10.1 TRACKING DEVICE
10.1.1
Firmware
This section details the process for updating the firmware on the TTS tracking device if
required to do so for a specific bug fix or to enable new functionality. The process of
updating the TTS is a fairly risky procedure, as is the case with any device firmware
update, so it should only be conducted if necessary to maintain normal product
operations. That being said, the TTS boot loader has precautionary measures built in to
reduce any issues.
119 | P a g e
10.1.1.1
Uploading TTS Firmware
The following materials must be present for uploading new TTS firmware to the tracking
device:
•
•
•
RS-232 DB-9 male-female cable
Computer with DB-9 male connector (a USB<->serial cable can be used instead),
and Microsoft Windows XP, Vista, or 7
TTS Software & Configuration disc (includes Arduino IDE software)
To upload new TTS firmware to the tracking device, first ensure the following conditions
are satisfied:
•
•
Ensure the device is connected to a stable power source during the entire
process (it is recommended that the device be removed from the vehicle being
tracked and powered from a standard AC receptacle)
The device is connected to the computer using the serial cable and the port
number is noted (this can be found using the Device Manager)
Follow each step below to upload the new TTS firmware:
1. Copy the TTS firmware folder from the TTS Software & Configuration disc to the
C:\ drive on the computer.
2. Open the folder and launch “arduino.exe”
3. Click File->Sketchbook->Sketches->TTS
4. Click Tools->Serial Port and select the serial port number that corresponds to the
port the tracking device is connected to.
NOTE: The following steps must be completed quickly in order for the upload to be
successful and to ensure there are no problems. Read through the steps before
continuing. You have 10 seconds from when the power is re-connected to the device
until the code must be successfully uploaded.
5.
6.
7.
8.
Remove the power connector from the tracking device.
Connect the power connector back to the tracking device.
Click File->Upload to I/O Board.
The Arduino IDE software will say “Done Uploading.” in the status bar towards
the bottom of the window.
Follow the steps in the “Verification” section to ensure the firmware update was
successful.
120 | P a g e
10.1.1.2
Verification
The following steps ensure the firmware update was performed successfully. Ensure the
conditions from the previous section still hold true and that the Arduino IDE software is
still opened with the correct Serial Port chosen.
1. Click Tools->Serial Monitor
2. Remove the power from the device and then reconnect
3. After a delay of about 10-15 seconds, a message should be written to the output
regarding the GPS signal and/or the configuration of the RF modem parameters.
If the expected output is written to the screen, the device firmware has been
successfully updated and the device may now be disconnected and reinstalled in the
vehicle.
10.2 RECEIVING RF MODEM
This section contains detailed instructions for the initial or updated configuration of the
Receiving RF Modem, which allows it to communicate properly on the TTS RF network.
This device comes pre-configured by the TTS team, but the instructions are included
here in the event that the device needs to be re-configured for bug fix or system
enhancement purposes.
10.2.1
Modem Parameter Configuration
The following materials must be present for configuration of the RF modem:
•
•
•
RS-232 DB-9 male-female cable
Computer with DB-9 male connector (a USB<->serial cable can be used instead),
Microsoft Windows XP, Vista, or 7, and the Digi X-CTU software installed.
TTS Software & Configuration disc
To configure the RF modem, first ensure the following conditions are satisfied:
•
•
Ensure the device is connected to a stable power source during the entire
process (it is recommended that the is powered from a standard AC receptacle)
The device is connected to the computer using the serial cable and the port
number is noted (this can be found using the Device Manager)
Follow each step below to configure the Receiving RF Modem:
1. Open the Digi X-CTU software from the computer.
2. Select the serial port corresponding to the RF modem connection on the “PC
Settings” tab. Leave the other parameters at their default.
3. Click the “Terminal” tab
4. Locate and open the text file on the TTS Software & Configuration disc named
“ReceivingModemParameters.txt”
121 | P a g e
NOTE: The following step will tell you to enter a sequence of symbols to force the
device into a configuration mode. If the steps for entering the parameters are not
completely promptly, the device will automatically exit configuration mode and
all steps of this section must be repeated.
5. Do not type anything into the terminal window for 5 seconds.
6. Type the following sequence of symbols without the quotations (do not press
the enter key): “+++”
7. Do not type anything into the terminal window until the modem responds with
“OK” in the terminal window. (This should take about 1 second).
8. Enter each of the commands outlined in the “ReceivingModemParameters.txt”
text file, pressing enter after each one. The modem will respond with “OK” after
each command is successfully entered.
Follow the steps in the “Verification” section to ensure the RF modem configuration was
successful.
10.2.2
Verification
The following steps ensure the Receiving RF Modem was configured successfully. Ensure
the conditions from the previous section still hold true, that the Digi X-CTU software is
still opened with the correct Serial Port chosen, and that the
“ReceivingModemParameters.txt” file is still open.
1. Do not type anything into the terminal window for 5 seconds.
2. Type the following sequence of symbols without the quotations (do not press
the enter key): “+++”
3. Do not type anything into the terminal window until the modem responds with
“OK” in the terminal window. (This should take about 1 second).
4. Enter
the
commands
in
the
verification
section
of
the
“ReceivingModemParameters.txt” text file one at a time, ensuring the expected
result listed is the text file is received.
If all the commands returned the expected output values, the Receiving RF Modem is
properly configured and may be removed from power and installed in its permanent
location.
10.3 REPEATER RF MODEM
This section contains detailed instructions for the initial or updated configuration of a
Repeater RF Modem, which allows it to communicate properly on the TTS RF network. If
a Repeater is added to the TTS system, the follow must be conducted on an RF modem
that is fresh from the manufacturer.
10.3.1
Modem Parameter Configuration
The following materials must be present for configuration of the RF modem:
122 | P a g e
•
•
•
RS-232 DB-9 male-female cable
Computer with DB-9 male connector (a USB<->serial cable can be used instead),
Microsoft Windows XP, Vista, or 7, and the Digi X-CTU software installed.
TTS Software & Configuration disc
To configure the RF modem, first ensure the following conditions are satisfied:
•
•
Ensure the device is connected to a stable power source during the entire
process (it is recommended that the is powered from a standard AC receptacle)
The device is connected to the computer using the serial cable and the port
number is noted (this can be found using the Device Manager)
Follow each step below to configure the Repeater RF Modem:
9. Open the Digi X-CTU software from the computer.
10. Select the serial port corresponding to the RF modem connection on the “PC
Settings” tab. Leave the other parameters at their default.
11. Click the “Terminal” tab
12. Locate and open the text file on the TTS Software & Configuration disc named
“RepeaterModemParameters.txt”
NOTE: The following step will tell you to enter a sequence of symbols to force the
device into a configuration mode. If the steps for entering the parameters are not
completely promptly, the device will automatically exit configuration mode and
all steps of this section must be repeated.
13. Do not type anything into the terminal window for 5 seconds.
14. Type the following sequence of symbols without the quotations (do not press
the enter key): “+++”
15. Do not type anything into the terminal window until the modem responds with
“OK” in the terminal window. (This should take about 1 second).
16. Enter each of the commands outlined in the “RepeaterModemParameters.txt”
text file, pressing enter after each one. The modem will respond with “OK” after
each command is successfully entered.
Follow the steps in the “Verification” section to ensure the RF modem configuration was
successful.
10.3.2
Verification
The following steps ensure the Repeater RF Modem was configured successfully. Ensure
the conditions from the previous section still hold true, that the Digi X-CTU software is
still opened with the correct Serial Port chosen, and that the
“RepeaterModemParameters.txt” file is still open.
5. Do not type anything into the terminal window for 5 seconds.
123 | P a g e
6. Type the following sequence of symbols without the quotations (do not press
the enter key): “+++”
7. Do not type anything into the terminal window until the modem responds with
“OK” in the terminal window. (This should take about 1 second).
8. Enter
the
commands
in
the
verification
section
of
the
“RepeaterModemParameters.txt” text file one at a time, ensuring the expected
result listed is the text file is received.
If all the commands returned the expected output values, the Repeater RF Modem is
properly configured and may be removed from power and installed in its permanent
location.
Please note that this verification ensures that the RF modem is properly configured, but
does not ensure that the RF modem will function as expected as a repeater in an
existing tracking system. After the RF modem is installed, a range test must be
conducted to ensure the repeater is in fact repeating the signal to the Receiving RF
Modem. The modem must be in range of a network of repeaters that reach the
receiving node, or in range of the receiving node itself.
10.4 TRACKING DEVICE RF MODEM
The TTS Tracking Device RF Modem receives its configuration automatically during
device boot-up since this is built into the TTS firmware. There is, therefore, no required
configuration or re-configuration by the user. If this RF modem needs to be reconfigured
due to a bug fix or system enhancement, a new version of the TTS firmware must be
created with the changes.
The user may want to know the source address of the RF modem on a particular TTS
tracking device to make changes to the map software. The address is listed on the
exterior casing of the tracking device module itself; however, it may be determined via a
debugging connection to a computer as well. The steps for the former are listed in the
following section.
10.4.1
Retrieving the Source Address
The following materials must be present for uploading new TTS firmware to the tracking
device:
•
•
•
RS-232 DB-9 male-female cable
Computer with DB-9 male connector (a USB<->serial cable can be used instead),
and Microsoft Windows XP, Vista, or 7
Any serial monitoring software (the Arduino IDE software on the TTS Software &
Configuration disc may be used)
To upload new TTS firmware to the tracking device, first ensure the following conditions
are satisfied:
124 | P a g e
•
•
Ensure the device is connected to a stable power source during the entire
process (it is recommended that the device be removed from the vehicle being
tracked and powered from a standard AC receptacle)
The device is connected to the computer using the serial cable and the port
number is noted (this can be found using the Device Manager)
Follow each step below to upload the new TTS firmware:
1.
2.
3.
4.
Click Tools->Serial Monitor
Remove the power from the device and then reconnect
Wait for about 10-15 seconds.
The device will output a series of debug and configuration items. One of the
items will state that the source address was set to XXXX (where XXXX is a valid
hexadecimal value. ex: A4C5)
The hexadecimal source address outputted is the address of the TTS Tracking Device RF
Modem. The device may now be powered down and disconnected from the computer.
10.5 DATA RECEIVING & PROCESSING SERVER
10.5.1
Installation Instructions
1. Insert the TTS Software & Configuration disc into the PC
2. Run the Setup.exe file
3. After the setup is complete, modify the TTS.exe.config file with the database
connection string.
4. Double click on the TTS icon
5. TTS should now be running on your machine.
10.6 TROUBLESHOOTING
10.6.1
Tracking Device
The device isn’t transmitting the location data to the receiving node.
First verify that the device still does not transmit data after placing it in a location which
is in range of the receiving antenna and that has ample GPS signal. Then connect the
powered tracking device to a computer using the serial cable (or combination of serial
cable and serial<->USB convertor). Next, launch any serial monitor program (the
Arduino IDE software that is included with the TTS Software & Configuration disc is
125 | P a g e
recommended). Power the device off and then back on, and observe the output on the
serial monitor which will provide useful debugging information relating to the RF
modem and GPS.
If there is no GPS signal, the debug output will note this through the serial output. If
there is GPS signal but the RF modem is not functioning properly, you will see something
similar to the following:
Entering Command Mode…
Address Set to…
In normal operations the first line about would be followed by an “OK” and the second
line by a hexadecimal value. Above we can see that there are no such values, which
points to an issue with the RF modem. Ensure the RF modem is seated properly in the
tracking device and if so, the RF modem may be defective.
10.6.2
RF Modems (Receiving and Repeater)
During the modem parameter configuration, there is no “OK” response from the RF
modem on the serial terminal output.
This may be caused by one of the following reasons:
1. The RF modem is not properly connected to the computer through the serial
cable and to power
2. The correct serial port is not selected in the X-CTU software. (Check Device
Manager under the Control Panel in Windows to ensure the correct choice is
selected)
3. The user is not waiting 5 seconds before entering the “+++” sequence to enter
command mode
4. The user is pressing the enter key immediately after the “+++” sequence instead
of waiting for the “OK” response. (The enter key should never be pressed when
using the “+++” sequence
The Receiving RF modem is not receiving any data
Place one of the TTS Tracking Devices near the receiving antenna and ensure that it is
powered on and receiving a GPS signal (you can use the debug output of the tracking
device to verify this). Use the X-CTU terminal output tab to see if there is any data being
received from the modem. If there is, there may be a problem with the TTS data
receiving software. If not, there may be a problem with the RF modem itself. Ensure
that all data, power, and antenna connections are properly connected. Additionally, run
126 | P a g e
through the verification portion of the Receiving RF Modem Parameter Configuration
earlier in the User Manual.
The Repeater RF modem is not increasing the range of the tracking system
First ensure the repeater is connected to power properly. Next, ensure the modem is
configured properly by running through the verification portion of the Repeater RF
Modem Parameter Configuration earlier in the User Manual. If these are both properly
configured, the Repeater Antenna is most likely not in range of the Receiving Antenna or
there is a large amount of interference inhibiting the signal. Move the repeater system
closer to the receiving antenna to test is this is the problem.
10.6.3
Data Receiving & Processing Server
A database error is being presented in the command line output of the Data
Processing & Receiving server.
If you receive a database error, ensure that the database connection string is correct
and you have the rights to access to the database.
11 Budget & Financing
11.1 BILL OF MATERIALS
The following is list of material derived from detailed systems engineering and analysis
performed by the team. After close discussions with the sponsor of the project
regarding customer expectations, the system designed consisted of these items to meet
all requirements. Some items were provided by UCF due to existing ownership, such as
computers and servers, and are marked as such in the tables. Parts in this list may be
changed depending on the specific site implementation if the system if to be recreated
at a new site. The parts that specifically may be altered are those relating to the
receiving and repeater systems, as larger antennas or a different quantity of repeater
may be used. Quotes are listed from the desired vendor for each item. Vendors were
chosen on the basis of cost, reliability, customer support, and item stock. While the
listed vendors were the top choices, as long as the items purchased match the exact
part numbers listed the design will function as expected.
In Table 23 below, a list of the hardware parts that are required for development
purposes is shown. These parts are required to build a working prototype of the design
before implementing a solid, manufacturable product.
127 | P a g e
Table 23 - Hardware Development Bill of Materials
System Item
Manufacturer
Description
Part Number
Quote
Quote Source
Qty
Extended
Price
RF Modem
(Client)
Digi
XT09-PK-RA
$0.00
(Property of
UCF)
2
$0.00
GPS
USGlobalSat
EM-406A GPS
$59.95
Sparkfun.com
1
$59.95
GPS Shield
SparkFun
9XTend - 1W
transceiver,
w/RPSMA
connector,
115000 bps,
industrial
20 Channel
EM-406A SiRF
III Receiver
with Antenna
GPS Shield
GPS-09817
$16.95
Sparkfun.com
1
$16.95
Dev board /
shield headers
SparkFun
Arduino
Stackable
Header - 6 Pin
PRT-09280
$0.50
Sparkfun.com
5
$2.50
Dev board /
shield headers
SparkFun
Arduino
Stackable
Header - 8 Pin
PRT-09279
$0.50
Sparkfun.com
5
$2.50
Accelerometer
Sparkfun/Ana
log Devices
SEN-00843
$39.95
Sparkfun.com
1
$39.95
Microcontroller
Dev board
Arduino
Dual Axis
Acceleromete
r Breakout
Board ADXL213AE
+/-1.2g
Arduino Mega
2560
Arduino Mega
2560
$64.95
Sparkfun.com
1
$64.95
RF Modem /
dev board
interface
SparkFun
DigiXTend
Modem
Breakout
BOB-09596
$1.95
Sparkfun.com
1
$1.95
Development
workstation
(Manufacture
r is irrelevant)
Development
workstation
computer
(Provided by
team)
$0.00
(Provided by
team)
1
$0.00
TOTAL
$188.75
In Table 24 below, a list of the software parts that are required for development
purposes is shown. These parts are required to build a working prototype of the design
before implementing a solid, manufacturable product.
128 | P a g e
Table 24 - Software Development Bill of Materials
System Item
Manufacturer
Description
Part Number
Quote
Quote Source
Qty
Extended
Price
Microcontroller
code
development
software
Data collection
and processing
IDE
Arduino
Arduino
Development
Environment
Arduino 0021
- Windows
$0.00
arduino.cc
1
$0.00
Microsoft
Visual C++
Express
Edition 2010
$0.00
Microsoft.co
m
1
$0.00
Web Design
Software
Adobe
Microsoft
Visual Studio
C++ Express
Edition
Adobe
Dreamweaver
Dreamweaver
CS5
$0.00
(Provided by
team)
1
$0.00
Database
Oracle (open
source)
MySQL
Community
Edition
Database
$0.00
mysql.com
1
$0.00
RF modem
management
software
PHP runtime
components
Digi
X-CTU
$0.00
Digi
1
$0.00
The PGP
Group (open
source)
$0.00
php.net
1
$0.00
phpMyAdmin
phpMyAdmin
devel team
(open source)
Oracle
PHP web
scripting
language
runtime
MySQL
management
tool
Java Runtime
Environment
(JRE)
MySQL
Community
Server
(5.1.53) –
Windows
version
v5.1.4.1 Windows
version
PHP 5.3.3 –
linux version
phpMyAdmin
3.3.8.1 – linux
version
JRE SE 6
$0.00
phpmyadmin.
net
1
$0.00
$0.00
oracle.com
1
$0.00
Managed code
runtime
environment
TOTAL
$0.00
In Table 25 below, a list of the parts that are required for the Mobile Tracking Device is
shown. These parts are required to build one tracking device module to support one
shuttle bus. This is the only part list that requires that quantities be scaled to
accommodate for additional shuttle buses.
Table 25 - Mobile Tracking Device Bill of Materials
System Item
RF Modem
Manufacturer
Digi
Part Number
Description
XT09-SI
9XTend - 1W
transceiver,
w/RPSMA
connector,
115000 bps,
industrial
Quote
Quote
Source
Qty
Extende
d Price
$179.99
Digi
$179.99
1
129 | P a g e
System Item
RF Mobile
Antenna
Manufacturer
Digi
Part Number
Description
Quote
Quote
Source
Qty
A09-HASM675
900 MHz, 6"
half wave, (2.1
dBi)
articulating,
RPSMA
connector
Digikey
Sparkfun.c
om
$59.95
1
Advanced
Circuits
$52.80
1
$20.00
$20.00
1
GPS
USGlobalSat
EM-406A
20 Channel
EM-406A SiRF
III Receiver
with Antenna
PCB
Advanced
Circuits
(custom
order)
Custom Order
PCB Board
Newark
$22.39
1
$59.95
Microcontroller
Atmel
ATMEGA2560
-16AU
ATMEL ATMEGA256016AU - IC, 8BIT
MCU, AVR,
16MHZ, TQFP100
Microcontroller
: Crystal
Oscillator
Citizen
Finetech
Miyota
HC49US16.000MABJUB
CRYSTAL
16.000 MHZ
18PF HC49/US
Digikey
$0.63
1
Microcontroller
: Capacitor
Kemet
C0805C220J5
GACTU
CAP CERAMIC
22PF 50V NP0
0805
Digikey
$0.01
2
Microcontroller
: Capacitor
Kemet
C0805C104K1
RACTU
CAP CER .10UF
100V X7R 0805
Digikey
$0.35
4
Microcontroller
: Resistor
Vishay/Dale
CRCW080510
K0JNEA
RES 10K OHM
1/8W 5% 0805
SMD
Digikey
0.77
1
RS232
TE
Connectivity
5745781-4
CONN D-SUB
RECPT R/A
9POS 30GOLD
Digikey
$2.90
1
1N4148-T
DIODE
SWITCHING
75V 500MW
DO-35
Digikey
$0.26
2
BC557
TRANS PNP
45V 100MA
TO-92
Digikey
$0.58
1
BC547
TRANS NPN
45V 100MA
TO-92
Digikey
$0.52
1
RS232:Diode
Diodes Inc
RS232:Transist
or
Fairchild
Semiconducto
r
RS232:Transist
or
Fairchild
Semiconducto
r
Extende
d Price
$52.80
$22.39
$0.63
$0.02
$1.42
$0.77
$2.90
$0.52
$0.58
$0.52
130 | P a g e
System Item
Manufacturer
Part Number
Description
Quote
Quote
Source
Qty
RS232:Capacito
r
Panasonic
EEE1VA100W
R
CAP 10UF 35V
ALUM ELECT
Digikey
$0.50
1
Vishay/Dale
CRCW080510
K0JNEA
RES 10K OHM
1/8W 5% 0805
SMD
Digikey
$0.77
4
Vishay/Dale
CRCW08051K
00JNEA
RES 1.0K OHM
1/8W 5% 0805
SMD
Digikey
$0.77
1
Vishay/Dale
CRCW08054K
70JNEA
RES 4.7K OHM
1/8W 5% 0805
SMD
Digikey
$0.77
1
Digikey
$0.88
1
RS232:Resistor
RS232:Resistor
RS232:Resistor
Power
CUI Inc
PJ-102AH
CONN PWR
JACK
2.1X5.5MM
HIGH CUR
Power: DC-DC
Convertor
Texas
Instruments
PT78HT205H
REGULATOR 5V
2A 3PSIP HORZ
Digikey
$21.60
1
Power:
Capacitor
Kemet
C0805C105Z3
VACTU
CAP 1.0UF 25V
CERAMIC Y5V
0805
Digikey
$0.20
1
Power:
Capacitor
Panasonic
EEE1VA101UP
CAP 100UF 35V
ALUM ELECT
Digikey
$0.77
1
Accelerometer
Analog
Devices Inc
ADXL213AE
IC ACCELER
DUAL AXIS
DGTL 8-CLCC
Digikey
$16.41
1
Accelerometer:
Capacitor
Kemet
C0805C104K1
RACTU
CAP CER .10UF
100V X7R 0805
Digikey
$0.35
3
Vishay/Dale
CRCW08051
M00JNEA
RES 1.0M OHM
1/8W 5% 0805
SMD
Digikey
$0.77
1
JST Sales
America Inc
CONN
HEADER SH
6POS TOP
1MM TIN
BM06B-SRSSTB(LF)(SN)
Bud
Industries
BOX ABS
5.07" X
3.57"X 1.59"
BLK
CU-389
Digikey
$6.70
1
Various
Assorted selftapping
screws
(various)
Ace
Hardware
$1.00
4
Accelerometer:
Resistor
GPS: Header
Enclosure
RF Modem
mounting
screws
Extende
d Price
$0.50
$3.08
$0.77
$0.77
$0.88
$21.60
$0.20
$0.77
$16.41
$1.06
$0.77
$0.72
Digikey
$0.72
1
$6.70
$1.00
131 | P a g e
System Item
Manufacturer
Part Number
Description
Quote
Quote
Source
Qty
TOTAL
Extende
d Price
$427.80
In Table 26, a list of the parts that are required for the Tracking Data Receiving System is
shown. These parts include all items in the communication circuit from the radio tower
to the first server the data is received by. This same list can be used for a repeater
system if needed.
Table 26 - Tracking Device Receiving System / Repeater System Bill of Materials
System Item
High Gain
Antenna
Waterproof RF
Modem
Antenna to
Waterproof RF
modem cable
TOTAL
Manufacturer
Description
Part Number
Quote
Quote Source
Qty
Extended
Price
A09-F8NF-M
ANT 8.1DBI
65" BASE
STATION W/N
Digikey.
com
$217.00
1
$217.00
Digi
XT09-4EI-RA
XTend-PKG
900 MHz,
NEMA 4, RS232/422/485,
external
antenna
connector
Digi.co
m
$499.00
1
$499.00
Digi
JT2N1-CL110F
CONN CBL
RPTNC MALEN C MALE 10'
Digikey.
com
$39.90
1
$39.90
Digi
$755.90
In Table 27 below, a list of the parts that are required for the Data Acquisition &
Processing Server is shown. This is simply the server, which was supplied by UCF, and
any software required.
132 | P a g e
Table 27 - Data Acquisition / Database Server Bill of Materials
System
Item
Manufacturer
Description
Part
Number
Quote
Quote
Source
Qty
Extended Price
Server
(Manufacturer
is irrelevant)
(Property
of UCF)
$0.00
(Property of
UCF)
1
$0.00
Operating
System
Microsoft
2GHz, 2GB
RAM, 40GB
HDD,
USB2.0,
100Mbps
NIC
Windows XP
Professional
32-bit
E8504026
$0.00
(Property of
UCF)
1
$0.00
Database
Oracle (open
source)
MySQL
Community
Edition
Database
$0.00
mysql.com
1
$0.00
RF modem
manageme
nt software
Digi
X-CTU
MySQL
Community
Server
(5.1.53) –
Windows
version
v5.1.4.1 Windows
version
$0.00
Digi
1
$0.00
TOTAL
$149.00
In Table 28 below, a list of the parts that are required for the Web Server is shown. This
is simply the server, which was supplied by UCF, and any software required.
Table 28 - Web Server Bill of Materials
System Item
Manufacturer
Description
Part
Number
Quote
Quote Source
Qty
Extended
Price
Server
(Manufacturer
is irrelevant)
(Property
of UCF)
$0.00
(Property of
UCF)
1
$0.00
Server
Operating
System
HTTP Server
Canonical
(open source)
2GHz, 4GB
RAM, 40GB
HDD, USB2.0,
100Mbps NIC
Ubuntu
Server Linux
10.04 64-bit
Apache HTTP
Web Server
(“httpd”)
N/A
$0.00
ubuntu.com
1
$0.00
$0.00
httpd.apache.o
rg
1
$0.00
PHP runtime
components
The PGP Group
(open source)
Apache
HTTP
Server
2.2.17 –
linux
version
PHP 5.3.3 –
linux
version
$0.00
php.net
1
$0.00
The Apache
Software
Foundation
(open source)
PHP web
scripting
language
runtime
133 | P a g e
System Item
Manufacturer
Description
Part
Number
Quote
Quote Source
Qty
Extended
Price
phpMyAdmin
phpMyAdmin
devel team
(open source)
MySQL
management
tool
phpMyAdm
in 3.3.8.1 –
linux
version
$0.00
phpmyadmin.n
et
1
$0.00
TOTAL
$0.00
The following totals in Table 29 describe the estimated system cost applied to specific
numbers of shuttle buses that are to be tracked. Twenty-five buses is the latest
estimate received by the team as the number of buses that UCF is looking to track. The
estimated system cost for n buses is included to tailor the system to a custom number
of buses. As it can be seen from the table, the cost is variable only based on the mobile
tracking device. The other infrastructure components will be able to accommodate
additional buses by design.
Table 29 - Summary of Bill of Materials
Development
Mobile Tracking Device
1 Bus
$188.75
$427.80
25 Buses
$188.75
$10695.00
“n” Buses
$188.75
$427.80 * n
$755.90
$753.00
$753.00
Tracking Data Receiving
Device
Data
Acquisition/Database
Server
Web Server
$0.00
$0.00
$0.00
$0.00
$0.00
$0.00
TOTAL:
$1372.45
$11636.75
$944.65 + n*$427.80
It must be noted that to produce more than few of the mobile tracking devices would
require a large amount of time for the team designing this project, mainly due to limited
resources and hand soldering the PCB board. As stated earlier in the document, if UCF
decides to adapt the design to allow for the tracking of all shuttle buses, it would be the
most cost effective and reliable solution to allow for the TTS team to continue to
product the software and PCB boards, while allowing UCF personnel or a third party
group to create the tracking device enclosures and install the antenna systems.
134 | P a g e
11.2 FINANCING
Financing for the project was provided by UCF under the sponsorship of David Norvell,
Director of Sustainability and Energy Management for the University of Central Florida.
The University of Central Florida would like to know the location of buses at all times for
management purposes as well as bus route optimizations. By carefully monitoring and
scheduling shuttle buses, energy can be conserved and emissions can be reduced. This
system also brings upon huge positive impacts to the budget of the university through
the students' use of the shuttle transportation system. If students are able to view the
current location of the next bus for their route, they are more likely to ride the bus since
they will have a better estimate of the time of arrival. Additionally, UCF shuttle
management will be able to better ensure that the buses arrive on time, providing the
students with a very reliable and attractive service. Increased student usage of the
shuttle system leads to less cars on campus, meaning less parking lots and garages that
need to be built and maintained. With environmental issues a pressing topic in today's
society, any chance to improve energy costs is very beneficial. Overall, the system aims
to greatly reduce cost for the university while providing a highly reliable service for the
students.
12 Project Milestone Schedule
Designing of this system of this magnitude takes careful planning. This ensures that
deadlines are met, as well as no parts of the design are overlooked. The journey began
with defining a project. Here is where a problem was taken, and a solution began to be
developed. The next phase was the research. This is where the means of creating that
solution was being discovered. At this stage, the project took many different directions
based on the findings of the research. If an initial idea became illogical based on
research, a new idea was created. This is also where the types of hardware and software
to be used were chosen. The next step was the designing of the system. This is where
the project started to take the shape. Here the software and hardware were looked at
closer, and the basic skeleton of the project was created. Next a prototype was
developed. This is where the design was created into a physical unit. This unit was
important because it can then be tested so bugs can be fixed before the true build
occurs. Following the prototype was the initial testing phase. This is where the
prototype was put through thorough testing in the hopes of exposing bugs. The
prototype was modified as needed based on the problems found in the testing.
An overall view of the schedule can be seen in the Gantt chart format in Figure 55
below.
135 | P a g e
Figure 55- Gantt Chart
Once the system is deemed working as expected, the system can now be built. This is
where the final design of the system is taken and each unit for the shuttles is created, as
well as the base station and the software. This helps expose problems the system will
endure so they can be fixed before it is delivered to the users. The final stage consists of
delivering the system to the users as well as completing the documentation for the
project. A more detailed schedule including specific dates is seen in Table 30 below.
Table 30 - Detailed Schedule
Task Name
Duration
Start
Finish
Definition
Define Project
Research
GPS Receiver
RF Modems
Mobile Application Development
Design
Hardware
Microcontroller
TTS Transmitter
TTS Receiver
Software
21 days
21 days
23 days
23 days
23 days
23 days
38 days
19 days
19 days
19 days
19 days
11 days
Wed 8/25/10
Wed 8/25/10
Wed 9/22/10
Wed 9/22/10
Wed 9/22/10
Wed 9/22/10
Mon 10/25/10
Mon 10/25/10
Mon 10/25/10
Mon 10/25/10
Mon 10/25/10
Wed 12/1/10
Wed 9/22/10
Wed 9/22/10
Fri 10/22/10
Fri 10/22/10
Fri 10/22/10
Fri 10/22/10
Wed 12/15/10
Thu 11/18/10
Thu 11/18/10
Thu 11/18/10
Thu 11/18/10
Wed 12/15/10
136 | P a g e
Task Name
Duration
Start
Finish
Data Management
Microcontroller
Database
Web Application
Prototype
Hardware
Microcontroller
TTS Transmitter
TTS Receiver
Software
Data Management
Microcontroller
Database
Web Application
Test
Single Unit
Full System
Final
Final System Complete
Documentation
Presentation
11 days
11 days
11 days
11 days
34 days
34 days
34 days
34 days
34 days
24 days
11 days
24 days
14 days
24 days
55 days
23 days
24 days
17 days
1 day
12 days
46 days
Wed 12/1/10
Wed 12/1/10
Wed 12/1/10
Wed 12/1/10
Wed 12/1/10
Wed 12/1/10
Wed 12/1/10
Wed 12/1/10
Wed 12/1/10
Wed 12/15/10
Wed 12/15/10
Wed 12/15/10
Wed 12/29/10
Wed 12/15/10
Mon 1/17/11
Mon 1/17/11
Tue 3/1/11
Fri 4/1/11
Fri 4/18/11
Fri 4/1/11
Mon 4/18/11
Wed 12/15/10
Wed 12/15/10
Wed 12/15/10
Wed 12/15/10
Mon 1/17/11
Mon 1/17/11
Mon 1/17/11
Mon 1/17/11
Mon 1/17/11
Mon 1/17/11
Wed 12/29/10
Mon 1/17/11
Mon 1/17/11
Mon 1/17/11
Fri 4/1/11
Wed 2/16/11
Fri 4/1/11
Mon 4/25/11
Fri 4/18/11
Mon 4/25/11
Fri 4/22/11
13 Final Project Summary & Conclusions
This project began with a need. Currently the second largest university in the nation, the
University of Central Florida boasts an enormous community, full of students, staff, and
faculty. Each day, the campus is plagued with heavy traffic, and no available parking.
This problem continues to increase each year, parallel to the overall population. While
the school makes efforts to help alleviate this issue by building more parking garages
and expanding parking lots, it is simply not enough to cure it completely. Another
resource available to help this cause is the university’s complementary shuttle transit
system. This service, available at no charge, runs daily from roughly 6:30 in the morning
to 10:00 at night. Not only is this service provided for transit on campus, but it includes
several routes off campus to many of the major local housing developments. The
unfortunate part about this free service is the fact that its convenience is not realized by
a good majority of the student population. Students lack trust in the reliability of the
system, and quickly make the choice to use their own personal vehicle for their
commute. Thus the problem arises, how to raise awareness and draw popularity to the
137 | P a g e
shuttle system. This problem provided the foundation for which the Transit Tracking
System was created.
The TTS project incorporates a medley of hardware and software to track the
university’s shuttles, and to provide the user population with a graphical interface of
each bus location in real-time. The overall design selected for this project provides a fast
and efficient way for accomplishing its goal. Each bus has its own tracking device, where
GPS and accelerometer information is collected, packaged, and transmitted through the
RF modem. At the radio tower on campus, the data collection and processing server
gathers this data, unpacks it, and stores it into the database. Each time a new package is
received from the bus, a new entry is inserted into the database. The web application
connects to the database, to retrieve live data and update the map accordingly. The
client is able to access the web application through their web browser on their
workstation. Additionally, administrative users have access to a password-protected
interface, where they have the ability to modify the data. These administrative functions
include adding and removing routes, modifying route paths, adding and removing bus
stops, adding and removing administrators, and setting the active status of the routes,
buses, and bus stops.
The final product developed in this project should have a very positive impact on the
UCF community. This tracking system should substantially increase the reliability of the
transit system, drawing more students towards riding the bus and not using their own
personal vehicles. This snowballing effect should eventually help to improve the heavy
traffic and parking situation that exists at the university. An extension may be made in
the future to develop mobile applications for the tracking system. This effort will
guarantee a further increase in the user population and satisfaction, because of the high
popularity in smartphones today. Said application will provide users with a similar
graphical interface, displaying the real-time positions of the buses. Having this
convenience on-the-go should entice many more individuals to utilize the
complementary shuttle transit system.
138 | P a g e
14 Resources
14.1 CONSULTANTS & SUPPLIERS
Mr. David Norvell
Sustainability & Energy Management
The University of Central Florida
[email protected]
407-823-0970
14.2 FACILITIES & EQUIPMENT
Several facilities and pieces of equipment were used for the project. The receiving rf
antenna and modem was placed on the rooftop of the residential Tower II building on
campus. Additionally, a repeater modem and antenna was placed on the rooftop of the
Physical Sciences building.be used for the project. For assembling and testing the
electronic components several tools such as soldering irons and volt meters were
available to the team in the Senior Design Laboratory. The Senior Design lab is exclusive
for students enrolled in Senior Design to utilize for design building purposes. Personal
automobiles were be used during the development and testing phases of the project to
ensure design functionality and quality.
139 | P a g e
Appendix A: References
A.1 References
A.1.1 Bibliography
•
•
•
•
•
•
Automatic Vehicle Location (AVL) Services: For Minnesota’s Electric Utility
Industry. Publication by United Service Group, November 2003
http://gigaom.com/cleantech/smart-grid-debate-licensed-vs-unlicensedwireless-spectrum/
http://en.wikipedia.org/wiki/Gps
http://en.wikipedia.org/wiki/Mobile_phone_tracking
http://en.wikipedia.org/wiki/Multilateration
http://en.wikipedia.org/wiki/Radio_navigation
A.2 Permissions
A.2.1 Figure Reprint Permissions
The following includes permissions, either emails or legal notices, for any reprinted
figures, tables, or pictures taken from websites, datasheets, and other forms of media.
Each image throughout the document has subtext denoting that it was reprinted with
permission from the owner company. These are the permissions from the owners.
A-1 | P a g e
A.2.1.1 SparkFun
A-2 | P a g e
A.2.1.2 Texas Instruments
A-3 | P a g e
A-4 | P a g e
A.2.1.3 Atmel
A-5 | P a g e
A-6 | P a g e
A-7 | P a g e
A-8 | P a g e
A.2.1.4 US GlobalSat
A-9 | P a g e
A-10 | P a g e
A.2.1.5 Analog Devices
A-11 | P a g e
A-12 | P a g e
A-13 | P a g e
A.2.1.6 Digi
The following boxed in text states that one must not reproduce the content from the
Digi website for commercial purposes or for profit. Since this is a non-profit educational
project the images reproduced do not violate these terms.
A-14 | P a g e
A-15 | P a g e
A-16 | P a g e
A.3 Screenshot Permissions
The following includes permissions, either emails or legal notices, for any screenshots
taken of software being used in the project. Since these are screenshots by the team of
software that is obtained by purchase or through free use licensing, the legal guidelines
are different from a reprinted figure or table. Each image throughout the document has
subtext denoting that it is a screenshot taken with permission from the owner company.
These are the permissions from the owners.
A.3.1.1 Microsoft
A-17 | P a g e
A-18 | P a g e
A-19 | P a g e
A.3.1.2 Google
A-20 | P a g e
A-21 | P a g e
A-22 | P a g e
A-23 | P a g e
A-24 | P a g e
A.3.1.3 Arduino
A-25 | P a g e
A-26 | P a g e
A-27 | P a g e