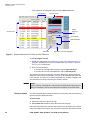
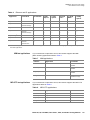
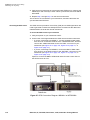
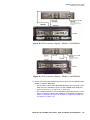
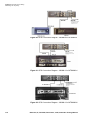
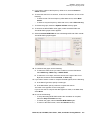
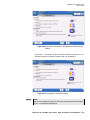
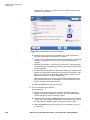
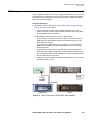
1
T-BERD ⁄ MTS 8000 and T-BERD ⁄ MTS 6000A
Transport Module, 40/100G Transport Module, and
Multiple Services Application Module
PDH, SONET, SDH, NextGen, and OTN Testing Manual
T-BERD ⁄ MTS 8000 and T-BERD ⁄ MTS 6000A
Transport Module, 40/100G Transport Module,
and Multiple Services Application Module
PDH, SONET, SDH, NextGen, and OTN Testing Manual
Communications Test and Measurement Solutions
One Milestone Center Court
Germantown, Maryland 20876-7100 USA
Toll Free 1-855-ASK-JDSU • Tel +1-240-404-2999 • Fax +1-240-404-2195
www.jdsu.com
Notice
Every effort was made to ensure that the information in this manual was accurate at the time of printing. However, information is subject to change without
notice, and JDS Uniphase reserves the right to provide an addendum to this
manual with information not available at the time that this manual was created.
Copyright
© Copyright 2012 JDS Uniphase Corporation. All rights reserved. JDSU, Communications Test and Measurement Solutions, and its logo are trademarks of
JDS Uniphase Corporation (“JDS Uniphase”). All other trademarks and registered trademarks are the property of their respective owners. No part of this
guide may be reproduced or transmitted electronically or otherwise without
written permission of the publisher.
Copyright release
Reproduction and distribution of this guide is authorized for Government purposes only.
Trademarks
JDS Uniphase, JDSU, MTS 6000A, T-BERD 6000A, MTS 8000, and
T-BERD 6000A are trademarks or registered trademarks of JDS Uniphase in
the United States and/or other countries.
Wireshark is a registered trademark of the Wireshark Foundation.
All trademarks and registered trademarks are the property of their respective
companies.
Terms and conditions
Specifications, terms, and conditions are subject to change without notice. The
provision of hardware, services, and/or software are subject to JDSU’s standard terms and conditions, available at www.jdsu.com/terms.
FCC Notice
This equipment has been tested and found to comply with the limits for a Class
A digital device, pursuant to Part 15 of the FCC Rules. These limits are
designed to provide reasonable protection against harmful interference when
the equipment is operated in a commercial environment. This equipment generates, uses, and can radiate radio frequency energy and, if not installed and
used in accordance with the instruction manual, may cause harmful interference to radio communications. Operation of this equipment in a residential
area is likely to cause harmful interference in which case the user will be
required to correct the interference at their own expense.
Ordering information
The catalog number for a printed getting started manual is ML-21138652. The
catalog number for a printed testing manual is ML-21148871. The catalog number for electronic manuals on USB is CEML-21138299.
WEEE and Battery Directive
Compliance
JDSU has established processes in compliance with the Waste Electrical and
Electronic Equipment (WEEE) Directive, 2002/96/EC, and the Battery Directive, 2006/66/EC.
This product, and the batteries used to power the product, should not be disposed of as unsorted municipal waste and should be collected separately and
disposed of according to your national regulations. In the European Union, all
equipment and batteries purchased from JDSU after 2005-08-13 can be
returned for disposal at the end of its useful life. JDSU will ensure that all waste
equipment and batteries returned are reused, recycled, or disposed of in an
environmentally friendly manner, and in compliance with all applicable national
and international waste legislation.
ii
PDH, SONET, SDH, NextGen, and OTN Testing Manual
It is the responsibility of the equipment owner to return equipment and batteries
to JDSU for appropriate disposal. If the equipment or battery was imported by
a reseller whose name or logo is marked on the equipment or battery, then the
owner should return the equipment or battery directly to the reseller.
Instructions for returning waste equipment and batteries to JDSU can be found
in the Environmental section of JDSU’s web site at www.jdsu.com. If you have
questions concerning disposal of your equipment or batteries, contact JDSU’s
WEEE Program Management team at [email protected].
PDH, SONET, SDH, NextGen, and OTN Testing Manual
iii
iv
PDH, SONET, SDH, NextGen, and OTN Testing Manual
Contents
About this Manual
xiii
Assumptions . . . . . . . . . . . . . . . . . . . . . . . . . . . . . . . . . . . . . . . . . . . . . . . xiv
Terminology . . . . . . . . . . . . . . . . . . . . . . . . . . . . . . . . . . . . . . . . . . . . . . . . xiv
PDH, SONET, SDH, NextGen, and OTN Testing Manual . . . . . . . . . . . . . xvi
Conventions . . . . . . . . . . . . . . . . . . . . . . . . . . . . . . . . . . . . . . . . . . . . . . . xvii
Safety and compliance information . . . . . . . . . . . . . . . . . . . . . . . . . . . . xviii
Technical assistance . . . . . . . . . . . . . . . . . . . . . . . . . . . . . . . . . . . . . . . . xviii
Chapter 1
Chapter 2
Basic Testing
1
Step 2: Configuring a test . . . . . . . . . . . . . . . . . . . . . . . . . . . . . . . . . . . . . .
Step 3: Connecting the instrument to the circuit . . . . . . . . . . . . . . . . . . .
Step 4: Starting the test. . . . . . . . . . . . . . . . . . . . . . . . . . . . . . . . . . . . . . . .
Step 5: Viewing test results . . . . . . . . . . . . . . . . . . . . . . . . . . . . . . . . . . . .
Setting the result group and category . . . . . . . . . . . . . . . . . . . . . . . . . . .
Additional test result information . . . . . . . . . . . . . . . . . . . . . . . . . . . . . . .
Running multiple tests . . . . . . . . . . . . . . . . . . . . . . . . . . . . . . . . . . . . . . . .
2
3
4
4
4
5
5
T-Carrier and PDH Testing
7
Features and capabilities . . . . . . . . . . . . . . . . . . . . . . . . . . . . . . . . . . . . 8
Understanding the LED panel . . . . . . . . . . . . . . . . . . . . . . . . . . . . . . . . . 9
Understanding the graphical user interface. . . . . . . . . . . . . . . . . . . . . . . 9
Understanding T-Carrier and PDH test results . . . . . . . . . . . . . . . . . . . . 9
T-Carrier test applications . . . . . . . . . . . . . . . . . . . . . . . . . . . . . . . . . . . 10
PDH test applications . . . . . . . . . . . . . . . . . . . . . . . . . . . . . . . . . . . . . . 10
Fractional T1 testing . . . . . . . . . . . . . . . . . . . . . . . . . . . . . . . . . . . . . . . . . .11
Loopback testing . . . . . . . . . . . . . . . . . . . . . . . . . . . . . . . . . . . . . . . . . . . . .11
Looping up MUX devices . . . . . . . . . . . . . . . . . . . . . . . . . . . . . . . . . . . 12
Defining custom loop codes . . . . . . . . . . . . . . . . . . . . . . . . . . . . . . . . . 12
Verifying performance. . . . . . . . . . . . . . . . . . . . . . . . . . . . . . . . . . . . . . . . 16
Measuring round trip delay. . . . . . . . . . . . . . . . . . . . . . . . . . . . . . . . . . . . 17
PDH, SONET, SDH, NextGen, and OTN Testing Manual
v
Contents
Chapter 3
vi
Measuring service disruption time . . . . . . . . . . . . . . . . . . . . . . . . . . . . . .
Monitoring the circuit . . . . . . . . . . . . . . . . . . . . . . . . . . . . . . . . . . . . . . . .
Analyzing PCM signals . . . . . . . . . . . . . . . . . . . . . . . . . . . . . . . . . . . . . . .
Test modes . . . . . . . . . . . . . . . . . . . . . . . . . . . . . . . . . . . . . . . . . . . . . .
Trunk type signaling. . . . . . . . . . . . . . . . . . . . . . . . . . . . . . . . . . . . . . . .
Standard E & M signaling . . . . . . . . . . . . . . . . . . . . . . . . . . . . . . . .
Loop start signaling . . . . . . . . . . . . . . . . . . . . . . . . . . . . . . . . . . . . .
Ground start signaling . . . . . . . . . . . . . . . . . . . . . . . . . . . . . . . . . . .
Connecting a headset . . . . . . . . . . . . . . . . . . . . . . . . . . . . . . . . . . . . . .
Specifying call settings. . . . . . . . . . . . . . . . . . . . . . . . . . . . . . . . . . . . . .
Monitoring a call. . . . . . . . . . . . . . . . . . . . . . . . . . . . . . . . . . . . . . . . . . .
Placing or receiving calls . . . . . . . . . . . . . . . . . . . . . . . . . . . . . . . . . . . .
Observing call results . . . . . . . . . . . . . . . . . . . . . . . . . . . . . . . . . . . . . .
Analyzing VF circuits . . . . . . . . . . . . . . . . . . . . . . . . . . . . . . . . . . . . . . . . .
VF tests . . . . . . . . . . . . . . . . . . . . . . . . . . . . . . . . . . . . . . . . . . . . . . . . .
Quiet tone test . . . . . . . . . . . . . . . . . . . . . . . . . . . . . . . . . . . . . . . . .
Holding tone test . . . . . . . . . . . . . . . . . . . . . . . . . . . . . . . . . . . . . . .
Three tone test . . . . . . . . . . . . . . . . . . . . . . . . . . . . . . . . . . . . . . . .
Single tone test . . . . . . . . . . . . . . . . . . . . . . . . . . . . . . . . . . . . . . . .
Frequency sweep test . . . . . . . . . . . . . . . . . . . . . . . . . . . . . . . . . . .
Impulse noise test . . . . . . . . . . . . . . . . . . . . . . . . . . . . . . . . . . . . . .
User-defined signaling bits . . . . . . . . . . . . . . . . . . . . . . . . . . . . . . .
Running VF analysis tests . . . . . . . . . . . . . . . . . . . . . . . . . . . . . . . . . . .
Observing VF results . . . . . . . . . . . . . . . . . . . . . . . . . . . . . . . . . . . . . . .
ISDN PRI testing . . . . . . . . . . . . . . . . . . . . . . . . . . . . . . . . . . . . . . . . . . . . .
Features and capabilities. . . . . . . . . . . . . . . . . . . . . . . . . . . . . . . . . . . .
Specifying General settings . . . . . . . . . . . . . . . . . . . . . . . . . . . . . . . . . .
Specifying Call settings . . . . . . . . . . . . . . . . . . . . . . . . . . . . . . . . . . . . .
Specifying Decode filter settings . . . . . . . . . . . . . . . . . . . . . . . . . . . . . .
Placing calls. . . . . . . . . . . . . . . . . . . . . . . . . . . . . . . . . . . . . . . . . . . . . .
Receiving calls. . . . . . . . . . . . . . . . . . . . . . . . . . . . . . . . . . . . . . . . . . . .
Inserting voice traffic into a call . . . . . . . . . . . . . . . . . . . . . . . . . . . . . . .
Performing BER analysis of a call . . . . . . . . . . . . . . . . . . . . . . . . . . . . .
Transmitting DTMF tones . . . . . . . . . . . . . . . . . . . . . . . . . . . . . . . . . . .
Disconnecting a call. . . . . . . . . . . . . . . . . . . . . . . . . . . . . . . . . . . . . . . .
Observing ISDN PRI results . . . . . . . . . . . . . . . . . . . . . . . . . . . . . . . . .
18
20
20
21
21
21
21
23
24
24
25
26
27
27
28
28
28
28
28
28
29
29
29
32
32
33
33
35
37
37
38
39
40
41
41
41
SONET and SDH Testing
43
Features and capabilities. . . . . . . . . . . . . . . . . . . . . . . . . . . . . . . . . . . .
Understanding the LED panel . . . . . . . . . . . . . . . . . . . . . . . . . . . . . . . .
Understanding the graphical user interface . . . . . . . . . . . . . . . . . . . . . .
Understanding SONET and SDH test results . . . . . . . . . . . . . . . . . . . .
SONET and SDH test modes . . . . . . . . . . . . . . . . . . . . . . . . . . . . . . . .
SONET test applications . . . . . . . . . . . . . . . . . . . . . . . . . . . . . . . . . . . .
SDH test applications . . . . . . . . . . . . . . . . . . . . . . . . . . . . . . . . . . . . . .
STM-1e test applications. . . . . . . . . . . . . . . . . . . . . . . . . . . . . . . . .
STM-1 test applications. . . . . . . . . . . . . . . . . . . . . . . . . . . . . . . . . .
STM-4 test applications. . . . . . . . . . . . . . . . . . . . . . . . . . . . . . . . . .
STM-16 test applications. . . . . . . . . . . . . . . . . . . . . . . . . . . . . . . . .
STM-64 test applications. . . . . . . . . . . . . . . . . . . . . . . . . . . . . . . . .
STM-256 test applications. . . . . . . . . . . . . . . . . . . . . . . . . . . . . . . .
Measuring optical power . . . . . . . . . . . . . . . . . . . . . . . . . . . . . . . . . . . . . .
Running J-Scan . . . . . . . . . . . . . . . . . . . . . . . . . . . . . . . . . . . . . . . . . . . . .
Displaying a map of the signal structure . . . . . . . . . . . . . . . . . . . . . . . .
Sorting the channels . . . . . . . . . . . . . . . . . . . . . . . . . . . . . . . . . . . . . . .
44
45
45
45
46
46
49
50
52
54
55
57
58
59
60
60
61
PDH, SONET, SDH, NextGen, and OTN Testing Manual
Contents
Chapter 4
Scanning the map . . . . . . . . . . . . . . . . . . . . . . . . . . . . . . . . . . . . . . . . .
Testing a channel . . . . . . . . . . . . . . . . . . . . . . . . . . . . . . . . . . . . . . . . .
Using Restart to reset the status . . . . . . . . . . . . . . . . . . . . . . . . . . . . . .
Understanding J-Scan results . . . . . . . . . . . . . . . . . . . . . . . . . . . . . . . .
Re-scanning the circuit . . . . . . . . . . . . . . . . . . . . . . . . . . . . . . . . . . . . .
BER testing . . . . . . . . . . . . . . . . . . . . . . . . . . . . . . . . . . . . . . . . . . . . . . . .
Specifying a BERT pattern . . . . . . . . . . . . . . . . . . . . . . . . . . . . . . . . . .
Running a BER test. . . . . . . . . . . . . . . . . . . . . . . . . . . . . . . . . . . . . . . .
Detecting the received BER pattern . . . . . . . . . . . . . . . . . . . . . . . . . . .
Drop and insert testing . . . . . . . . . . . . . . . . . . . . . . . . . . . . . . . . . . . . . . .
Inserting errors, anomalies, alarms, and defects . . . . . . . . . . . . . . . . . .
Inserting errors or anomalies. . . . . . . . . . . . . . . . . . . . . . . . . . . . . . . . .
Inserting alarms or defects . . . . . . . . . . . . . . . . . . . . . . . . . . . . . . . . . .
Measuring round trip delay. . . . . . . . . . . . . . . . . . . . . . . . . . . . . . . . . . . .
Measuring service disruption time . . . . . . . . . . . . . . . . . . . . . . . . . . . . .
Viewing a TOH group. . . . . . . . . . . . . . . . . . . . . . . . . . . . . . . . . . . . . . . . .
Manipulating overhead bytes . . . . . . . . . . . . . . . . . . . . . . . . . . . . . . . . . .
Capturing POH bytes. . . . . . . . . . . . . . . . . . . . . . . . . . . . . . . . . . . . . . . . .
Specifying the J0 or J1 identifier . . . . . . . . . . . . . . . . . . . . . . . . . . . . . . .
Inserting the C2 Path signal label . . . . . . . . . . . . . . . . . . . . . . . . . . . . . .
Manipulating K1 or K2 APS bytes . . . . . . . . . . . . . . . . . . . . . . . . . . . . . .
Manipulating the S1 byte . . . . . . . . . . . . . . . . . . . . . . . . . . . . . . . . . . . . .
Adjusting pointers . . . . . . . . . . . . . . . . . . . . . . . . . . . . . . . . . . . . . . . . . . .
Adjusting pointers manually . . . . . . . . . . . . . . . . . . . . . . . . . . . . . . . . .
Adjusting pointers using pointer stress sequences . . . . . . . . . . . . . . . .
Verifying performance. . . . . . . . . . . . . . . . . . . . . . . . . . . . . . . . . . . . . . . .
Monitoring the circuit . . . . . . . . . . . . . . . . . . . . . . . . . . . . . . . . . . . . . . . .
61
62
63
63
63
63
63
64
65
66
68
69
69
70
71
72
73
74
75
77
79
80
81
81
82
84
85
Jitter and Wander Testing
87
Features and capabilities . . . . . . . . . . . . . . . . . . . . . . . . . . . . . . . . . . . 88
Understanding the graphical user interface. . . . . . . . . . . . . . . . . . . . . . 89
Accessing jitter and wander test results . . . . . . . . . . . . . . . . . . . . . . . . 89
Jitter and wander test applications . . . . . . . . . . . . . . . . . . . . . . . . . . . . 89
Before testing. . . . . . . . . . . . . . . . . . . . . . . . . . . . . . . . . . . . . . . . . . . . . . . 93
Transmitting jitter . . . . . . . . . . . . . . . . . . . . . . . . . . . . . . . . . . . . . . . . . . . 93
Manually measuring jitter . . . . . . . . . . . . . . . . . . . . . . . . . . . . . . . . . . . . . 95
Automatic Measurement Sequences . . . . . . . . . . . . . . . . . . . . . . . . . . . . 96
Measuring jitter tolerance . . . . . . . . . . . . . . . . . . . . . . . . . . . . . . . . . . . 96
Measuring the jitter transfer function . . . . . . . . . . . . . . . . . . . . . . . . . . 101
Transmitting wander . . . . . . . . . . . . . . . . . . . . . . . . . . . . . . . . . . . . . . . . 103
Measuring and analyzing wander . . . . . . . . . . . . . . . . . . . . . . . . . . . . . 104
Measuring TIE and calculating MTIE . . . . . . . . . . . . . . . . . . . . . . . . . 104
Analyzing wander . . . . . . . . . . . . . . . . . . . . . . . . . . . . . . . . . . . . . . . . 105
Saving and exporting wander measurement data. . . . . . . . . . . . . . . . 108
1PPS Analysis . . . . . . . . . . . . . . . . . . . . . . . . . . . . . . . . . . . . . . . . . . . . . 109
PDH, SONET, SDH, NextGen, and OTN Testing Manual
vii
Contents
Chapter 5
viii
NextGen Testing
113
Features and capabilities . . . . . . . . . . . . . . . . . . . . . . . . . . . . . . . . . . . .
Using LEDs as a guide when testing . . . . . . . . . . . . . . . . . . . . . . . . . . .
Test 1: SONET/SDH physical layer . . . . . . . . . . . . . . . . . . . . . . . .
Test 2: VCAT verification . . . . . . . . . . . . . . . . . . . . . . . . . . . . . . . .
Test 3: LCAS verification . . . . . . . . . . . . . . . . . . . . . . . . . . . . . . . .
Test 4: BER analysis . . . . . . . . . . . . . . . . . . . . . . . . . . . . . . . . . . .
Test 5: GFP and Ethernet analysis . . . . . . . . . . . . . . . . . . . . . . . .
About the NextGen user interface . . . . . . . . . . . . . . . . . . . . . . . . . . . . .
Understanding the LED panel . . . . . . . . . . . . . . . . . . . . . . . . . . . . . . .
BERT LEDs . . . . . . . . . . . . . . . . . . . . . . . . . . . . . . . . . . . . . . . . . .
GFP LEDs . . . . . . . . . . . . . . . . . . . . . . . . . . . . . . . . . . . . . . . . . . .
Understanding the graphical user interface . . . . . . . . . . . . . . . . . . . . .
Create VCG quick configuration button. . . . . . . . . . . . . . . . . . . . .
Edit VCG quick configuration button . . . . . . . . . . . . . . . . . . . . . . .
Rx VCG Member Selection field . . . . . . . . . . . . . . . . . . . . . . . . . .
Enable LCAS. . . . . . . . . . . . . . . . . . . . . . . . . . . . . . . . . . . . . . . . .
Add All buttons . . . . . . . . . . . . . . . . . . . . . . . . . . . . . . . . . . . . . . .
Signal Structure tab . . . . . . . . . . . . . . . . . . . . . . . . . . . . . . . . . . . .
LED Panel . . . . . . . . . . . . . . . . . . . . . . . . . . . . . . . . . . . . . . . . . . .
VCG Member Selection for Error Insertion . . . . . . . . . . . . . . . . . .
VCG Analysis soft key. . . . . . . . . . . . . . . . . . . . . . . . . . . . . . . . . .
Understanding the NextGen test results . . . . . . . . . . . . . . . . . . . . . . .
About the NextGen test modes . . . . . . . . . . . . . . . . . . . . . . . . . . . . . .
Monitor mode . . . . . . . . . . . . . . . . . . . . . . . . . . . . . . . . . . . . . . . .
Terminate mode . . . . . . . . . . . . . . . . . . . . . . . . . . . . . . . . . . . . . .
NextGen SONET applications . . . . . . . . . . . . . . . . . . . . . . . . . . . . . . .
OC-3 applications . . . . . . . . . . . . . . . . . . . . . . . . . . . . . . . . . . . . .
OC-12 applications . . . . . . . . . . . . . . . . . . . . . . . . . . . . . . . . . . . .
OC-48 applications . . . . . . . . . . . . . . . . . . . . . . . . . . . . . . . . . . . .
OC-192 applications . . . . . . . . . . . . . . . . . . . . . . . . . . . . . . . . . . .
NextGen SDH test applications . . . . . . . . . . . . . . . . . . . . . . . . . . . . . .
STM-1 test applications. . . . . . . . . . . . . . . . . . . . . . . . . . . . . . . . .
STM-4 test applications. . . . . . . . . . . . . . . . . . . . . . . . . . . . . . . . .
STM-16 test applications. . . . . . . . . . . . . . . . . . . . . . . . . . . . . . . .
STM-64 test applications. . . . . . . . . . . . . . . . . . . . . . . . . . . . . . . .
Configuring NextGen tests . . . . . . . . . . . . . . . . . . . . . . . . . . . . . . . . . . .
Running classic SONET/SDH tests . . . . . . . . . . . . . . . . . . . . . . . . . . . .
VCG testing. . . . . . . . . . . . . . . . . . . . . . . . . . . . . . . . . . . . . . . . . . . . . . . .
Creating a VCG for analysis . . . . . . . . . . . . . . . . . . . . . . . . . . . . . . . .
Specifying VCG settings . . . . . . . . . . . . . . . . . . . . . . . . . . . . . . . . . . .
Adding or deleting VCG members . . . . . . . . . . . . . . . . . . . . . . . . . . . .
Inserting SONET or SDH errors and alarms . . . . . . . . . . . . . . . . . . . .
Analyzing a VCG . . . . . . . . . . . . . . . . . . . . . . . . . . . . . . . . . . . . . . . . .
Manipulating overhead bytes. . . . . . . . . . . . . . . . . . . . . . . . . . . . . . . .
LCAS testing. . . . . . . . . . . . . . . . . . . . . . . . . . . . . . . . . . . . . . . . . . . . . . .
Enabling LCAS . . . . . . . . . . . . . . . . . . . . . . . . . . . . . . . . . . . . . . . . . .
Monitoring the LCAS MST status for VCG members . . . . . . . . . . . . .
Adding or removing members . . . . . . . . . . . . . . . . . . . . . . . . . . . . . . .
BER testing . . . . . . . . . . . . . . . . . . . . . . . . . . . . . . . . . . . . . . . . . . . . . . . .
GFP testing . . . . . . . . . . . . . . . . . . . . . . . . . . . . . . . . . . . . . . . . . . . . . . . .
Specifying GFP settings. . . . . . . . . . . . . . . . . . . . . . . . . . . . . . . . . . . .
Specifying Ethernet and IP settings . . . . . . . . . . . . . . . . . . . . . . . . . . .
Transmitting and analyzing GFP traffic . . . . . . . . . . . . . . . . . . . . . . . .
Inserting GFP errors or alarms . . . . . . . . . . . . . . . . . . . . . . . . . . . . . .
114
115
115
115
115
116
116
116
116
116
117
118
118
118
118
118
118
119
119
119
119
119
119
120
120
121
122
123
124
124
126
126
128
130
132
133
133
134
134
135
136
137
139
140
142
142
143
143
143
144
144
145
145
146
PDH, SONET, SDH, NextGen, and OTN Testing Manual
Contents
Chapter 6
Chapter 7
Monitoring NextGen circuits. . . . . . . . . . . . . . . . . . . . . . . . . . . . . . . . . .
Monitoring the circuit for BERT errors . . . . . . . . . . . . . . . . . . . . . . . . .
Monitoring a circuit carrying GFP traffic . . . . . . . . . . . . . . . . . . . . . . .
Capturing POH bytes. . . . . . . . . . . . . . . . . . . . . . . . . . . . . . . . . . . . . . . .
147
147
147
148
OTN Testing
149
Features and capabilities . . . . . . . . . . . . . . . . . . . . . . . . . . . . . . . . . .
Understanding the LED panel . . . . . . . . . . . . . . . . . . . . . . . . . . . . . . .
Understanding the graphical user interface. . . . . . . . . . . . . . . . . . . . .
Understanding OTN test results . . . . . . . . . . . . . . . . . . . . . . . . . . . . .
OTN test applications . . . . . . . . . . . . . . . . . . . . . . . . . . . . . . . . . . . . .
Specifying the Tx clock source . . . . . . . . . . . . . . . . . . . . . . . . . . . . . . .
Specifying channels or timeslots. . . . . . . . . . . . . . . . . . . . . . . . . . . . . .
BER testing layer 1 . . . . . . . . . . . . . . . . . . . . . . . . . . . . . . . . . . . . . . . . .
Configuring 1 GigE, 10 GigE, 100 GigE LAN traffic . . . . . . . . . . . . . . .
Configuring OTN with SONET or SDH Clients . . . . . . . . . . . . . . . . . . .
Measuring optical power. . . . . . . . . . . . . . . . . . . . . . . . . . . . . . . . . . . . .
Inserting errors, anomalies, alarms, and defects . . . . . . . . . . . . . . . . .
Inserting errors or anomalies. . . . . . . . . . . . . . . . . . . . . . . . . . . . . . . .
Inserting alarms or defects . . . . . . . . . . . . . . . . . . . . . . . . . . . . . . . . .
Observing and manipulating overhead bytes. . . . . . . . . . . . . . . . . . . .
Scrambling the signal . . . . . . . . . . . . . . . . . . . . . . . . . . . . . . . . . . . . . . .
FEC testing. . . . . . . . . . . . . . . . . . . . . . . . . . . . . . . . . . . . . . . . . . . . . . . .
GMP Mapping. . . . . . . . . . . . . . . . . . . . . . . . . . . . . . . . . . . . . . . . . . . . . .
GFP Mapping . . . . . . . . . . . . . . . . . . . . . . . . . . . . . . . . . . . . . . . . . . . . . .
Specifying SM, PM, and TCM trace identifiers . . . . . . . . . . . . . . . . . . .
Specifying the transmitted and expected payload type. . . . . . . . . . . .
BER testing . . . . . . . . . . . . . . . . . . . . . . . . . . . . . . . . . . . . . . . . . . . . . . .
Measuring service disruption time . . . . . . . . . . . . . . . . . . . . . . . . . . . .
150
151
154
154
154
156
157
158
158
159
159
160
160
161
161
163
163
164
165
166
170
171
172
Test Results
175
Summary Status results . . . . . . . . . . . . . . . . . . . . . . . . . . . . . . . . . . . . .
T-Carrier and PDH results . . . . . . . . . . . . . . . . . . . . . . . . . . . . . . . . . . . .
LEDs (TestPad mode) . . . . . . . . . . . . . . . . . . . . . . . . . . . . . . . . . . . . .
LEDs (ANT mode) . . . . . . . . . . . . . . . . . . . . . . . . . . . . . . . . . . . . . . . .
Interface test results . . . . . . . . . . . . . . . . . . . . . . . . . . . . . . . . . . . . . .
Frame test results . . . . . . . . . . . . . . . . . . . . . . . . . . . . . . . . . . . . . . . .
BERT test results . . . . . . . . . . . . . . . . . . . . . . . . . . . . . . . . . . . . . . . .
Channel test results. . . . . . . . . . . . . . . . . . . . . . . . . . . . . . . . . . . . . . .
Traffic test results . . . . . . . . . . . . . . . . . . . . . . . . . . . . . . . . . . . . . . . .
ISDN test results . . . . . . . . . . . . . . . . . . . . . . . . . . . . . . . . . . . . . . . . .
Stats . . . . . . . . . . . . . . . . . . . . . . . . . . . . . . . . . . . . . . . . . . . . . . .
Call states . . . . . . . . . . . . . . . . . . . . . . . . . . . . . . . . . . . . . . . . . . .
VF results . . . . . . . . . . . . . . . . . . . . . . . . . . . . . . . . . . . . . . . . . . . . . .
SONET/SDH results . . . . . . . . . . . . . . . . . . . . . . . . . . . . . . . . . . . . . . . . .
SONET and SDH LEDs (TestPad mode) . . . . . . . . . . . . . . . . . . . . . .
......................................................
SONET and SDH LEDs (ANT mode) . . . . . . . . . . . . . . . . . . . . . . . . .
CFP Auto-FIFO Reset . . . . . . . . . . . . . . . . . . . . . . . . . . . . . . . . . . . . .
Interface test results . . . . . . . . . . . . . . . . . . . . . . . . . . . . . . . . . . . . . .
STL Stat results . . . . . . . . . . . . . . . . . . . . . . . . . . . . . . . . . . . . . . . . . .
176
177
177
178
179
180
183
183
183
183
183
185
185
187
188
189
190
191
192
192
PDH, SONET, SDH, NextGen, and OTN Testing Manual
ix
Contents
STL Per Lane results . . . . . . . . . . . . . . . . . . . . . . . . . . . . . . . . . . . . . .
Section/RSOH test results . . . . . . . . . . . . . . . . . . . . . . . . . . . . . . . . . .
Line/MSOH test results . . . . . . . . . . . . . . . . . . . . . . . . . . . . . . . . . . . .
Path/HP test results . . . . . . . . . . . . . . . . . . . . . . . . . . . . . . . . . . . . . . .
LP/VT test results . . . . . . . . . . . . . . . . . . . . . . . . . . . . . . . . . . . . . . . .
Payload BERT test results . . . . . . . . . . . . . . . . . . . . . . . . . . . . . . . . . .
Service Disruption Results. . . . . . . . . . . . . . . . . . . . . . . . . . . . . . . . . .
SD Summary . . . . . . . . . . . . . . . . . . . . . . . . . . . . . . . . . . . . . . . . .
SD Details . . . . . . . . . . . . . . . . . . . . . . . . . . . . . . . . . . . . . . . . . . .
SD Statistics . . . . . . . . . . . . . . . . . . . . . . . . . . . . . . . . . . . . . . . . .
TCM test results. . . . . . . . . . . . . . . . . . . . . . . . . . . . . . . . . . . . . . . . . .
T1.231 test results . . . . . . . . . . . . . . . . . . . . . . . . . . . . . . . . . . . . . . . .
ITU-T recommended performance test results . . . . . . . . . . . . . . . . . . .
HP, LP, RS, MS, ISM, and OOS designations . . . . . . . . . . . . . . . . . . .
NE and FE designations . . . . . . . . . . . . . . . . . . . . . . . . . . . . . . . . . . .
Performance result descriptions . . . . . . . . . . . . . . . . . . . . . . . . . . . . .
Jitter results . . . . . . . . . . . . . . . . . . . . . . . . . . . . . . . . . . . . . . . . . . . . . . .
HB, WB, Ext Band, and User-band designations . . . . . . . . . . . . . . . .
Jitter results, Summary group . . . . . . . . . . . . . . . . . . . . . . . . . . . .
Jitter results, Interface group. . . . . . . . . . . . . . . . . . . . . . . . . . . . .
Graphical and Tabular jitter results . . . . . . . . . . . . . . . . . . . . . . . . . . .
Jitter Graph . . . . . . . . . . . . . . . . . . . . . . . . . . . . . . . . . . . . . . . . . .
MTJ Graph and Table . . . . . . . . . . . . . . . . . . . . . . . . . . . . . . . . . .
JTF Graph . . . . . . . . . . . . . . . . . . . . . . . . . . . . . . . . . . . . . . . . . . .
Wander results . . . . . . . . . . . . . . . . . . . . . . . . . . . . . . . . . . . . . . . . . . . . .
1PPS Analysis Results . . . . . . . . . . . . . . . . . . . . . . . . . . . . . . . . . . . . . .
NextGen results . . . . . . . . . . . . . . . . . . . . . . . . . . . . . . . . . . . . . . . . . . . .
Common NextGen results . . . . . . . . . . . . . . . . . . . . . . . . . . . . . . . . . .
NextGen LEDs. . . . . . . . . . . . . . . . . . . . . . . . . . . . . . . . . . . . . . . . . . .
VCAT LEDs . . . . . . . . . . . . . . . . . . . . . . . . . . . . . . . . . . . . . . . . . .
LCAS LEDs . . . . . . . . . . . . . . . . . . . . . . . . . . . . . . . . . . . . . . . . . .
GFP LEDs . . . . . . . . . . . . . . . . . . . . . . . . . . . . . . . . . . . . . . . . . . .
VCAT results . . . . . . . . . . . . . . . . . . . . . . . . . . . . . . . . . . . . . . . . . . . .
LCAS results . . . . . . . . . . . . . . . . . . . . . . . . . . . . . . . . . . . . . . . . . . . .
Member Status . . . . . . . . . . . . . . . . . . . . . . . . . . . . . . . . . . . . . . .
Errors . . . . . . . . . . . . . . . . . . . . . . . . . . . . . . . . . . . . . . . . . . . . . .
Group . . . . . . . . . . . . . . . . . . . . . . . . . . . . . . . . . . . . . . . . . . . . . .
GFP results . . . . . . . . . . . . . . . . . . . . . . . . . . . . . . . . . . . . . . . . . . . . .
Error Stats . . . . . . . . . . . . . . . . . . . . . . . . . . . . . . . . . . . . . . . . . . .
Rx Traffic . . . . . . . . . . . . . . . . . . . . . . . . . . . . . . . . . . . . . . . . . . . .
Tx Traffic . . . . . . . . . . . . . . . . . . . . . . . . . . . . . . . . . . . . . . . . . . . .
OTN results . . . . . . . . . . . . . . . . . . . . . . . . . . . . . . . . . . . . . . . . . . . . . . . .
OTN LEDs (TestPad mode) . . . . . . . . . . . . . . . . . . . . . . . . . . . . . . . . .
OTN LEDs (ANT mode). . . . . . . . . . . . . . . . . . . . . . . . . . . . . . . . . . . .
Interface test results . . . . . . . . . . . . . . . . . . . . . . . . . . . . . . . . . . . . . .
FEC test results . . . . . . . . . . . . . . . . . . . . . . . . . . . . . . . . . . . . . . . . . .
Framing test results . . . . . . . . . . . . . . . . . . . . . . . . . . . . . . . . . . . . . . .
OTL Stats results . . . . . . . . . . . . . . . . . . . . . . . . . . . . . . . . . . . . . . . . .
OTL Per Lane results. . . . . . . . . . . . . . . . . . . . . . . . . . . . . . . . . . . . . .
OTU test results. . . . . . . . . . . . . . . . . . . . . . . . . . . . . . . . . . . . . . . . . .
ODU test results . . . . . . . . . . . . . . . . . . . . . . . . . . . . . . . . . . . . . . . . .
FTFL test results . . . . . . . . . . . . . . . . . . . . . . . . . . . . . . . . . . . . . . . . .
TCM1 - TCM 6 test results. . . . . . . . . . . . . . . . . . . . . . . . . . . . . . . . . .
OPU results . . . . . . . . . . . . . . . . . . . . . . . . . . . . . . . . . . . . . . . . . . . . .
GMP results . . . . . . . . . . . . . . . . . . . . . . . . . . . . . . . . . . . . . . . . . . . . .
GFP-T results . . . . . . . . . . . . . . . . . . . . . . . . . . . . . . . . . . . . . . . . . . .
x
PDH, SONET, SDH, NextGen, and OTN Testing Manual
193
194
195
196
198
199
200
200
200
200
200
201
202
202
202
202
204
204
204
205
206
207
207
207
207
208
209
209
210
210
210
211
211
212
212
212
213
213
213
214
215
216
216
219
220
221
222
223
224
225
226
227
227
228
228
230
Contents
Chapter 8
GFP results . . . . . . . . . . . . . . . . . . . . . . . . . . . . . . . . . . . . . . . . . . . . .
Payload BERT results . . . . . . . . . . . . . . . . . . . . . . . . . . . . . . . . . . . . .
Graphical results . . . . . . . . . . . . . . . . . . . . . . . . . . . . . . . . . . . . . . . . . . .
Histogram results . . . . . . . . . . . . . . . . . . . . . . . . . . . . . . . . . . . . . . . . . .
Event Log results. . . . . . . . . . . . . . . . . . . . . . . . . . . . . . . . . . . . . . . . . . .
Time test results . . . . . . . . . . . . . . . . . . . . . . . . . . . . . . . . . . . . . . . . . . .
231
233
233
234
234
235
Troubleshooting
237
Before testing. . . . . . . . . . . . . . . . . . . . . . . . . . . . . . . . . . . . . . . . . . . . . . 238
The test application I need is not available. . . . . . . . . . . . . . . . . . 238
Can I hot-swap PIMs? . . . . . . . . . . . . . . . . . . . . . . . . . . . . . . . . . 238
How can I determine whether I need to swap a PIM or swap SFP transceivers? . . . . . . . . . . . . . . . . . . . . . . . . . . . . . . . . . . . . . . . . . . . . 238
I am receiving unexpected errors when running optical applications .
238
Optical Overload Protection message . . . . . . . . . . . . . . . . . . . . . 239
User interface is not launching . . . . . . . . . . . . . . . . . . . . . . . . . . . 239
Inconsistent test results . . . . . . . . . . . . . . . . . . . . . . . . . . . . . . . . 239
Result values are blank . . . . . . . . . . . . . . . . . . . . . . . . . . . . . . . . 239
Unit on far end will not loop up . . . . . . . . . . . . . . . . . . . . . . . . . . . 239
A receiving instrument is showing many bit errors . . . . . . . . . . . . 239
Which MSAM or application module is selected? . . . . . . . . . . . . . 240
VF testing . . . . . . . . . . . . . . . . . . . . . . . . . . . . . . . . . . . . . . . . . . . . . . . . . 240
Voice frequency measurements are not available . . . . . . . . . . . . 240
Upgrades and options. . . . . . . . . . . . . . . . . . . . . . . . . . . . . . . . . . . . . . . 240
How do I upgrade my instrument? . . . . . . . . . . . . . . . . . . . . . . . . 240
How do I install test options? . . . . . . . . . . . . . . . . . . . . . . . . . . . . 240
Do software and test options move with the MSAM or Transport Module? . . . . . . . . . . . . . . . . . . . . . . . . . . . . . . . . . . . . . . . . . . . . . . . . 240
Appendix A
Principles of ISDN Testing
Understanding LAPD messages . . . . . . . . . . . . . . . . . . . . . . . . . . . . . .
LAPD Unnumbered frame messages . . . . . . . . . . . . . . . . . . . . . . . . .
LAPD Supervisory frame messages . . . . . . . . . . . . . . . . . . . . . . . . . .
Q.931 messages . . . . . . . . . . . . . . . . . . . . . . . . . . . . . . . . . . . . . . . . .
Understanding the Q.931 Cause Values . . . . . . . . . . . . . . . . . . . . . . . .
Appendix B
Principles of Jitter and Wander Testing
Jitter measurements . . . . . . . . . . . . . . . . . . . . . . . . . . . . . . . . . . . . . . . .
Intrinsic jitter . . . . . . . . . . . . . . . . . . . . . . . . . . . . . . . . . . . . . . . . . . . .
Output jitter . . . . . . . . . . . . . . . . . . . . . . . . . . . . . . . . . . . . . . . . . . . . .
Jitter over time. . . . . . . . . . . . . . . . . . . . . . . . . . . . . . . . . . . . . . . . . . .
Phase hits . . . . . . . . . . . . . . . . . . . . . . . . . . . . . . . . . . . . . . . . . . . . . .
Jitter tolerance. . . . . . . . . . . . . . . . . . . . . . . . . . . . . . . . . . . . . . . . . . .
MTJ test sequence . . . . . . . . . . . . . . . . . . . . . . . . . . . . . . . . . . . .
Fast MTJ test sequence . . . . . . . . . . . . . . . . . . . . . . . . . . . . . . . .
Jitter Transfer Function (JTF) . . . . . . . . . . . . . . . . . . . . . . . . . . . . . . .
Test set calibration . . . . . . . . . . . . . . . . . . . . . . . . . . . . . . . . . . . .
JTF measurement. . . . . . . . . . . . . . . . . . . . . . . . . . . . . . . . . . . . .
About wander. . . . . . . . . . . . . . . . . . . . . . . . . . . . . . . . . . . . . . . . . . . . . .
PDH, SONET, SDH, NextGen, and OTN Testing Manual
241
242
242
243
243
244
247
248
248
248
249
249
250
250
250
250
251
251
251
xi
Contents
Wander measurements . . . . . . . . . . . . . . . . . . . . . . . . . . . . . . . . . . . . . .
Reference clock requirements . . . . . . . . . . . . . . . . . . . . . . . . . . . . . . .
Wander over time. . . . . . . . . . . . . . . . . . . . . . . . . . . . . . . . . . . . . . . . .
TIE and MTIE. . . . . . . . . . . . . . . . . . . . . . . . . . . . . . . . . . . . . . . . . . . .
Time Deviation (TDEV) . . . . . . . . . . . . . . . . . . . . . . . . . . . . . . . . . . . .
Frequency offset . . . . . . . . . . . . . . . . . . . . . . . . . . . . . . . . . . . . . .
Drift rate. . . . . . . . . . . . . . . . . . . . . . . . . . . . . . . . . . . . . . . . . . . . .
252
252
252
253
253
253
253
Glossary
255
Index
265
xii
PDH, SONET, SDH, NextGen, and OTN Testing Manual
About this Manual
This prefix explains how to use this manual. Topics discussed include the
following:
– “Purpose and scope” on page xiv
– “Assumptions” on page xiv
– “Terminology” on page xiv
– “PDH, SONET, SDH, NextGen, and OTN Testing Manual” on page xvi
– “Conventions” on page xvii
– “Safety and compliance information” on page xviii
– “Technical assistance” on page xviii
PDH, SONET, SDH, NextGen, and OTN Testing Manual
xiii
About this Manual
Purpose and scope
Purpose and scope
The purpose of this manual is to help you successfully use the PDH, SONET,
NextGen, and OTN test capabilities of the MSAM and the Transport Module.
Assumptions
This manual is intended for novice, intermediate, and experienced users who
want to use the Transport Module or Multiple Services Application Module
effectively and efficiently. We are assuming that you have basic computer
experience and are familiar with basic telecommunication concepts, terminology, and safety.
Terminology
The T-BERD 8000 is branded as the MTS-8000 in Europe, and it is interchangeably referred to as the T-BERD 8000, MTS 8000, MTS-8000, MTS8000
and Media Test Set 8000 throughout supporting documentation.
The T-BERD 6000A is branded as the MTS-6000A in Europe, and it is interchangeably referred to as the T-BERD 6000A, MTS 6000A, MTS6000A and
Media Test Set 6000 throughout supporting documentation.
The following terms have a specific meaning when they are used in this
manual:
– Assembly—Used throughout this manual to refer to a complete set of
components assembled as an instrument and used for testing. This
manual supports three assemblies: The Transport Module assembly,
consisting of an T-BERD ⁄ MTS 8000 base unit and Transport Module, the
MSAM assembly, consisting of a MSAM, Physical Interface Modules
(PIMs), and a T-BERD ⁄ MTS 6000A base unit, and a DMC assembly,
consisting of up to two MSAMs, up to four PIMs, a Dual Module Carrier
(DMC), and a T-BERD ⁄ MTS 8000 base unit.
– Application module—Used throughout this manual to refer to the component that provides test functionality to the assembled instrument. This
manual supports two application modules: the Transport Module, and the
MSAM.
– Component—Used throughout this manual to refer to an individual hardware component which is connected to the other components to build a
test instrument (assembly). This manual supports the following components: the Transport Module, the MSAM, and the DMC. The base units are
documented in separate manuals.
– T-BERD ⁄ MTS 8000 and T-BERD ⁄ MTS 6000A—The family of products,
typically a combination of a base unit, a battery module, and one or more
application modules. The Dual Module Carrier (DMC) can be used on the
T-BERD / MTS 8000 platform to test using two MSAMs.
– Base unit—The unit which connects to the application module and power
adapter, providing the user interface and a variety of connectivity and work
flow tools. If optioned to do so, the base unit also allows you to measure
emitted power, received power, and optical link loss on fiber optic
networks.
xiv
PDH, SONET, SDH, NextGen, and OTN Testing Manual
About this Manual
Terminology
– DMC—Dual Module Carrier. The DMC is a two slot chassis which you can
connect to the T-BERD / MTS 8000 base unit to test using up to two
MSAM application modules and four Physical Interface Modules (PIMs).
– MSAM Multiple Services Application Module—Referred to generically
as “the instrument” when inserted in the T-BERD / MTS 6000A base unit or
the DMC with a PIM. The MSAM provides testing functionality for the base
unit.
– PIM—The physical interface module inserted into one of up to two ports
provided on the MSAM chassis. PIMs supply the physical connectors
(interfaces) required to connect the MSAM to the circuit under test. A
variety of cables, SFPs, and XFPs are offered as options, and can used to
connect the PIMs to the circuit.
– Transport Module—Referred to generically as “the instrument” when
connected to the T-BERD / MTS 8000 base unit. The Transport Module
provides testing functionality for the base unit.
– Battery Module—The module connected to the back of the T-BERD /
MTS 8000 base unit, which supplies power whenever it is not provided
using the power adapter.
– OC-n—Used to refer to each of the optical SONET rates supported by the
instrument (OC-3, OC-12, OC-48, and OC-192), where “n” represents the
user-selected line rate.
– STM-n—Used to refer to each of the optical SDH rates supported by the
instrument (STM-1, STM-4, STM-16, and STM-64), where “n” represents
the user-selected line rate.
– STS-1—Used to refer to the electrical equivalent of OC-1 (51.84 Mbps)
supported by the instrument.
– STM-1e—Used to refer to the electrical equivalent of STM-1
(155.52 Mbps) supported by the MSAM.
– OTN—Optical Transport Network.
– OTU1—Optical Transport Unit 1. A 2.7G OTN signal designed to carry a
SONET OC-48 or SDH STM-16 client signal. OTU1 is used on the user
interface to identify the applications used for 2.7G OTN testing.
– OTU2—Optical Transport Unit 2. A 10.7G, 11.05G, or 11.1G OTN signal
designed to carry SONET OC-192, SDH STM-64, or 10GigE Ethernet
WAN and LAN client signals. OTU2 is used on the user interface to identify
the applications used for 10.7G, 11.05G, or 11.1G OTN testing.
– OTU3 — Optical transport Unit 3. A 43G OTN signal designed to carry
40Gig Bulk BERT payloads and ODU3 encoded signals. OTU3 is available
on the 40/100G High Speed Transport Module.
– OTU4 — Optical transport Unit 4. A 111.8G OTN signal designed to carry
100GigE Ethernet and Bulk BERT and ODU4 encoded signals. OTU4 is
available on the 40/100G High Speed Transport Module.
– 10/100/1000 Ethernet—Used to represent 10/100/1000 Mbps Ethernet.
– 1GigE—Used to represent 1 Gigabit Ethernet.
– 10GigE—Used to represent 10 Gigabit Ethernet.
– 40GigE—Used to represent 40 Gigabit Ethernet.
– 100GigE—Used to represent 100 Gigabit Ethernet.
– FC—Used to represent Fibre Channel.
– JDSU Ethernet test set—A test set marketed by JDSU and designed to
transmit an Acterna Test Packet (ATP) payload. ATP packets carry a time
stamp used to calculate a variety of test results. The FST-2802 TestPad,
the SmartClass Ethernet tester, the HST-3000 with an Ethernet SIM, the
PDH, SONET, SDH, NextGen, and OTN Testing Manual
xv
About this Manual
PDH, SONET, SDH, NextGen, and OTN Testing Manual
T-BERD/MTS 8000 Transport Module, and the MSAM can all be configured to transmit and analyze ATP payloads, and can be used in
end-to-end and loopback configurations during testing.
– SFP—Small form-factor pluggable module. Used throughout this manual
to represent pluggable optical modules.
– XFP—10 Gigabit small form-factor pluggable module. Used throughout
this manual to represent pluggable optical modules used to connect to the
family of 10 Gbps circuits (ranging from 9.95 Gbps to 11.3 Gbps).
– QSFP+ — 40Gigabit Quad Small Form-Factor Pluggable optical transceiver. A variety of optional QSFP+s are available for testing 40 Gigabit
fiber circuits.
– CFP — 100Gigabit Form-Factor Pluggable optical transceiver. A variety of
optional CFPs are available for testing 100Gigabit fiber circuits.
– Xv—Used as a suffix throughout the user interface for virtual channels
carried in a SONET or SDH container, where X serves as a placeholder for
the number of virtual channels, and “v” indicates that the concatenation is
virtual (rather than true concatenation). For example, if you are testing
virtual channels carried in a high order STS-3c, you would select an
STS-3c-Xv payload when you launched your application. You can then
specify the number of members (channels) when you create the virtual
channel group (VCG).
PDH, SONET, SDH, NextGen, and OTN Testing Manual
This is the PDH, SONET, SDH, NextGen, and OTN testing manual for the
MSAM and the Transport Module. The manual is application-oriented and
contains information about using these instruments to test service carried on
each of the listed networks. It includes an overview of testing features, instructions for using the instruments to generate and transmit traffic over a circuit,
and detailed test result descriptions. This manual also provides contact information for JDSU’s Technical Assistance Center (TAC).
Use this manual in conjunction with the following manuals:
– 8000 Base Unit User Manual. This manual provides an overview, specifications, and instructions for proper operation of the base unit.
– 6000A Base Unit User Manual. This manual provides an overview, specifications, and instructions for proper operation of the base unit.
– Dual Module Carrier, Transport Module, and MSAM Getting Started
Manual. This manual provides an overview of the connectors provided on
the hardware components, instructions for connecting to the circuit you are
testing, and specifications for the hardware components.
– Ethernet, IP, TCP/UDP, Triple Play, Fibre Channel, and IP Video Testing
Manual. This manual provides instructions for testing each of the services
listed, and detailed test result descriptions. When using your instrument for
NextGen and OTN testing, details concerning Ethernet settings and test
results are provided in this manual.
xvi
PDH, SONET, SDH, NextGen, and OTN Testing Manual
About this Manual
Conventions
– Remote Control Reference Manual. This manual provides the remote
control commands used when developing scripts to automate your testing.
This manual is provided electronically on jdsu.com.
NOTE:
Many applications also require you to purchase and install certain testing
options; others require specific hardware connectors to connect to circuits
for testing. For example, if your instrument does not have a connector or
PIM designed to support OC-3 testing, you can not transmit and analyze a
signal or traffic over an OC-3 circuit.
You can quickly determine whether or not your instrument supports certain
applications by exploring the technologies, rates, and test modes presented
on the Test menu and by reviewing the settings available when you configure a test.
Conventions
This manual uses conventions and symbols, as described in the following
tables.
Table 1
Typographical conventions
Description
Example
User interface actions and buttons or
switches you have to press appear in
this typeface.
Press the OK key.
Code and output messages appear in
this typeface.
All results okay
Text you must type exactly as shown
appears in this typeface.
Type: a:\set.exe in the dialog box.
Variables appear in this typeface.
Type the new hostname.
Book references appear in this typeface.
Refer to Newton’s Telecom Dictionary
Table 2
Keyboard and menu conventions
Description
Example
A plus sign +indicates simultaneous
keystrokes.
Press Ctrl+s
A comma indicates consecutive key
strokes.
Press Alt+f,s
A slanted bracket indicates choosing a
submenu from menu.
On the menu bar, click
Start > Program Files.
Table 3
Symbol conventions
This symbol represents a general hazard.
PDH, SONET, SDH, NextGen, and OTN Testing Manual
xvii
About this Manual
Safety and compliance information
This symbol represents a risk of electrical shock.
This symbol represents a risk of explosion.
This symbol represents a Note indicating related information or tip.
This symbol, located on the equipment, battery, or packaging indicates that
the equipment or battery must not be disposed of in a land-fill site or as
municipal waste, and should be disposed of according to your national regulations.
Safety and compliance information
Safety and compliance information for the instrument are provided in printed
form and ship with your instrument.
Technical assistance
Table 4 lists contact information for technical assistance. For the latest TAC
information, go to www.jdsu.com or contact your local sales office for assistance. Contact information for regional sales headquarters is listed on the back
cover of this manual.
Table 4
Technical assistance centers
Region
Phone Number
Americas
1-866-ACTERNA
(option #2)
301-353-1550
(1-866-228-3762, option #2)
[email protected]
Europe, Africa, and
Mid-East
+49 (0) 7121 86 1345
(JDSU Germany)
[email protected]
Asia and the Pacific
+852 2892 0990
(Hong Kong)
+86 10 6655 5988
(Beijing-China)
During off-hours, you can request assistance by doing one of the following:
leave a voice mail message at the Technical Assistance number, e-mail the
North American Technical Assistance Center, [email protected], or submit your
question using our online Technical Assistance Request form at
www.jdsu.com.
xviii
PDH, SONET, SDH, NextGen, and OTN Testing Manual
Chapter 1
Basic Testing
1
This chapter explains basic testing concepts and procedures common to each
PDH, SONET, SDH, NextGen, and OTN test. Detailed information about
concepts and procedures shared by all supported test applications are
provided in the Getting Started manual that shipped with your instrument or
upgrade.
Topics discussed in this chapter include the following:
– “Step 1: Selecting a test application” on page 2
– “Step 2: Configuring a test” on page 2
– “Step 3: Connecting the instrument to the circuit” on page 3
– “Step 4: Starting the test” on page 4
– “Step 5: Viewing test results” on page 4
– “Running multiple tests” on page 5
PDH, SONET, SDH, NextGen, and OTN Testing Manual
1
Chapter 1 Basic Testing
Step 1: Selecting a test application
Step 1: Selecting a test application
The Test menu on the Main screen lists each of the available test applications.
If you are testing using an MSAM, the applications are listed for the PIM or
PIMs that are inserted in your MSAM chassis. If you have a dual port chassis,
by default, the first application you select will be for port 1 (P1).
To select an application
1 Select Test. The Test menu appears.
2 Select the technology (for example, SONET), signal, payload, and test
mode for your test application.
The instrument displays a message asking you to wait while it loads the
application.
3 Wait for the Main screen to appear, and then proceed to “Step 2: Configuring a test” on page 2.
The test application is selected.
NOTE:
When testing using an MSAM, only the applications for currently inserted
PIMs will appear on the Test menu. For example, if an SFP and XFP PIM
are inserted in the MSAM chassis, you will not see DS1 applications.
Other applications, such as the NextGen GFP applications only appear if
you purchased the associated testing options.
Step 2: Configuring a test
Before you configure a test, be certain to complete the information that you
want to include when you generate reports of your test results. For details, refer
to the Getting Started manual that shipped with your instrument.
Configuring a test involves displaying the setup screens, specifying test
settings, and optionally saving the test setup. Key settings are also available
on the Main screen, on the Quick Config tabs. Changing key settings while
running a test (for example, changing the pattern transmitted) triggers an automatic restart of the test.
To display the setup screens
1 Using the Test menu, select a test application (see “Step 1: Selecting a test
application” on page 2).
2 Select the Setup soft key.
2
PDH, SONET, SDH, NextGen, and OTN Testing Manual
Chapter 1 Basic Testing
Step 3: Connecting the instrument to the circuit
A setup screen with a series of tabs appears. The tabs displayed vary
based on the test application you selected. See Figure 1.
Figure 1
Setup Screen (Ethernet Settings tab for GFP testing)
3 To navigate to a different setup screen, select the corresponding tab at the
top of the screen. For example, to display the Traffic setup screen, select
the Traffic tab.
4 After you finish specifying the test settings, select the Results soft key to
return to the Main screen.
For detailed instructions, refer to the Getting Started manual that shipped with
your instrument or upgrade, and to each of the testing chapters in this manual.
Step 3: Connecting the instrument to the circuit
For detailed instructions on connecting your instrument to the circuit, refer to
the Getting Started Manual.
When connecting the unit to optical circuits, bear in mind that applied power
must not exceed the power level specified on the panel for each optical
connector.
PDH, SONET, SDH, NextGen, and OTN Testing Manual
3
Chapter 1 Basic Testing
Step 4: Starting the test
Step 4: Starting the test
After you configure a test, connect the unit to the circuit, and, turn the laser ON,
the test starts automatically, and test results immediately accumulate.
NOTE: Temperature stabilized lasers
When testing 10 Gigabit, 40 Gigabit or 100 Gigabit optical circuits, some
lasers (particularly 1550 nm lasers) are temperature stabilized; therefore,
they need to reach a certain temperature before you can use them to transmit a signal. This is expected behavior, and does not indicate that there is
something wrong with the laser or test instrument.
It typically takes up to one minute for the temperature to stabilize. If you have
turned the laser on, but no signal is present on the receiving instrument or
device, simply wait for one minute.
After you start a test, use the buttons at the bottom of the screen to perform
actions such as turning the laser on and off, starting and stopping traffic,
starting and stopping a local loopback, and inserting errors, anomalies, alarms,
or defects.
Table 5 lists some common Action buttons.
Table 5
Action buttons
Button
Action
Laser On/Off
Turns the laser on or off when testing optical rates.
Insert Error/Anomaly
Inserts an error or anomaly into the transmitted traffic.
Insert Alarm/Defect
Inserts an alarm or defect into the transmitted traffic.
Step 5: Viewing test results
Test results appear in the Results Windows of the Main screen.
Setting the result group and
category
To set the result group and category
1 Using the Test menu, select a test application see “Step 1: Selecting a test
application” on page 2), and then configure your test (see “Step 2: Configuring a test” on page 2).
2 Select the Results soft key to return to the Main screen.
3 Connect your module to the circuit (see “Step 3: Connecting the instrument
to the circuit” on page 3).
4 If you are testing an optical interface, select the Laser button.
5 If you selected an Ethernet, Fibre Channel, or SONET/SDH GFP test
application, select the Start Traffic button to start generating and
analyzing traffic.
Results appear in the Results Windows.
4
PDH, SONET, SDH, NextGen, and OTN Testing Manual
Chapter 1 Basic Testing
Running multiple tests
6 Optional. Insert errors or anomalies into the traffic stream, or use the
Action buttons to perform other actions. These buttons only appear if applicable to your test application.
7 Use the Group and Category buttons to specify the type of results you
want to observe. Figure 2 illustrates buttons for a standard SONET application.
Figure 2
Result Group and Category buttons
Results for the category you selected appear in the result window.
8 Optional. To observe results for a different group or category in another
result window, press the buttons at the top of the window to specify the
group and category.
For descriptions of each result, refer to Chapter 7 “Test Results”.
TIP:
If you want to provide a screen shot of key test results, on the Main screen,
select Tools > Capture Screenshot. A screen shot will be captured and
stored as a JPG file in the ../acterna/user/disk/bert/images
folder. You can include the screen shot when you create reports.
Additional test result
information
For detailed information on the following topics, refer to the Getting Started
manual that shipped with your instrument or upgrade.
– Expanding and collapsing result measurements
– Changing the result layout
– Using the entire screen for results
– About histogram results
– Viewing a histogram
– About the Event log
– About result graphs
– Clearing History results
– Creating and maintaining Custom result groups
For descriptions of each result, refer to Chapter 7 “Test Results”.
Running multiple tests
You can significantly reduce your testing time by terminating traffic over
multiple circuits simultaneously.
For example, you can transmit traffic from the DS1 and DS3 PIMs to a network
element, and then loop the traffic back to your unit to analyze the signals and
verify that the network element is operating properly.
For details, refer to the Getting Started manual that shipped with your instrument or upgrade.
PDH, SONET, SDH, NextGen, and OTN Testing Manual
5
Chapter 1 Basic Testing
Running multiple tests
6
PDH, SONET, SDH, NextGen, and OTN Testing Manual
Chapter 2
T-Carrier and PDH Testing
2
This chapter provides step-by-step instructions for testing T-Carrier and PDH
networks. Topics discussed in this chapter include the following:
– “About T-Carrier and PDH testing” on page 8
– “Fractional T1 testing” on page 11
– “Loopback testing” on page 11
– “BER testing” on page 14
– “Verifying performance” on page 16
– “Measuring round trip delay” on page 17
– “Measuring service disruption time” on page 18
– “Monitoring the circuit” on page 20
– “Analyzing PCM signals” on page 20
– “Analyzing VF circuits” on page 27
– “ISDN PRI testing” on page 32
PDH, SONET, SDH, NextGen, and OTN Testing Manual
7
Chapter 2 T-Carrier and PDH Testing
About T-Carrier and PDH testing
About T-Carrier and PDH testing
If your instrument is configured and optioned to do so, you can use it to analyze
the performance of DS1 and DS3, and E1, E3, and E4 networks by performing
BER tests, and verifying that performance conforms to the industry test standards.
When you configure the instrument for T-Carrier or PDH testing, a number of
the test parameters vary depending on the protocol (T-Carrier or PDH), rate,
and payload you select.
NOTE:
You can also test muxed T-Carrier and PDH payloads when testing SONET
and SDH networks. For a list of payloads supported, see Chapter 3 “SONET
and SDH Testing”.
Features and capabilities
When testing T-Carrier and PDH service, you can generate and analyze
muxed and bulk payloads ranging from 1.544 Mbps to 139.264 Mbps for a
variety of transport rates. The module also allows supports the following:
– BERT patterns—You can transmit and detect BERT patterns for each rate
available on the instrument.
– Error/anomaly and alarm/defect insertion—You can insert a variety of
errors, anomalies, alarms, and defects into traffic, such as Bit/TSE errors
and REBE alarms.
– Performance measurement—You can verify that performance complies
with ITU-T G.821, G.826, and M.2100, and ANSI T1.510.
– Intrusive through mode testing—You can monitor a received signal in
through mode, and then pass the signal through the unit to the transmitter.
The instrument will resolve any received line code violations before transmitting the signal.
– Drop and insert testing from a SONET/SDH access point—When testing
in through mode, you can insert one channel while non-intrusively passing
the remainder of the signal through unaffected. For example, you can
monitor an OC-48 signal, and then drop a DS3 signal and insert a BER
pattern into the DS3 signal, leaving the rest of the signal as it was
received. For details, see “Drop and insert testing” on page 66 of
Chapter 3 “SONET and SDH Testing”. (N/A 40/100G Transport Module)
– Loop code insertion—You can loop up MUX devices using CSU, NIU,
HDSL (including generic device), and FEAC loop codes. You can also
optionally define up to ten user-programmable loop codes. For details, see
“Looping up MUX devices” on page 12
– DS1 loop codes can be transmitted from within a channelized DS3 application.
– Round trip delay measurement—You can verify that a circuit complies with
round trip delay requirements as specified in a customer’s service level
agreement.
– Service disruption measurements—You can measure service disruption
time resulting from signal loss or a variety of errors, anomalies, alarms, or
defects. For details, see “Measuring service disruption time” on page 18.
8
PDH, SONET, SDH, NextGen, and OTN Testing Manual
Chapter 2 T-Carrier and PDH Testing
About T-Carrier and PDH testing
– DS1 jitter measurements—If your MSAM is configured and optioned to do
so, you can measure jitter on a DS1 interface. The measurement is
provided in the Interface result group, under the Signal category. For
details, see Chapter 4 “Jitter and Wander Testing”.
– PCM signal analysis—If your instrument is configured and optioned to do
so, you can analyze signals for the robbed-bit-in-band signaling standard
by testing against different trunk types. These tests are performed from a
DS1 (T1) access point. For details, see “Analyzing PCM signals” on
page 20.
– VF call analysis—If your instrument is configured and optioned to do so,
you can establish a VF (voice frequency) call, then transmit or receive
voice or tones without dropping the call. These tests are performed from a
DS1 (T1) access point. For details, see “Analyzing VF circuits” on page 27.
– Fractional T1 testing—If your instrument is configured and optioned to do
so, you can commission and maintain fractional T1 (FT1) transmission
circuits. Typically this involves out-of-service testing to ensure that the
physical layer is clean and there are no problems with network equipment
or improper provisioning. For details, see “Analyzing PCM signals” on
page 20.
– ISDN PRI testing—If your instrument is configured and optioned to do so,
you can place and receive one ISDN call and decode/monitor the
D-Channel. For details, see “ISDN PRI testing” on page 32.
Understanding the LED panel
When you setup the instrument, you can specify whether the T-Carrier and
PDH LED panels should emulate the LEDs on the ANT platform or the TestPad
2000 platform. If the LEDs are not what you expect or are accustomed to
seeing, verify that the correct emulation mode is selected for your module.
Understanding the graphical
user interface
The names of various elements on the graphical user interface change
depending on whether you select a T-Carrier or PDH test application. For
example, the button that you use to insert errors or anomalies is labeled
Insert Error if you selected a T-Carrier application; the same button is labeled
Insert Anomaly if you selected a PDH application.
Understanding T-Carrier and
PDH test results
Many T-Carrier and PDH standards are identical; therefore, the instrument
provides similar results for both test applications. See “T-Carrier and PDH
results” on page 177 for a description of each test result.
PDH, SONET, SDH, NextGen, and OTN Testing Manual
9
Chapter 2 T-Carrier and PDH Testing
About T-Carrier and PDH testing
T-Carrier test applications
Table 6 lists each of the T-Carrier test applications.
Table 6
T-Carrier test applications
Signal
Payload Rate
Test Modes
DS1
DS1 BERT
Terminate
Through
Dual Monitor
DS1 Signaling
Terminate
Dual Monitor
DS1 ISDN PRI
Terminate
Dual Monitor
DS1 VF
Terminate
Dual Monitor
DS3 BERT
Terminate
Through
Dual Monitor
E1 BERT
Terminate
Through
Dual Monitor
DS1 BERT
Terminate
Through
Dual Monitor
DS3
PDH test applications
Table 7 lists each of the PDH test applications.
Table 7
Signal
Payload Rate
Test Modes
E1
E1 BERT
Terminate
Through
Dual Monitor
E3
E3 BERT
Terminate
Through
Monitor
E1 BERT
Terminate
Through
Monitor
E4 BERT
Terminate
Through
Monitor
E3 BERT
Terminate
Through
Monitor
E1 BERT
Terminate
Through
Monitor
E4
10
PDH test applications
PDH, SONET, SDH, NextGen, and OTN Testing Manual
Chapter 2 T-Carrier and PDH Testing
Fractional T1 testing
Fractional T1 testing
If your instrument is optioned and configured to do so, you can analyze FT1
circuits for contiguous and non-contiguous channels in 56 kbps or 64 kbps
formats.
To configure a FT1 payload
1 Using the Test Menu, select the DS1 terminate test application for the
payload rate you are testing (refer to Table 6 on page 10).
2 Select the Setup soft key. A series of setup tabs appears.
3 Select the Payload tab, then specify the following settings:
Setting
Value
Payload Type
Select Fractional Rate.
Select DSO Channels
Select the displayed channels that you want
to analyze. When selected, a green check
mark appears to the left of the channel number.
– To select all channels, select Select All.
– To clear all channels, select Clear All.
At least one channel must be selected.
Idle Code
Enter the idle code in an 8 bit format.
Tx Bit Rate
Select N x 56 or N x 64.
The FT1 payload settings are specified. You can observe test results for each
channel in the Payload result group, under the Channel and Traffic categories.
For details, see “Channel test results” on page 183 and “Traffic test results” on
page 183.
Loopback testing
You can qualify DS1 and DS3 circuit performance by transmitting traffic from a
near-end unit, and then looping the traffic through a far end unit to test for
errors or anomalies.
To loop up a far end instrument
1 Using the Test Menu, select the terminate test application for the payload
and rate you are testing (refer to Table 6 on page 10).
2 Select Loop Up.
A message appears briefly in the message bar indicating that the loop up
of the network element on the far end was successful.
3 Select Restart.
The module on the far end is looped up, and traffic is passed from the
receiver through to the transmitter back to the near-end module.
To loop down the far end module
– Select Loop Down.
A message appears briefly in the message bar indicating that the loop
down of the instrument on the far end was successful.
PDH, SONET, SDH, NextGen, and OTN Testing Manual
11
Chapter 2 T-Carrier and PDH Testing
Loopback testing
Looping up MUX devices
When testing DS1 or DS3 circuits, you can use your unit to loop up MUX
devices by transmitting loop codes. If you are testing a DS1 payload, you can
also define and store up to ten custom loop codes (see “Defining custom loop
codes” on page 12).
To transmit a loop code
1 Using the Test Menu, select the DS1 or DS3 terminate test application for
the payload rate you are testing (refer to Table 6 on page 10 for a list of
applications).
2 Select the Setup soft key. A series of setup tabs appears.
3 Select the Loop tab, and then specify the following:
Payload Rate
DS1 Loop Type/ DS3 Tx
FEAC Loop Select
Settings
DS1 BERT
HDSL
–
–
–
NIU
–
–
CSU
–
–
DS3 BERT
HDSL Model. Select the
model for the HDSL device
or Generic HLU, HDU or
HRU if model not known.
Test Direction. Specify CO
to Customer or Customer to CO.
Code Type. Specify a
Short (required for
Generic) or Long loop
code.
NIU Code. Select the NIU
code for the device.
Auto Response. Specify
Respond On or Respond
Off.
CSU Code. Select the CSU
code for the device.
Auto Response. Specify
Respond On or Respond
Off.
User Defined
See “Defining custom loop
codes” on page 12.
NIU Loop
N/A
DS3 Loop
N/A
DS1 Codes
HDSL,NIU,CSIU - See above
4 To return to the Main screen, select the Results soft key.
5 Select Loop Up.
A message appears briefly in the message bar indicating that the loop up
of the device was successful.
The MUX device is looped up, and traffic is passed from its receiver through to
its transmitter back to the near-end module.
Defining custom loop codes
12
You can define and store up to ten custom loop codes for looping up DS1 MUX
devices.
PDH, SONET, SDH, NextGen, and OTN Testing Manual
Chapter 2 T-Carrier and PDH Testing
Loopback testing
To define a custom loop code
1 Using the Test Menu, select the DS1 terminate test application for the
payload rate you are testing (refer to Table 6 on page 10 for a list of applications).
2 Select the Setup soft key. A series of setup tabs appears.
3 Select the Loop tab, and then do the following:
a In Loop Type, specify User Defined.
A list of loop codes appears, allowing you to select a previously defined
loop code, or to define a new one. See Figure 3.
Figure 3
User Defined Loop Codes
b On the list, select the loop code you want to define.
c In Loop-Code name, use the keypad to type a unique name for the loop
code using up to twenty five characters.
d In Bit Pattern, use the keypad to type the bit pattern using up to 16
digits.
e Under Type, indicate whether you want to use the loop code to Loop
Up or Loop Down a MUX device, or select Other, and then manually
specify the loop code pattern.
f
Under Delivery, indicate whether you want to send the loop code
In Band, or Out of Band.
4 To return to the Main screen, select the Results soft key.
The loop code is defined.
PDH, SONET, SDH, NextGen, and OTN Testing Manual
13
Chapter 2 T-Carrier and PDH Testing
BER testing
BER testing
The following procedure illustrates a typical scenario for:
– Setting up the MSAM to terminate a T-Carrier or PDH signal for BER
testing.
– Inserting errors, anomalies, alarms, and defects.
NOTE: Changing BERT patterns
If you change a BERT pattern during the course of your test, be certain to
press the Restart soft key to ensure that you regain pattern sync.
To perform a T-Carrier or PDH BER test
1 Using the Test Menu, select the terminate test application for the signal
and payload rate you are testing (refer to Table 6 on page 10 and Table 7
on page 10 for a list of applications).
2 Select the Setup soft key. A series of setup tabs appears.
3 Select the Interface tab, and then specify the applicable settings for the
interface rate and payload you selected: specify the input sensitivity, line
coding method, clock source and offset, and the line build out (LBO).
4 If the Channel tab is available (muxed PDH rates), specify:
– The channel or channels to analyze on the receiver.
– The Tx=Rx setting. If you want to transmit traffic on the same channel
you specified for the receiver, select YES. If you want to transmit traffic
on a different channel, or all channels, select NO.
– If you selected NO for the Tx=Rx setting, specify the channel you want
to transmit traffic on, or set the Tx ALL setting to YES to transmit traffic
over all available channels.
If you are running a PDH application, and want to specify timeslots for your
test, proceed to step 5, otherwise, proceed to step 7.
5 Select the Payload tab, select the arrow to the right of the Payload Type
field, and then specify one of the following:
– Bulk. Proceed to step 7.
– Fractional Rate. The Select Timeslot box appears. Proceed to step 6.
14
PDH, SONET, SDH, NextGen, and OTN Testing Manual
Chapter 2 T-Carrier and PDH Testing
BER testing
6 To change the timeslots you want to test, do one of the following:
To...
Do...
Select individual timeslots
Select the timeslot(s). The check mark appears.
Clear individual timeslots
Select the timeslot(s). The check mark is
removed.
Select all the timeslots
Select the Select All button.
Clear all the timeslots
Select the Deselect All button.
7 Specify the framing and BERT pattern by doing one of the following:
a Manually specify the framing and pattern
– Select the Framing tab, and then specify the framing settings for the
received and transmitted signals and, if applicable, the muxed
payloads dropped from the signals:
Rates
Muxed Payloads
Framing types
DS1
–
–
–
–
Unframed
ESF
SF
SLC-96
DS3
–
–
–
Unframed
M13
C-Bit
E1
–
–
–
–
–
PCM31C
PCM31
PCM30C
PCM30
Unframed
E3
–
–
Framed
Unframed
E4
–
–
Framed
Unframed
NOTE:
You can also specify frame settings using the Framing quick configuration
button provided on the Main screen.
– Select the Pattern tab, and then select the Pattern Mode and specify a
BERT Pattern (for example, 2^23-1).
NOTE:
Patterns 2^20-1 ITU or 2^20-1 Inv ITU require that the far end unit be an
MSAM containing v13.0 or higher software in order to achieve pattern sync.
If the far end unit is an HST-3000 or MSAM containing software below
v13.0, patterns 2^20-1 ANSI or 2^20-1 Inv ANSI should be selected as an
acceptable substitute.
PDH, SONET, SDH, NextGen, and OTN Testing Manual
15
Chapter 2 T-Carrier and PDH Testing
Verifying performance
b Automatically detect the framing and the received BER pattern
– On the Main screen, press the Auto button:
A window appears indicating that the module detected the input signal and
then detected the received pattern.
8 Connect a cable from the appropriate RX connector to the network’s
TRANSMIT access connector.
9 Connect a cable from the appropriate TX connector to the network’s
RECEIVE access connector.
10 Using a hard loop or loop code, loop back the far-end of the network.
11 Verify the following LEDs:
– If your module is in TestPad mode, verify that the following LEDs are
green:
T-Carrier
PDH
Signal Present
Signal Present
Frame Sync
MFAS Sync
Pattern Sync
Pattern Sync
– If your module is in ANT mode, verify that the following LEDs are not
red:
T-Carrier and PDH
LOS
LOF
LSS
12 Verify that All Summary Results OK appears in the results window.
13 Optional. Insert five Bit / TSE errors (see “Verifying performance” on
page 16), and then verify that the five errors were received in the BERT
result category.
14 Run the test for an appropriate length of time.
The BER test is finished.
Verifying performance
You can use the MSAM to verifying that performance on a circuit conforms to
industry test recommendations.
To verify performance
1 Using the Test Menu, select the terminate test application for the signal
and payload you are testing (refer to Table 6 on page 10 and Table 7 on
page 10 for a list of applications).
16
PDH, SONET, SDH, NextGen, and OTN Testing Manual
Chapter 2 T-Carrier and PDH Testing
Measuring round trip delay
2 Select the Setup soft key. A series of setup tabs appears.
3 Select the Performance tab, and then do the following:
a In Path Allocation, enter the percentage of the circuit (path) you are
testing. For example, if the segment of the circuit you are testing constitutes 50% of the entire circuit, enter 50.000000.
b If you want to set a threshold (limit) after which the module will indicate
that the Verdict result is Rejected, do the following:
– In Enable UAS Limit, select Yes.
– In UAS Limit, specify the number of unavailable seconds after which
the module will display Rejected for the UAS result for the entire
duration of the test. For example, if you want the unit to display
Rejected after 10 unavailable seconds, specify 10.
c On the left side of the tab, select another test recommendation (G.821,
G.826, or M.2100) and then repeat step a and step b for each specification.
4 Display and observe Summary results in one window, and the test results
for the associated performance recommendation in a second window (see
“Step 5: Viewing test results” on page 4).
For example, if you configured the test for the G.826 recommendation, set
a result window to display G.826 results for the applicable receiver.
– If key results do not conform to the associated recommendations, they
appear in the performance category with a Rejected value.
– If all results in a performance category conform to the associated
recommendations, the Verdict result indicates: Accepted.
For additional information on performance results, see “ITU-T recommended
performance test results” on page 202.
Measuring round trip delay
You can use the instrument to measure round trip delay by transmitting a delay
pattern, and then looping the pattern back to the module. The module calculates the amount of time it took the pattern to traverse the loop, and then
reports the duration (delay) in milliseconds (ms).
To measure round trip delay
1 Using the Test Menu, select the test application for the signal and payload
you are testing (refer to Table 6 on page 10 and Table 7 on page 10 for a
list of applications).
2 Select the Setup soft key. A series of setup tabs appears.
3 Specify the Interface and Framing settings if the defaults are not acceptable (for details on the settings, refer to the associated steps in “BER
testing” on page 14).
4 Select the Pattern tab, and then select the Delay pattern.
5 To return to the Main screen, select the Results soft key.
6 Connect a cable from the appropriate RX connector to the network’s
TRANSMIT access connector.
PDH, SONET, SDH, NextGen, and OTN Testing Manual
17
Chapter 2 T-Carrier and PDH Testing
Measuring service disruption time
7 Connect a cable from the appropriate TX connector to the network’s
RECEIVE access connector.
8 Loop back the far-end of the network.
9 Verify the following LEDs:
– If your module is in TestPad mode, verify that the following LEDs are
green:
T-Carrier
PDH
Signal Present
Signal Present
Frame Sync
MFAS Sync
Pattern Sync
Pattern Sync
– If your module is in ANT mode, verify that the following LEDs are not
red:
T-Carrier and PDH
LOS
LOF
LSS
10 To observe the delay result, set one of the result windows to display the
Signal category.
Round trip delay is measured.
Measuring service disruption time
You can use the instrument to measure the service disruption time resulting
from a switch in service to a protect line. Before measuring the disruption time,
you can:
– Indicate which events to measure (such as a Signal Loss or LOF).
– Establish an acceptable length of time for the measurements by specifying
a Threshold Time. Measured times for an event that are less than or equal
to the Threshold Time pass the test, measured times that exceed the
Threshold Time fail the test.
– Specify a Separation Time to indicate that the unit should count separate
events that occur within a very brief period of time as a single event. For
example, if you specify a Separation time of 300.000 ms and select AIS-L
as an event trigger, if more than one AIS-L occurs during a 300.000 ms
period, the unit will interpret the events as a single AIS-L disruption. The
count will not increase when another AIS-L occurs until at least
300.000 ms has transpired since the previous AIS-L.
To measure service disruption time
1 Using the Test Menu, select the test application for the signal and payload
you are testing (refer to Table 6 on page 10 and Table 7 on page 10 for a
list of applications).
2 Select the Setup soft key, and then select the Service Disruption tab.
18
PDH, SONET, SDH, NextGen, and OTN Testing Manual
Chapter 2 T-Carrier and PDH Testing
Measuring service disruption time
3 Under Event Settings, do the following:
a Select Enable Service Disruption.
b Optional. To edit the displayed Separation Time, select the field, and
then type the new time in milliseconds (ms), or select Default to restore
the time to its default value (300.000 ms). This is the duration during
which each trigger of a specific type will be counted as a single disruption event.
c Optional. To edit the displayed Threshold Time, press the keypad icon,
and then type the new time in milliseconds (ms), or select Default to
restore the time to its default value (50.000 ms). Disruption measurements that exceed this duration will be interpreted as failed.
4 Under Event Triggers, do one of the following:
– To measure disruption time for each of the triggers listed, select Set
ALL.
– To measure disruption time for a specific trigger or group of triggers,
select Clear ALL, and then select each of the triggers for the measurements.
5 If you are measuring service disruption time from a DS1 or E1 interface, or
for a DS1 or E1 signal embedded in a higher rate (for example, a DS1
dropped from an OC-3 or an E1 dropped from an STM-4), select the
Framing tab, and then select Unframed.
NOTE:
You can not use a framed signal (for example, ESF) when measuring service disruption time for a DS1 or E1 signal from any interface. Be certain to
configure an unframed signal before starting your test.
You can use a framed signal (for example, M13 or C-Bit) when measuring
service disruption time for DS3, E3, and E4 signals from any interface.
6 If additional settings need to be modified to reflect the network configuration, select the appropriate tab, and then modify the settings as required.
7 To return to the Main screen, select the Results soft key.
8 Connect a cable from the appropriate RX connector to the network’s
TRANSMIT access connector.
9 Connect a cable from the appropriate TX connector to the network’s
RECEIVE access connector.
10 To force the switch to a protect line, use one of the following methods:
– Interrupt the signal. Physically interrupt the signal by pulling the signal
within the SONET/SDH ring.
– Insert errors. Use another unit through mode to insert errors until the
network switches to the backup lines.
– Use the network element’s software to force a protection switch.
The network switches to a protect line, the instrument detects that service
has been disrupted, and then begins to measure the disruption time in
milliseconds until the condition returns to normal.
PDH, SONET, SDH, NextGen, and OTN Testing Manual
19
Chapter 2 T-Carrier and PDH Testing
Monitoring the circuit
11 To observe the service disruption results, set one of the result windows to
display the Service Disruption Log, and set another window to display the
Service Disruption Log Stats.
Service disruption is measured for each of the triggers you selected. For
details on the associated test results, see “Service Disruption Results” on
page 200.
Monitoring the circuit
You can use the instrument to monitor T-Carrier and PDH signals and muxed
payloads within the signals.
1 Using the Test Menu, select a monitor test application for the signal and
payload you are testing (refer to Table 6 on page 10 and Table 7 on
page 10 for a list of applications).
2 If the current test configuration needs to be modified to reflect the network
configuration, select the Setup soft key, and then modify the settings as
required.
3 To return to the Main screen, select the Results soft key.
4 Connect a cable from the appropriate RX 1 connector to the network’s
TRANSMIT access connector.
If you are monitoring two signals, connect a second cable from the appropriate Rx 2 connector to the second network TRANSMIT access
connector.
5 Observe the test results (see “Step 5: Viewing test results” on page 4).
You are monitoring the circuit.
Analyzing PCM signals
If your instrument is configured and optioned to do so, you can use it to do the
following:
Monitor a call—The instrument can analyze both directions of a user-specified
DS0 channel on a T1 line for call activity. Call activity includes supervisory
events and DTMF, MF, and DP digit recognition. Each activity event is
displayed in the test results.
Place a call—The instrument can emulate the CPE (PBX) or CO side of a
network by originating a call over a user-specified DS0 channel on a duplex T1
circuit. Calls can incorporate DTMF digits, MF digits, DP digits, as well as other
signaling events.
Receive a call —The instrument can emulate the CPE (PBX) or CO side of a
network by terminating a call over a specified DS0 channel on a duplex T1
circuit. Calls can incorporate DTMF digits, MF digits, DP digits, as well as other
signaling events.
20
PDH, SONET, SDH, NextGen, and OTN Testing Manual
Chapter 2 T-Carrier and PDH Testing
Analyzing PCM signals
Analyze digits or events—The instrument can display the characteristics of
each received DTMF, MF, DP digit, and signaling event. Analysis results
include digit/event delay and duration, digit address type (DTMF, MF, or DP).
You must use a headset for audio analysis.
Analyze voice frequencies (VF)—After placing or receiving a standard PCM
call, you can perform VF analysis while maintaining the call. In addition to
signaling results, VF results, such as DC offset, frequency, and level measurements are available. For details, see “Analyzing VF circuits” on page 27.
Test modes
You can perform signaling analysis in the following modes:
Terminate — In Terminate mode both sides of a T1 path are separated; the
input signal is terminated at the receive side; and a totally independent signal
is generated for the output.
Dual Monitor — In Dual Monitor mode you can select a DS0 channel from a
duplex T1 circuit and monitor all channel activity. Channel activity includes all
originating and terminating supervisory events and originating digits. In Dual
Monitor mode, you cannot insert data on a T1 line.
Trunk type signaling
Trunk type signaling is used to define the On Hook and Off Hook status, and
other states of the A, B, C, and D signaling bits. All trunk types are available
regardless of the T1 Interface framing mode (for example, SLC trunk types can
be selected without SLC framing). The available trunk types are as follows:
– Standard E&M (Ear and Mouthpiece)
– Ground Start
– Loop Start
Each type of trunk signaling is described in the following sections.
Standard E & M signaling
Standard E&M signaling is used on trunks between switches in the public
switched telephone network (PSTN). Table 8 describes Standard E&M
signaling. An X indicates a “don’t care” condition.
Table 8
Direction
Transmit
Receive
Loop start signaling
Standard E&M signaling
Trunk Status
Signaling Bits
On Hook
A=0 B=0 (C=0 D=0)
Off Hook
A=1 B=1 (C=1 D=1)
On Hook
A=0 B=X (C=0 D=X)
Off Hook
A=1 B=X (C=1 D=X)
Loop start trunk signaling emulates standard signaling between a telephone
and a switch. This is the most common type of trunk found in residential installations. Signaling for the various types of loop start trunks is as follows:
– FXS (foreign exchange station)
– FXO (foreign exchange office)
PDH, SONET, SDH, NextGen, and OTN Testing Manual
21
Chapter 2 T-Carrier and PDH Testing
Analyzing PCM signals
– SLC (subscriber line carrier) Station
– SLC Office
Table 9 describes each type of loop start trunk signaling. An X indicates a
“don’t care” condition.
Table 9
Loop start trunk signaling
Direction
Trunk Status
Signaling Bits
On Hook
A=0 B=1 (C=0 D=1)
Off Hook
A=1 B=1 (C=1 D=1) Loop
closed
On Hook
A=0 B=1 (C=0 D=1)
Off Hook
A=0 B=1 (C=0 D=1)
Ringing
A=X B=0 (C=X D=0)
On Hook
A=0 B=1 (C=0 D=1)
Off Hook
A=0 B=1 (C=0 D=1)
Ringing
A=0 B=0 (C=0 D=0)
On Hook
A=0 B=X (C=0 D=X) Loop Idle
Off Hook
A=1 B=X (C=1 D=X) Loop
closed
FXS Signaling
Transmit
Receive
FXO Signaling
Transmit
Receive
SLC Station Signaling - ESF Framing
Transmit
Receive
On Hook
A=0 B=0 (C=0 D=0)
Off Hook
A=1 B=0 (C=1 D=0)
On Hook
A=1 B=1 (C=1 D=1)
Off Hook
A=1 B=1 (C=1 D=1)
Ringing
A=1 B=1 (C=1 D=0)
SLC Station Signaling - D4/SF/SLC-96 Framing
Transmit
Receive
On Hook
A=0 B=0
Off Hook
A=1 B=0
On Hook
A=1 B=1
Off Hook
A=1 B=1
Ringing
A=1 B=0/1
SLC Office Signaling - ESF Framing
Transmit
Receive
22
On Hook
A=1 B=1 (C=1 D=1)
Off Hook
A=1 B=1 (C=1 D=1)
Ringing
A=1 B=1 (C=1 D=0)
On Hook
A=0 B=0 (C=0 D=0)
Off Hook
A=1 B=0 (C=1 D=0)
PDH, SONET, SDH, NextGen, and OTN Testing Manual
Chapter 2 T-Carrier and PDH Testing
Analyzing PCM signals
Table 9
Loop start trunk signaling (Continued)
Direction
Trunk Status
Signaling Bits
SLC Office Signaling - D4/SF/SLC-96 Framing
Transmit
Receive
Ground start signaling
On Hook
A=1 B=1
Off Hook
A=1 B=1
Ringing
A=1 B=0/1
On Hook
A=0 B=0
Off Hook
A=1 B=0
Ground start trunk type circuits provide additional supervision to prevent
outgoing calls on circuits with incoming calls present. The signaling for the
various types of Ground Start trunks is as follows:
– FXS (Foreign Exchange Station)
– FXO (Foreign Exchange Office)
– SLC (Subscriber Line Carrier) Station
– SLC Office
Table 10 describes each type of ground start trunk signaling. An X indicates a
“don’t care” condition.
Table 10
Ground start signaling
Direction
Trunk Status
Signaling Bits
On Hook
A=0 B=1 (C=0 D=1)
Ground
A=0 B=0 (C=0 D=0) Ground on Ring
Off Hook
A=1 B=1 (C=1 D=1) Loop closed after
the far end, FXO sends A=0 (Ground
on Tip)
On Hook
A=1 B=X (C=1 D=X) No Tip Ground
Off Hook
A=0 B=1 (C=0 D=1) Tip Ground
Ringing
A=X B=0 (C=X D=0)
On Hook
A=1 B=1 (C=1 D=1) No Ground on
Tip
Off Hook
A=0 B=1 (C=0 D=1) Tip Ground
Ringing
A=0 B=0 (C=0 D=0)
On Hook
A=0 B=1 (C=0 D=1) Loop Idle
Ground
A=0 B=0 (C=0 D=0) Ground on Ring
Off Hook
A=1 B=1 (C=1 D=1) Loop closed
FXS Signaling
Transmit
Receive
FXO Signaling
Transmit
Receive
PDH, SONET, SDH, NextGen, and OTN Testing Manual
23
Chapter 2 T-Carrier and PDH Testing
Analyzing PCM signals
Table 10
Direction
Ground start signaling (Continued)
Trunk Status
Signaling Bits
SLC Station Signaling - ESF Framing
Transmit
Receive
On Hook
A=0 B=0 (C=0 D=0)
Ground
A=0 =1 (C=0 D=1)
Off Hook
A=1 B=0 (C=1 D=0)
On Hook
A=0 B=0 (C=0 D=0)
Off Hook
A=0 B=1 (C=0 D=0)
Ringing
A=1 B=1 (C=1 D=0)
SLC Station Signaling D4/SF/SLC-96 Framing
Transmit
Receive
On Hook
A=0 B=0
Ground
A=0 B=1
Off Hook
A=1 B=0
On Hook
A=0 B=0
Off Hook
A=0 B=0/1
Ringing
A=1 B=0/1
SLC Office Signaling - ESF Framing
Transmit
Receive
On Hook
A=0 B=0 (C=0 D=0)
Off Hook
A=0 B=1 (C=0 D=0)
Ringing
A=1 B=1 (C=1 D=0)
On Hook
A=0 B=0 (C=0 D=0)
Ground
A=0 =1 (C=0 D=1)
Off Hook
A=1 B=0 (C=1 D=0)
SLC Office Signaling D4/SF/SLC-96 Framing
Transmit
Receive
24
On Hook
A=0 B=0
Off Hook
A=0 B=0/1
Ringing
A=1 B=0/1
On Hook
A=0 B=0
Ground
A=0 B=1
Off Hook
A=1 B=0
Connecting a headset
Before monitoring or placing calls, you should connect a USB headset to listen
to the calls. To verify that your headset has been tested and recommended by
JDSU for use with your instrument, contact your local JDSU representative.
Specifying call settings
Before monitoring or placing calls, you must specify settings such as the trunk
type, equipment type (if applicable), and call mode.
PDH, SONET, SDH, NextGen, and OTN Testing Manual
Chapter 2 T-Carrier and PDH Testing
Analyzing PCM signals
To specify call settings
1 Using the Test Menu, select the DS1 Signaling application (refer to Table 6
on page 10 for a list of applications and test modes).
2 If the current test configuration needs to be modified to reflect the network
configuration, select the Setup soft key, and then modify the settings as
required.
3 Select the Call tab, then specify the following settings:
Setting
Value
Trunk Type
Select one of the following trunk types:
– Standard E&M
– Loop Start
– Ground Start
For information about trunk types, see “Trunk
type signaling” on page 21.
Equipment
(Loop Start or Ground Start
only)
For loop start and ground start trunk types, if
you are monitoring calls, select the type of
equipment that will be connected to the primary receiver; otherwise, select the type of
equipment the instrument is emulating:
– FXO
– FXS
– SLC Office
– SLC Station
For additional information, see “Loop start signaling” on page 21 or “Ground start signaling”
on page 23.
Address
(Terminate Mode only)
Select one of the following address types:
– DTMF
– MF
– DP
Response Mode
Select Auto or Manual. If you select Auto,
when testing in terminate mode the instrument will automatically respond to supervisory
events as applicable for the selected trunk
type.
Call Mode
Select Originate or Terminate.
The call settings are specified.
Monitoring a call
You can monitor call activity on a specified DS0 channel or scan specific channels for call activity. The instrument captures the call activity and displays the
results. The following procedure describes how to monitor a call on a DS0
channel from a T1.
To monitor a call
1 Using the Test Menu, select the DS1 Signaling application in Dual Monitor
mode (refer to Table 6 on page 10 for a list of applications and test
modes).
PDH, SONET, SDH, NextGen, and OTN Testing Manual
25
Chapter 2 T-Carrier and PDH Testing
Analyzing PCM signals
2 If the current test configuration needs to be modified to reflect the network
configuration, select the Setup soft key, and then modify the settings as
required.
3 Specify the calls settings (see “Specifying call settings” on page 24).
4 If you want to scan specific channels for originating and terminating
signaling events and digits, select the Call Scan tab, then specify the
following settings:
Setting
Value
Call Scanning
Select Enable.
Select Scan Channels
(Call Scanning must be
Enabled)
Select the displayed channels (timeslots) that
you want to analyze. When selected, a green
check mark appears to the left of the channel
number.
– To select all channels, select Select All.
– To clear all channels, select Clear All.
At least one channel must be selected.
Lock Time (sec)
Select the field to display a keypad, then enter
the lock time in seconds.
Release Time (msec)
Select the field to display a keypad, then enter
the release time in seconds.
The instrument will collect call activity results and display them in the
Payload result group, under the Call category for the selected receiver.
When the instrument is scanning for active channels, the speaker is
muted.
5 Select the Results soft key to return to the Main screen.
6 Select the Restart soft key, then observe the call results (see “Observing
call results” on page 27).
You are monitoring a call, and results associated with the call appear.
Placing or receiving calls
In Terminate mode, you can use the instrument to emulate a PBX, switch, or
telephone to place or receive calls, and perform voice frequency (VF) testing
on DS0 channels. You can place calls in either direction on a switched network.
To place or receive a call
1 Using the Test Menu, select the DS1 Signaling application in Terminate
mode (refer to Table 6 on page 10 for a list of applications and test
modes).
2 If the current test configuration needs to be modified to reflect the network
configuration, select the Setup soft key, and then modify the settings as
required.
3 Specify the calls settings (see “Specifying call settings” on page 24), then
select the Results soft key to return to the Main screen.
4 Connect the instrument to the line.
5 Select the Restart soft key, then observe the call results (see “Observing
call results” on page 27).
26
PDH, SONET, SDH, NextGen, and OTN Testing Manual
Chapter 2 T-Carrier and PDH Testing
Analyzing VF circuits
6 Select the Signaling Action tab, and then use the action keys to perform
the various signal events for the trunk type you selected. Available actions
will vary depending on whether you are placing or receiving a call.
Keys
Action
Signaling Events, such
as:
– On Hook
– Off Hook
– Push To Talk
– VF Testing
– Ring
– Idle
Additional keys may
appear as appropriate for
your call.
Performs the associated signaling event. Actions
vary depending on the selected trunk type and
whether you are placing or receiving a call.
VF Testing
Starts VF testing. For details, see “Analyzing VF
circuits” on page 27.
DTMF Dial
DP Dial
MF Dial
Displays a keypad so you can dial a call manually.
You placed or received a call.
Observing call results
When monitoring, placing, or receiving calls, you can observe more results if
you use a single result pane.
To observe call results
1 Select View > Result Windows > Single.
2 In the result window, select the receiver you want to observe calls for.
3 Set the result group to Payload, and the category to Call.
Analyzing VF circuits
If your instrument is configured and optioned to do so, you can use it to do the
following:
– Measure Standard Tone—Analyze a DS0 channel for standard VF characteristics such as tone frequency, tone level, and DC offset.
– Measure Noise—Test a DS0 channel for spectral noise analysis by filtering
the received signal using C-message, D-message, 3.4 kHz, and 1,010 Hz
notch filters.
– Transmit Standard Tones—Insert a single voice frequency tone over a
specified DS0 channel. Tone characteristics include pre-defined and userdefined frequencies and levels.
– Transmit Loopback Tones—Insert 2713 Hz loop up and loop down tones
at -10.0 dBm on the test channel.
PDH, SONET, SDH, NextGen, and OTN Testing Manual
27
Chapter 2 T-Carrier and PDH Testing
Analyzing VF circuits
– Insert Three-tone Steps—Insert the repeated transmission of three tones
(404, 1004, and 2804 Hz) over a specified DS0 channel at a user-specified
level and duration.
– Frequency Sweep—Transmit a user-defined range of tones (from 500 Hz
to 3500 Hz) over a specified DS0 channel. You can configure a block out
range (notch); the frequency separation between tones; the level, tone
duration, and sweep direction.
– Measure Impulse Noise—Measure impulse noise on a specified DS0
channel according to a user-defined threshold. You can also apply C- or Dmessage and notched filters.
– Configure Signaling Bits—You can configure and transmit AB(CD)
signaling bits with either 2-bit or 4-bit binary values, depending on the
specified framing format.
– Verify Path Continuity and Audible Faults—The audible output from the
instrument’s speaker allows you to verify path continuity and identify
audible faults, such as low levels, noise, and echo.
28
VF tests
Using the instrument, you can perform the following types of tests: Quiet Tone,
Holding Tone, Three Tone, Single Tone, Frequency Sweep, and Impulse
Noise. You can also specify values for AB(CD) signaling bits. The following
sections provide an overview of each test type. For instructions on performing
tests, see “Running VF analysis tests” on page 29.
Quiet tone test
This test lets you measure noise on a PCM data circuit when no tones are
present and one end of the circuit has been terminated. This test simulates this
condition by inserting a code representing zero signal (0xFE) into the test
channel.
Holding tone test
This test lets you transmit a tone, with a frequency of 1004 Hz and a transmit
level of -16 dBm, on the test channel.
Three tone test
This test lets you measure the frequency response of the test channel when
three tones (404, 1004, and 2804 Hz) are transmitted. These tones are transmitted automatically and repetitively as a step. You can specify the transmission duration for each tone, and you can specify the transmit level. All three
tones are transmitted at the same level.
Single tone test
This test lets you transmit any one of five preset tone frequencies, or a userdefined frequency from 20 to 3904 Hz on the test channel. You can also specify
any one of five preset tone levels, or specify a user-defined level from -40.0 to
3.0 dBm.
Frequency sweep test
This test lets you transmit a specified range of tones on the test channel. You
can configure the upper and lower bounds of the range to be anywhere from
20 Hz to 3904 Hz. You can also set a blocked (notched) frequency range as
well as the step size, the amount of frequency separation between tones.
PDH, SONET, SDH, NextGen, and OTN Testing Manual
Chapter 2 T-Carrier and PDH Testing
Analyzing VF circuits
Additionally, you can specify the point at which the instrument begins transmitting the tones, either from higher to the lower frequency or from lower to higher.
The range of tones is transmitted repeatedly at a user-specified level and duration.
Impulse noise test
This test lets you measure impulse noise on the test channel. You can specify
the threshold for detecting instances of impulse noise (impulse noise hits).
Additionally, you can apply C- or D-message and notched filters. When you
start the test, the instrument clears any previous results and starts a new count
of impulse noise hits.
User-defined signaling bits
Depending on the specified line framing format, you can assign 2- or 4-bit
values to the AB(CD) signaling bits. If the framing format is set to D4/SF or
SLC-96, you can configure a 2-bit value. If the framing format is set to ESF, you
can configure a 4-bit value. This feature is only available in Terminate mode.
Also, you cannot define signaling bits if you are accessing the VF settings from
the PCM Signaling application (see “Analyzing PCM signals” on page 20).
Running VF analysis tests
The following procedure describes how to run VF analysis tests when the
instrument is connected to a T1 line.
To run VF analysis tests
1 Using the Test Menu, select the DS1 VF application (refer to Table 6 on
page 10 for a list of applications and test modes).
2 If the current test configuration needs to be modified to reflect the network
configuration, select the Setup soft key, and then modify the settings as
required.
3 Specify the calls settings (see “Specifying call settings” on page 24), then
select the Results soft key to return to the Main screen.
4 If you want to scan specific channels for originating and terminating
signaling events and digits, select the Call Scan tab, then specify the
settings. For details, see step 4 on page 29 of “Monitoring a call”.
PDH, SONET, SDH, NextGen, and OTN Testing Manual
29
Chapter 2 T-Carrier and PDH Testing
Analyzing VF circuits
5 Select the VF tab.
– If you are running the Impulse Noise test, proceed directly to step 7 on
page 31.
– If you are running the Quiet Tone or Holding Tone test, proceed directly
to step 8 on page 31.
Three Tone
Frequency Sweep
X
X
X
X
X
X
X
X
X
Setting
Value
Test Type
Select one of the following test types:
– Single Tone
– Holding Tone
– Frequency Sweep
– Impulse Noise
Frequency
Select one of the following frequencies:
– 404 Hz
– 1004 Hz
– 1804 Hz
– 2713 Hz
– 2804 Hz
– User Frequency
X
User Frequency
(Hz)a
If you indicated that you want to specify
the frequency by selecting User Frequency, specify the frequency in Hz.
X
Level
Select the decibel level for the tones:
– 0 dBm
– 3 dBm
– -10 dBm
– -13 dBm
– -16 dBm
– User Level
User Level
(dBm)b
Specify the level the at which the tones
will be transmitted. You can enter a
value from -40.0 dBm to 3.0 dBm.
404Hz Duration
1004Hz Duration
2804Hz Duration
Enter the number of seconds for the
duration for each tone. The minimum is
2 seconds the maximum is 60 seconds.
The default duration is 5 seconds.
a. Frequency must be User Frequency
b. Level must be User Level
30
Single Tone
– For all other tests, specify the following settings:
PDH, SONET, SDH, NextGen, and OTN Testing Manual
X
Chapter 2 T-Carrier and PDH Testing
Analyzing VF circuits
6 If you are running the Frequency Sweep test, specify the following
settings; otherwise, proceed directly to step 8 on page 31.
Setting
Value
Tone Duration (sec)
Enter a value, from 2 to 10 seconds, to indicate how long each tone will be transmitted.
Step Size (Hz)
Enter a value, from 10 to 1000 Hz, to indicate
the amount of separation between tones.
Sweep Direction
Select one of the following:
– Up, to begin the sweep from the start frequency.
– Down, to begin the sweep from the stop
frequency.
Sweep Frequency Range
(Hz)
These settings specify the frequencies at
which the sweep starts and stops, based on
the direction specified. For Start and Stop,
specify a range from 10 to 3904 Hz.
Skip Frequency Range (Hz)
These settings indicate a range of frequencies that will not be transmitted as part of the
sweep. For Low and High, specify a range
from 10 to 3904 Hz. The default skip range is
2450 Hz to 2750 Hz.
7 If you are running the Impulse noise test, specify the following settings;
otherwise, proceed directly to step 8 on page 31:
Setting
Value
Test Type
Select Impulse Noise.
Impulse Noise
Enter a value, from 60 to 93 dBm, to indicate
when the instrument will detect impulse noise.
Filter Type
Apply one of the following filters:
– No Filter
– C Message
– C Notched
– D Message
– D Notched
Select Scan Channels
(Call Scanning must be
Enabled)
Select the displayed channels (timeslots) that
you want to analyze. When selected, a green
check mark appears to the left of the channel
number.
– To select all channels, select Select
All.
– To clear all channels, select Clear All.
At least one channel must be selected.
Lock Time (sec)
Select the field to display a keypad, then enter
the lock time in seconds.
Release Time (msec)
Select the field to display a keypad, then enter
the release time in seconds.
8 Connect the instrument to the line.
9 Press the Results soft key.
PDH, SONET, SDH, NextGen, and OTN Testing Manual
31
Chapter 2 T-Carrier and PDH Testing
ISDN PRI testing
10 To start the test, press the Restart soft key.
You can hear received tones through the instruments speaker or your
headset.
11 Select the Signaling Action tab, and then select the VF Testing key.
12 Use the action keys to perform the various signal events for the trunk type
you selected. Available actions will vary depending on whether you are
placing or receiving a call. For details, see step 6 on page 27 of “Placing or
receiving calls”.
You are running a VF test, and can observe results in the VF category (see
“Observing VF results”.
Observing VF results
When monitoring, placing, or receiving calls, you can observe more results if
you use a single result pane.
To observe call results
1 Select View > Result Windows > Single.
2 In the result window, select the receiver you want to observe calls for.
3 Set the result group to Payload, and the category to VF.
ISDN PRI testing
If your instrument is configured and optioned to do so, you can use it to install
and maintain ISDN PRI services over T1 interfaces. Using the instrument, you
can place, receive, and analyze calls, test data services using BERT analysis,
test voice services using a microphone/speaker audio headset, and monitor
physical (layer 1), LAPD (layer 2), and Q.931 (layer 3) results.
Before testing, review each of the following sections:
– “Features and capabilities” on page 33
– “Specifying General settings” on page 33
– “Specifying Call settings” on page 35
– “Specifying Decode filter settings” on page 37
– “Placing calls” on page 37
– “Receiving calls” on page 38
– “Inserting voice traffic into a call” on page 39
– “Performing BER analysis of a call” on page 40
– “Transmitting DTMF tones” on page 41
– “Disconnecting a call” on page 41
– “Observing ISDN PRI results” on page 41
32
PDH, SONET, SDH, NextGen, and OTN Testing Manual
Chapter 2 T-Carrier and PDH Testing
ISDN PRI testing
Features and capabilities
Using your instrument, you can also do the following:
– Place and receive calls using the standard transmit-receive DS1 interfaces. After a call is established, you can insert voice traffic into the associated B Channel, or perform BERT analysis on the B Channel.
– Emulate a network termination device such as a PBX or terminal equipment device (for example, an ISDN phone) using Terminal equipment (TE)
mode.
– Emulate a switch or network termination device using Network termination
(NT) mode.
– Process calls for switches using the following call control protocols:
– AT&T 5ESS
– Nortel DMS 100
– National ISDN-2 (NI-2)
– Passively monitor and analyze ISDN PRI service while the network is inservice.
– Isolate and locate problems by viewing D channel decode text for all
captured transmitted and received frames when you monitor or terminate
ISDN PRI service. After viewing the decode text, you can save the text to a
file on the instrument.
– Perform BERT analysis of a B channel.
Specifying General settings
Before monitoring or placing ISDN PRI calls, you must specify settings such as
the emulation mode (TE or NT), call control, numbering plan, and the
D Channel number and rate.
To specify general settings
1 Using the Test Menu, select the DS1 ISDN PRI application (refer to
Table 6 on page 10 for a list of applications and test modes).
2 Select the Setup soft key, then select the ISDN tab. Select the General
subtab, then specify the following settings:
Setting
Value
Emulation
Select an emulation mode:
– TE Emulation. If you select this setting,
the instrument places a call to the network
as if the call was originated from a PBX or
a TE device.
– NT Emulation. If you select this setting,
the instrument places a call to a TE as if
the call was originated by another TE on
the network.
Call Control
Select one of the following:
– N1-2 (National). For National ISDN-2
(NI-2) compliant switches.
– 5ESS. For AT&T 5ESS.
– DMS 100. For Nortel DMS 100.
NOTE: The majority of ISDN providers use
the N1-2 call control protocol. 5ESS and
DMS 100 are typically used by providers who
have a custom or proprietary method for
implementing ISDN.
PDH, SONET, SDH, NextGen, and OTN Testing Manual
33
Chapter 2 T-Carrier and PDH Testing
ISDN PRI testing
Setting
Value
Numbering Type
Select one of the following:
– National
– Auto
– International
– Local
– Unknown
NOTE: The numbering type refers to the format and number of digits used when a caller
dials a phone number. For example, National
indicates a 10 digit number is used; Local
indicates a 7 digit number is used.
Numbering Plan
(5ESS and DMS 100 only)
Select one of the following:
– Unknown
– ISDN
– Private
NOTE: Calls using NATIONAL call control
always use an ISDN numbering plan.
D Channel
Enter the time slot number for the D channel.
The default is 24.
D Channel Rate
Set the D Channel Rate to one of the following:
– 56K
– 64K
NOTE: 64K is typically the rate for D channels.
HDLC Mode
Set the HDLC mode to one of the
following:
– Normal
– Inverted
NOTE: Normal is typically the correct mode.
Transit Network ID
Specify the transit network ID for the network
that the call will be routed to.
Operator System Access
Specify one of the following for the operator
system access:
– Principal. If the default operator system
for the network is used, select Principal.
– Alternate. If an alternate operator system
has been established by subscription,
select Alternate.
– None. If no operator system is used,
select None.
The general settings for the call are specified.
34
PDH, SONET, SDH, NextGen, and OTN Testing Manual
Chapter 2 T-Carrier and PDH Testing
ISDN PRI testing
Specifying Call settings
Before monitoring or placing ISDN PRI calls, you must specify settings for the
calls such as the call type, bearer rate (for data calls), and the number to call.
1 Using the Test Menu, select the DS1 ISDN PRI application (refer to
Table 6 on page 10 for a list of applications and test modes).
2 Select the Setup soft key, then select the ISDN tab. Select the Call
subtab, then specify the following settings:
Setting
Value
Call Type
Select a call type:
– Voice
– 3.1k Audio
– Data
Bearer Rate
(Data calls only)
If you are placing a data call, select one of the
following rates:
– 64K
– 56K
– Nx64K
– H0
B Channel
Select a channel (1 - 24), or select Any to
place the call on any available channel.
NOTE: The Channel parameter is not applicable for Nx64K or H0 data calls. Use the Channel Map option to specify the FT1 channels
for Nx64K calls, and the H0 setting to select a
range of channels for H0 calls.
Channel Map
If you selected Nx56K for a data call, select
the FT1 channels. When selected, a green
check mark appears to the left of the channel
number.
H0 Channel
If you selected H0 as your bearer rate, specify
one of the following H0 Channel ranges:
– 1-6
– 7 - 12
– 13 - 18
– 19 - 24
Directory Number
Enter the number the instrument is using to
identify the line for the outgoing call using up
to 30 digits. Think of this as the caller ID of the
call placed from the instrument.
Number to Call
Enter the number to call using up to 30 digits,
*, and #.
PDH, SONET, SDH, NextGen, and OTN Testing Manual
35
Chapter 2 T-Carrier and PDH Testing
ISDN PRI testing
Setting
Value
Call Answer Mode
If you want to change the current call answer
mode for the instrument, select one of the following modes:
– Prompt. Prompt mode sets up the instrument to prompt you to accept, reject, or
ignore each incoming call as it comes in. If
you ignore a call, you can answer or reject
the call later.
– Accept. Accept mode sets up the instrument to automatically accept the first
incoming call, and then reject any additional calls. You can always check the
Summary Results screen to see if a call is
active on the instrument.
– Reject. Reject mode sets up the instruments to automatically reject all incoming
calls.
Presentation Indicator Status
Select one of the following:
– Enabled. When enabled, it provides the
ability to control the presentation indicator
when a directory number (DN) is provided.
This is necessary when making interLATA calls through certain switches.
– Disabled.
Presentation Indicator
(Presentation Indicator Status must be Enabled)
This indicates whether the calling line identity
is allowed to be presented.
– Presentation Allowed
– Presentation Restricted
– Number Not Available
Screening Indicator
(Presentation Indicator Status must be Enabled)
This provides information on the source and
the quality of the provided information.
– Network Provided
– User Provided Failed Screening
– User Provided Passed Screening
– User Provided Not Screened
The call settings are specified.
NOTE:
The call settings you specify only apply to the next outgoing call you make
using the instrument. The settings do not impact currently active calls or
incoming calls.
36
PDH, SONET, SDH, NextGen, and OTN Testing Manual
Chapter 2 T-Carrier and PDH Testing
ISDN PRI testing
Specifying Decode filter
settings
Before monitoring or placing ISDN PRI calls, you can optionally specify filter
settings for the calls such as the call type, bearer rate (for data calls), and the
number to call.
1 Using the Test Menu, select the DS1 ISDN PRI application (refer to
Table 6 on page 10 for a list of applications and test modes).
2 Select the Setup soft key, then select the ISDN tab. Select the Decode
subtab, then specify the following settings:
Setting
Value
Decode Filter
Select Enable.
L2 Filter
Enable this filter to capture and store only
layer 2 LAPD frames to the decode message
buffer. No additional criteria is required.
Called Number Filter
Enable this filter if you want to capture and
store messages for calls placed to a particular
number, then specify the called number.
Calling Number Filter
Enable this filter if you want to capture and
store messages for calls placed from a particular number, then specify the calling number.
Bearer Capability Filter
Enable this filter if you want to capture and
store messages for voice, 3.1k audio, or data
calls, then specify the type of call.
Channel Number Filter
Enable this filter if you want to capture and
store messages for calls placed on a particular channel, then specify the channel.
The decode filter settings are specified. The instrument will filter the D channel
decode messages and then store them in the decode message buffer.
Placing calls
You can use the instrument to place calls by emulating a PBX or TE device, or
by emulating a switch or NT device. When you configure the instrument to
place a call, you specify the settings required to activate the physical layer (the
Interface settings), and initialize ISDN service over the D Channel (ISDN
settings).
After service is initialized, the instrument establishes a data link and is ready to
carry out ISDN call processing using the settings you specified.
NOTE:
You will not hear a dial tone when you place calls from the instrument. This
is normal for devices placing ISDN calls.
To place an ISDN PRI call
1 Using the Test Menu, select the DS1 ISDN PRI application in Terminate
mode (refer to Table 6 on page 10 for a list of applications and test
modes).
PDH, SONET, SDH, NextGen, and OTN Testing Manual
37
Chapter 2 T-Carrier and PDH Testing
ISDN PRI testing
2 Select the Setup soft key, then select the Interface tab. Specify the applicable settings for the DS1 interface rate:
– Receiver Settings: Specify the input sensitivity and, if applicable, the
line coding method for the receiver or receivers.
– Transmitter Settings: Specify the clock source and offset, and the line
build out (LBO) and line coding method for the transmitter.
3 Specify the following settings:
– Framing settings: ESF or D4(SF)
– Pattern settings (if you intend to BER test the call)
– ISDN settings (see “Specifying General settings” on page 33, “Specifying Call settings” on page 35, and “Specifying Decode filter settings”
on page 37).
4 Connect the instrument to the test access point.
5 Select the Results soft key to return to the Main screen, then verify the
following:
– The Signal Present and Frame Sync LEDs are illuminated.
– In the ISDN Stats result category, verify that the LAPD State result says
Mult. Frm. Est.
6 Select the Call Controls tab on the Action bar, then select the
Connect Call button.
7 Answer the call on the receiving device.
8 Verify that the call status is CONNECTED by observing the Call Status result
screen. If it is not connected, the cause value (indicating the reason the
call was not connected) appears on the screen. See “Understanding the
Q.931 Cause Values” on page 244 for descriptions of each code.
After the call is connected, additional action buttons appear on your instrument. For example, buttons appear that allow you to BERT, idle, and disconnect the call. You can also use a button to insert DTMF tones.
The call is placed.
Receiving calls
If you set up the instrument to prompt you whenever a call comes in, Action
buttons will appear prompting you to accept, reject, or ignore each incoming
call. If you choose to ignore a call, you can accept or reject it later using the
Answer Call or Reject Call button.
To receive an ISDN PRI call
1 Using the Test Menu, select the DS1 ISDN PRI application in Terminate or
Dual Monitor mode (refer to Table 6 on page 10 for a list of applications
and test modes).
2 Select the Setup soft key, then select the Interface tab. Specify the applicable settings for the DS1 interface rate:
– Receiver Settings: Specify the input sensitivity and, if applicable, the
line coding method for the receiver or receivers.
– Transmitter Settings: Specify the clock source and offset, and the line
build out (LBO) and line coding method for the transmitter.
38
PDH, SONET, SDH, NextGen, and OTN Testing Manual
Chapter 2 T-Carrier and PDH Testing
ISDN PRI testing
3 Specify the following settings:
– Framing settings: ESF or D4(SF)
– Pattern settings (if you intend to BER test the call)
– ISDN settings (see “Specifying General settings” on page 33, “Specifying Call settings” on page 35, and “Specifying Decode filter settings”
on page 37).
4 Connect the instrument to the test access point.
5 Select the Results soft key to return to the Main screen, then verify the
following:
– The Signal Present and Frame Sync LEDs are illuminated.
– In the ISDN Stats result category, verify that the LAPD State result says
Mult. Frm. Est.
6 Place the call using the test instrument or device on the far end. A
message appears on your instrument indicating that a call is coming in.
7 Select the Call Controls tab on the Action bar, then do one of the following:
– To answer the call, select the Answer Call.
– To ignore the call, select Ignore Call.
– To reject the call, select Reject Call.
8 Verify that the call status is CONNECTED by observing the Call Status result
screen. If it is not connected, the cause value (indicating the reason the
call was not connected) appears on the screen. See “Understanding the
Q.931 Cause Values” on page 244 for descriptions of each code.
The call is received and connected.
Inserting voice traffic into a
call
When you place or receive a voice call using the instrument, you can use a
USB headset to insert voice traffic into the call’s B Channel. Be certain to use
a JDSU recommended headset with the instrument.
To insert voice traffic into a call
1 If you are using a headset, connect it to the instrument.
2 Do one of the following:
– If you are placing a call, specify the required settings for the call (see
“Placing calls” on page 37).
– If you are receiving a call, accept the call (see “Receiving calls” on
page 38).
3 Verify that the call status is CONNECTED by observing the Call Status result
screen. If it is not connected, the cause value (indicating the reason the
call was not connected) appears on the screen. See “Understanding the
Q.931 Cause Values” on page 244 for descriptions of each code.
4 If no other call is currently using the headset, the instrument automatically
connects the call.
5 Speak into the headset.
Voice traffic is inserted into the call.
PDH, SONET, SDH, NextGen, and OTN Testing Manual
39
Chapter 2 T-Carrier and PDH Testing
ISDN PRI testing
Performing BER analysis of a
call
When you place or receive calls using the instrument, you can perform BER
analysis of the B channel used after each call is connected. In addition to
providing T1 results, the instrument provides statistics collected on the
D Channel and results based on the BER analysis of the B Channel.
To BER test a B Channel
1 Select the Setup soft key, then select the Pattern tab.
2 Select a BERT pattern (for example, 2^23-1).
NOTE:
If a call is connected, both ends are configured for BER analysis (rather
than audio), and your interface settings are specified, you can automatically
detect the correct BERT pattern for the circuit by pressing the Auto button
on the Main screen.
3 Do one of the following:
– If you are placing a call, see “Placing calls” on page 37.
– If you are receiving a call, accept the call (see “Receiving calls” on
page 38).
4 On the Main screen, verify the following:
– The Signal Present and Frame Sync LEDs are illuminated.
– In the ISDN Stats result category, verify that the LAPD State result says
Mult. Frm. Est.
5 Verify that the call status is CONNECTED by observing the Call Status result
screen. If it is not connected, the cause value (indicating the reason the
call was not connected) appears on the screen. See “Understanding the
Q.931 Cause Values” on page 244 for descriptions of each code.
6 Select the Call Controls tab on the Action bar, then select BERT Call to
start transmitting the pattern.
7 Optional. Insert five Bit / TSE errors (see “Verifying performance” on
page 16), and then verify that the five errors were received in the BERT
result category.
The error or errors are inserted into the B Channel.
8 Check the Summary Results or BERT Results screen on the instruments
at each end of the circuit to verify that they received the inserted errors.
9 Optional. If you want to insert voice traffic into the B Channel, do the
following:
a Select Audio Call.
b Speak into the headset.
10 To disconnect the call, select Disconnect Call.
BER testing is complete.
40
PDH, SONET, SDH, NextGen, and OTN Testing Manual
Chapter 2 T-Carrier and PDH Testing
ISDN PRI testing
Transmitting DTMF tones
To insert DTMF tones into a connected call
1 On the Call Controls tab, select DTMF. A keypad appears.
2 Use the keypad to enter the tones.
3 Select Exit to return to the Main screen.
The tones are inserted, and can be heard on the receiving device.
Disconnecting a call
To disconnect a call, do the following
– On the Call Controls tab, select Disconnect Call.
Observing ISDN PRI results
You can observe test results for during IDSN testing in the ISDN and Call result
groups. For details, see “Channel test results” on page 183 and “Traffic test
results” on page 183.
PDH, SONET, SDH, NextGen, and OTN Testing Manual
41
Chapter 2 T-Carrier and PDH Testing
ISDN PRI testing
42
PDH, SONET, SDH, NextGen, and OTN Testing Manual
Chapter 3
SONET and SDH Testing
3
This chapter provides step-by-step instructions to perform SONET and SDH
tests. Topics discussed in this chapter include the following:
– “About SONET and SDH testing” on page 44
– “Specifying the Tx clock source” on page 59
– “Measuring optical power” on page 59
– “Running J-Scan” on page 60
– “BER testing” on page 63
– “Drop and insert testing” on page 66
– “Inserting errors, anomalies, alarms, and defects” on page 68
– “Measuring round trip delay” on page 70
– “Measuring service disruption time” on page 71
– “Viewing a TOH group” on page 72
– “Manipulating overhead bytes” on page 73
– “Capturing POH bytes” on page 74
– “Specifying the J0 or J1 identifier” on page 75
– “Inserting the C2 Path signal label” on page 77
– “Manipulating K1 or K2 APS bytes” on page 79
– “Manipulating the S1 byte” on page 80
– “Adjusting pointers” on page 81
– “Verifying performance” on page 84
– “Monitoring the circuit” on page 85
PDH, SONET, SDH, NextGen, and OTN Testing Manual
43
Chapter 3 SONET and SDH Testing
About SONET and SDH testing
About SONET and SDH testing
If your instrument is configured and optioned to do so, you can use it to analyze
the performance of SONET and SDH networks by performing BER tests,
manipulating and analyzing overhead bytes, adjusting pointers, and verifying
that performance conforms to the industry performance standards.
When you configure the instrument for SONET or SDH testing, a number of the
test parameters vary depending on the protocol (SONET or SDH), rate, and
payload you select.
Features and capabilities
When testing SONET and SDH service, you can generate and analyze muxed
and bulk payloads ranging from 51 Mbps to 100 Gbps for a variety of transport
rates. The instruments also support the following:
– BER testing—You can transmit and detect BERT patterns for each rate
available on the instrument.
– Error/anomaly and alarm/defect insertion—You can insert a variety of
errors, anomalies, alarms, and defects into traffic, such as frame, code,
and logic errors.
– Overhead byte manipulation and analysis—You can manipulate the value
of selected overhead bytes, such as the K1, K2, S1,and Z1 bytes.
– Performance measurement—You can verify that performance complies
with ITU-T G.826, G.828, G.829, M.2101, T1.231, and T1.514 recommendations, with the exception of the 40G/100G High Speed Transport
Module.
– Round trip delay measurement—You can verify that a circuit complies with
round trip delay requirements as specified in a customer’s service level
agreement.
– Tandem connection monitoring—You can monitor and compare performance of Path segments with the aid of the N bytes in the Path overhead.
– Intrusive through mode testing—You can monitor a received signal in
through mode, and then pass the signal through the unit to the transmitter.
The unit will resolve any received line code violations before transmitting
the signal. You can also optionally insert errors or alarms into the transmitted signal (see “Inserting errors, anomalies, alarms, and defects” on
page 68).
– Drop and insert testing—When testing in through mode, you can insert
one channel while non-intrusively passing the remainder of the signal
through unaffected. For example, you can monitor an OC-48 signal, and
then drop a DS3 signal and insert a BER pattern into the DS3 signal,
leaving the rest of the signal as it was received. For details, see “Drop and
insert testing” on page 66. (N/A 40/100G Transport Module)
– Service disruption measurements—You can measure service disruption
time resulting from signal loss or a variety of errors, anomalies, alarms, or
defects. For details, see “Measuring service disruption time” on page 71.
– Pointer Stress Sequences—You can adjust pointers using the Pointer
Stress Sequences. For details, see “Adjusting pointers” on page 81.
– SDH alarm suppression.
– Multiplexed SDH signal analysis from OTN interfaces. You now generate
and analyze bulk BERT payloads in multiplexed SDH signals down to
VC-3. For details, refer to Chapter 6 “OTN Testing”.
44
PDH, SONET, SDH, NextGen, and OTN Testing Manual
Chapter 3 SONET and SDH Testing
About SONET and SDH testing
– Multiplexed SONET signal analysis from OTN interfaces. You can
generate and analyze bulk BERT payloads in multiplexed SONET signals
down to STS-1. For details, refer to Chapter 6 “OTN Testing”.
– NextGen testing—If your instrument is configured and optioned to do so,
you can verify and troubleshoot NextGen service on your network. For
details, refer to Chapter 5 “NextGen Testing”.
– J-Scan (automatic tributary discovery)—The J-Scan application helps you
discover the structure of a SONET or SDH circuit, and then displays a
navigable map of the circuit and its tributaries. You can then check the
status for each of the tributaries, and select them for detailed testing. For
details, refer to “Running J-Scan” on page 60.
– Improved latency resolution—When transmitting high-order SDH or
SONET signals carrying Bulk BERT payloads, latency (delay) can now be
measured with a 100 µs resolution for STS-1 and AU-3 or VC-3 signals,
and 10 µs for signals up to VC-4-64c or STS-192c. All other signals and
mappings are measured with 1 ms resolution.
– Path overhead captures—You can capture high or low path overhead
bytes for a particular tributary for analysis. When configuring the capture,
you can indicate that you want to capture it manually, or specify a trigger to
automate the capture. For details, see “Capturing POH bytes” on page 74.
– STL Layer Testing—the STL layer applies to the OC_768/STM-256 interfaces on the 40/100G Transport Module. With LR 4 optics (4 wavelengths), errors and alarms can be injected for testing. With serial (FR)
optics, the STL layer is used but a number of alarms/errors are non-deterministic.
Understanding the LED panel
When you setup the instrument, you can specify whether the SDH and SONET
LED panels should emulate the LEDs on the JDSU ANT platform or the JDSU
TestPad 2000 platform. If the LEDs are not what you expect or are accustomed
to seeing, verify that the correct emulation mode is selected for your module.
SONET and SDH LEDs are also available when running OTN, 10GigE WAN,
and NextGen applications.
Understanding the graphical
user interface
The names of various elements on the graphical user interface change
depending on whether you select a SONET or SDH test application. For
example, the button that you use to insert errors or anomalies is labeled
Insert Error if you selected a SONET application; the same button is labeled
Insert Anomaly if you selected a SDH application.
Additional elements are available when the instrument is used for NextGen
testing. For details, refer to “About the NextGen user interface” on page 116.
Understanding SONET and
SDH test results
Many SDH and SONET standards are identical; therefore, the instrument
provides similar results for SONET and SDH test applications. See “SONET/
SDH results” on page 187 for a description of each test result.
Additional test results are available when the instrument is used for NextGen
testing. For details, refer to “Understanding the NextGen test results” on
page 119.
PDH, SONET, SDH, NextGen, and OTN Testing Manual
45
Chapter 3 SONET and SDH Testing
About SONET and SDH testing
SONET and SDH test modes
Terminate and monitor test modes are supported for each of the SONET and
SDH applications:
Terminate mode—Select terminate mode to generate, transmit, and analyze
traffic. In terminate mode, the module generates traffic independent of the
received traffic, and allows you to select a tributary to analyze down to the
lowest level available depending on the framing and mapping. The specified
tributary will be used for carrying the data generated by the module. The same
mapping, tributary, and BERT pattern selections will apply to both transmitted
and received traffic.
The transmitter and receiver are set at the same rate using an internal, recovered, or 1.5/2M reference transmit clock.
Monitor mode—Select monitor mode to monitor and analyze traffic. When
monitoring traffic for optical rates a splitter may be required to connect to the
circuit under test.
Through mode—Select through mode if you want your unit to emulate section
terminating equipment or a repeater. When you test in through mode, the unit
can originate specific bytes in the section overhead, and then clean up any
errors detected in the received signal for those specific bytes.
When testing in through mode, all data from sub-rates is untouched, and is
passed through the unit as it was received. For example, if you drop a DS1
from a DS3 signal, no errors, anomalies, alarms, or defects can be inserted
into the DS1 signal.
Drop and insert mode—Select drop and insert mode if you want to insert one
channel of a dropped signal while non-intrusively passing the remainder of the
signal through unaffected. The inserted channel carries a BERT pattern which
allows you to analyze the payload for the dropped signal. For example, if you
drop a DS3 from an STS-1 signal, you can select a specific DS3 channel, and
then insert a BERT pattern as the payload before transmitting the signal for
analysis. (N/A 40/100G Transport Module)
In addition to inserting a BERT payload, you can also manipulate specific overhead bytes, including path layer errors, alarms, and path parameters (for
example, the path trace byte). For this reason, the unit will automatically recalculate SONET and SDH B1 and B2 overhead bytes.
SONET test applications
Table 11 lists each of the SONET test applications, In addition to these applications, a J-Scan application is available (in Monitor mode) for each interface
line rate except OC768.
NextGen (VCAT, LCAS, and GFP) test applications are listed and explained in
Chapter 5 “NextGen Testing”.
46
PDH, SONET, SDH, NextGen, and OTN Testing Manual
Chapter 3 SONET and SDH Testing
About SONET and SDH testing
Table 11 SONET test applications
Signal
Rate
STS-1
DS3
VT-1.5
OC-3
STS-1
DS3
VT-1.5
Payload
Test Mode
Bulk BERT
Terminate
Through
Monitor
Dual Monitor
Drop+Insert
DS3 BERT
Terminate
Through
Monitor
Drop+Insert
DS1 BERT
E1 BERT
Terminate
Through
Monitor
BULK BERT
DS1 BERT
Terminate
Through
Single Monitor
STS-3c Bulk BERT
Terminate
Through
Monitor
Drop+Insert
Bulk BERT
Terminate
Through
Monitor
Drop+Insert
DS3 BERT
Terminate
Through
Monitor
Drop+Insert
DS1 BERT
E1 BERT
Terminate
Through
Monitor
Bulk BERT
DS1 BERT
Terminate
Through
Monitor
PDH, SONET, SDH, NextGen, and OTN Testing Manual
47
Chapter 3 SONET and SDH Testing
About SONET and SDH testing
Table 11 SONET test applications (Continued)
Signal
Rate
OC-12
STS-1
DS3
VT-1.5
OC-48
STS-1
DS3
VT-1.5
48
Payload
Test Mode
STS-12c Bulk BERT
STS-3c Bulk BERT
Terminate
Through
Monitor
Drop+Insert
Bulk BERT
Terminate
Through
Monitor
Drop+Insert
DS3 BERT
Terminate
Through
Monitor
Drop+Insert
DS1 BERT
E1 BERT
Terminate
Through
Monitor
Bulk BERT
DS1 BERT
Terminate
Through
Monitor
STS-48c Bulk BERT
STS-12c Bulk BERT
STS-3c Bulk BERT
Terminate
Through
Monitor
Drop+Insert
Bulk BERT
Terminate
Through
Monitor
Drop+Insert
DS3 BERT
Terminate
Through
Monitor
Drop+Insert
DS1 BERT
E1 BERT
Terminate
Through
Monitor
Bulk BERT
DS1 BERT
Terminate
Through
Monitor
PDH, SONET, SDH, NextGen, and OTN Testing Manual
Chapter 3 SONET and SDH Testing
About SONET and SDH testing
Table 11 SONET test applications (Continued)
Signal
Rate
OC-192
STS-1
DS3
VT-1.5
OC-768
STS-1
SDH test applications
Payload
Test Mode
STS-192c Bulk
BERT
STS-48c Bulk BERT
STS-12c Bulk BERT
STS-3c Bulk BERT
Terminate
Through
Monitor
Drop+Insert
Bulk BERT
Terminate
Through
Monitor
Drop+Insert
DS3 BERT
Terminate
Through
Monitor
Drop+Insert
DS1 BERT
E1 BERT
Terminate
Through
Monitor
Bulk BERT
DS1 BERT
Terminate
Through
Monitor
STL BERT
Terminate
Monitor
STS-768c Bulk
BERT
STS-192c Bulk
BERT
STS-48c Bulk BERT
STS-12c Bulk BERT
STS-3c Bulk BERT
Terminate
Through
Monitor
Bulk BERT
Terminate
Through
Monitor
If your unit is configured and optioned to do so, you can test SDH interfaces
ranging from STM-1e to STM-256.
– For STM-1e applications, see Table 12 on page 50.
– For STM-1 applications, see Table 13 on page 52.
– For STM-4 applications, see Table 14 on page 54.
– For STM-16 applications, see Table 15 on page 55.
– For STM-64 applications, see Table 16 on page 57.
– For STM-256 applications, see Table 17 on page 58
In addition to the applications listed in Table 12 on page 50 through Table 17
on page 58, a J-Scan application is available (in Monitor mode) for all interface
line rates except STM-256.
PDH, SONET, SDH, NextGen, and OTN Testing Manual
49
Chapter 3 SONET and SDH Testing
About SONET and SDH testing
NextGen (VCAT, LCAS, and GFP) test applications are listed and explained in
Chapter 5 “NextGen Testing”.
STM-1e test applications
Table 12 lists each of the supported STM-1e terminate and monitor test applications.
Table 12 STM-1e test applications
Rate
AU-4
Payload
Test Mode
Bulk BERT
Terminate
Through
Monitor
Drop+Insert
E4 BERT
Terminate
Through
Monitor
Drop+Insert
E3 BERT
E1 BERT
Terminate
Through
Monitor
Bulk BERT
Terminate
Through
Monitor
DS3
DS3 BERT
E1 BERT
DS1 BERT
Terminate
Through
Monitor
E3
E3 BERT
E1 BERT
Terminate
Through
Monitor
Bulk BERT
E1 BERT
Terminate
Through
Monitor
VC-4
E4
VC-3
VC-12
50
PDH, SONET, SDH, NextGen, and OTN Testing Manual
Chapter 3 SONET and SDH Testing
About SONET and SDH testing
Table 12 STM-1e test applications (Continued)
Rate
AU-3
VC-3
DS3
E3
VC-12
Payload
Test Mode
Bulk BERT
Terminate
Through
Monitor
Drop+Insert
DS3 BERT
Terminate
Through
Monitor
Drop+Insert
E1 BERT
DS1 BERT
Terminate
Through
Monitor
E3 BERT
Terminate
Through
Monitor
Drop+Insert
E1 BERT
Terminate
Through
Monitor
Bulk BERT
E1 BERT
Terminate
Through
Monitor
PDH, SONET, SDH, NextGen, and OTN Testing Manual
51
Chapter 3 SONET and SDH Testing
About SONET and SDH testing
STM-1 test applications
Table 13 lists each of the supported STM-1 terminate and monitor test applications.
Table 13 STM-1 test applications
Rate
AU-4
Payload
Test Mode
Bulk BERT
Terminate
Through
Monitor
Drop+Insert
E4 BERT
Terminate
Through
Monitor
Drop+Insert
E3 BERT
E1 BERT
Terminate
Through
Monitor
Bulk BERT
Terminate
Through
Monitor
DS3
DS3 BERT
E1 BERT
DS1 BERT
Terminate
Through
Monitor
E3
E3 BERT
E1 BERT
Terminate
Through
Monitor
Bulk BERT
E1 BERT
Terminate
Through
Monitor
VC-4
E4
VC-3
VC-12
52
PDH, SONET, SDH, NextGen, and OTN Testing Manual
Chapter 3 SONET and SDH Testing
About SONET and SDH testing
Table 13 STM-1 test applications (Continued)
Rate
AU-3
VC-3
DS3
E3
VC-12
Payload
Test Mode
Bulk BERT
Terminate
Through
Monitor
Drop+Insert
DS3 BERT
Terminate
Through
Monitor
Drop+Insert
E1 BERT
DS1 BERT
Terminate
Through
Monitor
E3 BERT
Terminate
Through
Monitor
Drop+Insert
E1 BERT
Terminate
Through
Monitor
Bulk BERT
E1 BERT
Terminate
Through
Monitor
PDH, SONET, SDH, NextGen, and OTN Testing Manual
53
Chapter 3 SONET and SDH Testing
About SONET and SDH testing
STM-4 test applications
Table 14 lists each of the supported STM-4 terminate and monitor test applications.
Table 14 STM-4 test applications
Rate
Payload
Test Mode
AU-4
VC-4-4c Bulk BERT
Terminate
Through
Monitor
Drop+Insert
Bulk BERT
Terminate
Through
Monitor
Drop+Insert
E4 BERT
Terminate
Through
Monitor
Drop+Insert
E3 BERT
E1 BERT
Terminate
Through
Monitor
Bulk BERT
Terminate
Through
Monitor
DS3
DS3 BERT
E1 BERT
DS1 BERT
Terminate
Through
Monitor
E3
E3 BERT
E1 BERT
Terminate
Through
Monitor
Bulk BERT
E1 BERT
Terminate
Through
Monitor
VC-4
E4
VC-3
VC-12
54
PDH, SONET, SDH, NextGen, and OTN Testing Manual
Chapter 3 SONET and SDH Testing
About SONET and SDH testing
STM-16 test applications
Table 15 lists each of the supported STM-16 terminate and monitor test applications.
Table 15 STM-16 test applications
Rate
Payload
Test Mode
AU-4
VC-4-16c Bulk BERT
VC-4-4c Bulk BERT
Terminate
Through
Monitor
Drop+Insert
Bulk BERT
Terminate
Through
Monitor
Drop+Insert
E4 BERT
Terminate
Through
Monitor
Drop+Insert
E3 BERT
E1 BERT
Terminate
Through
Monitor
Bulk BERT
Terminate
Through
Monitor
DS3
DS3 BERT
E1 BERT
DS1 BERT
Terminate
Through
Monitor
E3
E3 BERT
E1 BERT
Terminate
Through
Monitor
Bulk BERT
E1 BERT
Terminate
Through
Monitor
VC-4
E4
VC-3
VC-12
PDH, SONET, SDH, NextGen, and OTN Testing Manual
55
Chapter 3 SONET and SDH Testing
About SONET and SDH testing
Table 15 STM-16 test applications (Continued)
Rate
AU-3
VC-3
DS3
E3
VC-12
56
Payload
Test Mode
Bulk BERT
Terminate
Through
Monitor
Drop+Insert
DS3 BERT
Terminate
Through
Monitor
Drop+Insert
E1 BERT
DS1 BERT
Terminate
Through
Monitor
E3 BERT
Terminate
Through
Monitor
Drop+Insert
E1 BERT
Terminate
Through
Monitor
Bulk BERT
E1 BERT
Terminate
Through
Monitor
PDH, SONET, SDH, NextGen, and OTN Testing Manual
Chapter 3 SONET and SDH Testing
About SONET and SDH testing
STM-64 test applications
Table 16 lists each of the supported STM-64 terminate and monitor test applications.
Table 16 STM-64 test applications
Rate
Payload
Test Mode
AU-4
VC-4-64c Bulk BERT
VC-4-16c Bulk BERT
VC-4-4c Bulk BERT
Terminate
Through
Monitor
Drop+Insert
Bulk BERT
Terminate
Through
Monitor
Drop+Insert
E4 BERT
Terminate
Through
Monitor
Drop+Insert
E3 BERT
E1 BERT
Terminate
Through
Monitor
Bulk BERT
Terminate
Through
Monitor
DS3
DS3 BERT
E1 BERT
DS1 BERT
Terminate
Through
Monitor
E3
E3 BERT
E1 BERT
Terminate
Through
Monitor
Bulk BERT
E1 BERT
Terminate
Through
Monitor
VC-4
E4
VC-3
VC-12
PDH, SONET, SDH, NextGen, and OTN Testing Manual
57
Chapter 3 SONET and SDH Testing
About SONET and SDH testing
Table 16 STM-64 test applications (Continued)
Rate
AU-3
VC-3
DS3
E3
VC-12
STM-256 test applications
Payload
Test Mode
Bulk BERT
Terminate
Through
Monitor
Drop+Insert
DS3 BERT
Terminate
Through
Monitor
Drop+Insert
E1 BERT
DS1 BERT
Terminate
Through
Monitor
E3 BERT
Terminate
Through
Monitor
Drop+Insert
E1 BERT
Terminate
Through
Monitor
Bulk BERT
E1 BERT
Terminate
Through
Monitor
Table 17 lists each of the supported STM-256 terminate, through and monitor
test applications.
Table 17 STM-256 test applications
Rate
AU-4
AU-3
58
VC-4
VC-3
Payload
Test Mode
STL BERT
Terminate
Monitor
VC-4-256c Bulk BERT
VC-4-64c Bulk BERT
VC-4-16c Bulk BERT
VC-4-4c Bulk BERT
Terminate
Through
Monitor
Bulk BERT
Terminate
Through
Monitor
Bulk BERT
Terminate
Through
Monitor
PDH, SONET, SDH, NextGen, and OTN Testing Manual
Chapter 3 SONET and SDH Testing
Specifying the Tx clock source
Specifying the Tx clock source
You specify the Tx clock (timing) source on the Interface setup screen.
To set the Tx clock source
1 Using the Test Menu, select the terminate test application for the signal,
rate, and payload you are testing (refer to Table 11 on page 47 through
Table 16 on page 57 for a list of applications).
2 Select the Setup soft key, and then select the Interface tab. Select the
arrows to the right of the Clock Source field, and then select one of the
following:
– Internal. Select Internal to derive timing from the MSAM’s clock, and
then specify any required frequency offset in PPM.
– Recovered. Select Recovered to recover timing from the received
signal.
– External - Bits/Sets. Select External - Bits/Sets timing to derive timing
from one of the following signals, in the following order: BITS, SETS, or
2.048 MHz clock.
3 Select the Results soft key to return to the Main screen, or select another
tab to specify additional test settings.
The Tx clock source is specified.
Measuring optical power
You can use your instrument to measure the optical power of a received signal.
To measure optical power
1 Using the Test Menu, select the terminate test application for the signal,
rate, and payload you are testing (refer to Table 11 on page 47 through
Table 16 on page 57 for a list of applications).
2 Connect a cable from the appropriate RX connector to the network’s
TRANSMIT access connector.
3 Connect a cable from the appropriate TX connector to the network’s
RECEIVE access connector.
4 Select the Laser button.
5 Loop back the far-end of the network.
PDH, SONET, SDH, NextGen, and OTN Testing Manual
59
Chapter 3 SONET and SDH Testing
Running J-Scan
6 Verify the following LEDs
– If your module is in TestPad mode, verify that the following LEDs are
green:
SONET
SDH
Signal Present
Signal Present
Frame Sync
Frame Sync
Path Ptr Present
AU Ptr Present
Concat Payloada
Concat Payloada
Pattern Sync
Pattern Sync
a. If you selected a concatenated payload when you configured your test.
– If your module is in ANT mode, verify that the following LEDs are not
red:
SONET and SDH
LOS
LOF
LSS
7 Display the Interface result group, and then observe the Optical Rx Level
(dBm) test result.
Optical power is measured.
Running J-Scan
The J-Scan application helps you discover the structure of a SONET or SDH
circuit, and displays a list and a map of the containers and channels detected.
You can then use the list or map to select a particular channel for further
testing. (N/A 40/100G Transport Module)
For the purpose of clarity, the term “channel” is used throughout this section to
refer to the various channels, paths, or tributaries detected in SONET or SDH
container signals.
Displaying a map of the
signal structure
To display a map showing the SONET or SDH signal structure
1 Connect the instrument to the interface for the circuit you are testing (refer
to the Getting Started Manual for your instrument).
2 Using the Test Menu, select the J-Scan application for the interface the
instrument is connected to (refer to Table 11 on page 47 through Table 16
on page 57 for a list of applications).
3 Verify that a signal is present, and that you have frame synchronization.
60
PDH, SONET, SDH, NextGen, and OTN Testing Manual
Chapter 3 SONET and SDH Testing
Running J-Scan
4 Select the J-Scan softkey. The instrument automatically displays a map
showing the high path structure of the detected containers and channels
(see Figure 4).
Figure 4
Signal Map Page
If you want to see the Path Trace (J1) for a particular SONET circuit, it is
provided in the standard SONET Path results on the Main screen.
5 If you want to display a map of the low path tributaries (SONET VT-1.5 or
SDH VC-12), select the Low Path button.
A map of the signal structure is displayed, and the first channel is monitored.
Sorting the channels
After displaying the channels, you can sort them by Container ID or Channel
ID. This may be useful before scanning the channels to check their status,
especially if there are multiple containers.
To sort the displayed containers and channels
1 In Sort by, select the criteria (Container or Channel).
2 Select Sort.
The containers and channels are sorted using the criteria you selected. After
scanning the mapped channels for their labels and status, you can also optionally sort the containers and channels by Signal label or Status.
Scanning the map
After the instrument displays a map of the containers and channels, you can
do the following:
– Scan the map using the High Path Scan or Low Path Scan button to
quickly determine the signal label and status for each monitored channel.
– Select a particular channel to observe detailed test results on the Main
screen.
PDH, SONET, SDH, NextGen, and OTN Testing Manual
61
Chapter 3 SONET and SDH Testing
Running J-Scan
– Test a particular channel thoroughly using the Start Test button.
Sort Options
Interface LEDs
Signal
Structure
View
Channel List
Scan Button
Channel Details
Start Test
Figure 5
High Path Low Path Navigation
Scanned Monitored, Errored, and Ok Channels
To scan the mapped channels
1 Display the signal map (see “Displaying a map of the signal structure” on
page 60). Remember to use the Low Path button if you want to observe
VT-1.5 or VC-12 tributaries.
2 Do one of the following:
– If you want to scan high path tributaries, select High Path Scan.
– If you want to scan low path tributaries, select Low Path Scan.
The instrument scans the channels, and then displays the Signal Label and
Status for each channel sequentially. In Figure 5, all displayed channels have
been scanned. The STS-12c channel is errored due to an Alarm condition, and
the instrument is actively monitoring the STS-9c channel.
NOTE:
STS-6c, STS-9c, and STS-24c channels are not standard and therefore are
rarely encountered; however, the instrument can detect and monitor them.
Testing a channel
You can test a particular channel by selecting it on the map, and then launching
the test using the Start Test button.
To test a channel
1 Select the channel on the list or map.
2 Select Start Test, and then select the test for the channel.
The instrument selects the channel, launches the test, and takes you automatically to the Main screen where you can observe results for the tested channel.
62
PDH, SONET, SDH, NextGen, and OTN Testing Manual
Chapter 3 SONET and SDH Testing
BER testing
Using Restart to reset the
status
When running the J-Scan application, pressing the Restart soft key clears the
Signal Label and Status for each channel. It does not re-scan the circuit for
currently active channels. You can then actively re-scan the circuit using the
High Path Scan or Low Path Scan button.
Understanding J-Scan results
When you run the J-Scan application, the list and map of the channels is color
coded.
– Errored channels appear in red with an X to the left of the Container ID.
– Unerrored channels appear on a white background with a blue check mark
to the left of the Container ID.
– Monitored channels appear in yellow, with a circular arrow to the left of the
Container ID.
Detailed test results for the currently selected channel are available on the
Main screen. For example, if you ran the application from a SONET interface,
the standard Section, Line, Path, and VT results are all provided for the
channel that you selected from the list or map of the circuit.
For details, see “Step 5: Viewing test results” on page 4 of Chapter 1 “Basic
Testing”, and “SONET/SDH results” on page 187 of Chapter 7 “Test Results”.
Re-scanning the circuit
To re-scan the circuit after launching the J-Scan application
– Press Low Path Scan or High Path Scan.
The instrument re-scans the circuit to provide the Signal Label and Status for
each channel.
BER testing
The following procedure illustrates a typical scenario for:
– Setting up an instrument to terminate a SONET or SDH signal for BER
testing.
– Inserting errors, anomalies, alarms, and defects on concatenated signals.
NOTE: Changing BERT patterns
If you change a BERT pattern during the course of your test, be certain to
press the Restart soft key to ensure that you regain pattern sync.
Specifying a BERT pattern
You can configure your instrument to transmit a variety of ITU or ANSI patterns
when performing BER tests.
To specify a BER pattern
1 Using the Test Menu, select an application with a BERT payload for the
interface, administrative unit (if applicable), and virtual container you are
testing (refer to Table 11 on page 47 through Table 17 on page 58 for a list
of applications).
PDH, SONET, SDH, NextGen, and OTN Testing Manual
63
Chapter 3 SONET and SDH Testing
BER testing
2 Select the Setup soft key, then the Pattern tab. Select from the following
TX and RX patterns (except where noted):
– PRBS 31
– PRBS 31 Inv
– PRBS 23
– PRBS 23 Inv
– PRBS 9
– PRBS 9 Inv
– Delay
– Live (RX only)
NOTE:
You can automatically detect and transmit the correct BERT pattern for the
circuit by pressing the Auto button on the Main screen after you specify you
interface settings. See “Detecting the received BER pattern” on page 65.
3 Select the Results soft key to return to the Main screen.
The pattern is specified.
Running a BER test
To run a SONET or SDH BER test
1 Using the Test Menu, select the terminate test application for the signal,
rate, and payload you are testing (refer to Table 11 on page 47 through
Table 17 on page 58 for a list of applications).
2 If you selected a E1 BERT payload, and you want to specify timeslots for
your test, proceed to step 3, otherwise, proceed to step 8.
3 Select the PDH tab, and then select the N x 64 Setup tab.
4 Select the arrow to the right of the Payload Type field, and then specify
one of the following:
– Bulk. Proceed to step 8.
– Fractional 2M. The Timeslot configuration appears. Proceed to step 5.
5 You can view the currently selected timeslots in the Timeslot screen. To
change the timeslots you want to test, select the Configure button.
The Configure Timeslot screen appears.
6 To configure the timeslot
To...
Do...
Select all the timeslots
Select the Select All button.
Deselect all the timeslots
Select the Clear All button.
Select a timeslot
Select the checkbox to the right of the timeslot
number.
Clear a timeslot
Clear the checkbox to the right of the timeslot
number.
7 Do one of the following:
– To confirm and finish the timeslot configuration, select OK.
– To cancel configuring the timeslot, select Cancel.
64
PDH, SONET, SDH, NextGen, and OTN Testing Manual
Chapter 3 SONET and SDH Testing
BER testing
8 Specify the BERT pattern (see “Specifying a BERT pattern” on page 63).
9 Select the Results soft key to return to the Main screen.
10 Connect a cable from the appropriate RX connector to the network’s
TRANSMIT access connector.
11 Connect a cable from the appropriate TX connector to the network’s
RECEIVE access connector.
12 If you are testing an optical signal, select the Laser button.
13 Loop back the far-end of the network.
14 Verify the following LEDs
– If your module is in TestPad mode, verify that the following LEDs are
green:
SONET
SDH
Signal Present
Signal Present
Frame Sync
Frame Sync
Path Ptr Present
AU Ptr Present
Concat
Payloada
Pattern Sync
Concat Payloada
Pattern Sync
a. If you selected a concatenated payload when you configured your test.
– If your module is in ANT mode, verify that the following LEDs are not
red:
SONET and SDH
LOS
LOF
LSS
15 Verify that All Results OK appears in the results display.
16 Optional. Insert five Bit / TSE errors (see “Inserting errors, anomalies,
alarms, and defects” on page 68), and then verify that the five errors were
received in the BERT result category.
17 Run the test for an appropriate length of time.
The BER test is finished.
Detecting the received BER
pattern
The instrument can also automatically detect the BER pattern on the received
signal.
To detect the received BER pattern
1 On the Main screen, press the Auto button:
PDH, SONET, SDH, NextGen, and OTN Testing Manual
65
Chapter 3 SONET and SDH Testing
Drop and insert testing
A window appears indicating that the module detected the input signal and
then detected the received pattern.
2 Select Results to return to the Main screen, or Setup to configure additional test parameters.
The pattern is detected.
Drop and insert testing
The following procedure (N/A 40/100G Transport Module) illustrates a typical
scenario for:
– Setting up the instrument to drop a received signal for analysis, and then
BERT test the signal or a particular channel on the signal.
– Manipulating overhead bytes for the transmitted signal.
– Inserting errors, anomalies, alarms, and defects into the transmitted
signal.
To drop a signal and then insert a BERT payload, error, anomaly, alarm, or defect
1 Using the Test Menu, select the drop and insert test application for the
signal, rate, and payload you are testing (refer to Table 11 on page 47
through Table 16 on page 57 for a list of applications).
2 Select the Setup soft key, and then select the SONET or SDH tab.
3 If you are testing a particular channel for the dropped signal, in the panel
on the left side of the tab, select Channel, and then do the following:
a Select the keypad next to the channel field, and then type the number
corresponding to the channel you are testing. The labels that appear
for the channel fields vary depending on the signal you are dropping for
testing. For example, if you are dropping a DS3 signal from an STS-1,
you can specify an STS-N channel for testing. If you are dropping a
VC-3 from an AU-3, you can specify an STM-N channel and an AU-3
channel for testing.
b If you want to transmit the BERT pattern in the same channel that you
are analyzing on the receiver, in the corresponding Tx=Rx field, select
Yes; otherwise, select No, and then specify the channel to transmit with
the BERT pattern.
If you selected the E1 BERT payload, and you want to specify timeslots for
your test, proceed to step 4, otherwise, proceed to step 9.
4 Select the PDH tab, and then select the N x 64 Setup tab.
5 Select the arrow to the right of the Payload Type field, and then specify
one of the following:
– Bulk. Proceed to step 9.
– Fractional 2M. The Timeslot configuration appears. Proceed to step 6.
6 You can view the currently selected timeslots in the Timeslot screen. To
change the timeslots you want to test, select the Configure button.
The Configure Timeslot screen appears.
66
PDH, SONET, SDH, NextGen, and OTN Testing Manual
Chapter 3 SONET and SDH Testing
Drop and insert testing
7 To configure the timeslot
To...
Do...
Select all the timeslots
Select the Select All button.
Deselect all the timeslots
Select the Clear All button.
Select a timeslot
Select the checkbox to the right of the timeslot
number.
Clear a timeslot
Clear the checkbox to the right of the timeslot
number.
8 Do one of the following:
– To confirm and finish the timeslot configuration, select OK.
– To cancel configuring the timeslot, select Cancel.
9 To specify the BERT pattern to insert into the payload, select the Pattern
tab, and then from following Tx and Rx patterns (except as indicated):
– PRBS 31
– PRBS 31 Inv
– PRBS 23
– PRBS 23 Inv
– PRBS 9
– PRBS 9 Inv
– Delay
– Live (Rx only
10 Select the Results soft key to return to the Main screen.
11 Connect a cable from the appropriate RX connector to the network’s
TRANSMIT access connector.
12 Connect a cable from the appropriate TX connector to the network’s
RECEIVE access connector.
13 Select the Laser button.
14 Loop back the far-end of the network.
PDH, SONET, SDH, NextGen, and OTN Testing Manual
67
Chapter 3 SONET and SDH Testing
Inserting errors, anomalies, alarms, and defects
15 Verify the following LEDs
– If your module is in TestPad mode, verify that the following LEDs are
green:
SONET
SDH
PDH
Signal Present
Signal Present
Frame Sync
Frame Sync
Frame Sync
C-Bit Synca
Path Ptr Present
AU Ptr Present
Pattern Sync
Concat Payloadb
Concat Payloada
Pattern Sync
Pattern Sync
a. If you specified C-Bit framing for a dropped PDH signal
b. If you selected a concatenated payload when you configured your test.
– If your module is in ANT mode, verify that the following LEDs are not
red:
SONET and SDH
PDH
LOS
LOF
LOF
FTM
LSS
LSS
16 Verify that All Results OK appears in the results display.
17 Select DI On to generate and transmit the signal with the BERT pattern
you specified.
18 Optional. Manipulate overhead bytes for the transmitted signal (see
“Manipulating overhead bytes” on page 73).
19 Optional. Use the buttons provided on the Main screen to insert errors,
anomalies, alarms, or defects (see “Inserting errors, anomalies, alarms,
and defects” on page 68).
20 Run the test for an appropriate length of time.
The drop and insert test is finished.
Inserting errors, anomalies, alarms, and defects
You can insert multiple types of errors or anomalies and alarms or defects
simultaneously.
NOTE:
Synchronous Transport Lane (STL) specification requires 32-byte lane
spacing but some serial CFP hardware exists that does not conform to this
specification. The 40/100G Transport Module is being shipped with a CFP
Skew value at 0. If, at a later time, hardware changes require a skew value
of 32, that can be set via the Expert Optics selections accessed via the
Setup soft key and then the Interface and Connection tabs.
68
PDH, SONET, SDH, NextGen, and OTN Testing Manual
Chapter 3 SONET and SDH Testing
Inserting errors, anomalies, alarms, and defects
Inserting errors or anomalies
To insert errors or anomalies
1 Using the Test Menu, select the test application for the signal, rate, and
payload you are testing (refer to Table 11 on page 47 through Table 17 on
page 58 for a list of applications).
2 Connect a cable from the appropriate RX connector to the network’s
TRANSMIT access connector.
3 Connect a cable from the appropriate TX connector to the network’s
RECEIVE access connector.
4 Select the Laser button.
5 On the Main screen, select the error or anomaly tab and then select the
error or anomaly to be inserted from the list.
6 Do the following:
– For STL applications, select the Lane tab and then select the lanes into
which the Error is to be inserted.
– If you selected a Frame/FAS Word error, select the keypad icon, type
the number of errors you want to insert (ranging from 1 to 32, or 1to
128 for STL), and then select OK.
– If you selected any other type of error, specify the insert type (Single,
Burst (or Multiple) or Rate).
– If you specified Burst (or Multiple), select the keypad icon, type the
number of errors or anomalies you want to insert, and then select OK.
– If you specified Rate, select one of the error or anomaly rates for the
signal you selected when you configured your test
7 Press the Error Insert or Anomaly Insert button.
Error or anomaly insertion starts, and the associated button turns yellow.
Test results associated with the error or anomaly appear in the Status result
category.
To stop insertion
– Press the Error Insert or Anomaly Insert button again.
Error or anomaly insertion stops, and the associated button turns grey.
Inserting alarms or defects
To insert alarms or defects
1 Using the Test Menu, select the test application for the signal, rate, and
payload you are testing (refer to Table 11 on page 47 through Table 17 on
page 58 for a list of applications).
2 Connect a cable from the appropriate RX connector to the network’s
TRANSMIT access connector.
3 Connect a cable from the appropriate TX connector to the network’s
RECEIVE access connector.
4 On the Main screen, select the alarm or defect tab.’
5 For STL applications, select the Lane tab and then select the lanes into
which the alarm or defect is to be inserted.
6 Select the Laser button.
7 Select an alarm or defect type.
PDH, SONET, SDH, NextGen, and OTN Testing Manual
69
Chapter 3 SONET and SDH Testing
Measuring round trip delay
8 Press the Alarm Insert or Defect Insert button.
The module inserts an alarm or defect, and the button turns yellow.
Test results associated with the alarm or defect appear in the Status result
category.
To stop insertion
– Press the Alarm Insert or Defect Insert button again.
Alarm or defect insertion stops, and the button turns grey.
Measuring round trip delay
You can use the instrument to measure round trip delay by transmitting a delay
pattern, and then looping the pattern back to the module. The module calculates the amount of time it took the pattern to traverse the loop, and then
reports the duration (delay) in milliseconds (ms).
To measure round trip delay
1 Using the Test Menu, select the terminate test application for the signal,
rate, and payload you are testing (refer to Table 11 on page 47 through
Table 17 on page 58 for a list of applications).
2 Select the Setup soft key. A series of setup tabs appears.
3 Specify the Interface settings if the defaults are not acceptable.
4 Select the Pattern tab, and then select the Delay pattern.
5 To return to the Main screen, select the Results soft key.
6 Connect a cable from the appropriate RX connector to the network’s
TRANSMIT access connector.
7 Connect a cable from the appropriate TX connector to the network’s
RECEIVE access connector.
8 If you are testing an optical signal, select the Laser button.
9 Loop back the far-end of the network.
10 Verify the following LEDs:
– If your module is in TestPad mode, verify that the following LEDs are
green:
SONET
SDH
Signal Present
Signal Present
Frame Sync
Frame Sync
Path Ptr Present
AU Ptr Present
Concat
Payloada
Pattern Sync
Concat Payloada
Pattern Sync
a. If you selected a concatenated payload when you configured your test.
70
PDH, SONET, SDH, NextGen, and OTN Testing Manual
Chapter 3 SONET and SDH Testing
Measuring service disruption time
– If your module is in ANT mode, verify that the following LEDs are not
red:
SONET and SDH
LOS
LOF
LSS
11 To observe the delay result, set one of the result windows to display the
Signal category.
Round trip delay is measured.
Measuring service disruption time
You can use the instrument to measure the service disruption time resulting
from a switch in service to a protect line. Before measuring the disruption time,
you can:
– Indicate which events to measure (such as a Signal Loss or LOF).
– Establish an acceptable length of time for the measurements by specifying
a Threshold Time. Measured times for an event that are less than or equal
to the Threshold Time pass the test, measured times that exceed the
Threshold Time fail the test.
– Specify a Separation Time to indicate that the unit should count separate
events that occur within a very brief period of time as a single event. For
example, if you specify a Separation time of 300.000 ms and select AIS-L
as an event trigger, if more than one AIS-L occurs during a 300.000 ms
period, the unit will interpret the events as a single AIS-L disruption. The
count will not increase when another AIS-L occurs until at least
300.000 ms has transpired since the previous AIS-L.
To measure service disruption time
1 Using the Test Menu, select the terminate test application for the signal,
rate, and payload you are testing (refer to Table 11 on page 47 through
Table 17 on page 58 for a list of applications).
2 Select the Setup soft key. A series of setup tabs appears.
3 Select the Service Disruption tab.
4 Under Event Settings, do the following:
a Select Enable Service Disruption.
b Optional. To edit the displayed Separation Time, press the keypad
icon, and then type the new time in milliseconds (ms), or select Default
to restore the time to its default value (300.0 ms). This is the duration
during which each trigger of a specific type will be counted as a single
disruption event.
c Optional. To edit the displayed Threshold Time, press the keypad icon,
and then type the new time in milliseconds (ms), or select Default to
restore the time to its default value (50.0 ms). Disruption measurements that exceed this duration will be interpreted as failed.
PDH, SONET, SDH, NextGen, and OTN Testing Manual
71
Chapter 3 SONET and SDH Testing
Viewing a TOH group
5 Under Event Triggers, do one of the following:
– To measure disruption time for each of the triggers listed, select Set
ALL.
– To measure disruption time for a specific trigger or group of triggers,
select Clear ALL, and then select each of the triggers for measurements.
NOTE: The available triggers vary depending on the test application you
selected. For example, DS3 triggers do not appear if you selected an
OC-3 > STS-1 > Bulk BERT > Terminate application; however, they do
appear if you selected an OC-3 > STS-1 > DS3 > DS3 BERT > Terminate
application.
6 If additional settings need to be modified to reflect the network configuration, select the appropriate tab, and then modify the settings as required.
7 To return to the Main screen, select the Results soft key.
8 Connect a cable from the appropriate RX connector to the network’s
TRANSMIT access connector.
9 Connect a cable from the appropriate TX connector to the network’s
RECEIVE access connector.
10 To force the switch to a protect line, use one of the following methods:
– Interrupt the signal. Physically interrupt the signal by pulling the signal
from the add-drop multiplexer (ADM).
– Insert errors. Use another unit in through mode to insert errors until the
network switches to the backup lines.
The network switches to a protect line, the MSAM detects that service has
been disrupted, and then the module begins to measure the disruption
time in milliseconds until the condition returns to normal.
11 To observe the service disruption results, set one of the result windows to
display the Service Disruption Log, and set another window to display the
Service Disruption Log Stats.
Service disruption is measured for each of the triggers you selected. For
details on the associated test results, see “Service Disruption Results” on
page 200.
Viewing a TOH group
You can specify the TOH (Transport Overhead) group you want to view when
testing using the instrument.
To view a TOH group
1 Using the Test Menu, select the test application for the signal, rate, and
payload you are testing (refer to Table 11 on page 47 through Table 17 on
page 58 for a list of applications).
2 Select the Setup soft key, and then select the SONET or SDH tab.
3 In the panel on the left side of the tab, select Overhead.
A graphical display of the overhead bytes appears.
72
PDH, SONET, SDH, NextGen, and OTN Testing Manual
Chapter 3 SONET and SDH Testing
Manipulating overhead bytes
4 Under Overhead Bytes, select the field to the right of the Analysis
Channel, type the TOH group number, and then select OK.
The selected TOH channel group appears in the Sonet Overhead result
display.
Manipulating overhead bytes
The following procedure describes how to manipulate the value of selected
overhead bytes, and then view the byte values in the Overhead result category.
To manipulate an overhead byte
1 Using the Test Menu, select the test application for the signal, rate, and
payload you are testing (refer to Table 11 on page 47 through Table 17 on
page 58 for a list of applications).
2 Select the SONET or SDH Overhead soft key.
Figure 4 shows the display for a classic SONET application.
Figure 6
Overhead byte display - Classic SONET application
The Line/Multiplexor Section bytes appear in green; the Section/Regenerator Section bytes appear in grey. Path/High Path overhead bytes appear
in blue.
– Bytes labeled using a black font can be manipulated.
– Bytes labeled using a white font cannot be manipulated.
– The Default button restores any bytes you changed to their default
value.
3 To change the value of a byte, do the following:
a Select the byte you want to manipulate.
b Select the Overhead Byte Editor field, type the new byte value, and
then select OK.
The new value appears in the field and will be transmitted in the overhead when you start your test.
4 Select the Results soft key to return to the Main screen.
PDH, SONET, SDH, NextGen, and OTN Testing Manual
73
Chapter 3 SONET and SDH Testing
Capturing POH bytes
5 Connect a cable from the appropriate RX connector to the network’s
TRANSMIT access connector.
6 Connect a cable from the appropriate TX connector to the network’s
RECEIVE access connector.
7 If you are testing an optical signal, select the Laser button.
8 Loop back the far-end of the network.
9 Verify the following LEDs:
– If your module is in TestPad mode, verify that the following LEDs are
green:
SONET
SDH
Signal Present
Signal Present
Frame Sync
Frame Sync
Path Ptr Present
AU Ptr Present
Concat Payloada
Concat Payloada
Pattern Sync
Pattern Sync
a. If you selected a concatenated payload when you configured your test.
– If your module is in ANT mode, verify that the following LEDs are not
red:
SONET and SDH
LOS
LOF
LSS
10 To view overhead byte values on the Main screen, select the SONET or
SDH result group, and then select the Overhead result category.
The overhead byte is manipulated.
Capturing POH bytes
You can now capture high and low path overhead bytes. When configuring the
capture, you can indicate that you want to capture it manually, or specify a
trigger to automate the capture. Path capture is currently supported on the
MSAM only.
To capture a POH byte
1 If you haven’t already done so, use the Test Menu to select the BERT test
application for the interface you are testing.
– Refer to Table 11 on page 47 through Table 17 on page 58 for a list of
SONET and SDH applications.
– Refer to Table 22 on page 122 through Table 29 on page 132 for a list
of NextGen applications.
74
PDH, SONET, SDH, NextGen, and OTN Testing Manual
Chapter 3 SONET and SDH Testing
Specifying the J0 or J1 identifier
2 Select the SONET Overhead soft key, and then select the
POH Byte Capture tab.
3 Specify values for the following settings:
Setting
Value
Tributary Settings
When running classic SONET or SDH tests,
specify the settings that identify the tributary
you are capturing the byte for in the associated fields.
Rx VCG Member
(NextGen applications only)
Select the member you want to capture the
byte for.
Trigger
Select one of the following:
– Manual (only method available for 40/
100G Transport Module).
– Alarm.
– Compare Byte.
– Compare Not Byte.
Alarm Type
(only appears if Trigger is
Alarm)
Select the type of alarm that will trigger an
automatic capture:
– AIS-L
– RDI-L
– AIS-P
– LOP-P
Compare (Binary)
(only appears if Trigger is
Compare Byte or Compare
Not Byte).
Specify the received byte value that you want
matched, or the value that should not be
matched to force an automatic capture. For
example, if you want the instrument to capture the byte if it receives 01100110, enter
01100110. You can also enter X using the
Don’t Care button to wildcard the match (or
don’t match) value.
Select Byte
In the blue panel, select the byte to capture.
4 Select the Start button to the right of the Capture Settings, then observe
the capture log at the bottom right of the screen.
The POH byte is captured.
Specifying the J0 or J1 identifier
You can specify the J0 (Section or RSOH trace) or J1 (Path HP trace) identifier
using a variety of formats.
To specify the J0 or J1 trace identifier
1 Using the Test Menu, select the test application for the signal, rate, and
payload you are testing (refer to Table 11 on page 47 through Table 17 on
page 58 for a list of applications).
2 Select the Setup soft key, and then select the SONET or SDH tab.
PDH, SONET, SDH, NextGen, and OTN Testing Manual
75
Chapter 3 SONET and SDH Testing
Specifying the J0 or J1 identifier
3 In the panel on the left side of the tab, select one of the following:
– Section or RS, if you want to edit the J0 trace identifier.
– Path or HP, if you want to edit the J1 trace identifier.
Settings appear for the traces.
4 To change a trace, do the following:
a Select a trace format (for example, Single Byte).
b If you selected the Single Byte format, select the keypad icon to the
right of the Trace Identifier field, type the byte value, and then select
OK.
c If you selected any format other than Single Byte, select the keypad
icon to the right of the Trace Identifier field, type the identifier, and then
select OK.
The new identifier will be transmitted in the overhead when you start your
test.
NOTE:
You can reset the trace and expected trace format or identifier at any time
using the Default buttons.
5 Optional. If you want the unit to display a TIM-P alarm if the expected and
incoming trace values do not match, select Yes; otherwise, select No.
6 Repeat step 2 on page 75 for the Outgoing Path Trace format and identifier.
7 Select the Results soft key to return to the Main screen.
8 Connect a cable from the appropriate RX connector to the network’s
TRANSMIT access connector.
9 Connect a cable from the appropriate TX connector to the network’s
RECEIVE access connector.
10 If you are testing an optical signal, select the Laser button.
11 Loop up the far-end of the network.
76
PDH, SONET, SDH, NextGen, and OTN Testing Manual
Chapter 3 SONET and SDH Testing
Inserting the C2 Path signal label
12 Verify the following LEDs
– If your module is in TestPad mode, verify that the following LEDs are
green:
SONET
SDH
Signal Present
Signal Present
Frame Sync
Frame Sync
Path Ptr Present
AU Ptr Present
Concat Payloada
Concat Payloada
Pattern Sync
Pattern Sync
a. If you selected a concatenated payload when you configured your test.
– If your module is in ANT mode, verify that the following LEDs are not
red:
SONET and SDH
LOS
LOF
LSS
13 To view the J0 or J1 trace values, select the SONET or SDH result group,
and then select the Section/RSOH and Path/HP result categories.
The trace byte or identifier is inserted into the overhead.
Inserting the C2 Path signal label
You can insert the C2 Path signal label using a variety of formats.
To insert the C2 Path signal label
1 Using the Test Menu, select the test application for the signal, rate, and
payload you are testing (refer to Table 11 on page 47 through Table 17 on
page 58 for a list of applications).
2 Select the Setup soft key, and then select the SONET or SDH tab.
3 In the panel on the left side of the tab, select Signal Label.
Settings appear for the label.
PDH, SONET, SDH, NextGen, and OTN Testing Manual
77
Chapter 3 SONET and SDH Testing
Inserting the C2 Path signal label
4 Select the Signal Label and Expected Signal Label.
The new label will be transmitted in the overhead when you start your test.
5 Optional. If you want the unit to display an HP-PLM alarm if the labels in
received payloads do not match the expected label, select Yes; otherwise,
select No.
NOTE:
You can reset the label and expected label at any time using the Default
buttons.
6 Select the Results soft key to return to the Main screen.
7 Connect a cable from the appropriate RX connector to the network’s
TRANSMIT access connector.
8 Connect a cable from the appropriate TX connector to the network’s
RECEIVE access connector.
9 If you are testing an optical signal, select the Laser button.
10 Loop back the far-end of the network.
11 Verify the following LEDs:
– If your module is in TestPad mode, verify that the following LEDs are
green:
SONET
SDH
Signal Present
Signal Present
Frame Sync
Frame Sync
Path Ptr Present
AU Ptr Present
Concat
Payloada
Pattern Sync
Concat Payloada
Pattern Sync
a. If you selected a concatenated payload when you configured your test.
– If your module is in ANT mode, verify that the following LEDs are not
red:
SONET and SDH
LOS
LOF
LSS
78
PDH, SONET, SDH, NextGen, and OTN Testing Manual
Chapter 3 SONET and SDH Testing
Manipulating K1 or K2 APS bytes
12 To view the C2 label, select and display the SONET or SDH result group,
and then select the Overhead and Path/MSOH result categories.
The C2 Path signal label is inserted into the overhead.
Manipulating K1 or K2 APS bytes
You can manipulate the K1 or K2 APS bytes for ring or linear network topologies.
To manipulate K1 or K2 bytes
1 Using the Test Menu, select the test application for the signal, rate, and
payload you are testing (refer to Table 11 on page 47 through Table 17 on
page 58 for a list of applications).
2 Select the Setup soft key, and then select the SONET or SDH tab.
3 In the panel on the left side of the tab, select APS (K1/K2).
Settings appear for the bytes.
4 In APS Network Topology, specify Ring or Linear as the topology.
5 If you selected a linear topology, skip this step, and proceed to step 6 on
page 79. If you selected a Ring topology, do the following:
a For the K1 byte, specify a Bridge Request Code (for example, 0001
RR-R) and a Destination Node ID (for example, 0001 1),
b For the K2 byte, specify a Source Node ID (for example, 0001 1), Path
Code (for example, 0 Short), and Status code (for example, 001 Br).
6 If you selected a linear topology, do the following:
a For the K1 byte, specify a Request Code (for example, 0001 DnR) and
a Channel Number (for example, 0001 1).
b For the K2 byte, specify a Bridge Channel (for example, 0010 2), MSP
Architecture (for example, 0 1+1), and Status (for example,
001 Unknown).
7 Select the Results soft key to return to the Main screen.
8 Connect a cable from the appropriate RX connector to the network’s
TRANSMIT access connector.
9 Connect a cable from the appropriate TX connector to the network’s
RECEIVE access connector.
10 If you are testing an optical signal, select the Laser button.
11 Loop back the far-end of the network.
PDH, SONET, SDH, NextGen, and OTN Testing Manual
79
Chapter 3 SONET and SDH Testing
Manipulating the S1 byte
12 Verify the following LEDs:
– If your module is in TestPad mode, verify that the following LEDs are
green:
SONET
SDH
Signal Present
Signal Present
Frame Sync
Frame Sync
Path Ptr Present
AU Ptr Present
Concat Payloada
Concat Payloada
Pattern Sync
Pattern Sync
a. If you selected a concatenated payload when you configured your test.
– If your module is in ANT mode, verify that the following LEDs are not
red:
SONET and SDH
LOS
LOF
LSS
13 To view the K1 or K2 byte transitions, select the K1/K2 Linear or K1/K2
Ring result category.
The K1 and K2 bytes are manipulated. You can view them in the K1/K2 Log
provided in the SONET or SDH result group.
Manipulating the S1 byte
You can modify the S1 byte (used to indicate the synchronization status of the
network) before transmitting traffic when testing SONET or SDH interfaces.
To manipulate the S1 byte
1 Using the Test Menu, select the test application for the signal, rate, and
payload you are testing (refer to Table 11 on page 47 through Table 17 on
page 58 for a list of applications).
2 Select the Setup soft key, and then select the SONET or SDH tab.
3 In the panel on the left side of the tab, select Sync Status.
Settings appear for the bytes.
4 Select a sync status byte (for example, (1100 SONET Clock Trace).
5 Select the Results soft key to return to the Main screen.
6 Connect a cable from the appropriate RX connector to the network’s
TRANSMIT access connector.
80
PDH, SONET, SDH, NextGen, and OTN Testing Manual
Chapter 3 SONET and SDH Testing
Adjusting pointers
7 Connect a cable from the appropriate TX connector to the network’s
RECEIVE access connector.
8 If you are testing an optical signal, select the Laser button.
9 Loop back the far-end of the network.
10 Verify the following LEDs:
– If your module is in TestPad mode, verify that the following LEDs are
green:
SONET
SDH
Signal Present
Signal Present
Frame Sync
Frame Sync
Path Ptr Present
AU Ptr Present
Concat
Payloada
Pattern Sync
Concat Payloada
Pattern Sync
a. If you selected a concatenated payload when you configured your test.
– If your module is in ANT mode, verify that the following LEDs are not
red:
SONET and SDH
LOS
LOF
LSS
11 To view the transmitted Sync Status (S1) byte, select the Line result category.
The S1 byte is manipulated. You can observe it in the Line/MSOH result category provided in the SONET or SDH result group
Adjusting pointers
You can adjust pointers manually or by using the Pointer Stress Sequences,
and then optionally measure induced jitter on a dropped T-Carrier or PDH
signal.
Adjusting pointers manually
The following procedure describes how to manually adjust pointers.
To adjust pointers manually
1 Using the Test Menu, select the test application for the signal, rate, and
payload you are testing (refer to Table 11 on page 47 through Table 17 on
page 58 for a list of applications).
2 Configure your test settings (refer to the applicable test procedure in this
chapter), and then start the test.
PDH, SONET, SDH, NextGen, and OTN Testing Manual
81
Chapter 3 SONET and SDH Testing
Adjusting pointers
3 On the Main screen, on the Pointer toolbar, select one of the following:
– Increment: Increases the pointer value by one.
– Decrement: Decreases the pointer value by one.
– +2 NDF: Sets the new data flag, and increases the pointer value by
two.
– -2 NDF: Sets the new data flag, and decreases the pointer value by
two.
4 Select the Path/VT Pointer Adjust (for SONET), or AU/TU Pointer
Adjust (for SDH) action button to adjust the appropriate pointer.
5 To observe the pointer value, number of adjustments, and pointer increments and decrements, do one of the following:
– If you are testing a SONET circuit, select the Path or VT result categories provided in the SONET result group.
– If you are testing a SDH circuit, select the HP or LP results categories
provided in the SDH result group.
The pointer is manually adjusted.
Adjusting pointers using
pointer stress sequences
You can adjust the pointers using the Pointer Stress Sequences to induce jitter
in PDH signals demuxed from SONET and SDH signals. The Pointer Stress
Sequence test combined with a PDH jitter test allow you to determine if a
network element produces excessive jitter when stressful pointer operations
occur. This test uses the pointer sequences specified in G.783 recommendations. For details, refer to the ITU-T Recommendation G.783.
The following procedure describes how to adjust pointers using a pointer
stress sequence.
To adjust pointers with a pointer sequence
1 Using the Test Menu, select the test application for the signal, rate, and
payload you are testing (refer to Table 11 on page 47 through Table 17 on
page 58 for a list of applications).
2 Configure your test settings (refer to the applicable test procedure in this
chapter), and then start the test.
3 Select the Setup soft key, and then select the SONET or SDH tab.
4 In the panel on the left side of the tab, do one of the following:
– If you are testing a SONET circuit, select Path Pointer or VT Pointer.
– If you are testing a SDH circuit, select AU Pointer or TU Pointer.
82
PDH, SONET, SDH, NextGen, and OTN Testing Manual
Chapter 3 SONET and SDH Testing
Adjusting pointers
Settings appear for the pointer test sequences. Figure 7 illustrates the
settings that appear when you select one of the H sequences for SONET
tests.
Figure 7
Pointer Stress Sequence Settings
5 In G.783 Section, select the pointer sequence you want to apply to the
test. For details on each test pattern, refer to the ITU-T Recommendation
G.783.
6 Specify the time variables in seconds for the test sequence you selected
by doing the following:
a Select the keypad icon to the right of the T field.
b Type the value in seconds, and then select OK. The value you specified appears in the corresponding field.
For details on the adjustable values, refer to the ITU-T Recommendation
G.783.
7 Select the Results soft key to return to the Main screen.
8 On the Main screen, do one of the following:
– If you are testing a SONET circuit, in the Path or VT Pointer field, select
Sequence.
– If you are testing a SDH circuit, in the AU or TU Pointer fields, select
Sequence.
9 Do one of the following:
– If you are testing a SONET circuit, select the Path Pointer Adjust or
VT Pointer Adjust action button to adjust the pointer.
– If you are testing a SDH circuit, select the AU Pointer Adjust or TU
Pointer Adjust action button to adjust the pointer.
The pointer is adjusted by the test sequence.
PDH, SONET, SDH, NextGen, and OTN Testing Manual
83
Chapter 3 SONET and SDH Testing
Verifying performance
Verifying performance
You can verify that performance complies with the ITU-T and ANSI recommendations for error and anomaly performance.
To verify performance
1 Using the Test Menu, select the test application for the signal, rate, and
payload you are testing (refer to Table 11 on page 47 through Table 17 on
page 58 for a list of applications).
2 Select the Setup soft key, and then select the Performance tab.
3 Select a recommendation (specification).
4 Specify the Path allocation percentage by doing the following:
a Select the Path Allocation% field.
b Type the percentage or threshold, and then select OK. The percentage
or threshold appears in the corresponding field.
5 If you want to enable the UAS limit, select Yes.
6 To view the performance measurements, press the Results soft key to
return to the Main screen.
7 Verify the following LEDs:
– If your module is in TestPad mode, verify that the following LEDs are
green:
SONET
SDH
Signal Present
Signal Present
Frame Sync
Frame Sync
Path Ptr Present
AU Ptr Present
Concat Payloada
Concat Payloada
Pattern Sync
Pattern Sync
a. If you selected a concatenated payload when you configured your test.
84
PDH, SONET, SDH, NextGen, and OTN Testing Manual
Chapter 3 SONET and SDH Testing
Monitoring the circuit
– If your module is in ANT mode, verify that the following LEDs are not
red:
SONET and SDH
LOS
LOF
LSS
Ptr Justifications
8 To observe performance results, select the SONET or SDH result group,
and then select the result category for the specification you specified.
Performance measurements are verified.
Monitoring the circuit
Use the monitor applications whenever you want to analyze the received signal
and pass the signal unchanged through to the unit’s transmitter.
To monitor a circuit
1 Using the Test Menu, select the monitor test application for the signal,
rate, and payload you are testing (refer to Table 11 on page 47 through
Table 17 on page 58 for a list of applications).
2 Connect the module to the circuit.
3 Observe the test results.
The circuit is monitored.
PDH, SONET, SDH, NextGen, and OTN Testing Manual
85
Chapter 3 SONET and SDH Testing
Monitoring the circuit
86
PDH, SONET, SDH, NextGen, and OTN Testing Manual
Chapter 4
Jitter and Wander Testing
4
This chapter provides step-by-step instructions for measuring jitter and wander
on T-Carrier, PDH, SONET, SDH, or OTN networks using the instrument.
Topics discussed in this chapter include the following:
– “About jitter and wander testing” on page 88
– “Before testing” on page 93
– “Transmitting jitter” on page 93
– “Manually measuring jitter” on page 95
– “Automatic Measurement Sequences” on page 96
– “Transmitting wander” on page 103
– “Measuring and analyzing wander” on page 104
– “1PPS Analysis” on page 109
PDH, SONET, SDH, NextGen, and OTN Testing Manual
87
T-BERD ⁄ MTS 8000 and T-BERD ⁄ MTS 6000A
Transport Module, 40/100G Transport Module, and
Multiple Services Application Module
Ethernet, IP, TCP/UDP, Fibre Channel, VoIP, and IP Video Testing Manual
T-BERD ⁄ MTS 8000 and T-BERD ⁄ MTS 6000A
Transport Module, 40/100G Transport Module, and
Multiple Services Application Module
Ethernet, IP, TCP/UDP, Fibre Channel, VoIP, and IP Video Testing Manual
Communications Test and Measurement Solutions
One Milestone Center Court
Germantown, Maryland 20876-7100 USA
Toll Free 1-855-ASK-JDSU • Tel +1-240-404-2999 • Fax +1-240-404-2195
www.jdsu.com
Notice
Every effort was made to ensure that the information in this manual was accurate at the time of printing. However, information is subject to change without
notice, and JDS Uniphase reserves the right to provide an addendum to this
manual with information not available at the time that this manual was created.
Copyright
© Copyright 2013 JDS Uniphase Corporation. All rights reserved. JDSU, Communications Test and Measurement Solutions, and its logo are trademarks of
JDS Uniphase Corporation (“JDS Uniphase”). All other trademarks and registered trademarks are the property of their respective owners. No part of this
guide may be reproduced or transmitted electronically or otherwise without
written permission of the publisher.
Copyright release
Reproduction and distribution of this guide is authorized for Government purposes only.
Trademarks
JDS Uniphase, JDSU, MTS 6000A, T-BERD 6000A, MTS 8000, and
T-BERD 6000A are trademarks or registered trademarks of JDS Uniphase in
the United States and/or other countries.
Cisco is a registered trademark of Cisco and/or its affiliates in the U.S. and certain other countries.
NetFlow is a trademark of Cisco Systems, Inc. in the United States and certain
other countries.
Wireshark is a registered trademark of the Wireshark Foundation.
All trademarks and registered trademarks are the property of their respective
companies.
ii
Terms and conditions
Specifications, terms, and conditions are subject to change without notice. The
provision of hardware, services, and/or software are subject to JDSU’s standard terms and conditions, available at www.jdsu.com/terms.
FCC Notice
This equipment has been tested and found to comply with the limits for a Class
A digital device, pursuant to Part 15 of the FCC Rules. These limits are
designed to provide reasonable protection against harmful interference when
the equipment is operated in a commercial environment. This equipment generates, uses, and can radiate radio frequency energy and, if not installed and
used in accordance with the instruction manual, may cause harmful interference to radio communications. Operation of this equipment in a residential
area is likely to cause harmful interference in which case the user will be
required to correct the interference at their own expense.
Ordering information
The catalog number for a printed getting started manual is ML-21138652. The
catalog number for a printed testing manual is ML-21148867. The catalog
number for electronic manuals on USB is CEML-21138299.
WEEE and Battery Directive
Compliance
JDSU has established processes in compliance with the Waste Electrical and
Electronic Equipment (WEEE) Directive, 2002/96/EC, and the Battery Directive, 2006/66/EC.
Ethernet, IP, TCP/UDP, Fibre Channel, VoIP, and IP Video Testing Manual
This product, and the batteries used to power the product, should not be disposed of as unsorted municipal waste and should be collected separately and
disposed of according to your national regulations. In the European Union, all
equipment and batteries purchased from JDSU after 2005-08-13 can be
returned for disposal at the end of its useful life. JDSU will ensure that all waste
equipment and batteries returned are reused, recycled, or disposed of in an
environmentally friendly manner, and in compliance with all applicable national
and international waste legislation.
It is the responsibility of the equipment owner to return equipment and batteries
to JDSU for appropriate disposal. If the equipment or battery was imported by
a reseller whose name or logo is marked on the equipment or battery, then the
owner should return the equipment or battery directly to the reseller.
Instructions for returning waste equipment and batteries to JDSU can be found
in the Environmental section of JDSU’s web site at www.jdsu.com. If you have
questions concerning disposal of your equipment or batteries, contact JDSU’s
WEEE Program Management team at [email protected].
Ethernet, IP, TCP/UDP, Fibre Channel, VoIP, and IP Video Testing Manual
iii
iv
Ethernet, IP, TCP/UDP, Fibre Channel, VoIP, and IP Video Testing Manual
Contents
About this Manual
xvii
Purpose and scope . . . . . . . . . . . . . . . . . . . . . . . . . . . . . . . . . . . . . . . . . xviii
Assumptions . . . . . . . . . . . . . . . . . . . . . . . . . . . . . . . . . . . . . . . . . . . . . . xviii
Terminology . . . . . . . . . . . . . . . . . . . . . . . . . . . . . . . . . . . . . . . . . . . . . . . xviii
Ethernet, IP, TCP/UDP, Fibre Channel, and IP Video Testing Manual . . xx
Conventions . . . . . . . . . . . . . . . . . . . . . . . . . . . . . . . . . . . . . . . . . . . . . . . . xxi
Safety and compliance information . . . . . . . . . . . . . . . . . . . . . . . . . . . . xxii
Technical assistance . . . . . . . . . . . . . . . . . . . . . . . . . . . . . . . . . . . . . . . . xxii
Chapter 1
Chapter 2
Basic Testing
1
Step 1: Selecting a test application . . . . . . . . . . . . . . . . . . . . . . . . . . . . . .
Step 2: Configuring a test . . . . . . . . . . . . . . . . . . . . . . . . . . . . . . . . . . . . . .
Step 3: Connecting the instrument to the circuit . . . . . . . . . . . . . . . . . . .
Step 4: Starting the test. . . . . . . . . . . . . . . . . . . . . . . . . . . . . . . . . . . . . . . .
Step 5: Viewing test results . . . . . . . . . . . . . . . . . . . . . . . . . . . . . . . . . . . .
Setting the result group and category . . . . . . . . . . . . . . . . . . . . . . . . . . .
Additional test result information . . . . . . . . . . . . . . . . . . . . . . . . . . . . . . .
Running multiple tests . . . . . . . . . . . . . . . . . . . . . . . . . . . . . . . . . . . . . . . .
2
2
3
3
4
4
4
5
3.072G Optical Testing
7
About 3.072G Optical testing . . . . . . . . . . . . . . . . . . . . . . . . . . . . . . . . . . . 8
BER Testing 3.072G Optical Layer 1 . . . . . . . . . . . . . . . . . . . . . . . . . . . . . 8
Monitoring 3.072G Optical Layer 1. . . . . . . . . . . . . . . . . . . . . . . . . . . . . . . 9
Chapter 3
CPRI/OBSAI Testing
11
About CPRI/OBSAI testing . . . . . . . . . . . . . . . . . . . . . . . . . . . . . . . . . . . .
Layer 1 BER Testing . . . . . . . . . . . . . . . . . . . . . . . . . . . . . . . . . . . . . . . . .
Layer 2 CPRI testing . . . . . . . . . . . . . . . . . . . . . . . . . . . . . . . . . . . . . . . . .
Inserting alarms. . . . . . . . . . . . . . . . . . . . . . . . . . . . . . . . . . . . . . . . . . .
Inserting errors . . . . . . . . . . . . . . . . . . . . . . . . . . . . . . . . . . . . . . . . . . . . .
Monitoring CPRI or OBSAI layer 1 . . . . . . . . . . . . . . . . . . . . . . . . . . . . . .
12
12
15
16
17
17
Ethernet, IP, TCP/UDP, Fibre Channel, and IP Video Testing Manual
v
Contents
Chapter 4
vi
Ethernet and IP Testing
19
About Ethernet and IP testing. . . . . . . . . . . . . . . . . . . . . . . . . . . . . . . . . .
Features and capabilities. . . . . . . . . . . . . . . . . . . . . . . . . . . . . . . . . . . .
Understanding the graphical user interface . . . . . . . . . . . . . . . . . . . . . .
Frame settings . . . . . . . . . . . . . . . . . . . . . . . . . . . . . . . . . . . . . . . .
Packet settings . . . . . . . . . . . . . . . . . . . . . . . . . . . . . . . . . . . . . . . .
Ethernet and IP test applications . . . . . . . . . . . . . . . . . . . . . . . . . . . . . .
MiM test applications . . . . . . . . . . . . . . . . . . . . . . . . . . . . . . . . . . . . . . .
MPLS-TP test applications . . . . . . . . . . . . . . . . . . . . . . . . . . . . . . . . . .
PTP/1588 test applications . . . . . . . . . . . . . . . . . . . . . . . . . . . . . . . . . .
Configuring applications in Dual Through mode . . . . . . . . . . . . . . . . . .
Configuring 10 Gigabit Ethernet WAN tests. . . . . . . . . . . . . . . . . . . . . .
Configuring Ethernet VPLS tests . . . . . . . . . . . . . . . . . . . . . . . . . . . . . .
VPLS tunnels . . . . . . . . . . . . . . . . . . . . . . . . . . . . . . . . . . . . . . . . .
Virtual channels. . . . . . . . . . . . . . . . . . . . . . . . . . . . . . . . . . . . . . . .
VPLS test applications . . . . . . . . . . . . . . . . . . . . . . . . . . . . . . . . . .
Configuring MPLS over Ethernet tests . . . . . . . . . . . . . . . . . . . . . . . . .
Configuring IPv4 and IPv6 tests . . . . . . . . . . . . . . . . . . . . . . . . . . . . . .
Cable Diagnostics . . . . . . . . . . . . . . . . . . . . . . . . . . . . . . . . . . . . . . . . . . .
Running cable diagnostics. . . . . . . . . . . . . . . . . . . . . . . . . . . . . . . . . . .
Viewing cable measurements . . . . . . . . . . . . . . . . . . . . . . . . . . . . . . . .
Adjusting the frequency of transmitted optical signals . . . . . . . . . . . . .
Enabling automatic traffic transmission . . . . . . . . . . . . . . . . . . . . . . . . .
Prerequisites for traffic transmission . . . . . . . . . . . . . . . . . . . . . . . . . . .
Issues to consider . . . . . . . . . . . . . . . . . . . . . . . . . . . . . . . . . . . . . . . . .
Enabling the feature. . . . . . . . . . . . . . . . . . . . . . . . . . . . . . . . . . . . . . . .
Discovering another JDSU test instrument using J-Connect . . . . . . . .
Discoverable instruments . . . . . . . . . . . . . . . . . . . . . . . . . . . . . . . . . . .
Prerequisites . . . . . . . . . . . . . . . . . . . . . . . . . . . . . . . . . . . . . . . . . . . . .
Discovering an instrument . . . . . . . . . . . . . . . . . . . . . . . . . . . . . . . . . . .
About the Refresh key . . . . . . . . . . . . . . . . . . . . . . . . . . . . . . . . . . . . . .
Sorting discovered instruments . . . . . . . . . . . . . . . . . . . . . . . . . . . . . . .
Observing details for an instrument . . . . . . . . . . . . . . . . . . . . . . . . . . . .
Discovering network devices . . . . . . . . . . . . . . . . . . . . . . . . . . . . . . . . . .
Protocol Analysis . . . . . . . . . . . . . . . . . . . . . . . . . . . . . . . . . . . . . . . . . . . .
Layer 1 BER testing . . . . . . . . . . . . . . . . . . . . . . . . . . . . . . . . . . . . . . . . . .
BER testing layer 1 . . . . . . . . . . . . . . . . . . . . . . . . . . . . . . . . . . . . . . . .
Monitoring layer 1 BER . . . . . . . . . . . . . . . . . . . . . . . . . . . . . . . . . . . . .
Link connectivity testing. . . . . . . . . . . . . . . . . . . . . . . . . . . . . . . . . . . . .
Layer 2 testing . . . . . . . . . . . . . . . . . . . . . . . . . . . . . . . . . . . . . . . . . . . . . .
Specifying interface settings . . . . . . . . . . . . . . . . . . . . . . . . . . . . . . . . .
Specifying Ethernet frame settings . . . . . . . . . . . . . . . . . . . . . . . . . . . .
Things to consider . . . . . . . . . . . . . . . . . . . . . . . . . . . . . . . . . . . . . .
Specifying the settings . . . . . . . . . . . . . . . . . . . . . . . . . . . . . . . . . .
Configuring VLAN tagged traffic . . . . . . . . . . . . . . . . . . . . . . . . . . .
Configuring Q-in-Q traffic . . . . . . . . . . . . . . . . . . . . . . . . . . . . . . . .
Configuring stacked VLAN traffic . . . . . . . . . . . . . . . . . . . . . . . . . .
Configuring VPLS traffic . . . . . . . . . . . . . . . . . . . . . . . . . . . . . . . . .
Configuring LBM Traffic. . . . . . . . . . . . . . . . . . . . . . . . . . . . . . . . . .
Specifying Ethernet filter settings. . . . . . . . . . . . . . . . . . . . . . . . . . . . . .
Filtering traffic using Q-in-Q criteria. . . . . . . . . . . . . . . . . . . . . . . . .
Filtering traffic using stacked VLAN criteria. . . . . . . . . . . . . . . . . . .
Filtering traffic using VPLS criteria . . . . . . . . . . . . . . . . . . . . . . . . .
Filtering traffic using MPLS criteria . . . . . . . . . . . . . . . . . . . . . . . . .
Filtering traffic using byte pattern criteria . . . . . . . . . . . . . . . . . . . .
Filtering traffic using payload criteria. . . . . . . . . . . . . . . . . . . . . . . .
20
20
23
23
24
24
25
25
26
26
27
27
27
28
28
28
30
30
30
31
31
32
32
32
33
33
34
34
34
35
35
37
37
39
40
40
41
42
42
42
45
45
46
50
50
50
51
51
51
54
55
56
57
58
59
Ethernet, IP, TCP/UDP, Fibre Channel, and IP Video Testing Manual
Contents
Specifying traffic load settings . . . . . . . . . . . . . . . . . . . . . . . . . . . . . . . . 60
Transmitting a constant load. . . . . . . . . . . . . . . . . . . . . . . . . . . . . . 60
Transmitting a bursty load. . . . . . . . . . . . . . . . . . . . . . . . . . . . . . . . 61
Transmitting a ramped load . . . . . . . . . . . . . . . . . . . . . . . . . . . . . . 62
Transmitting a flooded load. . . . . . . . . . . . . . . . . . . . . . . . . . . . . . . 63
Transmitting and analyzing layer 2 traffic . . . . . . . . . . . . . . . . . . . . . . . 64
Transmitting and analyzing layer 2 patterns . . . . . . . . . . . . . . . . . . . . . 65
Monitoring layer 2 traffic . . . . . . . . . . . . . . . . . . . . . . . . . . . . . . . . . . . . 66
Transmitting and analyzing layer 2 MPLS-TP, T-MPLS or MPLS traffic 66
About MPLS-TP . . . . . . . . . . . . . . . . . . . . . . . . . . . . . . . . . . . . . . . 66
Transmitting and analyzing MPLS-TP traffic. . . . . . . . . . . . . . . . . . 67
Using J-Proof to verify layer 2 transparency . . . . . . . . . . . . . . . . . . . . . 70
Understanding transparent loopbacks . . . . . . . . . . . . . . . . . . . . . . 71
Configuring the traffic originating instrument . . . . . . . . . . . . . . . . . 71
Using Quick Config to configure test frames . . . . . . . . . . . . . . . . . 73
Verifying the far end filter settings. . . . . . . . . . . . . . . . . . . . . . . . . . 74
Initiating the transparent loopback . . . . . . . . . . . . . . . . . . . . . . . . . 74
Starting the frame sequence. . . . . . . . . . . . . . . . . . . . . . . . . . . . . . 74
Observing transparency results . . . . . . . . . . . . . . . . . . . . . . . . . . . 74
Layer 3 testing . . . . . . . . . . . . . . . . . . . . . . . . . . . . . . . . . . . . . . . . . . . . . . 75
Specifying the data mode and link initialization settings . . . . . . . . . . . . 75
Configuring MPLS traffic . . . . . . . . . . . . . . . . . . . . . . . . . . . . . . . . . . . . 77
Specifying PPPoE settings . . . . . . . . . . . . . . . . . . . . . . . . . . . . . . . . . . 77
PPPoE messages. . . . . . . . . . . . . . . . . . . . . . . . . . . . . . . . . . . . . . 80
Terminating a PPPoE session . . . . . . . . . . . . . . . . . . . . . . . . . . . . 80
Specifying transmitted IPv4 packet settings . . . . . . . . . . . . . . . . . . . . . 80
Specifying IPv4 filter settings . . . . . . . . . . . . . . . . . . . . . . . . . . . . . . . . 82
Specifying transmitted IPv6 packet settings . . . . . . . . . . . . . . . . . . . . . 83
Specifying IPv6 filter settings . . . . . . . . . . . . . . . . . . . . . . . . . . . . . . . . 85
Transmitting and analyzing IP traffic . . . . . . . . . . . . . . . . . . . . . . . . . . . 86
Ping testing . . . . . . . . . . . . . . . . . . . . . . . . . . . . . . . . . . . . . . . . . . . . . . 87
Specifying IP settings for Ping and Traceroute testing . . . . . . . . . . 87
Transmitting ping request packets . . . . . . . . . . . . . . . . . . . . . . . . . 88
Running Traceroute. . . . . . . . . . . . . . . . . . . . . . . . . . . . . . . . . . . . . . . . 89
Monitoring IP traffic . . . . . . . . . . . . . . . . . . . . . . . . . . . . . . . . . . . . . . . . 90
Capturing packets for analysis. . . . . . . . . . . . . . . . . . . . . . . . . . . . . . . . . 91
What is captured? . . . . . . . . . . . . . . . . . . . . . . . . . . . . . . . . . . . . . . . . . 92
Test traffic . . . . . . . . . . . . . . . . . . . . . . . . . . . . . . . . . . . . . . . . . . . . 92
Control plane traffic. . . . . . . . . . . . . . . . . . . . . . . . . . . . . . . . . . . . . 92
How much can be stored in the buffer?. . . . . . . . . . . . . . . . . . . . . . . . . 92
Why use packet slicing? . . . . . . . . . . . . . . . . . . . . . . . . . . . . . . . . . . . . 92
Understanding the Capture toolbar . . . . . . . . . . . . . . . . . . . . . . . . . . . . 93
Specifying filter settings . . . . . . . . . . . . . . . . . . . . . . . . . . . . . . . . . . . . 93
Capturing packets . . . . . . . . . . . . . . . . . . . . . . . . . . . . . . . . . . . . . . . . . 94
Manually capturing packets . . . . . . . . . . . . . . . . . . . . . . . . . . . . . . 94
Capturing packets based on a trigger . . . . . . . . . . . . . . . . . . . . . . . 96
Saving or exporting captured packets . . . . . . . . . . . . . . . . . . . . . . . . . . 98
How long will it take to save the PCAP file? . . . . . . . . . . . . . . . . . . . . 100
Analyzing the packets using Wireshark® . . . . . . . . . . . . . . . . . . . . . . 100
Analyzing the packets using J-Mentor. . . . . . . . . . . . . . . . . . . . . . . . . 101
Loopback testing . . . . . . . . . . . . . . . . . . . . . . . . . . . . . . . . . . . . . . . . . . . 103
Inserting errors or pause frames . . . . . . . . . . . . . . . . . . . . . . . . . . . . . . 103
Inserting alarms or defects . . . . . . . . . . . . . . . . . . . . . . . . . . . . . . . . . . . 104
Measuring round trip delay or packet jitter . . . . . . . . . . . . . . . . . . . . . . 105
Measuring one way delay . . . . . . . . . . . . . . . . . . . . . . . . . . . . . . . . . . . . 105
CDMA/GPS receivers . . . . . . . . . . . . . . . . . . . . . . . . . . . . . . . . . . . . . 106
ATP-GPS test packets. . . . . . . . . . . . . . . . . . . . . . . . . . . . . . . . . . . . . 106
Network diagram . . . . . . . . . . . . . . . . . . . . . . . . . . . . . . . . . . . . . . . . . 106
Ethernet, IP, TCP/UDP, Fibre Channel, and IP Video Testing Manual
vii
Contents
Chapter 5
Chapter 6
viii
Things to consider . . . . . . . . . . . . . . . . . . . . . . . . . . . . . . . . . . . . . . . .
About the One Way Delay test option and accessory kit . . . . . . . . . . .
CDMA Receiver Kit . . . . . . . . . . . . . . . . . . . . . . . . . . . . . . . . . . . .
GPS Receiver Kit . . . . . . . . . . . . . . . . . . . . . . . . . . . . . . . . . . . . .
Step 1: Connecting the receivers to your instruments . . . . . . . . . . . . .
Connecting the CDMA Receiver . . . . . . . . . . . . . . . . . . . . . . . . . .
Connecting the GPS receiver . . . . . . . . . . . . . . . . . . . . . . . . . . . .
Step 2: Measuring one way delay . . . . . . . . . . . . . . . . . . . . . . . . . . . .
Measuring service disruption time . . . . . . . . . . . . . . . . . . . . . . . . . . . . .
OAM service and link layer testing. . . . . . . . . . . . . . . . . . . . . . . . . . . . .
Service layer features . . . . . . . . . . . . . . . . . . . . . . . . . . . . . . . . . . . . .
Link layer features . . . . . . . . . . . . . . . . . . . . . . . . . . . . . . . . . . . . . . . .
Specifying OAM settings . . . . . . . . . . . . . . . . . . . . . . . . . . . . . . . . . . .
Turning AIS or RDI analysis ON . . . . . . . . . . . . . . . . . . . . . . . . . . . . .
Sending LBM or LTM messages . . . . . . . . . . . . . . . . . . . . . . . . . . . . .
MAC-in-MAC testing . . . . . . . . . . . . . . . . . . . . . . . . . . . . . . . . . . . . . . . .
Understanding MAC-in-MAC test results . . . . . . . . . . . . . . . . . . . . . . .
Understanding the MAC-in-MAC LEDs . . . . . . . . . . . . . . . . . . . . . . . .
Configuring layer 2 MAC-in-MAC tests . . . . . . . . . . . . . . . . . . . . . . . .
Specifying interface settings . . . . . . . . . . . . . . . . . . . . . . . . . . . . .
Specifying Ethernet frame settings . . . . . . . . . . . . . . . . . . . . . . . .
Specifying Ethernet filter settings for MiM traffic . . . . . . . . . . . . . .
Specifying OAM settings . . . . . . . . . . . . . . . . . . . . . . . . . . . . . . . .
Specifying traffic load settings . . . . . . . . . . . . . . . . . . . . . . . . . . . .
Transmitting layer 2 MiM traffic . . . . . . . . . . . . . . . . . . . . . . . . . . . . . .
Inserting errors or pause frames . . . . . . . . . . . . . . . . . . . . . . . . . . . . .
Measuring round trip delay and packet jitter . . . . . . . . . . . . . . . . . . . .
Measuring service disruption time . . . . . . . . . . . . . . . . . . . . . . . . . . . .
Monitoring layer 2 MiM traffic. . . . . . . . . . . . . . . . . . . . . . . . . . . . . . . .
Synchronous Ethernet testing . . . . . . . . . . . . . . . . . . . . . . . . . . . . . . . .
Transmitting and analyzing PTP/1588 traffic . . . . . . . . . . . . . . . . . . . . .
About PTP . . . . . . . . . . . . . . . . . . . . . . . . . . . . . . . . . . . . . . . . . . . . . .
GPS as Time Source . . . . . . . . . . . . . . . . . . . . . . . . . . . . . . . . . . . . . .
Connecting the GPS . . . . . . . . . . . . . . . . . . . . . . . . . . . . . . . . . . .
Configuring GPS as Source . . . . . . . . . . . . . . . . . . . . . . . . . . . . .
Analyzing PTP traffic . . . . . . . . . . . . . . . . . . . . . . . . . . . . . . . . . . . . . .
Discovering traffic using J-Profiler . . . . . . . . . . . . . . . . . . . . . . . . . . . .
107
108
108
108
109
109
110
113
114
115
115
116
116
121
121
122
122
122
122
122
122
125
127
127
128
128
129
129
129
129
130
130
130
131
131
131
134
Wander Testing
137
About wander testing . . . . . . . . . . . . . . . . . . . . . . . . . . . . . . . . . . . . . . .
Features and capabilities. . . . . . . . . . . . . . . . . . . . . . . . . . . . . . . . . . .
Accessing wander test results . . . . . . . . . . . . . . . . . . . . . . . . . . . . . . .
Measuring and analyzing wander . . . . . . . . . . . . . . . . . . . . . . . . . . . . . .
Measuring TIE and calculating MTIE. . . . . . . . . . . . . . . . . . . . . . . . . .
Analyzing wander . . . . . . . . . . . . . . . . . . . . . . . . . . . . . . . . . . . . . . . .
Saving and exporting wander measurement data . . . . . . . . . . . . . . . .
138
138
138
138
138
139
142
TCP/UDP Testing
145
About TCP/UDP testing . . . . . . . . . . . . . . . . . . . . . . . . . . . . . . . . . . . . . .
Features and capabilities. . . . . . . . . . . . . . . . . . . . . . . . . . . . . . . . . . .
Understanding the graphical user interface . . . . . . . . . . . . . . . . . . . . .
TCP/UDP test applications . . . . . . . . . . . . . . . . . . . . . . . . . . . . . . . . .
Understanding the ATP Listen IP and Port . . . . . . . . . . . . . . . . . . . . .
Specifying layer 2 and layer 3 settings . . . . . . . . . . . . . . . . . . . . . . . . .
146
146
147
148
148
150
Ethernet, IP, TCP/UDP, Fibre Channel, and IP Video Testing Manual
Contents
Chapter 7
Specifying layer 4 settings . . . . . . . . . . . . . . . . . . . . . . . . . . . . . . . . . . .
Well known ports . . . . . . . . . . . . . . . . . . . . . . . . . . . . . . . . . . . . . . . . .
Specifying TCP/UDP settings for transmitted traffic . . . . . . . . . . . . . .
Configuring the traffic load . . . . . . . . . . . . . . . . . . . . . . . . . . . . . . . . .
Specifying the frame or packet length for transmitted traffic . . . . . . . .
Filtering received traffic using layer 2 or layer 3 criteria . . . . . . . . . . .
Filtering received traffic using layer 4 criteria . . . . . . . . . . . . . . . . . . .
Transmitting layer 4 traffic . . . . . . . . . . . . . . . . . . . . . . . . . . . . . . . . . . .
Inserting errors or pause frames . . . . . . . . . . . . . . . . . . . . . . . . . . . . . .
Loopback testing . . . . . . . . . . . . . . . . . . . . . . . . . . . . . . . . . . . . . . . . . . .
Running TCP Host or Wirespeed applications . . . . . . . . . . . . . . . . . . .
Changing settings during the test . . . . . . . . . . . . . . . . . . . . . . . . . . . .
Streams pipe: multiple TCP streams . . . . . . . . . . . . . . . . . . . . . . . . . .
Understanding the LED panel . . . . . . . . . . . . . . . . . . . . . . . . . . . . . . .
Understanding TCP Host and Wirespeed test results. . . . . . . . . . . . .
Viewing results for a specific stream. . . . . . . . . . . . . . . . . . . . . . .
Viewing cumulative link results . . . . . . . . . . . . . . . . . . . . . . . . . . .
Viewing TCP Host results . . . . . . . . . . . . . . . . . . . . . . . . . . . . . . .
Focusing on key results . . . . . . . . . . . . . . . . . . . . . . . . . . . . . . . .
Configuring the streams . . . . . . . . . . . . . . . . . . . . . . . . . . . . . . . . . . .
Specifying TCP Host settings . . . . . . . . . . . . . . . . . . . . . . . . . . . . . . .
Running the TCP Host application . . . . . . . . . . . . . . . . . . . . . . . . . . .
Running the TCP Wirespeed application . . . . . . . . . . . . . . . . . . . . . .
TrueSpeed . . . . . . . . . . . . . . . . . . . . . . . . . . . . . . . . . . . . . . . . . . . . . . . .
150
151
151
152
153
153
153
155
156
156
156
157
157
157
157
157
158
158
158
158
159
160
161
162
Triple Play and Multiple Streams Testing
163
About Triple Play and Multiple Streams testing . . . . . . . . . . . . . . . . . .
Features and capabilities . . . . . . . . . . . . . . . . . . . . . . . . . . . . . . . . . .
What’s new . . . . . . . . . . . . . . . . . . . . . . . . . . . . . . . . . . . . . . . . . . . . .
Streams Pipe soft key . . . . . . . . . . . . . . . . . . . . . . . . . . . . . . . . . . . . .
Using the action buttons . . . . . . . . . . . . . . . . . . . . . . . . . . . . . . . . . . .
Multiple Streams testing . . . . . . . . . . . . . . . . . . . . . . . . . . . . . . . . . . . . .
Multiple Streams test applications . . . . . . . . . . . . . . . . . . . . . . . . . . . .
Understanding the LED panel . . . . . . . . . . . . . . . . . . . . . . . . . . . . . . .
Streams pipe: multiple streams . . . . . . . . . . . . . . . . . . . . . . . . . . . . . .
Understanding multiple streams test results . . . . . . . . . . . . . . . . . . . .
Viewing results for a specific stream. . . . . . . . . . . . . . . . . . . . . . .
Viewing cumulative link results . . . . . . . . . . . . . . . . . . . . . . . . . . .
Viewing graphical results for all streams. . . . . . . . . . . . . . . . . . . .
Changing graph properties . . . . . . . . . . . . . . . . . . . . . . . . . . . . . .
Enabling multiple streams . . . . . . . . . . . . . . . . . . . . . . . . . . . . . . . . . .
Specifying the load type for all streams. . . . . . . . . . . . . . . . . . . . . . . .
Specifying the load unit on a stream with burst . . . . . . . . . . . . . . . . . .
Specifying the load unit for multiple streams . . . . . . . . . . . . . . . . . . . .
Specifying common traffic characteristics for multiple streams . . . . . .
Specifying layer 2 stream settings. . . . . . . . . . . . . . . . . . . . . . . . . . . .
Automatically incrementing configured MAC addresses or VLAN IDs
Specifying layer 3 stream settings. . . . . . . . . . . . . . . . . . . . . . . . . . . .
Specifying layer 4 stream settings. . . . . . . . . . . . . . . . . . . . . . . . . . . .
Transmitting multiple streams . . . . . . . . . . . . . . . . . . . . . . . . . . . . . . .
SAMComplete . . . . . . . . . . . . . . . . . . . . . . . . . . . . . . . . . . . . . . . . . . .
Triple Play testing . . . . . . . . . . . . . . . . . . . . . . . . . . . . . . . . . . . . . . . . . .
Triple Play test applications. . . . . . . . . . . . . . . . . . . . . . . . . . . . . . . . .
Understanding the LED panel . . . . . . . . . . . . . . . . . . . . . . . . . . . . . . .
Streams pipe: Triple Play streams. . . . . . . . . . . . . . . . . . . . . . . . . . . .
164
164
165
165
165
166
166
167
167
168
168
168
168
169
170
171
172
173
173
175
176
177
177
178
179
179
179
180
180
Ethernet, IP, TCP/UDP, Fibre Channel, and IP Video Testing Manual
ix
Contents
Chapter 8
Chapter 9
x
Understanding Triple Play test results . . . . . . . . . . . . . . . . . . . . . . . . .
Viewing cumulative link results . . . . . . . . . . . . . . . . . . . . . . . . . . .
Viewing graphs . . . . . . . . . . . . . . . . . . . . . . . . . . . . . . . . . . . . . . .
Changing graph properties . . . . . . . . . . . . . . . . . . . . . . . . . . . . . .
Characterizing Triple Play services . . . . . . . . . . . . . . . . . . . . . . . . . . .
Specifying layer 2 and layer 3 settings for Triple Play services . . . . . .
Transmitting multiple Triple Play streams . . . . . . . . . . . . . . . . . . . . . .
Looping back multiple streams . . . . . . . . . . . . . . . . . . . . . . . . . . . . . . .
Running the TCP Host script . . . . . . . . . . . . . . . . . . . . . . . . . . . . . . . . .
Playing audio clips. . . . . . . . . . . . . . . . . . . . . . . . . . . . . . . . . . . . . . . . . .
181
181
181
181
182
184
185
185
185
186
Loopback Testing
189
About Loopback testing . . . . . . . . . . . . . . . . . . . . . . . . . . . . . . . . . . . . .
Loopback terminology . . . . . . . . . . . . . . . . . . . . . . . . . . . . . . . . . . . . .
Local unit . . . . . . . . . . . . . . . . . . . . . . . . . . . . . . . . . . . . . . . . . . . .
Loopback unit . . . . . . . . . . . . . . . . . . . . . . . . . . . . . . . . . . . . . . . .
Terminate mode . . . . . . . . . . . . . . . . . . . . . . . . . . . . . . . . . . . . . .
Loopback mode. . . . . . . . . . . . . . . . . . . . . . . . . . . . . . . . . . . . . . .
Key loopback concepts . . . . . . . . . . . . . . . . . . . . . . . . . . . . . . . . . . . .
ARP settings . . . . . . . . . . . . . . . . . . . . . . . . . . . . . . . . . . . . . . . .
Address swapping . . . . . . . . . . . . . . . . . . . . . . . . . . . . . . . . . . . . .
Filter criteria on the loopback unit . . . . . . . . . . . . . . . . . . . . . . . . .
Loop types. . . . . . . . . . . . . . . . . . . . . . . . . . . . . . . . . . . . . . . . . . .
LBM Traffic . . . . . . . . . . . . . . . . . . . . . . . . . . . . . . . . . . . . . . . . . .
VLAN and Q-in-Q traffic . . . . . . . . . . . . . . . . . . . . . . . . . . . . . . . .
VPLS labels . . . . . . . . . . . . . . . . . . . . . . . . . . . . . . . . . . . . . . . . .
VPLS service provider and customer destination addresses . . . .
MPLS labels . . . . . . . . . . . . . . . . . . . . . . . . . . . . . . . . . . . . . . . . .
MPLS destination addresses . . . . . . . . . . . . . . . . . . . . . . . . . . . .
TCP/UDP ATP Listen IP Address and Listen Port. . . . . . . . . . . . .
Understanding the graphical user interface . . . . . . . . . . . . . . . . . . . . .
Loopback action buttons . . . . . . . . . . . . . . . . . . . . . . . . . . . . . . . .
Loopback messages . . . . . . . . . . . . . . . . . . . . . . . . . . . . . . . . . . .
Loopback tests. . . . . . . . . . . . . . . . . . . . . . . . . . . . . . . . . . . . . . . . . . .
Specifying a unit identifier . . . . . . . . . . . . . . . . . . . . . . . . . . . . . . . . . . .
Using LLB to loop received traffic back to the local unit . . . . . . . . . . .
Using Loop Up to initiate a loopback from the local unit. . . . . . . . . . .
190
190
190
190
190
190
191
191
191
191
191
191
191
191
192
192
192
193
193
193
194
194
194
195
196
IP Video Testing
201
About IP Video testing . . . . . . . . . . . . . . . . . . . . . . . . . . . . . . . . . . . . . . .
Understanding MPEG video transport streams . . . . . . . . . . . . . . . . . .
Single program transport streams . . . . . . . . . . . . . . . . . . . . . . . . .
Multiple program transport streams. . . . . . . . . . . . . . . . . . . . . . . .
Understanding the Explorer and Analyzer applications . . . . . . . . . . . .
Explorer applications . . . . . . . . . . . . . . . . . . . . . . . . . . . . . . . . . . .
Analyzer applications . . . . . . . . . . . . . . . . . . . . . . . . . . . . . . . . . .
Understanding MSTV . . . . . . . . . . . . . . . . . . . . . . . . . . . . . . . . . . . . .
Instant Channel Change (ICC) . . . . . . . . . . . . . . . . . . . . . . . . . . .
Microsoft R-UDP . . . . . . . . . . . . . . . . . . . . . . . . . . . . . . . . . . . . . .
Features and capabilities. . . . . . . . . . . . . . . . . . . . . . . . . . . . . . . . . . .
Understanding the graphical user interface . . . . . . . . . . . . . . . . . . . . .
Action buttons . . . . . . . . . . . . . . . . . . . . . . . . . . . . . . . . . . . . . . . .
Restart button . . . . . . . . . . . . . . . . . . . . . . . . . . . . . . . . . . . . . . . .
Understanding the LED panel . . . . . . . . . . . . . . . . . . . . . . . . . . . . . . .
202
202
203
203
203
203
203
204
204
204
205
205
206
206
206
Ethernet, IP, TCP/UDP, Fibre Channel, and IP Video Testing Manual
Contents
Understanding IP Video test results . . . . . . . . . . . . . . . . . . . . . . . . . . 206
Layered view: Quality Layer Buttons . . . . . . . . . . . . . . . . . . . . . . 207
Layered View: Button Colors . . . . . . . . . . . . . . . . . . . . . . . . . . . . 208
Streams view . . . . . . . . . . . . . . . . . . . . . . . . . . . . . . . . . . . . . . . . 210
Stream status icons . . . . . . . . . . . . . . . . . . . . . . . . . . . . . . . . . . . .211
Observing streams using the Explorer Application . . . . . . . . . . . . 212
Observing streams using the Analyzer Application . . . . . . . . . . . 212
Static and dynamic test results . . . . . . . . . . . . . . . . . . . . . . . . . . . 213
Navigating the results display . . . . . . . . . . . . . . . . . . . . . . . . . . . . 214
Customizing the results display . . . . . . . . . . . . . . . . . . . . . . . . . . 214
IP Video test applications . . . . . . . . . . . . . . . . . . . . . . . . . . . . . . . . . . 215
Populating the Address Book . . . . . . . . . . . . . . . . . . . . . . . . . . . . . . . . 215
Adding streams . . . . . . . . . . . . . . . . . . . . . . . . . . . . . . . . . . . . . . . . . . 215
Updating stream data . . . . . . . . . . . . . . . . . . . . . . . . . . . . . . . . . . . . . 216
Importing or exporting streams . . . . . . . . . . . . . . . . . . . . . . . . . . . . . . 216
Specifying interface settings . . . . . . . . . . . . . . . . . . . . . . . . . . . . . . . . . 217
Specifying Video settings . . . . . . . . . . . . . . . . . . . . . . . . . . . . . . . . . . . . 217
Specifying Ethernet filter settings . . . . . . . . . . . . . . . . . . . . . . . . . . . . . 217
Specifying result threshold settings . . . . . . . . . . . . . . . . . . . . . . . . . . . 219
Specifying latency distribution settings . . . . . . . . . . . . . . . . . . . . . . . . 220
Specifying IGMP settings . . . . . . . . . . . . . . . . . . . . . . . . . . . . . . . . . . . . 221
Joining streams . . . . . . . . . . . . . . . . . . . . . . . . . . . . . . . . . . . . . . . . . . . . 222
Observing physical layer and link statistics . . . . . . . . . . . . . . . . . . . . . 223
Observing stream statistics . . . . . . . . . . . . . . . . . . . . . . . . . . . . . . . . . . 224
Leaving streams . . . . . . . . . . . . . . . . . . . . . . . . . . . . . . . . . . . . . . . . . . . 224
Basic principles of IP Video testing . . . . . . . . . . . . . . . . . . . . . . . . . . . . 225
IP Video network architecture . . . . . . . . . . . . . . . . . . . . . . . . . . . . . . . 225
MPEG-2 transport streams . . . . . . . . . . . . . . . . . . . . . . . . . . . . . . . . . 226
Packetized elementary streams (PES) . . . . . . . . . . . . . . . . . . . . . 226
Signaling tables . . . . . . . . . . . . . . . . . . . . . . . . . . . . . . . . . . . . . . 226
IP Video encapsulation . . . . . . . . . . . . . . . . . . . . . . . . . . . . . . . . . . . . 227
RTP. . . . . . . . . . . . . . . . . . . . . . . . . . . . . . . . . . . . . . . . . . . . . . . . 227
Non-RTP . . . . . . . . . . . . . . . . . . . . . . . . . . . . . . . . . . . . . . . . . . . . 227
Chapter 10
VoIP Testing
229
About VoIP testing. . . . . . . . . . . . . . . . . . . . . . . . . . . . . . . . . . . . . . . . . .
Features and capabilities . . . . . . . . . . . . . . . . . . . . . . . . . . . . . . . . . .
Understanding VoIP basics . . . . . . . . . . . . . . . . . . . . . . . . . . . . . . . . .
Understanding the graphical user interface . . . . . . . . . . . . . . . . . . . . .
Action buttons . . . . . . . . . . . . . . . . . . . . . . . . . . . . . . . . . . . . . . . . . . .
Understanding the LED panel . . . . . . . . . . . . . . . . . . . . . . . . . . . . . . .
Understanding the VoIP call bar . . . . . . . . . . . . . . . . . . . . . . . . . . . . .
Understanding VoIP test results . . . . . . . . . . . . . . . . . . . . . . . . . . . . .
Layered view: Quality Layer Buttons . . . . . . . . . . . . . . . . . . . . . .
Layered View: Button Colors . . . . . . . . . . . . . . . . . . . . . . . . . . . .
Navigating the results display . . . . . . . . . . . . . . . . . . . . . . . . . . . .
VoIP test applications . . . . . . . . . . . . . . . . . . . . . . . . . . . . . . . . . . . . .
Populating the Address Book . . . . . . . . . . . . . . . . . . . . . . . . . . . . . . . .
Specifying interface settings . . . . . . . . . . . . . . . . . . . . . . . . . . . . . . . . .
Specifying Ethernet frame and IP settings . . . . . . . . . . . . . . . . . . . . . .
Specifying VoIP settings . . . . . . . . . . . . . . . . . . . . . . . . . . . . . . . . . . . . .
Specifying VoIP Filters . . . . . . . . . . . . . . . . . . . . . . . . . . . . . . . . . . . . . .
Placing and receiving calls. . . . . . . . . . . . . . . . . . . . . . . . . . . . . . . . . . .
Registering with the server . . . . . . . . . . . . . . . . . . . . . . . . . . . . . . . . .
Placing calls . . . . . . . . . . . . . . . . . . . . . . . . . . . . . . . . . . . . . . . . . . . .
Receiving calls manually . . . . . . . . . . . . . . . . . . . . . . . . . . . . . . . . . . .
Automatically answering calls . . . . . . . . . . . . . . . . . . . . . . . . . . . . . . .
230
230
230
231
231
231
232
232
232
233
234
235
235
236
236
237
241
241
241
242
242
243
Ethernet, IP, TCP/UDP, Fibre Channel, and IP Video Testing Manual
xi
Contents
Chapter 11
Chapter 12
xii
Capturing packets for analysis . . . . . . . . . . . . . . . . . . . . . . . . . . . . . . . .
Understanding the Capture toolbar . . . . . . . . . . . . . . . . . . . . . . . . . . .
Specifying filter settings . . . . . . . . . . . . . . . . . . . . . . . . . . . . . . . . . . .
Capturing packets . . . . . . . . . . . . . . . . . . . . . . . . . . . . . . . . . . . . . . . .
Analyzing Audio Packets . . . . . . . . . . . . . . . . . . . . . . . . . . . . . . . . . . .
243
243
243
243
245
Fibre Channel Testing
247
About Fibre Channel Testing . . . . . . . . . . . . . . . . . . . . . . . . . . . . . . . . .
Features and capabilities . . . . . . . . . . . . . . . . . . . . . . . . . . . . . . . . . . . .
Understanding the graphical user interface . . . . . . . . . . . . . . . . . . . . .
Fibre Channel test applications . . . . . . . . . . . . . . . . . . . . . . . . . . . . . .
Configuring layer 1 tests . . . . . . . . . . . . . . . . . . . . . . . . . . . . . . . . . . . . .
BER testing layer 1 . . . . . . . . . . . . . . . . . . . . . . . . . . . . . . . . . . . . . . .
Monitoring layer 1 BER . . . . . . . . . . . . . . . . . . . . . . . . . . . . . . . . . . . .
Configuring layer 2 Fibre Channel tests . . . . . . . . . . . . . . . . . . . . . . . .
Specifying interface settings . . . . . . . . . . . . . . . . . . . . . . . . . . . . . . . .
Specifying Fibre Channel frame settings . . . . . . . . . . . . . . . . . . . . . . .
Specifying Fibre Channel filter settings . . . . . . . . . . . . . . . . . . . . . . . .
Specifying traffic load settings . . . . . . . . . . . . . . . . . . . . . . . . . . . . . . .
Transmitting and analyzing layer 2 traffic . . . . . . . . . . . . . . . . . . . . . . .
Loopback testing . . . . . . . . . . . . . . . . . . . . . . . . . . . . . . . . . . . . . . . . . . .
Transmitting and analyzing patterns . . . . . . . . . . . . . . . . . . . . . . . . . . .
Measuring service disruption time . . . . . . . . . . . . . . . . . . . . . . . . . . . . .
Inserting errors. . . . . . . . . . . . . . . . . . . . . . . . . . . . . . . . . . . . . . . . . . . . .
Measuring round trip delay . . . . . . . . . . . . . . . . . . . . . . . . . . . . . . . . . . .
Monitoring layer 2 traffic . . . . . . . . . . . . . . . . . . . . . . . . . . . . . . . . . . . . .
Emission Lowering Protocol. . . . . . . . . . . . . . . . . . . . . . . . . . . . . . . . . .
248
248
249
250
250
251
252
252
252
255
256
257
257
258
258
259
260
260
261
262
Automated Testing
263
TrueSAM . . . . . . . . . . . . . . . . . . . . . . . . . . . . . . . . . . . . . . . . . . . . . . . . . .
Setting up TrueSAM. . . . . . . . . . . . . . . . . . . . . . . . . . . . . . . . . . . . . . .
Loading TrueSAM Profile. . . . . . . . . . . . . . . . . . . . . . . . . . . . . . . . . . .
Running TrueSAM . . . . . . . . . . . . . . . . . . . . . . . . . . . . . . . . . . . . . . . .
Launching a single automated test . . . . . . . . . . . . . . . . . . . . . . . . . . . .
Automated RFC 2544 and Fibre Channel tests . . . . . . . . . . . . . . . . . . .
Features and capabilities. . . . . . . . . . . . . . . . . . . . . . . . . . . . . . . . . . .
About loopbacks . . . . . . . . . . . . . . . . . . . . . . . . . . . . . . . . . . . . . . . . .
J-QuickCheck . . . . . . . . . . . . . . . . . . . . . . . . . . . . . . . . . . . . . . . . . . .
Understanding the J-QuickCheck stages . . . . . . . . . . . . . . . . . . .
Test at configured Max Bandwidth . . . . . . . . . . . . . . . . . . . . . . . .
Layer 2 Quick Test . . . . . . . . . . . . . . . . . . . . . . . . . . . . . . . . . . . .
Running J-QuickCheck . . . . . . . . . . . . . . . . . . . . . . . . . . . . . . . . .
Asymmetrical tests. . . . . . . . . . . . . . . . . . . . . . . . . . . . . . . . . . . . . . . .
Throughput test . . . . . . . . . . . . . . . . . . . . . . . . . . . . . . . . . . . . . . . . . .
JDSU zeroing-in method . . . . . . . . . . . . . . . . . . . . . . . . . . . . . . . .
Throughput test results . . . . . . . . . . . . . . . . . . . . . . . . . . . . . . . . .
Pass/fail threshold . . . . . . . . . . . . . . . . . . . . . . . . . . . . . . . . . . . . .
Latency (RTD) test. . . . . . . . . . . . . . . . . . . . . . . . . . . . . . . . . . . . . . . .
About the latency test . . . . . . . . . . . . . . . . . . . . . . . . . . . . . . . . . .
Pass/fail threshold . . . . . . . . . . . . . . . . . . . . . . . . . . . . . . . . . . . . .
Packet Jitter test . . . . . . . . . . . . . . . . . . . . . . . . . . . . . . . . . . . . . . . . .
About the Packet Jitter test . . . . . . . . . . . . . . . . . . . . . . . . . . . . . .
Packet Jitter test results . . . . . . . . . . . . . . . . . . . . . . . . . . . . . . . .
Pass/fail threshold . . . . . . . . . . . . . . . . . . . . . . . . . . . . . . . . . . . . .
264
264
268
270
270
272
272
273
273
273
274
275
275
279
280
280
281
281
281
281
282
282
282
282
282
Ethernet, IP, TCP/UDP, Fibre Channel, and IP Video Testing Manual
Contents
About the System Recovery test . . . . . . . . . . . . . . . . . . . . . . . . . . . . . 283
About the System Recovery test . . . . . . . . . . . . . . . . . . . . . . . . . 283
System Recovery test results . . . . . . . . . . . . . . . . . . . . . . . . . . . . 283
Frame Loss test . . . . . . . . . . . . . . . . . . . . . . . . . . . . . . . . . . . . . . . . . 283
About the frame loss test . . . . . . . . . . . . . . . . . . . . . . . . . . . . . . . 283
Frame Loss test results . . . . . . . . . . . . . . . . . . . . . . . . . . . . . . . . 283
Back to Back Frames test (Burst test). . . . . . . . . . . . . . . . . . . . . . . . . 283
About the Back to Back Frames test . . . . . . . . . . . . . . . . . . . . . . 283
Back to Back test results . . . . . . . . . . . . . . . . . . . . . . . . . . . . . . . 284
Optimizing the test time. . . . . . . . . . . . . . . . . . . . . . . . . . . . . . . . . . . . 284
Specifying the external test settings . . . . . . . . . . . . . . . . . . . . . . . . . . 285
Importing and exporting RFC config files . . . . . . . . . . . . . . . . . . . . . . 286
Running the RFC 2544 or Fibre Channel tests . . . . . . . . . . . . . . . . . . 287
Specifying the external test settings . . . . . . . . . . . . . . . . . . . . . . . . . . 287
Running symmetrical Enhanced RFC 2544 or Enhanced FC tests288
Running asymmetrical Enhanced RFC 2544 tests . . . . . . . . . . . . 294
SAMComplete . . . . . . . . . . . . . . . . . . . . . . . . . . . . . . . . . . . . . . . . . . . . . 298
Configuring test settings . . . . . . . . . . . . . . . . . . . . . . . . . . . . . . . . . . . 299
Choosing tests. . . . . . . . . . . . . . . . . . . . . . . . . . . . . . . . . . . . . . . . . . . 306
Running tests . . . . . . . . . . . . . . . . . . . . . . . . . . . . . . . . . . . . . . . . . . . 306
Automated VLAN tests . . . . . . . . . . . . . . . . . . . . . . . . . . . . . . . . . . . . . . 309
Automated FTP Throughput tests . . . . . . . . . . . . . . . . . . . . . . . . . . . . . 310
Automated HTTP Throughput tests . . . . . . . . . . . . . . . . . . . . . . . . . . . . 312
Automated TCP Throughput tests . . . . . . . . . . . . . . . . . . . . . . . . . . . . . 313
TrueSpeed Test . . . . . . . . . . . . . . . . . . . . . . . . . . . . . . . . . . . . . . . . . . . . 314
TrueSpeed test steps . . . . . . . . . . . . . . . . . . . . . . . . . . . . . . . . . . . . . 314
About the test steps . . . . . . . . . . . . . . . . . . . . . . . . . . . . . . . . . . . 315
Configuring the TrueSpeed test. . . . . . . . . . . . . . . . . . . . . . . . . . . . . . 316
Running the TrueSpeed test . . . . . . . . . . . . . . . . . . . . . . . . . . . . . . . . 322
Testing using TAM automation. . . . . . . . . . . . . . . . . . . . . . . . . . . . . . . . 324
Before testing . . . . . . . . . . . . . . . . . . . . . . . . . . . . . . . . . . . . . . . . . . . 325
Connecting to the management network. . . . . . . . . . . . . . . . . . . . . . . 325
Connecting to the test network . . . . . . . . . . . . . . . . . . . . . . . . . . . . . . 326
Setting up a TAM test . . . . . . . . . . . . . . . . . . . . . . . . . . . . . . . . . . . . . 327
Saving automated test report data. . . . . . . . . . . . . . . . . . . . . . . . . . . . . 328
Chapter 13
Test Results
331
About test results . . . . . . . . . . . . . . . . . . . . . . . . . . . . . . . . . . . . . . . . . .
Summary Status results . . . . . . . . . . . . . . . . . . . . . . . . . . . . . . . . . . . . .
CPRI/OBSAI test results . . . . . . . . . . . . . . . . . . . . . . . . . . . . . . . . . . . . .
CPRI and OBSAI LEDs . . . . . . . . . . . . . . . . . . . . . . . . . . . . . . . . . . . .
Interface/Signal results . . . . . . . . . . . . . . . . . . . . . . . . . . . . . . . . . . . .
CPRI/OBSAI Error Stats . . . . . . . . . . . . . . . . . . . . . . . . . . . . . . . . . . .
CPRI/OBSAI Counts results . . . . . . . . . . . . . . . . . . . . . . . . . . . . . . . .
CPRI L1 Inband Protocol results . . . . . . . . . . . . . . . . . . . . . . . . . . . . .
CPRI/OBSAI Payload BERT results . . . . . . . . . . . . . . . . . . . . . . . . . .
Ethernet, IP, TCP/UDP, and Fibre Channel results . . . . . . . . . . . . . . . .
Ethernet, IP, TCP/UDP, and Fibre Channel LEDs . . . . . . . . . . . . . . . .
Cable Diagnostic results . . . . . . . . . . . . . . . . . . . . . . . . . . . . . . . . . . .
MDI or MDIX Status result . . . . . . . . . . . . . . . . . . . . . . . . . . . . . .
Fault Type result . . . . . . . . . . . . . . . . . . . . . . . . . . . . . . . . . . . . . .
Distance (m) result . . . . . . . . . . . . . . . . . . . . . . . . . . . . . . . . . . . .
Skew (ns) result . . . . . . . . . . . . . . . . . . . . . . . . . . . . . . . . . . . . . .
Polarity result . . . . . . . . . . . . . . . . . . . . . . . . . . . . . . . . . . . . . . . .
Pair result . . . . . . . . . . . . . . . . . . . . . . . . . . . . . . . . . . . . . . . . . . .
SLA/KPI. . . . . . . . . . . . . . . . . . . . . . . . . . . . . . . . . . . . . . . . . . . . . . . .
Interface results. . . . . . . . . . . . . . . . . . . . . . . . . . . . . . . . . . . . . . . . . .
332
332
333
333
334
335
335
335
336
336
338
342
342
343
343
343
344
344
344
344
Ethernet, IP, TCP/UDP, Fibre Channel, and IP Video Testing Manual
xiii
Contents
L2 Link Stats results. . . . . . . . . . . . . . . . . . . . . . . . . . . . . . . . . . . . . . .
L2 Link Counts results . . . . . . . . . . . . . . . . . . . . . . . . . . . . . . . . . . . . .
L2 Filter Stats results . . . . . . . . . . . . . . . . . . . . . . . . . . . . . . . . . . . . . .
L2 Filter Counts results . . . . . . . . . . . . . . . . . . . . . . . . . . . . . . . . . . . .
J-Proof (transparency) results . . . . . . . . . . . . . . . . . . . . . . . . . . . . . . .
L2 BERT Stats results . . . . . . . . . . . . . . . . . . . . . . . . . . . . . . . . . . . . .
CDMA Receiver Status results . . . . . . . . . . . . . . . . . . . . . . . . . . . . . .
CDMA/GPS Receiver Log . . . . . . . . . . . . . . . . . . . . . . . . . . . . . . . . . .
Ethernet OAM Service OAM results . . . . . . . . . . . . . . . . . . . . . . . . . .
Ethernet OAM Service OAM MEP Discovery results. . . . . . . . . . . . . .
Ethernet OAM L-OAM Modes results . . . . . . . . . . . . . . . . . . . . . . . . .
Ethernet OAM L-OAM Counts results . . . . . . . . . . . . . . . . . . . . . . . . .
Ethernet OAM L-OAM States results . . . . . . . . . . . . . . . . . . . . . . . . . .
Ethernet OAM L-OAM Error History results. . . . . . . . . . . . . . . . . . . . .
L3 Link Stats results. . . . . . . . . . . . . . . . . . . . . . . . . . . . . . . . . . . . . . .
L3 Link Counts results . . . . . . . . . . . . . . . . . . . . . . . . . . . . . . . . . . . . .
L3 Filter Stats results . . . . . . . . . . . . . . . . . . . . . . . . . . . . . . . . . . . . . .
L3 Filter Counts results . . . . . . . . . . . . . . . . . . . . . . . . . . . . . . . . . . . .
L3/IP Config Status results . . . . . . . . . . . . . . . . . . . . . . . . . . . . . . . . .
Ping results . . . . . . . . . . . . . . . . . . . . . . . . . . . . . . . . . . . . . . . . . . . . .
Traceroute results . . . . . . . . . . . . . . . . . . . . . . . . . . . . . . . . . . . . . . . .
PCS Error Stats . . . . . . . . . . . . . . . . . . . . . . . . . . . . . . . . . . . . . . . . . .
Ethernet Per Lane results . . . . . . . . . . . . . . . . . . . . . . . . . . . . . . . . . .
Error Stats results . . . . . . . . . . . . . . . . . . . . . . . . . . . . . . . . . . . . . . . .
Error Stats (Layer 1 BERT) . . . . . . . . . . . . . . . . . . . . . . . . . . . . .
Error Stats (Layer 2 Traffic) . . . . . . . . . . . . . . . . . . . . . . . . . . . . . .
Error Stats (Layer 3 Traffic) . . . . . . . . . . . . . . . . . . . . . . . . . . . . . .
Capture results . . . . . . . . . . . . . . . . . . . . . . . . . . . . . . . . . . . . . . . . . .
Sync Status Messages . . . . . . . . . . . . . . . . . . . . . . . . . . . . . . . . . . . .
AutoNeg Status results . . . . . . . . . . . . . . . . . . . . . . . . . . . . . . . . . . . .
Login Status results . . . . . . . . . . . . . . . . . . . . . . . . . . . . . . . . . . . . . . .
Implicit or Explicit (E-Port) login . . . . . . . . . . . . . . . . . . . . . . . . . .
Explicit (Fabric/N-Port) login . . . . . . . . . . . . . . . . . . . . . . . . . . . . .
PTP Link Counts results . . . . . . . . . . . . . . . . . . . . . . . . . . . . . . . . . . .
PTP Link Stats results . . . . . . . . . . . . . . . . . . . . . . . . . . . . . . . . . . . . .
PTP Graphs . . . . . . . . . . . . . . . . . . . . . . . . . . . . . . . . . . . . . . . . . . . . .
L4 Link Stats results. . . . . . . . . . . . . . . . . . . . . . . . . . . . . . . . . . . . . . .
Detailed L4 Stats . . . . . . . . . . . . . . . . . . . . . . . . . . . . . . . . . . . . . . . . .
Cumulative L4 results . . . . . . . . . . . . . . . . . . . . . . . . . . . . . . . . . . . . .
L4 Link Counts results . . . . . . . . . . . . . . . . . . . . . . . . . . . . . . . . . . . . .
L4 Filter Stats results . . . . . . . . . . . . . . . . . . . . . . . . . . . . . . . . . . . . . .
L4 Filter Counts results . . . . . . . . . . . . . . . . . . . . . . . . . . . . . . . . . . . .
J-Profiler results. . . . . . . . . . . . . . . . . . . . . . . . . . . . . . . . . . . . . . . . . .
Wander results . . . . . . . . . . . . . . . . . . . . . . . . . . . . . . . . . . . . . . . . . . . . .
IP Video results . . . . . . . . . . . . . . . . . . . . . . . . . . . . . . . . . . . . . . . . . . . .
IP Video LEDs . . . . . . . . . . . . . . . . . . . . . . . . . . . . . . . . . . . . . . . . . . .
Physical/Link Stats results . . . . . . . . . . . . . . . . . . . . . . . . . . . . . . . . . .
All Streams Transport results. . . . . . . . . . . . . . . . . . . . . . . . . . . . . . . .
All Streams Video/All Program Video results . . . . . . . . . . . . . . . . . . . .
All Streams Complete results. . . . . . . . . . . . . . . . . . . . . . . . . . . . . . . .
Individual stream results . . . . . . . . . . . . . . . . . . . . . . . . . . . . . . . . . . .
Stream and Program PID results . . . . . . . . . . . . . . . . . . . . . . . . . . . . .
MSTV results . . . . . . . . . . . . . . . . . . . . . . . . . . . . . . . . . . . . . . . . . . . .
MSTV Stats . . . . . . . . . . . . . . . . . . . . . . . . . . . . . . . . . . . . . . . . . .
MSTV Count . . . . . . . . . . . . . . . . . . . . . . . . . . . . . . . . . . . . . . . . .
MSTV Latency Distribution . . . . . . . . . . . . . . . . . . . . . . . . . . . . . .
MSTV Message Log . . . . . . . . . . . . . . . . . . . . . . . . . . . . . . . . . . .
xiv
Ethernet, IP, TCP/UDP, Fibre Channel, and IP Video Testing Manual
345
349
351
355
356
357
358
358
359
361
362
362
363
363
364
365
366
366
367
368
369
369
370
371
371
373
374
375
375
376
377
377
378
379
380
382
382
382
383
384
384
384
384
385
386
386
387
388
392
394
395
395
396
396
396
396
396
Contents
Chapter 14
VoIP results . . . . . . . . . . . . . . . . . . . . . . . . . . . . . . . . . . . . . . . . . . . . . . .
VoIP LEDs . . . . . . . . . . . . . . . . . . . . . . . . . . . . . . . . . . . . . . . . . . . . . .
Content results . . . . . . . . . . . . . . . . . . . . . . . . . . . . . . . . . . . . . . . . . .
Transport results . . . . . . . . . . . . . . . . . . . . . . . . . . . . . . . . . . . . . . . . .
QoS results . . . . . . . . . . . . . . . . . . . . . . . . . . . . . . . . . . . . . . . . . .
Stats/Counts results . . . . . . . . . . . . . . . . . . . . . . . . . . . . . . . . . . .
Transaction Log results . . . . . . . . . . . . . . . . . . . . . . . . . . . . . . . . . . . .
Miscellaneous measurements. . . . . . . . . . . . . . . . . . . . . . . . . . . . . . .
Measurement results . . . . . . . . . . . . . . . . . . . . . . . . . . . . . . . . . .
Call Stats results . . . . . . . . . . . . . . . . . . . . . . . . . . . . . . . . . . . . . .
Ethernet results . . . . . . . . . . . . . . . . . . . . . . . . . . . . . . . . . . . . . . . . . .
Stats results . . . . . . . . . . . . . . . . . . . . . . . . . . . . . . . . . . . . . . . . .
Capture results . . . . . . . . . . . . . . . . . . . . . . . . . . . . . . . . . . . . . . .
Auto Neg Status . . . . . . . . . . . . . . . . . . . . . . . . . . . . . . . . . . . . . .
Graph results. . . . . . . . . . . . . . . . . . . . . . . . . . . . . . . . . . . . . . . . . . . .
Graphical results . . . . . . . . . . . . . . . . . . . . . . . . . . . . . . . . . . . . . . . . . . .
Histogram results . . . . . . . . . . . . . . . . . . . . . . . . . . . . . . . . . . . . . . . . . .
Event Log results. . . . . . . . . . . . . . . . . . . . . . . . . . . . . . . . . . . . . . . . . . .
Time test results . . . . . . . . . . . . . . . . . . . . . . . . . . . . . . . . . . . . . . . . . . .
397
397
398
399
399
400
400
400
400
401
402
402
402
402
402
402
403
403
404
Troubleshooting
405
About troubleshooting . . . . . . . . . . . . . . . . . . . . . . . . . . . . . . . . . . . . . . 406
Before testing. . . . . . . . . . . . . . . . . . . . . . . . . . . . . . . . . . . . . . . . . . . . . . 406
The test application I need is not available. . . . . . . . . . . . . . . . . . 406
Can I hot-swap PIMs? . . . . . . . . . . . . . . . . . . . . . . . . . . . . . . . . . 406
How can I determine whether I need to swap a PIM or swap SFP
transceivers? . . . . . . . . . . . . . . . . . . . . . . . . . . . . . . . . . . . . . . . . 406
I am receiving unexpected errors when running optical
applications. . . . . . . . . . . . . . . . . . . . . . . . . . . . . . . . . . . . . . . . . . 406
Performing tests . . . . . . . . . . . . . . . . . . . . . . . . . . . . . . . . . . . . . . . . . . . 406
Optical Overload Protection message . . . . . . . . . . . . . . . . . . . . . 406
User interface is not launching . . . . . . . . . . . . . . . . . . . . . . . . . . . 407
Inconsistent test results . . . . . . . . . . . . . . . . . . . . . . . . . . . . . . . . 407
Result values are blank . . . . . . . . . . . . . . . . . . . . . . . . . . . . . . . . 407
Unit on far end will not loop up . . . . . . . . . . . . . . . . . . . . . . . . . . . 407
A receiving instrument is showing many bit errors . . . . . . . . . . . . 407
RFC 2544 or FC Script button does not appear . . . . . . . . . . . . . . 407
Which MSAM or application module is selected? . . . . . . . . . . . . . 408
I am transmitting Layer 2 Ethernet traffic with OAM frames at 10 Mbps,
but no frames are transmitted or received . . . . . . . . . . . . . . . . . . 408
One way delay measurements do not appear . . . . . . . . . . . . . . . 408
My VoIP call didn’t go through . . . . . . . . . . . . . . . . . . . . . . . . . . . 409
I am emulating a SIP phone but cannot register with the SIP
server. . . . . . . . . . . . . . . . . . . . . . . . . . . . . . . . . . . . . . . . . . . . . . . 409
I am running a VoIP test but the delay measurement does not
appear. . . . . . . . . . . . . . . . . . . . . . . . . . . . . . . . . . . . . . . . . . . . . . 409
I have very little loss, but a high level of delay on my VoIP test . . 409
I have a large amount of jitter in my VoIP test, but no loss or
delay. . . . . . . . . . . . . . . . . . . . . . . . . . . . . . . . . . . . . . . . . . . . . . . 410
Upgrades and options. . . . . . . . . . . . . . . . . . . . . . . . . . . . . . . . . . . . . . . 410
How do I upgrade my instrument? . . . . . . . . . . . . . . . . . . . . . . . . 410
How do I install test options? . . . . . . . . . . . . . . . . . . . . . . . . . . . . 410
Do software and test options move with the MSAM or Transport
Module? . . . . . . . . . . . . . . . . . . . . . . . . . . . . . . . . . . . . . . . . . . . . 410
Ethernet, IP, TCP/UDP, Fibre Channel, and IP Video Testing Manual
xv
Contents
Glossary
411
Index
419
xvi
Ethernet, IP, TCP/UDP, Fibre Channel, and IP Video Testing Manual
About this Manual
This prefix explains how to use this manual. Topics discussed include the
following:
– “Purpose and scope” on page xviii
– “Assumptions” on page xviii
– “Terminology” on page xviii
– “Ethernet, IP, TCP/UDP, Fibre Channel, and IP Video Testing Manual” on
page xx
– “Conventions” on page xxi
– “Safety and compliance information” on page xxii
– “Technical assistance” on page xxii
Ethernet, IP, TCP/UDP, Fibre Chan., VoIP, and Video Testing Manual xvii
About this Manual
Purpose and scope
Purpose and scope
The purpose of this manual is to help you successfully use the Ethernet, IP, TCP/
UDP, Fibre Channel, and IP Video test capabilities of the MSAM, Transport Module
and the 40G/100G High Speed Transport Module.
This manual includes task-based instructions that describe how to configure,
use, and troubleshoot the general functions of your instrument.
Assumptions
This manual is intended for novice, intermediate, and experienced users who
want to use the 40G/100G High Speed Transport Module, Transport Module or
Multiple Services Application Module effectively and efficiently. We are
assuming that you have basic computer experience and are familiar with basic
telecommunication concepts, terminology, and safety.
Terminology
The T-BERD 8000 is branded as the MTS-8000 in Europe, and it is interchangeably referred to as the T-BERD 8000, MTS 8000, MTS-8000, MTS8000
and Media Test Set 8000 throughout supporting documentation.
The T-BERD 6000A is branded as the MTS-6000A in Europe, and it is interchangeably referred to as the T-BERD 6000A, MTS 6000A, MTS6000A and
Media Test Set 6000 throughout supporting documentation.
The following terms have a specific meaning when they are used in this
manual:
– Assembly—Used throughout this manual to refer to a complete set of
components assembled as an instrument and used for testing. This
manual supports three assemblies: The Transport Module assembly,
consisting of an T-BERD ⁄ MTS 8000 base unit and Transport Module, the
MSAM assembly, consisting of a MSAM, Physical Interface Modules
(PIMs), and a T-BERD ⁄ MTS 6000A base unit, and a DMC assembly,
consisting of up to two MSAMs, up to four PIMs, a Dual Module Carrier
(DMC), and a T-BERD ⁄ MTS 8000 base unit.
– Application module—Used throughout this manual to refer to the component that provides test functionality to the assembled instrument. This
manual supports two application modules: the Transport Module, and the
MSAM.
– Component—Used throughout this manual to refer to an individual hardware component which is connected to the other components to build a
test instrument (assembly). This manual supports the following components: the Transport Module, the MSAM, and the DMC. The base units are
documented in separate manuals.
– T-BERD ⁄ MTS 8000—The family of products, typically a combination of a
base unit, a battery module, and one or more application modules. The
Dual Module Carrier (DMC) can be used on the T-BERD / MTS 8000 platform to test using two MSAMs.
xviii
Ethernet, IP, TCP/UDP, Fibre Chan., VoIP, and Video Testing Manual
About this Manual
Terminology
– Base unit—The unit which connects to the application module and power
adapter, providing the user interface and a variety of connectivity and work
flow tools. If optioned to do so, the base unit also allows you to measure
emitted power, received power, and optical link loss on fiber optic
networks.
– DMC—Dual Module Carrier. The DMC is a two slot chassis which you can
connect to the T-BERD / MTS 8000 base unit to test using up to two
MSAM application modules and four Physical Interface Modules (PIMs).
– MSAM Multiple Services Application Module—Referred to generically
as “the instrument” when inserted in the T-BERD / MTS 6000A base unit or
the DMC with a PIM. The MSAM provides testing functionality for the base
unit.
– PIM—The physical interface module inserted into one of up to two ports
provided on the MSAM chassis. PIMs supply the physical connectors
(interfaces) required to connect the MSAM to the circuit under test. A
variety of cables, SFPs, and XFPs are offered as options, and can used to
connect the PIMs to the circuit.
– Transport Module—Referred to generically as “the instrument” when
connected to the T-BERD / MTS 8000 base unit. The Transport Module
provides testing functionality for the base unit.
– Battery Module—The module connected to the back of the T-BERD /
MTS 8000 base unit, which supplies power whenever it is not provided
using the power adapter.
– OC-n—Used to refer to each of the optical SONET rates supported by the
instrument (OC-3, OC-12, OC-48, and OC-192), where “n” represents the
user-selected line rate.
– STM-n—Used to refer to each of the optical SDH rates supported by the
instrument (STM-1, STM-4, STM-16, and STM-64), where “n” represents
the user-selected line rate.
– STS-1—Used to refer to the electrical equivalent of OC-1 (51.84 Mbps)
supported by the instrument.
– STM-1e—Used to refer to the electrical equivalent of STM-1
(155.52 Mbps) supported by the MSAM.
– OTN—Optical Transport Network.
– OTU1—Optical Transport Unit 1. A 2.7G OTN signal designed to carry a
SONET OC-48 or SDH STM-16 client signal. OTU1 is used on the user
interface to identify the applications used for 2.7G OTN testing.
– OTU2—Optical Transport Unit 2. A 10.7G, 11.05G, or 11.1G OTN signal
designed to carry SONET OC-192, SDH STM-64, or 10GigE Ethernet
WAN and LAN client signals. OTU2 is used on the user interface to identify
the applications used for 10.7G, 11.05G, or 11.1G OTN testing.
– OTU3 — Optical Transport Unit 3. A 43G OTN signal designed to carry
40GigE BERT signals. OTU3 is available on the 40G/100G High Speed
Transport Module.
– OTU4 — Optical Transport Unit 4. A 111.8G OTN signal designed to carry
100GigE Ethernet BERT and ODU4 encoded signals. OTU4 is available
on the 40G/100G High Speed Transport Module.
– 1GigE—Used to represent 1 Gigabit Ethernet.
– 10GigE—Used to represent 10 Gigabit Ethernet.
– 40GigE — Used to represent 40 Gigabit Ethernet.
– 100GigE — Used to represent 100 Gigabit Ethernet.
Ethernet, IP, TCP/UDP, Fibre Chan., VoIP, and Video Testing Manual
xix
About this Manual
Ethernet, IP, TCP/UDP, Fibre Channel, and IP Video Testing Manual
– FC—Used to represent Fibre Channel.
– JDSU Ethernet test set—A test set marketed by JDSU and designed to
transmit an Acterna Test Packet (ATP) payload. ATP packets carry a time
stamp used to calculate a variety of test results. The FST-2802 TestPad,
the SmartClass Ethernet tester, the HST with an Ethernet SIM, the
T-BERD/MTS 8000 Transport Module, and the MSAM can all be configured to transmit and analyze ATP payloads, and can be used in
end-to-end and loopback configurations during testing.
– SFP—Small Form-factor Pluggable module. Used throughout this manual
to represent pluggable optical modules.
– XFP—10 Gigabit small form-factor pluggable module. Used throughout
this manual to represent pluggable optical modules used to connect to the
family of 10 Gbps circuits (ranging from 9.95 Gbps to 11.3 Gbps).
– QSFP+ — Quad Small Form-Factor Pluggable optical transceiver. A
variety of optional QSFP+s are available for testing 40 Gigabit fiber
circuits.
– CFP — C Form-Factor Pluggable optical transceiver. A variety of optional
CFPs are available for testing 100Gigabit fiber circuits.
– Xv—Used as a suffix throughout the user interface for virtual channels
carried in a SONET or SDH container, where X serves as a placeholder for
the number of virtual channels, and “v” indicates that the concatenation is
virtual (rather than true concatenation). For example, if you are testing
virtual channels carried in a high order STS-3c, you would select an
STS-3c-Xv payload when you launched your application. You can then
specify the number of members (channels) when you create the virtual
channel group (VCG).
Ethernet, IP, TCP/UDP, Fibre Channel, and IP Video Testing Manual
This is the Ethernet, IP, TCP/UDP, Fibre Channel, and IP Video testing manual
for the MSAM and the Transport Module. The manual is application-oriented
and contains information about using these instruments to test service carried
on each of the listed networks. It includes an overview of testing features,
instructions for using the instruments to generate and transmit traffic over a
circuit, and detailed test result descriptions. This manual also provides contact
information for JDSU’s Technical Assistance Center (TAC).
Use this manual in conjunction with the following manuals:
– 8000 Base Unit User Manual. This manual provides an overview, specifications, and instructions for proper operation of the base unit (The 40G/
100G High Speed Transport Module requires the 8000E Base Unit).
– 6000A Base Unit User Manual. This manual provides an overview, specifications, and instructions for proper operation of the base unit.
– Dual Module Carrier, Transport Module, and MSAM Getting Started
Manual. This manual provides an overview of the connectors provided on
the hardware components, instructions for connecting to the circuit you are
testing, and specifications for the hardware components.
– PDH, SONET, SDH, NextGen, and OTN Testing Manual. This manual
provides instructions for testing each of the services listed, and detailed
test result descriptions. When using your instrument for NextGen and OTN
testing, details concerning SONET and SDH settings and test results are
provided in this manual.
xx
Ethernet, IP, TCP/UDP, Fibre Chan., VoIP, and Video Testing Manual
About this Manual
Conventions
– Remote Control Reference Manual. This manual provides the remote
control commands used when developing scripts to automate your testing.
This manual is provided electronically on the USB stick.
NOTE:
Many applications also require you to purchase and install certain testing
options; others require specific hardware connectors to connect to circuits
for testing. For example, if your instrument does not have a connector or
PIM designed to support 1GigE Optical testing, you can not transmit and
analyze a signal or traffic over a 1GigE circuit.
You can quickly determine whether or not your instrument supports certain
applications by exploring the technologies, rates, and test modes presented
on the Test menu and by reviewing the settings available when you configure a test.
Conventions
This manual uses conventions and symbols, as described in the following
tables.
Table 1
Typographical conventions
Description
Example
User interface actions and buttons or
switches you have to press appear in
this typeface.
Press the OK key.
Code and output messages appear in
this typeface.
All results okay
Text you must type exactly as shown
appears in this typeface.
Type: a:\set.exe in the dialog box.
Variables appear in this typeface.
Type the new hostname.
Book references appear in this typeface.
Refer to Newton’s Telecom Dictionary
Table 2
Keyboard and menu conventions
Description
Example
A plus sign +indicates simultaneous
keystrokes.
Press Ctrl+s
A comma indicates consecutive key
strokes.
Press Alt+f,s
A slanted bracket indicates choosing a
submenu from menu.
On the menu bar, click
Start > Program Files.
Ethernet, IP, TCP/UDP, Fibre Chan., VoIP, and Video Testing Manual
xxi
About this Manual
Safety and compliance information
Table 3
Symbol conventions
This symbol represents a general hazard.
This symbol represents a risk of electrical shock.
This symbol represents a risk of explosion.
This symbol represents a Note indicating related information or tip.
This symbol, located on the equipment, battery, or packaging
indicates that the equipment or battery must not be disposed of
in a land-fill site or as municipal waste, and should be disposed
of according to your national regulations.
Safety and compliance information
Safety and compliance information for the instrument are provided in printed
form and ship with your instrument.
Technical assistance
Table 4 lists contact information for technical assistance. For the latest TAC
information, go to www.jdsu.com or contact your local sales office for assistance. Contact information for regional sales headquarters is listed on the back
cover of this manual.
Table 4
Technical assistance centers
Region
Phone Number
Americas
1-855-ASK-JDSU (option #3)
301-353-1550
(1-855-275-5378, option #3)
[email protected]
Europe, Africa,
and Mid-East
+49 (0) 7121 86 1345
(JDSU Germany)
[email protected]
Asia and the
Pacific
+852 2892 0990
(Hong Kong)
+86 10 6655 5988
(Beijing-China)
During off-hours, you can request assistance by doing one of the following:
leave a voice mail message at the Technical Assistance number, e-mail the
North American Technical Assistance Center, [email protected], or submit your
question using our online Technical Assistance Request form at
www.jdsu.com.
xxii
Ethernet, IP, TCP/UDP, Fibre Chan., VoIP, and Video Testing Manual
Chapter 1
Basic Testing
1
This chapter explains basic testing concepts and procedures common to each
Ethernet, IP, TCP/UDP, Fibre Channel, or IP Video test. Detailed information
about concepts and procedures shared by all supported test applications are
provided in the Getting Started manual that shipped with your instrument or
upgrade,
Topics discussed in this chapter include the following:
– “Step 1: Selecting a test application” on page 2
– “Step 2: Configuring a test” on page 2
– “Step 3: Connecting the instrument to the circuit” on page 3
– “Step 4: Starting the test” on page 3
– “Step 5: Viewing test results” on page 4
– “Running multiple tests” on page 5
Ethernet, IP, TCP/UDP, Fibre Chan., VoIP, and Video Testing Manual
1
Chapter 1 Basic Testing
Step 1: Selecting a test application
Step 1: Selecting a test application
The Test menu on the Main screen lists each of the available test applications.
If you are testing using an MSAM, the applications are listed for the PIM or
PIMs that are inserted in your Transport Module chassis. If you have a dual
port chassis, by default, the first application you select will be for port 1 (P1).
To select an application
1 Select Test. The Test menu appears.
2 Select the technology (for example, Ethernet), signal, payload, and test
mode for your test application.
The instrument displays a message asking you to wait while it loads the
application.
3 Wait for the Main screen to appear, and then proceed to “Step 2: Configuring a test” on page 2.
The test application is selected.
NOTE:
When testing using an MSAM, only the applications for currently inserted
PIMs will appear on the Test menu. For example, if an SFP and XFP PIM
are inserted in the Transport Module chassis, you will not see DS1 applications.
Other applications, such as the Mac-in-Mac or NextGen GFP applications
only appear if you purchased the associated testing options.
Step 2: Configuring a test
Before you configure a test, be certain to complete the information that you
want to include when you generate reports of your test results. For details,
refer to the Getting Started manual that shipped with your instrument.
Configuring a test involves displaying the setup screens, specifying test
settings, and optionally saving the test setup. Key settings are also available
on the Main screen, on the Quick Config tabs. Changing key settings while
running a test (for example, changing the pattern transmitted) triggers an automatic restart of the test.
To display the setup screens
1 Using the Test menu, select a test application (see “Step 1: Selecting a
test application” on page 2).
2 Select the Setup soft key.
A setup screen with a series of tabs appears. The tabs displayed vary
based on the test application you selected.
3 To navigate to a different setup screen, select the corresponding tab at the
top of the screen. For example, to display the Traffic setup screen, select
the Traffic tab.
2
Ethernet, IP, TCP/UDP, Fibre Chan., VoIP, and Video Testing Manual
Chapter 1 Basic Testing
Step 3: Connecting the instrument to the circuit
Step 3: Connecting the instrument to the circuit
For detailed instructions on connecting your instrument to the circuit, refer to
the Getting Started Manual.
When connecting the unit to optical circuits, bear in mind that applied power
must not exceed the power level specified on the panel for each optical
connector.
Step 4: Starting the test
After you configure a test, connect the unit to the circuit, and, if appropriate,
turn the laser ON.
– If you are running an Ethernet, OTN, Fibre Channel, or NextGen application (launched from the SONET or SDH test menu options), you must turn
the laser ON (if you are testing an optical circuit), and then actively Start
Traffic (using the action button).
– If you are running an Ethernet or Fibre Channel application, and you would
like your unit to transmit traffic automatically, you can enable the automatic
traffic generation feature. For details, see “Enabling automatic traffic transmission” on page 32 in Chapter 4 “Ethernet and IP Testing”.
NOTE: Temperature stabilized lasers
When testing 10 Gigabit, 40 Gigabit or 100Gigabit optical circuits, some
lasers (particularly 1550 nm lasers) are temperature stabilized; therefore,
they need to reach a certain temperature before you can use them to transmit a signal. This is expected behavior, and does not indicate that there is
something wrong with the laser or test instrument.
It typically takes up to one minute for the temperature to stabilize. If you have
turned the laser on, but no signal is present on the receiving instrument or
device, simply wait for one minute.
After you start a test, use the buttons at the bottom of the screen to perform
actions such as turning the laser on and off, starting and stopping traffic,
starting and stopping a local loopback, and inserting errors, anomalies, alarms,
or defects. Table 5 lists some common Action buttons.
Table 5
Action buttons
Button
Action
Laser On/Off1
Turns the laser on or off when testing optical rates.
Insert Error/Anomaly
Inserts an error or anomaly into the transmitted traffic.
Insert Alarm/Defect
Inserts an alarm or defect into the transmitted traffic.
Start Traffic/Stop Traffic
Starts or stops transmission of Ethernet, IP, Fibre
Channel, OTN, TCP/UDP, or GFP traffic over the circuit.
1. You can optionally configure optical standard Ethernet and Fibre Channel applications to
automatically transmit traffic after you turn the laser ON.
Ethernet, IP, TCP/UDP, Fibre Chan., VoIP, and Video Testing Manual
3
Chapter 1 Basic Testing
Step 5: Viewing test results
Step 5: Viewing test results
Test results appear in the Results Windows of the Main screen.
Setting the result group and
category
To set the result group and category
1 Using the Test menu, select a test application see “Step 1: Selecting a test
application” on page 2), and then configure your test (see “Step 2: Configuring a test” on page 2).
2 Select the Results soft key to return to the Main screen.
3 Connect your module to the circuit (see “Step 3: Connecting the instrument to the circuit” on page 3).
4 If you are testing an optical interface, select the Laser button.
5 If you selected an Ethernet, Fibre Channel, or SONET/SDH GFP test
application, select the Start Traffic button to start generating and
analyzing traffic.
Results appear in the Results Windows.
6 Optional. Insert errors or anomalies into the traffic stream, or use the
Action buttons to perform other actions. These buttons only appear if applicable to your test application.
7 Use the Group and Category buttons to specify the type of results you
want to observe. Figure 1 illustrates buttons for a standard Ethernet application.
Figure 1
Result Group and Category buttons
Results for the category you selected appear in the result window.
8 Optional. To observe results for a different group or category in another
result window, press the buttons at the top of the window to specify the
group and category.
For descriptions of each result, refer to Chapter 13 “Test Results”.
TIP:
If you want to provide a screen shot of key test results, on the Main screen,
select Tools > Capture Screenshot. A screen shot will be captured and
stored as a JPG file in the /acterna/user/disk/bert/images folder.
You can include the screen shot when you create reports.
Additional test result
information
For detailed information on the following topics, refer to the Getting Started
manual that shipped with your instrument or upgrade.
– Expanding and collapsing result measurements
– Changing the result layout
– Using the entire screen for results
– About histogram results
– Viewing a histogram
4
Ethernet, IP, TCP/UDP, Fibre Chan., VoIP, and Video Testing Manual
Chapter 1 Basic Testing
Running multiple tests
– About the Event log
– About result graphs
– Clearing History results
– Creating and maintaining Custom result groups
For descriptions of each result, refer to Chapter 13 “Test Results”.
Running multiple tests
You can significantly reduce your testing time by terminating traffic over
multiple circuits simultaneously.
For example, if your instrument is configured and optioned to do so, you can
transmit traffic from the SFP and XFP PIMs to a network element, and then
loop the traffic back to your unit to analyze the signals and verify that the
network element is operating properly.
In addition, you can display two test result windows side-by-side using the Dual
Test View button.
For details, refer to the Getting Started manual that shipped with your instrument or upgrade.
Ethernet, IP, TCP/UDP, Fibre Chan., VoIP, and Video Testing Manual
5
Chapter 1 Basic Testing
Running multiple tests
6
Ethernet, IP, TCP/UDP, Fibre Chan., VoIP, and Video Testing Manual
Chapter 2
3.072G Optical Testing
2
This chapter provides information on testing 3.072G Optical services using the
MSAM. Topics discussed in this chapter include the following:
– “About 3.072G Optical testing” on page 8
– “BER Testing 3.072G Optical Layer 1” on page 8
– “Monitoring 3.072G Optical Layer 1” on page 9
Ethernet, IP, TCP/UDP, Fibre Chan., VoIP, and Video Testing Manual
7
Chapter 2 3.072G Optical Testing
About 3.072G Optical testing
About 3.072G Optical testing
The 3.072G Optical test is used to validate that the underlying dark fiber/
DWDM network is configured correctly to support 3.072G protocol without
errors.
If your instrument is equipped with the option, it supports both 3.072G Optical
Terminate and Monitor modes.
BER Testing 3.072G Optical Layer 1
To BER test 3.072G Optical Layer1
1 Using the Test Menu, select the 3.072G Optical Layer 1 BERT Terminate
application.
2 To specify the BER pattern, do the following:
a Select the Setup soft key, and then the Pattern tab.
b Select a pattern.
Pattern
Description
2^23-1 ANSI
Selects the 223 -1 pseudorandom pattern, which generates a maximum of 22 sequential 0s and 23 sequential
1s. Usually used to simulate live data for DS3 and
SONET circuits.
2^23-1 Inv ANSI
Selects the inverted 223 -1 pseudorandom pattern, which
generates a maximum of 22 sequential 1s and 23
sequential 0s. Usually used to simulate live data for DS3
and SONET circuits.
Delay
223-1 PRBS with multi-Bit Error Insertion for Latency
Measurement. This is an unframed Layer 1 Pattern. This
pattern delivers energy across the entire frequency
spectrum delivering a good basic Bit Error Test for the
optical transmission line. The periodic insertion of multiple bit errors permit a high-accuracy measurement of
timing in the 100s of nanoseconds range.
To measure round trip delay, use the Delay pattern.
NOTE:
There must be a loop at the far end (hard cable/fiber loop or far end test set
in Mon application with Rx = Tx selected) to measure round trip delay.
c Specify whether to link the Rx pattern to the Tx pattern.
d If you did not link the Rx pattern to the Tx pattern, specify the Rx
pattern.
e Press Results to return to the Main screen.
3 Connect the module to the circuit.
4 Select the Laser button.
5 Verify that the green Signal LED is illuminated.
8
Ethernet, IP, TCP/UDP, Fibre Chan., VoIP, and Video Testing Manual
Chapter 2 3.072G Optical Testing
Monitoring 3.072G Optical Layer 1
6 If desired, specify the error insertion parameters at the bottom of the page
and press the Error Insert button to insert into the signal.
7 Observe the test results in the following categories:
– Interface Signal - Stats such as Signal-Losses and Loss Seconds; Rx,
Optical-Overload and Level; Frequency and Clock Specs
– 3.072G Optical BERT- Error Stats such as Pattern Sync Losses and
Pattern Sync Loss Seconds (all), Bit Error Rate, Errors and Seconds
(typical BERT patterns), or Round Trip Delay (Delay pattern).
3.072G Optical Layer 1 BERT is complete
Monitoring 3.072G Optical Layer 1
To monitor 3.072G Optical Layer1
1 Using the Test Menu, select the 3.072G Optical Layer 1 BERT Monitor/
Thru application.
2 To specify the BER pattern, do the following:
a Select the Setup soft key, and then the Pattern tab.
b Specify the Rx Pattern.
To monitor round trip delay, use the Delay pattern.
NOTE:
The Rx Pattern selection specifies which pattern to analyze, it does not
change the transmit data from the terminating unit.
c Press Results to return to the Main screen.
3 Connect the module to the circuit.
4 If you are testing an optical interface, select the Laser button.
5 Verify that the green Signal LED is illuminated.
6 Press the Restart soft key.
7 Observe the test results in the following categories:
– Interface Signal - Stats such as Signal-Losses and Loss Seconds; Rx,
Optical-Overload and Level; Frequency and Clock Specs
– 3.072G Optical BERT- Error Stats such as Pattern Sync Losses and
Pattern Sync Loss Seconds (all), Bit Error Rate, Errors and Seconds
(typical BERT patterns), or Round Trip Delay (Delay pattern).
You are monitoring 3.072G Optical layer 1.
Ethernet, IP, TCP/UDP, Fibre Chan., VoIP, and Video Testing Manual
9
Chapter 2 3.072G Optical Testing
Monitoring 3.072G Optical Layer 1
10
Ethernet, IP, TCP/UDP, Fibre Chan., VoIP, and Video Testing Manual
Chapter 3
CPRI/OBSAI Testing
3
This chapter provides information on testing CPRI services using the MSAM.
Topics discussed in this chapter include the following:
– “About CPRI/OBSAI testing” on page 12
– “Layer 1 BER Testing” on page 12
– “Layer 2 CPRI testing” on page 15
– “Inserting errors” on page 17
– “Monitoring CPRI or OBSAI layer 1” on page 17
Ethernet, IP, TCP/UDP, Fibre Chan., VoIP, and Video Testing Manual
11
Chapter 3 CPRI/OBSAI Testing
About CPRI/OBSAI testing
About CPRI/OBSAI testing
Common Public Radio Interface (CPRI) protocol is used on 3G/4G wireless
network deployments to implement a more cost effective distributive wireless
base station architecture. CPRI is the communication protocol used to
synchronize, control, and transport data between the radio controller and
remote radio heads. The CPRI test is used to validate that the underlying dark
fiber/DWDM network is configured correctly for these new rates and meet
CPRI service requirements.
Open Base Station Architecture Initiative Reference Point 3 (OBSAI RP3)
refers to the interface between the baseband and RF components within a
cellular base station. The OBSAI test is used to verify the CWDM links between
the Central Office and the base station.
CPRI Layer 2 testing enables field technicians to verify that fiber installation is
correctly performed and CPRI Link is functional before the Radio Equipment
Controller at the central office is installed and connected to the overall system.
NOTE:
CPRI /OBSAI testing is only applicable to 8000 UIMv2 or higher.
Layer 1 BER Testing
If your instrument is optioned to do so, you can BERT over CPRI or OBSAI.
To BER test CPRI or OBSAI
1 Using the Test Menu, select the CPRI or OBSAI Layer 1 BERT Terminate
application.
Protocol
Frequency
Layer 1 BERT Applications
CPRI
614.4M
P1 Terminate
P2 Terminate
1228.8M
P1 Terminate
P2 Terminate
2457.6M
P1 Terminate
P2 Terminate
3072.0M
P1 Terminate
P2 Terminate
4915.2M
P1 Terminate
P2 Terminate
6144.0M
P1 Terminate
P2 Terminate
9830.4M
P1 Terminate
P2 Terminate
3072.0M
P1 Terminate
P2 Terminate
6144.0M
P1 Terminate
P2 Terminate
OBSAI
12
Ethernet, IP, TCP/UDP, Fibre Chan., VoIP, and Video Testing Manual
Chapter 3 CPRI/OBSAI Testing
Layer 1 BER Testing
NOTE:
You must use a XFP if testing CPRI at 9.8G, or a SPF+ for 4.9G and 6.1G.
2 To specify the BER pattern, do the following:
a Select the Setup soft key, and then the Pattern tab.
b Select a pattern.
Pattern
Description
2^23-1 ANSI
Selects the 223 -1 pseudorandom pattern, which generates a maximum of 22 sequential 0s and 23 sequential
1s. Usually used to simulate live data for DS3 and
SONET circuits.
2^23-1 Inv ANSI
Selects the inverted 223 -1 pseudorandom pattern, which
generates a maximum of 22 sequential 1s and 23
sequential 0s. Usually used to simulate live data for DS3
and SONET circuits.
Delay
223-1 PRBS with multi-Bit Error Insertion for Latency
Measurement. This is an unframed Layer 1 Pattern. This
pattern delivers energy across the entire frequency
spectrum delivering a good basic Bit Error Test for the
optical transmission line. The periodic insertion of multiple bit errors permit a high-accuracy measurement of
timing in the 100s of nanoseconds range.
Test Patterns
Includes:
– D6.6 D25.6
– 2^23-1 ANSI
– 2^23-1 Inv ANSI
– Delay
– 2^31-1 (only available for 9.8G test)
– 2^23-1 Inv (only available for 9.8G test)
These patterns are formatted using the 8B/10B symbol framing format.
This allows these patterns to be passed by network elements that
require basic synchronization messages as built into 8B/10B framing.
These patterns are therefore intended to confirm the ability of the Physical Coding Sub-layer (PCS) of equipment that implements 8B/10B to
properly synchronize to another element under specific conditions.
Ethernet, IP, TCP/UDP, Fibre Chan., VoIP, and Video Testing Manual
13
Chapter 3 CPRI/OBSAI Testing
Layer 1 BER Testing
Figure 2 through Figure 4 show the details of the specific 8B/10B
Encoded test patterns for CPRI and OBSAI used to verify the correct
operation of the RF/Baseband interface. The Pseudo-Random Bit
Sequence (PRBS) will be inserted as shown in Figure 4 on page 14.
Figure 2
Test pattern (D6.6 D25.6) frame for CPRI
Figure 3
Test pattern (D6.6 D25.6) frames for OBSAI
Figure 4
Test pattern (PRBS) frames for CPRI
To measure round trip delay, use the Delay pattern. NOTE: There must
be a loop at the far end (hard cable/fiber loop or far end test set in Mon
application with Rx = Tx selected) to measure round trip delay.
c Specify whether to link the Rx pattern to the Tx pattern.
14
Ethernet, IP, TCP/UDP, Fibre Chan., VoIP, and Video Testing Manual
Chapter 3 CPRI/OBSAI Testing
Layer 2 CPRI testing
d Select the Tx Pattern. If you did not link the Rx pattern to the Tx
pattern, also specify the Rx pattern.
e Select the Payload Analysis checkbox if you’d like to see pattern
sync, bit errors, etc. reported in the Results.
f
Press Results to return to the Main screen.
3 Connect the module to the circuit. Select either SFP1 or SFP2.
4 If you are testing an optical interface, select the Laser button.
5 If the Tx Frequency needs to be offset, select the Actions tab at the
bottom of the page and then select the Offset Tx Freq button. This will
activate the available offset frequency options. Select the desired offset.
6 To insert errors into the transmission, select the Error tab at the bottom of
the page and then select from the available Error Types, Insertion Types
and insertion Rates. Press the Insert Error button to initiate error insertion.
7 Press the Start BERT Pattern action button to start inserting the BERT
pattern.
This button appears when using the typical BERT patterns; it does not
apply if you are using the Delay pattern.
8 Verify that the green Signal LED is illuminated.
CPRI/OBSAI layer 1 BERT is complete.
Layer 2 CPRI testing
If your instrument is optioned to do so, you can set Overhead Bytes, configure
a payload and perform BER testing (with optional alarm insertion) of your CPRI
circuit.
NOTE:
CPRI Layer 2 testing is not applicable to MSAMv1.
To configure Layer 2 CPRI testing
1 Using the Test Menu, select a CPRI Layer 2 BERT Terminate application.
Protocol
Frequency
Applications
CPRI
2457.6M
Layer 2 BERT Terminate
3072.0M
Layer 2 BERTTerminate
4915.2M
Layer 2 BERTTerminate
6144.0M
Layer 2 BERTTerminate
2 Select the Setup soft key, and then the CPRI tab.
a Define the Port Type and Start-Up Sequence.
b If the Start-Up Sequence is Bypass, specify the Protocol version.
Ethernet, IP, TCP/UDP, Fibre Chan., VoIP, and Video Testing Manual
15
Chapter 3 CPRI/OBSAI Testing
Layer 2 CPRI testing
c Specify the Control and Management parameters, if necessary.
– HDLC rate (or No HDLC).
– Whether the Ethernet Channel is enabled.
– If the Ethernet Channel is enabled, enter the Ethernet Subchannel
Number.
3 Select the Pattern tab.
a Select a Pattern Mode.
b Select the desired pattern from the list of available patterns.
4 If service disruption detection is desired, select the Service Disruption
tab and click the Enable checkbox. Define the parameters to be detected
from the available selections.
5 If a timed or delayed start test is required, select the Timed Test tab and
specify the desired start times and duration.
6 Select the Results soft key to return to the Main screen.
7 Select the Laser Tab at the bottom of the screen and click the Laser On
button.
8 Select the CPRI result group and then choose a category to view:
– Error Stats
– Counts
– L1 Inband Protocol
You are testing CPRI layer 2.
Inserting alarms
You can insert alarms into a configured Layer 2 CPRI signal.
To insert alarms
1 Verify the laser is active (Laser button is yellow).
2 Select an alarm type (R-LOS, R-LOF, RAI, SDI).
3 Press the Alarm Insert button.
The module inserts an alarm and the button turns yellow.
Test results associated with the alarm or defect appear in the Status result
category.
16
Ethernet, IP, TCP/UDP, Fibre Chan., VoIP, and Video Testing Manual
Chapter 3 CPRI/OBSAI Testing
Inserting errors
Inserting errors
Action buttons on the Main screen allow you to insert errors into the CPRI
signal. If you turn on a particular error insertion rate, the error insertion
continues even after you restart a test or change the test configuration.
To insert errors
1 If you are inserting errors, select one of the following error types:
– Code
– K30.7
– BIT/TSE
2 Do the following:
– Specify the Insertion Style (Single, or Rate).
– If you specified Rate, select a rate.
3 Press the Error Insert button.
Error or pause frame insertion starts. If you are inserting errors at a particular
rate, the associated button turns yellow. To stop insertion, press the corresponding button again. Error insertion stops, and the associated button turns
grey.
Monitoring CPRI or OBSAI layer 1
If your instrument is optioned to do so, you can monitor CPRI or layer 1 OBSAI
links.
To monitor CPRI or layer1 OBSAI
1 Using the Test Menu, select a CPRI or OBSAI Layer 1 BERT Monitor/Thru
application.
BERT Mon/Thru
Applications
Protocol
Frequency
CPRI Layer 1
614.4M
P1 Mon/Thru
P2 Mon/Thru
1228.8M
P1 Mon/Thru
P2 Mon/Thru
2457.6M
P1 Mon/Thru
P2 Mon/Thru
3072.0M
P1 Mon/Thru
P2 Mon/Thru
4915.2M
P1 Mon/Thru
P2 Mon/Thru
6144.0M
P1 Mon/Thru
P2 Mon/Thru
9830.4M
P1 Mon/Thru
P2 Mon/Thru
Ethernet, IP, TCP/UDP, Fibre Chan., VoIP, and Video Testing Manual
17
Chapter 3 CPRI/OBSAI Testing
Monitoring CPRI or OBSAI layer 1
Protocol
Frequency
BERT Mon/Thru
Applications
CPRI Layer2
2457.6M
Mon/Thru
3072.0M
Mon/Thru
4915.2M
Mon/Thru
6144.0M
Mon/Thru
3072.0M
P1 Mon/Thru
P2 Mon/Thru
6144.0M
P1 Mon/Thru
P2 Mon/Thru
OBSAI
2 To specify the BER pattern, do the following:
a Select the Setup soft key, and then the Pattern tab.
– For Layer 1 CPRI/OBSAI -Select the Payload Analysis checkbox if
you'd like the test set to analyze the received BERT pattern (the
payload) for errors. This will cause pattern sync, bit errors etc. to be
reported in the results.
– For Layer 2 CPRI - Select the Pattern tab.
Select the Pattern Mode desired.
Select the desired pattern from the list of available patterns.
3 For Layer 2 CPRI -If service disruption detection is desired, select the
Service Disruption tab and click the Enable checkbox. Define the parameters to be detected from the available selections.
4 If a timed or delayed monitoring is required, select the Timed Test tab and
specify the desired start times and duration.
5 Press Results to return to the Main screen.
6 Connect the module to the circuit. If necessary, select either SFP1 or
SFP2.
7 Select the Laser button.
8 Verify that the green Signal LED is illuminated.
9 Press the Restart soft key.
You are monitoring CPRI or OBSAI layer 1.
18
Ethernet, IP, TCP/UDP, Fibre Chan., VoIP, and Video Testing Manual
Chapter 4
Ethernet and IP Testing
4
This chapter provides information on testing Ethernet and IP services using the
MSAM. Topics discussed in this chapter include the following:
– “About Ethernet and IP testing” on page 20
– “Cable Diagnostics” on page 30
– “Adjusting the frequency of transmitted optical signals” on page 31
– “Enabling automatic traffic transmission” on page 32
– “Discovering another JDSU test instrument using J-Connect” on page 33
– “Discovering network devices” on page 37
– “Protocol Analysis” on page 39
– “Layer 1 BER testing” on page 40
– “Layer 2 testing” on page 42
– “Layer 3 testing” on page 75
– “Capturing packets for analysis” on page 91
– “Loopback testing” on page 103
– “Inserting errors or pause frames” on page 103
– “Inserting alarms or defects” on page 104
– “Measuring round trip delay or packet jitter” on page 105
– “Measuring one way delay” on page 105
– “Measuring service disruption time” on page 114
– “OAM service and link layer testing” on page 115
– “MAC-in-MAC testing” on page 122
– “Synchronous Ethernet testing” on page 129
– “Transmitting and analyzing PTP/1588 traffic” on page 130
– “Discovering traffic using J-Profiler” on page 134
Ethernet, IP, TCP/UDP, Fibre Chan., VoIP, and Video Testing Manual
19
Chapter 4 Ethernet and IP Testing
About Ethernet and IP testing
About Ethernet and IP testing
If your instrument is configured and optioned to do so, you can use it to provision Ethernet and IP service, verify end-to-end connectivity, and analyze link
performance by simulating different traffic conditions. Figure 5 illustrates the
Main screen when running an Ethernet application.
Result
Port
Result
Group
Result
Category
Test
Menu Bar
Message Bar
Quick Config
LED Panel
Actions Panel
Soft keys
Figure 5
Features and capabilities
MSAM Main screen (Ethernet Terminate Application)
Features and capabilities include the following when testing Ethernet or IP
service:
– 10/100/1000, 1 Gigabit Ethernet, 10 Gigabit LAN, 10 Gigabit WAN,
40Gigabit Ethernet and 100Gigabit Ethernet testing—Testing on each of
these circuits is supported.
– JDSU Discovery—You can automatically detect other JDSU test equipment on the network, and determine their services and capabilities. For
details, see “Discovering another JDSU test instrument using J-Connect”
on page 33.
– Cable diagnostics—You can use the MSAM to examine the state of the
cables used to transmit 10/100/1000 electrical signals before you begin
testing. For details, see “Cable Diagnostics” on page 30.
– Ping test during Setup—After entering the destination address (during
application Setup or in the Quick Config bar in the Main Menu), the validity
of the address entered can be checked in layer 3+ applications. The ping
will be sent using the currently defined frame encapsulation and will be
able to respond despite mismatched frames. Ping buttons will appear next
to the Destination IP in the Quick Config bar on the main screen and on
the IP/Source Destination Address page during Setup.
– Automatic traffic transmission—You can optionally set up optical Ethernet,
IP, TCP/UDP, and Fibre Channel Traffic, Multiple Streams, and Triple Play
20
Ethernet, IP, TCP/UDP, Fibre Chan., VoIP, and Video Testing Manual
Chapter 4 Ethernet and IP Testing
About Ethernet and IP testing
applications to generate and transmit traffic automatically whenever you
turn the laser on.
– Dual port testing—You can run a dual port test in terminate or through
mode from a 10/100/1000 or 1GigE interface, and observe test results for
each port simultaneously on the Main screen. Dual port testing requires
two SFP or XFP PIMs.
– BER testing—You can verify circuit performance by sending BERT
patterns over switched (layer 2) and unswitched (layer 1) networks. You
can also configure ATP payloads carrying a BERT pattern.
– Multiple source MAC addresses—When transmitting a single stream of
Layer 2 traffic, you can simulate traffic from multiple sources by assigning
a range of MAC addresses to be carried in the frames transmitted in the
stream.
– Layer 2 transparency testing—You can transmit and analyze layer 2 traffic
with CDP, VTP, STP, and R/STP headers to verify that a circuit can support
a variety of control protocols irrespective of the transport method. For
details, see “Using J-Proof to verify layer 2 transparency” on page 70.
– Automated VLAN testing—An automated VLAN test is available that tests
a range of VLANs by transmitting and looping back frames for each VLAN
in the range for a user-specified test period, and then comparing the
number of frames transmitted to the number received. For details, see
“Automated VLAN tests” on page 309.
– Layer 3 testing—You can perform end to end tests to verify throughput.
You can also:
– Transmit packets and determine if any are lost when looped back to
your module.
– Filter traffic using layer 3 criteria.
– Measure round trip delay. The 40G/100G High Speed Transport
Module utilizes ATP version 3 for highly accurate delay measurements
(200 nsecs).
– Send ping requests and respond to ping requests from another
Ethernet device to verify connectivity.
– Record and observe the route of traffic through the network using the
Traceroute application.
– Insert IP checksum errors into the traffic stream.
– Insert Acterna payload errors into the traffic stream.
– J-Profiler traffic explorer—You can use the J-Profiler application to automatically discover and monitor up to 128 streams of traffic that satisfy your
profile criteria on 10/100/1000 electrical, 100M optical, and 1GigE optical
circuits. For details, see “Discovering traffic using J-Profiler” on page 134.
– PPPoE support—If your instrument is configured and optioned to do so,
you can configure your unit to emulate a PPPoE client or server, login to a
PPP peer to establish a PPPoE session, and then transmit IPv4 packets
over an Ethernet circuit for analysis. For details, see “Specifying the data
mode and link initialization settings” on page 75 and “Configuring MPLS
traffic” on page 77.
– IPv6 support—If you purchased the IPv6 Traffic option, you can transmit
and analyze IPv6 traffic using the terminate and monitor/thru applications.
When configuring your test, you can specify the required addresses manually, or you can use stateless or stateful auto-configuration to assign
addresses for you.
– Packet capture and analysis—If your instrument is configured and
optioned to do so, you can use it to capture transmitted and received data,
Ethernet, IP, TCP/UDP, Fibre Chan., VoIP, and Video Testing Manual
21
Chapter 4 Ethernet and IP Testing
About Ethernet and IP testing
save it on the instrument or to a USB key, and then either send the data to
another technician for analysis, or analyze it yourself using the Wireshark®
protocol analyzer (provided on the instrument). For details, see “Capturing
packets for analysis” on page 91. In addition, if capturing VoIP packets,
the data can by analyzed with the PVA-1000 utility from JDSU.
NOTE: PVA-1000 is used for VoIP analysis only.
– MPLS and VPLS testing—If you purchase the MPLS/VPLS test option,
you can configure your unit to generate, transmit, and analyze MPLS and
VPLS encapsulated frames when testing and qualifying core and metro
networks. For details, see “Configuring MPLS over Ethernet tests” on
page 28 and “Configuring Ethernet VPLS tests” on page 27.
– Q-in-Q testing—You can configure, transmit, and analyze traffic carrying
SVLAN and CVLAN tags per IEEE 802.1ad to verify that your network can
support and prioritize traffic for multiple customers without conflicts. You
can also specify a user-defined TPID for the service provider when transmitting and filtering Q-in-Q encapsulated traffic. For details, see “Configuring Q-in-Q traffic” on page 50.
– MiM testing—If you purchase the MiM testing option, you can transmit and
analyze MAC-in-MAC Ethernet traffic over a PBB (Provider Backbone
Bridged) network to verify end-to-end connectivity, and analyze link performance. For details, see “MAC-in-MAC testing” on page 122.
– Stacked VLAN—If your instrument is configured and optioned to do so,
you can configure, transmit, and analyze L2 traffic carrying SVLAN and
CVLAN tags per IEEE 802.1ad to verify that your network can support and
prioritize traffic for multiple customers without conflicts. You can also
specify a user-defined TPID for the service provider when transmitting and
filtering stacked VLAN encapsulated traffic. For details, see “Configuring
stacked VLAN traffic” on page 50.
– Trigger support. The instrument supports packet capture based on a triggering event. For details, see “Capturing packets based on a trigger” on
page 96.
– Filters enhanced to include byte pattern filter. The instrument supports
filtering on a 16-byte pattern. For details, see “Filtering traffic using byte
pattern criteria” on page 58
– Link and service layer OAM testing—OAM messages are supported,
enabling you to identify trunk problems so you can initiate a switch to a
protection path. When testing Ethernet First Mile OAM communications,
you can loopback an adjacent node or Ethernet demarcation device
(EDD), and then exchange messages with the node or device to verify that
auto-discovery and error notification are functioning properly. For details,
see “OAM service and link layer testing” on page 115.
– Packet jitter testing—You can verify the integrity of triple play services
such as Video and VoIP by qualifying the packet jitter characteristics of
Ethernet circuits. For details, see “Measuring round trip delay or packet
jitter” on page 105.
– OTN testing—If you purchased a MSAM configured for OTN testing, you
can generate and transmit 10 Gigabit LAN Ethernet payloads at OTU-2
line rates (11.05G and 11.1G) or 1 Gigabit Ethernet payloads utilizing
ODU0 multiplexing carried in an OTU-2 or OTU-1 wrapper over an OTN
circuit. If you purchased a 40G/100G High Speed Transport Module
configured for OTN testing, you can generate and transmit Bulk BERT
payloads at OTU-3 line rates (43.02G) or OTU4 line rates (111.8G) and
100 Gigabit Ethernet payloads utilizing ODU4 multiplexing carried in an
22
Ethernet, IP, TCP/UDP, Fibre Chan., VoIP, and Video Testing Manual
Chapter 4 Ethernet and IP Testing
About Ethernet and IP testing
OTU-4 wrapper over an OTN circuit. For details, see the PDH, SONET,
SDH, NextGen, and OTN Testing Manual that shipped with your instrument or upgrade.
– NextGen GFP testing—If your instrument is configured and optioned to do
so, you can use it to transmit and analyze generic framing procedure
(GFP) traffic carrying Ethernet frames over a legacy SONET or SDH
circuit, and then run layer 2 and layer 3 Ethernet tests to verify that
network performance conforms to all applicable ITU-T and IEEE standards. For details, see the PDH, SONET, SDH, NextGen, and OTN
Testing Manual that shipped with your instrument or upgrade.
– Test Access Management (TAM)—If your instrument is configured and
optioned to do so, you can now use it to remotely log into and provision
network elements such as switches and routers from a Mobility Switching
Center (MSC). You can also use your instrument to emulate a router on
the network end of the Ethernet Transport Service (ETS), run an
RFC 2554 script to put a Network Interface Device (NID) in loopback
mode, transmit traffic, then analyze looped back traffic to determine link
characteristics such as throughput and latency. For details, see “Testing
using TAM automation” on page 324 of Chapter 12 “Automated Testing”.
– One way delay measurements—If your instrument is configured and
optioned to do so, you can measure delay in one direction on a circuit. For
details, see “Measuring one way delay” on page 105.
Understanding the graphical
user interface
When you configure your module for testing, graphical displays of Ethernet
frames and IP packets are provided on the setup tabs for the application you
selected. You can specify frame or packet characteristics for transmitted and
filtered traffic by selecting the corresponding field on the graphic, and then
entering the value for transmitted or filtered traffic. Colored fields can be edited;
fields in grey can not be modified.
Frame settings
Figure 6 illustrates the frame settings for a layer 2 traffic test, with the Data field
selected.
Figure 6
Frame Settings
For details on each of the settings, see “Specifying Ethernet frame settings” on
page 45 and “Specifying Ethernet filter settings” on page 51.
Ethernet, IP, TCP/UDP, Fibre Chan., VoIP, and Video Testing Manual
23
Chapter 4 Ethernet and IP Testing
About Ethernet and IP testing
Packet settings
Figure 7 illustrates the IP packet settings for a layer 3 traffic test.
Figure 7
IP Packet Settings
For details on each of the settings, see “Specifying transmitted IPv4 packet
settings” on page 80 and“Specifying IPv4 filter settings” on page 82
Ethernet and IP test
applications
This release supports the layer 2 and layer 3 applications listed in Table 6.
– MiM applications are listed in Table 7 on page 25.
– Layer 4 TCP/UDP applications are listed in Table 15 on page 148 of
Chapter 6 “TCP/UDP Testing”.
– Multiple Streams applications are listed in Table 16 on page 166 of
Chapter 7 “Triple Play and Multiple Streams Testing”
– Triple Play applications are listed in Table 18 on page 179 of
Chapter 7 “Triple Play and Multiple Streams Testing”.
– Loopback applications are listed in Table 19 on page 194 of
Chapter 8 “Loopback Testing”.
24
Ethernet, IP, TCP/UDP, Fibre Chan., VoIP, and Video Testing Manual
Chapter 4 Ethernet and IP Testing
About Ethernet and IP testing
Table 6
Ethernet and IP applications
Application
Test Mode
10/100/1000
100M
Optical
1 GigE
Optical
10 GigE
LAN
10 GigE
WAN
40Gig &
100Gig
Optical
Layer 1 PCS
Terminate
N/A
N/A
N/A
N/A
N/A
√
Layer 1 BERT
Terminate
Monitor/Through
N/A
N/A
√
√
√
N/A
Layer 2 Patterns
Terminate
N/A
N/A
√
√
N/A
N/A
Layer 2 Traffic
Terminate
Monitor
Monitor/Through
√
√
√
√
√
√
√
√
√
√
√
√
Layer 3 Ping1
Terminate
√
√
√
√
√
√
Layer 3 Traceroute1
Terminate
√
√
√
√
√
√
Layer 3 Traffic1
Terminate
Monitor
Monitor/Thru
√
√
√
√
√
√
√
√
√
√
√
√
1. IPv4 and IPv6 applications are available. IPv4 and IPv6 applications are also available when running layer 3 and layer 4 multiple streams
terminate applications.
MiM test applications
If your instrument is optioned to do so, this release supports the MiM
(MAC-in-MAC) applications listed in Table 7.
Table 7
MPLS-TP test applications
MiM applications
Interface
Application
Test Mode
10/100/1000
MiM Traffic
Terminate
Monitor
100M Optical
MiM Traffic
Terminate
Monitor
1GigE Optical
MiM Traffic
Terminate
Monitor
10GigE LAN
MiM Traffic
Terminate
Monitor/Through
If your instrument is optioned to do so, this release supports the MPLS-TP
applications listed in Table 8.
Table 8
MPLS-TP applications
Interface
Application
Test Mode
10/100/1000
Layer 2 MPLS-TP Traffic
Terminate
100M Optical
Layer 2 MPLS-TP Traffic
Terminate
1GigE Optical
Layer 2 MPLS-TP Traffic
Terminate
10GigE LAN
Layer 2 MPLS-TP Traffic
Terminate
Ethernet, IP, TCP/UDP, Fibre Chan., VoIP, and Video Testing Manual
25
Chapter 4 Ethernet and IP Testing
About Ethernet and IP testing
PTP/1588 test applications
If your instrument is optioned to do so, this release supports the PTP/1588
applications listed in Table 9.
Table 9
Configuring applications in
Dual Through mode
PTP/1588 applications
Interface
Application
Test Mode
10/100/1000
Layer 2 PTP/1588
Layer 4 PTP/1588
Terminate
100M Optical
Layer 2 PTP/1588
Layer 4 PTP/1588
Terminate
1GigE Optical
Layer 2 PTP/1588
Layer 4 PTP/1588
Terminate
When configuring applications in Dual Through modes, you must specify test
and traffic settings for each port.
If you are currently running tests using both ports, you must remove one test
before launching a Dual Through mode application.
To configure an application using two ports
1 Launch an application in Dual Through mode.
2 Use the Port Selection soft key to select a port.
3 Configure the test running on the port. The settings you specify will apply
only to the currently selected port.
4 Use the Port Selection soft key to select the second port, then configure
the second test.
When running applications in Dual Through mode, the user interface behaves
as follows:
Quick Config settings—The Quick Config tab located under the Message
Bar, provides key settings required to configure the currently selected Port.
Changing a setting that prompts an automatic restart on one port also restarts
the test or script running on the other port.
LEDs—LEDs are provided for Port 1 and Port 2 (see Figure 5 on page 20).
Action Panel—The Action buttons affect the currently selected port.
Restart Soft key—The Restart soft key affects both ports; therefore, script
results will be reset (and inaccurate) if you press Restart while running a script
on one port. If you are running a script, wait for the script to complete before
pressing Restart.
DUAL PORT TEST RESULTS:
Although you can only perform actions on the currently selected port, you
can easily observe test results for both ports without toggling back and forth.
To do so, set the result port in one pane to Port 1, and the result port in a
second pane to Port 2.
26
Ethernet, IP, TCP/UDP, Fibre Chan., VoIP, and Video Testing Manual
Chapter 4 Ethernet and IP Testing
About Ethernet and IP testing
Configuring 10 Gigabit
Ethernet WAN tests
– When you use the instrument to test 10 Gigabit WAN interfaces, you can
specify settings that characterize the SONET or SDH network in addition
to the settings used to characterize the Ethernet data. Essentially, the
setup tabs are a combination of those used to specify SONET or SDH
settings, and those used for the Ethernet applications discussed in this
chapter. When configuring the module to test a WAN interface, refer to the
PDH, SONET, SDH, NextGen, and OTN Testing Manual that shipped with
your instrument or upgrade for details on each of the SONET/SDH setup
tabs.
NOTE:
When configuring the module for WAN testing, default SONET/SDH
overhead values are per IEEE 802.3ae.
Configuring Ethernet VPLS
tests
The instrument allows you to configure and transmit layer 2 VPLS traffic (see
Figure 8) by specifying tunnel and virtual circuit label settings.
Figure 8
VPLS network
Figure 9 illustrates generic tunnel and virtual circuit (VC) labels, which together
comprise a VPLS header. Shaded fields are user-configurable.
Figure 9
Generic tunnel and VC labels
When configuring traffic for VPLS testing, be certain to specify labels that have
already been instantiated by routers on the network. For details on specifying
VPLS settings for transmitted traffic, see “Specifying Ethernet frame settings”
on page 45. For details on filtering received VPLS traffic, see “Specifying
Ethernet filter settings” on page 51.
VPLS tunnels
In a VPLS network, customer sites are connected to the service provider
network (see Figure 8 on page 27) via PE routers. Each PE router in the
network is connected together using tunnels, and can be connected to any
other PE router residing on the network.
Ethernet, IP, TCP/UDP, Fibre Chan., VoIP, and Video Testing Manual
27
Chapter 4 Ethernet and IP Testing
About Ethernet and IP testing
Virtual channels
VPLS test applications
Each tunnel is comprised of multiple channels which are used to carry different
types of service between the PE routers.
Key VPLS applications include:
End-to-end testing of VPLS networks—For this application, you configure
your unit to transmit layer 2 traffic without a VPLS header to a second unit on
the far end of the circuit. The ingress provider edge (PE) router then adds the
VPLS header and sends the encapsulated traffic through the network. The
egress PE router removes the tunnel label. If the VPLS header also carries a
VC label, the router forwards the traffic to the appropriate interface. Finally, the
far end unit analyzes the received layer 2 traffic.
PE router emulation—For this application, you configure a unit on the nearend to emulate an ingress PE router transmitting VPLS encapsulated traffic to
a second unit on the far end. Transmitted traffic is then routed through the
VPLS network using the tunnel label you specified. The egress PE router
removes the tunnel label. If the VPLS header also carries a VC label, the router
forwards the traffic to the appropriate interface.
Traffic analysis: monitor mode— For this application, you configure a nearend unit to transmit layer 2 Ethernet traffic to an ingress PE router. The PE
router then adds the VPLS header, and sends it through the network. Using a
second unit, you connect to the circuit from a port provided by a router, and
then monitor and analyze the VPLS encapsulated traffic.
Traffic analysis: through mode— For this application, you configure a nearend unit to transmit layer 2 Ethernet traffic to an ingress PE router. The PE
router then adds the VPLS header, and sends it through the network. Using a
second unit, you connect to the circuit at a point between the two routers,
monitor and analyze the received VPLS encapsulated traffic, and then pass the
traffic through the unit to transmit it to the next router on the network.
Configuring MPLS over
Ethernet tests
The instrument allows you to transmit layer 3 IP traffic over a MPLS network
by specifying MPLS label settings. Figure 10 illustrates a generic MPLS
header. Shaded fields are user-configurable.
Figure 10 Generic MPLS header
When configuring traffic for MPLS testing, be certain to specify labels that have
already been instantiated by routers on the network. For details on specifying
MPLS settings for transmitted traffic, see “Specifying Ethernet frame settings”
on page 45. For details on filtering received MPLS traffic, see “Specifying
Ethernet filter settings” on page 51.
Key MPLS test applications include:
End-to-end testing of MPLS networks—For this application, you configure
your unit to transmit layer 3 traffic without MPLS labels to a second unit on the
far end of the circuit. The ingress provider edge (PE) router then adds the
28
Ethernet, IP, TCP/UDP, Fibre Chan., VoIP, and Video Testing Manual
Chapter 4 Ethernet and IP Testing
About Ethernet and IP testing
MPLS header and sends the encapsulated packet through the network. The
egress PE router removes the MPLS header, and then forwards the data to a
second unit on the far end. The far end unit then analyzes the layer 3 traffic.
PE router to CE router emulation—For this application, you configure a unit
on the near-end to emulate an ingress PE router transmitting MPLS encapsulated traffic to a second unit on the far end. The far end unit is configured to
emulate a customer edge (CE) router. If the network uses routers which do not
use ARP, you may also need to specify the MAC address of the PE router that
your near-end unit is connected to. Transmitted traffic is then routed through
the MPLS network using the MPLS header settings you specified. The egress
PE router removes the MPLS header, and then forwards the layer 3 IP traffic
to the far end unit (which is emulating a CE router) for layer 3 analysis.
PE router to PE router emulation—For this application, you configure a unit
on the near-end to emulate an ingress PE router transmitting MPLS encapsulated traffic to a second unit on the far end. The far end unit is configured to
emulate an egress PE router. If the network uses routers which do not use
ARP, you may also need to specify the MAC address of the PE router that your
near-end unit is connected to. Transmitted traffic is then routed through the
MPLS network using the MPLS header settings you specified. The far end unit
emulating the egress PE router removes the MPLS header, and analyzes the
layer 3 IP traffic.
Core router testing—For this application, you configure a unit on the nearend to emulate an ingress PE router, which then transmits MPLS encapsulated
traffic to a core router on the MPLS network. Using the label you specified for
the traffic originated by the near-end unit, the core router forwards the traffic to
a second far end unit, which is configured to emulate another router in the core
of the network. The far end unit then analyzes received traffic (based on the
MPLS filter criteria you specified) to determine the characteristics of the intermediary core router.
Packet analysis: monitor mode— For this application, you configure a nearend unit to transmit layer 3 IP traffic to a ingress PE router. The PE router then
adds the MPLS header, and sends it through the network. Using a second unit,
you connect to the circuit from a port provided by a core router, and then
monitor and analyze the MPLS encapsulated traffic.
Packet analysis: through mode— For this application, configure a near-end
unit to transmit layer 3 traffic to a ingress PE router. The PE router then adds
the MPLS header, and sends it through the network. Using a second unit, you
connect to the circuit between two routers, monitor and analyze the received
MPLS encapsulated traffic, and then pass the traffic through the unit to transmit
it to the next router on the network.
Ethernet, IP, TCP/UDP, Fibre Chan., VoIP, and Video Testing Manual
29
Chapter 4 Ethernet and IP Testing
Cable Diagnostics
Configuring IPv4 and IPv6
tests
Table 10
If you purchased the IPv6 option, applications are provided that allow you to
transmit and analyze either IPv4 or IPv6 traffic. Table 10 lists the key differences between the applications:
IPv4 and IPv6 applications
Feature
IPv4
IPv6
Source IP Configuration
–
Uses one of the following:
– Stateful Auto-configuration (also known
as DHCPV6)
– Stateless
Auto-configuration
– Manual configuration
–
In IPoE mode, uses DHCP or manual
configuration.
In PPPoE mode, uses the client-server
PPPoE login process. For details, see
“Configuring MPLS traffic” on page 77.
Source IP Address
A single IP address is assigned to the interface transmitting IP traffic.
Two IP addresses are assigned:
– Link-local address. this source address is
assigned locally, and must always go
through duplicate address detection
(DAD).
– Global address. This second source
address is not used locally; it is used to
transmit traffic beyond the router.
Automatic
MAC Address Resolution
Uses ARP
Uses Neighbor Solicitation
Traffic
prioritization
Uses one of the following:
– Layer 2 VLAN or Q-in-Q encapsulation.
– Layer 3 MPLS encapsulation which uses
labels and tunnel priorities.
Uses the following:
– VLAN or Q-in-Q encapsulation.
– Flow labels. The instrument allows you to
configure traffic with flow labels simply to
determine whether routers on the circuit
support the labels.
– MPLS encapsulation is not supported.
IP Header Checksums
Checksum error insertion supported.
Does not use checksums.
Error Messages
ICMPv4 messages appear.
ICMPv6 messages appear.
Cable Diagnostics
Before testing 10/100/1000 electrical Ethernet, IP (IPoE), or TCP/UDP circuits,
you can use the instrument to examine the state of the cables used to transmit
electrical signals. Typically this involves out-of-service testing to determine the
link status, the pair status of each MDI or MDI-X pair, the pair assignments for
1000M links, the polarity for each MDI pair, and the pair skew. You can also
use the instrument to verify whether or not Power over Ethernet (PoE) service
is available on the link (per IEEE 802.3af). Finally, if the link is inactive, you can
use the instrument to determine the nature of the fault.
Cable diagnostics should not be run in PPPoE Data Mode when running
layer 3 test applications.
Running cable diagnostics
30
Running cable diagnostics involves connecting to the link, launching the Cable
Diagnostics tool, and then observing the measurements provided on the Cable
Diagnostics screen.
Ethernet, IP, TCP/UDP, Fibre Chan., VoIP, and Video Testing Manual
Chapter 4 Ethernet and IP Testing
Adjusting the frequency of transmitted optical signals
To run cable diagnostics
1 If you haven’t already done so, turn ON the Transport Module, and launch
a 10/100/1000 electrical Ethernet application, and verify that Auto-negotiation is turned ON.
2 Select the Toolkit soft key, and then select the Cable Diagnostics tool.
The Cable Diagnostics screen appears.
3 Connect the Transport Module to the link.
4 Verify that traffic is not being transmitted. The Start Traffic action button
should be grey.
5 To start the diagnostics, select Analyze Cable.
6 Observe the cable results and measurements.
Cable diagnostics are complete.
Viewing cable measurements
Figure 11
Cable measurements appear automatically on the Cable Diagnostics screen
(see Figure 11).
Cable Diagnostics screen
For detailed descriptions of each of the measurements, see “Cable Diagnostic
results” on page 342.
Adjusting the frequency of transmitted optical signals
If your unit is configured and optioned to do so, you can adjust the frequency
of transmitted optical signals in 1 PPM increments. Before adjusting the
frequency, consider the following:
– If you are transmitting traffic to another unit placed in LLB mode, if you
increase the frequency you may overrun the LLB unit. As a result, the
transmitting unit will report lost frames and out of sequence frames in the
traffic received from the LLB unit.
– Increasing the frequency may also overrun certain network devices on the
circuit you are testing.
Ethernet, IP, TCP/UDP, Fibre Chan., VoIP, and Video Testing Manual
31
Chapter 4 Ethernet and IP Testing
Enabling automatic traffic transmission
To adjust the frequency
1 If you haven’t already done so, use the Test Menu to select the test application for the interface you are testing. Refer to Table 6 on page 25
through Table 7 on page 25 for a list of layer 2 and layer 3 applications.
Table 15 on page 148 lists layer 4 applications.
2 Connect the module to the circuit.
3 Select the Laser button.
4 Select the Laser action bar, and then do one of the following:
– To increase the frequency by 1 PPM, press Freq Offset +1.
– To decrease the frequency by 1 PPM, press Freq Offset -1.
You increase or decrease the frequency up to 100 PPM.
5 On the transmitting unit, observe the values for the following results in the
Interface result group, Signal category:
– Tx Freq Max Deviation (ppm)
– Tx Frequency Deviation (ppm)
6 On the receiving unit, verify that the values for the following results match
the transmitted frequency values.
– Rx Freq Max Deviation (ppm)
– Rx Frequency Deviation (ppm)
The frequency was adjusted.
Enabling automatic traffic transmission
You can optionally set up Ethernet LAN, IP, TCP/UDP, and Fibre Channel test
applications to generate and transmit traffic automatically whenever you turn
the laser on (for optical applications).
Prerequisites for traffic
transmission
If you enable automatic traffic generated, traffic is transmitted after the
following occurs:
– You turn the laser ON (using the Laser ON action button).
– A signal is acquired.
– Synchronization is acquired.
– A link is established.
– If you are running a layer 3 (IP) application and ARP is enabled, ARP must
be successful. If ARP is not enabled, the destination IP address must be
available.
– If you are running a Fibre Channel application, the login process must be
complete.
As always, you can turn traffic off at any time using the Stop Traffic action
button.
Issues to consider
32
Consider the following issues and behavior before enabling automatic traffic
generation:
Ethernet, IP, TCP/UDP, Fibre Chan., VoIP, and Video Testing Manual
Chapter 4 Ethernet and IP Testing
Discovering another JDSU test instrument using J-Connect
– This is not a global setting. This setting does not affect all Ethernet LAN,
IP, TCP/UDP, and Fibre Channel applications; you must enable automatic
traffic generation for each individual application. After you enable the
setting for a particular application, it will remain enabled until you disable it.
– Changing setups while tests are running. Your unit is designed to
handle traffic transmission appropriately when you change key setups
while a test is running. In some instances, if you change key setups while
running a test, traffic stops temporarily (as a result of the changed setup),
and then starts again. In other instances, changing a setup stops traffic
entirely until you actively start it again.
This is still the case when automatic traffic generation is enabled. If you
change a setup that causes the unit to stop transmitting traffic entirely, you
must actively start it again by pressing the Start Traffic action button.
– Loopback testing. Ensure that your unit is not placed in loopback mode
by verifying that the LLB action button is grey. If you intend to issue a
command to loop up another unit, make certain automatic traffic generation is not enabled on the far end unit. If it is not disabled, the far end unit
will not respond to the loop up command.
Issues specific to certain applications are explained in the associated procedures provided in this chapter.
Enabling the feature
To enable automatic traffic generation
1 Using the Test menu, launch the test application for the optical interface
you are about to test.
2 Select the Setup soft key, and then do the following:
a Select the Interface tab.
b Select the Physical Layer sub-tab.
c Set Auto-start traffic when laser turned on to Yes.
Traffic will be transmitted after you turn the laser on and the criteria listed in
“Prerequisites for traffic transmission” on page 32 is satisfied.
Discovering another JDSU test instrument using J-Connect
When testing using an MSAM, you can automatically detect other JDSU test
instruments on the same subnet and determine their capabilities.You can then
optionally configure key parameters for your test automatically based on a
discovered instrument’s settings.
NOTE:
The J-Connect feature is not available when using a 40G/100G High Speed
Transport Module.
When your instrument discovers the other instruments on the subnet, it is
simply providing a snapshot of the information available for the instruments at
that current time. If someone changes an instrument’s IP address, or disconnects an instrument from the circuit, this will not be reflected in the snapshot.
To ensure that you have accurate data, you should refresh the display periodically. The instruments must be on the same VLAN ID and ether types.
Ethernet, IP, TCP/UDP, Fibre Chan., VoIP, and Video Testing Manual
33
Chapter 4 Ethernet and IP Testing
Discovering another JDSU test instrument using J-Connect
The J-Connect feature is not available when testing using the Transport
Module, or when running MAC-in-MAC, multiple stream, IPv6, IP Video, or
Triple Play applications.
Discoverable instruments
Discoverable test instruments include:
– The T-BERD/MTS 8000 Transport Module
– The T-BERD/MTS 6000A MSAM
– HST SIMs
Prerequisites
To be discoverable, JDSU test instruments must:
– Run a software version that supports the J-Connect feature.
– Be configured to be discoverable.
– Have a unique source IP address. JDSU test instruments of the same type
(for example, MSAMs) ship from the factory with the same default source
IP address. If you want to discover the instrument on the subnet, be
certain to specify a different source IP address.
On the transmitter side, destination addresses and port numbers can be
discovered. On the receiver side, source addresses and port numbers can be
discovered. If you want to use a discovered instrument’s MAC and IP
addresses or port numbers to configure the settings on your instrument, verify
the following:
– In the Ethernet menu, verify that the Destination Type is Unicast.
– In the Ethernet Filter, verify that the Source Type is Unicast.
– In the IP Filter, verify that the filter is enabled, and that the Source IP
setting is checked.
– In the TCP/UDP Filter, verify that the filter is enabled, and that the service
type for the source port is User Defined.
– Verify that you are not transmitting traffic.
– If you want to use the discovered MAC address as the destination
address, turn ARP off if you are running a layer 3 or layer 4 application.
Discovering an instrument
To discover another JDSU test instrument
1 Before testing, ensure that instruments on the subnet are discoverable by
doing the following for each:
a Launch a single-stream IPv4 terminate application (see “Step 1:
Selecting a test application” on page 2).
b On the Main screen, above the result panes, select the J-Connect tab,
and then verify that the Make this unit discoverable setting is
selected.
c Verify that a different source IP address is assigned to each instrument.
To observe the IP settings used for remote connections and the
J-Connect feature, if you are running a layer 2 application, go to the
Network Visibility sub-tab (on the Interface set up tab). If you are
running a layer 3 or layer 4 application, the source IP address appears
34
Ethernet, IP, TCP/UDP, Fibre Chan., VoIP, and Video Testing Manual
Chapter 4 Ethernet and IP Testing
Discovering another JDSU test instrument using J-Connect
on the IP setup tab. This is also the IP address that a remote instrument must use to connect to the instrument when running the Asymmetric RFC 2544 test.
2 Connect your instrument to the circuit, and then do the following:
a Launch a single-stream layer 2, layer 3 (IPv4), layer 3 PING, or
layer 4 terminate application.
b Verify that the Sync Acquired and Link Active LEDs are illuminated,
indicating that an active link is established.
3 Verify that you are not running a timed test on any port.
4 If you haven’t already done so, select the J-Connect tab on the Main
screen, then select Discover Units.
A message appears asking you to wait while the instrument discovers
devices.
If the instrument discovered other test instruments, their unit identifiers appear
on the Discovered Devices screen.
If the instrument does not discover any other test instruments, a message
appears stating that no devices were discovered, and instructing you to press
Refresh to start the process again.
NOTE:
The J-Connect feature is also available when specifying destination MAC or
IP addresses, or port numbers for transmitted traffic, or source MAC or IP
addresses, or port numbers for filtered traffic.
About the Refresh key
The Refresh key appears whenever the Discovered Devices screen is
displayed. Use the button to rediscover devices on the subnet (for example, if
you suspect a discovered device is no longer connected to the circuit).
Sorting discovered
instruments
By default, discovered instruments are listed by their unit identifiers. You can
optionally sort them by serial number, application name, MAC, or IP address.
To sort discovered instruments
1 Discover the instruments.
2 On the Discovered Devices screen, select the Display By ... drop down
list.
3 Select the sort key.
The instruments are sorted using the new key.
The application names that appear on the screen are abbreviated due to space
constraints. Refer to Table 11 for the application name as it is typically used.
Table 11 Discovered application names
Discovered Name
Application Name
TermEth100ML2Loopback
100M Optical Eth Layer 2 Loopback Term
TermEth100ML2Traffic
100M Optical Eth Layer 2 Traffic Term
Ethernet, IP, TCP/UDP, Fibre Chan., VoIP, and Video Testing Manual
35
Chapter 4 Ethernet and IP Testing
Discovering another JDSU test instrument using J-Connect
Table 11 Discovered application names (Continued)
Discovered Name
Application Name
TermEth100ML3Loopback
100M Optical Eth Layer 3 Loopback
TermEth100ML3Ping
100M Optical Eth Layer 3 Ping Term
TermEth100ML3Traffic
100M Optical Eth Layer 3 Traffic Term
TermEth100ML4Loopback
100M Optical Eth Layer 4 Loopback
TermEth100ML4Traffic
100M Optical Eth Layer 4 Traffic Term
TermEth10GL2Loopback
10GigE LAN Layer 2 Loopback
TermEth10GL2Traffic
10GigE LAN Layer 2 Traffic Term
TermEth10GL3Loopback
10GigE LAN Layer 3 Loopback
TermEth10GL3Ping
10GigE LAN Layer 3 Ping Term
TermEth10GL3Traffic
10GigE LAN Layer 3 Traffic Term
TermEth10GL4Loopback
10GigE LAN Layer 4 Loopback
TermEth10GL4Traffic
10GigE LAN Layer 4 Traffic Term
TermEth10ML2Loopback
10/100/1000 Eth Layer 2 Loopback
TermEth10ML2Traffic
10/100/1000 Eth Layer 2 Traffic Term
TermEth10ML3Loopback
10/100/1000 Eth Layer 3 Loopback
TermEth10ML3Ping
10/100/1000 Eth Layer 3 Ping Term
TermEth10ML3Traffic
10/100/1000 Eth Layer 3 Traffic Term
TermEth10ML4Loopback
10/100/1000 Eth Layer 4 Loopback
TermEth10ML4Traffic
10/100/1000 Eth Layer 4 Traffic Term
TermEth1GL2Loopback
1GigE Layer 2 Loopback
TermEth1GL2Patterns
1GigE Layer 2 Patterns Term
TermEth1GL2Traffic
1GigE Layer 2 Traffic Term
TermEth1GL3Loopback
1GigE Layer 3 Loopback
TermEth1GL3Ping
1GigE Layer 3 Ping Term
TermEth1GL3Traffic
1GigE Layer 3 Traffic Term
TermEth1GL4Loopback
1GigE Layer 4 Loopback
TermEth1GL4Traffic
1GigE Layer 4 Traffic Term
TermOc192Sts192cEthL2Loopback
10GigE WAN OC-192c Layer 2 Loopback
TermOc192Sts192cEthL2Traffic
10GigE WAN OC-192c Layer 2 Traffic Term
TermOc192Sts192cEthL3Loopback
10GigE WAN OC-192c Layer 3 Loopback
TermOc192Sts192cEthL3Ping
10GigE WAN OC-192c Layer 3 Ping Term
TermOc192Sts192cEthL3Traffic
10GigE WAN OC-192c Layer 3 Traffic Term
TermStm64Au464cVc464cEthL2Loopback
10GigE WAN STM-64 Layer 2 Loopback
TermStm64Au464cVc464cEthL2Traffic
10GigE WAN STM-64 Layer 2 Traffic Term
TermStm64Au464cVc464cEthL3Loopback
10GigE WAN STM-64 Layer 3 Loopback
TermStm64Au464cVc464cEthL3Ping
10GigE WAN STM-64 Layer 3 Ping Term
TermStm64Au464cVc464cEthL3Traffic
10GigE WAN STM-64 Layer 3 Traffic Term
36
Ethernet, IP, TCP/UDP, Fibre Chan., VoIP, and Video Testing Manual
Chapter 4 Ethernet and IP Testing
Discovering network devices
Observing details for an
instrument
After discovering the instruments, you can observe details for a particular
instrument, and indicate whether or not you want to use the discovered instrument’s MAC and IP address, and port number (if applicable) when you
configure your instrument.
To observe details for a discovered instrument
1 Select the instrument on the Discovered Devices screen.
The Device Details screen appears to the right.
2 If you want to automatically apply the discovered instrument’s MAC or IP
address, or port number to your instrument’s configuration, do the
following:
a To use the discovered instrument’s MAC or IP address, or port number
as the destination MAC or IP address, or port number for your transmitted traffic, highlight the check box under Tx, and then select
Configure Checked Item(s).
b To filter received traffic using the discovered instrument’s source MAC
or IP address, or port number, highlight the check box under Rx, and
then select Configure Checked Item(s).
3 Press Close to return to the previous screen.
Details were displayed, and your instrument is configured based on the
settings you selected.
NOTE:
If no MAC address was discovered, go to the Ethernet setup tab, change
the destination type to Unicast, and then re-discover the instruments.
Discovering network devices
The Network Discovery test is used to identify nodes and devices on the local
network It is typically done to gain knowledge of accessible devices prior to
analysis and debug. It provides information about what kinds of devices are
available for access, and information about how the network is configured.
To discover network devices
1 If you haven’t already done so, use the Test Menu to select the Traffic test
application for the interface you are testing. Refer to Table 6 on page 25
through Table 7 on page 25 for a list of layer 2 and layer 3 applications.
Table 15 on page 148 lists layer 4 applications.
2 Select the Toolkit soft key, and then select the Network Discovery tool.
3 Select the Settings button, and then specify the following settings.
Setting
Description
Mode
Specify whether the discovery is active or passive.If
testing layer 2, this cannot be changed, it is always
passive
MAC Source Type
Specify the MAC address to use - the factory default
or a user defined address.
User Defined MAC
If the MAC source is user defined address, specify
the user defined MAC address
Ethernet, IP, TCP/UDP, Fibre Chan., VoIP, and Video Testing Manual
37
Chapter 4 Ethernet and IP Testing
Discovering network devices
Setting
Description
Source IP Type
Specify the source of the IP address (Static or
DHCP). If testing layer 2, this item is not available.
Source IP
If the IP Type is Static, specify the local IP address.
Default Gateway
If the IP Type is Static, specify the local gateway.
Subnet Mask
If the IP Type is Static, specify the local subnet
mask.
DNS Type
Indicates where to get the DNS address. If IP Type
is Static, use Static; if DHCP, use Auto.
Primary DNS
If the DNS Type is Static, specify the IP address of
the primary DNS server
Secondary DNS
If the DNS Type is Static, specify the IP address of
the secondary DNS server
4 Start the discovery.
The test reports the discovered devices. This could include all or only a
few of the following:
– Infrastructure:
– IP Networks - Listing of subnets discovered and count of devices
discovered per subnet.
– Domains - Listing of domains discovered (NetBIOS) and count of
devices discovered per domain.
– VLANs - Listing of VLAN IDs discovered, priorities of the discovered
VLANs, and count of devices per VLAN.
– Core
– Routers - Listing of the IPs discovered and a list of the MACs discovered.
– Distribution
– Switches - Listing of switches discovered and the services provided by
the switch.
– Access
– Hosts - Name of the devices as known to the DNS, the IP address of
the device, MAC address of the device, and the name of the device as
known to NetBIOS.
– Servers - Name of the devices as known to the DNS, the IP address of
the device, MAC address of the device, the name of the device as
known to NetBIOS, and the services offered by the device.
5 Optional. To save the test results, select Report and then specify a file
name for the report and the file format.
You have discovered network devices.
38
Ethernet, IP, TCP/UDP, Fibre Chan., VoIP, and Video Testing Manual
Chapter 4 Ethernet and IP Testing
Protocol Analysis
Protocol Analysis
The Protocol Analysis utility automates the capture/decode process by
passively detecting a packet for a selected protocol and then providing the user
relevant information decoded from the packet.
This utility detects and decodes port data in LAN networks configured using the
Cisco Discovery Protocol (CDP) or the Link Layer Discovery Protocol (LLDP).
Protocol Analysis can be used to recover the switch and port data supplied
during configuration to determine port availability on a network.
To analyze protocol
1 If you haven’t already done so, use the Test Menu to select a Traffic
Monitor test application for the interface you are testing. Refer to Table 6
on page 25 for a list of layer 2 and layer 3 applications.
NOTE:
The Protocol Analysis utility is provided in all Layer 2 and Layer 3 Ethernet
traffic monitoring applications from 10/100/1000 to 10GigE interfaces
(10GigE WAN excluded).
2 Select the Toolkit soft key, and then select the Protocol Analysis.
3 Select the Protocol to Analyze - CDP or LLDP.
4 To initiate the protocol analysis click the Start Analysis button.
The utility displays the configured parameters of the ports analyzed:
– CDP:
– Device Identifier - Name specified for the device containing the port.
– Port Identifier - Name specified for the port.
– VLAN ID - Name specified for the VLAN into which the port has been
configured.
– Source MAC address - MAC address of the device IP subnet address.
– IP subnet address - IP subnet address into which the device containing
the port has been configured.
– LLDP:
– Chassis identifier - Name specified for the chassis containing the port.
– Port identifier - Name specified for the port.
– Time to Live - Duration of the LLDP advertisement value.
– Source MAC (with optional VLAN identifier) - MAC address of the
device IP subnet address and (optional) specified name for the VLAN
into which the port has been configured.
– Management IP address - The IP address for the management port of
the device.
– MAU Type - Medium Attachment Unit Type - The physical component
type used to transmit/receive on the port identified.
5 Optional. To save the test results, select Export Text File and then accept
the given filename or click Rename button and specify a file name for the
report, to be saved in the Reports subdirectory, and select OK twice.
You have completed protocol analysis.
Ethernet, IP, TCP/UDP, Fibre Chan., VoIP, and Video Testing Manual
39
Chapter 4 Ethernet and IP Testing
Layer 1 BER testing
Layer 1 BER testing
When testing 1 Gigabit, 10 Gigabit LAN, 10 Gigabit WAN, or 100 Gigabit
Ethernet service, you can generate and receive layer 1 test patterns, and
monitor and analyze received signals.
NOTE: Changing BERT patterns
If you change a BERT pattern during the course of your test, be certain to
press the Restart soft key to ensure that you regain pattern sync.
BER testing layer 1
Use the layer 1 BERT terminate application to generate and receive layer 1 test
patterns.
NOTE:
For 10 Gigabit Ethernet patterns, refer to IEEE 802.3ae-2002, Sections
49.2.8, 49.2.12, and 52.9.1 for detailed descriptions of each pattern. For
1 Gigabit Ethernet MF, LF, and HF patterns, refer to the IEEE 802.3, 2000
Edition, Annex 26A. For 1 Gigabit Ethernet RDPAT, JTPAT, and SNPAT patterns, refer to the NCITS TR-25-1999 specifications.
To BER test layer 1
1 If you haven’t already done so, use the Test Menu to select the Layer 1
BERT terminate application for the circuit you are testing. For PCS BERT
testing go to step 4.
2 Select the Setup soft key.
3 Select the Pattern tab, and then do the following:
a Specify the TX Pattern.
b If you wish to do so, check the box for Use same pattern for Tx and
Rx and then specify a Tx pattern. If using the Delay pattern, the box
should be checked (Tx=Rx).
If the check box for Use same pattern for Tx and Rx is not checked,
select an Rx Pattern and a Tx Pattern.
4 Connect the test instruments to the circuit.
5 On both instruments, if you are testing an optical interface, select the
Laser button.
6 On both instruments, verify that the green Signal Present and Sync
Acquired LEDs are illuminated. If using the Delay pattern, only the Signal
Present LED appears (Sync Acquired is not used). For PCS BERT testing
go to step 8.
7 On both instruments, do the following:
a If you are testing a 1GigE optical circuit, select the Actions tab, and
then press the Start BERT Pattern button. This is not necessary if you
are using the Delay pattern or testing a 10GigE LAN or WAN circuit.
b Verify that the green L1 Pattern Sync LED illuminates. If you are testing
a 1GigE optical circuit, and the LED is not illuminated, stop transmitting
the pattern from the other instrument, and then transmit it again. The
LED will illuminate.
40
Ethernet, IP, TCP/UDP, Fibre Chan., VoIP, and Video Testing Manual
Chapter 4 Ethernet and IP Testing
Layer 1 BER testing
8 At a minimum, observe the test results in the following categories:
– Summary
– Error Stats
Layer 1 BER testing is complete.
When running the L1 BERT application, your LEDs may indicate that you have
L1 Pattern Sync without word sync. The word sync status is indicated on your
unit using a red Sync Acquired LED (if word sync was obtained, then lost), or
an extinguished LED (if word sync was never obtained since starting your test).
This is usually due to a temporary loss of signal or word sync when receiving
an L1 pattern that does not contain Ethernet compliant link characters (for
example, IDLE). To resolve this, stop transmitting the L1 pattern momentarily
to allow the receiver to regain sync, and then begin transmitting the pattern
again. The exception is when using the Delay using any pattern other than
Delay.
If this occurs, be certain to determine why the signal or word sync was lost
temporarily.
Monitoring layer 1 BER
Use the layer 1 BERT monitor application to analyze the received signal, and
then pass the signal bit-for-bit through the unit’s transmitter (if you select
Connect Rx to Tx).
NOTE:
If you are monitoring traffic on an optical circuit, be certain to turn the laser
on using the Laser button on the Main screen.
To monitor layer 1 BERT
1 Using the Test Menu, select the Layer 1 BERT monitor/through test application for the interface you are testing.For PCS BERT testing go to step 4.
2 To specify the BER pattern for the traffic you are monitoring, select the
Setup soft key, select the Pattern tab, and then select the Rx Pattern.
3 Press Results to return to the Main screen.
4 Connect the module to the circuit.
5 If you are testing an optical interface, select the Laser button.
6 Verify that the green Signal Present LED is illuminated. For PCS BERT
testing go to step 8.
7 Select Connect Rx to Tx to pass the received pattern through to the
transmitter.
8 At a minimum, observe the test results in the following categories:
– Summary
– Error Stats
Monitoring layer 1 BERT is complete.
Ethernet, IP, TCP/UDP, Fibre Chan., VoIP, and Video Testing Manual
41
Chapter 4 Ethernet and IP Testing
Layer 2 testing
Link connectivity testing
Using the Link Connectivity Test, you can locate which port on the hub, switch,
or router is being used. This is useful when one technician is troubleshooting
and the test access port is in a different physical location than the switch.
CAUTION: LOSS OF DATA
This is an intrusive test. It temporarily brings the link down. Do not run this
test when generating traffic.
To test link connectivity (not applicable with 40G/100G High Speed Transport
Module)
1 Connect the instrument to the circuit.
2 Verify that you are not generating traffic.
3 Select the Toolkit soft key, and then select the Link Connectivity Test
tool.
The Link Connectivity Test starts.
4 Go to the location of the hub, switch, or router and observe the link activity
LEDs. The port that is connected to the instrument will blink three seconds
on and three seconds off.
The link connection is located.
Layer 2 testing
Using the instrument, you can transmit, monitor, and analyze layer 2 Ethernet
traffic. Step-by-step instructions are provided in this section for the following:
– “Specifying interface settings” on page 42
– “Specifying Ethernet frame settings” on page 45
– “Specifying Ethernet filter settings” on page 51
– “Specifying traffic load settings” on page 60
– “Transmitting and analyzing layer 2 traffic” on page 64
– “Transmitting and analyzing layer 2 patterns” on page 65
– “Monitoring layer 2 traffic” on page 66
– “Transmitting and analyzing layer 2 MPLS-TP, T-MPLS or MPLS traffic” on
page 66
– “Using J-Proof to verify layer 2 transparency” on page 70
NOTE:
If during the course of testing you change the frame length (or settings that
impact the calculated frame length) while the unit is already transmitting traffic, the unit resets your test results, but some residual frames of the old
length may be counted because they are already in the traffic stream.
Specifying interface settings
Before you transmit traffic, you can specify interface settings which:
– Indicate which SFP jack you are using (if you are monitoring traffic on a
1 GigE circuit, and your unit is equipped with SFP jacks).
42
Ethernet, IP, TCP/UDP, Fibre Chan., VoIP, and Video Testing Manual
Chapter 4 Ethernet and IP Testing
Layer 2 testing
– Specify the transmitted wavelength (if you are monitoring traffic on an
10 Gigabit Ethernet circuit, and your unit is equipped with 850 nm,
1310 nm, and 1550 nm connectors).
– Turn flow control off to ignore pause frames sent to the instrument by its
Ethernet link partner, or on if you want your unit to respond to received
pause frames.
– Specify the pause quanta for transmitted pause frames. If you are specifying interface settings for an IP Video application, pause frames can not
be transmitted; therefore, this setting does not appear on the Physical
Layer sub-tab.
– Specify the speed and duplex settings for 10/100/1000 Ethernet traffic.
– Turn auto-negotiation for 10/100/1000 or 1 Gigabit Ethernet optical circuits
on to tell the instrument to negotiate its capabilities with another Ethernet
device before transmitting idle traffic. If you need to validate the autonegotiation capabilities of the device you are negotiating with, you can
change each of the module’s default capabilities.
NOTE:
For 10/100/1000 Ethernet, if you turn auto-negotiation ON, and the Duplex
setting is FULL, flow control is also ON by default. The module also advertises that it is capable of transmitting and receiving pause frames. If you turn
auto-negotiation OFF, flow control is user-configurable.
If you turn auto-negotiation OFF, you must use a cross-over cable to connect
to the circuit.
To specify interface settings
1 If you haven’t already done so, use the Test Menu to select the test application for the interface you are testing. Refer to Table 6 on page 25
through Table 7 on page 25 for a list of layer 2 and layer 3 applications.
Table 15 on page 148 lists layer 4 applications.
2 Select the Setup soft key, and then select the Interface tab.
3 Select the Signal sub-tab, and then do one of the following:
– If you selected a 1GigE application and your unit is equipped with SFP
jacks, select the Connector sub-tab, and then select the connector
(jack) that you are using for the SFP.
– If you have an older chassis, or if you selected a 10Gigabit Ethernet
application, select the Signal sub-tab, and then specify the wavelength.
If your module only supports one wavelength (850 nm, 1310 nm or
1550 nm), the wavelength settings on the Main screen and Interface tab
are disabled.
Ethernet, IP, TCP/UDP, Fibre Chan., VoIP, and Video Testing Manual
43
Chapter 4 Ethernet and IP Testing
Layer 2 testing
4 Select the Physical Layer sub-tab, and then specify the following settings:
Interface
Settings
10/100/1000
–
–
–
–
–
–
1 Gigabit
–
–
–
–
–
44
Auto Negotiation. If you want to negotiate
capabilities with another switch, select On; otherwise, select Off. Auto Negotiation is always On
when your unit is configured to test a
1000 BaseT interface.
Pause Length (Quanta). Select the field to
enter the quanta to be carried by transmitted
pause frames. To determine the pause duration,
the receiving device performs the following calculation:
10 Mbps electrical: Quanta x 51.2 ms
100 Mbps electrical: Quanta x 5.12 ms
1000 Mbps electrical: Quanta x 512 ns
10BaseTX FDX/HDX.
100BaseTX FDX/HDX
1000BaseTX FDX/HDX
Select Yes if you want to advertise that the module is capable of full-duplex or half-duplex transmission for each rate; otherwise, select No.
These settings only appear if auto negotiation is
On.
Flow Control. If auto negotiation is OFF, select
On if you want the module to adjust the transmitted bandwidth when it receives pause frames, or
Off to ignore pause frames.
Duplex. If auto negotiation is off, specify Half or
Full duplex transmission.
Speed (Mbps). If auto negotiation is off, specify
10 (10 Mbps) or 100 (100 Mbps) as the rate for
the link. This setting only appears if auto negotiation is Off.
Auto Negotiation. If you want to negotiate
capabilities with another switch, select On; otherwise, select Off. Auto Negotiation is only available in Monitor mode.
FDX Capable/HDX Capable. By default, the
module advertises it is capable of full and halfduplex transmission (Yes). If you need to advertise that it is not capable, select No. This setting
only appears if auto negotiation is On.
Pause Capable. By default, the module advertises it is capable of transmitting and interpreting
received pause frames (Both). If you need to
change the default capabilities, select Neither,
Tx Only, or Rx Only. This setting only appears if
auto negotiation is On.
Flow Control. Select On if you want the module
to adjust the transmitted bandwidth when it
receives pause frames, or Off to ignore pause
frames. This setting only appears if auto negotiation is Off.
Pause Length (Quanta). Select the field to
enter the quanta to be carried by transmitted
pause frames. To determine the pause duration,
the receiving device performs the following calculation:
1GigE optical: Quanta x 512 ns
Ethernet, IP, TCP/UDP, Fibre Chan., VoIP, and Video Testing Manual
Chapter 4 Ethernet and IP Testing
Layer 2 testing
Interface
Settings
10 Gigabit LAN
10 Gigabit WAN
–
–
Flow Control. Select On if you want the module
to adjust the transmitted bandwidth when it
receives pause frames, or Off to ignore pause
frames.
Pause Length (Quanta). Select the field to
enter the quanta to be carried by transmitted
pause frames. To determine the pause duration,
the receiving device performs the following calculation:
10GigE LAN optical: Quanta x 51.2 ns
5 Optional. If you want to transmit an ID to identify all loop up/loop down
frames originating from the module, select the Unit Identifier field, and then
type the ID. The default ID is JDSU 6000.
6 If you need to specify other settings for the test, select the appropriate tab;
otherwise, press Results to return to the Main screen.
The interface settings are specified.
Specifying Ethernet frame
settings
Things to consider
Before you transmit traffic, you can specify the frame characteristics of the
traffic, such as the frame type (DIX, 802.3), control frame type (CDP, VTP, STP,
or RSTP), encapsulation (VLAN, Q-in-Q, VPLS, or MPLS), and payload
(Acterna test frames or BER patterns).
Consider the following before specifying the settings:
– CDP, VTP, STP, or RSTP headers. When configuring traffic with these
headers, you can optionally specify EtherType settings; LLC, SNAP
settings for 802.3 traffic are assigned automatically.
– Simulating traffic from a number of sources. If you would like to transmit
traffic carrying a variety of source MAC addresses to simulate traffic from a
number of sources, you can specify a beginning MAC address (or use the
factory-assigned MAC address), and then indicate that the unit should
automatically increment the address carried in each frame for a specific
number of frames.
– ARP mode. If you are transmitting layer 3 traffic, you can enable ARP
mode to determine the layer 2 destination MAC address of the destination
or gateway router automatically, or you can disable ARP mode and then
manually specify the destination MAC address. You can also indicate that
the instrument should only ARP to devices on the same VLAN specified
for transmitted traffic.
You can also assign a user-defined source MAC address to your instrument to determine whether network problems originate with a particular
address for an Ethernet device.
– ATP payloads carrying BERT patterns. Even when running software
version 8.x, version 1 Transport Modules will not support ATP payloads
carrying BERT patterns. Version 2 and Version 3 Transport Modules do
support the payloads.
40G/100G High Speed Transport Modules do not support ATP payload
carrying BERT patterns. They only support ATP->Fill Byte.
– Changing BERT patterns or payload type. In order for a BERT analysis to
be reliable, the test configuration must not change for the entire duration of
Ethernet, IP, TCP/UDP, Fibre Chan., VoIP, and Video Testing Manual
45
Chapter 4 Ethernet and IP Testing
Layer 2 testing
the test. Changing any part of the configuration, including the pattern or
source of the frames being analyzed (including changes in loopback) may
result in momentary BERT bit errors and a pattern sync loss detected by
the receiver after the traffic resumes.
If you do experience bit errors and sync losses after changing the test
configuration (including initiating loop up) and starting traffic, press the
Restart soft key to clear the initial burst of errors. If you no longer make
configuration changes, you can stop and start traffic without experiencing
extraneous bit errors or sync losses. If you continue to see BERT bit errors
after performing a test restart, this indicates a problem with the circuit
under test.
ATP Fill Pattern can be used if you do not wish to analyze BERT data.
– Byte sequence. The MSAM and Transport Module transmit the bytes in
user defined patterns from left to right; the FST-2802 transmits the bytes in
user defined patterns right to left. For example, a user defined hexadecimal pattern of 12345678 populates the frame as: 12345678.Using the
same hexadecimal pattern, the FST-2802 would populate the frame as
78563412. Consider this when testing using the FST-2802.
Specifying the settings
To specify Ethernet frame settings
1 If you haven’t already done so, use the Test Menu to select the test application for the interface you are testing. Refer to Table 6 on page 25
through Table 7 on page 25 for a list of layer 2 and layer 3 applications.
Table 15 on page 148 lists layer 4 applications.
2 Select the Setup soft key, and then select the Ethernet tab.
3 In Encapsulation, select one of the following:
– None. If you do not want to encapsulate transmitted frames, select
None.
– VLAN. If you want to transmit VLAN tagged frames, select VLAN, and
then refer to “Configuring VLAN tagged traffic” on page 50.
– Q-in-Q. If you want to transmit VLAN stacked (Q-in-Q) frames, select
Q-in-Q, and then refer to “Configuring Q-in-Q traffic” on page 50.
– Stacked VLAN. If you want to transmit stacked VLAN frames, select
Stacked VLAN, and then refer to “Configuring stacked VLAN traffic” on
page 50.
– VPLS. If you are testing on a VPLS network, and you want to transmit
traffic with a VPLS header, select VPLS, and then refer to “Configuring
VPLS traffic” on page 51.
When you select VPLS encapsulation, the Frame Type label changes to
SP Frame Type, and the L2 Transparency setting disappears.
NOTE: If you selected a Terminate application, and you want to filter
received traffic using VPLS criteria, you must select VPLS encapsulation
for transmitted traffic.
46
Ethernet, IP, TCP/UDP, Fibre Chan., VoIP, and Video Testing Manual
Chapter 4 Ethernet and IP Testing
Layer 2 testing
4 In Test Mode, specify the category of testing being done:
– Traffic. Standard mode that transmits unicast frames that satisfy the
receiving unit’s filter criteria.
– J-Proof. For verifying layer 2 transparency requiring loopback of all
test frames including control frames and frames carrying a broadcast or
multicast address.
– LBM Traffic. For Loopback Message/Loopback Reply (LBM/LBR)
frame analysis where the far-end unit (any equipment that responds to
LBM messages) loops back any packet containing the LBM message.
NOTE:
If the LBM/LBR testing mode is required in RFC 2544 testing, it must be
configured prior to initializing the RFC 2544 application.
NOTE:
LBM/LBR testing mode is not valid for any automatic scripting application
other than RFC 2544.
5 In Frame Type, specify the type of frame you are transmitting (DIX, or
802.3).
6 If you are verifying layer 2 transparency, do the following:
a Turn L2 Transparency On.
b In Control Frame Type, select the frame type.
NOTE:
These settings are not applicable when testing 10 GigE WAN circuits.
7 If you selected a layer 2 application, in Frame Size (Bytes), select one of
the seven IEEE recommended frame lengths, Random, EMIX or enter a
specific Jumbo, Undersized, or User Defined frame length. (If the payload
is something other than Acterna with BERT payload, Undersized is available.)
If you selected Random or EMIX, use the Configure button to specify
user-defined random frame sizes, including Jumbo, or select Reset to
transmit frames of randomly generated sizes based on the seven RFC
2544 frame length recommendations. EMIX also adds the EMIX Cycle
Length field that controls how many frame entries are sent, in order, before
cycling back to the first frame entry and repeating. To define the number of
frame entries, enter a number between 1 and 8.
Figure 12 Configure Random Frame Size
Ethernet, IP, TCP/UDP, Fibre Chan., VoIP, and Video Testing Manual
47
Chapter 4 Ethernet and IP Testing
Layer 2 testing
Jumbo frames are not supported for 802.3 traffic per the 802.3 specification.
8 If you are configuring layer 2 traffic, use the graphical display of a frame to
specify the following:
Frame Label
Setting
Value
DA
Destination Type
Select the type corresponding to the
Destination Address that will be
inserted in the transmit frames:
– Unicast.
If you select Unicast, the least significant bit of the leftmost byte in
the MAC address is forced to 0.
– Multicast.
If you select Multicast, the least
significant bit of the leftmost byte
in the MAC address is forced to 1.
– Broadcast
If you select Broadcast, the MAC
address is automatically
FFFFFFFFFFFF.
Destination MAC
If you specified Unicast or Multicast as
the destination type, enter the destination address using a 6 byte hexadecimal format.
Loop Type
Select one of the following:
– Unicast. The unit will issue a unicast message and loop-up the
device with the Destination MAC
address that you specified.
– Broadcast. The unit will issue a
broadcast hello message, and will
then send a unicast loop-up to the
first device on the circuit that
responds to the hello.
Source Type
Select Factory Default or
User Defined.
User MAC
If you specified User Defined, enter
the unicast source MAC address
using a 6 byte hexadecimal format.
Auto Increment
MAC
If you would like the unit to automatically increment the MAC address carried in each frame by one, select Yes.
# MACs in
Sequence
If you indicated that you would like the
unit to increment the MAC addresses,
specify the number of MACs in the
sequence. The addresses will be
assigned in succession, and will
repeat after the number specified for
the sequence is complete.
SA
48
Ethernet, IP, TCP/UDP, Fibre Chan., VoIP, and Video Testing Manual
Chapter 4 Ethernet and IP Testing
Layer 2 testing
9 Select DATA, and then specify the Tx Payload:
NOTE: You must select an Acterna payload to measure round trip delay,
count lost packets, and measure jitter.
a Acterna. To transmit frames that contain a sequence number and time
stamp so that lost frames, round trip delay, and jitter can be calculated,
select Acterna.
To configure the Acterna payload, set the following:
– Acterna Payload Ver. - Acterna Test Protocol (ATP) Version 2 and
Version 3 handle time resolution differently, so ATPv3 provides higher
resolution than ATPv2 for more precise RTD and packet jitter results.
Consult Table 12 and select the version that is compatible with your
equipment. Incompatible settings will produce inaccurate RTD and
packet jitter results.
Table 12 ATP version compatibility
ATP
version
version 2
MSAMv1
MSAMv2
Transport
Module
√
√
√
version 3
40G/100G
Transport
Module
ONT
√
√
√
– Acterna Fill Byte - this may be filled with any hexadecimal byte of your
choice.
– Delay Setup - if you are measuring round trip delay on a 10 Gigabit,
40 Gigabit or 100 Gigabit circuit, in RTD Setup, indicate whether you
want to measure delay with a high degree of precision, or a low degree
of precision. In most instances, you should select High Precision Low Delay.
For the 40/100G Transport Module:
High precision ATPv3 can support distances up to 37,000km (18,500km
each direction round-trip). For longer distances, use Low precision
ATPv3.
High precision ATPv2 can support distances up to 7,700km (3,850km
each direction round-trip). For longer distances, use Low precision
ATPv2.
For the MSAM/Transport Module:
High precision ATPv2 can support distances up to 5,800km one-way
(2,900km each direction round-trip). For longer distances, use Low
precision ATPv2.
b BERT. To transmit frames with payloads filled with the BERT pattern
you specify, select BERT, and then select a pattern.
– Depending on the equipment being used, various pseudo-random and
Fixed patterns are available. The pseudo-random patterns continue
from one frame into the next. The fixed patterns restart each frame,
such that the frame will always start with the beginning of the pattern.
– If User Defined is an option and selected as the BERT Pattern, in the
User Pattern field, specify the 32 bit fixed pattern that will be repeated
in the payload.
c Optic Latency Factor This setting provides a means to compensate
for significant intrinsic delays, especially when using certain types of
pluggable optics affecting Frame Delay (latency) measurement results.
Ethernet, IP, TCP/UDP, Fibre Chan., VoIP, and Video Testing Manual
49
Chapter 4 Ethernet and IP Testing
Layer 2 testing
In particular, if using the 40G/100G Transport Module, 100G LR4 CFP
optics equipped with gearbox functionality have been shown to introduce delays in the range of 70 to 170 nanoseconds. Should this intrinsic
delay be deemed significant, the Optic Latency factor allows compensation by specifying a value between 0 and 100 microseconds, with nanosecond granularity. This factor will be subtracted from latency
calculations.
To specify the Optic Latency Factor, do the following:
– Run an RTD test with a very short fiber self-loop.
– Enter the returned RTD value in the Optic Latency Factor field on the
Setup page.
10 If you need to specify other settings for the test, select the appropriate tab;
otherwise, press Results to return to the Main screen.
The frame settings for transmitted traffic are specified.
Configuring VLAN tagged traffic
To configure VLAN tagged traffic
1 After selecting VLAN as your encapsulation, on the graphic of the frame,
select VLAN
2 Enter the VLAN ID transmitted in the VLAN ID field in a decimal format
ranging from 0 to 4095.
3 In User Priority, select the priority (0 to 7) from the drop-down menu.
4 Do one of the following:
– If you are configuring traffic for a layer 2 application, return to “Specifying Ethernet frame settings”.
– If you are configuring traffic for a layer 3 application, return to “Specifying transmitted IPv4 packet settings”.
VLAN settings are specified.
Configuring Q-in-Q traffic
To configure Q-in-Q traffic
1 After selecting Q-in-Q as your encapsulation, on the graphic of the frame,
select SVLAN, and then specify the SVLAN ID, SVLAN User Priority, DEI
Bit, and SVLAN TPID for the service provider. You can now specify a User
Defined TPID if you choose to.
2 Select CVLAN, and then specify the VLAN ID and User Priority for the
customer’s traffic.
3 Return to “Specifying Ethernet frame settings” for details on specifying the
remaining settings.
Q-in-Q settings are specified.
Configuring stacked VLAN traffic
To configure stacked VLAN traffic
1 After selecting Stacked VLAN as your encapsulation, on the graphic of
the frame, select VLAN Stack, and then specify the stack depth (number of
VLANs).
2 For each VLAN, specify the SVLAN ID, SVLAN User Priority, DEI Bit, and
SVLAN TPID for the service provider. You can now specify a User Defined
TPID if you choose to.
50
Ethernet, IP, TCP/UDP, Fibre Chan., VoIP, and Video Testing Manual
Chapter 4 Ethernet and IP Testing
Layer 2 testing
3 Select CVLAN, and then specify the VLAN ID and User Priority for the
customer’s traffic.
4 Return to “Specifying Ethernet frame settings” for details on specifying the
remaining settings.
Stacked VLAN settings are specified.
Configuring VPLS traffic
To configure VPLS traffic
1 After selecting VPLS as your encapsulation, under Configure outgoing
frames, select Tunnel Label, and then specify the Tunnel ID (the label the
network will use to route the traffic), the Tunnel Priority, and the Tunnel
TTL value.
NOTE: VPLS settings are only available when configuring layer 2 test
applications.
2 To specify a virtual circuit (VC) label for the transmitted traffic, select VC
Label, and then specify the VC ID (the label the network will use to route
the traffic on the channel to the appropriate interface), the VC Priority, and
the VC TTL value.
3 To specify the customer destination address, source address, type, and
payload, select Data, and then specify each of the settings.
4 Based on your settings, the unit automatically calculates and displays the
service provider’s overall frame size in the Calc. SP Frame Size field.
Return to step 8 on page 48 of “Specifying Ethernet frame settings” for
details on specifying the remaining settings.
VPLS settings are specified.
Configuring LBM Traffic
To configure LBM Traffic
1 After selecting LBM Traffic as the Test Mode (see step 4 in “Specifying the
settings” on page 46), on the frame graphic, select LBM.
2 Specify the Maintenance Domain Level to which the transmitting unit
belongs. If desired, also select the Enable Sender TLV checkbox to
include the unit identifier (defined on the Network Visibility tab of the Interface setup page) in the header data.
LBM settings are specified.
Specifying Ethernet filter
settings
Before transmitting traffic, you can specify settings that indicate the expected
received payload and determine which frames or packets will pass through the
filter and be counted in the test result categories for filtered traffic. For example,
you can set up the filter to observe results for all traffic sent to a specific destination address. The filter settings may also impact other results.
NOTE:
During layer 2 BER testing, incoming frames must pass the filter to be analyzed for a BERT pattern. Local loopback is also only performed on frames
that pass the filter. Use the filter to analyze BERT frames when non-test
frames are present, such as spanning tree frames.
Ethernet, IP, TCP/UDP, Fibre Chan., VoIP, and Video Testing Manual
51
Chapter 4 Ethernet and IP Testing
Layer 2 testing
If you are transmitting Q-in-Q, VPLS, or MPLS encapsulated traffic, refer to:
– “Filtering traffic using Q-in-Q criteria” on page 54
– “Filtering traffic using VPLS criteria” on page 56
– “Filtering traffic using MPLS criteria” on page 57
To specify Ethernet filter settings
1 If you haven’t already done so, use the Test Menu to select the test application for the interface you are testing. Refer to Table 6 on page 25
through Table 7 on page 25 for a list of layer 2 and layer 3 applications.
Table 15 on page 148 lists layer 4 applications.
2 Select the Setup soft key, and then select the Filters tab. By default, a
summary of all applicable filter settings appear (Ethernet, IP, and TCP/
UDP).
3 In the panel on the left side of the tab, select Basic, then set the Filter
Mode to Detailed.
4 To specify layer 2 filter settings, in the panel on the left side of the tab,
select Ethernet, then specify the following:
a If you want to filter traffic based on the type of encapsulation used,
specify the following:
52
Setting
Value
Encapsulation
Select one of the following:
– None. The instrument will analyze only unencapsulated traffic.
– VLAN. The instrument will analyze only
VLAN encapsulated traffic for the parameters
you specify.
– Q-in-Q. The instrument will analyze only
Q-in-Q encapsulated traffic for the parameters you specify. See “Filtering traffic using
Q-in-Q criteria” on page 54.
– Stacked VLAN (layer 2 applications only).
The instrument will analyze only stacked
VLAN encapsulated traffic for the parameters
you specify. See “Filtering traffic using
stacked VLAN criteria” on page 55.
– VPLS (layer 2 applications only). The instrument will analyze only VPLS encapsulated
traffic for the parameters you specify. See
“Filtering traffic using VPLS criteria” on
page 56.
– MPLS (layer 3 applications only). The instrument will analyze only VPLS encapsulated
traffic for the parameters you specify. See
“Filtering traffic using MPLS criteria” on
page 57.
– Don’t Care. The instrument will analyze traffic satisfying all other filter criteria regardless
of encapsulation.
VLAN
If you specified VLAN as the encapsulation type,
on the graphic display of the frame, select VLAN,
and then specify the VLAN ID carried in the filtered traffic.
Ethernet, IP, TCP/UDP, Fibre Chan., VoIP, and Video Testing Manual
Chapter 4 Ethernet and IP Testing
Layer 2 testing
Setting
Value
User Priority
If you specified VLAN as the encapsulation type,
and you want to filter for traffic with a specific
user priority, specify the priority, or select
Don’t Care.
b In Frame Type, specify one of the following:
Frame Type
Description
DIX
To analyze DIX frames only, select DIX.
EtherType
If you specified DIX as the frame type, specify the
Ethertype by selecting the Type field on the graphic
of the frame. If you do not specify the EtherType,
the module will filter the traffic for DIX frames with
the currently specified EtherType value.
802.3
To analyze 802.3 frames only, select 802.3.
Data Length (bytes)
If you specified 802.3 as the frame type, specify the
data length by selecting the Length field on the
graphic of the frame. If you do not specify the
length, the module will filter the traffic for 802.3
frames with the currently specified length.
Don’t Care
If you want to analyze both DIX and 802.3 VLAN or
Q-in-Q encapsulated traffic, select Don’t Care.
You must specify a frame type if you are filtering
unencapsulated traffic.
c If you want the unit to filter for traffic carrying a particular destination
address, on the graphic of the frame, select DA, and then specify the
following:
Setting
Value
Destination Type
If you want to analyze traffic with a specific type of
destination address, select one of the following:
– Unicast
– Multicast
– Broadcast
Otherwise, select Don’t Care to analyze traffic
with any type of destination address.
Destination MAC
If you are filtering traffic for a specific Unicast or
Multicast destination address, specify the address
carried in the traffic that you want to analyze.
d If you want to filter traffic for a particular source address, on the graphic
of the frame, select SA, and then specify the following:
Setting
Value
Source Type
If you want to analyze traffic with a Unicast
source address, select Unicast; otherwise,
select Don’t Care to analyze traffic with any type
of destination address.
Ethernet, IP, TCP/UDP, Fibre Chan., VoIP, and Video Testing Manual
53
Chapter 4 Ethernet and IP Testing
Layer 2 testing
Setting
Value
Default MAC
If you are filtering traffic for a specific Unicast
source address, specify the address carried in
the traffic that you want to analyze.
5 To specify additional filter settings, see:
– “Filtering traffic using Q-in-Q criteria” on page 54
– “Filtering traffic using stacked VLAN criteria” on page 55
– “Filtering traffic using VPLS criteria” on page 56
– “Filtering traffic using MPLS criteria” on page 57
– “Filtering traffic using byte pattern criteria” on page 58
– “Filtering traffic using payload criteria” on page 59
6 If you need to specify other settings for the test, select the appropriate tab;
otherwise, press Results to return to the Main screen.
The Ethernet filter settings are specified.
Filtering traffic using Q-in-Q criteria
If your instrument is configured to transmit Q-in-Q encapsulated traffic, you can
filter received traffic using Q-in-Q criteria.
To filter traffic using Q-in-Q criteria
1 If you haven’t already done so, use the Test Menu to select the layer 2 or
layer 3 test application for the interface you are testing. Refer to Table 6
on page 25 through Table 7 on page 25 for lists of applications.
2 Select the Setup soft key, and then select the Ethernet tab. Verify that
Q-in-Q is specified as the encapsulation.
3 Select the Filters tab. In the panel on the left side of the tab, select
Ethernet, then specify the following:
a On the graphic of the frame, select SVLAN, and then specify the
following:
54
Setting
Value
SVLAN ID
Specify the SVLAN ID carried in the filtered traffic.
SVLAN User Priority
If you want to filter traffic for a specific user priority, specify the priority; otherwise, select
Don’t Care.
SVLAN DEI Bit
If you want to filter traffic for a specific DEI Bit,
specify the bit value; otherwise, select
Don’t Care.
SVLAN TPID (hex)
Specify the TPID carried in the filtered traffic. If
you are transmitting traffic with a user defined
TPID, your instrument will automatically use the
TPID that you specified in the User SVLAN TPID
(hex) field.
NOTE: If you want to filter on a user-defined
TPID, you must also enter that TPID on the RX
Payload/TPID setup page.
Ethernet, IP, TCP/UDP, Fibre Chan., VoIP, and Video Testing Manual
Chapter 4 Ethernet and IP Testing
Layer 2 testing
b On the graphic of the frame, select CVLAN, and then specify the
following:
Setting
Value
Specify VLAN ID
If you specified Q-in-Q as the encapsulation type,
and you want to filter traffic for a specific CVLAN,
select Yes; otherwise, select Don’t Care.
VLAN ID
If you specified Q-in-Q as the encapsulation type,
and you specified indicated that you want to filter
traffic for a particular CVLAN, specify the VLAN
ID carried in the filtered traffic.
User Priority
If you specified Q-in-Q as the encapsulation type,
and you specified indicated that you want to filter
traffic for a particular CVLAN, specify the User
Priority carried in the filtered traffic.
4 If you want to analyze/detect frames carrying User Defined SVLAN TPID
as Q-in-Q traffic, you have to specify the expected User Defined TPID
value(s) on the Filters->Rx->TPID page. The TPID values on this page are
used to recognize Q-in-Q traffic with User Defined TPID. If you want to
analyze/detect Q-in-Q traffic carrying the same TPID that you specified for
transmitted traffic, check the box for Use Tx User SVLAN TPID.
5 If you need to specify other settings for the test, select the appropriate tab;
otherwise, press Results to return to the Main screen.
The Q-in-Q filter settings are specified.
Filtering traffic using stacked VLAN
criteria
If your instrument is configured to transmit stacked VLAN encapsulated traffic,
you can filter received traffic using stacked VLAN criteria.
To filter traffic using stacked VLAN criteria
1 If you haven’t already done so, use the Test Menu to select the layer 2 test
application for the interface you are testing. Refer to Table 6 on page 25
for lists of applications.
2 Select the Setup soft key, and then select the Ethernet tab. Verify that
Stacked VLAN is specified as the encapsulation.
3 Select the Filters tab. In the panel on the left side of the tab, select
Ethernet, then specify the following:
a On the graphic of the frame, select SVLAN, and then specify the
following:
Setting
Value
SVLAN ID
Specify the SVLAN ID carried in the filtered traffic.
SVLAN User Priority
If you want to filter traffic for a specific user priority,
specify the priority; otherwise, select Don’t Care.
SVLAN DEI Bit
If you want to filter traffic for a specific DEI Bit,
specify the bit value; otherwise, select
Don’t Care.
Ethernet, IP, TCP/UDP, Fibre Chan., VoIP, and Video Testing Manual
55
Chapter 4 Ethernet and IP Testing
Layer 2 testing
Setting
Value
SVLAN TPID (hex)
Specify the TPID carried in the filtered traffic. If
you are transmitting traffic with a user defined
TPID, your instrument will automatically use the
TPID that you specified in the User SVLAN TPID
(hex) field.
b On the graphic of the frame, select CVLAN, and then specify the
following:
Setting
Value
Specify VLAN ID
If you specified stacked VLAN as the encapsulation type, and you want to filter traffic for a specific
CVLAN, select Yes; otherwise, select Don’t Care.
VLAN ID
If you specified stacked VLAN as the encapsulation type, and you specified indicated that you
want to filter traffic for a particular CVLAN, specify
the VLAN ID carried in the filtered traffic.
User Priority
If you specified stacked VLAN as the encapsulation type, and you specified indicated that you
want to filter traffic for a particular CVLAN, specify
the User Priority carried in the filtered traffic.
4 If you want to analyze/detect frames carrying User Defined SVLAN TPID
as Stacked VLAN traffic, you have to specify the expected User Defined
TPID value(s) on the Filters->Rx->TPID page. The TPID values on this
page are used to recognize Stacked VLAN traffic with User Defined TPID.
If you want to analyze/detect Stacked VLAN traffic carrying the same TPID
that you specified for transmitted traffic, check the box for Use Tx User
SVLAN TPID.
5 If you need to specify other settings for the test, select the appropriate tab;
otherwise, press Results to return to the Main screen.
The stacked VLAN filter settings are specified.
Filtering traffic using VPLS criteria
If your unit is configured to transmit VPLS encapsulated traffic, you can filter
received traffic using VPLS criteria.
To filter traffic using VPLS header criteria
1 If you haven’t already done so, use the Test Menu to select the layer 2 test
application for the interface you are testing. Refer to Table 6 on page 25
through Table 7 on page 25 for lists of layer 2 applications.
2 Select the Setup soft key, and then select the Ethernet tab. Verify that
VPLS is specified as the encapsulation.
3 Select the Filters tab. In the panel on the left side of the tab, select
Ethernet, then specify the following:
56
Ethernet, IP, TCP/UDP, Fibre Chan., VoIP, and Video Testing Manual
Chapter 4 Ethernet and IP Testing
Layer 2 testing
a On the graphic of the frame, select Tunnel Label, and then specify the
following:
Setting
Value
Tunnel Label
If you want to filter received traffic based on the
tunnel label, set the Tunnel Label filter to Yes;
otherwise, select Don’t Care.
Tunnel Label
If you indicated that you want to filter traffic for a
specific tunnel, enter the label.
Tunnel Priority
If you want to filter received traffic based on the
tunnel priority, set the Tunnel ID Filter to Yes;
otherwise, select Don’t Care.
Tunnel Priority
If you indicated that you want to filter traffic for a
specific tunnel, select the priority number.
b If you want to filter received traffic using virtual circuit criteria, select VC
Label, and then specify the following:
Setting
Value
VC Label
If you want to filter received traffic based on the
tunnel ID, set the VC Label to Yes; otherwise,
select Don’t Care.
VC Label
If you indicated that you want to filter traffic for a
specific label, enter the label.
VC Priority
If you want to filter received traffic based on the
virtual channel priority, set the priority filter to
Yes; otherwise, select Don’t Care.
VC Priority
If you indicated that you want to filter traffic for a
specific virtual channel priority, select the priority
number.
4 Return to “Specifying Ethernet filter settings” to verify or specify additional
filter settings.
VPLS filter criteria is specified.
Filtering traffic using MPLS criteria
To filter traffic using MPLS header criteria
1 If you haven’t already done so, use the Test Menu to select the test application for the interface you are testing. Refer to Table 6 on page 25
through Table 7 on page 25 for lists of layer 3 applications.
2 Select the Setup soft key, and then select the Ethernet tab. Verify that the
encapsulation is set to MPLS.
3 Select the Filters tab. In the panel on the left side of the tab, select
Ethernet, then specify the following:
a Above the graphic of the frame, set the MPLS Type Filter to Enable.
b In EtherType, select MPLS Unicast or MPLS Multicast.
Ethernet, IP, TCP/UDP, Fibre Chan., VoIP, and Video Testing Manual
57
Chapter 4 Ethernet and IP Testing
Layer 2 testing
c On the graphic of the frame, select MPLS Label 1, and then specify the
following:
Setting
Value
MPLS1 Label
If you want to filter received traffic based on the
label, set the filter to Yes; otherwise, select
Don’t Care.
MPLS1 Label
If you indicated that you want to filter traffic for a
specific label, enter the label.
MPLS1 Priority
If you want to filter received traffic based on the
priority, set the filter to Yes; otherwise, select
Don’t Care.
MPLS1 Priority
If you indicated that you want to filter traffic for a
specific priority, select the priority number.
4 If you want to specify additional criteria for MPLS2, on the graphic of the
frame, select MPLS Label 2, then repeat step 3.
5 Return to “Specifying Ethernet filter settings” to verify or specify additional
filter settings.
MPLS filter criteria is specified.
Filtering traffic using byte pattern
criteria
If you want to do so, you can specify criteria to filter based on the byte pattern.
To filter traffic using byte pattern criteria
1 If you haven’t already done so, use the Test Menu to select the layer 2 test
application for the interface you are testing. Refer to Table 6 on page 25
through Table 7 on page 25 for lists of layer 2 applications.
2 Select the Capture tab, and then set Capture to Enable and set Use
Filters as to Filter.
3 Select the Filters tab, and then specify the following:
a In the panel on the left side of the tab, select Summary, and then select
Clear All Filters to clear any previous filter settings.
b In the panel on the left side of the tab, select Byte Pattern, and then
set Use Byte Pattern as to Filter.
Figure 13 explains the different filter and trigger modes.(You can find
this table by clicking the ? next to Use Byte Pattern as).
Figure 13 Filter and trigger modes
58
Ethernet, IP, TCP/UDP, Fibre Chan., VoIP, and Video Testing Manual
Chapter 4 Ethernet and IP Testing
Layer 2 testing
c Specify the following:
Filtering traffic using payload
criteria
Setting
Value
Match Method
Select how to match the pattern: Fixed offset
(match the pattern at the specified Pattern Offset) or Sliding Window (match the pattern anywhere in the header).
Byte Pattern
In the graphic of the Byte Pattern, click on the
individual bit and set the hex pattern and the
mask. The mask specifies whether to match both
bits (FF) one bit (0F or F0), or don’t care (00).
You can filter traffic using payload criteria, or you can turn payload analysis off
entirely.
To specify payload filter settings
1 In the panel on the left side of the tab, select Rx Payload, then specify the
following:
Setting
Value
Payload Analysis
Specify one of the following:
– Off. If you want the module to monitor and analyze live Ethernet traffic by suppressing lost
frames (LF) or BERT errors in their associated
result counts and as triggers for LEDs during payload analysis, select Off.
– On. If you want to analyze traffic carrying a particular BERT pattern, select On.
Use Tx BERT settings
Specify one of the following:
– If you want the module to monitor and analyze
traffic carrying a different BERT pattern than the
one specified for transmitted traffic, un-check the
box.
– If you want to analyze traffic carrying the same
BERT pattern carried in transmitted traffic, check
the box.
Rx Payload
(Payload Analysis
On, and Use Tx
BERT settings unchecked)
Specify Acterna or BERT.
Rx BERT Pattern
Payload Analysis On,
and Use Tx BERT
settings un-checked)
If you unchecked Use Tx BERT settings, specify the
BERT pattern carried in the filtered traffic.
Payload filter criteria is specified.
Ethernet, IP, TCP/UDP, Fibre Chan., VoIP, and Video Testing Manual
59
Chapter 4 Ethernet and IP Testing
Layer 2 testing
Specifying traffic load
settings
Before transmitting traffic, you can specify the type of traffic load the unit will
transmit (Constant, Bursty, Ramp, or Flood). The settings vary depending on
the type of load. When configuring a load, you can specify the bandwidth of the
transmitted traffic in 0.001% increments.
NOTE:
If you configure the instrument to transmit a constant, bursty, or ramped
load of 100%, the module is designed to transmit slightly less than 100%
traffic (99.996% for 10 Gigabit Ethernet, 99.90% for 1 Gigabit Ethernet, and
99.90% for 10/100/1000 Ethernet) as a safeguard against overrunning network elements that can not support 100%. If you are certain the elements
can support true 100% traffic, configure your unit to transmit a flood load
(see “Transmitting a flooded load” on page 63).
Transmitting a constant load
With a constant load, the module transmits frames continuously with a fixed
bandwidth utilization. You can specify the load as a percent or a bit rate. See
Figure 14.
Bandwidth
(configurable
either as %
or in kbps or
Mbps)
Time
Figure 14 Constant traffic
When you setup a constant traffic load, if you are running a standard Ethernet
application, you can specify the bandwidth as a percentage of the line rate
(%BW) or at a specific bit rate. The bit rate can be specified in total kbps or
Mbps.
To configure the module to transmit a constant load of traffic
1 If you haven’t already done so, use the Test Menu to select the test application for the interface you are testing. Refer to Table 6 on page 25
through Table 7 on page 25 for a list of layer 2 and layer 3 applications.
Table 15 on page 148 lists layer 4 applications.
2 Select the Setup soft key, and then select the Traffic tab.
3 In Load Type, select Constant.
4 In Load Unit, select one of the following:
– Percent. If you select Percent, in Load %, enter the duty cycle as a
percentage.
– Bit Rate. If you select Bit Rate, in Load (Mbps) or Load (kbps) enter
the bit rate in Mbps or kbps.
5 If you need to specify other settings for the test, select the appropriate tab;
otherwise, press Results to return to the Main screen.
The module is configured to transmit a constant rate of traffic.
60
Ethernet, IP, TCP/UDP, Fibre Chan., VoIP, and Video Testing Manual
Chapter 4 Ethernet and IP Testing
Layer 2 testing
Transmitting a bursty load
With a bursty load, the module transmits frames at 100% bandwidth for a
specific time interval, followed by no frame transmissions during the specified
gap interval. See Figure 15.
Gap between bursts
100%
Bandwidth
Time
Figure 15 Bursty traffic
When you configure bursty traffic, if you are running a standard Ethernet application, you can specify the burst load as a percentage of the duty cycle, or by
specifying the burst and gap intervals in units of time, bytes and Information
Rate (IR). If you specify the burst load as a percentage of the duty cycle, and
then specify the number of frames per burst, the module automatically calculates the burst gap.
NOTE:
If you configure a bursty load of traffic with a low percentage of the line rate
(duty cycle) and a large number of frames per bust, it may appear that traffic
transmission has stopped periodically. This is because the calculated interval (gap) between bursts will be longer. A higher percentage of the line rate
and a lower number of frames per burst results in a shorter interval (gap).
To configure the module to transmit bursts of traffic
1 If you haven’t already done so, use the Test Menu to select the test application for the interface you are testing. Refer to Table 6 on page 25
through Table 7 on page 25 for a list of layer 2 and layer 3 applications.
Table 15 on page 148 lists layer 4 applications.
2 Select the Setup soft key, and then select the Traffic tab.
3 In Load Type, select Burst.
4 In Load Unit, select one of the following:
– Bytes and Information Rate. Proceed to step 5.
– Burst Time and Information Rate. Proceed to step 5.
– Bytes and Gap Time. Proceed to step 5.
– Burst Time and Gap Time. Proceed to step 5.
– Frames and Duty Cycle. Proceed to step 6.
5 If you selected any of the combinations of Time, Rates and Byte, the
following parameters may need to be set:
NOTE
Values may be automatically normalized (rounded to nearest appropriate
values) from values entered.
a Information Rate. Enter the average throughput rate in Mbps up to the
maximum rate of the interface (layer 2 only).
Ethernet, IP, TCP/UDP, Fibre Chan., VoIP, and Video Testing Manual
61
Chapter 4 Ethernet and IP Testing
Layer 2 testing
b Burst KBytes. Enter the number of Kbytes of data desired to be transmitted in each burst of traffic.
c Burst Time. Enter the amount of time that each burst of traffic should
be transmitted (will round to the nearest frame transmit time).
d Time Unit. Select unit for time entry - sec, msec, usec or nsec.
e Gap/Idle Time. Enter the amount of time between each burst. The
valid range for this setting adjusts depending on the Burst Time that is
entered, to ensure that the duty cycle is at least 1% in 0.001% intervals
(will round to the nearest 0.001%).
The following parameters may be displayed as a result of the above
selectionsf
Bit Rate (calculated). Bits/Time Unit from Burst average throughput
rate (will round kb down to the nearest frame size).
g Actual KBytes (calculated). Actual value of bytes/burst. Values above
the line rate can not be entered.
6 If you selected Frames and Duty Cycle as the load unit, set the following:
a Duty Cycle (%). Enter the percentage of the line rate (the duty cycle)
during which traffic will be transmitted in the burst, from 0.001 - 100%.
b Frames/Burst Time. Select a predefined value, or User-Defined, for
the number of frames that are to be included in each burst.
c User Burst Size. If User-Defined is specified for Frames/Burst, define
the User Burst size, 1- 65535 frames.
7 Specify the burst type for the traffic:
– Fixed. Sends a fixed number of bursts and then stops. If you select
Fixed, enter the number of bursts.
– Continuous. Sends bursts continuously.
8 If you need to specify other settings for the test, select the appropriate tab;
otherwise, press Results to return to the Main screen.
The module is configured to transmit bursts of traffic.
Transmitting a ramped load
With a ramped load, the module automatically increases the load by a
percentage of bandwidth (specified as the load step) at a particular time
interval (specified as the time step). The process is repeated, allowing you to
easily verify the maximum throughput of a link. See Figure 16.
Time step
Load step
Bandwidth
Time
Figure 16 Ramped traffic
62
Ethernet, IP, TCP/UDP, Fibre Chan., VoIP, and Video Testing Manual
Chapter 4 Ethernet and IP Testing
Layer 2 testing
You can also specify criteria to tell the module to stop ramping if an error (or
errors) occurs in a load step.
NOTE:
When configuring a ramped load of traffic for a particular stream (when running a multiple streams application), the triggers for stopping the ramp are
not available.
To configure the module to transmit a ramped load of traffic
1 If you haven’t already done so, use the Test Menu to select the test application for the interface you are testing. Refer to Table 6 on page 25
through Table 7 on page 25 for a list of layer 2 and layer 3 applications.
Table 15 on page 148 lists layer 4 applications.
2 Select the Setup soft key, and then select the Traffic tab.
3 In Load Type, select Ramp, and then specify the following settings:
a Time Step (sec). Enter the time step in seconds.
b Load Step (%). Enter the load step as a percentage of the total bandwidth.
4 Optional. If you want to stop the ramp from incrementing when certain
errors occur, under Stop Load Increments, specify the following:
– Errored Frames. If you want to stop incrementing the load if FCS
errored frames are detected, select Yes, and then enter the number of
errored frames that must be detected to stop the ramp.
– Dropped Frames. If you want to stop incrementing the load if dropped
frames are detected, select Yes, and then enter the number of dropped
frames that must be detected to stop the ramp.
NOTE:
Acterna frames carry a sequence number which the unit uses to determine
whether frames were dropped; therefore, you must configure your unit to
transmit an Acterna payload, turn payload analysis on, and loop the far-end
device back to the traffic originating unit.
– Pause Frames. If you want to stop incrementing the load if pause
frames are detected, select Yes, and then enter the number of pause
frames that must be detected to stop the ramp.
5 If you need to specify other settings for the test, select the appropriate tab;
otherwise, press Results to return to the Main screen.
The module is configured to transmit ramped traffic.
Transmitting a flooded load
With a flooded load, the module transmits traffic at 100% of the interface rate.
NOTE:
True 100% traffic transmission may overrun certain network elements if the
elements can not support the load. If you are certain the elements can support a 100% load, configure a flooded load of traffic; otherwise, configure a
constant load of traffic at 100% (see “Transmitting a constant load” on
page 60).
Ethernet, IP, TCP/UDP, Fibre Chan., VoIP, and Video Testing Manual
63
Chapter 4 Ethernet and IP Testing
Layer 2 testing
To configure the module to transmit a flooded load of traffic
1 If you haven’t already done so, use the Test Menu to select the test application for the interface you are testing. Refer to Table 6 on page 25
through Table 7 on page 25 for a list of layer 2 and layer 3 applications.
Table 15 on page 148 lists layer 4 applications.
2 Select the Setup soft key, and then select the Traffic tab.
3 In Load Type, select Flood.
4 If you need to specify other settings for the test, select the appropriate tab;
otherwise, press Results to return to the Main screen.
The module is configured to transmit a flooded load of traffic.
Transmitting and analyzing
layer 2 traffic
Before you transmit layer 2 traffic, you must specify:
– Interface settings (see “Specifying interface settings” on page 42).
– Frame characteristics for the transmitted traffic (see “Specifying Ethernet
frame settings” on page 45).
– Frame characteristics used to filter received traffic (see “Specifying
Ethernet filter settings” on page 51).
– Traffic load settings (see “Specifying traffic load settings” on page 60).
After you specify the layer 2 settings, you are ready to transmit and analyze the
layer 2 traffic.
NOTE: Layer 2 BERT testing
Layer 2 BERT patterns carried in a BERT payload are not compatible with
BERT patterns carried in an ATP payload. When testing using two instruments, be certain to configure both using the same payload type and BERT
pattern.
To transmit and analyze layer 2 traffic
1 If you haven’t already done so, use the Test Menu to select the test application for the interface you are testing. Refer to Table 6 on page 25
through Table 7 on page 25 for a list of layer 2 applications.
2 Select the Setup soft key, and then select the Interface tab to specify
settings that control the Ethernet interface (see “Specifying interface
settings” on page 42).
3 Select the Ethernet tab to specify settings that define the frame characteristics of the transmitted traffic (see “Specifying Ethernet frame settings” on
page 45).
4 Select the Ethernet Filter tab to specify settings that filter the received
traffic based on specified frame characteristics (see “Specifying Ethernet
filter settings” on page 51).
5 Select the Traffic tab to specify the type of load the unit will transmit (see
“Specifying traffic load settings” on page 60).
6 Press Results to return to the Main screen.
7 Connect the module to the circuit.
8 If you are testing an optical interface, select the Laser button.
9 Select Start Traffic to transmit traffic over the circuit.
64
Ethernet, IP, TCP/UDP, Fibre Chan., VoIP, and Video Testing Manual
Chapter 4 Ethernet and IP Testing
Layer 2 testing
10 Verify that the green Signal Present, Sync Acquired, and Link Active LEDs
are illuminated.
11 At a minimum, observe the summary, link statistics and counts, filter statistics and counts, error statistics, and layer 2 BERT statistics results.
You have analyzed layer 2 traffic.
Transmitting and analyzing
layer 2 patterns
Using the instrument, you can stress the jitter and noise characteristics of
1 Gigabit components and systems by transmitting continuous random test
patterns (CRPAT), continuous jitter test patterns (CJPAT), and the compliant
supply noise pattern (CSPAT). These patterns are always transmitted automatically when you turn the laser on.
NOTE:
You must run pattern tests using an end-to-end configuration at all times.
These patterns are designed to test physical layer networks. By definition,
these framed patterns populate the Ethernet header with invalid address
information; therefore, these frames will not traverse a layer 2, switched network.
For the same reason, if the pattern frames are transmitted to a far-end
Transport Module that is looped-up, the far-end Transport Module tries to
swap the source address and destination address for the pattern frames. As
a result, the patterns received by the near-end Transport Module are modified, and the results are not valid.
To transmit a pattern
1 If you haven’t already done so, use the Test Menu to select the
Layer 2 Patterns test application for the 1GigE Optical interface.
2 Select the Setup soft key. The Setup tab appears.
3 Select a pattern:
To…
Select…
Emulate a worst case scenario for deterministic jitter
by transmitting frames with a broad spectral content.
CRPAT
Stress the timing margins in the received eye by
exposing the data sampling circuits to large systematic phase jumps.
CJPAT
Emulate a worst case scenario for power supply noise
within network transceivers.
CSPAT
4 Press Results to return to the Main screen.
5 Connect the module to the circuit.
6 If you are testing an optical interface, select the Laser button.
7 Verify that the green SIGNAL LED is illuminated.
8 Select Start Pattern to transmit the pattern over the circuit.
9 At a minimum, observe the summary and pattern statistic test results.
You have transmitted layer 2 patterns.
Ethernet, IP, TCP/UDP, Fibre Chan., VoIP, and Video Testing Manual
65
Chapter 4 Ethernet and IP Testing
Layer 2 testing
Monitoring layer 2 traffic
Use the layer 2 traffic monitor application whenever you want to analyze the
received signal. You can also pass the signal bit-for-bit through to the unit’s
transmitter if you select Connect Rx to Tx. When you configure your test, you
can specify settings that indicate the expected received payload and determine
which frames will pass through the receive filter and be counted in the test
result categories for filtered layer 2 traffic. The settings may also impact other
results.
NOTE:
You must turn the laser on using the associated button to pass the signal
through the unit’s transmitter.
To monitor layer 2 traffic
1 Use the Test Menu to do one of the following:
– Select the layer 2 monitor test application for the interface you are
testing (refer to Table 6 on page 25 through Table 7 on page 25 for a
list of applications).
2 Select the Setup soft key, and then select the Ethernet Filter tab. Do one
of the following:
– If you are running a standard Ethernet test application, specify the filter
settings for the traffic you want to monitor (see “Specifying Ethernet
filter settings” on page 51).
– If you are monitoring VPLS encapsulated traffic, specify the VPLS filter
settings (see “Filtering traffic using VPLS criteria” on page 56).
3 Press Results to return to the Main screen.
4 Connect the module to the circuit.
5 If you are testing an optical interface, select the Laser button.
6 Verify that the green Signal Present, Sync Acquired, and Link Active LEDs
are illuminated.
7 Select Connect Rx to Tx (for line loopbacks).
8 At a minimum, observe the summary, link statistics and counts, filter statistics and counts, error statistics, and layer 2 BERT statistics results.
Layer 2 traffic is monitored.
Transmitting and analyzing
layer 2 MPLS-TP, T-MPLS or
MPLS traffic
About MPLS-TP
You can use the instrument to send and receive MPLS OAM messages or
generate Ethernet traffic on a specific pseudo-wire inside a specific tunnel and
analyze any MPLS-TP (ITU-T G.8113.1), T-MPLS (ITU-T G.8114),or MPLS
(ITU Y.1711) traffic present on the Ethernet link.
The differences between MPLS, T-MPLS OAM and MPLS-TP OAM are:
– MPLS and T-MPLS OAM uses the reserved Label 14 as the identifier and
MPLS-TP uses the label 13 together with Associated Channel Header
(ACH).
– T-MPLS and MPLS-TP can use Loop-Back Message and Loop-Back
Reply (LEBM/LBR) while MPLS must use Continuity Verification (CV).
66
Ethernet, IP, TCP/UDP, Fibre Chan., VoIP, and Video Testing Manual
Chapter 4 Ethernet and IP Testing
Layer 2 testing
However, MPLS, T-MPLS and MPLS-TP OAMs all support multiple layers:
section layer, tunnel/trunk layer or label switched path (LSP), and pseudo wire
(PW) layer or virtual circuit (VC).
MPLS-TP is a connection oriented packet-switched transport technology. The
main features of MPLS-TP are:
– Connection oriented
– Subset of MPLS (without IP functionality)
– Packet-based service support via point-to-point connection
– No dynamic control protocol
– Simplified data plane and forwarding
– End-to-end OAM
– Protection switching
MPLS-TP provides transport service using pseudo wire emulation edge-toedge (PWE3) technology.
Figure 17 summarizes the evolution of MPLS-TP from MPLS via T-MPLS.
Figure 17 MPLS-TP evolution
Transmitting and analyzing
MPLS-TP traffic
You can use the instrument to send and receive MPLS-TP OAM messages or
generate Ethernet traffic on a specific pseudo-wire inside a specific tunnel and
analyze any MPLS-TP traffic present on the Ethernet link.
To transmit and analyze L2 MPLS-TP traffic
1 If you haven’t already done so, use the Test Menu to select the L2 MPLSTP application for the interface you are testing. Refer to Table 8 on
page 25 for a list of applications.
2 Select the Setup soft key, and then select the Ethernet tab.
3 Specify the Service Provider Frame settings:
Encapsulation - None or VLAN
Frame Type - DIX or 802.3
Control Word - specify (ON/OFF) whether an optional control word
(fixed to all zeroes) is inserted before the payload.
Ethernet, IP, TCP/UDP, Fibre Chan., VoIP, and Video Testing Manual
67
Chapter 4 Ethernet and IP Testing
Layer 2 testing
For more information on the settings, see “Specifying Ethernet frame
settings” on page 45
4 If VLAN was the encapsulation method selected, select the VLAN field on
the image of the outgoing frame at the bottom of the page. Define the
VLANID and the User Pri(ority).
NOTE: Only one VLAN is supported.
5 Select the OAM tab, and then do the following:
a In the options list on the left side of the tab, select Common Header
and then specify the settings:
Setting
Description
Type
Specifies the type of OAM transport service to be used:
MPLS-TP, T-MPLS or MPLS.
Layer
Specifies the layer that OAM is operating on: PW, LSP, or
Section.
PW is only available if the Control Word field is set to ON
on the Ethernet setup tab.
Label
Indicates the OAM encoding type, in label 13 (GAL) or
label 14 (OAL).
ACH Channel
Type
Specifies the channel type field in the associated channel
header (ACH).
Only appears if the Label Type is label 13.
Traffic Class
Specifies the traffic class field in the generic associated
channel label (GAL).
Only appears if the Label Type is label 13 and if using the
Section or LSP layer.
TTL
Specifies the time to live (TTL) field.
If the Label Type is label 13, this only appears if using
Section or LSP layer. For label 14, it is always available.
Per the y.17tom specification, this setting is applicable
when LBM/LBR is enabled. If LBM/LBR is not enabled,
this field is fixed to 1, even if set to something else.
b In the options list on the left side of the tab, select CCM (except when
Y.1711(MPLS) was selected for type) and then specify the settings:
68
Setting
Description
Continuity Checking
Specifies whether to transmit/receive CCM
messages.
LOC threshold
Specifies the number of messages required to
reach the LOC threshold.
CCM Rate
Specifies the rate at which CCM frames are
transmitted and the rate at which they are
expected to be received.
MEG End Point ID
Specifies the local and peer MEG End Point ID.
Maintenance Domain Level
Specifies the Maintenance Domain Level.
Specify Domain ID
Indicates whether the Domain ID needs to be
specified.as part of the Maintenance Association ID.
Maintenance Association ID
Specifies the Maintenance Association.
Ethernet, IP, TCP/UDP, Fibre Chan., VoIP, and Video Testing Manual
Chapter 4 Ethernet and IP Testing
Layer 2 testing
c In the options list on the left side of the tab, select AIS (except when
Y.1711(MPLS) was selected for type), and then specify the settings:
Setting
Description
AIS State
Specifies whether to enable AIS.
Maintenance Domain Level
Specifies the Maintenance Domain Level.
AIS Rate
Specifies the rate at which AIS indications are
sent. It is fixed to 1 second if the Label type is
Label 14 (OAL).
d In the options list on the left side of the tab, select LBM/LBR (except
when Y.1711(MPLS) was selected for type) and then specify the
settings.
Setting
Description
LBM/LBR (ping)
Specifies whether to transmit/receive LBM/LBR
messages.
Maintenance Domain Level
Specifies the Maintenance Domain Level.
MEG End Point ID
Specifies the local and peer MEG End Point ID.
Maintenance Association ID
Specifies the Maintenance Association.
e In the options list on the left side of the tab, if the Common Header type
is set to Y.1711(MPLS), select CV/FFD to turn on and set the Connectivity Verification and Fast Forward Detection settings.
Setting
Description
CV/FFD
Specifies whether the Connectivity Verification
is activated
Type
Specifies the type of Connectivity Verification
to be employed: CV or FFD
LSP TTSI
LSR ID (IPv6)
LSP ID (Tunnel ID)
f
Specifies the sixteen-bit source ID of the LSR
(IPv6 only) for the LSP Trail Source Termination Identifier
Specifies the sixteen-bit source ID of the tunnel
containing the LSP Trail Source Termination
Identifier data.
Expected LSP TTSI
Same as above, for received signal
Frequency
Specifies the transmission frequency of the
FFD packet (FFD only).
In the options list on the left side of the tab, if the Common Header type
is set to Y.1711(MPLS), select BDI and /or FDI to turn on and set the
Backward Defect Indication and/or Forward Defect Indication settings.
The settings are identical for either BDI or FDI.
Setting
Description
BDI
Specifies whether the Backward Defect Indication is activated
Ethernet, IP, TCP/UDP, Fibre Chan., VoIP, and Video Testing Manual
69
Chapter 4 Ethernet and IP Testing
Layer 2 testing
Setting
Description
LSP TTSI
LSR ID (IPv6)
LSP ID (Tunnel ID)
Specifies the sixteen-bit source ID of the LSR
(IPv6 only) for the LSP Trail Source Termination Identifier
Specifies the sixteen-bit source ID of the tunnel
containing the LSP Trail Source Termination
Identifier data.
Defect Type
Specifies the type of defect indicated by the
BDI or FDI.
Defect Location
Specifies the 16-bit autonomous system number for the defect location.
6 Press Results to return to the Main screen.
7 Connect the module to the circuit.
8 If you are testing an optical interface, select the Laser button.
9 Verify that the green Signal Present and Link Active LEDs are illuminated.
10 Select Start Traffic to transmit traffic over the circuit.
11 Use the OAM action buttons to manually insert an AIS, RDI, or LBM (AIS
when AIS is enabled, RDI when CCM is enabled, or LBM when LBM is
enabled).
12 Observe the Ethernet Service OAM results.
You have analyzed MPLS-TP traffic.
NOTE:
If capturing and analyzing MPLS-TP data using Wireshark, please note the
following:
– If the transmitting unit’s destination MAC address contains a 6 in the first
four bits, Wireshark will interpret this as the fixed version field at the start
of an IPv6 packet and decode it as such.
– Wireshark does not support decoding of T-MPLS OAM PDUs and will
decode OAM PDUs according to ITU-T Y.1711 when it encounters
label 13 (OAL), which will show erroneous fields.
Using J-Proof to verify layer 2
transparency
You can use the instrument to verify that an Ethernet circuit can support a
variety of control protocols (such as CDP, VTP, STP, and RSTP), irrespective
of the underlying transport method.
NOTE:
It is not possible to run OWD at the same time as a J-Proof test.
70
Ethernet, IP, TCP/UDP, Fibre Chan., VoIP, and Video Testing Manual
Chapter 4 Ethernet and IP Testing
Layer 2 testing
If the Test Mode is set to J-Proof for your application, you must actively
transmit the test frames by pressing the Start Frame Sequence action button.
Your unit will not automatically transmit test frames in this mode, even if automatic traffic generation is enabled.
NOTE:
Legacy JDSU test instruments identify the J-Proof applications as Layer 2
or L2 Transparency tests throughout their user interfaces. They are compatible with the J-Proof applications.
Understanding transparent
loopbacks
When a JDSU Ethernet test instrument sends a standard loopup message, the
receiving test instrument only loops back unicast test frames that satisfy its
filter criteria. Pause frames, control frames, and broadcast or multicast frames
are not looped back.
When you verify layer 2 transparency, you need the receiving test instrument
to loopback all test frames, including control frames and frames carrying a
broadcast or multicast address. To do so, you must place the traffic originating
instrument into J-Proof (transparency) mode, and then specify the settings for
the outgoing loop-up frame. When the receiving instrument receives the transparent loop-up frame, it is automatically placed into transparent loopback
mode, and it returns all received test frames. You do not need to specify filter
settings on the receiving instrument.
When initiating a transparent loopback from the traffic originating instrument,
you can send the loop-up frame to a specific test instrument (by specifying the
appropriate unicast destination address), or you can send a broadcast loopup
frame to loop-up the first test instrument that replies within the broadcast
boundary.
When the test is completed, the far end instrument is automatically taken out
of loop up mode.
Configuring the traffic originating
instrument
Before verifying layer 2 transparency, you must place the traffic originating
instrument into J-Proof mode, specify the settings for the outgoing loop-up
frame, and configure the outgoing control frames.
To configure the traffic originating instrument
1 If you haven’t already done so, use the Test Menu to select the
Layer 2 Traffic test application for the interface you are testing. Refer to
Table 6 on page 25 for a list of layer 2 applications.
2 Select the Setup soft key, and then select the Interface tab to specify
settings that control the Ethernet interface (see “Specifying interface
settings” on page 42).
3 Select the Ethernet tab, and then do the following:
a In Test Mode, select J-Proof.
b Specify the remaining settings that define the characteristics of the
transmitted loopback frame (see “Specifying Ethernet frame settings”
on page 45). If you are looping up a specific test instrument, be certain
to specify a unicast destination address for the frame.
Ethernet, IP, TCP/UDP, Fibre Chan., VoIP, and Video Testing Manual
71
Chapter 4 Ethernet and IP Testing
Layer 2 testing
Bear in mind that the encapsulation settings for outgoing control frames
(as opposed to the loop-up frame) are specified on the J-Proof tab for each
type of control frame.
4 Select the J-Proof tab. By default, a single test frame appears in the frame
list. You can specify a name for the frame, the control protocol format,
encapsulation settings, the number of frame of this type to transmit (the
count), the frame rate, and the timeout period.
To modify the settings for the transmitted frame:
a If you want to name the frame, select the Test Frame setting to launch
a keypad, and then type a name using up to twenty characters. Select
OK to close the keypad.
b In Protocol, select the control protocol format for the frame.
c In Encap., select None, VLAN, or Q-in-Q. If you select VLAN or
Q-in-Q, be certain to do the following:
VLAN. Select the VLAN field on the image of the outgoing frame at the
bottom of the tab, and then specify the VLAN ID and User Priority for
the frame. If you want the PBit to increment for each transmitted frame,
select PBit Increment. For details on VLAN settings, refer to “Configuring VLAN tagged traffic” on page 50.
Q-in-Q. Select the SVLAN field on the image of the outgoing frame at
the bottom of the tab, and then specify the service provider’s SVLAN ID,
SVLAN User Priority, DEI Bit, and SVLAN TPID for the frame. If you
want the PBit to increment for each transmitted frame, select PBit Increment.
Select the CVLAN field, and then specify the customer VLAN ID and
User Priority for the frame. If you want the PBit to increment for each
transmitted frame, select PBit Increment. For details on Q-in-Q
settings, refer to “Configuring Q-in-Q traffic” on page 50.
d In Count, specify the number of frames you want to transmit.
e In Rate (fr/sec), enter the rate at which you want to transmit the
frames.
f
In Timeout (msec), enter the number of milliseconds the instrument
will wait to receive the looped back frame before stopping transmission
of frames.
5 If you want to transmit control frames for different protocols, do the
following for each protocol:
a Select the Add Frame soft key.
b Specify the settings listed in step 4 for each type of frame, or use the
Quick Config soft key populate the frame list with all types of control
frames, or frame types for a particular protocol family. You can also
assign common encapsulation settings to all of the frame types that
appear in the list using the Quick Config soft key (see “Using Quick
Config to configure test frames” on page 73).
6 Press Results to return to the Main screen.
The traffic originating instrument is configured for a layer 2 transparency test.
72
Ethernet, IP, TCP/UDP, Fibre Chan., VoIP, and Video Testing Manual
Chapter 4 Ethernet and IP Testing
Layer 2 testing
Using Quick Config to configure
test frames
You can quickly populate the Frames List with frame types for all available
protocols, or a particular family of protocols. When you do so, all current frame
settings will be overwritten, and the frame types generated by the instrument
will all share the same encapsulation settings.
After populating the list using the Quick Config soft key, you can then optionally
edit the settings for the generated frame types. For example, you can assign
different VLAN priorities to the frame types.
To quickly generate and configure test frames
1 If you haven’t already done so, use the Test Menu to select the
Layer 2 Traffic test application for the interface you are testing. Refer to
Table 6 on page 25 for a list of layer 2 applications.
2 Select the Setup soft key, and then select the Interface tab to specify
settings that control the Ethernet interface (see “Specifying interface
settings” on page 42).
3 Select the Ethernet tab, and then do the following:
a In Test Mode, select J-Proof.
b Specify the settings for the outgoing loop-up frame (see step 3 on
page 71 of “Configuring the traffic originating instrument”).
4 Select the J-Proof tab, and then select the Quick Config soft key.
The Quick Config dialog box appears.
5 Specify the following settings:
Setting
Value
Intensity
Select one of the following:
– Full. Select full to transmit 100 frames per protocol.
– Quick. Select Quick to transmit 10 frames per protocol.
Family
Select one of the following:
– All. Select All to transmit frames for every supported protocol.
– Spanning Tree. Select Spanning to transmit STP,
RSTP, and MSTP frames.
– Cisco. Select Cisco to transmit CDP, VTP, PagP,
UDLD, DTP, PVST-PVST+, ISL, and STP-ULFAST
frames.
– IEEE. Select IEEE to transmit GMRP, GVRP,
LACP, VLAN-BRDGSTP, and 802.1d frames.
Encapsulation
Select one of the following, and then specify the associated VLAN and, if applicable, SVLAN settings:
– None. Select None if you do not want to transmit
encapsulated frames.
– VLAN. Select VLAN to transmit VLAN-tagged
frames, then specify the associated settings. For
details, refer to step c on page 72.
– Q-in-Q. Select Q-in-Q to transmit Q-in-Q encapsulated frames, and then specify the associated customer and service provider settings. For details,
refer to step c on page 72.
Ethernet, IP, TCP/UDP, Fibre Chan., VoIP, and Video Testing Manual
73
Chapter 4 Ethernet and IP Testing
Layer 2 testing
6 Select OK to store the settings and populate the Frames List.
7 Optional. If you would like to change settings for one or more of the frame
types, do so.
The frame types are generated.
Verifying the far end filter settings
After you configure the traffic originating instrument, verify that the Encapsulation setting for the Ethernet filter is set to Don’t Care. This ensures that traffic
will be looped back.
Initiating the transparent loopback
After you configure the traffic originating instrument, and check the far end
instrument’s filter settings, you can initiate the transparent loopback.
To initiate the transparent loopback
1 If you are verifying transparency on an optical circuit, turn the Laser ON.
2 On the Main screen, select the Actions action panel, then select Loop
Up. The instrument sends the loop-up frame.
When the receiving instrument is placed in J-Proof transparent loopback
mode, a message appears stating that the remote transparent loop up was
successful. You are ready to transmit the test frames.
Starting the frame sequence
After turning the laser ON (if you are testing on an optical circuit), and placing
the second test instrument into transparent loopback mode, you can transmit
the test frames. The frames are transmitted sequentially in the sequence used
on the Frames List.
To transmit test frames
– On the Main screen, if you haven’t already done so, select the Actions
action panel, then select Start Frame Sequence. The instrument transmits the frames sequentially as they appear in the Frames List.
The test frames are transmitted.
Observing transparency results
After transmitting and looping back test frames, you can observe results associated with transparency testing in the J-Proof category.
To observe transparency results
– On the Main screen, set the result group to Ethernet, and the result category to J-Proof. Counts of transmitted and received frames, and the pass/
fail status appears for each protocol.
Transparency results are displayed. For detailed result descriptions, refer to “JProof (transparency) results” on page 356.
NOTE:
When your instrument is in Transparent test mode, Payload Analysis is
automatically turned OFF. If you return to Traffic mode, Payload Analysis is
turned back ON.
74
Ethernet, IP, TCP/UDP, Fibre Chan., VoIP, and Video Testing Manual
Chapter 4 Ethernet and IP Testing
Layer 3 testing
Layer 3 testing
Using the instrument, you can transmit, monitor, and analyze layer 3 IPv4 or
IPv6 traffic. Step-by-step instructions are provided in this section for the
following:
– “Specifying the data mode and link initialization settings” on page 75
– “Configuring MPLS traffic” on page 77
– “Specifying transmitted IPv4 packet settings” on page 80
– “Specifying IPv4 filter settings” on page 82
– “Specifying transmitted IPv6 packet settings” on page 83
– “Specifying IPv6 filter settings” on page 85
– “Transmitting and analyzing IP traffic” on page 86
– “Ping testing” on page 87
– “Running Traceroute” on page 89
– “Monitoring IP traffic” on page 90
NOTE: IPv4 applications
You must select an IPv4 application if you intend to do the following:
– Establish PPPoE sessions
– Transmit and analyze MPLS encapsulated traffic on electrical or optical
circuits.
NOTE: IPv6 applications
You can only run a single IPv6 application at a time. You can run other applications from other test ports (for example, a layer 2 Ethernet or layer 3 IPv4
application) while running one IPv6 application.
Specifying the data mode and
link initialization settings
Before transmitting layer 3 traffic, you must specify whether you are transmitting IPoE or PPPoE traffic (if you are testing on an electrical, 1 GigE optical, or
100 Mbps optical circuit), and provide the appropriate link initialization settings.
To specify the data mode and initialization settings
1 If you haven’t already done so, use the Test Menu to select the test application for the interface you are testing. Refer to Table 6 on page 25
through Table 7 on page 25 for a list of layer 3 applications. Table 15 on
page 148 lists layer 4 applications.
2 Select the Setup soft key, and then select the Ethernet tab.
Ethernet, IP, TCP/UDP, Fibre Chan., VoIP, and Video Testing Manual
75
Chapter 4 Ethernet and IP Testing
Layer 3 testing
3 In Encapsulation, select one of the following:
– None. If you do not want to encapsulate transmitted traffic, select
None.
– VLAN. If you want to transmit VLAN tagged frames, select VLAN, and
then refer to “Configuring VLAN tagged traffic” on page 50.
– Q-in-Q. If you want to transmit VLAN stacked (Q-in-Q) frames, select
Q-in-Q, and then refer to “Configuring Q-in-Q traffic” on page 50.
– MPLS. If you are testing on an MPLS network, and you want to
transmit traffic with a MPLS header, select MPLS, and then refer to
“Configuring MPLS traffic” on page 77.
NOTE: If you selected a Terminate application, and you want to filter
received traffic using MPLS criteria, you must select MPLS encapsulation for transmitted traffic.
4 In Data Mode, specify IPoE or PPoE.
5 If you want the unit to issue an ARP request to determine the destination
MAC address of the instrument’s link partner, in ARP mode, select
Enabled; otherwise, select Disabled, and then be certain to manually
specify the destination MAC address, (see “Specifying Ethernet frame
settings” on page 45).
If you enabled ARP, and you only want to respond to ARP requests from
devices on the same VLAN specified for transmitted traffic, select
Match VLAN ID(s).
NOTE: If you need your unit to respond to ARP requests from other
devices (for example, a second test instrument on the circuit), be certain to
enable ARP.
6 In Frame Type, specify DIX or 802.3.
7 In Length Type, indicate whether you want to specify the length as a frame
size or as a packet length.
– Frame Size. If you select Frame Size, select a pre-defined size, or
select User Defined or Jumbo, and then specify the size. The calculated packet length (in bytes) appears to the right of the field.
– Packet Length. If you select Packet Length, select a pre-defined
length, or select User Defined, Jumbo or EMIX and then specify the
length. The calculated frame size (in bytes) appears to the right of the
field.
If you selected Random or EMIX, use the Configure button to specify
user-defined random frame sizes, including Jumbo, or select Reset to
transmit frames of randomly generated sizes based on the seven RFC
2544 frame length recommendations. EMIX also adds the EMIX Cycle
Length field that controls how many frame entries are sent, in order,
before cycling back to the first frame entry and repeating. To define the
number of frame entries, enter a number between 1 and 8.
8 If you want to specify a source address for the traffic, select SA, and then
specify the following:
– Source MAC Address. Select Factory Default or User Defined.
– User MAC Address. If you specified User Defined, enter the source
MAC address using a 6 byte hexadecimal format.
9 Select the Filter tab, and then specify the Ethernet filter settings for the
destination type, source type, and encapsulation.
76
Ethernet, IP, TCP/UDP, Fibre Chan., VoIP, and Video Testing Manual
Chapter 4 Ethernet and IP Testing
Layer 3 testing
Configuring MPLS traffic
To configure MPLS traffic
1 After selecting MPLS as your encapsulation, do the following:
a In EtherType, select MPLS Unicast or MPLS Multicast.
b Under Configure outgoing frames, select MPLS1 Label, and then
specify the label the network will use to route the traffic, the Priority,
and the TTL value.
NOTE: MPLS settings are only available when configuring layer 3 test
applications.
2 Optional. If you want to configure a second MPLS label for your traffic, in
MPLS Label #, select 2, and then repeat step 1 for the second label.
NOTE: When a unit is in LLB mode, it always uses the labels specified for
the transmitted traffic; therefore:
– If your near-end module is in LLB mode and is configured to transmit
traffic with a second MPLS label, but the module's link partner is configured to transmit traffic with a single label, the out of sequence and lost
frames counts reported by the module's link partner may increment if
the incoming frame rate is too high.
– If your near-end module is in LLB mode, and is configured to transmit
traffic with a single MPLS label, but the module's link partner is configured to transmit traffic with more than one label, the near-end module’s
receive bandwidth utilization will exceed its transmit bandwidth utilization.
3 Based on your settings, the unit automatically calculates and displays the
frame size in the Calc. Frame Size field. Return to step 8 on page 48 of
“Specifying Ethernet frame settings” for details on specifying the remaining
settings.
MPLS settings are specified.
Specifying PPPoE settings
In addition to the settings you specify to establish an Ethernet link, when establishing a PPPoE session (available for compatible IPv4 Terminate applications
only), you also specify settings that allow you to log in to the PPPoE peer. The
settings indicate whether you want your unit to emulate a PPPoE client or
server, and provide the user name, password, and other information required
to establish the session.
To specify the PPPoE settings and establish a connection
1 If you haven’t already done so, use the Test Menu to select an IPv4 test
application in Terminate mode for the e10/100/1000 electrical interface.
2 Select the Setup soft key, and then select the Ethernet tab. Verify that the
Data Mode is set to PPPoE.
Ethernet, IP, TCP/UDP, Fibre Chan., VoIP, and Video Testing Manual
77
Chapter 4 Ethernet and IP Testing
Layer 3 testing
3 Go to the PPP setup tab, then specify the following settings. The Provider
Name, Password, and Service Name you specify for the instrument must
match those of its PPPoE peer:
Settings
Parameters
PPP Mode
–
–
78
Client. In most instances, the instrument should
emulate a PPPoE client. If you select Client
mode, you do not need to specify the Local IP,
Subnet Mask, or Remote IP settings on the IP
setup tab because they will be provided by a
PPPoE server.
Server. Select Server mode if the unit must
operate as a PPPoE server. For example, if the
unit is positioned before a BBRAR (Broadband
Remote Access Router), it must function as a
server. If you select Server mode, you must
specify the Local IP, Subnet Mask, or Remote
IP settings on the IP setup tab.
User Name
Enter a valid user name for the ISP (Internet Service Provider).
Password
Enter the password for the user name that you
specified. Remember passwords are often casesensitive.
Service Provider
If the ISP requires the provider’s domain name be
included with the User Name (for example, [email protected]), select this setting, and then
specify the provider name. An at sign (@) and the
provider name will automatically be appended to
the User Name that you specified, and will be carried in the packet.
Service Name
Select this setting if you want to specify a service
name. If you specify a service name, your unit will
only attempt to establish a PPPoE session with the
service you specify. The default service name is
“JDSU”.
Ethernet, IP, TCP/UDP, Fibre Chan., VoIP, and Video Testing Manual
Chapter 4 Ethernet and IP Testing
Layer 3 testing
4 Do one of the following:
– If the instrument is emulating a PPPoE client, proceed to step 5. The
unit will use a static IP address.
– If the instrument is emulating a PPPoE server, go to the IP setup tab,
and then specify the following settings:
Settings
Parameters
Local IP
Enter the source IP address for traffic generated by your unit. This address is used as the
remote IP address for the PPPoE client.
Subnet Mask
Enter the subnet mask.
Remote IP
Enter remote IP address for the instrument
server. This address is used as the local
(source) IP address on the client side of the
connection.
NOTE:
The instrument’s PPPoE server is a demo server and does not support full
server functionality.
5 If you need to specify other settings for the test, do so; otherwise, return to
the Main screen and do the following:
a Press the PPPoE Client Log-On or PPPoE Server Log-On Action
key.
The unit discovers the MAC address of the PPPoE peer, and then uses
the MAC address in combination with a session ID to uniquely identify
the session.
b Observe the messages and events associated with the PPPoE login
process. For a list of potential messages, see “PPPoE messages” on
page 80.
The PPPoE session is established. The instrument will continuously send PPP
echoes and replies to keep the session established.
Ethernet, IP, TCP/UDP, Fibre Chan., VoIP, and Video Testing Manual
79
Chapter 4 Ethernet and IP Testing
Layer 3 testing
PPPoE messages
Table 13
The following messages may appear in the during the PPPoE login process.
PPPoE messages
Message
Typically Indicates:
Resolution
PPP Authentication Failed
The user name, password, or provider name you specified were not
accepted by the PPPoE server.
–
–
–
–
PPPoE Timeout
The instrument is not physically
connected to a PPPoE server, or it
is configured to use a service that is
not supported by the server.
–
–
–
It is possible that the user name and password you specified were not recognized by
the PPPoE server. Verify that you specified
the correct name and password.
If the PPPoE server requires a provider
name, verify that the name you specified
when you configured the PPP settings is
correct.
It is possible that the PPPoE server does
not require a provider name; if so, specifying one in the PPP settings results in a
failed authentication. Set the Provider
Name setting to No, and then try to establish the session again.
Try to establish a new session with the
server.
Verify that the instrument is physically connected to the server.
Verify that the service name you specified
is correct, or, if a service name is not
required by the server, set the Service
Name setting to No.
Try to establish a new session with the
server.
Data Layer Stopped
The physical Ethernet link to the
instrument is lost.
Reconnect the physical Ethernet link. The
instrument will attempt to reconnect to the
server.
PPP LCP Failed
There is a problem with the server.
Try to establish a new session with the server.
PPP Up Failed
The PPPoE server dropped a successful PPPoE session.
Try to establish a new session with the server.
Internal Error - Restart PPPoE
The instrument experienced an
internal error.
Try to establish a new session with the server.
PPP IPCP Failed
PPPoE Failed
Terminating a PPPoE session
After testing is complete, you must manually terminate the PPPoE session.
To terminate a PPPoE session
– Press the PPPoE Client Log-Off or PPPoE Server Log-Off Action key.
Specifying transmitted IPv4
packet settings
80
Before you transmit layer 3 IPv4 traffic, you can specify the IP characteristics
of the traffic, such as the destination IP address, the type of payload, and the
type of service.
Ethernet, IP, TCP/UDP, Fibre Chan., VoIP, and Video Testing Manual
Chapter 4 Ethernet and IP Testing
Layer 3 testing
To specify transmitted IPv4 packet settings
1 If you haven’t already done so, use the Test Menu to select the layer 3 or
layer 4 IPv4 test application for the interface you are testing. Refer to
Table 6 on page 25 through Table 7 on page 25 for a list of layer 3 applications. Table 15 on page 148 lists layer 4 applications.
2 Select the Setup soft key, and then select the IP tab.
3 In Length Type, indicate whether you want to specify the length as a frame
size or as a packet length.
– Frame Size. If you select Frame Size, you must specify the size on the
Ethernet tab, then return to the IP tab to specify the remaining settings.
– Packet Length. If you select Packet Length, select a pre-defined
length, or select User Defined or Jumbo and then specify the length.
The calculated frame size (in bytes) appears to the right of the field.
If you selected Random or EMIX, use the Configure button to specify
user-defined random frame sizes, including Jumbo, or select Reset to
transmit frames of randomly generated sizes based on the seven RFC
2544 frame length recommendations. EMIX also adds the EMIX Cycle
Length field that controls how many frame entries are sent, in order,
before cycling back to the first frame entry and repeating. To define the
number of frame entries, enter a number between 1 and 8.
Figure 18 Configure Random Frame Size
4 On the illustration of the IP packet, select the TOS/DSCP field, and then
do the following to indicate how the network should prioritize the packet
during transmission:
– In Type, select TOS or DSCP.
– Specify the TOS or DSCP value. DSCP values are shown as code
points with their decimal values in ( ) following. For example: EF(46).
5 Select the TTL field, and then specify maximum number of hops to travel
before the packet is dropped.
6 Select the Source/Destination Address field, and then specify the
Source IP Type, Source IP, Default Gateway, Subnet Mask and Destination IP.
Ethernet, IP, TCP/UDP, Fibre Chan., VoIP, and Video Testing Manual
81
Chapter 4 Ethernet and IP Testing
Layer 3 testing
7 To verify the validity of the Destination IP entered, select the Ping button. If
a connection to the specified IP address is possible, a green check mark
will display after the Destination IP field. If no connection is possible a red
“X” will appear. This ping result will also appear on the ping button on the
Results page.
NOTE:
For optical applications the Laser must be ON to ping the destination IP.
8 Select the Data field, and then do the following:
– If you want to transmit packets with a time stamp and sequence
number, select Acterna.
Indicate whether you want the payload to carry a BERT pattern, or a FillByte pattern, then specify the pattern.
NOTE:
In 40Gig and 100Gig Traffic applications, you can also select either Version
2 or Version 3 Acterna Payload (ATP). To successfully use the Version 3
payload, the remote equipment must be capable of receiving Version 3 payloads. Verify compatibility before selecting Version 3 payloads.
– If you are measuring round trip delay on a 10 Gigabit circuit, in RTD
Setup, indicate whether you want to measure delay with a high degree
of precision, or a low degree of precision. In most instances, you should
select High Precision - Low Delay.
NOTE: You must select an Acterna payload to measure round trip delay
and count lost packets.
– If you want to populate the payload by repeating a specific pattern of
bytes, select Fill Byte, type the byte value using a 1 byte hexadecimal
format, and then specify the Protocol.
9 If you need to specify other settings for the test, select the appropriate tab;
otherwise, press Results to return to the Main screen.
The transmitted IPv4 packet settings are specified.
Specifying IPv4 filter settings
Before transmitting layer 3 IPv4 traffic, you can optionally specify settings that
indicate the expected received payload and determine which packets will pass
through the receive filter and be counted in the test result categories for filtered
IP traffic. The settings may also impact other results.
To specify received IPv4 packet settings
1 If you haven’t already done so, use the Test Menu to select the IPv4 test
application for the interface you are testing. Refer to Table 6 on page 25
through Table 7 on page 25 for lists of layer 3 applications. Table 15 on
page 148 lists layer 4 applications.
2 Select the Setup soft key, and then select the Filters tab.
3 In the panel on the left side of the tab, select Basic, then set the Filter
Mode to Detailed.
4 Specify the Ethernet filter settings (see “Specifying Ethernet filter settings”
on page 51.
5 To specify layer 3 filter settings, in the panel on the left side of the tab,
select IP.
82
Ethernet, IP, TCP/UDP, Fibre Chan., VoIP, and Video Testing Manual
Chapter 4 Ethernet and IP Testing
Layer 3 testing
6 Set the IP Filter to Enable., then do the following:
a If you are running an application in Monitor mode, in IP Version, select
IPv4.
b In Address Filter, select one of the following:
Single Direction. To pass through the filter, traffic must satisfy the
source and destination address criteria you specified for the filter to be
reflected in the L3 Filter Counts and L3 Filter Stats result categories.
Either Direction. The filter will not care which direction the traffic is
coming from; therefore, the source address carried in the filtered traffic
can be the source address of the near-end unit or port, or the source
address of the far end unit or port. Traffic from either source will be
reflected in the L3 Filter Counts and L3 Filter Stats result categories.
c On the illustration of the IP packet, select the TOS/DSCP, Protocol,
Source IP, or Destination IP field, and then enter the filter criteria. This
is the criteria that must be carried in the analyzed (filtered) traffic. For
descriptions of each of these settings, see “Specifying transmitted IPv4
packet settings” on page 80.
7 If you want the module to monitor and analyze live Ethernet traffic, in the
panel on the left side of the tab, select Rx Payload, then turn Payload
Analysis Off. The instrument will suppress lost frames (LF) in their associated result counts and as triggers for LEDs.
8 If you need to specify other settings for the test, select the appropriate tab;
otherwise, press Results to return to the Main screen.
The filter settings for IPv4 packets are specified.
Specifying transmitted IPv6
packet settings
Before you transmit layer 3 IPv6 traffic, you can specify the IP characteristics
of the traffic, such as the source type and default gateway.
To specify transmitted IPv6 packet settings
1 If you haven’t already done so, use the Test Menu to select the layer 3 or
layer 4 IPv6 test application for the interface you are testing. Refer to
Table 6 on page 25 through Table 7 on page 25 for a list of layer 3 applications. Table 15 on page 148 lists layer 4 applications.
2 Select the Setup soft key, and then select the IP tab.
3 In Length Type, indicate whether you want to specify the length as a frame
size or as a packet length.
– Frame Size. If you select Frame Size, you must specify the size on the
Ethernet tab, then return to the IP tab to specify the remaining settings.
– Packet Length. If you select Packet Length, select a pre-defined
length, or select User Defined, Jumbo, or Random and then specify the
length. The calculated frame size (in bytes) appears to the right of the
field.
If you selected Random or EMIX, use the Configure button to specify
user-defined random frame sizes, including Jumbo, or select Reset to
transmit frames of randomly generated sizes based on the seven RFC
2544 frame length recommendations. EMIX also adds the EMIX Cycle
Ethernet, IP, TCP/UDP, Fibre Chan., VoIP, and Video Testing Manual
83
Chapter 4 Ethernet and IP Testing
Layer 3 testing
Length field that controls how many frame entries are sent, in order,
before cycling back to the first frame entry and repeating. To define the
number of frame entries, enter a number between 1 and 8.
Figure 19 Configure Random Frame Size
4 On the illustration of the IP packet, select the Traffic Class field, and then
specify a number representing the traffic class using a hexadecimal format
ranging from 0x0 to 0xFF.
5 Select the Flow Label field. If you are certain the routers on the circuit
support flow labels for traffic prioritization, specify the flow label using a
hexidecimal format ranging from 0x0 to 0xFFFFF; otherwise, use the
default (0x0).
6 Select the Next Header field, then specify the code representing the type
of data carried in the next header in the packet using a hexidecimal format
ranging from 0x0 to 0xFF.
7 Select the Hop Limit field, then specify the time after which a packet can
be deleted by any device on a circuit as a number of hops. The default
Hop Limit setting is 64 hops.
8 Select the Source Address field, then select one of the following:
– Stateful. Select Stateful if you want to obtain the required global,
default gateway, and DNS server addresses from a DHCPv6 server.
– Stateless. Select Stateless if you know that routers on the network
allow stateless configuration. When you use Stateless configuration,
the instrument generates a tentative link-local address, and then
performs Duplicate Address Detection to verify that the address isn’t
already used. If DAD is successful, the instrument then obtains a
subnet prefix from the router to build the required global address.
– Manual. Select Manual if you want to specify the source link-local
address, global address, subnet prefix length, and default gateway.
9 Select the Destination Address field, and then specify the destination
address for the traffic.
10 Select the Data field, and then select do the following:
– If you want to transmit packets with a time stamp and sequence
number, select Acterna.
84
Ethernet, IP, TCP/UDP, Fibre Chan., VoIP, and Video Testing Manual
Chapter 4 Ethernet and IP Testing
Layer 3 testing
Indicate whether you want the payload to carry a BERT pattern, or a FillByte pattern, then specify the pattern.
– If you are measuring round trip delay on a 10 Gigabit circuit, in RTD
Setup, indicate whether you want to measure delay with a high degree
of precision, or a low degree of precision. In most instances, you
should select High Precision - Low Delay.
NOTE: You must select an Acterna payload to measure round trip delay
and count lost packets.
– If you want to populate the payload by repeating a specific pattern of
bytes, select Fill Byte, type the byte value using a 1 byte hexadecimal
format, and then specify the Protocol.
11 If you need to specify other settings for the test, select the appropriate tab;
otherwise, press Results to return to the Main screen.
The transmitted IPv6 packet settings are specified.
Specifying IPv6 filter settings
Before transmitting layer 3 IPv6 traffic, you can optionally specify settings that
indicate the expected received payload and determine which packets will pass
through the receive filter and be counted in the test result categories for filtered
IPv6 traffic. The settings may also impact other results.
To specify received IPv6 packet settings
1 If you haven’t already done so, use the Test Menu to select the IPv6 test
application for the interface you are testing. Refer to Table 6 on page 25
through Table 7 on page 25 for lists of layer 3 applications. Table 15 on
page 148 lists layer 4 applications.
2 Select the Setup soft key, and then select the Filters tab.
3 In the panel on the left side of the tab, select Basic, then set the Filter
Mode to Detailed.
4 Specify the Ethernet filter settings (see “Specifying Ethernet filter settings”
on page 51.
5 To specify layer 3 filter settings, in the panel on the left side of the tab,
select IP.
6 Set the IP Filter to Enable, then do the following:
a If you are running an application in Monitor mode, in IP Version, select
IPv6.
b In Address Filter, select one of the following:
Single Direction. To pass through the filter, traffic must satisfy the
source and destination address criteria you specified for the filter to be
reflected in the L3 Filter Counts and L3 Filter Stats result categories.
Either Direction. The filter will not care which direction the traffic is
coming from; therefore, the source address carried in the filtered traffic
can be the source address of the near-end unit or port, or the source
address of the far end unit or port. Traffic from either source will be
reflected in the L3 Filter Counts and L3 Filter Stats result categories.
c On the illustration of the IP packet, select the Traffic Class, Next
Header, Source Address, or Destination Address field, and then
enter the filter criteria. This is the criteria that must be carried in the
analyzed (filtered) traffic. For descriptions of each of these settings, see
“Specifying transmitted IPv6 packet settings” on page 83
Ethernet, IP, TCP/UDP, Fibre Chan., VoIP, and Video Testing Manual
85
Chapter 4 Ethernet and IP Testing
Layer 3 testing
7 If you want the module to monitor and analyze live Ethernet traffic, in the
panel on the left side of the tab, select Rx Payload, then turn Payload
Analysis Off. The instrument will suppress lost frames (LF) in their associated result counts and as triggers for LEDs.
8 If you need to specify other settings for the test, select the appropriate tab;
otherwise, press Results to return to the Main screen.
The filter settings for IPv6 packets are specified.
Transmitting and analyzing IP
traffic
Before you transmit layer 3 IP traffic, you must specify:
– Interface settings (see “Specifying interface settings” on page 42).
– IP characteristics of the transmitted traffic (see “Specifying transmitted
IPv4 packet settings” on page 80).
– IP characteristics used to filter received traffic (see “Specifying IPv4 filter
settings” on page 82).
– Traffic load settings (see “Specifying traffic load settings” on page 60).
After you configure the layer 3 IP settings, and you either manually specify the
destination device’s MAC address, or the unit determines the address using
ARP, you are ready to transmit traffic over the link.
To transmit and analyze IP traffic
1 Use the Test Menu to select the layer 3 IP traffic terminate test application
for the interface you are testing (refer to Table 6 on page 25 through
Table 7 on page 25 for a list of applications).
2 Select the Setup soft key, and then select the Interface tab to specify
settings that control the Ethernet interface (see “Specifying interface
settings” on page 42).
3 Specify settings that define the Ethernet frame and the IP packet characteristics of the transmitted traffic (see “Specifying transmitted IPv4 packet
settings” on page 80).
4 Select the Setup soft key, and then select the Ethernet filter tab to specify
the Ethernet filter settings (see “Specifying Ethernet filter settings” on
page 51.
5 Select the IP Filter tab to specify settings that filter the received traffic
based on specified packet characteristics (see “Specifying IPv4 filter
settings” on page 82).
6 Select the Traffic tab to specify the type of load the unit will transmit (see
“Specifying traffic load settings” on page 60).
7 Press Results to return to the Main screen.
8 Connect the module to the circuit.
9 If you are testing an optical interface, select the Laser button.
10 Select Start Traffic (for constant, bursty, or flood loads) or Start Ramp (for
ramped loads) to transmit traffic over the circuit.
11 Verify that the green Signal Present, Sync Acquired, Link Active, and IP
Packet Detect LEDs are illuminated.
86
Ethernet, IP, TCP/UDP, Fibre Chan., VoIP, and Video Testing Manual
Chapter 4 Ethernet and IP Testing
Layer 3 testing
12 At a minimum, observe the summary, layer 2 and 3 link counts and statistics, layer 2 and 3 filter counts and statistics, layer 3 configuration status,
and error statistics.
You have analyzed IP traffic.
Ping testing
Using the instrument, you can verify connectivity with another layer 3 or IP
device by sending ping request packets to the device. The device then
responds to the ping request with a ping reply (if the device is responsive), or
with another message indicating the reason no ping reply was sent.
Ping testing tells you if the destination device is reachable, how long it took the
ping packet to travel to the destination device and back to the
Transport Module, and if ping packets were dropped or lost along the way.
NOTE:
Ping application testing differs from ping testing during setup in that the ping
applications are not able to respond to mismatched frames. Ping testing
during setup is a simple IP address connectability verification.
Before you transmit ping request packets, you must specify:
– Interface settings (see “Specifying interface settings” on page 42).
– Ethernet Frame settings (see “Specifying Ethernet frame settings” on
page 45. Bear in mind that Jumbo packets are only supported for DIX
traffic (the 802.3 specification does not support jumbo packets).
Jumbo frames are also not supported when the instrument is configure to
transmit fast ping packets.
– IP settings (see “Specifying IP settings for Ping and Traceroute testing” on
page 87).
After you specify the ping settings, you are ready to transmit ping request
packets.
NOTE:
If you are transmitting ping packets larger than 2000 bytes to an MTS 8000
Transport Module, the Transport Module will not respond. This is not an
issue when testing using two MSAMs, or one MSAM and an FST-2802.
Specifying IP settings for Ping and
Traceroute testing
Before you transmit ping request packets or run the Traceroute application,
you can specify settings indicating the source of the IP address (static, or
assigned by a DHCP server), and the destination type (IP address or host
name), and attributes of the ping request packets (type, size, type of service,
and time to live). ARP is always enabled when running Ping and Traceroute
applications.
To specify IP settings
1 If you haven’t already done so, use the Test Menu to select the Ping application for the interface you are testing (refer to Table 6 on page 25 through
Table 7 on page 25 for a list of applications).
2 Select the Setup soft key, select the Ethernet tab, and then specify the
Ethernet frame settings (see “Specifying Ethernet frame settings” on
page 45). Be certain to set the data mode (IPoE or PPPoE).
Ethernet, IP, TCP/UDP, Fibre Chan., VoIP, and Video Testing Manual
87
Chapter 4 Ethernet and IP Testing
Layer 3 testing
3 Select the IP tab.
4 In Source Type, select one of the following:
– Static IP. To manually assign an IP address as the source address for
the traffic, select Static IP, and then type the address, subnet mask,
and default gateway in the corresponding fields.
– DHCP. To allow a DHCP server to assign an IP address, subnet mask,
and default gateway, select DHCP.
5 In Destination Type, select IP Address or Host Name, and then type the
destination IP address or the host name for the ping.
6 If you selected the Ping application, under Ping, specify the following
settings:
a In Ping Type, indicate whether you want to transmit a Single ping
packet, Multiple ping packets, a Continuous stream of ping packets,
or a Fast stream of ping packets. If you specify Multiple, enter the
number of packets to transmit.
NOTE: The instrument sends multiple and continuous pings at a rate of
1 ping per second.
It sends fast pings at a rate of once every 100 ms; assuming a response
is received within 100 ms. If the unit doesn’t receive a reply within 100
ms, it will wait up to one additional second for a reply. If a reply is
received, it will then send another ping packet. Therefore, this setting
may result in very fast ping transmissions, or slower transmissions,
depending on the responsiveness of the network.
b In Packet Size (Bytes), enter the size of the ping request packet or
packets.
c In TOS Type, specify Type of Service or DSCP, and then enter the
type of service code (see “Specifying transmitted IPv4 packet settings”
on page 80).
d In Time To Live, specify the number of hops the packet can travel
before being dropped.
NOTE: The default TTL for ping packets is 64.
7 If you selected the Traceroute application, under Traceroute, specify the
following settings:
a In TOS Type, specify Type of Service or DSCP, and then enter the
type of service code *(see “Specifying transmitted IPv4 packet settings”
on page 80).
b In Max Num. Hops (TTL), enter the number of hops or TTL after which
the TTL value stops increasing.
c In Response Time (s), enter the number of seconds the module will
wait for a response from a hop.
8 If you need to specify other settings for the test, select the appropriate tab;
otherwise, press Results to return to the Main screen.
The IP settings for ping testing are specified.
Transmitting ping request packets
88
After you specify interface, frame, and IP settings, you can transmit ping
request packets to verify connectivity.
Ethernet, IP, TCP/UDP, Fibre Chan., VoIP, and Video Testing Manual
Chapter 4 Ethernet and IP Testing
Layer 3 testing
To transmit ping packets
1 Use the Test Menu to select the layer 3 Ping test application for the interface you are testing (refer to Table 6 on page 25 through Table 7 on
page 25 for a list of applications).
2 Select the Setup soft key, and then select the Interface tab to specify
settings that control the Ethernet interface (see “Specifying interface
settings” on page 42).
3 Select the Ethernet Frame tab to specify settings that define the frame
characteristics of the transmitted traffic, and then select the IP tab to
specify settings that characterize the ping packets (see “Specifying IP
settings for Ping and Traceroute testing” on page 87).
4 Press Results to return to the Main screen.
5 Connect the module to the circuit.
6 If you are testing an optical interface, select the Laser button.
7 Verify that the green Signal Present, Sync Acquired, and Link Active LEDs
are illuminated.
8 On the Main screen, select the Ping button to transmit the packet or
packets.
9 At a minimum, observe the ping and IP configuration status test results.
You have transmitted ping request packets.
Running Traceroute
Before you run the traceroute application to determine where problems in the
network are occurring, you specify the interface settings, frame characteristics
of the traffic, and settings that control the traceroute application, such as the
source and destination IP addresses, maximum number of hops, and the
response time.
To run traceroute
1 Use the Test Menu to select the Traceroute application for the interface
you are testing (refer to Table 6 on page 25 through Table 7 on page 25
for a list of applications).
2 Select the Setup soft key, and then select the Interface tab to specify
settings that control the Ethernet interface (see “Specifying interface
settings” on page 42).
3 Select the Setup soft key, select the Ethernet tab, and then specify the
Ethernet frame settings (see “Specifying Ethernet frame settings” on
page 45). Be certain to set the data mode (IPoE or PPPoE).
4 Select the IP tab, and then specify the IP settings for the traceroute (see
“Specifying IP settings for Ping and Traceroute testing” on page 87).
5 Press Results to return to the Main screen.
6 Connect the module to the circuit.
7 If you are testing an optical interface, select the Laser button.
8 Verify that the green Signal Present, Sync Acquired, and Link Active LEDs
are illuminated.
9 Using the View menu, set the result display to a full view (Full Size), and
then select the Traceroute result category.
Ethernet, IP, TCP/UDP, Fibre Chan., VoIP, and Video Testing Manual
89
Chapter 4 Ethernet and IP Testing
Layer 3 testing
10 Press the Traceroute action button.
11 Observe the traceroute.
The traceroute application is finished.
Monitoring IP traffic
You can use the instrument to monitor IP traffic when you test each of the
Ethernet interfaces. Before you monitor traffic, you can specify interface
settings and settings that characterize and filter the received IP traffic.
NOTE:
If you are analyzing traffic on an optical circuit, be certain to turn the laser
on.
To monitor IP traffic
1 Use the Test Menu to select the layer 3 monitor/through application for the
interface you are testing (refer to Table 6 on page 25 through Table 7 on
page 25 for a list of applications).
2 Select the Setup soft key, and then select the Interface tab to specify
settings that control the Ethernet interface (see “Specifying interface
settings” on page 42).
3 Do one of the following:
– If you want to filter the received packets based on their Ethernet frame
settings, select the Ethernet Filter tab, and then proceed to step 4 and
step 5; otherwise, proceed to step 8.
– If you want to filter received MPLS packets based on the MPLS packet
settings, select the Ethernet Filter tab, set encapsulation to MPLS, and
then specify the filter criteria (see “Filtering traffic using MPLS criteria”
on page 57).
4 Under Configure incoming frames, do the following:
– In Destination Type, specify the destination address type corresponding to the Destination Address in the received frames.
– In Source Type, specify the source address type corresponding to the
Source Address in the received frames.
– If you specified a Unicast or Multicast Source or Destination Type,
enter the corresponding MAC address in the field provided.
5 In Encapsulation, do the following:
– If you want to monitor VLAN, Q-in-Q, or MPLS encapsulated traffic,
select the encapsulation, and then specify the corresponding filter
settings.
– If you want to monitor traffic with no encapsulation, select None.
– If you don’t care whether they are tagged, select Don’t Care.
6 If you want to filter the received packets based on their source IP address,
destination IP address, type of service, or IP version, select the IP Filter
tab, and then proceed to step 7; otherwise, proceed to step 8.
90
Ethernet, IP, TCP/UDP, Fibre Chan., VoIP, and Video Testing Manual
Chapter 4 Ethernet and IP Testing
Capturing packets for analysis
7 In IP Filter, select Enable, and then specify the following filter criteria:
– To filter traffic for a specific source IP address, select Yes, and then
type the source address.
– To filter traffic for a specific destination IP address, select Yes, and then
type the destination address.
– Specify whether you want to filter traffic in a single direction, or in either
direction.
– To filter traffic for a specific source or destination subnet, select Prefix
Length or Subnet Mask, and they type the corresponding value in the
field provided.
– To filter traffic for a specific type of service or DSCP, select TOS or
DSCP, and then type the corresponding value (see “Specifying transmitted IPv4 packet settings” on page 80).
8 If you need to specify other settings for the test, select the appropriate tab;
otherwise, press Results to return to the Main screen.
9 Connect the module to the circuit.
10 If you are testing an optical interface, select the Laser button.
11 Verify that the green Signal Present, Sync Acquired, and Link Active LEDs
are illuminated.
12 If you selected an optical application, select Connect Rx to Tx. This
setting does not appear for electrical applications.
13 At a minimum, observe the summary, layer 3 link statistics and counts,
layer 3 filter statistics and counts, layer 3 configuration status, and error
statistics.
Layer 3 IP traffic is monitored.
Capturing packets for analysis
If your instrument is configured and optioned to do so, you can use it to capture
transmitted and received packets, save it on the instrument or to an external
USB key, and then either send the packets to another technician for analysis,
or analyze it yourself using the Wireshark® protocol analyzer, or the J-Mentor
utility (provided on the instrument).
NOTE:
The term “packets” is used interchangeably with “frames” throughout the following section, and represents any of the layer 2, layer 3, or layer 4 datagrams carried in the traffic stream.
You can capture packets when running any of the single stream or multiple
stream Ethernet, IP, TCP/UDP, or VoIP applications, with the following exceptions:
– Applications with Mac-in-Mac (MiM) encapsulated traffic
– IPTV applications
Ethernet, IP, TCP/UDP, Fibre Chan., VoIP, and Video Testing Manual
91
Chapter 4 Ethernet and IP Testing
Capturing packets for analysis
What is captured?
All received traffic (test traffic, control plane traffic, and live traffic) that satisfies
the user-specified criteria on the Filter setup tab can be captured for all
supported interfaces.
All transmitted traffic (test traffic, control plane traffic, and live traffic) that satisfies the user-specified criteria on the Capture setup tab can be captured for all
supported interfaces up to 1 Gigabit Ethernet.
When capturing transmitted traffic from a 10 Gigabit Ethernet interface, only
control plane traffic is captured.
Ethernet frames ranging from 64 to10000 bytes long can be captured, but the
4 byte Ethernet FCS is not stored in the capture buffer.
Test traffic
Test traffic is the traffic generated and transmitted by your test instrument
carrying an ATP or BERT payload. Test traffic can be captured when it is transmitted, looped back and then captured when it is received, or it can be captured
when received from a transmitting instrument on the far end.
You can capture received test traffic for all supported interfaces; you can
capture transmitted test traffic for all supported interfaces except
10 Gigabit Ethernet.
Control plane traffic
Control plane traffic is traffic used to establish a connection with another
network element (or instrument), request information from the element, or to
verify connectivity with the element. Examples of control plane traffic include
ARP packets, Ping packets, and software application layer datagrams, such as
HTTP, TCP/UDP, or FTP control packets.
You can capture transmitted and received control traffic from all supported
interfaces.
How much can be stored in
the buffer?
When you configure your instrument to capture packets, you can control the
size of the buffer by specifying a size ranging from 1 MB to 256 MB in 1 MB
increments. You can also control how your instrument handles the packets
when the buffer becomes full. The instrument can stop capturing packets
entirely, or it can wrap (overwrite) the oldest packets in the buffer with new
captured packets in 1 MB increments.
After capturing packets to the buffer, you can save them to a a PCAP (packet
capture) file, which can optionally be compressed using gzip for efficient
storage.
Why use packet slicing?
92
When you configure your instrument to capture packets, you can tell the instrument to capture only the first 64 or 128 bytes of each packet. This allows you
to analyze the most important data carried in the packet headers (at the beginning of the packets), and to capture and store more packets in the buffer.
Ethernet, IP, TCP/UDP, Fibre Chan., VoIP, and Video Testing Manual
Chapter 4 Ethernet and IP Testing
Capturing packets for analysis
Understanding the Capture
toolbar
The buttons on the Capture toolbar (illustrated in Figure 20) are used to enable
or disable the capture feature, start and stop the capture process, save the
packets in the capture buffer to the internal USB drive (or an external drive), or
launch Wireshark® or J-Mentor to analyze the packets on the instrument.
Figure 20 Capture Toolbar
The % Buffer Full gauge shows the percentage of the available buffer capacity
that is used.
When you capture traffic at a high bandwidth or specify a small buffer size, if
you configure the capture to wrap (overwrite) the oldest packets in the buffer
with new captured packets in 1 MB increments, the buffer gauge may appear
to “jump around”. If you do not wrap the packets, the capture process may stop
very soon after you start it, because the buffer reaches capacity quickly. This
is expected behavior.
Specifying filter settings
If you specify filter settings when you configure the application, the settings
determine which received traffic is captured to the buffer. The Capture Toolbar
(illustrated in Figure 20) indicates whether filters are active or inactive.
Transmitted control plane frames are always captured to the buffer. When
capturing frames on circuits at rates up to 1 Gigabit Ethernet, all other transmitted frames are captured.
To specify filter settings before capturing frames
1 If you haven’t already done so, use the Test Menu to select the test application for the interface you are testing. Refer to Table 6 on page 25
through Table 7 on page 25 for a list of layer 2 and layer 3 applications.
Table 15 on page 148 lists layer 4 applications.
2 On the Main screen, select the Capture tool bar, then enable the capture
feature.
3 Select the Setup soft key, and then select the Filters tab. By default, a
summary of all currently configured filter settings appear (Ethernet, IP, and
TCP/UDP).
4 If you would like to clear the filters (to specify new settings for the capture
process), select Clear All Filters.
5 If you launched a layer 2 application, the panel on the left of the tab
displays the Summary and Ethernet selections.
If you launched a layer 3 or layer 4 application, the panel displays the
Summary, Basic, Ethernet, IP, and if applicable, TCP/UDP selections.
Ethernet, IP, TCP/UDP, Fibre Chan., VoIP, and Video Testing Manual
93
Chapter 4 Ethernet and IP Testing
Capturing packets for analysis
Do one of the following:
– If you launched a layer 2 application, select Ethernet, and then specify
the settings that capture the received traffic that you want to analyze
(see “Specifying Ethernet filter settings” on page 51).
– If you launched a layer 3 or layer 4 application, and you want to specify
basic filter information, select Basic, and then specify the Traffic Type
and the Address Type carried in the received traffic you want to
capture.
– If you launched a layer 3 or layer 4 application, and you want to specify
detailed filter information, select Basic, and then set the filter mode to
Detailed.
Use the Ethernet, IP, and TCP/UDP selections in the pane on the left to
display the filter settings for your particular test, and then specify the
settings that capture the received traffic that you want to analyze (see
“Specifying Ethernet filter settings” on page 51, “Specifying IPv4 filter
settings” on page 82, and “Filtering received traffic using layer 4 criteria”
on page 153).
The filter settings are specified for the capture.
Capturing packets
There are two ways to capture packets
– manually starting and stopping the capture
– capturing packets based on a triggering event
Manually capturing packets
Capturing packets involves launching and configuring an Ethernet, IP, TCP/
UDP, or VoIP application, specifying the capture settings, and, if you are
capturing received traffic, specifying the filter settings. If you are capturing
received traffic only, you can start the capture process immediately.
If you intend to capture transmitted or looped back traffic, you must actively
start traffic transmission. The traffic can then be looped back (to be captured
by the transmitting instrument), or captured by a second receiving instrument
on the circuit.
When capturing packets in Monitor or Terminate mode, you must use Port 1 for
your test if using a MSAMv1; for MSAMv2, either port can be used.
If you are capturing packets while running the VoIP application, it is recommended that you do not save the captured packets until the call is ended (the
phone is on hook).
When capturing packets, bear in mind that configuring the capture for a large
buffer (for example, 256 MB) with small packets (for example, 46 byte ping
packets), it will take a long time to fill the buffer. If you configure the capture for
a small buffer with large packets, it will take much less time.
To capture packets on the instrument
1 Launch a single or multiple stream layer 2 Ethernet, layer 3 IP, or
layer 4 TCP/UDP application.
2 If you haven’t already done so, on the Main screen, select the Capture tool
bar, then enable the capture feature.
94
Ethernet, IP, TCP/UDP, Fibre Chan., VoIP, and Video Testing Manual
Chapter 4 Ethernet and IP Testing
Capturing packets for analysis
3 Select the Setup soft key, and then do one of the following:
– Specify the settings required to filter received traffic for the type you
want to capture and analyze.
– Clear all of the filters to capture all received traffic.
For details, refer to “Specifying filter settings” on page 93.
4 Select the Capture setup tab, and then specify the following settings:
Setting
Parameter
Capture buffer size (MB)
Specify a size ranging from 1 to 256 MB in a
1 MB increment. The default buffer size is 16 MB.
Capture frame slicing
If you want to capture the first 64 or 128 bytes of
each frame (and ignore the rest of the frame),
select 64 or 128; otherwise, select None.
If you select None (the default), the entire frame
is captured.
When capture buffer is
filled
If you want to overwrite the oldest packets with
new packets when the buffer becomes full, select
Wrap Capture; otherwise, select Stop Capture.
Include frames from
Traffic tab
If you want to capture transmitted frames (the
traffic load which is specified on the Traffic tab),
select Yes.
5 Select the Results soft key to return to the Main screen.
6 If you are capturing transmitted or looped back traffic, select Start traffic.
7 Select the Capture toolbar, and then do the following:
a Select Start Capture.
A message appears in the message bar indicating that the capture has
started, and the action key states Capture Started.
b If you want to capture packets that shows how the traffic is impacted by
various events, use the buttons on the Actions, Errors, and Fault
Signaling tool bars to insert the events into the transmitted traffic
stream.
8 If you want to manually stop capturing packets (for example, after the
instrument has transmitted and received a certain number of frames),
select the Capture Started action key.
The action key turns grey, and a message appears in the message bar
indicating that the capture is complete.
Packets were captured and are stored temporarily in the capture buffer. A
count of the number of packets processed is provided in the Ethernet result
group, in the Capture category.
WARNING: Changing applications or turning OFF the instrument
You will lose the entire contents of the capture buffer if you launch a new
application on the port that you are capturing packets on, or if you turn your
instrument OFF. To ensure that the packets are stored, save the capture
buffer before changing applications or turning the instrument OFF.
Ethernet, IP, TCP/UDP, Fibre Chan., VoIP, and Video Testing Manual
95
Chapter 4 Ethernet and IP Testing
Capturing packets for analysis
Capturing packets based on a
trigger
When troubleshooting problems that occur intermittently or inconsistently, the
trigger feature allows capture to begin based on a given event. For this
scenario, the filters are used as triggers.
Triggering using only the byte pattern as a trigger
1 Press the Setup soft key.
2 Select Capture tab, and then set Capture to Enable.
3 Set Use Filters as to Filter.
4 Select the Filters tab, and then, in the panel on the left side, select
Summary.
5 Select the Clear All Filters button to clear any current filter settings.
6 In the panel on the left side, select Byte Pattern.
7 Set Use Byte Pattern as to Trigger, and then specify the trigger/filter as
described in “Filtering traffic using byte pattern criteria” on page 58.
8 Select the Capture tab and specify a Post-Trigger Size. This is the
amount of data, in MB, to capture after the trigger event occurs. If set to
zero, the capture stops immediately after the trigger event.
9 Select the Results soft key to return to the Main screen.
NOTE:
When capturing packets based on a trigger, the capture buffer saves in
wrap-around mode (overwrite the oldest packets with new packets when the
buffer becomes full).
10 Select the Capture toolbar, and then select Start Capture.
A message appears in the message bar indicating that the capture has
started, and the action key states Capture Started.
The capture will begin when the trigger event occurs which will be when the
data matches the byte pattern criteria. Captured packets are stored temporarily
in the capture buffer. A count of the number of packets processed is provided
in the Ethernet result group, in the Capture category.
WARNING: Changing applications or turning OFF the instrument
You will lose the entire contents of the capture buffer if you launch a new
application on the port that you are capturing packets on, or if you turn your
instrument OFF. To ensure that the packets are stored, save the capture
buffer before changing applications or turning the instrument OFF.
Triggering using only the filters as a trigger
1 Press the Setup soft key.
2 Select Capture tab, and then set Capture to Enable.
3 Set Use Filters as to Trigger.
4 Select the Filters tab, and then, in the panel on the left side, select
Summary.
5 Select the Clear All Filters button to clear any current filter settings.
6 In the panel on the left side, select Byte Pattern.
7 Set the Use Byte Pattern as to Don't Care to turn off the byte pattern as a
trigger.
96
Ethernet, IP, TCP/UDP, Fibre Chan., VoIP, and Video Testing Manual
Chapter 4 Ethernet and IP Testing
Capturing packets for analysis
8 On the Filters tab, specify the trigger/filter as described in “Specifying filter
settings” on page 93.
9 Select the Capture tab and specify a Post-Trigger Size. This is the
amount of data, in MB, to capture after the trigger event occurs. If set to
zero, the capture stops immediately after the trigger event.
NOTE:
When capturing packets based on a trigger, the capture buffer saves in
wrap-around mode (overwrite the oldest packets with new packets when the
buffer becomes full).
10 Select the Capture toolbar, and then select Start Capture.
A message appears in the message bar indicating that the capture has
started, and the action key states Capture Started.
The capture will begin when the trigger event occurs which will be when the
data matches the filter criteria. Captured packets are stored temporarily in the
capture buffer. A count of the number of packets processed is provided in the
Ethernet result group, in the Capture category.
WARNING: Changing applications or turning OFF the instrument
You will lose the entire contents of the capture buffer if you launch a new
application on the port that you are capturing packets on, or if you turn your
instrument OFF. To ensure that the packets are stored, save the capture
buffer before changing applications or turning the instrument OFF.
Triggering using the filters and byte pattern simultaneously as a trigger
1 Press the Setup soft key.
2 Select Capture tab, and then set Capture to Enable.
3 Set Use Filters as to Trigger.
4 Select the Filters tab, and then, in the panel on the left side, select
Summary.
5 Select the Clear All Filters button to clear any current filter settings.
6 In the panel on the left side, select Byte Pattern.
7 Set the Use Byte Pattern as to Trigger, and then specify the trigger/filter
as described in “Specifying filter settings” on page 93.
8 Select the Capture tab and specify a Post-Trigger Size. This is the
amount of data, in MB, to capture after the trigger event occurs. If set to
zero, the capture stops immediately after the trigger event.
NOTE:
When capturing packets based on a trigger, the capture buffer saves in
wrap-around mode (overwrite the oldest packets with new packets when the
buffer becomes full).
9 Select the Capture toolbar, and then select Start Capture.
A message appears in the message bar indicating that the capture has
started, and the action key states Capture Started.
Ethernet, IP, TCP/UDP, Fibre Chan., VoIP, and Video Testing Manual
97
Chapter 4 Ethernet and IP Testing
Capturing packets for analysis
The capture will begin when the trigger event occurs which will be when the
data matches the filter criteria and byte pattern criteria. Captured packets are
stored temporarily in the capture buffer. A count of the number of packets
processed is provided in the Ethernet result group, in the Capture category.
WARNING: Changing applications or turning OFF the instrument
You will lose the entire contents of the capture buffer if you launch a new
application on the port that you are capturing packets on, or if you turn your
instrument OFF. To ensure that the packets are stored, save the capture
buffer before changing applications or turning the instrument OFF.
Saving or exporting captured
packets
After capturing packets, you can save the packets in the buffer to the internal
USB drive, or export it to an external USB drive. You can save the entire buffer,
or you can indicate that you want to save part of the buffer. You can also optionally turn on gzip compression.
You can also optionally import a pcap file from an external USB drive to
analyze it on your unit.
Many factors contribute to the length of time it takes to save a captured file. For
example, if you configure a capture for a large buffer size (for example,
256 MB) with small packets (for example, 46 byte ping packets), it will take a
long time to save the file due to the large number of packets stored in the buffer.
Essentially, the packet density and the capture size determine the length of
time it takes to save the packets.
If you are running a TCP Host application, saving captured packets takes a
long time; therefore, we recommend stopping the TCP Host application before
saving the captured packets.
To save the packets in the capture buffer
1 Capture the packets (see “Capturing packets” on page 94).
2 Select Save Capture Buffer.
The Save Capture File dialog box appears (see Figure 21).
Figure 21 Save Capture File dialog box
98
Ethernet, IP, TCP/UDP, Fibre Chan., VoIP, and Video Testing Manual
Chapter 4 Ethernet and IP Testing
Capturing packets for analysis
3 At the top of the dialog box, select one of the following:
To ...
Select this ...
Save the captured packets to the internal
USB drive
/acterna/user/bert/disk/capture
Save the captured packets to an external
USB drive
/acterna/user/usbflash
4 Specify the following settings:
Setting
Parameter
File Type
If you want to see all files stored in the location
you selected in step 3, select All files; otherwise,
accept the default (Pcap files).
File Name
If you want to specify a file name instead of
accepting the default, type the name using popup
keypad. You do not need to specify the .pcap file
extension, the instrument will automatically do so
for you.
Save
Select one of the following:
– If you want to save all of the packets in the
buffer, select Full Buffer.
– If you only want to save some of the packets
in the buffer, select Partial Buffer.
From
If you indicated that you only want to save part of
the buffer (by selecting Partial Buffer), specify
one of the following:
– Start of buffer
– End of buffer
Amount
If you indicated that you only want to save part of
the buffer (by selecting Partial Buffer), specify
one of the following:
– The number of MB to save (up to 256 MB)
– The percentage of the buffer to save
Compress File
By default, the instrument does not compress the
file. If you want to save the packets in a compressed (gz) format, select this setting.
Do not compress the file if you are measuring
One Way Delay.
Launch Wireshark after
saving
If you want to launch Wireshark immediately after
saving the packets in the capture buffer, select
this setting.
5 Select the Save button at the bottom of the dialog box.
A dialog box appears above the Main screen showing the percentage of
the buffer that has been saved. When buffer is saved, the box closes. If
you indicated that you wanted Wireshark to launch immediately after
saving the buffer, the Wireshark® application appears.
Ethernet, IP, TCP/UDP, Fibre Chan., VoIP, and Video Testing Manual
99
Chapter 4 Ethernet and IP Testing
Capturing packets for analysis
The packets in the capture buffer are saved or exported.
CANCELLING THE SAVE PROCESS:
You can cancel the save process by pressing the Cancel button provided
on the Save Capture Buffer dialog box. The length of time it take to cancel
the save process varies depending on the amount of data stored in the capture buffer. More data in the buffer results in a longer cancellation process.
How long will it take to save
the PCAP file?
The length of time it takes to save the PCAP file varies based on a number of
factors, including the capture buffer size, the length of the packets captured,
the system resources used, and whether or not you chose to compress the file.
Table 14 provides estimates for a 100% full 256 MB buffer, for two packet
lengths. The estimates assume you did not compress the file, and that you are
not running another application on the other port.
Table 14 Estimated time to save a 256 MB PCAP file
Analyzing the packets using
Wireshark®
Packet Length
Estimated time to save
64 bytes
9 minutes
512 byte frames
8 minutes
After saving the packets in the capture buffer (to a PCAP file), you can analyze
the packets in detail on the instrument using the Wireshark® protocol analyzer.
Files exceeding 16 MB should not be analyzed on the instrument; large files
should be exported for analysis on another device. If you attempt to analyze a
file with more than 50,000 packets, the instrument will alert you that the file
should be exported for analysis.
One way to think of the buffer size in relationship to the length of packets is in
terms of density. A small 1 MB buffer populated with 256 byte packets is not as
dense as a 1 MB buffer populated with 64 byte packets, because less 256 byte
packets are required to fill the 1 MB buffer. Due to the reduced density of the
file, opening the file for analysis take less time. A dense file takes longer to
open.
IMPORTANT: Wireshark® Support
JDSU is distributing Wireshark® on the instrument under the GNU General
Public License, version 2. It is not a JDSU product. For technical support, go
to the product website at www.wireshark.org.
To analyze captured packets
1 On the Capture toolbar, select the Wireshark action key.
The Open Capture File dialog box appears.
2 Navigate to and select the file you want to analyze.
The Wireshark® splash screen appears, then a small dialog box appears
while the application loads the packets in the file you selected.
100
Ethernet, IP, TCP/UDP, Fibre Chan., VoIP, and Video Testing Manual
Chapter 4 Ethernet and IP Testing
Capturing packets for analysis
3 After the packets are loaded, a screen similar to the one in Figure 22
appears.
Figure 22 Sample Wireshark® screen
4 Use the controls at the top of the screen to locate and evaluate the
packets. For technical support and product documentation, go to
www.wireshark.org.
You are analyzing captured packets.
Analyzing the packets using
J-Mentor
If you want a summarized analysis of the packets, you can use the J-Mentor
utility provided on your instrument. The utility is only available for analysis of
packets captured on 10/100/1000 Mbps electrical, 100M optical, and 1G
optical circuits.
J-Mentor can only be used to analyze PCAP files with 50,000 or less captured
packets.
To analyze captured packets
1 On the Capture toolbar, select the J-Mentor action key.
The Open Capture File dialog box appears.
2 Specify the link bandwidth in Mbps. This is the line rate at which you
captured the traffic.
3 Navigate to and select the file you want to analyze.
4 If you want to observe key details for the PCAP file, select Get PCAP Info.
This is wise if you suspect the file might exceed the 50000 packet limit for
analysis on your instrument.
Ethernet, IP, TCP/UDP, Fibre Chan., VoIP, and Video Testing Manual 101
Chapter 4 Ethernet and IP Testing
Capturing packets for analysis
If the file has 50,000 packets (or less), a summary of the data in the file
appears, including:
– The number of packets captured
– The file and data size
– The capture duration, start, and stop time
– The data bit and byte rate
– The average packet size
– The average packet rate
If the file has more than 50,000 packets, a message appears indicating
that you can not analyze the packets on the instrument. If this occurs,
export the PCAP file and analyze it using Wireshark® on your workstation.
5 To analyze the packets in the file, select Analyze. The utility immediately
checks for the following:
– The possible retransmissions of packets
– High bandwidth utilization
– Top talkers
– Detection of half duplex ports
– ICMP frames
After analyzing the packets, the Capture Analysis Summary screen
appears, indicating whether issues were found at layers 1 and 2 (the physical and Ethernet layer), layer 3 (the IP layer), or layer 4 (the TCP/UDP
layer). Green indicates everything was fine at a particular layer; Red indicates that there were issues identified at that layer. See Figure 23.
Figure 23 Capture Analysis Summary screen
6 Use the Details buttons to observe detailed results for each layer. For
example, if you want to observe a graph of the network utilization, or a list
of all IP conversations, press the Details button for Layer 1 / 2.
7 If you want to analyze another PCAP file, select Choose PCAP File, and
repeat step 3 through step 6; otherwise, select Exit to return to the Main
Screen.
The packets were analyzed using J-Mentor.
102
Ethernet, IP, TCP/UDP, Fibre Chan., VoIP, and Video Testing Manual
Chapter 4 Ethernet and IP Testing
Loopback testing
Loopback testing
Loopback testing allows you to transmit traffic from one JDSU Ethernet test
set, and then loop the traffic back through a second unit on the far end of a
circuit. For details, refer to Chapter 8 “Loopback Testing”.
Inserting errors or pause frames
Action buttons on the Main screen allow you to insert errors and pause frames
into the traffic stream. If you turn on a particular error insertion rate, the error
insertion continues even after you restart a test or change the test configuration.
– If you selected a 10 Gigabit WAN application, you can also insert SONET/
SDH errors and alarms as appropriate. For details, see the PDH, SONET,
SDH, NextGen, and OTN Testing Manual that shipped with your instrument or upgrade.
NOTE:
Only errors that are applicable to your test appear for selection. For example, IP Checksum errors only appear if you selected a layer 3 or layer 4 test
application; TCP/UDP Checksum errors only appear if you selected a
layer 4 test application.
To insert errors or pause frames
1 If you are inserting pause frames, specify the pause quanta on the Interface tab (see “Specifying interface settings” on page 42); otherwise,
proceed to step 2.
2 If you are inserting errors, select one of the following error types; otherwise, proceed to step 4:
– Code (optical applications only)
– FCS
– BIT (BERT payload only)
– Pattern (Layer 1 BERT, 1 GigE or 10 GigE applications only)
– IP Checksum (Layer 3 only)
– TCP/UDP Checksum (Layer 4 only). TCP/UDP Checksum errors are
only available if you are transmitting fixed BERT patterns. They are not
available when transmitting PRB patterns.
– ATP Payload. You must configure the module to transmit an Acterna
payload to insert ATP Payload errors.
– Remote Fault - insert on L2 and above (10 GigE, 40 GigE and
100 GigE applications only)
– Local Fault - insert on L2 and above (10 GigE, 40 GigE and 100 GigE
applications only)
– Alignment Marker(40 GigE or 100 GigE applications only)
– BIP-8 AM (40 GigE or 100 GigE applications only)
– Block Error on L1 PCS (40 GigE or 100 GigE applications only)
Ethernet, IP, TCP/UDP, Fibre Chan., VoIP, and Video Testing Manual 103
Chapter 4 Ethernet and IP Testing
Inserting alarms or defects
3 Do the following:
– Specify the Insertion Style (Single, Burst, or Rate).
– For 40GigE or 100GigE lane errors (Code, Alignment Marker, or
Bip-8), select the lane(s) into which the error is to be inserted.
– If you specified Burst, specify the number of errors in the burst, and
then select OK.
– If you specified Rate, select a rate.
4 Do one of the following:
– If you are inserting errors, press the Error Insert button.
– If you are inserting pause frames, select the Actions tab, and then
press the Pause Frame Insert button.
NOTE:
When inserting code errors at a rate of 1E-3 on 10 GigE circuits, the large
volume of errors will bring down the Ethernet link.
Per IEEE 802.3ae, a maximum of 16 code violations (invalid synchronization headers) are to be counted per 125 μs. Therefore, inserting a burst of
code errors with a quantity greater than 16 will typically be counted as 16
code violations on the receiver.
Error or pause frame insertion starts. If you are inserting errors at a particular
rate, the associated button turns yellow. To stop insertion, press the corresponding button again. Error insertion stops, and the associated button turns
grey.
Inserting alarms or defects
You can insert multiple types of alarms or defects simultaneously into a single
or multiple streams.
To insert alarms or defects
1 Using the Test Menu, select the terminate test application for the signal,
rate, and payload you are testing (refer to Table 6 on page 25 for a list of
applications).
2 Connect a cable from the appropriate TX connector to the network’s
RECEIVE access connector.
3 Select the Laser button.
4 Select an alarm or defect type (LOBL, LOAML, HI-BER).
5 For alarms that apply to multi-lane applications, specify the number of the
lane in which the alarm is to be inserted or select All.
6 Press the Alarm Insert or Defect Insert button.
The module inserts an alarm or defect, and the button turns yellow.
Test results associated with the alarm or defect appear in the Status result
category.
104
Ethernet, IP, TCP/UDP, Fibre Chan., VoIP, and Video Testing Manual
Chapter 4 Ethernet and IP Testing
Measuring round trip delay or packet jitter
Measuring round trip delay or packet jitter
You can measure round trip delay or packet jitter by transmitting an Acterna
payload. The Acterna payload carries frames with time stamps, enabling the
instrument to calculate the delay and jitter. To measure round trip delay, you
must use a loopback configuration.
You can measure packet jitter (the difference in one-way-delay as experienced
by a series of packets) using either a loopback or an end-to-end configuration.
When measuring packet jitter, your unit must receive three or more Acterna
frames or packets before measurement begins.
To measure round trip delay or packet jitter
1 Use the Test Menu to do one of the following:
– Select the layer 2 or layer 3 traffic terminate test application for the
interface you are testing (refer to Table 6 on page 25 through Table 7
on page 25 for a list of applications).
2 Select the Setup soft key, and then do the following:
– If you selected a layer 2 traffic application, select the Ethernet setup
tab, or if you selected a layer 3 traffic application, select the IP setup
tab.
– Select the DATA field to specify that transmitted frames will carry an
Acterna payload.
– If you are measuring delay on a 10 Gigabit Ethernet or 10 Gigabit Fibre
Channel circuit, verify that the RTD Setup setting is set to
High Precision - Low Delay.
3 If you need to specify other settings for the test, select the appropriate tab;
otherwise, press Results to return to the Main screen. If delay through the
optic needs to be accounted for, the user needs to enter the latency in the
RTD Optic offset field, so that it can be subtracted from the delay
measurement (enter in microseconds). For more information, see “Optics
Expert Mode” in the Getting Started Guide.
4 Connect the module to the circuit.
5 If you are testing an optical interface, select the Laser button.
6 Verify that the green Signal Present, Sync Acquired, and Link Active LEDs
are illuminated.
7 At a minimum, observe the delay and jitter test results in the Ethernet L2
Link Stats or L3 Link Stats category and the L2 Filter Stats or L3 Filter
Stats category.
If your delay results (measurements) display “Out of Range”, change the
RTD Setup to Low Precision - High Delay, and then restart the test.
Round trip delay and packet jitter are measured.
Measuring one way delay
One way delay measurements are measurements of delay in a single direction
(from a source node to a destination node). They differ from round trip delay
measurements because they do not include the cumulative network delays
associated with inbound and outbound traffic.
Ethernet, IP, TCP/UDP, Fibre Chan., VoIP, and Video Testing Manual 105
Chapter 4 Ethernet and IP Testing
Measuring one way delay
CDMA/GPS receivers
To accurately measure delay in one direction, the time on both nodes must be
precisely synchronized. The MSAMs use external CDMA receivers to ensure
that both instruments are synchronized, providing measurements that are
accurate within +/- 10 μs. A CDMA base station is synchronized to GPS time,
and broadcasts this time to the receivers which are connected to your instruments. The receivers provide periodic messages with GPS time, and an accurate 1PPS signal into the BNC connector on your instrument.
A GPS receiver is an alternative to the CDMA receiver. This receiver obtains
highly accurate timing information directly from the GPS Satellite. Each MSAM
in the system that needs to be synchronized must have its own GPS
receiver. The receivers provide periodic messages with GPS time via a DB9 or
RJ-45 connector, and an accurate 1PPS signal into the BNC or SMA connector
on your instrument.
Whether connected to a CDMA or GPS receiver, your instrument uses the
messages and signals to synchronize its internal clock with GPS time.
Outgoing packets are then marked with GPS timestamps (see “ATP-GPS test
packets” on page 106).
ATP-GPS test packets
When your test instrument is synchronized to GPS time via the CDMA or GPS
receiver, it tags outgoing Acterna Test Packets (ATP) with GPS timestamps.
The timestamps are required for accurate one way delay measurements. The
receiving instrument recognizes these packets and uses them when
measuring one way delay.
Network diagram
Figure 24 shows a typical placement of the test instruments and their relationship to the CDMA receivers and base stations. In this configuration, synchronized instrument B measures the delay in traffic received from instrument A,
and synchronized instrument A measures the delay in traffic received from
instrument B. Each instrument operates in terminate mode, and only measures
delay on the inbound link.
Figure 24 Typical one way delay configuration
106
Ethernet, IP, TCP/UDP, Fibre Chan., VoIP, and Video Testing Manual
Chapter 4 Ethernet and IP Testing
Measuring one way delay
Both test ports can be used on the instruments, allowing you to measure one
way delay for two different circuits simultaneously. Figure 25 illustrates a
configuration used to measure one way delay from A to B, and from A to C.
You could also transmit traffic from instruments B and C, and measure delay
for both circuits on two independent ports on Instrument A.
Figure 25 Dual Port configuration
For systems utilizing GPS receivers instead of CDMA receivers, the system is
very similar except that the GPS receivers communicate directly with the GPS
instead of via terrestrial-based radio.
Things to consider
Before measuring one way delay, consider the following:
– Two GPS synchronized instruments are required to accurately measure
one way delay. No communication is required over the Transport network
to synchronize the time.
– Both instruments must operate within a CDMA or GPS network to attain
GPS synchronization.
– Both ports can be used on the instruments for one way delay testing. In
Figure 24 on page 106, one port is used to transmit traffic and measure
delay from instrument A to B, and a second port is used to transmit traffic
and measure delay from instrument B to A.
– A GPS synchronized instrument and an unsynchronized instrument can be
used for testing; however, they can not be used to measure one way delay.
Neither instrument will provide one way delay measurements.
– Follow the guidelines included in the documentation shipped with the GPS
receiver regarding preparation time and hold-over stability to ensure
maximum accuracy and stability.
– Acterna traffic can be looped back from an unsynchronized instrument;
however, the receiving synchronized instrument will not be able to
measure one way delay on the looped back traffic. Round trip delay will be
measured instead.
– If instrument B is synchronized, and traffic from instrument A is looped
back through B to A, instrument B will measure one way delay (from A to
B), but instrument A will only measure round trip delay because it can not
measure one way delay on traffic that has travelled both directions (in a
round trip). Instrument A will measure round trip delay for the returned
(looped back) traffic.
Ethernet, IP, TCP/UDP, Fibre Chan., VoIP, and Video Testing Manual 107
Chapter 4 Ethernet and IP Testing
Measuring one way delay
Although it might seem like you can estimate the one way delay from
instrument B to instrument A by subtracting the one way delay measurements reported on B from the round trip delay measurements reported on
A, the calculation will not be correct. Round trip delay measurements
include internal loopback delays, which vary and depend on the size of
looped back frames. Therefore, the estimate will not be accurate, and the
delay measured will be slightly exaggerated.
– The two instruments used to measure one way delay must use the same
BERT software version in order to synchronize timing.
– Version 10 uses UTC timing, so if measuring one way delay using an
instrument running BERT software version 10, the other instrument
must also run version 10.
– Version 11 uses GPS timing, so if measuring one way delay using an
instrument running BERT software version 11, the other instrument
must also run BERT software version 11.
About the One Way Delay test
option and accessory kit
CDMA Receiver Kit
One way delay testing is offered as a test option for your instrument. When you
purchase an OWD test option (CDMA or GPS), you receive an accessory kit.
The accessory kit can be used with the T-BERD / MTS 5800, 6000A with
MSAM, 8000 with DMC, or 8000 with Transport Module, so not all parts are
used for a given product.
– Præcis2 CDMA Receiver Package. This package includes a CDMA
receiver, AC power adapter, Ethernet cable, DB-9 to RJ-45 adapter, Mag
mount 14” antenna, and documentation for the items in the package.
– Antenna stub and magnetic-mount antenna.
– J-Bullet custom attenuator
– BNC (male) to BNC (male) cable
– SMA to BNC Adapter
– SMA to BNC cable
– SMA to SMA cable
– RS-232 Serial cable
– RS-232 to USB converter
– Serial DB-9 to RJ-45 cable
GPS Receiver Kit
– Spectrum Instruments TM=4M GPS receiver
– Antenna
– J-Bullet attenuator, 500 ohm - JDSU
– BNC (male) to BNC (male) cable
– SMA to BNC Adapter
– SMA to BNC cable
– SMA to SMA cable
– RS-232 Serial Cables
– DB9 (female) to RJ-45 (1)
– DB9 to DB9 (1)
– RS-232 to USB converter
– Documentation and software for items in the package
108
Ethernet, IP, TCP/UDP, Fibre Chan., VoIP, and Video Testing Manual
Chapter 4 Ethernet and IP Testing
Measuring one way delay
Step 1: Connecting the
receivers to your instruments
Before measuring one way delay, you must connect the receivers (CDMA or
GPS) to each of the test instruments. The CDMA receivers will communicate
with each other to establish synchronization. The GPS receivers will establish
synchronization by using the common signal from the GPS satellite.
Connecting the CDMA Receiver
Figure 26 illustrates each of the required connections for a CDMA receiver
connected to a MTS6000 or MTS8000v2. Connection to a MTS8000v1 is
accomplished by connecting the RJ-45 to DB9 adapter directly into the instrument (no USB).
Figure 26 CDMA connection for one way delay measurements
To connect a CDMA receiver to your instrument
1 Verify that power on your instrument is OFF.
2 Connect the ToD signal between the CDMA receiver and the MST6000 or
MST8000.
a Connect one end of the Ethernet cable to the serial RJ-45 port of the
CDMA receiver.
b Connect the other end of the Ethernet cable to the RJ-45 to DB9
adapter.
c Connect the other end of the cable to the instrument:
– If using a DMC in an 8000v1 base unit, connect the DB9 adapter to the
instrument.
– If using a DMC with a 6000A or 8000v2 base unit, do the following:
i. Connect the DB9 end of the RJ-45 to DB9 adapter to the DB9 to USB
cable.
ii. Connect the USB end of the DB9 to USB cable to a USB port on your
instrument.
Ethernet, IP, TCP/UDP, Fibre Chan., VoIP, and Video Testing Manual 109
Chapter 4 Ethernet and IP Testing
Measuring one way delay
3 Verify that your instrument is synchronized with GPS time by checking the
CDMA Sync and 1PPS Sync LEDs. When synchronized, the LEDs will be
illuminated.
4 Repeat step 1 through step 3 on the second instrument.
The receivers are connected to your instruments, and the instruments are
synchronized with GPS time.
Connecting the GPS receiver
The GPS receiver provides a Time of Day (ToD) and a 1PPS signal which are
used to generate accurate time stamps that are encoded into the data transmitted between the local and remote instruments.
To connect the GPS receiver to your instrument
1 Verify that power on your instrument is OFF.
2 Connect the 1PPS signal between the GPS receiver and the instrument.
– If you are connecting to a MSAM v1, connect the BNC to BNC cable
from “OUT B” on the GPS receiver to the J-Bullet attenuator, and then
connect the J-Bullet attenuator to the “EXT REF” connector on your
instrument (see Figure 27 on page 110, Figure 28 on page 111, or
Figure 29 on page 111).
– If you are connecting to a MSAMv2, connect the BNC to SMA cable
from “OUT B” on the GPS receiver to the “EXT REF” connector on your
instrument (see Figure 30 on page 112, Figure 31 on page 112, or
Figure 32 on page 112).
Optional. Connect the DB9 to USB serial cable from the Control Port on
the GPS receiver to a PC.
Figure 27 GPS Connection Diagram- MSAMv1 w/ MTS6000A
110
Ethernet, IP, TCP/UDP, Fibre Chan., VoIP, and Video Testing Manual
Chapter 4 Ethernet and IP Testing
Measuring one way delay
Figure 28 GPS Connection Diagram - MSAM v1 in MTS8000v1
Figure 29 GPS Connection Diagram - MSAM v1 in MTS8000v2
3 Connect the ToD signal between the GPS receiver and the T-BERD ⁄ MTS
6000A or T-BERD ⁄ MTS 8000.
– For an 8000v1, connect the DB9-DB9 cable from the “Time Port” on the
GPS receiver to the DB9 connector on the T-BERD ⁄ MTS 8000 (see
Figure 28 on page 111 or Figure 31 on page 112).
– For a 6000A or 8000v2, connect the DB9 to USB cable from the “Time
Port” on the GPS receiver to the USB port on the 6000A or 8000 (see
Figure 27 on page 110, Figure 29 on page 111, Figure 30 on page 112,
or Figure 32 on page 112).
Ethernet, IP, TCP/UDP, Fibre Chan., VoIP, and Video Testing Manual 111
Chapter 4 Ethernet and IP Testing
Measuring one way delay
Figure 30 GPS Connection Diagram - MSAMv2 w/ MTS6000A
Figure 31 GPS Connection Diagram - MSAM v2 in MTS8000v1
Figure 32 GPS Connection Diagram - MSAM v2 in MTS8000v2
112
Ethernet, IP, TCP/UDP, Fibre Chan., VoIP, and Video Testing Manual
Chapter 4 Ethernet and IP Testing
Measuring one way delay
4 Repeat step 1through step on the second instrument.
5 Power ON the instrument and verify that it is synchronized with GPS time
by checking the GPS Sync and 1 PPS Sync LEDs. When synchronized,
the LEDs will be illuminated.
The 1PPS minimum pulse width that can be detected is 20uS.
The GPS receivers are now connected for OWD testing.
Step 2: Measuring one way
delay
Two synchronized instruments are required to measure one way delay. On
both instruments, you select a traffic application for the line rate of the circuit
you are testing, and you configure the traffic to carry an Acterna payload. This
payload carries frames with time stamps, enabling the receiving instrument to
calculate the delay.
To measure one way delay
1 On each instrument, use the Test Menu to do one of the following:
– Select the layer 2 or layer 3 traffic terminate test application for the
interface you are testing (refer to Table 6 on page 25 through Table 7
on page 25 for a list of applications).
2 On each instrument, select the Setup soft key, and then do the following:
a If you selected a layer 2 traffic application, select the Ethernet setup
tab, or if you selected a layer 3 traffic application, select the IP setup
tab.
b Select the Data field to specify that transmitted frames will carry an
Acterna payload. The payload can be populated with a BERT pattern or
Fill Byte pattern.
c Select the Interface tab, and then on the CDMA/GPS Receiver tab, do
the following:
– Enable the CDMA or GPS receiver.
– If using a CDMA receiver, choose a Channel Set. The selections the
vary based on which CDMA receiver is being used.
3 If you need to specify other settings for the test, select the appropriate tab;
otherwise, press Results to return to the Main screen.
4 Connect the instruments to the circuit. For details, refer to the Getting
Started manual that shipped with your instrument or upgrade.
5 If you are testing an optical interface, select the Laser button.
6 Select the Restart button.
7 Verify that the green Signal Present, Sync Acquired, and Link Active LEDs
are illuminated on each instrument.
8 At a minimum, observe the one way delay test results in the Ethernet L2
Link Stats or L3 Link Stats category and the L2 Filter Stats or L3 Filter Stats
category. CDMA/GPS Receiver results are also available for review.
You have measured one way delay.
Ethernet, IP, TCP/UDP, Fibre Chan., VoIP, and Video Testing Manual 113
Chapter 4 Ethernet and IP Testing
Measuring service disruption time
Measuring service disruption time
You can use two instruments in an end-to-end configuration to measure the
service disruption (SD) time resulting from a switch in service to a protect line.
The traffic originating unit must transmit a constant rate of traffic to obtain accurate measurements.
By default, all units stop Tx traffic when they detect a break in the Rx link. This
means that recorded Service Disruption times will include the time that the Rx
line was down plus the time needed to restart traffic and auto-negotiate (if
enabled).
With some optical applications (100M, 1G and 10G LAN), configured with full
duplex communication, it is possible to decouple the Rx line from the Tx line
and prevent this condition from occurring, thus achieving a much more accurate Service Disruption measurement. If the unit is capable of decoupling there
will be an active Decouple Tx/Rx option next to the Reset Service Disruption
Test button on the Actions panel at the bottom of the main screen.
NOTE:
Decoupling the Tx and Rx links is only applicable to the Service Disruption
measurement on Ethernet interfaces (except L4 TCP Wirespeed). In order
for the decoupling to occur, the circuit must support ethernet service disruption.
Take decoupled SD measurements exclusive of other measurements as
the decoupling has varying affects on other measurements.
Disable the decoupling before making any other measurements or analysis.
When using the 400G/100G module, the CFP FIFO reset is bypassed to get
more accurate measurements in decouple mode. (More details in “Optics
Expert Mode” in the Getting Started Guide.)
To measure service disruption time
1 Using the Test Menu, do one of the following:
– If you are using two Transport Modules, on both units, use the Test
Menu to select the layer 2 or layer 3 traffic terminate test application for
the interface you are testing (refer to Table 6 on page 25 through
Table 7 on page 25 for a list of applications).
2 Configure the traffic originating unit to transmit a constant load of traffic. If
you are using a Transport Module to generate traffic, the load is configured
on the Traffic setup tab. For instructions on configuring a constant load of
traffic to transmit to another instrument, see “Transmitting a constant load”
on page 60.
3 If you are using a Transport Module or Transport Module to originate
traffic, and you need to specify other settings for the test, select the appropriate tab; otherwise, press Results to return to the Main screen.
4 Connect the near and far end units to the circuit under test. When
connecting Transport Modules to the circuit, blinking LEDs on the
connector panels indicate which connectors to use for your test.
5 If you are testing on an optical circuit, on the traffic originating unit, select
the Laser button.
6 On the instruments, verify that the green Signal Present, Sync Acquired,
and Link Active LEDs are illuminated.
114
Ethernet, IP, TCP/UDP, Fibre Chan., VoIP, and Video Testing Manual
Chapter 4 Ethernet and IP Testing
OAM service and link layer testing
7 On the traffic originating unit, do the following:
a Start traffic.
b If you are using a Transport Module or Transport Module to transmit
traffic, clear the service disruption time by selecting the Reset Service
Disruption Test button on the Main screen.
c If desired, Enable Decouple Tx and RX.
The coupling selection is only available if testing full duplex 100M, 1G, or
10G LAN optical circuits, or on 40G/100G module in OTU4 Ethernet Client
and Line Rate Ethernet.
8 Initiate the switch to the protect line.
9 Observe the service disruption result in the Ethernet L2 Link Stats result
category.
You have measured service disruption time.
OAM service and link layer testing
You can position the instrument at various endpoints in a Maintenance Domain
(MD) or Maintenance Association (MA) area to verify that no trunk problems
occur per ITU-T Rec. Y.1731 and IEEE 802.1ag.
You can also use the instrument to verify point-to-point link layer performance
per IEEE 802.3ah. You can observe results associated with your test in the
OAM result category. For details, refer to “Ethernet OAM Service OAM results”
on page 359 of Chapter 13 “Test Results”.
Service layer features
When using your instrument for service layer OAM testing, you can do the
following:
– Specify the Maintenance Domain (MD) level, Maintenance Entity Group
(MEG) End Point IDs, and Maintenance Association (MA) IDs.
– Specify the Continuity Check Message (CCM) transmission rate (nonMPLS).
– Specify the CCM and LBM Multicast address when running
non-MAC-in-MAC applications.
– Choose from a variety of defect and continuity detection options -Continuity Verification (CV), Fast Failure Detection (FFD), Backward Defect
Indication (BDI) and Forward Defect Indication (FDI)- for MPL S applications.
– Specify thresholds for declaring a loss of continuity (LOC) if the number of
consecutive missing CCM exceeds the number of messages expected
within the calculated interval. This state may be used by Maintenance End
Point devices to initiate a switch to a protect line.
NOTE: Service OAM testing is not applicable with 40G/100G Transport
Module.
Ethernet, IP, TCP/UDP, Fibre Chan., VoIP, and Video Testing Manual 115
Chapter 4 Ethernet and IP Testing
OAM service and link layer testing
– Fast OAM “heartbeat” messages (CCM/FFD) for
– Y.1731 (OAM for Ethernet)
– G.8114/G.8113.1 (OAM for T-MPLS)
– Y.1711 (OAM for MPLS)
– MEP Discovery – identifies various EVCs (Ethernet Virtual Circuits), such
as a VLAN or Q-in-Q in the network, to verify that the correct MEPs are in
the correct MD (maintenance domain) level and within the correct EVC.
Link layer features
When using your instrument for link layer OAM testing, you can do the
following:
– Identify a discovered OAM as a peer, matching all setups to its detected
capabilities.
– Indicate whether you want the instrument to serve in an active or passive
role.
– Specify the Vendor OUI (Organizationally Unique Identifier) for the instrument.
– Indicate whether the instrument will advertise that it provides unidirectional
support for failure detection, remote loopback, link events, and variable
retrieval.
– Indicate whether you want the instrument to generate link faults, dying
gasps, and critical events.
– Indicate whether you want the instrument to issue a remote loopback
command to place its peer in loopback mode if the instrument is in active
mode and its peer is capable of remote loopbacks.
NOTE: Link layer OAM testing is not applicable with 40G/100G Transport
Module.
Specifying OAM settings
OAM settings are specified for the traffic originating instrument on the OAM
setup tab when configuring Layer 2 Traffic tests in Terminate mode.
To specify OAM settings
1 If you haven’t already done so, use the Test Menu to select the
Layer 2 Traffic test application for the interface you are testing. Refer to
Table 6 on page 25 for a list of layer 2 applications.
2 Select the Setup soft key, and then select the Interface tab to specify
settings that control the Ethernet interface (see “Specifying interface
settings” on page 42).
3 Specify the settings that characterize the transmitted traffic (see “Specifying Ethernet frame settings” on page 45), and then specify the filter
settings (see “Specifying Ethernet filter settings” on page 51).
4 Select the OAM tab. The pane on the left of the tab groups the link settings
(L-OAM) and service settings (S-OAM).
5 To specify link OAM settings, do the following:
116
Ethernet, IP, TCP/UDP, Fibre Chan., VoIP, and Video Testing Manual
Chapter 4 Ethernet and IP Testing
OAM service and link layer testing
a In the left pane, under L-OAM, select Local Config, then specify the
following settings:
Setting
Parameters
Link OAM State
If you want to enable link OAM, select
On; otherwise, select Off.
Mode
Select one of the following:
– Active. Select Active if you want the
instrument to automatically discover
and monitor the peer on the link.
– Passive. Select Passive if you want
the peer to initiate the discovery process.
Vendor OUI
Specify the Vendor OUI (Organizationally
Unique Identifier) for the instrument.
Unidirectional
Select this setting if you want to advertise
that the instrument is capable of sending
OAM PDUs when the receiving path is
non-operational.
Remote Loopback
Select this setting if the instrument supports OAM remote loopback mode.
Vendor Specific Info
Enter the value used to differentiate the
vendor’s product models or versions.
Entry of a value is optional.
Link Events
Select this setting if the instrument supports Link Event interpretation.
Variable Retrieval
Select this setting if the instrument can
send Variable Response OAM PDU.
Max PDU Size
Specify the largest OAM PDU size.
b In the left pane, under L-OAM, select Events, then specify the following
settings:
Setting
Parameters
Link Fault
Select this setting if you want to indicate
to the peer a fault has occurred.
Critical Event
Select this setting if you want to indicate
to the peer that a critical event has
occurred.
Dying Gasp
Select this setting if you want to indicate
to the peer that an unrecoverable local
failure condition has occurred.
Errored Symbol Period Event
Event Window
(total symbols)
Specify the number of symbols that can
be received in the period on the underlying physical layer.
Event Threshold
(errored symbols)
Specify the number of errored symbols in
the window specified required for an error
to be declared.
Errored Frame Event
Ethernet, IP, TCP/UDP, Fibre Chan., VoIP, and Video Testing Manual 117
Chapter 4 Ethernet and IP Testing
OAM service and link layer testing
Setting
Parameters
Event Window
(100ms intervals)
Specify the duration of the frame window
in terms of the number of 100 ms period
intervals. For example, 2 indicates that
the window spans a 200 ms period interval.
Event Threshold
(errored frames)
Specify the number of detected errored
frames required within the window specified for an error to be declared
Errored Frame Period Event
Event Window
(total frames)
Specify the duration of the window in
terms of frames.
Event Threshold
(errored frames)
Specify the number of frame errors that
must occur in the window to declare an
error.
Errored Frame Second Summary Event
Event Window
(100ms intervals)
Specify the duration of the period in terms
of the 100 ms interval.
Event Threshold
(errored sec)
Specify the number of errored frame seconds that must occur in the window to
declare an error.
6 To specify service OAM settings, do the following:
a In the left pane, under S-OAM, select CCM, and then specify the
following settings:
118
Setting
Value
Continuity Checking
Select one of the following:
– On. Select On if you intend to test for
loss of continuity (LOC).
– Off. Select Off if you do not intend to
test for loss of continuity.Go to step b.
LOC Threshold (messages)
Specify the number of messages that must
be received within the calculated interval
(see “CCM Rate”).
CCM Rate
Specify the rate at which the instrument will
transmit CCM messages.
The instrument will transmit CCM messages at the rate specified; if it does not
receive the number of messages back that
you specify as the threshold within the calculated interval (CCM Rate times LOC
Threshold (messages)), the instrument
declares a loss of continuity (LOC).
CCM Type
(non-MAC-in-MAC
applications only)
Select one of the following:
– Unicast. Select Unicast to send CCMs
to its destination address.
– Multicast. Select Multicast to send
CCMs to a reserved multicast MAC
address.
This setting does not appear when running
Mac-in-Mac applications.
Ethernet, IP, TCP/UDP, Fibre Chan., VoIP, and Video Testing Manual
Chapter 4 Ethernet and IP Testing
OAM service and link layer testing
Setting
Value
MEG End Point ID
Specify the Maintenance Entity Group End
Point ID for the instrument.
The instrument encodes the ID that you
specify in the CCMs that it sends to its
peer.
Peer MEG End Point ID
Specify the Maintenance Entity Group End
Point ID for the instrument’s peer.
The instrument uses the peer ID that you
specify to indicate whether CCMs are
detected with unexpected MEG End Point
IDs.
Maintenance Domain Level
Specify the level for the Maintenance
Domain (MD).
The instrument uses the level that you
specify to indicate whether CCMs for unexpected lower levels are detected in the traffic stream.
Specify Domain ID
Select one of the following:
– If you are testing per IEEE 802.1ag,
select Yes.
– If you are testing per ITU-T Rec.
Y.1731, select No.
Maintenance Domain ID
(Specify Domain ID must be
Yes)
If you indicated that you want to specify a
domain ID, enter the ID using up to 22
characters.
The instrument uses the ID that you specify
to indicate whether CCMs are detected
with different IDs.
Maintenance Association ID
Specify the Maintenance Association ID,
using up to 22 characters.
The instrument uses the ID that you specify
to indicate whether CCMs are detected
with different IDs.
b In the left pane, under S-OAM, select AIS, and then specify the
following settings:
Setting
Parameters
AIS State
If you want to test AIS, select On; otherwise, select Off. Go to step c.
Maintenance Domain Level
Specify the level for the Maintenance
Domain (MD).
The instrument will indicate whether AIS
for the specified level are detected in the
traffic stream.
AIS Rate
Specify the rate at which the instrument
will transmit AIS.
Ethernet, IP, TCP/UDP, Fibre Chan., VoIP, and Video Testing Manual 119
Chapter 4 Ethernet and IP Testing
OAM service and link layer testing
Setting
Parameters
AIS Type
(non MAC-in-MAC applications only)
Select one of the following:
– Unicast. Select Unicast to send AIS
to its destination address.
– Multicast. Select Multicast to send
AIS to a reserved multicast MAC
address.
This setting does not appear when running Mac-in-Mac applications.
c In the left pane, under S-OAM, select LBM/LBR, and then specify the
following settings:
Setting
Value
LBM/LBR (ping)
Select one of the following:
– On. Select On if you intend to verify
connectivity by transmitting ping messages.
– Off. Select Off if you do not intend to
verify connectivity. Go to step d.
Maintenance Domain Level
Specify the level for the Maintenance
Domain (MD).
The instrument uses the level that you
specify to indicate whether loopback replies
(LBRs) for unexpected lower levels are
detected in the traffic stream.
LBM Type
(non-MAC-in-MAC
applications only)
Select one of the following:
– Unicast. Select Unicast to send CCMs
to its destination address. Unicast is the
default setting.
– Multicast. Select Multicast to send
CCMs to a reserved multicast MAC
address.
This setting does not appear when running
MAC-in-MAC applications.
d In the left pane, under S-OAM, select LTM/LTR, and then specify the
following settings:
120
Setting
Value
LTM/LTR (trace)
Select one of the following:
– On. Select On if you intend to verify
connectivity by transmitting trace messages.
– Off. Select Off if you do not intend to
verify connectivity. Go to step 7
Maintenance Domain Level
Specify the level for the Maintenance
Domain (MD).
The instrument uses the level that you
specify to indicate whether loopback replies
(LBRs) for unexpected lower levels are
detected in the traffic stream.
Ethernet, IP, TCP/UDP, Fibre Chan., VoIP, and Video Testing Manual
Chapter 4 Ethernet and IP Testing
OAM service and link layer testing
7 Press Results to return to the Main screen.
NOTE:
Before turning the laser ON (if you are testing on an optical circuit), and
starting traffic, be certain to verify that the filter settings on the receiving
instrument match the settings for transmitted traffic on the traffic originating
unit. For example, be certain to specify the same protocol or data length for
transmitted traffic on the traffic originating unit, and filtered traffic on the
receiving unit.
8 If testing on an optical circuit, at the bottom of the main page, select the
Laser tab on the action bar then click Laser to On.
9 Select the Action tab on the action bar, and then click Start Traffic.
10 Select the OAM tab on the action bar and then click BDI and/or FDI to
begin insertion of Backward and/or Forward Defect Insertion.
The OAM settings are specified.
Turning AIS or RDI analysis
ON
If you want to analyze traffic for AIS or RDI during the course of your test, you
must turn AIS or RDI analysis ON.
To turn AIS or RDI analysis ON
1 On the Main (Results) screen, select the OAM action panel.
2 Select AIS or RDI.
AIS or RDI analysis is on, and your instrument will indicate whether AIS or
RDIs have been detected. When AIS analysis is On, pressing Restart will not
interrupt analysis; you must turn AIS analysis off to clear AIS test results.
Sending LBM or LTM
messages
If you turned LBM/LBR or LTM/LTR on when you configured the OAM settings,
you can send LBM ping messages or LTM trace messages, and then ensure
that you receive LBR or LTR messages to verify OAM connectivity.
To send an LBM or LTM message
1 On the Main screen, select the OAM action panel.
2 Select LBM or LTM.
The instrument sends an LBM or LTM, and reports the number of transmitted
LBM or LTM frames, and received LBR or LTR frames in the OAM result category.
Ethernet, IP, TCP/UDP, Fibre Chan., VoIP, and Video Testing Manual 121
Chapter 4 Ethernet and IP Testing
MAC-in-MAC testing
MAC-in-MAC testing
If you purchased the MAC-in-MAC option for your instrument, a series of
MAC-in-MAC (MiM) applications are available which allow you to transmit and
analyze unicast layer 2 Ethernet traffic carried on a PBB (Provider Backbone
Bridged) trunk. When configuring the traffic, you specify a backbone destination address (B-DA), backbone source address (B-SA), and backbone tag
(B-TAG) which designate the path for the backbone frame to the destination.You can also characterize the customer frame (carried in the backbone
frame) by specifying the frame type, I-TAG settings, encapsulation settings,
and frame size.
When analyzing MiM traffic, you can set up a filter on the receiving instrument
to observe test results for traffic sharing the same B-TAG (tag settings for the
backbone frame), I-TAG (tag settings for the customer frames), customer
frame settings such as the frame type, encapsulation values, and the pattern
carried in the customer frame payload.
Understanding MAC-in-MAC
test results
Understanding the MAC-inMAC LEDs
Configuring layer 2 MAC-inMAC tests
When the instrument is configured for MiM testing, a subset of the standard
layer 2 test results is provided for the backbone and customer frames (see
“CPRI/OBSAI test results” on page 333 of Chapter 13 “Test Results”). When
observing results for the backbone frames, B-TAG and I-TAG information is
also provided.
In addition to the standard LEDs provided for layer 2 Ethernet testing, a
PBB Frame Detect LED is available which indicates whether the unit has
detected MiM traffic on the circuit.
Before transmitting or analyzing traffic on a PBB trunk, you must select the
appropriate MAC-in-MAC (MiM) test application, specify interface settings,
specify frame and frame filter settings, and then configure the traffic load.
Instructions are provided in this section for the following:
– “Specifying interface settings” on page 122
– “Specifying Ethernet frame settings” on page 122
– “Specifying Ethernet filter settings for MiM traffic” on page 125
– “Specifying traffic load settings” on page 127
Specifying interface settings
Before you transmit layer 2 MiM traffic, you can specify interface settings that
provide the speed and duplex settings for 10/100/1000 Ethernet traffic, indicate
how you want the unit to handle flow control, provide the pause quanta for
transmitted pause frames, and identify all traffic originating from your particular
Transport Module.
For detailed instructions on specifying these settings, refer to “Specifying interface settings” on page 42.
Specifying Ethernet frame settings
122
Before you transmit layer 2 Ethernet traffic over a PBB trunk, you can specify
the frame characteristics of the traffic, such as the backbone source address,
destination address, tag settings, and payload (Acterna test frames or BER
patterns).
Ethernet, IP, TCP/UDP, Fibre Chan., VoIP, and Video Testing Manual
Chapter 4 Ethernet and IP Testing
MAC-in-MAC testing
To specify Ethernet frame settings
1 If you haven’t already done so, use the Test Menu to select the test application for the interface you are testing. Refer to Table 7 on page 25 for a
list of MiM applications.
2 Select the Setup soft key, and then select the Ethernet tab. A graphical
display of a MiM frame appears.
Figure 33 Backbone frame (MiM Traffic application)
3 In Frame Size (Bytes), select one of the seven IEEE recommended frame
lengths, Random (to transmit frames of randomly generated sizes based
on the seven RFC 2544 frame length recommendations), or enter a
specific Jumbo, Undersized, or User Defined frame length.
If you selected Random or EMIX, use the Configure button to specify
user-defined random frame sizes, including Jumbo, or select Reset to
transmit frames of randomly generated sizes based on the seven RFC
2544 frame length recommendations. EMIX also adds the EMIX Cycle
Length field that controls how many frame entries are sent, in order, before
cycling back to the first frame entry and repeating. To define the number of
frame entries, enter a number between 1 and 8.
NOTE:
Undersized is available in the Frame Size menu if the TX payload is something other than Acterna with BERT payload.
4 Use the graphical display of a backbone frame (illustrated in Figure 33 on
page 123) to specify the following:
Frame Label
Setting
Value
B-DA
Destination MAC
Enter the destination address using a
6 byte hexadecimal format.
B-SA
Source Type
Select Factory Default or
User Defined.
User MAC
If you specified User Defined, enter
the source MAC address using a 6
byte hexadecimal format.
B-Tag VLAN ID
Enter the ID for the backbone VLAN
B-TAG
used as the path to the destination.
B-Tag Priority
Enter the priority code point (PCP) ID
representing the type of service the
transmitted traffic is emulating.
B-Tag DEI BIT
Indicate whether the traffic is drop eligible by setting the DEI bit for the
transmitted traffic.
Ethernet, IP, TCP/UDP, Fibre Chan., VoIP, and Video Testing Manual 123
Chapter 4 Ethernet and IP Testing
MAC-in-MAC testing
Frame Label
Setting
Value
I-TAG
I-Tag Priority
Enter the priority code point (PCP) ID
representing the type of service the
transmitted traffic is emulating.
I-Tag DEI Bit
Indicate whether the traffic is drop eligible by setting the DEI bit for the
transmitted traffic.
I-Tag UCA Bit
Indicate whether you want to use the
customer address by setting the bit.
I-Tag Service ID
Specify the backbone service instance
ID for the traffic.
5 On the backbone frame graphic, select Data, and then specify the settings
that characterize the customer frame (illustrated in Figure 34 on
page 124).
Figure 34 Customer Frame (MiM Traffic application)
6 On the customer frame graphic, select Data, and then specify one of the
following for the Tx Payload:
– Acterna. To transmit frames that contain a sequence number and time
stamp so that lost frames, round trip delay, and jitter can be calculated,
select Acterna.
If you are measuring round trip delay on a 10 Gigabit circuit, in RTD
Setup, indicate whether you want to measure delay with a high degree
of precision, or a low degree of precision. In most instances, you should
select High Precision - Low Delay.
NOTE: You must select an Acterna payload to measure round trip delay
and count lost packets.
– BERT. To transmit frames with payloads filled with the BERT pattern
you specify, select BERT, and then select a pattern.
- Various pseudo-random and Fixed patterns are available. The
Pseudo-random patterns continue from one frame into the next. The
fixed patterns restart each frame, such that the frame will always start
with the beginning of the pattern.
124
Ethernet, IP, TCP/UDP, Fibre Chan., VoIP, and Video Testing Manual
Chapter 4 Ethernet and IP Testing
MAC-in-MAC testing
- If you set the BERT Pattern to User Defined, in the User Pattern field,
specify the 32 bit fixed pattern that will be repeated in the payload.
NOTE:
The Transport Module transmits the bytes in user defined patterns from left
to right; the FST-2802 transmits the bytes in user defined patterns right to
left.
For example, a user defined hexadecimal pattern of 12345678 populates
the frame as: 12345678.Using the same hexadecimal pattern, the FST-2802
would populate the frame as 78563412.
7 If you need to specify other settings for the test, select the appropriate tab;
otherwise, press Results to return to the Main screen.
The transmitted frame settings are specified.
Specifying Ethernet filter settings
for MiM traffic
Before transmitting or monitoring layer 2 traffic on a MiM trunk, you can specify
settings that indicate the expected received payload and determine which
backbone frames will pass through the receive filter and be counted in the test
result categories for filtered layer 2 traffic. The settings may also impact other
results.
If you want to observe results for the Customer Link (counts or statistics),
ensure that the B-TAG and I-TAG filter settings, and the Customer filter settings
match those carried in the analyzed traffic.
NOTE:
During layer 2 BER testing, incoming frames must pass the filter to be analyzed for a BERT pattern. Local loopback is also only performed on frames
that pass the filter. Use the filter when analyzing BERT frames and non-test
frames are present.
To specify Ethernet filter frame settings
1 If you haven’t already done so, use the Test Menu to select the test application for the interface you are testing. Refer to Table 7 on page 25 for a
list of MiM applications.
2 Select the Setup soft key, and then select the Ethernet Filter tab.
Ethernet, IP, TCP/UDP, Fibre Chan., VoIP, and Video Testing Manual 125
Chapter 4 Ethernet and IP Testing
MAC-in-MAC testing
3 Specify the settings required to filter received traffic for analysis:
Frame Label
Setting
Value
B-TAG
B-Tag VLAN ID
Filter
If you don’t want to filter traffic for a
specific VLAN, select Don’t Care; otherwise, select Specify Value.
B-Tag VLAN ID
Enter the ID for the backbone VLAN
used as the path to the destination.
This setting only appears if B-Tag
VLAN ID Filter is set to Specify Value.
I-TAG
126
B-Tag Priority
Enter the priority code point (PCP) ID
representing the type of service the filtered traffic is emulating, or select
Don’t Care.
B-Tag DEI BIT
Indicate whether the filtered traffic is
drop eligible by setting the DEI bit for
the traffic, or select Don’t Care.
I-Tag Priority
Enter the priority code point (PCP) ID
representing the type of service the filtered traffic is emulating, or select
Don’t Care.
I-Tag DEI Bit
Indicate whether the filtered traffic is
drop eligible by setting the DEI bit for
the traffic, or select Don’t Care.
I-Tag UCA Bit
Indicate whether the filtered traffic
uses the customer address by setting
the bit, or select Don’t Care.
I-Tag Service ID
Filter
Specify the backbone service instance
ID carried in the filtered traffic by
selecting Specify Value, or select
Don’t Care.
I-Tag Service ID
If you set the I-Tag Service ID Filter to
Specify Value, specify the service
instance ID carried in the filtered traffic.
This setting only appears if I-Tag Service ID Filter is set to Specify Value.
Ethernet, IP, TCP/UDP, Fibre Chan., VoIP, and Video Testing Manual
Chapter 4 Ethernet and IP Testing
MAC-in-MAC testing
4 Select the Data field on the illustration of the backbone frame, and then
specify the following for the customer frame:
Setting
Value
Encapsulation
Select one of the following:
– None. To analyze unencapsulated traffic, select
None.
– VLAN. To analyze VLAN tagged traffic, select
VLAN, and then select the VLAN field on the illustration of the customer frame to specify the ID and priority.
– Q-in-Q.To analyze Q-in-Q tagged traffic, select
Q-in-Q, and then select the SVLAN field on the illustration of the customer frame to specify the SVLAN
settings, and the VLAN field to specify the VLAN ID
and priority.
– Don’t Care. To analyze all customer frames irrespective of encapsulation, select Don’t Care.
For details on the VLAN or Q-in-Q filter settings, refer to
“Specifying Ethernet filter settings” on page 51.
Frame Type
Select one of the following:
– DIX
– 802.3
5 Select the Data field on the illustration of the customer frame, and then do
one of the following:
– If you want the module to monitor and analyze live Ethernet traffic by
suppressing lost frames (LF) or BERT errors in their associated result
counts and as triggers for LEDs during payload analysis, turn Payload
Analysis Off.
– If you want to filter traffic for a particular pattern, turn Payload Analysis
On, and then specify the BERT pattern.
6 If you need to specify other settings for the test, select the appropriate tab;
otherwise, press Results to return to the Main screen.
The received frame settings are specified.
Specifying OAM settings
You can position the instrument at various endpoints in a Maintenance Domain
(MD) or Maintenance Association (MA) area to verify that no OAM trunk problems occur. For details, refer to “OAM service and link layer testing” on
page 115
Specifying traffic load settings
Before transmitting layer 2 traffic over a MiM trunk, you can specify the type of
traffic load the unit will transmit (Constant, Burst, Ramp or Flood). The settings
vary depending on the type of load.
When configuring a load, you can specify the bandwidth of the transmitted
traffic in 0.001% increments for 1 Gigabit or 10 Gigabit circuits, or 0.01% increments for 10/100/1000 Mbps electrical or 100 Mbps optical circuits.
For an overview of the available traffic loads, see “Specifying traffic load
settings” on page 60.
Ethernet, IP, TCP/UDP, Fibre Chan., VoIP, and Video Testing Manual 127
Chapter 4 Ethernet and IP Testing
MAC-in-MAC testing
Transmitting layer 2 MiM
traffic
Before you transmit layer 2 traffic over a MiM trunk, you must specify:
– Interface settings (see “Specifying interface settings” on page 42).
– Frame characteristics of the transmitted traffic (see “Specifying Ethernet
frame settings” on page 122).
– Frame characteristics used to filter received traffic (see “Specifying
Ethernet filter settings for MiM traffic” on page 125).
– Traffic load settings (see “Specifying traffic load settings” on page 127).
After you specify the layer 2 settings, you are ready to transmit and analyze the
traffic.
To transmit and analyze layer 2 traffic
1 If you haven’t already done so, use the Test Menu to select the MiM terminate test application for the interface you are testing.
2 Select the Setup soft key, and then select the Interface tab to specify
settings that control the Ethernet interface (see “Specifying interface
settings” on page 42).
3 Select the Ethernet tab to specify settings that define the frame characteristics of the transmitted traffic (see “Specifying Ethernet frame settings” on
page 122).
4 Select the Ethernet Filter tab to specify settings that filter the received
traffic based on specified frame characteristics (see “Specifying Ethernet
filter settings for MiM traffic” on page 125).
5 Select the Traffic tab to specify the type of load the unit will transmit (see
“Specifying traffic load settings” on page 127).
6 Press Results to return to the Main screen.
7 Connect the module to the circuit.
8 If you are testing an optical interface, select the Laser button.
9 Select Start Traffic to transmit traffic over the circuit.
10 Verify that the green Signal Present, Sync Acquired, Link Active, and
PBB Frame Detect LEDs are illuminated.
11 At a minimum, observe the test results in the Summary Status result category.
You have analyzed layer 2 MiM traffic.
Inserting errors or pause
frames
Action buttons on the Main screen allow you to insert errors and pause frames
into the traffic stream. If you turn on a particular error insertion rate, the error
insertion continues even after you restart a test or change the test configuration.
For detailed instructions on error and pause frame insertion, see “Inserting
errors or pause frames” on page 103.
128
Ethernet, IP, TCP/UDP, Fibre Chan., VoIP, and Video Testing Manual
Chapter 4 Ethernet and IP Testing
Synchronous Ethernet testing
Measuring round trip delay
and packet jitter
You can measure round trip delay and packet jitter by transmitting traffic
carrying an Acterna payload. Frames with an Acterna payload provide time
stamps, enabling the unit to calculate the delay and jitter. For instructions on
looping back a unit, see Chapter 8 “Loopback Testing”.
For detailed instructions, see “Measuring round trip delay or packet jitter” on
page 105.
Measuring service disruption
time
You can use two units in an end-to-end configuration to measure the service
disruption time resulting from a switch in service to a protect line. The traffic
originating unit must transmit a constant rate of traffic to obtain accurate
measurements.
For detailed instructions, see “Measuring service disruption time” on page 114.
Monitoring layer 2 MiM traffic
Use the MiM Traffic Monitor/Through application whenever you want to
analyze received traffic. When you configure your test, you can specify settings
that indicate the expected received payload and determine which frames will
pass through the receive filter and be counted in the test result categories for
filtered layer 2 traffic. The settings may also impact other results.
NOTE:
If you are testing from an optical interface, you must turn the laser on using
the associated button to pass the signal through the unit’s transmitter.
For detailed instructions, see “Monitoring layer 2 traffic” on page 66.
Synchronous Ethernet testing
Synchronous Ethernet (Sync-E) is the ability to provide frequency distribution
through an Ethernet port. Physical layer timing transport is required to guarantee frequency distribution to the extent necessary for encapsulated signals
to meet network performance requirements. Although other methods may be
used for this purpose, physical layer Sync-E provides the best technical option
for guaranteed frequency accuracy and stability because it is impervious to the
effects of traffic load. On a Sync-E network, each node in the network recovers
the clock.
To test Sync-E
1 If you haven’t already done so, use the Test Menu to select the test application for the interface you are testing. Refer to Table 6 on page 25
through Table 7 on page 25 for a list of layer 2 and layer 3 applications.
Table 15 on page 148 lists layer 4 applications.
2 Press the Setup soft key, and then select the Interface tab.
3 On the Physical Layer tab, check the box beside Enable Synchronous
Ethernet. This specifies whether SSM messages are decoded and SSM
statistics are collected.
4 Connect the instrument to the circuit.
5 Select the Laser button to turn on the laser.
Ethernet, IP, TCP/UDP, Fibre Chan., VoIP, and Video Testing Manual 129
Chapter 4 Ethernet and IP Testing
Transmitting and analyzing PTP/1588 traffic
6 Select Start Traffic to transmit traffic over the circuit.
7 Use the Actions buttons to add positive or negative frequency offset on
the transmit line frequency. It should appear in the Rx Freq Deviation result
on the far end, in the Interface category.
8 Observe the test results in the Signal category (in the Interface group) and
the Sync Status Messages category (in the Ethernet group). For details,
see “Interface results” on page 344 and “Sync Status Messages” on
page 375 of Chapter 13 “Test Results”.
You have tested Synchronous Ethernet.
Transmitting and analyzing PTP/1588 traffic
You can use the instrument during turn-up or installation of PTP links or troubleshooting an active link. Features include the following:
– Verify that the link can support PTP
– Verify that the PTP Master is reachable and can be communicated with
– Verify that PTP timing messages are received
– Provide packet delay variation (PDV) measurements
– Load network background traffic stream simultaneously with PTP session
to see effect network traffic has on PTP
– Connect an optional GPS as timing source
– Capability to measure master-to-slave and slave-to-master delay
About PTP
Due to growing wireless traffic volume, 3G and 4G networks are being
deployed. In order to ensure accuracy and that inter-cell handoffs are manageable, every base transmission station in the network needs to be able to trace
its frequency synchronization back to a primary reference clock. Without
synchronization, the mobile devices lose lock which can adversely affect voice
and data services or result in dropped calls.
Precision time protocol (PTP) is an industry-standard protocol that enables the
precise transfer of frequency and time to synchronize clocks over packetbased Ethernet networks.It is based on IEEE 1588. The PTP protocol specifies
master and slave clocks. It synchronizes the PTP local slave clock on each
PTP network device with a PTP system Grandmaster clock. PTP distributes
the timing at layer 2 or 4 using timestamps embedded within an Ethernet frame
or IP/UDP packet; thus, PTP can be transported over native Ethernet or any
transport that supports IP/UDP.
The Multiple Services Application Module can be configured as either a slave
or a master unit in a PTP system. When configured as a master, the internal
oscillator is used as the system clock to which all other units are synced. The
measurement of the relative stability of this system is the Packet Delay Variation (PDV).
GPS as Time Source
130
In those systems where the PDV results indicate the need for greater stability,
an option is available that utilizes a GPS Time of Day (ToD) and 1PPS signals
to generate the timestamps and provide reference to a Grandmaster clock.
Ethernet, IP, TCP/UDP, Fibre Chan., VoIP, and Video Testing Manual
Chapter 4 Ethernet and IP Testing
Transmitting and analyzing PTP/1588 traffic
Connecting the GPS
The optional GPS receiver supplies the 1PPS and the ToD signal for use in
generating PTP timestamps. Different generations of these instruments utilize
different connections for these signals. These connections are identical to
those used for OWD (except for the CDMA connections). Refer to Figure 27
through Figure 32.
Before beginning the test, verify that the GPS receiver and instrument are
synchronized and ready.
a Verify that the appropriate LEDs on the GPS receiver are flashing or
steadily on (refer to the instructions included with the GPS receiver).
b Verify that the TOD Sync and 1PPS LEDs on the instrument are on.
To ensure maximum accuracy and stability, follow the guidelines regarding
preparation time and hold-over stability included in the documentation shipped
with the GPS receiver.
Configuring GPS as Source
After the GPS receiver is connected to the instrument, the instrument does not
automatically switch to the GPS as time source. The instrument must be
configured to use the GPS as the time source. If sync to the GPS is lost at any
time though, the instrument will automatically switch to the internal oscillator as
the PTP time source and an event will be recorded in the log.
To select GPS as time source
1 If you haven’t already done so, use the Test Menu to select the PTP/1588
application for the interface you are testing. Refer to Table 9 on page 26
for a list of applications.
2 On the instrument, select the Setup soft key.
3 Select the Interface tab, and then on the CDMA/GPS Receiver tab, select
the Enable CDMA or GPS receiver check box.
The GPS receiver has been selected as the time source.
Analyzing PTP traffic
You can use the instrument to send and receive traffic to troubleshoot a PTP
link.
To transmit and analyze PTP traffic
1 If you haven’t already done so, use the Test Menu to select the PTP/1588
application for the interface you are testing. Refer to Table 9 on page 26
for a list of applications.
2 Select the Setup soft key, and then select the PTP tab.
3 Specify the settings:
Setting
Description
Mode
Specifies master or slave mode.
Address Mode
In Slave mode, specifies the type of message: unicast or multicast.
Multicast: PTP message (announce, sync and
delay request) rates configured on Master.
Unicast: PTP message rates configured on Slave.
Ethernet, IP, TCP/UDP, Fibre Chan., VoIP, and Video Testing Manual 131
Chapter 4 Ethernet and IP Testing
Transmitting and analyzing PTP/1588 traffic
132
Setting
Description
Domain
Specifies the domain number that is using PTP.
The domain is a logical grouping of clocks that
synchronize to each other using PTP.
Sync Type
In Master mode, indicates that the synchronization
type is two step.
Master IP Address
If testing layer 4 streams in slave mode, and the
address mode is unicast, enter the IP destination
address of the master.
Master MAC Address
If testing layer 2 streams in slave mode, and the
address mode is unicast, enter the MAC destination address of the master.
Encapsulation
Specify the encapsulation: VLAN or None.
VLAN ID and Priority
If Encapsulation is set to VLAN, specify the ID and
priority for the VLAN.
TOS Type
If testing layer 4 streams, specify the TOS type:
TOS or DSCP.
TOS
If TOS type is TOS, specify the TOS code.
DSCP
If TOS type is DSCP, specify the DSCP code.
DSCP values are shown as code points with their
decimal values following in ( ). For example,
EF(46).
Announce Rx Timeout
If in Slave mode, specify the amount of time that
has to pass without receipt of an announce message to trigger a Timeout event.
Announce
Specify the announce message rate - the rate at
which announce messages are transmitted.
NOTE: When using multicast address mode, the
announce rate must match for the Master and
Slave. Although the Master controls the rate, the
Slave must use the same rate, otherwise timeouts
occur.
Sync
Specify the sync message rate - the rate at which
sync messages are transmitted.
Delay Request
Specify the delay request message rate - the rate
at which delay request messages are transmitted.
Query
If testing in the Slave mode and using unicast
address mode, specifies the rate at which unicast
messages are transmitted.
Lease Duration
If testing in the Slave mode and using unicast
address mode, specifies the unicast lease duration, in seconds.
Priority 1
In Master mode, specify the priority 1 value - the
priority is used in the execution of the best master
clock algorithm.
Priority 2
In Master mode, specify the priority 2 value - the
priority is used in the execution of the best master
clock algorithm.
Class
Specify the clock class - the traceability of the time
and frequency distributed by the grandmaster
clock.
Ethernet, IP, TCP/UDP, Fibre Chan., VoIP, and Video Testing Manual
Chapter 4 Ethernet and IP Testing
Transmitting and analyzing PTP/1588 traffic
Setting
Description
Domain
Specifies the domain number that is using PTP.
The domain is a logical grouping of clocks that
synchronize to each other using PTP.
Sync Type
In Master mode, indicates that the synchronization
type is two step.
Master IP Address
If testing layer 4 streams in slave mode, and the
address mode is unicast, enter the IP destination
address of the master.
Master MAC Address
If testing layer 2 streams in slave mode, and the
address mode is unicast, enter the MAC destination address of the master.
Encapsulation
Specify the encapsulation: VLAN or None.
VLAN ID and Priority
If Encapsulation is set to VLAN, specify the ID and
priority for the VLAN.
TOS Type
If testing layer 4 streams, specify the TOS type:
TOS or DSCP.
TOS
If TOS type is TOS, specify the TOS code.
DSCP
If TOS type is DSCP, specify the DSCP code.
DSCP values are shown as code points with their
decimal values following in ( ). For example,
EF(46).
Announce Rx Timeout
If in Slave mode, specify the amount of time that
has to pass without receipt of an announce message to trigger a Timeout event.
Announce
Specify the announce message rate - the rate at
which announce messages are transmitted.
NOTE: When using multicast address mode, the
announce rate must match for the Master and
Slave. Although the Master controls the rate, the
Slave must use the same rate, otherwise timeouts
occur.
Sync
Specify the sync message rate - the rate at which
sync messages are transmitted.
Delay Request
Specify the delay request message rate - the rate
at which delay request messages are transmitted.
Query
If testing in the Slave mode and using unicast
address mode, specifies the rate at which unicast
messages are transmitted.
Lease Duration
If testing in the Slave mode and using unicast
address mode, specifies the unicast lease duration, in seconds.
Priority 1
In Master mode, specify the priority 1 value - the
priority is used in the execution of the best master
clock algorithm.
Priority 2
In Master mode, specify the priority 2 value - the
priority is used in the execution of the best master
clock algorithm.
Class
Specify the clock class - the traceability of the time
and frequency distributed by the grandmaster
clock.
Ethernet, IP, TCP/UDP, Fibre Chan., VoIP, and Video Testing Manual 133
Chapter 4 Ethernet and IP Testing
Discovering traffic using J-Profiler
Setting
Description
Time Source
Specify the source of time used by the grandmaster clock.
Clock Accuracy
Specify the estimated accuracy of the grandmaster clock.
4 Press Results to return to the Main screen.
If testing toward a unit that is in loopback, the stream bandwidth should be
limited to 95% (on the “All Streams” tab, using “Configure Streams”).
5 Connect the instrument to the circuit.
6 If you are testing an optical interface, select the Laser button.
If testing layer4 streams, the Stream IP destinations must complete ARP
successfully before PTP Session can be started.
7 Select the Start PTP session button.
8 Verify that the green Signal Present and Link Active LEDs are illuminated.
NOTE:
When running a PTP test, it is recommended you avoid CPU intensive
actions such as launching another application, launching Wireshark, or saving a capture. These can cause a spike in PDV stats.
9 Observe the PTP Link Stats and PTP Link Counts.
NOTE:
The PTP session will be terminated if a loop down request is received. If you
wish to save the test results, do so before looping down.
You have analyzed PTP traffic.
Discovering traffic using J-Profiler
If your instrument is optioned and configured to do so, you can use the
J-Profiler application to automatically discover and monitor up to 128 streams
of traffic that satisfy your profile criteria on 10/100/1000 electrical, 100M
optical, and 1GigE optical circuits. After discovering the streams, you can sort
them based on the bandwidth utilized by each stream to identify the top talkers
for the discovered streams. If there are less than 128 streams present on the
link, this represents the top talkers for the link. If there are more than 128
streams present on the link, this represents the top talkers for the streams
satisfying your profile criteria.
When running the J-Profiler application, standard link and filtered results are
provided in addition to the Traffic Profiler Streams results.
To discover traffic using J-Profiler
1 Use the Test Menu to select the J-Profiler test application for the interface
you are testing.
2 Select the Setup soft key, and then select the Interface tab to specify
settings that control the Ethernet interface (see “Specifying interface
settings” on page 42).
134
Ethernet, IP, TCP/UDP, Fibre Chan., VoIP, and Video Testing Manual
Chapter 4 Ethernet and IP Testing
Discovering traffic using J-Profiler
Disable J-Profiler before changing IPv6 address modes. Failure to do so
may cause the instrument to lock up.
3 If you want to discover streams sharing specific criteria (such as a particular VLAN, Source MAC address, or well-known TCP/UDP port), select
the Filter tab, then specify the settings. For details, see:
– “Specifying Ethernet filter settings” on page 51
– “Specifying IPv4 filter settings” on page 82
– “Filtering received traffic using layer 4 criteria” on page 153
Only streams that satisfy the filter criteria will be discovered and displayed.
4 Select the Profile tab. The illustration in Figure 35 appears to guide you
through the profile process:
Figure 35 J-Profiler illustration
5 Specify how the discovered (and optionally filtered) traffic will be
displayed:
– VLAN ID. Both the VLAN ID and SVLAN ID will be considered. Traffic
must contain at least one VLAN tag to be included in the profile.
– VLAN ID and Source MAC Address. Both VLAN IDs and the source
MAC address will be considered. The traffic does not need to carry a
VLAN tag to be included in the profile.
– VLAN ID, Source MAC and Destination MAC. Similar to VLAN ID and
Source MAC Address, but also considers the destination MAC
address. Use this setting if you want to observe MAC-to-MAC conversations.
– VLAN ID and Source IP Address. Both VLAN IDs and the source IP
address will be considered. The traffic does not need to carry a VLAN
tag, but it must have a source IP address to be included in the profile.
– VLAN ID and well-known (0-1023) TCP/UDP port. Both VLAN IDs and
the TCP/UDP port number will be considered. The traffic does not need
to carry a VLAN tag, but it must be TCP or UPD traffic to or from a well
known port to be included in the profile. Use this setting if you want to
see which services are running (well-known ports typically identify
services).
– MPLS Labels with VLAN ID. Both MPLS labels and VLAN IDs will be
considered. The traffic does not need to carry a VLAN tag to be
included in the profile.
– PW (Pseudowire) Labels with VLAN ID. Both MPLS labels and PW
labels along with VLAN IDs will be considered. The traffic does not
need to carry a VLAN tag to be included in the profile.
– Source IP, Destination IP, Source Port and Destination Port. All four
parameters will be considered. These parameters form the two ends of
a TCP or UDP conversation, so use this setting if you want to observe
these conversations.
6 Press Results to return to the Main screen.
Ethernet, IP, TCP/UDP, Fibre Chan., VoIP, and Video Testing Manual 135
Chapter 4 Ethernet and IP Testing
Discovering traffic using J-Profiler
7 Connect the module to the circuit.
8 If you are testing an optical interface, select the Laser button.
9 Select Start Traffic to transmit traffic over the circuit.
10 At a minimum, verify that the green Signal Present, Sync Acquired, Link
Active, and Frame Detect LEDs are illuminated.
11 At a minimum, observe the test results in the Traffic Profile group, in the
Streams category. For details, see “J-Profiler results” on page 384 of
Chapter 13 “Test Results”.
You have discovered traffic using J-Profiler.
136
Ethernet, IP, TCP/UDP, Fibre Chan., VoIP, and Video Testing Manual
Chapter 5
Wander Testing
5
This chapter provides step-by-step instructions for measuring wander on
1GigE Optical SyncE networks using the instrument. Topics discussed in this
chapter include the following:
– “About wander testing” on page 138
– “Measuring and analyzing wander” on page 138
Ethernet, IP, TCP/UDP, Fibre Chan., VoIP, and Video Testing Manual 137
Chapter 5 Wander Testing
About wander testing
About wander testing
If your MSAMv2 is configured and optioned to do so, you can use it to measure
wander on a 1GigE Optical SyncE interface. (You must have both the SyncE
and Wander options.) For details on the device and interface standards for
measuring jitter and wander on Ethernet interfaces, refer to ITU-T Recommendations O.174.
NOTE:
Wander testing is only applicable to 8000 UIMv2 and MSAMv2 or higher.
The wander option allows you to analyze system wander performance.
NOTE:
The MSAM has a maximum wander test duration of 48 days 23 hours 59
minutes and 56 seconds, but may be limited by file system storage capacity
(actual time available may be less). When running a test, you can observe
the remaining test time in the Time category of the Summary result group or
in the Wander category of the Interface result group.
For information about jitter and wander principles and specifications, refer to
the appendix “Principles of Jitter and Wander Testing” in the PDH, SONET,
SDH, NextGen, and OTN Testing Manual.
Features and capabilities
The wander measurement includes the following:
– Allows you to test and analyze the wander results in a graphical manner.
– Export the wander TIE result to be analyzed on a remote PC using the
O.172 MTIE/TDEV Offline Analysis software shipped with your unit. For
details, see “Saving and exporting wander measurement data” on
page 142.
Accessing wander test
results
When you configure your unit to measure wander, measurement results are
available in the Interface result group.
Measuring and analyzing wander
If you purchased the wander testing option, you can measure Time Interval
Error (TIE) and calculate MTIE/TDEV (Maximum Time Interval Error/Time
Deviation) to evaluate the condition of your network elements.
NOTE:
The time it takes to update the TIE data or calculate MTIE/TDEV depends
on the amount of data collected.
Measuring TIE and
calculating MTIE
138
Measuring TIE and calculating MTIE involves specifying the settings for the
test interface you selected and the Tx and Rx parameters. After the test starts,
you can observe the TIE and MTIE results in the Wander category.
Ethernet, IP, TCP/UDP, Fibre Chan., VoIP, and Video Testing Manual
Chapter 5 Wander Testing
Measuring and analyzing wander
To measure TIE and MTIE
1 Using the Test Menu, select the Ethernet>1GigE Optical>SyncE
Wander test application.
2 Selectg the Setup soft key, and then select the Wander tab.
3 Specify the wander sample rate.
4 Select the Results soft key to return to the Main screen.
5 Connect a cable from the appropriate TX connector to the network’s Rx
access connector.
6 Select the Laser button.
The button label becomes Laser On.
7 Verify the LEDs.
– Verify that the Signal Present, Sync Acquired, and Link Active LEDs
are green.
– Verify that the Wander Reference Present is green.
8 Select Restart.
9 Run the test for an appropriate length of time. To ensure accuracy of your
results, let the test run for at least one minute.
10 To view the wander results, set one of the result windows to display the
Summary group, set another results window to display the Interface group,
and then select the Wander category.
To view the wander results in a graphical format, select the Wander Graph
category. For details, see “Wander results” on page 385.
TIE and MTIE results are measured.
Analyzing wander
After you have accumulated some TIE data samples, the MSAM can do more
detailed MTIE and TDEV calculations on it using the On-board Wander Analysis tool. This provides much more detail than the results available in the Interface/Wander category.
1 To analyze wander, follow step 1 through step 10 of “Measuring TIE and
calculating MTIE”.
2 Select the Wander Analysis soft key.
The graphical wander analysis screen appears with the TIE tab selected.
Ethernet, IP, TCP/UDP, Fibre Chan., VoIP, and Video Testing Manual 139
Chapter 5 Wander Testing
Measuring and analyzing wander
NOTE:
– You can run th on-board Wander Analysis while the test is in progress,
however, if you modify the sample rate or restart the test, the wander
data collected previously will be cleared. If you want to preserve the
wander data for the previous measurement, save the data before
restarting a test. Note: the saved data cannot be loaded into the onboard Wander Analysis tool; it calculates MTIE and TDEV on all the data
accumulated so far.
– Wander analysis is restricted to the first 8.64 million samples. If your
measurement contains more samples, you must export the wander data
for offline analysis.
– Wander analysis is a memory intensive operation. Therefore, you can
only process wander data while running a single application.
For detailed information about saving and exporting wander data, see “Saving and exporting wander measurement data” on page 142.
3 Select the Update TIE Data soft key.
This refreshes the data in the Wander Analysis screen. All of the TIE
samples accumulated so far (including those gathered since the tool itself
was launched) are redrawn, and then MTIE and TDEV are recalculated.
The TIE graph appears. The Wander Analyzer automatically displays the
last block of continuous valid data.
4 To observe another block of data, select the Current Block field, type the
block number, and then select OK.
The data block you specified appears.
A block of TIE data is a contiguous subset of all TIE samples that is not
interrupted by any alarms. For Wander measurements, TIE values are
sampled at a constant rate. If an alarm occurs (e.g. LOS), the receiver is
not able to produce meaningful TIE values and stops producing TIE
entries until it is able to recover. These alarms separate the whole
measurement into sections, or “blocks”.
140
Ethernet, IP, TCP/UDP, Fibre Chan., VoIP, and Video Testing Manual
Chapter 5 Wander Testing
Measuring and analyzing wander
5 If you want to observe the frequency offset curve, clear the Remove
Offset checkbox.
6 To select the data curve to observe, under Curve Selection, do one of the
following:
– To observe both TIE and frequency offset data curves, select Both
Curves.
– To observe only the frequency offset data curve, select Offs.rem.only.
7 To refresh the graph, select the Update TIE Data soft key again.
8 To observe the MTIE/TDEV result graph, select the MTIE/TDEV tab.
The MTIE/TDEV graph screen appears.
9 Select Calculate MTIE/TDEV to start calculating MTIE and TDEV results.
The MTIE/TDEV graphs appear.
10 To customize the graph, do the following:
a To select the data curves you want to observe, use the first field to
select MTIE only, TDEV only, or MTIE+TDEV.
b To select the curve style, select the arrows to the right of the Curve
Style field, and then select Line+Dots, or Dots only.
11 If you want to select a mask to compare the data against, do the following:
a In the Mask Type field, specify a mask type.
b In the Mask field, specify a mask to compare the data to.
The mask curve appears on the result graph.
If you do not want to compare the data against a mask, in the Mask field,
select None.
12 Do one of the following:
– To stop calculating MTIE/TDEV before the calculation is complete,
select the Stop Calculation soft key.
– To refresh the graph, select Calculate MTIE/TDEV again.
– To return to the Main screen, select the Results soft key.
Ethernet, IP, TCP/UDP, Fibre Chan., VoIP, and Video Testing Manual 141
Chapter 5 Wander Testing
Measuring and analyzing wander
– To stop wander analysis and return to the Main screen, select the
Close Analysis soft key.
NOTE:
Selecting the Close Analysis soft key stops analyzing the data and clears
test results. This will discard all MTIE and TDEV results calculated inside
the Analysis tool. It will not discard the real-time MTIE results displayed in
the Interface/Wander category. To return to the Main screen without ending
the current analysis, use the Results soft key.
Saving and exporting wander
measurement data
You can save the TIE result data to a .hrd file or .chrd (compressed and
encrypted .hrd file) on the base unit’s hard drive, then export the saved file to
a USB memory key, and then do further analysis of MTIE and TDEV by loading
the file on a remote PC using an offline analysis tool, such as the PC-based
Wander Analysis application.
NOTE:
Restarting a test clears the wander history data. If you want to preserve the
wander data for the current measurement, you must export the data before
restarting a test.
To save the TIE data
1 Select the Save TIE Data soft key.
The wander data is saved into a .hrd or .chrd file in the following folder on
your unit:
../acterna/user/disk/bert/reports
The file name is automatically assigned with a TIE_ prefix followed by
date, time, test mode, and interface information as shown in the following
example:
TIE_2007-08-16T15.59.19_TermDs1WanderTieEvalMsec.hrd
The TIE data is saved.
NOTE:
The offline analysis tool TIE - MTIE/TDEV Analyzer can analyze .hrd files
only, however, the Wander Analysis tool can analyze either .hrd or .chrd
files.
If you have the TIE - MTIE/TDEV Analyzer tool but would like the Wander
Analysis tool, contact customer service. The ordering number is
BN 3061/95.98.
If you have the the Wander Analysis tool, version 3.0.0 or before, you can
upgrade to the latest version for free, using the instructions provided in the
user manual that came with the analysis tool.
To export the TIE data to a USB memory key
1 Insert a USB memory key into one of the two slots provided on the top
panel of the base unit.
2 Select the Export TIE Data soft key.
The Wander Data Files screen appears, listing the wander data files in:
../acterna/user/disk/bert/reports
142
Ethernet, IP, TCP/UDP, Fibre Chan., VoIP, and Video Testing Manual
Chapter 5 Wander Testing
Measuring and analyzing wander
3 Select the wander data file you want to export, and then press the Export
to USB soft key.
The File Export dialog box appears, indicating that the unit is copying the
selected report file to the USB memory key.
The TIE data is exported. If desired, it can now can be loaded into the PCbased Wander Analysis Tool.
Ethernet, IP, TCP/UDP, Fibre Chan., VoIP, and Video Testing Manual 143
Chapter 5 Wander Testing
Measuring and analyzing wander
144
Ethernet, IP, TCP/UDP, Fibre Chan., VoIP, and Video Testing Manual
Chapter 6
TCP/UDP Testing
6
This chapter provides step-by-step instructions for testing TCP/UDP service.
Topics discussed in this chapter include the following:
– “About TCP/UDP testing” on page 146
– “Specifying layer 2 and layer 3 settings” on page 150
– “Specifying layer 4 settings” on page 150
– “Transmitting layer 4 traffic” on page 155
– “Inserting errors or pause frames” on page 156
– “Loopback testing” on page 156
– “Running TCP Host or Wirespeed applications” on page 156
– “TrueSpeed” on page 162
Ethernet, IP, TCP/UDP, Fibre Chan., VoIP, and Video Testing Manual 145
Chapter 6 TCP/UDP Testing
About TCP/UDP testing
About TCP/UDP testing
If your instrument is configured and optioned to do so, you can use it to verify
layer 4 performance by transmitting and analyze TCP or UDP traffic, verifying
that routers are prioritizing traffic for various ports properly, and verifying that
the bandwidth allocated to a customer per their Service Level Agreement is
available. Figure 36 illustrates the Main screen when running a Layer 4 TCP/
UDP application.
Group
Test
Category
Battery
Indicator
Menu Bar
Message Bar
Quick Config
LED Panel
Actions Panel
Result Window
soft keys
Figure 36 Main screen, Layer 4 Traffic application
Features and capabilities
Features and capabilities of the instrument include the following when testing
TCP/UDP:
– Performance measurements—Layer 4 bandwidth, data loss, out of
sequence, jitter, and latency measurements are available when evaluating
layer 4 performance.
– Stateless firewall verification—You can configure and transmit TCP and
UDP traffic destined for a particular port, and then verify that the traffic
successfully passes through a stateless firewall.
– TCP connection support—The instrument can establish a TCP connection, enabling you to verify that traffic destined for a particular port can
pass through stateful devices on the network.
– Multiple stream testing—You can transmit and analyze up to ten streams
of layer 4 traffic, with each stream depicting a particular type of traffic. After
transmitting the streams, you can analyze each stream to verify that
network routing and switching devices are handling the traffic properly
(based on each stream’s priority). For details, see “Specifying layer 4
stream settings” on page 177.
146
Ethernet, IP, TCP/UDP, Fibre Chan., VoIP, and Video Testing Manual
Chapter 6 TCP/UDP Testing
About TCP/UDP testing
– Layer 4 Toolkit—When running multiple streams applications, a variety of
scripts have been provided in the Layer 4 Toolkit which allow you to determine the ideal window size, and measure throughput and latency for a
particular connection.
– Packet capture and analysis—If your instrument is configured and
optioned to do so, you can use it to capture transmitted and received data,
save it on the instrument or to an external USB key, and then either send
the data to another technician for analysis, or analyze it yourself using the
Wireshark® protocol analyzer (provided on the instrument). For details,
see “Capturing packets for analysis” on page 91.
– IPv6 support—If you purchased the IPv6 Traffic option, you can transmit
and analyze IPv6 traffic using the terminate and monitor/thru applications.
For details, see “Configuring IPv4 and IPv6 tests” on page 30.
– TCP Wirespeed throughput analysis—If your instrument is configured and
optioned to do so, you can use it to verify that your network meets or
exceeds the throughput specified in service level agreements at the TCP
layer, and optimize layer 4 throughput by testing using a variety of window
sizes. For details, see “Running the TCP Wirespeed application” on
page 161.
Understanding the graphical
user interface
When you configure your module for testing, graphical displays of TCP packets
or UDP datagrams are provided on the setup tabs for the application you
selected. You can specify characteristics for transmitted and filtered traffic by
selecting the corresponding field on the graphic, and then entering or selecting
a value. Colored fields can be edited; fields in grey can not be modified.
Figure 37 illustrates the TCP packet details for a layer 4 traffic test.
Figure 37 TCP Packet Details
For details on specifying layer 4 traffic characteristics, see “Specifying TCP/
UDP settings for transmitted traffic” on page 151.
Ethernet, IP, TCP/UDP, Fibre Chan., VoIP, and Video Testing Manual 147
Chapter 6 TCP/UDP Testing
About TCP/UDP testing
TCP/UDP test applications
If your instrument is configured and optioned to do so, the applications listed in
Table 15 are supported.
Table 15 TCP and UDP applications
Circuit
Application
Test Mode1
10/100/1000
Layer 4 Traffic
Terminate
Loopback
Layer 4 Multiple Streams
Terminate
Loopback
Layer 4 TCP Wirespeed2
Terminate
Layer 4 Traffic
Terminate
Loopback
Layer 4 Multiple Streams
Terminate
Loopback
Layer 4 Traffic
Terminate
Loopback
Layer 4 Multiple Streams
Terminate
Loopback
Layer 4 TCP Wirespeed2
Terminate
Layer 4 Traffic
Terminate
Layer 4 Multiple Streams
Terminate
Layer 4 TCP Wirespeed2
Terminate
100M Optical
1GigE Optical
10GigE LAN
1. When running loopback tests, if both units are capable of transmitting traffic, select a Terminate mode application for each unit. If the loopback unit cannot transmit traffic, place it in
Loopback mode. Loopback mode does not appear if your unit is capable of transmitting traffic.
2. IPv4 traffic only.
In addition to the single stream applications, you can also transmit and analyze
up to ten streams of layer 4 traffic using the Layer 4 Multiple Streams application, or four streams using the Layer 4 TCP Wirespeed application. When
running the Multiple Streams or Wirespeed applications, you can configure
your instrument to emulate a TCP client or server, and then use the TCP Host
to initiate a stateful TCP session with another device. For details, see “Specifying layer 4 stream settings” on page 177 and “Running the TCP Host script”
on page 185 of Chapter 7 “Triple Play and Multiple Streams Testing”.
Understanding the ATP
Listen IP and Port
Many applications (such as delay measurements, out of sequence counts, lost
frames counts, and packet jitter measurements) and multiple-stream tests
must be performed using traffic that carries an Acterna Test Packet (ATP)
payload. Each of these packets has a time stamp and a unique sequence
number which are used to calculate a variety of test results.
The instrument uses the ATP Listen IP Address and ATP Listen Port to determine whether received layer 4 traffic carries an ATP payload; therefore, it is
essential that you specify the correct ATP Listen IP Address and ATP Listen
Port on the receiving unit when you configure tests that require an ATP
payload.
148
Ethernet, IP, TCP/UDP, Fibre Chan., VoIP, and Video Testing Manual
Chapter 6 TCP/UDP Testing
About TCP/UDP testing
Figure 38 illustrates the settings required to analyze layer 4 traffic carrying an
Acterna payload when testing end-to-end.
Transport Network
UNIT A: TCP/UDP tab
Specify settings to “listen” for ATP traffic received
from Unit B
ATP Listen IP =
Destination IP Address carried in Unit B traffic
ATP Listen Port =
Destination Port carried in Unit B traffic
UNIT B: TCP/UDP tab
Specify settings to “listen” for ATP traffic received
from Unit A
ATP Listen IP =
Destination IP Address carried in Unit A traffic
ATP Listen Port =
Destination Port carried in Unit A traffic
Figure 38 ATP Listen Scenario: End-to-End testing
When initiating a loopback from the local unit (using the Loop Up command),
no ATP listen settings need to be specified for either unit (see Figure 39).
Transport Network
UNIT A: Issues “Loop Up” command
TCP/UDP tab:
ATP Listen IP and ATP Listen Port are automatically
set to Unit A’s Source IP and Source Port. You do
not need to specify “Listen” settings.
UNIT B: Loops received traffic back to Unit A
Swaps Destination IP Address and Destination Port
carried in received traffic with Unit A’s Source IP
Address and Source Port. Sends ATP traffic back to
Unit A.
Figure 39 ATP Listen Scenario: Loop Up initiated from Unit A
Ethernet, IP, TCP/UDP, Fibre Chan., VoIP, and Video Testing Manual 149
Chapter 6 TCP/UDP Testing
Specifying layer 2 and layer 3 settings
Figure 40 illustrates the settings required for Unit A when traffic is looped back
from the Unit B using the LLB action.
Transport Network
UNIT A: Sends traffic to UNIT B
TCP/UDP tab:
ATP Listen IP =
UNIT A’s Source IP Address
ATP Listen Port =
UNIT A’s Source Port
UNIT B: Placed into Loopback Mode using LLB
Swaps Destination IP Address and Destination Port
carried in received traffic with Unit A’s Source IP
Address and Source Port. Sends ATP traffic back to
Unit A.
Figure 40 ATP Listen Scenario: LLB initiated from Unit B
For details, see “Specifying TCP/UDP settings for transmitted traffic” on
page 151.
Specifying layer 2 and layer 3 settings
Before you transmit layer 4 traffic, you must first initialize the link, and specify
the appropriate layer 2 and layer 3 settings for the traffic, such as the frame
type, frame encapsulation, time to live, and type of service. After you initialize
the link and specify the layer 2 and layer 3 settings, you then specify the
required layer 4 settings before transmitting the traffic over the circuit.
For details on link initialization, see “Specifying interface settings” on page 42.
For details on specifying layer 2 and layer 3 settings, see “Layer 2 testing” on
page 42 and “Layer 3 testing” on page 75.
Specifying layer 4 settings
After initializing the link and specifying layer 2 and layer 3 settings, you specify
the layer 4 settings before transmitting traffic over the circuit. Step-by-step
instructions are provided in this section for the following:
– “Specifying TCP/UDP settings for transmitted traffic” on page 151
– “Configuring the traffic load” on page 152
– “Specifying the frame or packet length for transmitted traffic” on page 153
– “Filtering received traffic using layer 2 or layer 3 criteria” on page 153
– “Filtering received traffic using layer 4 criteria” on page 153
150
Ethernet, IP, TCP/UDP, Fibre Chan., VoIP, and Video Testing Manual
Chapter 6 TCP/UDP Testing
Specifying layer 4 settings
NOTE:
If during the course of testing you change the frame or packet length (or settings that impact the calculated length) while the unit is already transmitting
traffic, the unit resets your test results, but some residual frames or packets
of the old length may be counted because they are already in the traffic
stream.
Well known ports
A port is an endpoint to a logical connection and the way a client program specifies a specific server program on a computer in a network. Some ports, known
as well known ports, have numbers that are pre-assigned to them by the IANA
(as specified in RFC 1700). Port numbers can range from 0 to 65535, but only
ports numbers 0 through 1024 are reserved for privileged services and designated as well-known ports. This list of well-known port numbers specifies the
port used by the server process as its contact port.
When configuring layer 4 traffic, you can select from a list of well known ports,
or you can specify your own user-defined port.
Specifying TCP/UDP settings
for transmitted traffic
Before transmitting layer 4 traffic you must specify the traffic mode, source and
destination port numbers, and the type of payload carried.
Port 0 (zero) is reserved by TCP/UDP for networking; therefore, it is not available when you configure your traffic.
The following port numbers are also reserved, and should not be used during
testing.
–
53
–
3000
–
68
–
3001
–
111
–
5353
–
1022
–
8192
–
1023
If DHCP is enabled in the near-end unit, a far-end unit should not send UDP
traffic to port 68 for IPv4 and 546 for IPv6. Such UDP traffic may cause the
near-end unit to lock up.
To specify the TCP/UDP settings for transmitted traffic
1 Using the Test Menu, select the Layer 4 Traffic application for the circuit
you are testing (refer to Table 15 on page 148 for a list of applications).
2 Select the Setup soft key, and then select the TCP/UDP tab.
3 Specify the following settings:
Setting
Parameter
Traffic Mode
Indicate whether you want to transmit TCP or
UDP traffic.
Ethernet, IP, TCP/UDP, Fibre Chan., VoIP, and Video Testing Manual 151
Chapter 6 TCP/UDP Testing
Specifying layer 4 settings
Setting
Parameter
ATP Listen IP Type
–
To analyze ATP traffic carrying the source IP
address of your unit as the destination
address, select Auto Obtained.
– To analyze ATP traffic carrying a different
destination address (for example, a multicast
address), select User Defined.
Refer to “Understanding the ATP Listen IP and
Port” on page 148 for illustrations explaining the
ATP Listen settings for end-to-end and loopback
tests.
ATP Listen IP Address
(if ATP Listen IP Type is
User Defined)
Specify the destination IP address carried in the
ATP traffic that you want to analyze.
NOTE:
If your unit has been looped up by another unit,
the ATP Listen IP Address will automatically be
populated for you.
Listen Port Service Type
–
–
To analyze ATP traffic with a specific service
type, select the type. The ATP Listen Port will
automatically be assigned for you.
To analyze ATP traffic with a service type that
is not pre-defined, select User Defined.
ATP Listen Port
(if Listen Port Service
Type is User Defined)
Specify the port number carried in the ATP traffic
that you want to analyze.
Source Port
Select a a pre-defined port number, or select
User Defined to enter a different number.
Destination Port
Select a a pre-defined port number, or select
User Defined to enter a different number.
Data
Select one of the following:
– Acterna. To transmit packets that contain a
sequence number and time stamp so that lost
packets, round trip delay, and jitter can be calculated, select Acterna, and then specify the
byte value that will be used to fill the rest of
the payload using a 1 byte hexadecimal format.
– Fill Byte. To transmit packets with payloads
populated with a specific pattern of bytes,
select Fill Byte, and then specify the byte
value using a 1 byte hexadecimal format.
4 If you need to specify other settings for the test, select the appropriate tab;
otherwise, press Results to return to the Main screen.
The layer 4 settings are specified for transmitted traffic.
Configuring the traffic load
152
Before transmitting TCP or UDP traffic, you can specify the type of traffic load
the unit will transmit (Constant, Bursty, Ramp, or Flood) in 0.001% increments,
beginning at 0.001%. For details on configuring a traffic load, see “Specifying
traffic load settings” on page 60 of Chapter 4 “Ethernet and IP Testing”.
Ethernet, IP, TCP/UDP, Fibre Chan., VoIP, and Video Testing Manual
Chapter 6 TCP/UDP Testing
Specifying layer 4 settings
Specifying the frame or
packet length for transmitted
traffic
Before transmitting TCP or UDP traffic, you must indicate the frame or packet
length for each transmitted packet or datagram.
To specify the frame or packet length
1 If you haven’t already done so, use the Test Menu to select the Layer 4
Traffic application for the circuit you are testing (refer to Table 15 on
page 148 for a list of applications).
2 Select the Setup soft key, and then do the following:
a Go to the Ethernet tab.
b If you are specifying the length as a frame size, set the Length Type to
Frame Size, and then select or specify the size.
The automatically calculated packet length appears to the right of the
Length Type setting.
c If you are specifying the length as a packet length, set the Length Type
to Packet Length, and then select or specify the size.
The automatically calculated frame size appears to the right of the
Length Type setting.
The frame or packet length is specified.
Filtering received traffic
using layer 2 or layer 3
criteria
If you want to filter received traffic using layer 2 or layer 3 criteria, set the Filter
Mode to detailed on the Filters tab, select Ethernet or IP on the left pane, and
then specify the criteria. For details, see “Specifying Ethernet filter settings” on
page 51, “Specifying IPv4 filter settings” on page 82, or “Specifying IPv6 filter
settings” on page 85 of Chapter 4 “Ethernet and IP Testing”.
IPv6 traffic is not supported when running the TCP Wirespeed application.
Filtering received traffic
using layer 4 criteria
You can specify settings that determine which packets will pass through the
layer 4 (TCP/UDP) receive filter and be analyzed and reported in the test result
categories, or looped back to another unit. Traffic that does not pass filter
criteria is not reported or looped back.
FILTER TIPS:
– If you want to analyze all received traffic, Filter Mode is set to Basic.
– If you want to analyze only layer 4 traffic, be certain to set the Filter
Mode to Detailed, and then Enable the TCP/UDP filter.
To specify TCP/UDP filter criteria
1 If you haven’t already done so, use the Test Menu to select the Layer 4
application for the circuit you are testing (refer to Table 15 on page 148 for
a list of applications).
2 Select the Setup soft key, then select the Filters tab.
3 In the panel on the left side of the tab, select Basic, then set the Filter
Mode to Detailed.
4 Specify the Ethernet and the IP filter settings (see “Specifying Ethernet
filter settings” on page 51, “Specifying IPv4 filter settings” on page 82, or
“Specifying IPv6 filter settings” on page 85 of Chapter 4 “Ethernet and IP
Testing”).
Ethernet, IP, TCP/UDP, Fibre Chan., VoIP, and Video Testing Manual 153
Chapter 6 TCP/UDP Testing
Specifying layer 4 settings
5 To specify layer 4 filter settings, in the panel on the left side of the tab,
select TCP/UDP, and then specify values for the following settings:
Setting
Parameter
Filter Enable
–
–
If you want to filter received traffic using layer
4 criteria, select Enable. If you want to analyze only layer 4 traffic, you must enable the
filter.
If you do not want to filter received traffic
using layer 4 criteria, select Disable.
Protocol
(if filter is Enabled)
–
–
–
To analyze TCP traffic, select TCP.
To analyze UDP traffic, select UDP.
To analyze all layer 4 traffic, select
Don’t Care.
Port Filter
–
Single Direction. To pass through the filter,
traffic must satisfy the source and destination
port criteria you specified for the filter to be
reflected in the L4 Filter Counts and L4 Filter
Stats result categories.
Either Direction. The filter will not care which
direction the traffic is coming from; therefore,
the source port carried in the filtered traffic
can be the source port of the near-end instrument or port, or the source port of the far end
instrument or port. Traffic from either source
will be reflected in the L4 Filter Counts and L4
Filter Stats result categories.
–
6 On the graphic of the TCP/UDP packet, specify the following:
154
Setting
Parameter
Source Port
(if filter is Enabled)
Two filters are available. If you define a single filter, traffic must match the criteria in the filter. If
you define both filters, traffic must match the criteria for either filter.
– Under Filter 1, if you want to filter traffic for a
particular service type or source port, select
the box to the left of Source Service Type.
– To analyze traffic originating from one of the
pre-defined specific service types, select the
type. The port number is assigned automatically for you.
– To analyze traffic originating from a different
port, select User Defined, then specify the
port number.
– If you would like to define a second filter,
specify the settings for Filter 2.
Ethernet, IP, TCP/UDP, Fibre Chan., VoIP, and Video Testing Manual
Chapter 6 TCP/UDP Testing
Transmitting layer 4 traffic
Setting
Parameter
Destination Port
(if filter is Enabled)
Two filters are available. If you define a single filter, traffic must match the criteria in the filter. If
you define both filters, traffic must match the criteria for either filter.
– Under Filter 1, if you want to filter traffic for a
particular service type or destination port,
select the box to the left of Destination Service Type.
– To analyze traffic destined for one of the predefined specific service types, select the type.
The port number is assigned automatically for
you.
– To analyze traffic destined for a different port,
select User Defined, then specify the port
number.
– If you would like to define a second filter,
specify the settings for Filter 2.
7 If you want to specify received payload settings, see “Filtering traffic using
payload criteria” on page 59.
8 If you need to specify other settings for the test, select the appropriate tab;
otherwise, press Results to return to the Main screen.
The unit is configured to analyze received traffic satisfying the layer 4 filter
criteria.
Transmitting layer 4 traffic
After you configure the layer 4 settings, you are ready to transmit traffic over
the circuit.
To transmit layer 4 traffic
1 If you haven’t already done so, use the Test Menu to select the Layer 4
Traffic application for the circuit you are testing (refer to Table 15 on
page 148 for a list of applications).
2 Specify the settings required to initialize the link (see “Specifying interface
settings” on page 42).
3 Configure the instrument as appropriate for your test (see the appropriate
procedures below):
– “Specifying Ethernet frame settings” on page 45
– “Specifying Ethernet filter settings” on page 51
– “Specifying traffic load settings” on page 60
– “Specifying transmitted IPv4 packet settings” on page 80
– “Specifying IPv4 filter settings” on page 82
– “Specifying TCP/UDP settings for transmitted traffic” on page 151
– “Specifying the frame or packet length for transmitted traffic” on
page 153
– “Filtering received traffic using layer 4 criteria” on page 153
4 Press Results to return to the Main screen.
Ethernet, IP, TCP/UDP, Fibre Chan., VoIP, and Video Testing Manual 155
Chapter 6 TCP/UDP Testing
Inserting errors or pause frames
5 Select the Action tab, and then select Start Traffic (if you configured a
constant, bursty, or flooded load), or Start Ramp (if you configured a
ramped traffic load).
The instrument transmits traffic over the circuit.
Inserting errors or pause frames
You can use the instrument to insert errors (such as TCP/UDP checksum
errors) or pause frames into layer 4 traffic when you perform end-to-end and
loopback tests. For details on error and pause frame insertion, see “Inserting
errors or pause frames” on page 103.
Loopback testing
Loopback testing allows you to transmit traffic from one JDSU Ethernet test
set, and then loop the traffic back through a second unit on the far end of a
circuit. For details, refer to Chapter 8 “Loopback Testing”.
Running TCP Host or Wirespeed applications
If your instrument is configured and optioned to do so, the TCP Host application allows you to establish a TCP connection to a peer, and then measure
layer 4 (TCP) throughput to demonstrate that poor application performance is
not due to IP network issues. You can also determine the window size and
latency associated with the connection. The TCP Host application is available
when testing using a Transport Module or MSAM.
When testing using an MSAM, you can also use the TCP Wirespeed application to verify that your network meets or exceeds the layer 4 TCP throughput
specified in customer’s service level agreements for 10 Mbps through 10 Gbps
circuits. Using TCP Wirespeed, you can demonstrate that problems are occurring due to customer applications such as file downloads, email, or internet
access, rather than poor throughput on your network.
Unlike PC-based test solutions such as Iperf, the TCP Wirespeed application
resides on your MSAM, eliminating many of the limitations and inaccuracies
associated with poor PC performance. The application is not available on the
Transport Module
When configuring these applications, you can indicate whether you want the
instrument to report throughput in kilobits, megabits, kilobytes, or megabytes
per second. When configuring the TCP Host application, you can also specify
the interval at which the instrument is to refresh reported test results.
IMPORTANT:
The TCP Host and TCP Wirespeed applications are resource intensive
applications. To ensure optimal performance, be certain to configure one
instrument as the client, and the other as a server (if you are using a second
instrument rather than an Iperf server). Dual port testing is not recommended.
156
Ethernet, IP, TCP/UDP, Fibre Chan., VoIP, and Video Testing Manual
Chapter 6 TCP/UDP Testing
Running TCP Host or Wirespeed applications
NOTE: Interrupted Connections
If a TCP connection is lost unexpectedly (or intentionally, for example,
because someone brings the link down), the connection may not be
restored automatically. This is expected behavior because there is no way
to ensure that the server will become active before the client.
Changing settings during the
test
When running the TCP Host and TCP Wirespeed applications, the instrument
locks the Setup soft key and does not allow you to change application settings.
This is to prevent you from mistakenly bringing the connection or connections
down. If TCP connections come down when testing, there is no way to ensure
that the server will become active before the client, and as a result, the instrument might not be able to restore the connection automatically.
Streams pipe: multiple TCP
streams
When running the TCP Host or TCP Wirespeed application, you can use the
Streams Pipe soft key to specify the load unit, and to access the Load Distribution dialog box. The Load Distribution dialog box is used to enable the background streams that you want to transmit, and to specify the traffic load carried
in each stream.
Figure 43 on page 167 of Chapter 7 “Triple Play and Multiple Streams
Testing” illustrates the Streams Pipe display for regular layer 4 traffic streams.
When running the TCP Wirespeed application, the display is limited to the four
analyzed streams.
You can start and stop traffic from the pipe display. You can also specify the
load unit, and use the Configure Streams button to enable specific streams and
specify the traffic load carried in each stream.
Understanding the LED panel
When you select a TCP Host or TCP Wirespeed application, the module
provides LEDs in the panel for each analyzed traffic stream. Figure 41 illustrates the LEDs provided when running the Wirespeed application.
Figure 41 TCP Wirespeed LEDs
Understanding TCP Host and
Wirespeed test results
Viewing results for a specific
stream
When running the TCP Host and Wirespeed applications, you can observe
cumulative test results for the entire link and detailed test results for each
analyzed background stream.
You can view detailed test results for a particular stream on the result display
by specifying the stream number as the result group, and then selecting the
category with the results you want to observe.
Ethernet, IP, TCP/UDP, Fibre Chan., VoIP, and Video Testing Manual 157
Chapter 6 TCP/UDP Testing
Running TCP Host or Wirespeed applications
Viewing cumulative link results
You can observe cumulative link results for all transmitted streams by selecting
the Link group, and then the corresponding Stats, Counts, Error Stats, or
AutoNeg Status category.
Viewing TCP Host results
You can observe summarized and detailed results associated with each TCP
connection in the TCP Host result group. IPerf output and layer 3 configuration
status results are also available for each connection.
Focusing on key results
Some categories provide so much information you may need to scroll to the
right significantly to observe a particular result. To focus on a particular subset
of results (and minimize scrolling), you can use the Columns key under the
result panes to specify which result columns appear, and hide those you are
not interested in. For example, if you want to focus on the delay measurements
for each connection, you may choose to hide the Tx Mbps columns or Send
Window columns. You can always display them later if you need to.
Configuring the streams
Before running the TCP Host or Wirespeed applications, you must first
configure the traffic streams.
To configure the traffic streams
1 If you haven’t already done so, use the Test Menu to select the
Layer 4 Multiple Streams application for the circuit you are testing.
2 Configure the streams by doing the following:
a Specify the load unit (see “Enabling multiple streams” on page 170) for
traffic carried on the streams.
b Enable the streams you intend to transmit (see “Enabling multiple
streams” on page 170), and then specify the traffic load for each
stream (see “Specifying the load type for all streams” on page 171).
c Specify the settings that are common to all enabled streams (see
“Specifying common traffic characteristics for multiple streams” on
page 173).
d Specify the layer 2 (see “Specifying layer 2 stream settings” on
page 175), layer 3 (see “Specifying layer 3 stream settings” on
page 177), and if applicable, layer 4 settings (see “Specifying layer 4
stream settings” on page 177) for each enabled stream.
You can optionally copy the settings for one stream to all other streams
by selecting the Copy Setups to other Streams button. Frame or
packet characteristics will be copied. Traffic load settings can not be
copied; you must specify the type of load (Constant or Ramp) for each
individual stream on the Traffic tab.
The actual load for each enable stream is specified on the Load Distribution screen (see “Specifying the load type for all streams” on
page 171).
The streams are configured.
158
Ethernet, IP, TCP/UDP, Fibre Chan., VoIP, and Video Testing Manual
Chapter 6 TCP/UDP Testing
Running TCP Host or Wirespeed applications
Specifying TCP Host settings
Before running the TCP Host or Wirespeed applications, you must specify TCP
Host settings. The TCP Host setup tab allows you to configure your instrument
as a TCP client or server, and specify key settings such as the TCP port that
you are establishing a stateful connection to, the client or server window size,
the maximum segment size, and the type of service that the unit is emulating
(if your instrument is operating as a client). When configuring the
TCP Wirespeed application in Client mode, you can indicate that you want to
establish up to 64 connections.
To specify TCP Host settings
1 If you haven’t already done so, use the Test Menu to select the
Layer 4 Multiple Streams or Layer 4 TCP Wirespeed application for the
circuit you are testing.
2 Select the TCP Host tab, then select the TCP Host Settings sub-tab.
Specify the following settings:
Setting
TCP
Host
Client
TCP
Host
Server
√
TCP
Wirespeed
Client1
TCP
Wirespeed
Server
√
√
Value
TCP Host Mode
√
Connect to
Server
√
√
If the instrument is connecting to a server as a
client, specify the IP address for the server.
Connect to Port
√
√
The port that the TCP client is connecting to.
√
Listen Port
Indicate whether the unit is operating as a Client, or as a Server.
√
The port that the TCP server is listening on.
Window Size
√
√
√
√
The TCP window size for the connection. Be
certain to indicate the unit of measure for the
size (KB, MB, or bytes).
Max Seg Size
Bytes
√
√
√
√
The maximum segment size (in bytes) supported by the connection. This is typically 40
bytes less than the maximum transmission
unit (to accommodate the TCP/IP header
data).
The default is 1460 bytes.
Type of Service
√
√
To specify the type of service supported by
the connection, select DSCP, then select from
the list. The entries show the code points followed by their decimal equivalents in ( ).
If you want to transmit traffic without a particular TOS, select TOS. 0x00 will be carried in
the TOS field.
Transmit Mode
√
Indicate whether you intend to transmit a specific number of Bytes, or traffic for a specific
length of Time.
Number of
Bytes
√
If you set the transmit mode to Bytes, specify
the number of bytes you intend to transmit.
Time (sec)
√
If you set the transmit mode to Time, specify
the number of seconds that traffic will be
transmitted.
Number of
Connections
√
Specify the number of connections to the
server you want to establish.
Ethernet, IP, TCP/UDP, Fibre Chan., VoIP, and Video Testing Manual 159
Chapter 6 TCP/UDP Testing
Running TCP Host or Wirespeed applications
Setting
TCP
Host
Client
TCP
Host
Server
Report Rate
Format
√
√
Report Interval
√
√
TCP
Wirespeed
Client1
TCP
Wirespeed
Server
√
√
Value
Indicate whether you want the instrument to
report throughput in kilobits (Kb), megabits
(Mb), kilobytes (KB), or megabytes (MB).
Specify the interval at which the instrument is
to refresh reported test results.
1. Available on the MSAM only. MSAM must be optioned and configured for the Wirespeed application.
The TCP Host settings are specified.
Running the TCP Host
application
To run the TCP host
1 If you haven’t already done so, use the Test Menu to select the
Layer 4 Multiple Streams application for the circuit you are testing.
2 Specify the settings required to initialize the link (see “Specifying interface
settings” on page 42). Be certain to configure a full duplex connection.
3 Configure the traffic streams (see “Configuring the streams” on page 158).
4 Specify the TCP Host settings (see “Specifying TCP Host settings” on
page 159).
5 Press Results to return to the main screen, and then do the following:
a If you are measuring throughput on an optical circuit, turn the laser on.
b Select the Actions tab.
c If your unit is operating as a client, select Start Traffic.
d Select Start TCP Server or Start TCP Client (depending on the mode
you specified).
6 At a minimum, observe the following test results:
– To verify layer 2 or layer 3 performance, set a result group to Link, and
then display and observe results in the corresponding Link Stats category.
– To verify layer 4 TCP performance, set a result group to TCP Host,
and then display and observe results in the L4 Link Stats and Output
categories.
– Throughput, Latency (RTD), Packet Jitter, and Frame Loss graphs
are also available in the All Streams result group.
TCP throughput is measured. For descriptions of the available result categories, test results, and graphs refer to “CPRI/OBSAI test results” on page 333.
You can also optionally create a report detailing the TCP Host settings that you
used when measuring TCP throughput.
NOTE:
The tool used to run the TCP Host application may take up to two seconds
to launch. This impacts test results derived using the timestamp provided in
traffic carrying an ATP payload, such as latency/delay measurements,
packet jitter or packet jitter.
160
Ethernet, IP, TCP/UDP, Fibre Chan., VoIP, and Video Testing Manual
Chapter 6 TCP/UDP Testing
Running TCP Host or Wirespeed applications
Running the TCP Wirespeed
application
When configuring the TCP Wirespeed applications, many of the settings are
the same as those used to run the TCP Host application. When running
TCP Wirespeed, consider the following:
– Optimal window size. When turning up TCP service, you can test using a
variety of window sizes to determine the size that provides the best layer 4
throughput.
– Customer traffic emulation. When running the application, your instrument emulates a true TCP client/server, allowing you to establish up to 64
stateful TCP connections, and collect pertinent throughput, latency, and
loss results for many sessions. This provides a more accurate assessment
of the network's ability to carry application traffic than layer 3 throughput
tests, and provides the data you need to assure customers that issues are
not due to poor layer 4 throughput.
– Filters. When running the Wirespeed application, filter settings apply to
the background streams; they do not impact the TCP connections.
– Traffic off load. You can determine whether the proper CoS/QoS settings
are specified in the network and verify proper prioritization of background
streams by offloading up to four concurrent streams of traffic for analysis.
– Iperf compatibility. You can use the TCP Wirespeed application with Iperf
to sectionalize TCP performance issues, and demonstrate to the customer
that CPE equipment may be the root cause of performance problems.
– J-Mentor data analysis. When running the TCP Wirespeed application
from 1 Gigabit Optical Ethernet interfaces, you can capture the data, and
then analyze it using the J-Mentor application provided on your instrument.
The TCP Wirespeed application is not available for 100 Mbps optical circuits,
802.3 frames, or Q-in-Q encapsulated traffic. IPv6 traffic is also not supported
in this release.
NOTE: TCP connections
If you issue a loopup command to an instrument that is actively running the
TCP Wirespeed application, the command tears down any TCP connections that were established.
Pressing Restart while running the application will not tear down the
TCP Connections; it will simply refresh your test results.
To run the TCP Wirespeed application
1 Verify that you are not running any other tests.
2 If you haven’t already done so, use the Test Menu to select the
TCP Wirespeed application for the interface you are testing (refer to
Table 15 on page 148 for a list of applications).
3 Select the Setup soft key, and then select the Interface tab to specify the
settings required to initialize the link (see “Specifying interface settings” on
page 42).
4 Configure the traffic streams (see “Configuring the streams” on page 158).
5 Specify the TCP Host settings (see “Specifying TCP Host settings” on
page 159).
6 Press Results to return to the main screen, and then do the following:
a If you are measuring throughput on an optical circuit, turn the laser on.
b Select the Actions tab.
Ethernet, IP, TCP/UDP, Fibre Chan., VoIP, and Video Testing Manual 161
Chapter 6 TCP/UDP Testing
TrueSpeed
c If your instrument is operating as a client, select Start Traffic to
transmit the background streams.
d Select Start TCP Server or Start TCP Client (depending on the mode
you specified).
7 At a minimum, observe the following test results:
– To verify layer 2 or layer 3 performance, set a result group to Link, and
then display and observe results in the corresponding Link Stats category.
– To verify layer 4 TCP performance, set a result group to TCP Host,
and then display and observe results in the L4 Link Stats and Output
categories.
– Throughput, Latency (RTD), Packet Jitter, and Frame Loss graphs
are also available in the All Streams result group.
The application is running. When running the TCP Wirespeed application,
detailed statistics are provided for each established connection, including
bandwidth measurements, delay measurements, window statistics, and frame
counts.
TrueSpeed
If your instrument is configured and optioned to do so, you can use it to run the
TrueSpeed Test. This test uses the Wirespeed application and automates TCP
throughput testing per the IETF draft standard “ippm-tcp-throughput-framework” and to allow TCP throughput testing for up to 64 connections. For more
information, see “TrueSpeed Test” on page 314.
162
Ethernet, IP, TCP/UDP, Fibre Chan., VoIP, and Video Testing Manual
Chapter 7
Triple Play and
Multiple Streams Testing
7
This chapter provides information on testing triple play services and multiple
Ethernet (layer 2), IP (layer 3), or TCP/UDP (layer 4) streams of traffic. Topics
discussed in this chapter include the following:
– “About Triple Play and Multiple Streams testing” on page 164
– “Multiple Streams testing” on page 166
– “Triple Play testing” on page 179
– “Looping back multiple streams” on page 185
– “Running the TCP Host script” on page 185
– “Playing audio clips” on page 186
Ethernet, IP, TCP/UDP, Fibre Chan., VoIP, and Video Testing Manual 163
Chapter 7 Triple Play and Multiple Streams Testing
About Triple Play and Multiple Streams testing
About Triple Play and Multiple Streams testing
Before running Triple Play or Multiple Streams applications, be certain you are
comfortable configuring and running basic layer 2, layer 3, and layer 4 tests.
For details, refer to:
– Chapter 4 “Ethernet and IP Testing” on page 19.
– Chapter 6 “TCP/UDP Testing” on page 145.
Features and capabilities
Features and capabilities include the following when running Triple Play or
Multiple Streams applications:
– 10/100/1000 electrical, 1 GigE optical, and 10 GigE LAN testing—You can
configure up to ten streams of layer 2, or layer 3, or layer 4 traffic per port,
for a total of 20 streams (if your instrument is configured for dual port
testing).
– 10 GigE WAN testing—You can configure and transmit up to eight
streams of layer 2, layer 3, or layer 4 traffic.
– Uniquely characterize each stream of traffic—For example, you can verify
that a network handles VLAN tagged traffic properly by assigning a high
priority to one stream, and a lower priority to a second stream.
– IPv6 support—If you purchased the IPv6 Traffic option, you can transmit
and analyze multiple streams of IPv6 traffic using the terminate and loopback applications (40G and 100G— Terminate only). When configuring
your test, you can specify the required addresses manually, or you can use
stateless or stateful auto-configuration to assign addresses for you.
– Triple Play testing—You can transmit and analyze up to five streams of
traffic carrying voice, video, or data payloads to verify triple play service on
10/100/1000, 1 GigE Optical, and 10 GigE LAN circuits.
– When testing triple play, can transmit an actual audio stream (pre-recorded
tone or actual voice) to test the audio quality of a triple play network with
specific traffic levels before deployment.
– Layer 4 TCP/UDP streams—If you purchased the TCP/UDP option, you
can transmit and analyze multiple streams of traffic with TCP or UDP
headers in terminate mode. For details, see “Specifying layer 4 stream
settings” on page 177.
– TCP throughput measurements—If you purchased the TCP/UDP option,
you can establish a TCP connection to a peer, and then measure layer 3
(IP) and layer 4 (TCP) throughput to demonstrate that poor application
performance is not due to IP network issues.
– Unique MAC and IP addresses per stream—When running Layer 2 or
Layer 3 Triple Play or Multiple Streams applications, you can assign a
unique destination MAC and IP address to each individual stream, or you
can continue to use the same addresses for all streams. For details, see
“Specifying layer 2 stream settings” on page 175 and “Specifying layer 3
stream settings” on page 177.
– Packet capture and analysis—If your instrument is configured and
optioned to do so, you can use it to capture transmitted and received data,
save it on the instrument or to a USB key, and then either send the data to
another technician for analysis, or analyze it yourself using the Wireshark®
protocol analyzer (provided on the instrument). For details, see “Capturing
164
Ethernet, IP, TCP/UDP, Fibre Chan., VoIP, and Video Testing Manual
Chapter 7 Triple Play and Multiple Streams Testing
About Triple Play and Multiple Streams testing
packets for analysis” on page 91. In addition, if capturing VoIP packets,
the data can by analyzed with the PVA-1000 utility from JDSU.
NOTE: PVA-1000 is used for VoIP analysis only.
– Streamlined filter configuration—Ethernet, IP, and TCP/UDP filter settings
are available on the same setup tab, reducing the need to move from tab
to tab when you configure your test. For details, see “Filtering received
traffic using layer 4 criteria” on page 153.
What’s new
This release provides the following features when running Triple Play or
Multiple Stream applications:
–When configuring Multiple Streams tests, the Load units can now be
displayed in either kbps or Mbps. Streams pipe displays can also be specified to display in units of kbps or Mbps independently of the Load unit
display setting.
Streams Pipe soft key
You can press the Streams Pipe soft key to observe summarized test results
and information for each individual stream. For details, see “Streams pipe:
multiple streams” on page 167 and “Streams pipe: Triple Play streams” on
page 180.
Depending on the application you are running, a variety of views are provided
for the pipe.
– Overview. This view provides key source and destination addresses and
the bandwidth received and transmitted for each stream.
– Addressing. This view shows the source and destination IP addresses
carried in each transmitted stream. The default gateway and subnet mask
for each stream are also provided.
– Traffic Loads. This view provides more detailed information for the traffic
carried in each stream, such as the currently received frame size, the
received bandwidth, the transmitted traffic load type (constant or ramped),
the transmitted bandwidth, and a count of transmitted Acterna frames.
– VLAN/VPLS. These views show key encapsulation data for each stream.
For example, if you are analyzing layer 2 Q-in-Q streams, the SVLAN ID
and priority for received and transmitted streams appears.
Using the action buttons
The buttons on the Main screen are used to perform actions for all enabled
streams. For example, if stream 1, stream 2, and stream 3 are enabled, or if
you have selected a voice, HDTV, and data stream, pressing the Start Traffic
button transmits traffic for all three streams simultaneously.
Ethernet, IP, TCP/UDP, Fibre Chan., VoIP, and Video Testing Manual 165
Chapter 7 Triple Play and Multiple Streams Testing
Multiple Streams testing
Multiple Streams testing
If your instrument is configured and optioned to do so, you can use it to transmit
multiple streams of layer 2, layer 3, or layer 4 traffic. You can configure each
individual stream to depict a particular type of traffic, transmit the streams, and
then analyze each stream to verify that network routing and switching devices
are handling each stream properly (based on the stream’s priority). You can
also observe the bandwidth utilized, and a count of transmitted, received, and
lost frames for each individual stream.
Multiple Streams test
applications
This release supports the Multiple Streams applications listed in Table 16.
Loopback applications are listed in Table 16 on page 166 of
Chapter 8 “Loopback Testing”.
Table 16 Multiple Streams applications
Circuit
Application
Test Mode
10/100/1000
Layer 2 Multiple Streams
Terminate
Dual Terminate1
Layer 3 Multiple Streams
Terminate
Dual Terminate1
Layer 4 Multiple Streams
Terminate
Layer 2 Multiple Streams
Terminate
Dual Terminate1
Layer 3 Multiple Streams
Terminate
Dual Terminate1
Layer 4 Multiple Streams
Terminate
Layer 2 Multiple Streams
Terminate
Dual Terminate1
Layer 3 Multiple Streams
Terminate
Dual Terminate1
Layer 4 Multiple Streams
Terminate
Layer 2 Multiple Streams
Terminate
Layer 3 Multiple Streams
Terminate
Layer 4 Multiple Streams
Terminate
Layer 2 Multiple Streams
Terminate
Layer 3 Multiple Streams
Terminate
Layer 4 Multiple Streams
Terminate
Layer 2 Multiple Streams
Terminate
Layer 3 Multiple Streams
Terminate
100M Optical
1GigE Optical
10GigE LAN
10GigE WAN
100GigE
1. Transport Modules must use two PIMs for the selected interface to test in dual terminate
mode. Dual terminate mode is not available when testing 10 Gigabit Ethernet LAN or WAN
interfaces using an MSAM.
166
Ethernet, IP, TCP/UDP, Fibre Chan., VoIP, and Video Testing Manual
Chapter 7 Triple Play and Multiple Streams Testing
Multiple Streams testing
In addition to the standard Multiple Streams applications, if your instrument is
configured and optioned to do so, you can run TCP Wirespeed test applications with up to four streams of layer 4 traffic. For details, see “Running the
TCP Wirespeed application” on page 161.
Understanding the LED panel
When you select a Multiple Streams application, the module provides LEDs in
the panel for each enabled traffic streams (see Figure 42).
Figure 42 Multiple Stream LEDs (Layer 4)
If you run a Multiple Streams application in Dual Terminate mode, LEDs are
provided for both ports.
Streams pipe: multiple
streams
When running multiple streams applications, you can use the Streams Pipe
soft key to specify the load unit (see “Enabling multiple streams” on page 170),
and to access the Load Distribution dialog box. The Load Distribution dialog
box is used to enable the streams that you want to transmit (see “Enabling
multiple streams” on page 170), and to specify the traffic load carried in each
stream (see “Specifying the load type for all streams” on page 171).
Figure 43 illustrates the Streams Pipe display for layer 4 traffic streams.
Figure 43 Streams Pipe Display: layer 4 streams
Ethernet, IP, TCP/UDP, Fibre Chan., VoIP, and Video Testing Manual 167
Chapter 7 Triple Play and Multiple Streams Testing
Multiple Streams testing
You can start and stop traffic from the pipe display. You can also specify the
load and Throughput units, and press the Configure Streams button to enable
specific streams, and specify the traffic load carried in each stream.
NOTE:
When observing the pipe for layer 2 or layer 3 traffic, the Frame Length or
Packet Size displayed represents the maximum length or size received for
each individual stream.
When transmitting multiple VPLS encapsulated streams, the frame length
on the Streams Pipe Display represents the customer frame length; the load
percentage displayed represents the load as configured for the service provider.
Understanding multiple
streams test results
When running Multiple Streams applications, you can observe cumulative test
results for the entire link, detailed test results for a particular stream, and
graphical results for all analyzed streams.
Viewing results for a specific
stream
You can view detailed test results for a particular stream on the result display
by specifying the stream number as the result group, and then selecting the
category with the results you want to observe. Figure 44 illustrates the L2 Link
Results for Stream 1, and the Summary/Status results for all enabled streams.
Figure 44 Multiple Streams result display
Viewing cumulative link results
You can observe cumulative link results for all transmitted streams by selecting
the Link group, and then the corresponding Stats, Counts, Error Stats, or
AutoNeg Status category.
Viewing graphical results for all
streams
Throughput, latency (RTD), packet jitter, and frame loss results can be
observed graphically by selecting the All Streams group, and then the category with the results you want to observe. When observing graphical results,
it’s helpful to view the entire result window by selecting View > Result
Windows > Full Size.
168
Ethernet, IP, TCP/UDP, Fibre Chan., VoIP, and Video Testing Manual
Chapter 7 Triple Play and Multiple Streams Testing
Multiple Streams testing
Figure 45 illustrates the Throughput Graph for multiple traffic streams.
Figure 45 Throughput Graph: Multiple Streams application
A color coded legend appears under the graph indicating which color is used
to present results for each of the analyzed streams. In Figure 45, the green
lines provide results for Stream 3, the blue lines provide results for Stream 1,
and the bright pink line provides results for Stream 8.
Changing graph properties
To simplify the graph, you can select the legend, and then choose the data that
you want to observe for each analyzed stream, and hide the rest. You can also
focus on a subset of streams by hiding those that you do not want to observe
anymore.
To change graph properties
1 Select the legend at the bottom of the graph (see Figure 46).
Figure 46 Graph Legend: Multiple Streams application
The Graph properties dialog box appears (see Figure 47 on page 170).
2 Under Graph properties, select one of the following:
– Stream
– Frame Size
– CVLAN ID
– SVLAN ID
– MPLS1 ID
– MPLS2 ID
Ethernet, IP, TCP/UDP, Fibre Chan., VoIP, and Video Testing Manual 169
Chapter 7 Triple Play and Multiple Streams Testing
Multiple Streams testing
Figure 47 Graph properties dialog box
3 Clear the boxes next to the types of streams, the frame sizes, or the
SVLAN/CVLAN/MPLS IDs for streams that you do not want to observe.
4 Select Close to return to the Main screen.
The graph displays data for streams with the selected properties.
Enabling multiple streams
If you selected a Multiple Streams application, you enable streams on the Load
Distribution dialog box using the following procedure.
To enable multiple streams
1 If you haven’t already done so, use the Test Menu to select the Multiple
Streams test application for the interface you are testing (refer to Table 18
on page 179 for a list of applications).
2 Select the Streams Pipe soft key.
3 Select Configure Streams.
170
Ethernet, IP, TCP/UDP, Fibre Chan., VoIP, and Video Testing Manual
Chapter 7 Triple Play and Multiple Streams Testing
Multiple Streams testing
The Load Distribution screen appears.
4 Select the streams you want to transmit.
Streams are enabled. If you have already specified the load type for each
stream (see “Specifying the load type for all streams” on page 171), you can
specify the load.
NOTE:
The Auto Distribute button is disabled if one or more traffic streams is configured to transmit a ramped load of traffic.
Specifying the load type for
all streams
If you selected a Multiple Streams application, you can transmit a constant load
or a ramped load of traffic in any stream.
NOTE:
A single stream may be defined as having a a burst load.See “Specifying
the load unit on a stream with burst” on page 172.
To specify the load type for all streams
1 If you haven’t already done so, use the Test Menu to select the Multiple
Streams test application for the interface you are testing (refer to Table 16
on page 166 for a list of applications).
2 Select the Setup soft key.
3 By default, the module transmits a constant load of traffic for each enabled
stream. If this is acceptable, proceed to step 4. If you want to transmit a
ramped load of traffic for a particular stream or streams, do the following:
a Select the tab corresponding to the stream.
b Select the Traffic sub-tab.
Ethernet, IP, TCP/UDP, Fibre Chan., VoIP, and Video Testing Manual 171
Chapter 7 Triple Play and Multiple Streams Testing
Multiple Streams testing
c In Load Type, select Ramp, and then specify the time step (in seconds)
and the load step (in Mbps or as a percentage of the line rate). For
details, see “Transmitting a ramped load” on page 62.
NOTE: When configuring a ramped load of traffic for a stream, the triggers used to stop the ramp are not available.
d Repeat step a through step c for each ramped stream of traffic, and
then proceed to step 4.
4 Select the Streams Pipe soft key, and then select Configure Streams.
The Load Distribution screen appears.
5 Do one of the following:
– If you are transmitting a constant load of traffic for every enabled
stream, and you want to distribute the load evenly across the streams,
select Auto Distribute. The module automatically calculates the load
for each stream.
– If you are transmitting one or more ramped streams of traffic, or a
combination of constant and ramped loads, enter the load for each
enabled stream.
6 Select OK to store the loads and return to the Streams Pipe dialog box.
7 If you do not need to specify other settings, select the Results soft key to
return to the Main screen.
The traffic load is specified.
Specifying the load unit on a
stream with burst
If a burst signal is necessary in a multiple streams signal, any stream may be
defined to carry that bursty signal. Only one stream may be defined as carrying
a bursty signal.
Defining a stream as having a Burst load type automatically changes any other
stream defined as Burst to the Constant Load Type. It also restricts all enabled
streams to be configurable based on Layer 2 bit rate (Eth. IR (Mbps)).
To configure the load unit on a stream with burst load type
1 If you haven’t already done so, use the Test Menu to select the Multiple
Streams test application for the interface you are testing (refer to Table 16
on page 166).
2 Select the Setup soft KEY.
3 Select the All Streams tab. Verify that a burst Stream has been specified
in the Stream Selection portion of the window. If not specified, select the
desired stream from the Burst Stream drop-down list.
4 Select the tab of the individual stream specified as being the Burst Stream.
5 On the Traffic tab, select a Load Unit from the drop-down box accessed by
clicking the up-down arrows at the end of the Load Unit field.
If you selected Burst Time and Information Ratea Enter a desired Burst Time.
b Enter the desired units for the Burst time.
172
Ethernet, IP, TCP/UDP, Fibre Chan., VoIP, and Video Testing Manual
Chapter 7 Triple Play and Multiple Streams Testing
Multiple Streams testing
If you selected Bytes and Information Ratea Enter the desired Burst Kbytes.Actual Kbytes will be recalculated and
will display in the window.
b The Information Rate will display based on the value entered when
configuring the individual stream.
Specifying the load unit for
multiple streams
If you selected a Multiple Streams application, the traffic load for each stream
transmitted (except when configured for burst) can be specified in Mbps, or as
a percentage of the line rate. If a stream is to be configured with a Burst load
type (only one stream may be defined to have a Burst load type), see “Specifying the load unit on a stream with burst” on page 172 for instructions on
selecting the load unit on the stream carrying the burst signal.
To specify the load unit
1 If you haven’t already done so, use the Test Menu to select the Multiple
Streams test application for the interface you are testing (refer to Table 16
on page 166 for a list of applications).
2 Select the Setup soft key.
3 In the Stream Selection section, verify that the Burst Stream is set to None
and then under Load Unit, select one of the following:
– Bit Rate
– Percent
4 If you selected Bit Rate, the Throughput Bitrate definition source must also
be specified. Select either Layer 1 (Mbps) or Layer 2 (Eth IR (Mbps)).
The load unit is specified. You can specify the traffic load for each stream (see
“Specifying the load type for all streams” on page 171).
Specifying common traffic
characteristics for multiple
streams
If you selected a Multiple Streams application, common characteristics shared
by all streams are specified on the All Streams tab.
To specify traffic characteristics shared by every enabled stream
1 If you haven’t already done so, use the Test Menu to select the Multiple
Streams test application for the interface you are testing (refer to Table 16
on page 166 for a list of applications).
2 Select the Setup soft key, and then select the All Streams tab.
3 Do one of the following:
– Layer 2 VPLS streams. If you want to transmit VPLS encapsulated
traffic, set VPLS mode to Enabled, and then specify the SP source and
destination MAC addresses, and the customer’s source MAC address.
NOTE: Although the SP source and destination MAC addresses, and
the customer’s source MAC address are assigned to every enabled
stream, you can specify a unique customer destination MAC address for
each individual stream. See “Specifying layer 2 stream settings” on
page 175.
– Layer 2 Non-VPLS streams. If you do not want to transmit VPLS
encapsulated traffic, set VPLS mode to Disabled. You can optionally
specify source MAC address to be carried in every enabled stream of
traffic, or you can specify a unique MAC address for each stream.
Ethernet, IP, TCP/UDP, Fibre Chan., VoIP, and Video Testing Manual 173
Chapter 7 Triple Play and Multiple Streams Testing
Multiple Streams testing
To specify a single address, in Source MAC Mode, select Single, and
then indicate whether you want to use the factory default address, or
specify your own.
To specify an address for each stream, in Source MAC Mode, select Per
Stream, and then specify the addresses on the tabs corresponding to
each enabled stream (see “Specifying layer 2 stream settings” on
page 175).
– Layer 3 MPLS streams. If you want to transmit MPLS encapsulated
traffic, set MPLS mode to Enabled, and then specify the source MAC
address.
Enable or disable ARP mode.
If you enable ARP mode, specify the source IP for this hop, the destination IP address and subnet mask for the next hop, and then specify
source IP address, default gateway, and subnet mask for the customer
(Layer 3). These addresses will be used for all enabled streams.
– Layer 3 Non-MPLS streams. If you do not want to transmit MPLS
encapsulated traffic, set MPLS Mode to Disabled, then enable or
disable ARP mode.
Under Customer Information, in Source Type, indicate whether you
want to use DHCP to assign a single source IP address to all enabled
streams, manually assign a static address to be carried in all enabled
streams, or assign a unique source IP address to each enabled stream.
To specify a single static address, in Source Type, select Static, and
then specify the source IP address, default gateway, and subnet mask
for the customer.
To specify an address for each stream, in Source Type, select Static Per Stream, and then specify the addresses on the tabs corresponding
to each enabled stream (see “Specifying layer 3 stream settings” on
page 177).
– Layer 4 streams. Specify the source MAC address, enable or disable
ARP mode, and then specify the source IP address, default gateway,
and subnet mask for the customer (Layer3). The source MAC and IP
addresses will be carried in each enabled stream of traffic.
Under Layer 4, indicate whether you want to use the unit’s source IP
address as the ATP Listen IP Address (by setting the ATP Listen IP Type
to Auto Obtained), or select User Defined and then assign your own
address. If you do not want to use the default fill pattern (AA) to populate
the payloads, specify a different pattern.
NOTE:
The ATP version is set on the “All stream” page. It can be set per stream or
all streams. ATPv3 available only on the 40G/100G module.
4 Specify the Load Unit, selecting one of the following:
– Percent. If you select Percent, when configuring individual streams,
you will specify their output as a percentage of the line rate.
– Bit Rate. If you select Bit Rate, in Load Format, enter the bit format as
Mbps or kbps. When configuring individual streams, you will specify
their output as a distinct frequency, the sum of which cannot exceed the
line rate.
5 40G/100G applications only. Specify the Optic Latency Factor. This
setting provides a means to compensate for significant intrinsic delays,
especially when using certain types of pluggable optics affecting Frame
Delay (latency) measurement results.
174
Ethernet, IP, TCP/UDP, Fibre Chan., VoIP, and Video Testing Manual
Chapter 7 Triple Play and Multiple Streams Testing
Multiple Streams testing
In particular, 100G LR4 CFP optics equipped with gearbox functionality
have been shown to introduce delays in the range of 70 to 170 nanoseconds. Should this intrinsic delay be deemed significant, the Optic Latency
factor allows compensation by specifying a value between 0 and 100
microseconds, with nanosecond granularity. This factor will be subtracted
from latency calculations.
To specify the Optic Latency Factor, do the following:
– Run an RTD test with a very short fiber self-loop.
– Enter the returned RTD value in the Optic Latency Factor field on the
Setup page.
6 10 GigE applications only. In Delay, indicate whether you want to make
measurements using a high degree of precision, or a low degree of precision. In most instances, you should select the high precision setting.
7 To specify additional settings for each individual stream, see “Specifying
layer 2 stream settings” on page 175, “Specifying layer 3 stream settings”
on page 177, or “Specifying layer 4 stream settings” on page 177.
8 If you do not need to specify other settings, select the Results soft key to
return to the Main screen.
Common traffic characteristics are specified.
Specifying layer 2 stream
settings
You can specify the frame type, frame size, and encapsulation settings for
each individual stream when configuring standard Multiple Streams applications, or for each type of stream (VoIP, SDTV, HDTV, Data 1, and Data 2) when
configuring Triple Play applications. After specifying settings for a stream (or
type of stream), you can optionally copy the settings to every stream.
To specify layer 2 stream settings
1 If you haven’t already done so, use the Test Menu to select the Multiple
Streams, Triple Play, or TCP Wirespeed test application for the interface
you are testing (refer to Table 16 on page 166 and Table 18 on page 179
for a list of applications).
2 Select the Setup soft key, and then select the tab corresponding the
stream or type of stream you are configuring.
3 Select the Ethernet sub-tab, and then specify the frame type, length type,
and optional encapsulation settings. For details, refer to:
– “Specifying Ethernet frame settings” on page 45.
– “Configuring VLAN tagged traffic” on page 50.
– “Configuring Q-in-Q traffic” on page 50.
– “Configuring VPLS traffic” on page 51.
4 Do one of the following:
– Select the tab corresponding to the next stream or the next type of
stream you want to characterize, then repeat step 3.
– Optional. If you want to use the same settings for all enabled streams,
select Copy Setups to other Streams.
Traffic load settings are not copied. Load settings must be configured for
each individual stream.
Ethernet, IP, TCP/UDP, Fibre Chan., VoIP, and Video Testing Manual 175
Chapter 7 Triple Play and Multiple Streams Testing
Multiple Streams testing
5 If you do not need to specify other settings, select the Results soft key to
return to the Main screen.
Layer 2 traffic characteristics are specified.
Automatically incrementing
configured MAC addresses
or VLAN IDs
When configuring layer 2 multiple streams tests, you can indicate that you want
the instrument to automatically increment the MAC address and VLAN ID for
each stream when you configure the first stream. After you specify the MAC
address or VLAN ID for the first stream, you use the Copy Setups to other
Streams button to copy the values and populate the MAC addresses or VLAN
IDs with incremented values.
Table 17 shows the values assigned for each stream’s MAC address and
VLAN ID if the increment options are selected for stream one.
Table 17 Example: Incremented MAC addresses and VLAN IDs
Stream
MAC Address
VLAN ID
1
00-06-5B-15-04-03
2
2
00-06-5B-15-04-04
3
3
00-06-5B-15-04-05
4
4
00-06-5B-15-04-06
5
5
00-06-5B-15-04-07
6
To increment configured MAC addresses or VLAN IDs
1 If you haven’t already done so, use the Test Menu to select the layer 2
Multiple Streams test application for the interface you are testing (refer to
Table 16 on page 166 and Table 18 on page 179 for a list of applications).
2 Select the Setup soft key, and then enable the streams you intend to
transmit (see “Enabling multiple streams” on page 170). Be certain to
enable stream 1.
3 Select the tab for stream 1, then select the Ethernet sub-tab.
4 Specify the frame settings (see “Specifying layer 2 stream settings” on
page 175), then do the following:
– If you want to increment the configured MAC addresses for the
remaining streams, on the graphic of the frame, select DA, then specify
the destination MAC address for the first stream. Select Enable Increment During Copy.
– If you want to increment the configured VLAN ID for the remaining
streams, specify VLAN or Q-in-Q as the frame encapsulation, then
select VLAN on the graphic of the frame. Specify the VLAN ID for the
first frame, then select Enable Increment During Copy.
5 Select Copy Setups to other Streams.
The instrument copies the values for stream 1 to each stream, and increments
the values for the MAC address or VLAN ID as you specified.
176
Ethernet, IP, TCP/UDP, Fibre Chan., VoIP, and Video Testing Manual
Chapter 7 Triple Play and Multiple Streams Testing
Multiple Streams testing
Specifying layer 3 stream
settings
When running layer 3 and layer 4 Multiple Streams or layer 3 Triple Play applications, you can specify layer 3 settings for each individual stream or type of
stream. After specifying settings for a stream (or type of stream), you can
optionally copy the settings to every stream.
To specify layer 3 stream settings
1 If you haven’t already done so, use the Test Menu to select the Multiple
Streams, Triple Play, or TCP Wirespeed test application for the interface
you are testing (refer to Table 16 on page 166 and Table 18 on page 179
for a list of applications).
2 Select the Setup soft key, and then select the tab corresponding the
stream or type of stream you are configuring.
3 Select the IP sub-tab, and then specify the length type, the packet length,
the TOS/DSCP, TTL, and source and destination IP addresses. For
details, refer to:
– “Layer 3 testing” on page 75.
– “Configuring MPLS over Ethernet tests” on page 28 (if you are transmitting multiple streams of MPLS encapsulated traffic). MPLS encapsulation is not available when running Triple Play applications.
4 Do one of the following:
– Select the tab corresponding to the next stream or the next type of
service you want to characterize, then repeat step 3.
– Optional. If you want to use the same settings for all streams, select
Copy Setups to other Streams.
Traffic load settings are not copied. Load settings must be configured for
each individual stream.
The source IP address is not copied. If you want to use the same source
IP address for each stream, select Static as the Source Type on the All
Streams or All Services tab, and then specify the shared Source IP
address.
5 If you do not need to specify other settings, select the Results soft key to
return to the Main screen.
The layer 3 traffic characteristics are specified.
Specifying layer 4 stream
settings
When running layer 4 Multiple Streams applications, you can specify layer 4
settings for each individual stream. After specifying settings for a stream, you
can optionally copy the settings to every enabled stream.
To specify layer 4 stream settings
1 If you haven’t already done so, use the Test Menu to select the Multiple
Streams or TCP Wirespeed test application for the interface you are
testing (refer to Table 16 on page 166 for a list of applications).
2 Select the Setup soft key, and then select the tab corresponding the
stream you are configuring.
3 Select the TCP/UDP tab, and then specify the traffic mode (TCP or UDP),
the listen port service type (and if applicable, listen port number), the
source port number, the destination port number, and the payload (Acterna
or Fill Byte). For details, refer to “Specifying layer 4 settings” on page 150.
Ethernet, IP, TCP/UDP, Fibre Chan., VoIP, and Video Testing Manual 177
Chapter 7 Triple Play and Multiple Streams Testing
Multiple Streams testing
4 Specify the traffic load for the stream (see “Specifying the load type for all
streams” on page 171).
5 Optional. If you want to use the same settings for all enabled streams,
select Copy Setups to other Streams. Traffic load settings are not
copied. Load settings must be configured for each individual stream.
6 If you do not need to specify other settings, select the Results soft key to
return to the Main screen.
The layer 4 traffic characteristics are specified.
Transmitting multiple
streams
Before transmitting multiple traffic streams, you must:
– Specify the interface settings required to initialize the link (see “Specifying
interface settings” on page 42).
– Specify the load unit for the transmitted traffic (Bit Rate or Percent). This
setting indicates whether you want to specify the load for each stream as a
bit rate, or as a percent of the line rate. For details, see “Enabling multiple
streams” on page 170.
– Enable the streams you want to transmit (see “Enabling multiple streams”
on page 170, or “Specifying layer 2 and layer 3 settings for Triple Play
services” on page 184).
– Specify common traffic characteristics for all enabled streams. For
example, if you intend to use the factory default source MAC address, and
a static IP address as the source addresses for every enabled stream,
these are specified on the All Streams tab. For details, see “Specifying
common traffic characteristics for multiple streams” on page 173.
– Specify unique traffic characteristics for each enabled stream or type of
stream. For example, you can verify that a network handles VLAN tagged
traffic properly by assigning a high priority to one stream, and a lower
priority to a second stream. Or you can configure and transmit unencapsulated layer 3 VoIP streams and VLAN tagged SDTV streams.
For details, see “Specifying layer 2 stream settings” on page 175, “Specifying layer 3 stream settings” on page 177, “Specifying layer 4 stream
settings” on page 177, and “Specifying layer 2 and layer 3 settings for
Triple Play services” on page 184.
– Specify the load for each enabled stream, or let the module automatically
distribute the load evenly between enabled streams. For example, if you
specify the load unit as a percent and enable 4 traffic streams, selecting
Auto Distribute distributes a 25% traffic load to each stream. For details,
see “Specifying the load type for all streams” on page 171.
If you intend to run the TCP Host application, additional settings are required
(see “Running the TCP Host script” on page 185).
If you are running a Triple Play application, see “Transmitting multiple Triple
Play streams” on page 185.
To transmit multiple streams
1 If you haven’t already done so, use the Test Menu to select the Multiple
Streams test application for the interface you are testing (refer to Table 16
on page 166 for a list of applications).
178
Ethernet, IP, TCP/UDP, Fibre Chan., VoIP, and Video Testing Manual
Chapter 7 Triple Play and Multiple Streams Testing
Triple Play testing
2 Select the Setup soft key, and then select the Interface tab to specify the
settings required to initialize the link (see “Specifying interface settings” on
page 42).
3 Configure the test. For details, refer to:
– “Enabling multiple streams” on page 170.
– “Enabling multiple streams” on page 170.
– “Specifying the load type for all streams” on page 171.
– “Specifying common traffic characteristics for multiple streams” on
page 173.
– “Specifying layer 2 stream settings” on page 175.
– “Specifying layer 3 stream settings” on page 177.
– “Specifying layer 4 stream settings” on page 177.
4 Select Results to return to the Main screen.
5 Select Start Traffic to transmit the streams over the circuit.
Multiple streams are transmitted. For an overview of the test results presented
when transmitting multiple streams, see “Understanding multiple streams test
results” on page 168.
SAMComplete
If your instrument is configured and optioned to do so, you can use it to run the
SAMComplete test. This test is a multi-stream test based on ITU-T Y.156sam
that performs a two-phase test. First, the test verifies whether each Ethernet
service is properly configured. Second, multiple Ethernet service instances are
verified simultaneously, each meeting its assigned Committed Information
Rate (CIR). See “SAMComplete” on page 298.
Triple Play testing
If your instrument is configured and optioned to do so, you can use it to transmit
and analyze traffic emulating Triple Play services. When running Triple Play
applications, you can configure each type of stream (voice, video, or data) with
unique layer 2 or layer 3 characteristics. For example, if you are running a
Layer 3 Triple Play application, you can setup all voice streams to use Q-in-Q
encapsulation, all SDTV (or HDTV) video streams to use VLAN tags, and all
data streams to use no encapsulation. You can also transmit an actual audio
stream (pre-recorded voice, tone, or voice conversation) to test the audio
quality of a triple play network with specific traffic levels before deployment.
Triple Play test applications
This release supports the Triple Play applications listed in Table 18.
Table 18 Triple Play applications
Circuit
Application
Test Mode
10/100/1000
Layer 2 Triple Play
Terminate
Layer 3 Triple Play
Terminate
Layer 2 Triple Play
Terminate
Layer 3 Triple Play
Terminate
100M Optical
Ethernet, IP, TCP/UDP, Fibre Chan., VoIP, and Video Testing Manual 179
Chapter 7 Triple Play and Multiple Streams Testing
Triple Play testing
Table 18 Triple Play applications (Continued)
Circuit
Application
Test Mode
1GigE Optical
Layer 2 Triple Play
Terminate
Layer 3 Triple Play
Terminate
Layer 2 Triple Play
Terminate
Layer 3 Triple Play
Terminate
10GigE LAN
Understanding the LED panel
When you select a Triple Play application, the module provides LEDs in the
panel for each type of traffic transmitted in each enabled stream (see
Figure 48).
Figure 48 Triple Play LEDs (Layer 3)
Streams pipe: Triple Play
streams
Figure 49 illustrates the Streams Pipe Display for Layer 3 Triple Play streams.
Figure 49 Streams Pipe Display: Layer 3 Triple Play streams
You can start and stop traffic directly from the pipe display. You can set the
Throughput units display to kpbs or Mbps. You can also press the Configure
Triple Play Services button to select the type of services you want to emulate,
and specify parameters for each type. For example, if you are emulating voice
service, you can specify the Codec, sampling rate, and the number of calls.
180
Ethernet, IP, TCP/UDP, Fibre Chan., VoIP, and Video Testing Manual
Chapter 7 Triple Play and Multiple Streams Testing
Triple Play testing
Understanding Triple Play
test results
When running Triple Play applications, you can observe cumulative test results
for the entire interface and link. You can also observe throughput, latency
(RTD), packet jitter, and frame loss graphs for all analyzed streams.
Viewing cumulative link results
You can observe cumulative link results for all transmitted streams by selecting
the Link group, and then the corresponding Stats or Counts category.
Viewing graphs
Throughput, latency (RTD), packet jitter, and frame loss results can be
observed graphically by selecting the Graphs group, and then the category or
the results that you want to observe. When observing the graphs, it’s helpful to
view the entire result window by selecting View > Result Windows > Full
Size.
Figure 50 illustrates the Throughput Graph for Triple Play streams.
Figure 50 Throughput Graph
A color coded legend appears under the graph indicating which color is used
to present results for each type of analyzed streams. In Figure 50, the green
line provides results for HDTV traffic, the red line provides results for SDTV
traffic, and the purple and light blue lines provide results for the data traffic. The
bright blue line provides results for simulated voice traffic. NOTE: The bright
blue reflects simulated voice, not the audio frames.
Changing graph properties
If you would like to focus on results for a specific type of stream, frame size,
CVLAN, SVLAN, or VLAN ID, you can change the graph properties.
To change graph properties
1 Select the legend at the bottom of the graph (see Figure 51).
Figure 51 Graph Legend: Triple Play application
The Graph properties dialog box appears (see Figure 52 on page 182).
Ethernet, IP, TCP/UDP, Fibre Chan., VoIP, and Video Testing Manual 181
Chapter 7 Triple Play and Multiple Streams Testing
Triple Play testing
2 Under Graph properties, select one of the following:
– Stream
– Frame Size
– CVLAN ID
– SVLAN ID
– VLAN ID
Figure 52 Graph properties dialog box
3 Clear the boxes next to the types of streams, the frame sizes, or the
SVLAN/CVLAN/VLAN ID for streams that you do not want to observe.
4 Select Close to return to the Main screen.
The graph displays data for streams with the selected properties.
Characterizing Triple Play
services
Before transmitting multiple streams of Triple Play traffic, you must characterize each type of service, and indicate the number of calls (VoIP), channels
(SDTV and/or HDTV), and data streams that you intend to transmit and
analyze.
The maximum utilization threshold is equal to the line rate for the application;
therefore, if you utilize all of the bandwidth for one type of stream, you can not
transmit the other types concurrently.
To characterize each type of service
1 If you haven’t already done so, use the Test Menu to select the Triple Play
test application for the interface you are testing (refer to Table 18 on
page 179 for a list of applications).
2 Select the Setup soft key, and then select the All Services tab.
3 Do one of the following:
– Layer 2 Triple Play. To specify a single source MAC address shared
by all streams, in Source MAC Mode, select Single, and then indicate
whether you want to use the factory default address, or specify your
own.
182
Ethernet, IP, TCP/UDP, Fibre Chan., VoIP, and Video Testing Manual
Chapter 7 Triple Play and Multiple Streams Testing
Triple Play testing
To specify a source MAC address for each stream, in Source MAC
Mode, select Per Stream, and then specify the addresses on the tabs
corresponding to each type of service (see “Specifying layer 2 and layer
3 settings for Triple Play services” on page 184).
– Layer 3 Triple Play. Under MAC Address setup, indicate whether you
want to use the factory default address, or specify your own.
Under Customer Information, in Source Type, indicate whether you
want to use DHCP to assign a single source IP address to all streams
(for all services), manually assign a static address to be carried in
streams for all services, or assign a unique source IP address to each
stream.
To specify a single static address, in Source Type, select Static, and
then specify the source IP address, default gateway, and subnet mask
for the customer.
To specify an address for each stream, in Source Type, select Static Per Stream, and then specify the addresses on the tabs corresponding
to each type of service (see “Specifying layer 2 and layer 3 settings for
Triple Play services” on page 184).
4 Press Configure Triple Play Services. The Define Triple Play Services
dialog box appears. Specify the following:
– Voice service. If you intend to simulate and analyze voice traffic,
select the checkbox next to Simulated. If your instrument includes the
VoIP option, a second voice selection is available. Choose Voice
Conversation, IP Voice Announce, or Transmit Tone. Specify the
Codec, sampling rate (in ms), and the number of calls to emulate. Your
instrument automatically calculates the bandwidth utilized by each call
(in kbps), the total rate (in Mbps) for all calls, and the frame size (in
Bytes).
NOTE: Increasing the sampling rate reduces required bandwidth;
increasing the number of calls utilizes additional bandwidth. If you utilize
all of the bandwidth for voice data, you can not transmit SDTV, HDTV,
or data traffic at the same time.
IMPORTANT: The Codec type on the receiving and transmitting unit
must match for the audio to work properly.
– Video service. If you intend to emulate and analyze SDTV and/or
HDTV traffic, select the corresponding checkbox, and then specify the
number of channels, and the compression rate (MPEG-2, at 4.00 Mbps
or 19.00 Mbps, or MPEG-4, at 2.00 Mbps or 7.00 Mbps).
NOTE: Each additional SDTV channel increases the rate by 4.0 or
2.0 Mbps. Each additional HDTV channel increases the rate by 19.0 or
7.0 Mbps. If you utilize all of the bandwidth for video data, you can not
transmit voice and data traffic with the video traffic.
– Data streams. If you intend to emulate and analyze data traffic, select
one or both of the checkboxes, and then configure the rate (up to the
maximum utilization threshold), and a constant or ramped load of traffic
for the selected data streams. If you select Ramp, specify the Time
Step (in seconds) and Load Step (in Mbps). Finally, specify the frame
size to transmit (in Bytes), or select the Random check box to transmit
frames of randomly generated sizes.
– After specifying the settings, select the OK button to return to the setup
menu.
5 Select the Voice tab, and then in the left pane, select Audio Codec.
Ethernet, IP, TCP/UDP, Fibre Chan., VoIP, and Video Testing Manual 183
Chapter 7 Triple Play and Multiple Streams Testing
Triple Play testing
6 Specify the following settings:
Setting
Description
Primary Codec
Select the codec type to be advertised/supported
for receiving audio packets.
IMPORTANT: The Codec type on the receiving and
transmitting unit must match for the audio to work
properly.
Speech Per Frame
Specify the number of milliseconds of speech per
transmission frame the unit will transmit.
Jitter buffer
Set the jitter buffer length.This is the number of milliseconds of speech that will be collected before an
attempt will be made to play the speech back. This
allows lost, late, or out-of-sequence packets time to
arrive and be reassembled before playback.
Transmit Source
Select the transmit source: Voice conversation
(transmits and receives live voice), IP voice
announce (the unit repeats a sequence of words
including the calling party’s IP address), Tone
(transmits the specified frequency).
Language
If the Transmit Source is set to IP Voice Announce,
the Language selection becomes available. This
specifies the language for the transmitted voice
announcement.
Silence Suppression
Specify whether silence suppression is enabled.
7 In the left panel on the side of the tab, select QoS and then specify the
following:
Setting
Description
MOS Scaling
Specify the scale used for MOS results.
Jitter Threshold
Specify the pass and fail thresholds for the jitter result.
Delay Threshold
Specify the pass and fail thresholds for the delay
result.
Loss Threshold
Specify the pass and fail thresholds for the loss result.
Content Threshold
Specify the pass and fail thresholds for the MOS
results.
8 If you do not need to specify other settings, select the Results soft key to
return to the Main screen.
Triple Play service is characterized.
Specifying layer 2 and layer 3
settings for Triple Play
services
You can specify layer 2 and layer 3 settings for each type of service on the
Voice, SDTV, HDTV, Data 1, and Data 2 setup tabs. For details, see:
– “Specifying layer 2 stream settings” on page 175
– “Specifying layer 3 stream settings” on page 177
184
Ethernet, IP, TCP/UDP, Fibre Chan., VoIP, and Video Testing Manual
Chapter 7 Triple Play and Multiple Streams Testing
Looping back multiple streams
Transmitting multiple Triple
Play streams
Before transmitting multiple Triple Play streams, you must:
– Specify the interface settings required to initialize the link (see “Specifying
interface settings” on page 42).
– Specify setting that characterize each type of service, and indicate the
bandwidth utilized by each type (see “Characterizing Triple Play services”
on page 182).
– Specify layer 2 and layer 3 settings for the streams (see “Specifying
layer 2 stream settings” on page 175 and “Specifying layer 3 stream
settings” on page 177).
To transmit multiple Triple Play streams
1 If you haven’t already done so, use the Test Menu to select the Triple Play
test application for the interface you are testing (refer to Table on
page 179 for a list of applications).
2 Select the Setup soft key, and then select the Interface tab to specify the
settings required to initialize the link (see “Specifying interface settings” on
page 42).
3 Configure the test. For details, refer to:
– “Characterizing Triple Play services” on page 182.
– “Specifying layer 2 and layer 3 settings for Triple Play services” on
page 184.
4 Select Results to return to the Main screen.
5 Select Start Traffic to transmit the streams over the circuit.
Multiple Triple Play streams are transmitted. For an overview of the test results
presented when transmitting Triple Play traffic, see “Understanding Triple Play
test results” on page 181.
Looping back multiple streams
Loopback testing allows you to transmit traffic from one JDSU Ethernet test
set, and then loop the traffic back through a second unit on the far end of a
circuit. For details, refer to Chapter 8 “Loopback Testing”.
Running the TCP Host script
When running layer 3 and layer 4 multiple streams applications, you can
configure and run the TCP Host script to establish a stateful TCP connection
with another device, and then determine the TCP throughput, window size and
latency associated with the connection.
For details, refer to “Running TCP Host or Wirespeed applications” on
page 156.
Ethernet, IP, TCP/UDP, Fibre Chan., VoIP, and Video Testing Manual 185
Chapter 7 Triple Play and Multiple Streams Testing
Playing audio clips
Playing audio clips
When running layer 3 triple play applications, you can transmit an actual audio
stream (pre-recorded voice, tone, or voice conversation). This allows testing of
the audio quality of a triple play network with specific traffic levels before
deployment.
To play audio clips
1 If you haven’t already done so, use the Test Menu to select the layer 3
Triple Play test application for the interface you are testing (refer to Table
on page 179 for a list of applications).
2 Select the Setup soft key, and then select the All Services tab.
3 Tap the Configure Triple Play Services button.
The Define Triple Play Services dialog box appears (see Figure 53).
Figure 53 Define Triple Play Services dialog box
4 In the Voice section, do the following:
a Select one or both Voice types:
– Simulated—a stream of Acterna test packets.
– Choose one of the following:
- Voice Conversation—typical voice call
- Transmit Tone—a single frequency tone transmitted via RTP
packets
- IP Voice Announce—pre-recorded audio clip transmitted via RTP
packets
b Specify the Codec, sampling rate (in ms), and the number of calls to
emulate, as described in step 4 on page 183.
IMPORTANT: The audio will work properly only when the Codec type
matches on the receiving and transmitting unit.
5 Verify the settings on the Voice tab, as described in step 5 on page 183.
6 Select the Results soft key to return to the test result menu.
186
Ethernet, IP, TCP/UDP, Fibre Chan., VoIP, and Video Testing Manual
Chapter 7 Triple Play and Multiple Streams Testing
Playing audio clips
7 Select the Play Audio action button to transmit the audio stream.
8 Verify the audio by doing the following:
– Observe the Audio Detect LED. It illuminates when audio packets are
received.
– Observe the Sim. Voice LED.
– Use a headset to listen to the audio.
NOTE:
If playing audio on a MTS8000 with DMC, no audio path is available. You
can use the simulated voice and observe results but will not hear audio.
Ethernet, IP, TCP/UDP, Fibre Chan., VoIP, and Video Testing Manual 187
Chapter 7 Triple Play and Multiple Streams Testing
Playing audio clips
188
Ethernet, IP, TCP/UDP, Fibre Chan., VoIP, and Video Testing Manual
Chapter 8
Loopback Testing
8
This chapter provides information on looping back Ethernet, IP, TCP/UDP,
Fibre Channel, and multiple streams of traffic.
Topics discussed in this chapter include the following:
– “About Loopback testing” on page 190
– “Specifying a unit identifier” on page 194
– “Using LLB to loop received traffic back to the local unit” on page 195
– “Using Loop Up to initiate a loopback from the local unit” on page 196
Ethernet, IP, TCP/UDP, Fibre Chan., VoIP, and Video Testing Manual 189
Chapter 8 Loopback Testing
About Loopback testing
About Loopback testing
If your instruments are configured and optioned to do so, you can use two
Transport Modules (or other JDSU compliant Ethernet test instruments) to
transmit Ethernet, IP, TCP/UDP, or Fibre Channel traffic from one instrument,
and then loop the traffic through a second instrument back to the sending
instrument. By transmitting and then looping traffic back, you are essentially
emulating a longer circuit on the network.
Before looping back traffic, it is important to understand the terminology and
concepts in the following sections.
Loopback terminology
Local unit
The following terms are used to explain loopback testing in this chapter.
Used in this chapter to refer to the traffic-originating unit (which is always
placed in Terminate mode).
Loopback unit
Used in this chapter to refer to the unit that loops received traffic back to the
traffic-originating (local) unit. If the loopback unit is capable of generating
traffic, place it in terminate mode when you want to loop traffic through to the
transmitter. If the loopback unit is not capable of generating traffic (it is a loopback-only unit), place it into loopback mode.
Terminate mode
Mode used for loopback applications when both the local unit and the loopback
unit are capable of generating traffic. Also used by local unit to generate traffic
that will be looped back by a unit that is only capable of looping received traffic
back. In this scenario, the loopback unit is placed in loopback mode.
All MSAMs and Transport Modules with Ethernet testing capability are shipped
with the ability to generate and transmit traffic; therefore, when running loopback applications using two MSAMs, two Transport Modules, or an MSAM and
a Transport Module, both instruments should be placed in terminate mode.
Loopback mode
Previously, loopback tests were always performed with both the local traffic
transmitting unit and the loopback unit in Terminate mode. Assuming both
units can transmit traffic, this is still the case.
When you purchase an Multiple Services Application Module, you can order a
unit that is capable of generating, transmitting, and analyzing Ethernet traffic,
or you can order a unit that simply loops back traffic received from another
transmitting unit. The loopback unit is not capable of generating its own traffic;
it functions simply as a loopback device.
If you are using a loopback-only unit at the far end, you must place the local
unit in Terminate mode; the loopback unit must be placed in Loopback mode.
Configure and transmit traffic from the local unit just as you would for an
end-to-end test; and verify that the filter settings on the loopback unit will allow
traffic to pass from its receiver through to its transmitter.
You can still initiate the loopback from your local unit using the Loop Up action
button, or you can actively loop traffic back from the loopback unit using the
LLB action button.
190
Ethernet, IP, TCP/UDP, Fibre Chan., VoIP, and Video Testing Manual
Chapter 8 Loopback Testing
About Loopback testing
Key loopback concepts
ARP settings
The following concepts apply when configuring loopback applications.
If you are looping back layer 3 or layer 4 traffic, and you want to use ARP to
obtain the units MAC addresses, be certain to enable ARP on both units.
If ARP is disabled on all units on the circuit, you can issue a broadcast request
to loop up the first device that responds (rather than a specific unit).
Address swapping
On the loopback unit, received frames and packets are looped through to the
transmitter after the destination and source MAC addresses (layer 2, 3, and 4
loopbacks), IP addresses (layer 3 and 4 loopbacks), and if applicable, port
numbers (layer 4 loopbacks) are swapped.
NOTE:
Applications using the100G interface do not automatically swap addresses
for traffic transmitted from the loopback unit.
Filter criteria on the loopback unit
Only Unicast frames that pass the filter criteria specified on the loopback unit
are looped back to the local unit.
If the Ethernet filter settings are all Don’t Care, and/or the IP and TCP/UDP
filters are both disabled, traffic carrying any payload will pass through the filter
for analysis.
Loop types
When configuring the local traffic-generating unit, you can specify that you
want to issue a Unicast loop-up command, or a Broadcast loop-up command.
If you are running an Ethernet application, Unicast commands are used to loop
up a specific test instrument on the far end; Broadcast commands are used to
loop up the first instrument on the circuit that responds.
If you are running a Fibre Channel application, and you suspect that a switch
on the circuit you are testing discards Broadcast frames, be certain to specify
a Unicast loop type. Otherwise, the switch will discard the Broadcast loop up
frame, and the unit on the far end will not be looped up.
LBM Traffic
VLAN and Q-in-Q traffic
VPLS labels
Used for Loopback Message/Loopback Reply (LBM/LBR) frame analysis
where the far-end unit (any equipment that responds to LBM messages) loops
back any packet containing the LBM message.
The loopback unit uses the same IDs and priorities assigned to the received
traffic, and loops the traffic back on the same virtual LAN using the same
priority.
The labels for traffic received by the loopback unit are replaced with the labels
specified for transmitted traffic on the Ethernet tab before the traffic is passed
through to the loopback unit’s transmitter.
If you are looping back multiple streams of VPLS traffic, you can specify a
unique tunnel label and VC label for each individual stream, or you can specify
the labels for one stream, and then copy them to the other streams.
Ethernet, IP, TCP/UDP, Fibre Chan., VoIP, and Video Testing Manual 191
Chapter 8 Loopback Testing
About Loopback testing
VPLS service provider and
customer destination addresses
When looping back VPLS traffic, the loopback unit swaps the service provider
destination address (SP DA) and service provider source address (SP SA)
carried in received traffic before looping the traffic through to the transmitter.
When configuring traffic on the local unit, you must specify the service provider
source address of the loopback unit as the service provider destination
address for all traffic transmitted from the local unit. This is because when
looping back VPLS traffic, the local unit will not issue a broadcast request to
loopup the next JDSU Ethernet test instrument on the circuit. Essentially, you
must tell it to loop up a specific test instrument by specifying the correct service
provider DA.
Where are the VPLS addresses specified?
The SP destination address is specified on the Ethernet tab by selecting the
DA field for the service provider frame; the customer destination address is
specified by selecting the Data field for the SP frame, and then selecting the
DA field for the customer frame (displayed graphically underneath the SP
frame).
Looping back multiple streams of VPLS traffic.
If you are looping back multiple streams of VPLS traffic, you must specify a
destination SP address for all enabled streams (on the All Streams tab), but
you can specify a unique customer destination address for each individual
stream on it’s corresponding setup tab. You can also copy the customer destination address for one stream to all enabled streams.
MPLS labels
Before received traffic is passed through to the loopback unit’s transmitter, the
labels for the traffic are automatically replaced with the labels specified for
traffic transmitted from the loopback unit; therefore:
– If your local unit is configured to transmit traffic with a second MPLS label,
but the loopback unit is configured to transmit traffic with a single label, the
out of sequence and lost frames counts reported by the local unit may
increment if the incoming frame rate is too high.
– If your local unit is configured to transmit traffic with a single MPLS label,
but the loopback unit is configured to transmit traffic with a second label,
the local unit’s receive bandwidth utilization will exceed its transmitted
bandwidth utilization.
NOTE:
Applications using the100G interface do not automatically replace labels
specified for traffic transmitted from the loopback unit.
If you are looping back multiple streams of MPLS traffic, you can specify
unique labels for each individual stream, or you can specify the labels for one
stream, and then copy them to the other streams.
MPLS destination addresses
If you initiate a loopback from a local unit using the Loop Up button, and ARP
is enabled on both units, you must specify the destination IP address and
subnet mask for the next hop on the circuit.
If you use the LLB button on the loopback unit to loop traffic back to the local
unit, and ARP is enabled on both units, you must manually specify the destination IP addresses for the traffic transmitted from the local unit and for the
traffic looped back by the loopback unit.
192
Ethernet, IP, TCP/UDP, Fibre Chan., VoIP, and Video Testing Manual
Chapter 8 Loopback Testing
About Loopback testing
If ARP is disabled, you must also specify the destination MAC address for
traffic transmitted by the local unit.
If you are looping back multiple streams of MPLS traffic, and ARP is disabled,
you can specify a unique destination MAC address (on the Ethernet tab), and
a unique destination IP address (on the IP tab) for each individual stream, or
you can specify the addresses for one stream, and then copy them to the other
streams.
TCP/UDP ATP Listen IP Address
and Listen Port
The Transport Module and Multiple Services Application Module use an
ATP Listen IP Address and ATP Listen Port to determine whether received
layer 4 traffic carries an ATP payload.
If you issue a Loop Up command from a local unit, after the local unit receives
a response from the loopback unit indicating that the loopup was successful,
the local unit’s ATP Listen IP Address and ATP Listen Port are automatically
set to the destination IP address and destination port number carried in the
looped back traffic. The loopback unit’s ATP Listen IP Address and
ATP Listen Port will also automatically be set to the destination IP address and
destination port carried in the traffic it receives from the local unit.
If you use the LLB action button on the loopback unit, it is essential that you
specify the destination IP address and port carried in received traffic as the
ATP Listen IP Address and ATP Listen Port when you configure tests that
require an ATP payload (such as delay measurements, out of sequence
counts, lost frames counts, and packet jitter measurements).
Understanding the graphical
user interface
Loopback action buttons
When running loopback tests, the user interface looks much like it does for
standard end-to-end or multiple streams tests.
Three action buttons are used for the purpose of initiating or ending loopback
tests, and placing a unit into loopback mode.
Loop Up
Press Loop Up when you want to initiate the loopup of another unit on the
circuit from your unit. In this scenario, you are initiating the loopup from the
local unit.
Loop Down
Press Loop Down when you want to end the loopup of another unit on the
circuit. In this scenario, you are ending the loopup from the local unit.
LLB
Press LLB to loop received traffic back through to a units transmitter, or to stop
looping traffic back through to the transmitter. In this scenario, you are initiating
or ending the loopup from the loopback unit itself.
Ethernet, IP, TCP/UDP, Fibre Chan., VoIP, and Video Testing Manual 193
Chapter 8 Loopback Testing
Specifying a unit identifier
Loopback messages
During loopback testing, if you initiate or end the loopback from the local unit
using the Loop Up and Loop Down actions, messages are sent to each loopback partner indicating the status of the loopback. These messages appear in
the Message Bar provided on the Main screen of the user interface.
When you configure your unit for a loopback test, you can specify a “Unit Identifier” which will be provided in each loop up or loop down frame sent from the
unit.
Loopback tests
If your instrument is configured and optioned to do so, you can run a loopback
test using each of the applications listed in Table 19.
Table 19 Applications used for loopback testing
1 GigE
Optical
Ethernet
or Fibre
Channel
2 Gig,
4 Gig or
8 Gig2
Fibre
Channel
10 GigE
LAN
Ethernet
10 GigE
WAN
Ethernet
Application1
10/100/1000
100 FX
Optical
Ethernet
Layer 2 Traffic
√
√
√
√
√
√
Layer 2 Multiple Streams
√
√
√
N/A
√
√
Layer 3 Traffic
√
√
√
N/A
√
√
Layer 3 Multiple Streams
√
√
√
N/A
√
√
Layer 4 Traffic
√
√
√
N/A
√
N/A
Layer 4 Multiple Streams
√
√
√
N/A
√
N/A
1. If both units are capable of generating traffic, select a Terminate mode application for each unit. If the loopback unit cannot
generate traffic, place it in Loopback mode.
2. 8Gigabit Fibre Channel XFPs require an MSAMv2 for proper operation.
You can also loop back layer 2 and layer 3 traffic when running NextGen applications carrying a GFP payload.
Specifying a unit identifier
You can specify an identifier to be carried in all loop up and loop down frames
originating from your unit. This allows a technician on the far end to determine
where the loop commands came from.
The default identifier for the MSAM is “JDSU 6000”. The default identifier for
the Transport Module is “JDSU 8000”.
To specify a unit identifier
1 If you haven’t already done so, use the Test Menu to select the application
for the interface you are testing.
2 Select the Setup soft key, and then select the Interface tab.
194
Ethernet, IP, TCP/UDP, Fibre Chan., VoIP, and Video Testing Manual
Chapter 8 Loopback Testing
Using LLB to loop received traffic back to the local unit
3 Select the Unit Identifier setting, and then type the identifier using up to 25
characters.
The identifier is specified.
NOTE:
If you are observing loop up or loop down messages on another Transport
Module or MSAM, the full unit identifier appears in the messages. If you are
observing the messages on other JDSU Ethernet testers, such as the
FST-2802 or the HST (with an Ethernet SIM), the identifier will be truncated,
and will display only the first ten characters.
Using LLB to loop received traffic back to the local unit
You can loop received traffic through to a unit’s transmitter and back to the
local (traffic-originating) unit by selecting the LLB action button provided on the
loopback unit.
To loop received traffic back using LLB
1 If you haven’t already done so, on both units, launch the layer 2, layer 3,
layer 4, triple play, or multiple streams application for the circuit you are
testing (see “Step 1: Selecting a test application” on page 2).
If you are looping back traffic on an Ethernet circuit, and both units are
capable of transmitting traffic, place each in Terminate mode; otherwise, if
the loopback unit is not capable of generating traffic, place it in Loopback
mode.
If you are looping back traffic on a Fibre Channel circuit, place both units
into Terminate mode. Loopback mode is not available for Fibre Channel
applications.
Refer to the sections below for a list of available applications:
– “Ethernet and IP test applications” on page 24
– “MiM applications” on page 25
– “TCP and UDP applications” on page 148
– “Multiple Streams testing” on page 166
– “Fibre Channel test applications” on page 250
2 On the local unit, specify the link initialization settings.
– If you are looping back traffic on an Ethernet circuit, see “Specifying
interface settings” on page 42.
– If you are looping back traffic on a Fibre Channel circuit, see “Specifying interface settings” on page 252.
3 On the local unit, specify the settings for transmitted traffic.
If you are looping back a single stream of layer 2 traffic, refer to one of the
following:
– “Layer 2 testing” on page 42
– “Configuring layer 2 MAC-in-MAC tests” on page 122
– “Configuring layer 2 Fibre Channel tests” on page 252
Ethernet, IP, TCP/UDP, Fibre Chan., VoIP, and Video Testing Manual 195
Chapter 8 Loopback Testing
Using Loop Up to initiate a loopback from the local unit
If you are looping back a single stream of layer 3 traffic, refer to the
following:
– “Layer 2 testing” on page 42
– “Layer 3 testing” on page 75
If you are looping back a single stream of layer 4 traffic, refer to the
following:
– “Layer 2 testing” on page 42
– “Layer 3 testing” on page 75
– “Specifying layer 4 settings” on page 150
If you are looping back multiple streams of traffic, refer to the following as
appropriate for your application:
– “Enabling multiple streams” on page 170
– “Specifying layer 2 stream settings” on page 175
– “Specifying layer 3 stream settings” on page 177
– “Specifying layer 4 stream settings” on page 177
– “Specifying layer 2 and layer 3 settings for Triple Play services” on
page 184
4 On the loopback unit, do the following:
a If you are running a single-stream application, verify that the applicable
filter settings are either disabled, set to Don’t Care, or that they match
the settings for the traffic transmitted from the local unit.
b On the Main screen, select the Actions tab, and then select LLB.
5 On the local unit, select the Actions tab, and then select one of the
following:
– Start Traffic (if you configured a constant, burst, or flooded load).
– Start Ramp (if you configured a ramped traffic load).
When the loopback unit receives the traffic, it does the following:
– Determines which frames or packets satisfy its filter criteria. Only traffic
that satisfies the criteria will be looped back to the near end unit.
– Swaps the destination and source addresses or port IDs, and if applicable, port number for every frame or packet it receives.
– Transmits the traffic back to the local unit.
Traffic is looped back to the local unit.
Using Loop Up to initiate a loopback from the local unit
You can select the Loop Up button on the local (traffic generating) unit to loop
up another unit on the circuit. After sending the Loop Up frame, a confirmation
message from the loopback unit appears in the message bar of the Main
screen of your local unit informing you that the loopback is successful.
Before sending the Loop Up frame, your unit must be configured as follows:
– If you are looping back layer 2 non-VPLS Ethernet traffic, the near end unit
automatically detects the MAC address for the next unit on the circuit;
therefore, you do not need to configure the destination MAC address. It
will be populated automatically for you.
196
Ethernet, IP, TCP/UDP, Fibre Chan., VoIP, and Video Testing Manual
Chapter 8 Loopback Testing
Using Loop Up to initiate a loopback from the local unit
If you want to loop up a specific device, you can specify that you are using
a Unicast loop type, and then specify the destination MAC address for the
device you are looping up.
– If you are looping back layer 2 Fibre Channel traffic, the near end unit
automatically detects the source port ID for the next Fibre Channel port on
the circuit; therefore, you do not need to configure the destination port ID
(D_ID). It will be populated automatically for you.
– If you are looping back layer 3 traffic, you must specify the source IP
address for the unit on the far end of the circuit as the destination IP
address for traffic transmitted by the local unit.
Be certain to specify the same destination address for the filter on the
receiving loopback unit.
– If you are looping back layer 3 or layer 4 traffic, and you want to use ARP
to populate the units MAC addresses; be certain to enable ARP on both
units.
– If you are looping back layer 4 traffic, after you issue the Loop Up
command (from the local unit), and the unit receives a response from the
far end unit indicating that the loopup was successful, the local unit’s ATP
Listen IP Address and ATP Listen Port are automatically set to the destination IP address and destination port number carried in the looped back
traffic. The far end unit’s ATP Listen IP Address and ATP Listen Port will
also automatically be set to the destination IP address and destination port
carried in the traffic it receives from the local unit.
– You can optionally specify unit identifiers for each unit (for example,
“SamsUnit” and “JoesUnit”). When the units send confirmation messages
to each other indicating the status of the loopback, the messages will identify each unit using the identifier. For details, see “Specifying a unit identifier” on page 194.
To initiate a loopback from the local unit
1 If you haven’t already done so, launch the layer 2, layer 3, layer 4,
triple play, or multiple streams application for the circuit you are testing
(see “Step 1: Selecting a test application” on page 2). Refer to the sections
below for a list of available applications:
– “Ethernet and IP applications” on page 25
– “MiM applications” on page 25
– “TCP and UDP applications” on page 148
– “Multiple Streams testing” on page 166
2 On the local unit, specify the link initialization settings (see “Specifying
interface settings” on page 42).
3 On the local unit, specify the settings for transmitted traffic. Depending on
the application you selected, see:
– “Layer 2 testing” on page 42
– “Layer 3 testing” on page 75
– “Configuring layer 2 MAC-in-MAC tests” on page 122
– “Specifying layer 4 settings” on page 150
– “Enabling multiple streams” on page 170
– “Specifying layer 2 stream settings” on page 175
– “Specifying layer 3 stream settings” on page 177
Ethernet, IP, TCP/UDP, Fibre Chan., VoIP, and Video Testing Manual 197
Chapter 8 Loopback Testing
Using Loop Up to initiate a loopback from the local unit
– “Specifying layer 4 stream settings” on page 177
– “Specifying layer 2 and layer 3 settings for Triple Play services” on
page 184
4 If you are looping back a single stream of non-VPLS layer 2 traffic,
proceed to step 8.
5 If you are looping back a single stream of traffic, on the local unit, do the
following (as appropriate for your particular test); otherwise, if you are
looping back multiple streams of traffic, proceed to step 6:
– If you are looping back layer 2 VPLS traffic, specify the far end unit’s
source MAC address as the destination MAC address for transmitted
traffic.
– If you are looping back layer 3 or layer 4 traffic, specify the far end
unit’s source IP address as the destination IP address for transmitted
traffic.
– If you are looping back layer 4 traffic, specify the far end unit’s source
port number as the destination port for transmitted traffic.
6 If you are looping back multiple streams of traffic, source MAC addresses
and IP addresses can be specified for all enabled streams (on the All
Streams tab) or on a stream-by-stream basis (on the Ethernet or IP subtab for each individual stream).
When looping back multiple streams of layer 4 TCP/UDP traffic, you can
specify a unique source service type and port number for each stream, or
you can specify the information for one stream, and then copy it to all other
streams.
To specify source addresses and ports, on the local unit, do the following:
– If you want to assign a unique source MAC address to each layer 2
stream, be certain to specify Per Stream as the Source MAC Mode on
the All Streams setup tab, then specify the source MAC addresses on
the tabs corresponding to each enabled stream.
– If you want to assign a unique source IP address to each layer 3
stream, be certain to specify Static-Per Stream as the Source Type on
the All Streams setup tab, then specify the source IP addresses on the
tabs corresponding to each enabled stream.
– If you want to assign a unique source port number to each layer 4
stream, specify the port number on the tabs corresponding to each
enabled stream.
7 On the far end unit, do the following:
a Ensure that automatic traffic generation is not enabled. If it is not
disabled, the unit will not respond to the loop up command.
b If you are looping back multiple streams of TCP/UDP traffic, specify a
listen port for each enabled stream that matches the destination port in
the corresponding stream received from the near end unit.
198
Ethernet, IP, TCP/UDP, Fibre Chan., VoIP, and Video Testing Manual
Chapter 8 Loopback Testing
Using Loop Up to initiate a loopback from the local unit
8 On the near end unit, select the Action tab, and then select Loop Up to put
the far end unit in loopback mode. The following occurs:
– A confirmation message appears in the message bar of the near end
unit indicating that the loopback was successful.
– For layer 4 loopbacks, if a confirmation message appeared, the ATP
listen port (or ports for multiple streams) on the near end are automatically populated.
– If a layer 4 loopback at the far end was successful, and you are looping
back traffic using a single stream application, the ATP listen port on the
far end is automatically populated.
9 On the near end unit, select one of the following:
– Start Traffic (if you configured a constant, burst, or flooded load).
– Start Ramp (if you configured a ramped traffic load).
When the far end unit receives the traffic, it does the following:
– Determines which frames or packets satisfy its filter criteria. Only traffic
that satisfies the criteria will be looped back to the near end unit.
– Swaps the destination and source MAC or IP address, and if applicable, port number for every frame or packet it receives.
– Transmits the traffic back to the unit on the near end.
Traffic is transmitted and looped through the unit on the far end (if it passes the
far end unit’s filter criteria).
To loop down the far end unit
1 On the near end unit, select the Action tab, and then select Stop Traffic or
Stop Ramp.
2 On the near end unit, select Loop Down.
The far end unit is looped down, and a confirmation message appears in the
message bar of the near end unit indicating that the loop down was successful.
Ethernet, IP, TCP/UDP, Fibre Chan., VoIP, and Video Testing Manual 199
Chapter 8 Loopback Testing
Using Loop Up to initiate a loopback from the local unit
200
Ethernet, IP, TCP/UDP, Fibre Chan., VoIP, and Video Testing Manual
Chapter 9
IP Video Testing
9
This chapter provides information on testing video over IP services. Topics
discussed in this chapter include the following:
– “About IP Video testing” on page 202
– “Populating the Address Book” on page 215
– “Specifying interface settings” on page 217
– “Specifying Video settings” on page 217
– “Specifying Ethernet filter settings” on page 217
– “Specifying result threshold settings” on page 219
– “Specifying latency distribution settings” on page 220
– “Specifying IGMP settings” on page 221
– “Joining streams” on page 222
– “Observing physical layer and link statistics” on page 223
– “Observing stream statistics” on page 224
– “Leaving streams” on page 224
– “Basic principles of IP Video testing” on page 225
Ethernet, IP, TCP/UDP, Fibre Chan., VoIP, and Video Testing Manual 201
Chapter 9 IP Video Testing
About IP Video testing
About IP Video testing
If your instrument is configured and optioned to do so, you can use it to verify
the proper installation and configuration of IPTV and IP Video transport
service, and then verify that key quality of service (QoS) requirements have
been satisfied per a customer’s service level agreement (SLA).
The instrument allows you to:
– Automatically discover up to 32 MPTS or 512 SPTS video streams on a
circuit.
– Quickly determine whether problems occur at the physical or link layer, on
the transport network, or in the video streams themselves by observing the
color-coded Summary Status results.
– Determine whether problems are occurring at the video head end, in the
transport network, or in the access network by conducting tests at various
locations on the network (see Figure 54).
– Validate video flows by configuring the module to emulate a service end
point.
– Verify transport network performance of video streams by measuring critical parameters such as bandwidth, packet loss, jitter, and loss distance.
– Analyze multiple streams sent to different end customers and locations to
determine whether problems occur in the metro or access segment of the
network.
Figure 54 IP Video network architecture
For a brief overview of the key concepts involved in IP Video testing, see “Basic
principles of IP Video testing” on page 225.
Understanding MPEG video
transport streams
202
At a minimum, each MPEG video transport stream is comprised of a source
and destination IP address, and a UDP port number. They are typically encapsulated within RTP/UDP/IP or UDP/IP streams. If a stream is encapsulated in
an RTP stream, the RTP header is also present. If applicable, the required
VLAN, VPLS, or Q-in-Q tags or labels are also carried in the stream.
Ethernet, IP, TCP/UDP, Fibre Chan., VoIP, and Video Testing Manual
Chapter 9 IP Video Testing
About IP Video testing
Figure 55 illustrates a typical IPTV encapsulation scheme.
Figure 55 IPTV Encapsulation
Single program transport streams
Single program transport streams (SPTS) carry a single program; therefore,
when you run SPTS applications, each of the analyzed streams is carrying one
program, and when you observe results in streams view, program results
appear for each stream on a one-to-one basis.
Multiple program transport streams
Multiple program transport streams (MPTS) carry multiple programs; therefore, when you run MPTS applications, each of the analyzed streams is
carrying more than one program, and when you observe results in streams
view, multiple programs appear and can be analyzed for any particular stream.
Understanding the Explorer
and Analyzer applications
The MSAM allows you to quickly determine what is happening on a link by
discovering, then observing many MPTS or SPTS transport streams using the
Explorer application. If necessary, you can then analyze a single MPTS stream
or a subset of SPTS streams in greater detail to troubleshoot issues on the link.
Explorer applications
The Explorer applications allow you to discover and then monitor up to
32 MPTS or 512 SPTS streams, and observe key results such as the MPEG
status, the number of programs carried in the stream, the layer 1 bandwidth
utilized by the stream (in Mbps), packet loss, and packet jitter measurements.
When running an Explorer application, you can establish thresholds for
declaring key errors, such as IP jitter and packet loss.
Analyzer applications
The Analyzer applications allow you to monitor a single MPTS stream or
16 SPTS streams, observe comprehensive transport layer and MPEG-2 layer
results, and observe aggregate physical layer and link statistics for the stream
or streams. When running an Analyzer application, you can establish detailed
thresholds for declaring a variety of errors, including:
– Continuity errors
– PCR Jitter
– Synchronization errors
– Transport (TEI) errors
– PAT, PMT and PID errors
Ethernet, IP, TCP/UDP, Fibre Chan., VoIP, and Video Testing Manual 203
Chapter 9 IP Video Testing
About IP Video testing
– MDI delay factor and media loss rate (if optioned)
– Packet jitter, loss distance, and loss periods
– Packet Loss
Understanding MSTV
Microsoft media room television (MSTV) is Microsoft’s proprietary IPTV. It is a
distributed operating system that runs both on the servers and on the STBs. It
performs end-to-end configuration, provisions the video servers, links the electronic program guide (EPG) with the content, acts as a boot server for the STB
and ensures that all STBs run compatible software. MSTV Architecture
contains a number of servers, running on Microsoft platforms used to provide
content storage and delivery in a service provider's network. MSTV streams
are almost always VBR streams.
Acquisition server (A-Server) performs live content acquisition from various
local and terrestrial sources for linear broadcast TV. A -Server packetize it over
RTP and send it to all D-server and STBs listening to the same sources.
Distribution servers (D-servers) are used to distribute frequently used content
from various points of presence in the provider's network for faster access and
to minimize channel switching time. D-Server serves the STB clients with both
R-UDP and ICC, which are transmitted as unicast packets of TS/RTP/UDP.
Lost packets are also restored between A and D server with R-UDP unicast or
multicast packets.
STBs are customer premises equipment interfaced with the TV which also run
Microsoft proprietary software. For a channel change, the STB sends
ICCIGMP join request to the D-server and D-server sends a response back,
followed by a short unicast burst of traffic to enable the channel change.
Instant Channel Change (ICC)
Unlike channel switching on cable TV, where changes are “instant”, inherent
switching and routing delays in an IP network cause channel switches to be
visibly slower (one to two seconds). To eliminate the channel change delay
inherent in digital cable, satellite, and IPTV networks set-top-boxes support
Microsoft Instant Channel Change (ICC) capability used to implement very fast
channel change.
Microsoft uses a combination of short unicast burst of data (starting with an
MPEG “I” frame) at a 20-30% higher bitrate than normal at the beginning of
channel tuning from the STB to the D-Servers, Begins with I frame so that playback can begin immediately. Fills the STB buffer. After the buffer is full it joins
the multicast stream. The first request implements ICC by accelerating video
for the first seconds, followed by 'normal' video flow.
Channel change time, also known as Zap time, is an important metric for IPTV
QOS. Zap time refers to the channel change delay, or how quickly and reliably
the user can change the channel. It is the time between sending of channel
leave request and receiving of first video stream data for the new, just joined
video stream.
Microsoft R-UDP
204
MSTV uses R-UDP protocol for IPTV service delivery over multicast networks.
This is Microsoft proprietary protocol. It focuses on replacing lost packets as
reported by a STB. Retries between Dserver and STB is unicast. The source
listens on a IP or UPD port for the retries.The STB makes requests for the lost
packets. The Dserver responds with lost packets as unicast packets of
Ethernet, IP, TCP/UDP, Fibre Chan., VoIP, and Video Testing Manual
Chapter 9 IP Video Testing
About IP Video testing
TS/RTP/UDP. The Dserver uses the overhead bandwidth allocated over the
max bit rate to server the additional packets.The lost packets are reported to
the DServer in the format of the starting sequence number of the hole, followed
by the number of packets in this hole.
Features and capabilities
Features and capabilities of the MSAM include the following when testing IP
Video service:
– Address book—If you need to monitor specific streams on a regular basis,
you can add them to the address book to expedite the setup process for
future tests. You can also import addresses from and export addresses to
a USB key. After adding them to the address book, you can quickly select
them when joining streams using IGMP requests. For details, see “Populating the Address Book” on page 215.
– Timed tests and event log—You can schedule tests to run for a specific
period of time, and archive all events to a log for review at a later time.
This is useful when evaluating sporadic packet loss on a circuit, or correlating PCR jitter to instances of overall packet jitter. For details on timed
tests, see the Getting Started manual that shipped with your instrument or
upgrade. For details on the Event log, see “Event Log results” on page 403
of Chapter 13 “Test Results”.
– IGMP Version 2 or Version 3—You can optionally use Version 2 or
Version 3 of IGMP to request specific video streams when testing.
– Traffic filters—You can optionally filter monitored streams for non-tagged,
VLAN, Q-in-Q, or VPLS traffic.
– Result thresholds—When running Explorer applications, you can monitor
transport streams for packet loss and packet jitter, and either use the
default thresholds for declaring QoS alarms for either condition, or establish your own thresholds. Additional thresholds are available when running
Analyzer applications.
– Bandwidth utilization—You can determine the bandwidth utilized for each
transport stream, and then verify that error free traffic is received for each
stream.
– TR 101 290 First Priority results—You can observe the first priority results
recommended in ETSI TR 101, such as transport stream synchronization
loss, and continuity, PAT, PMT, and PID error counts.
– Detailed result analysis—You can observe detailed information for a
subset of transport streams using the Analyzer application, and then
compare results for the streams to determine if errors are due to the same
root cause.
– Identification of stream type. The instrument analyzes the stream to identify whether it is a CBR or VBR stream. The available results vary
depending on the stream type.
– MSTV. Support for Microsoft IP TV in SPTS Analyzer mode. MSTV can
monitor up to 16 multicast streams.
Understanding the graphical
user interface
When you configure your module for testing, the main screen provides three
result buttons that allow you to display physical/link quality results, transport
streams quality results, and video streams quality results. Setup tabs are
provided that allow you to specify filter criteria for monitored streams and
Ethernet, IP, TCP/UDP, Fibre Chan., VoIP, and Video Testing Manual 205
Chapter 9 IP Video Testing
About IP Video testing
establish thresholds for declaring certain errors such as packet loss or packet
jitter. If you intend to actively request specific streams using IGMP, you can
also specify settings that control the requests.
Action buttons
When running IP Video applications, buttons appear at the bottom of the Main
screen that allow you to select an SFP or specify the wavelength for an optical
connector (if applicable), turn the laser on or off, and, if you are using IGMP,
actively join or leave specific transport streams.
Restart button
When running IP Video applications, if streams are dropped during the course
of your test, they will continue to appear on your display, but the current bandwidth measurement (Total Util %, Cur) will be zero. If this occurs, you
can press the Restart button to refresh the display and show all currently
analyzed streams. The dropped streams will be cleared from the display.
Understanding the LED panel
When you select an IP Video application, LEDs appear under the result
window on the Main screen (see Figure 56).
Figure 56 IP Video LEDs
The LEDs allow you to quickly determine whether a signal is present, synchronization has been acquired, and whether or not the link is active. LEDs also
indicate whether or not frames or packets are detected on the link.
Understanding IP Video test
results
IP video results are available that allow you to verify the quality of the physical
layer, the link, the transport quality of video streams, and the quality of the
video streams and programs themselves. Figure 57 illustrates the buttons
used to verify the quality of service in each area.
Figure 57 IP Video Quality Buttons
206
Ethernet, IP, TCP/UDP, Fibre Chan., VoIP, and Video Testing Manual
Chapter 9 IP Video Testing
About IP Video testing
Layered view: Quality Layer
Buttons
The layered view appears on the Main screen the first time you launch an IP
Video application. Color coded quality buttons appear which immediately indicate the current and historical status of the physical layer and link, the transport
of the video streams (using IP, UDP, and RTP), and the video streams and
programs themselves. Figure 58 illustrates the view when all results are OK
and there is no history of errors at any layer.
Figure 58 Layered View - All Results OK
Physical/Link Quality (Interface, Ethernet)—This button displays aggregate
results (such as the bandwidth utilization, interface (layer 1) and Ethernet
(layer 2) errors for the link.
Transport Quality (IP, UDP, RTP)—This button displays test results for each
monitored IP, UDP, or RTP traffic stream.
Video Streams Quality (MPEG-2 TS)—This button displays test results for
each monitored MPEG-2 video transport stream.
After streams are discovered on the link, a count of the number of streams
passing the filter criteria, and the total layer 1 bandwidth utilized and appears
under the buttons.
Navigation Tip:
You can always return to the layered view by setting the results group to
Summary, and the category to Status.
Ethernet, IP, TCP/UDP, Fibre Chan., VoIP, and Video Testing Manual 207
Chapter 9 IP Video Testing
About IP Video testing
Layered View: Button Colors
Figure 59 illustrates the view when there are errors at the transport stream
layer and there is a history of errors at both the transport stream and video
stream layer. The Video Streams Quality button indicates that it can not
provide results for video streams because there are errors with the underlying
transport streams (Lower Layers Errored). No errors have occurred at the
physical/link layer.
Figure 59 Layered View - Errored Transport Streams
Table 20 explains each of the colors used for the current and history buttons.
Table 20 Current and History Button Colors
208
Color
Current
Historya
Green
Indicates that all results are
OK for that particular quality
group. For an example, see
Figure 58 on page 207.
N/A
Yellow
Indicates that at least one result
at that particular layer triggered
a minor alarm or error based on
the established thresholds.
Indicates that at least one result
occurred within the last test
interval that triggered a minor
alarm or error based on the
established thresholds. For an
example, see Figure 61 on
page 210.
Red
Indicates that at least one
result at that particular layer
triggered a major alarm or
error based on the established thresholds.
Indicates that at least one result
triggered a major alarm or error
based on the established
thresholds within the last test
interval. For an example, see
Figure 62 on page 211.
Ethernet, IP, TCP/UDP, Fibre Chan., VoIP, and Video Testing Manual
Chapter 9 IP Video Testing
About IP Video testing
Table 20 Current and History Button Colors (Continued)
Color
Current
Historya
Light Grey
Indicates that results are not
available because there is an
issue at a lower level that prevents your unit from determining the status for that particular
quality group. For an example,
see Figure 62 on page 211.
If a button is grey, evaluate the
test results for the lower layer
to determine the nature of the
problem.
N/A
Dark Grey
Indicates that your unit can not
detect the signal, packets, or
streams required to provide the
status for the quality layer. A
message appears on the button
stating what could not be
detected (No Signal, No IP
Streams, or No MPEG-2
Streams). For an example, see
Figure 60 on page 209.
Indicates that nothing has
occurred within the last test
interval to trigger a yellow or
red state.
a. If errors are intermittent, the large quality button (indicating the current state of the results)
will be green, but the associated history button will be red or yellow. This is due to the five
second refresh rate of your unit. Therefore, it is important to check the state of the history
button periodically during the course of your test to verify that intermittent errors are not
occurring.
Figure 60 illustrates the layered view when no IP or MPEG-2 streams are
detected, and there is a history of errors at the transport and video stream
layers.
Figure 60 Layered View: No IP or MPEG-2 streams detected
Ethernet, IP, TCP/UDP, Fibre Chan., VoIP, and Video Testing Manual 209
Chapter 9 IP Video Testing
About IP Video testing
Figure 61 illustrates the layered view when errors occurred at the transport
layer, and there is a history of warnings at the video stream layer.
Figure 61 Layered View: History of Warnings at Video Stream Layer
Streams view
The streams view appears by default after you select the
Transport Streams Quality or Video Streams Quality button.
– When you press the Transport Streams Quality button, all monitored
streams are listed.
– If you press the Video Streams Quality button while running an MPTS
application, all programs for each monitored MPTS appear.
– If you press the Video Streams Quality button while running an SPTS
application, monitored SPTS streams appear (see Figure 62).
210
Ethernet, IP, TCP/UDP, Fibre Chan., VoIP, and Video Testing Manual
Chapter 9 IP Video Testing
About IP Video testing
To optimize the number of results that appear on your display, the result
windows appear in the Full Size view by default when you run IP Video applications.
Figure 62 Video Results: Streams View (MPTS Transport Stream, Explorer application)
Stream status icons
Table 21 explains each of the icons that may appear to the left of the monitored
streams.
Table 21 Stream Status Icons
Icon
Indicates
No errors have been detected on the monitored stream.
One or more errors satisfying the alarm threshold have been
detected on the monitored stream. Errored results also appear with
a red background.
If you see a stream with a red exclamation mark, but no results
appear in red, one of the hidden results is errored.
If this occurs, select the Columns button, and then press Select all
to show all of the results available for the stream. Scroll to the right
of the results display until you locate the errored result (or results).
One or more errors satisfying the warning threshold have been
detected on the monitored stream. Errored results also appear with
a yellow background.
Ethernet, IP, TCP/UDP, Fibre Chan., VoIP, and Video Testing Manual 211
Chapter 9 IP Video Testing
About IP Video testing
Observing streams using the
Explorer Application
You can do the following when running an Explorer application:
– Observe a list of transport traffic streams or video streams by pressing the
Transport Streams Quality or Video Streams Quality button provided in
the layered view to observe a list of transport traffic streams or video
streams.
– Observe transport and video streams simultaneously by selecting the
current result group button (All Streams Video or
All Streams Transport), and then selecting All Streams Complete.
– Evaluate certain streams more thoroughly (using the Analyzer application)
by selecting the streams, and then pressing Launch Analyzer directly
from the streams display. It is not necessary to launch the application from
the Test menu. If you are analyzing streams on an optical circuit, you’ll
need to turn the laser on again after the Analyzer application launches. If
you originally joined the streams via an IGMP request, you must re-join
them. See “Joining streams” on page 222.
If you have streams displayed in multiple result windows, you can only
launch one instance of the Analyzer application. You can not launch
multiple instances of the Analyzer from different windows.
Observing streams using the
Analyzer Application
You can launch the Analyzer application using either method below:
– Via the Test Menu, which provides Analyzer applications for SPTS and
MPTS streams.
– From an Explorer application, if you want to analyze a subset of streams in
greater detail. A Launch Analyzer action button appears at the bottom of
the streams result display, allowing you to launch the application for
selected streams immediately (without returning to the Main screen).
You can do the following when running an Analyzer application:
– Press the Transport Streams Quality or Video Streams Quality button
provided in the layered view to observe a list of transport traffic streams or
video streams.
– If you would like to observe transport traffic streams and video streams
simultaneously, select the current result group button (All Streams Video
or All Streams Transport), and then select All Streams Complete.
– If you would like to observe results for a particular stream, select the
current result group button, and then select the group corresponding to the
stream number (for example, Stream 3). If the stream is named, its name
(for example, ESPN or CNN) appears in the group list instead of a stream
number.
– If you launched the Analyzer application from the Explorer application,
after you analyze the streams that were discovered by the Explorer application (which were transferred to the Analyzer application), you can press
the Rescan Streams soft key to rescan the link and discover the current
streams meeting your filter criteria. Discovered streams will not be
restricted to those that were previously discovered using the Explorer
application.
Navigation Tip:
You can always return to the streams view by setting the results group to All
Streams (Complete), All Streams Video, or All Streams Transport.
212
Ethernet, IP, TCP/UDP, Fibre Chan., VoIP, and Video Testing Manual
Chapter 9 IP Video Testing
About IP Video testing
Restart Warning:
If you launch an Explorer or Analyzer application from the Test Menu, pressing Restart clears all discovered streams from your display, and your unit
rescans the circuit and discovers streams that are currently on the circuit.
Therefore, if you are in the process of analyzing results for a particular
stream, do not press Restart.
If you launch the Analyzer application from an Explorer application (using
the Launch Analyzer button), pressing Restart will only clear your test
results; it will not rescan the circuit for new streams. The Rescan Streams
soft key is used to discover new streams.
Static and dynamic test results
When streams (and programs) are first discovered, values for certain results
are determined, displayed, and then remain static. These values remain the
same until you “discover” streams or programs again. All other dynamic results
are refreshed every five seconds.
Table 22 lists static results for each stream when running the Explorer or
Analyzer applications.
Table 22 Static IP Video Stream Test Results
Result
Explorer?
Analyzer?
IPv4 Source Address
Yes
Yes
IPv4 Destination Address
Yes
Yes
UDP Dest Port
Yes
Yes
UDP Source Port
Yes
Yes
RTP Present
Yes
Yes
VLAN ID
Yes
Yes
VLAN Priority
Yes
Yes
SVLAN ID
Yes
Yes
SVLAN Priority
Yes
Yes
VC Label (VPLS)
Yes
Yes
Tunnel Label (VPLS)
Yes
Yes
Number of Programs
Yes
Yes
Transport Stream ID
No
Yes
Table 23 lists static results for each program when running an Analyzer application.
Table 23 Static IP Video Test Results - Analyzed Programs
Result
PMT PID
Program Number
# of PIDs
PID ID
PID Types (such as Audio, Video, Other)
Ethernet, IP, TCP/UDP, Fibre Chan., VoIP, and Video Testing Manual 213
Chapter 9 IP Video Testing
About IP Video testing
Navigating the results display
When navigating through the IP Video results, consider the following:
– When you launch an application for the first time, the Summary group and
Status category appear. This is also referred to as the “layered” view (see
“Layered view: Quality Layer Buttons” on page 207).
– When you launch applications subsequent times, the result view that was
displayed the last time you ended a test appears. For example, if the
All Streams Video results were displayed the last time you ran the MPTS
Explorer application, the next time you launch the application, the
All Streams Video results will appear (see Figure 62 on page 211).
– Use the Result Group button to switch between the Summary, Physical/Link, All Streams (Complete), All Streams Video, and All Streams
Transport groups.
– When observing results in the Physical/Link group, Stats and AutoNeg
Status categories are available. Use the category button to switch categories.
– When observing results in one of the All Streams groups, the only category that is available is the All category.
– If you’d like to observe more detailed information for a particular stream,
you can select the stream, and then press Stream Details. Some results
are only available when viewing detailed results for a particular stream.
For example, if you are analyzing video streams carried on a VPLS
network, you must press Stream Details to see the VLAN, SVLAN,
Tunnel, and Virtual Channel (VC) for the stream.
– If you’d like to observe detailed results for a particular stream or program,
tap twice quickly (double-click) on the stream or program. For example, if
you are analyzing SPTS, double clicking on the first stream displays the
bandwidth utilized for the stream or program, PCR jitter measurements,
and counts for a variety of errors.
– If an up or down arrow appears in a column label, you can tap on the label
to sort the streams in ascending or descending order.
Customizing the results display
Some categories provide so much information you may need to scroll to the
right significantly to observe a particular result. In other instances, you may be
monitoring a large number of transport or MPEG-2 streams, which forces you
to scroll up and down to observe results for each analyzed stream.
To focus on a particular subset of results (and minimize scrolling), you can
specify which result columns appear on your display, and hide those that do
not apply to your test. For example, if each of the streams you are analyzing is
named, and the circuit is not configured for VPLS traffic, you may choose to
hide the IP Address, Tunnel, and VC (virtual channel) columns since they are
not necessary when evaluating your results.
To reduce the number of streams displayed, you can optionally show only
errored streams (rather than all monitored streams).
214
Ethernet, IP, TCP/UDP, Fibre Chan., VoIP, and Video Testing Manual
Chapter 9 IP Video Testing
Populating the Address Book
IP Video test applications
This release of the instrument supports the IP Video test applications for the
interfaces listed in Table 24.
Table 24 IP Video test applications
Application
10/100/1000
100M Optical
1 GigE Optical
10 GigE LAN
10 GigE WAN
MPTS Explorer
√
√
√
√
N/A
SPTS Explorer
√
√
√
√
N/A
MPTS Analyzer
√
√
√
√
N/A
SPTS Analyzer
√
√
√
√
N/A
Populating the Address Book
The MSAM provides an Address Book which you can populate with the
streams that you know you intend to request and monitor on a regular basis.
When running MPTS applications, you can also add and name specific
programs carried in each stream.
After you store streams and programs in the address book, you can join them
using the Join Streams button provided on the Main screen.
Adding streams
To add streams to the address book
1 If you haven’t already done so, launch an IP Video application. For a list of
applications, see Table 24 on page 215.
2 Press the Address Book soft key.
3 Under New Entry, specify the following:
a If the stream is identified using a combination of source IP address and
destination address, in Source IP, enter the source address for the
stream; otherwise, accept the default value of 0.0.0.0 (which indicates
that streams with any source address carrying the specified destination
address will be added).
A source IP address is only required if you are issuing requests using
IGMPv3.
b In Dest. IP, specify the destination address carried in the stream. The
destination IP address is required.
c Optional. If you are running an MPTS Analyzer application, and you
want to specify the program ID carried in the program mapping table
(PMT) for the stream, in PMT PID, enter the PID. If you intend to name
the stream, you must specify the PID (to distinguish the program from
other programs carried in the stream).
d In Name, type the name you want to use to identify the stream or
program.
4 Select Add Entry.
The stream is added to the address book, and it appears in the streams list.
Delete and Delete All buttons are provided if you need to remove streams from
the book.
Ethernet, IP, TCP/UDP, Fibre Chan., VoIP, and Video Testing Manual 215
Chapter 9 IP Video Testing
Populating the Address Book
Updating stream data
After you add a stream, you can update the name, source IP address, destination IP address, and if applicable, PID by selecting the corresponding data on
your touch screen.
To update stream data
1 Select the data you want to update (Name, Source IP, Destination IP, or
PMT PID).
A keypad appears.
2 Type the new name, address, or PID, and then select OK.
The data is updated.
Importing or exporting
streams
You can store a list of streams as a CSV file on a USB key, and then import
them into the address book. You can also export address book data to a USB
key, and then load it onto another unit.
To import streams
1 If you haven’t already done so, launch an IP Video application. For a list of
applications, see Table 24 on page 215.
2 Press the Address Book soft key.
3 Insert the key with the CSV file into a USB slot on your unit.
The unit beeps to indicate that it recognized the key.
4 To import stream entries, do the following:
a Select Import. The Import Entries From USB dialog box appears.
b Select the .csv file with the entries that you want to import, and then
select Import Entries.
Streams are imported, and appear on the dialog box.
5 To export stream entries, do the following:
a Select Export. The Export Entries To USB dialog box appears.
b Type a file name for the CSV file that will contain the exported stream
entries, or accept the default file name (IPTV_Address_Book_YYYYMM-DD, where YYYY represents the current year, MM represents the
month, and DD represents the day). If you enter your own filename,
you do not need to type the .csv extension.
c Select Export Entries.
Streams are exported to the USB key.
Stream entries are imported or exported.
TIP: SORTING PHONE BOOK ENTRIES
You can easily sort the entries in ascending or descending order using the
data provided. For example, to sort the entries by name, select the heading
for the Name column. To sort the entries in descending order by destination
IP address, select the Destination IP heading. Selecting a heading a second
time reverses the order.
216
Ethernet, IP, TCP/UDP, Fibre Chan., VoIP, and Video Testing Manual
Chapter 9 IP Video Testing
Specifying interface settings
Specifying interface settings
Before monitoring IP Video traffic on an optical circuit, you can specify interface settings which:
– Indicate which SFP jack you are using (if your unit is equipped with SFP
jacks).
– Specify the transmitted wavelength (if your unit is equipped with 850 nm,
1310 nm, and 1550 nm connectors).
– Allow your unit to communicate with another Ethernet device (when
requesting video traffic using IGMP).
For details on the various connectors used to connect to the circuit, refer to the
printed Getting Started User’s Manual that shipped with your unit. For details
on specifying the information required to establish a link to another device, see
“Specifying interface settings” on page 42 of Chapter 4 “Ethernet and IP
Testing”.
Specifying Video settings
After specifying interface settings, specify the Video settings. These settings
are only available in SPTS Analyzer applications.
To specify video settings
1 If you haven’t already done so, use the Test Menu to select the test application for the interface you are testing. Refer to Table 24 on page 215 for a
list of applications.
2 Select the Setup soft key, and then select the Video tab.
3 Specify the Protocol Mode: IPTV (typical IPTV) or MSTV (Microsoft
proprietary IPTV).
The video settings are specified.
Specifying Ethernet filter settings
Before monitoring video traffic, you can specify settings that determine which
traffic passes through the filter for analysis. For example, you can set up the
filter to observe multicast traffic carried on a specific VLAN, or unicast and
multicast traffic carried on a particular VPLS tunnel, or traffic for a specific STB.
NOTE:
If you are joining specific streams using IGMP requests, be certain to configure the filter using the same encapsulation criteria to ensure that the
streams pass through the filter for analysis. For details, see “Joining
streams” on page 222.
To filter received traffic
1 If you haven’t already done so, use the Test Menu to select the test application for the interface you are testing. Refer to Table 24 on page 215 for a
list of applications.
2 Select the Setup soft key, and then select the Ethernet Filter tab.
Ethernet, IP, TCP/UDP, Fibre Chan., VoIP, and Video Testing Manual 217
Chapter 9 IP Video Testing
Specifying Ethernet filter settings
3 If you do not want to analyze video streams on a VPLS circuit, skip this
step and proceed to step 4.
If you want to analyze video streams on a VPLS circuit, specify the
following filter settings:
Setting
Specify
VPLS Enabled
Yes
Tunnel ID Filter
If you want to analyze video streams carried on a specific tunnel, select Yes; otherwise, to analyze streams
carried on any tunnel, select Don’t Care.
Tunnel ID
(Tunnel ID Filter is
Yes)
Enter the ID for the tunnel carrying the video streams
that you want to analyze.
VC ID Filter
If you want to analyze video streams carried on a specific virtual circuit, select Yes; otherwise, to analyze
streams carried on any circuit, select Don’t Care.
VC ID
Enter the ID for the virtual circuit carrying the video
streams that you want to analyze.
4 In Encapsulation, specify the type of traffic you want to analyze:
Encapsulation
Settings
None, VLAN, or
Q-in-Q
No additional settings required. Only unencapsulated,
VLAN-tagged, or Q-in-Q tagged traffic will pass through
the filter for analysis. VPLS traffic will not be analyzed.
None
No additional settings required. Only unencapsulated
traffic will pass through the filter for analysis. VPLS traffic will not be analyzed.
VLAN
Specify VLAN ID
If you want to analyze traffic carried on a specific VLAN,
select Yes; otherwise, to analyze traffic on multiple
VLANs, select Don’t Care.
VLAN ID (Specify VLAN ID must be Yes)
Specify the ID of the VLAN carrying the traffic you want
to analyze.
Q-in-Q
Specify CVLAN ID
If you want to analyze traffic on a specific customer or
service provider VLAN, select Yes; otherwise, to analyze traffic on multiple VLANs, select Don’t Care.
CVLAN ID (Specify CVLAN ID must be Yes)
Specify the ID of the customer VLAN carrying the traffic
you want to analyze.
SVLAN ID (Specify CVLAN ID must be Yes)
Specify the ID of the service provider VLAN carrying the
traffic you want to analyze.
5 In Traffic Type, specify whether you want to analyze Multicast traffic
(traffic sent to a variety of destinations), or Multicast & Unicast traffic
(traffic sent to a variety of destinations, or to a single destination).
The settings are specified to filter traffic for analysis.
218
Ethernet, IP, TCP/UDP, Fibre Chan., VoIP, and Video Testing Manual
Chapter 9 IP Video Testing
Specifying result threshold settings
Specifying result threshold settings
Before analyzing traffic, you can specify settings that control how your unit
interprets a variety of test results. Thresholds for declaring that certain results
are in an alarm state (and reported in red on your results display), and whether
they are approaching an alarm state (and reported in yellow) are available.
Red results (results in an alarm state) are also reported in the Event Log.
For example, when configuring an Explorer application, you can indicate that
if more than two packets are lost during a test interval (5 seconds), the packet
loss result (and any associated result buttons) should appear in red. You can
also indicate that if more than one packet is lost, the result and buttons should
appear in yellow (to serve as a warning that something may be wrong).
When configuring Analyzer applications, you can also indicate when certain
errors, such as period errors or distance errors should be declared.
The test interval used to calculate alarm results varies depending on the type
of result (see Table 20). Each test interval is treated as a separate time slot.
Table 25 Alarm Test Intervals
Result
Test Interval
Explorer
Application
Analyzer
Application
Packet Loss
5 seconds
Yes
Yes
Continuity Counter Errors
5 seconds
No
Yes
MDI Media Loss Rate
5 seconds
No
Yes
Sync Errors
5 seconds
No
Yes
PAT/PMT Errors
5 seconds
No
Yes
Transport Errors (TEI)
5 seconds
No
Yes
PID Errors
5 seconds
No
Yes
Packet Jitter (ms)
1 second
Yes
Yes
MDI Delay Factor
1 second
No
Yes
MDI Media Loss Rate
1 second
No
Yes
To specify result threshold settings
1 If you haven’t already done so, use the Test Menu to select the IP Video
application for the interface you are testing. Refer to Table 24 on page 215
for a list of applications.
2 Select the Setup soft key, and then select the Result Thresholds tab.
3 Under QoS Alarm Thresholds, for each result listed, specify the following:
– In Raise alarm if above, specify the threshold for displaying the result
(and any associated buttons) in red.
– In Warn if at least, specify the threshold for displaying the result (and
any associated buttons) in yellow.
If you are configuring an Explorer application, or if the streams you are
analyzing are not encapsulated using RTP, the thresholds are specified.
You do not need to proceed to step 4.
Ethernet, IP, TCP/UDP, Fibre Chan., VoIP, and Video Testing Manual 219
Chapter 9 IP Video Testing
Specifying latency distribution settings
4 If you are configuring an Analyzer application, and the analyzed streams
are carried in RTP, specify the following under QoS Error Thresholds:
– Period Error - Loss Period must exceed. Enter the threshold for
declaring a Period Error. The threshold represents the number of
packets lost sequentially before a Period Error is declared. The
number of sequentially lost packets constitutes the “Loss Period”.
– Distance Error - Distance between periods must fall below. Enter
the threshold for declaring a Distance Error. The threshold represents
the minimum number of packets that must be received in between
declared Loss Periods to constitute an acceptable distance between
errors. If the number of received packets between Loss Periods falls
below the threshold, a Distance Error is declared. Essentially, the specified number of packets constitutes the “distance”.
The result thresholds are specified. Alarms, warnings, errors, and the Event
Log will be handled according to your settings.
Specifying latency distribution settings
If you are testing Mirosoft IPTV streams (selected MSTV on the Video setup
screen), the latency distribution settings are available.
To specify latency distribution settings
1 If you haven’t already done so, use the Test Menu to select the test application for the interface you are testing. Refer to Table 24 on page 215 for a
list of applications.
2 Select the Setup soft key, and then select the Latency Dist. tab.
220
Ethernet, IP, TCP/UDP, Fibre Chan., VoIP, and Video Testing Manual
Chapter 9 IP Video Testing
Specifying IGMP settings
3 Specify the following:
Setting
Description
ICC Latency Distribution
(with Burst)
Specify the minimum and maximum amount of
time, in milliseconds, of an MSTV ICC request
message to the first unicast media packet.
ICC Latency Distribution
(without Burst)
Specify the minimum and maximum amount of
time, in milliseconds, of an MSTV ICC request
message to the first multicast media packet.
RUDP Latency Distribution
Specify the minimum and maximum amount of
time, in milliseconds, of an MSTV RUDP
request message to the first unicast retry
media packet.
The latency distribution settings are specified.
Specifying IGMP settings
Before testing, you can set up your unit to emulate a downstream IGMP client,
and then actively request video streams from an IGMP router. To do so, you
specify the version of IGMP to use (Version 2 or 3), and the source IP address,
subnet mask, and default gateway for the unit. You can also optionally use
DHCP to assign the IP address data for you.
After specifying the IP address data, you can specify a user-defined source
MAC address for your unit, or you can use the factory assigned MAC address
Finally, you should specify the frame format used on the network to ensure that
streams are not dropped during the course of your test. You can optionally
encapsulate the requests in VLAN or Q-in-Q tagged Ethernet frames. If you do
so, you must specify the associated VLAN IDs and priorities.
If you are issuing the requests using IGMP Version 2, you can specify durations to wait before retrying requests for a single stream or multiple streams.
IGMP WARNING:
Be certain to configure IGMP on your unit before using it to join streams. If
you change any setting on the IGMP setup screen after joining streams, the
unit will automatically leave all currently joined streams.
To specify your unit’s IGMP settings
1 If you haven’t already done so, use the Test Menu to select the IP Video
application for the interface you are testing. Refer to Table 24 on page 215
for a list of applications.
2 Select the Setup soft key, and then select the IGMP tab.
3 Under Customize IGMP Requests, in Format, select IGMP v2 or IGMP v3.
4 If no reply is received to in response to a request, your unit will wait
120 seconds before issuing another join request for a single stream and
50 milliseconds between consecutive stream requests.
If you are using IGMP v3, your unit will wait for a response for the default
intervals before issuing another request; proceed to step 5.
Ethernet, IP, TCP/UDP, Fibre Chan., VoIP, and Video Testing Manual 221
Chapter 9 IP Video Testing
Joining streams
If you selected IGMP v2, and you would like to change the default intervals, select the appropriate field, and then specify the interval.
5 In Source IP Type, indicate whether you are using a static IP address, or
whether you want to use DHCP to assign the address for you. If you use a
static address, specify the Source IP address, Subnet Mask, and Default
Gateway carried by the requests.
6 Specify the Source MAC address type (Factory Default or User
Defined). If you select User Defined, specify the address.
7 In Ethernet Frame Type, indicate whether the requests are made using
DIX or 802.3 frames. Be certain to enter the same format used by switches
on the circuit you are monitoring.
8 In Encapsulation, select None, VLAN, or Q-in-Q. If you select VLAN or
Q-in-Q, specify the required encapsulation settings. For details on the
settings, refer to “Configuring VLAN tagged traffic” on page 50 and
“Configuring Q-in-Q traffic” on page 50 of Chapter 4 “Ethernet and IP
Testing”.
9 If you specified VLAN or Q-in-Q as your encapsulation setting, to ensure
that traffic passes through the filter for analysis, select the Ethernet Filter
tab, and then specify the same encapsulation settings.
The settings are specified. You are ready to join streams (see “Joining
streams” on page 222).
Joining streams
To join a particular stream (or streams), you press the Join Streams button on
the Main screen, and then either select the stream from the address book, or
specify the address (or addresses) for the stream that you want to join manually. Table 26 lists the number of streams you can join when running each of
the IP Video applications.
Table 26 Maximum number of streams analyzed
Application
SPTS
MPTS
Explorer
512
32
Analyzer
16
1
After your instrument discovers streams for analysis, you can only actively join
streams up to the maximum number supported. For example, if you are
running an MPTS Explorer application, and your instrument discovers 30 video
streams, you can only actively join and then analyze two additional streams.
Although you can add streams as you need them on the Join Streams screen,
if you’d like to name the stream or name a PMT PID for a specific program for
a stream, you must use the Address Book soft key provided on the Main
screen. For details, see “Populating the Address Book” on page 215.
To join streams
1 If you haven’t already done so, use the Test Menu to select the IP Video
application for the interface you are testing. Refer to Table 24 on page 215
for a list of applications.
222
Ethernet, IP, TCP/UDP, Fibre Chan., VoIP, and Video Testing Manual
Chapter 9 IP Video Testing
Observing physical layer and link statistics
2 On the Main screen, select the Join Streams button.
The Join Streams screen appears.
3 For each of the streams you want to join, do one of the following:
If....
Do this ...
The stream appears in the
Address Book
Tap on the stream, and then press Select.
The stream appears under Selected Streams.
You are using IGMP v2, and
the stream does not appear
in the Address Book
Tap the Dest. IP field, and then use the keypad to enter the destination IP address for the
stream.
You are using IGMP v3, and
the stream does not appear
in the Address Book
–
–
If you want to request the stream using
just the destination IP address, accept the
default source IP address (0.0.0.0), and
then enter the destination IP address.
If you want to request the stream using a
source IP address and destination IP
address, tap each field to enter the
addresses.
The streams are selected, and appear under Selected Streams.
4 After selecting the streams, press Join Streams.
You are returned to the Main screen. Your unit issues IGMP requests to
join the streams, and messages concerning the status of the request
appear in the Message bar at the top of the screen.
5 Select the All Streams Complete, All Streams Transport or All Streams
Video result group.
Results for the requested streams appear.
If, after waiting for 5 seconds, streams do not appear, press Setup, and then
verify that you have specified the correct Ethernet Filter and IGMP settings
(see “Specifying Ethernet filter settings” on page 217 and “Specifying IGMP
settings” on page 221).
Observing physical layer and link statistics
When monitoring video streams, you can quickly verify the state of the physical
layer and the link by observing the Physical/Link Quality button. If green, all
results are OK at these two layers.
If the button is yellow or red, you must investigate and resolve the problem
before evaluating transport and video stream results.
To observe physical layer and link statistics
1 If you haven’t already done so, use the Test Menu to select the test application for the interface you are testing. Refer to Table 24 on page 215 for a
list of applications.
2 On the Main screen, press the Physical/Link Quality button.
The Physical/Link result group appears, showing aggregate statistics for
the physical layer and the link. For example, the total number of Sync Loss
Seconds or Rx IGMP frames are provided in the Stats category.
Ethernet, IP, TCP/UDP, Fibre Chan., VoIP, and Video Testing Manual 223
Chapter 9 IP Video Testing
Observing stream statistics
3 If you want to observe results associated with the auto-negotiation of the
link, set the result category to AutoNeg Status.
The physical layer and link statistics were displayed. For descriptions of each
of the results, refer to “CPRI/OBSAI test results” on page 333 of
Chapter 13 “Test Results”.
Observing stream statistics
You can quickly verify the state of monitored transport and video streams by
observing the colors of the Transport Streams Quality and Video Streams
Quality buttons. Pressing the buttons allows you to observe results at each
layer in more detail.
To observe stream statistics
1 If you haven’t already done so, use the Test Menu to select the test application for the interface you are testing. Refer to Table 24 on page 215 for a
list of applications.
2 On the Main screen, press one of the buttons:
– Transport Streams Quality. The All Streams Transport result group
appears.
– Video Streams Quality. The All Streams Video result group appears.
3 Use the scroll bars to browse through the monitored streams. To
customize your results, you can optionally do the following:
– If you are monitoring a large number of streams, and you want to focus
only on errored streams, select Show only errored streams.
– If too many results appear for the streams, or if the results you
expected to see do not appear, select Columns..., and then clear the
check box next to the results you want to remove, or select the check
box next to the results you want to add to the display. Press Ok to
return to the result display.
– If you are running an Explorer application, and there are streams that
you want to analyze in more detail, select the Analyze check box (to
the left of the stream results), and then press Launch Analyzer.
The SPTS or MPTS analyzer application is launched. If you are monitoring streams on an optical circuit, turn the laser back on. If you originally joined the streams using an IGMP request, re-join the streams (see
“Joining streams” on page 222).
A more detailed set of results appears for the analyzed streams.
You are observing stream statistics.
Leaving streams
If you actively joined streams using IGMP requests, when you are done testing,
you should leave them.
To leave a stream
1 On the Main screen, press Leave Streams ....
The Leave Streams dialog box appears, listing each of the streams you
actively joined.
224
Ethernet, IP, TCP/UDP, Fibre Chan., VoIP, and Video Testing Manual
Chapter 9 IP Video Testing
Basic principles of IP Video testing
2 Select each of the streams you want to leave, and then press Leave
Streams.
You are returned to the Main screen. Your unit issues IGMP requests to leave
the streams, and messages concerning the status of the request appear in the
Message bar at the top of the screen.
Basic principles of IP Video testing
This section presents some of the basic principles behind IP Video testing. For
a comprehensive discussion of IP Video troubleshooting, please contact
Customer Care for a copy of the JDSU Triple Play Service Deployment Guide.
IP Video network architecture
Figure 54 on page 202 illustrates a typical IP Video network. When troubleshooting IP video service, the first step is to determine whether problems are
originating from the source of the video (indicating that there are content issues
in the actual video payload), or due to issues on the transport network.
Using the MSAM, you can identify both source and transport network issues.
Symptoms of source content errors include:
– Errors that occur on a single stream, rather than on all monitored streams.
You can quickly identify errored streams, and filter your results to only
show errored streams in the All Streams Video or
All Streams (Complete) result groups.
– Transport Error Indicators. The transport error indicator is a bit that is set in
the packet header by encoders if they detect corrupted content from the
source. It always indicates that there is an issue with the video content.
– Continuity Counter Errors. These errors are usually detected by a monitoring system placed close to the video headend; therefore, they are typically corrected before reaching a downstream test instrument. When
running analyzer applications, you can verify that there are no continuity
counter errors by observing results in the All Streams Video or All
Programs result groups.
– Continuous PCR (Program Clock Reference) jitter in the absence of
excessive packet jitter. This is typically due to transcoding problems in the
encoder. When running analyzer applications, you can observe PCR jitter
measurements in the All Streams Video result group; packet jitter
measurements are available in the All Streams Transport result group. If
you are specifically comparing PCR jitter to overall packet jitter, select the
All Streams (Complete) result group.
– PAT and PMT errors. Program specific information is comprised of tables
of data associated with the programs carried in each stream; in particular,
the PAT and PMT tables. This data must be present at regular intervals.
PMT and PAT error counts are counts of sections that don’t occur within
the minimum required interval. You can observe these counts in the
All Streams Video result group.
Ethernet, IP, TCP/UDP, Fibre Chan., VoIP, and Video Testing Manual 225
Chapter 9 IP Video Testing
Basic principles of IP Video testing
Symptoms of transport network problems include:
– Simultaneous packet loss and packet jitter. This is typically evaluated
using the optional Media Delivery Index (MDI) analysis, which calculates
the delay factor (DF) and media loss rate (MLR). The delay factor indicates how long a data stream must be buffered at its nominal rate to
prevent packet loss. The media loss rate is a count of lost or
out-of-sequence packets over time. Packet loss and jitter measurements
are available in the All Streams Transport result group.
– Persistent packet loss and packet jitter. Packet loss and jitter measurements are available in the All Streams Transport result group.
MPEG-2 transport streams
When monitoring transport streams using the MSAM, you can observe test
results associated with transport stream header data and errors. Figure 63
illustrates a packetized transport stream. The module provides test results for
each of the shaded header fields when running analyzer applications.
Figure 63 Packetized transport stream
Navigation Tip:
To observe results associated with MPEG-2 transport streams, run an analyzer application, and then select the top Video Streams Quality button on
the Summary/Status display, or the All Streams Video result group.
The Transport Quality (IP, UDP, RTP) button and All Streams Transport
result group provide test results associated with the transport of packets
over the IP video network. They do not provide results associated with the
actual MPEG-2 transport streams.
Packetized elementary streams
(PES)
ES (elementary streams) carry video and audio payloads, which are then packetized, resulting in PES (packetized elementary streams). Each PES packet is
then broken into fixed length transport packets, which are carried inside
MPEG-2 transport streams.
Signaling tables
Three signaling tables are carried in a dedicated set of elementary streams for
each transport stream. The tables, referred to as PSI (Program Specific Information), consist of a description of the elementary streams that are required to
build particular programs, and descriptions of the programs.
Program Association Table (PAT)—Lists the program IDs of tables describing
each individual program.
226
Ethernet, IP, TCP/UDP, Fibre Chan., VoIP, and Video Testing Manual
Chapter 9 IP Video Testing
Basic principles of IP Video testing
Program Map Table (PMT)—Lists the set of PIDs associated with a particular
program.
When running an analyzer application, you can determine the PMT ID for a
particular stream, and observe results associated with PAT and PMT errors.
IP Video encapsulation
MPEG-2 transport streams are typically encapsulated within RTP/UDP/IP or
UDP/IP streams.
RTP
When MPEG-2 transport streams are encapsulated in RTP/UDP/IP/Ethernet
streams, results are derived as follows:
– When running Explorer applications, packet jitter is measured using the
average IP inter-arrival time; packet loss is measured using the RTP
sequence number.
– When running Analyzer applications, packet jitter and packet loss are
measured on the circuit using the RTP timestamps and sequence
numbers, respectively.
– When running Analyzer applications, MDI DF results are measured using
the average IP inter-arrival time; MDI MLR results are measured using the
RTP sequence number. (MDI results are only available if you purchased
the MDI option.)
When configuring a test, you can establish thresholds for declaring RTP loss
distance and loss period errors. While running the test, you can easily determine whether transport streams are encapsulated in an RTP payload by
observing the RTP Present result in the All Streams Transport result group.
Non-RTP
When MPEG-2 transport streams are encapsulated in UDP/IP/Ethernet
streams, results are derived as follows:
– When running Explorer and Analyzer applications, packet jitter is
measured using the average IP inter-arrival time; packet loss is measured
using the MPEG continuity counter.
– When running Analyzer applications, MDI DF results are measured using
the average IP inter-arrival time; MDI MLR results are measured using the
the MPEG continuity counter.(MDI results are only available if you
purchased the MDI option.)
Packet loss measurements are provided in the All Streams Transport result
group; continuity counter errors are provided in the All Streams Video result
group.
For descriptions of the IP Video test results, refer to Chapter 13 “Test Results”.
Ethernet, IP, TCP/UDP, Fibre Chan., VoIP, and Video Testing Manual 227
Chapter 9 IP Video Testing
Basic principles of IP Video testing
228
Ethernet, IP, TCP/UDP, Fibre Chan., VoIP, and Video Testing Manual
Chapter 10
VoIP Testing
10
This chapter provides information on testing voice over IP services. Topics
discussed in this chapter include the following:
– “About VoIP testing” on page 230
– “Understanding the graphical user interface” on page 231
– “Populating the Address Book” on page 235
– “Specifying interface settings” on page 236
– “Specifying Ethernet frame and IP settings” on page 236
– “Specifying VoIP settings” on page 237
– “Specifying VoIP Filters” on page 241
– “Placing and receiving calls” on page 241
– “Analyzing Audio Packets” on page 245
Ethernet, IP, TCP/UDP, Fibre Chan., VoIP, and Video Testing Manual 229
Chapter 10 VoIP Testing
About VoIP testing
About VoIP testing
If your instrument is configured and optioned to do so, you can use it to verify
the proper installation and configuration of Voice over IP (VoIP) service.
Features and capabilities
The VoIP option allows you to:
– Place and receive calls (call setup and teardown)
– Voice conversation/generate tone/IP voice announce
– Auto answer
– Real-time packet metrics (delay, jitter, packet loss)
– E-model QoS and RTCP statistics
– User selectable CODEC
– MOS and R Factor results
Understanding VoIP basics
VoIP refers to a collection of standards and technologies for transporting Voice
over Internet Protocol. There are three basic functions that need to be
performed in order for a voice conversation to take place:
1 The first requirement to maintaining a voice conversation is call management (signaling). This includes call setup, teardown and maintenance.
These protocols/standards help enable the actual voice conversation.
There are several standards for maintaining a phone call:
– H.323–This is an umbrella recommendation from ITU which contains a
large set of standards for multimedia communication over packet
switched networks.
– Session Initialization Protocol (SIP)–SIP is a contender to H.323 being
developed by IETF multiparty, multimedia session control working
group. This alternative is lighter and easier to setup than the H.323
standard.
2 VoIP is transmitted using several layers of encapsulation. A common
example of how VoIP is transmitted is RTP > UDP > IP > L2 data-link
protocol (IPoE/PPPoE).
Figure 64 is an example of the levels of encapsulation and where the voice
sample is stored.
Figure 64 VoIP Encapsulation
230
Ethernet, IP, TCP/UDP, Fibre Chan., VoIP, and Video Testing Manual
Chapter 10 VoIP Testing
Understanding the graphical user interface
3 Analog to digital data conversion/compression and vice versa. This
involves sampling the audio and providing some digital outputs. This is
done using codecs. Some examples of codecs used in VoIP are
G.711 U law, G.711 A law, G.723 5.3K, G 723 6.3K, G.729A, G.726.32K,
and G.722 64K.
Understanding the graphical user interface
When you configure your module for testing, the main screen provides four
summary result buttons that allow you to display physical/link quality results,
transaction log, transport streams quality results, and content streams quality
results. Setup tabs are provided that allow you to specify items such as the
destination phone number and codec. Other setups may appear, depending on
the call control.
Action buttons
When running VoIP applications, buttons appear at the bottom of the Main
screen that allow you to select an SFP or specify the wavelength for an optical
connector (if applicable), turn the laser on or off, and, register with the management entity (also called “gateway,” “proxy,” or “call manager,” depending on
which signaling protocol you are using), or place and receive a call.
Understanding the LED panel
When you select a VoIP application, LEDs appear next to the result window on
the Main screen (see Figure 65).
Figure 65 VoIP LEDs
The LEDs allow you to quickly determine whether a signal is present, synchronization has been acquired, and whether or not the link is active. LEDs also
indicate the content rating.
Ethernet, IP, TCP/UDP, Fibre Chan., VoIP, and Video Testing Manual 231
Chapter 10 VoIP Testing
Understanding the graphical user interface
Understanding the VoIP call
bar
The VoIP call bar is located in the area just above the results. It allows entry of
the destination phone number and quick selection of setup items. The setup
items available vary depending on the call control.
Figure 66 VoIP call bar, SIP call control
Understanding VoIP test
results
Layered view: Quality Layer
Buttons
VoIP results are available that allow you to verify the quality of the physical
layer, the link, the transport quality of audio streams, and the quality of the
audio itself.
The layered view appears on the Main screen the first time you launch a VoIP
application. Color coded quality buttons appear which immediately indicate the
current and historical status of the physical layer and link, the transport of the
audio streams (using IP, UDP, and RTP), and the audio streams themselves.
Figure 67 illustrates the view when all results are OK and there is no history of
errors at any layer.
Figure 67 Layered View - All Results OK
Ethernet Quality (Physical Link Quality) —Selecting this button will display
aggregate results (such as the bandwidth utilization, interface (layer 1) and
Ethernet (layer 2) errors for the link.
Transaction Log—Selecting this button will display a running list of all transactions with the far-end including communication with Call Manager/Gatekeeper/Proxy, and call status.
Transport Quality—Selecting this button will display test results for each monitored IP, UDP, or RTP voice stream.
Content Quality—Selecting this button will display test results for each monitored voice stream.
Navigation Tip:
You can always return to the layered view by setting the results group to
Summary, and the category to Status.
232
Ethernet, IP, TCP/UDP, Fibre Chan., VoIP, and Video Testing Manual
Chapter 10 VoIP Testing
Understanding the graphical user interface
Layered View: Button Colors
Figure 68 illustrates the view when the instrument has lost the physical
connection so there is a history of errors at the physical layer.
Figure 68 Layered View - Errored physical link
Table 27 explains each of the colors used for the current and history buttons.
Table 27 Current and History Button Colors
Color
Current
History
Green
Indicates that all results are OK
for that particular quality group.
For an example, see Figure 67
on page 232.
N/A
Yellow
Indicates that at least one result
at that particular layer triggered
a minor alarm or error based on
the established thresholds.
Indicates that at least one result
occurred during the test that
triggered a minor alarm or error
based on the established
thresholds.
Red
Indicates that at least one result
at that particular layer triggered
a major alarm or error based on
the established thresholds.
Indicates that at least one result
triggered a major alarm or error
based on the established
thresholds during the test. For
an example, see Figure 68 on
page 233.
Ethernet, IP, TCP/UDP, Fibre Chan., VoIP, and Video Testing Manual 233
Chapter 10 VoIP Testing
Understanding the graphical user interface
To optimize the number of results that appear on your display, the result
windows appear in the Full Size view by default when you run VoIP applications.
Figure 69 VoIP results: Transport quality
Navigating the results display
When navigating through the VoIP results, consider the following:
– When you launch an application for the first time, the Summary group and
Status category appear. This is also referred to as the “layered” view (see
“Layered view: Quality Layer Buttons” on page 232).
– When you launch applications subsequent times, the result view that was
displayed the last time you ended a test appears. For example, if the
Transport quality results were displayed the last time you ran the application, the next time you launch the application, the Transport quality results
will appear (see Figure 69 on page 234).
– Use the result group button to switch between the Summary, Content,
Transport, Transaction Log, Miscellaneous, Ethernet, and Graphs groups.
– Use the result category button to switch between the categories for each
group. For example, when observing results in the Content group, Current
Call Scores and Historical Call Score Stats categories are available.
234
Ethernet, IP, TCP/UDP, Fibre Chan., VoIP, and Video Testing Manual
Chapter 10 VoIP Testing
Populating the Address Book
VoIP test applications
If your instrument is optioned to do so, this release supports the VoIP applications listed in Table 28.
Table 28 VoIP applications
Interface
Application
Test Mode
10/100/1000
VoIP
Terminate
100M Optical
VoIP
Terminate
1GigE Optical
VoIP
Terminate
10G LAN
VoIP
Terminate
Populating the Address Book
The MSAM provides an Address Book which gives you quick access to phone
numbers when you want to place a call. Entries can include name, phone
number, and IP address information. The address book can be saved by
saving the test configuration.
To update entries in the address book
1 If you haven’t already done so, launch a VoIP application. For a list of
applications, see Table 28 on page 235.
2 Press the Address Book soft key. The address book appears.
3 In the Entry Name column, tap the field to launch a keypad, and then
specify a name for the entry.
4 In the Dest. Number column, tap the field to launch a keypad, and then
enter a phone number alias for the entry.
5 In the Dest. Name/URI/Email column, tap the field to launch a keypad, and
then enter the destination name/URI/Email.
6 Select either Select and Dial or Save and Close.
The entry is updated.
Ethernet, IP, TCP/UDP, Fibre Chan., VoIP, and Video Testing Manual 235
Chapter 10 VoIP Testing
Specifying interface settings
Specifying interface settings
Before testing on an optical circuit, you can specify interface settings which:
– Indicate which SFP jack you are using (if your unit is equipped with SFP
jacks).
– Specify the transmitted wavelength (if your unit is equipped with 850 nm,
1310 nm, and 1550 nm connectors).
– Allow your unit to communicate with another Ethernet device (when
requesting video traffic using IGMP).
For details on the various connectors used to connect to the circuit, refer to the
printed Getting Started User’s Manual that shipped with your unit. For details
on specifying the information required to establish a link to another device, see
“Specifying interface settings” on page 42 of Chapter 4 “Ethernet and IP
Testing”.
Specifying Ethernet frame and IP settings
Before you transmit traffic, you can specify the frame characteristics of the
traffic, such as the frame type (DIX, 802.3), encapsulation (VLAN, Q-in-Q,),
and IP settings such as IP type, gateway, and subnet mask.
To specify Ethernet frame settings
1 If you haven’t already done so, use the Test Menu to select the test application for the interface you are testing. Refer to Table 28 on page 235 for a
list of applications.
2 Select the Setup soft key, and then select the Ethernet/IP tab.
3 In Encapsulation, select one of the following:
– None. If you do not want to encapsulate transmitted frames, select
None.
– VLAN. If you want to transmit VLAN tagged frames, select VLAN, and
then refer to “Configuring VLAN tagged traffic” on page 50.
– Q-in-Q. If you want to transmit VLAN stacked (Q-in-Q) frames, select
Q-in-Q, and then refer to “Configuring Q-in-Q traffic” on page 50.
4 In Frame Type, specify the type of frame you are transmitting (DIX, or
802.3).
5 In Source Type, specify whether the source MAC address uses a factory
default MAC or User Defined. If User Defined, enter the MAC address
6 If you selected VLAN Encapsulation, enter the VLAN ID and Priority.
7 If you selected Q-in-Q Encapsulation, do the following:
a Enter the SVLAN ID, DEI, Priority, and TPID.
b Enter the CVLAN ID and Priority.
8 Specify whether the Source IP Type is a Static address or DHCP.
9 If you selected Static IP, specify the Source IP, Gateway, and Subnet
Mask.
The Ethernet frame and IP settings are specified.
236
Ethernet, IP, TCP/UDP, Fibre Chan., VoIP, and Video Testing Manual
Chapter 10 VoIP Testing
Specifying VoIP settings
Specifying VoIP settings
Before placing or receiving VoIP calls, you must specify the VoIP settings.
To specify VoIP settings
1 If you haven’t already done so, use the Test Menu to select the test application for the interface you are testing. Refer to Table 28 on page 235 for a
list of applications.
2 Select the Setup soft key, and then select the VoIP tab.
3 In the panel on the left side of the tab, select General, and then specify the
following:
a Select Auto Answer, and then specify whether to automatically answer
calls.
b Select Call Control Standard, and then specify a call control standard
– SIP is Session Initiation Protocol. It is an application layer protocol
used to establish, modify, and terminate conference and telephony
sessions over IP-based networks.
– SCCP is the call control used on Cisco VoIP systems.
– H.323 (Fast connect) minimizes the number of messages exchanged.
c If you selected SIP call control, specify the following settings.
Setting
Description
Source Alias
Enter the source phone number alias.
Outbound Alias
Select how to dial the destination:
Dial by Phone Number or
Dial by Name/URI/Email.
Dest. Phone Number
If you selected “Dial by Phone Number” for Outbound Alias, enter the destination phone number.
Dest. Name/URI/Email
If you selected “Dial by Name/URI/Emai” for Outbound Alias, enter the destination name/UTI/Email.
SIP Vendor
Specify the vendor.
100 Rel Usage
Specify whether 100rel is required, supported, or
disabled.
100 Rel provides reliable provisional response messages by appending the 100rel tag to the value of
the required header of initial signalling messages.
d If you selected SCCP call control, specify the following:
Setting
Description
Dest. Phone Number
Enter the destination phone number.
Device Type
Specify the Device Type.
Device Name
If checked, click on the field and use the keypad to
enter the device name.
Ethernet, IP, TCP/UDP, Fibre Chan., VoIP, and Video Testing Manual 237
Chapter 10 VoIP Testing
Specifying VoIP settings
e If you selected H.323 call control, specify the following settings..
Setting
Description
Source Alias
Enter the source phone number alias.
Dest. Phone Number
Enter the destination phone number.
H.323ID
Enter the ID, using up to 40 characters. This is an
ID element field that is sent to the Gatekeeper during all registration and request messages.
Bear Cap
Specify the bearer capability: Voice, 3.1K audio,
Unrestricted Digital
This sets the Bearer Cap information element in the
H.323 setup message for outgoing calls.
Calling Party Number
Plan
Specify the numbering plan, if required: Unknown,
ISDN/Telephony, Data, Telex, National, Private
This sets the Calling Party Numbering Plan information element in the H.323 setup message for
outgoing calls.
Calling Party Number
Type
Specify the type of number, if required: Unknown,
International, National, Network Specific, Subscriber, Abbreviated.
This sets the Calling Party Type information element in the H.323 setup message for outgoing calls
Called Party Number
Plan
Specify the numbering plan, if required: Unknown,
ISDN/Telephony, Data, Telex, National, Private.
This sets the Called Party Numbering Plan information element in the H.323 setup message for outgoing calls.
Called Party Type
Specify the type of number, if required: Unknown,
International, National, Network Specific, Subscriber, Abbreviated.
This sets the Called Party Type information element in the H.323 setup message for outgoing
calls.
4 If you selected SIP call control, in the panel on the left side of the tab,
select Proxy, and then specify the following:
238
Setting
Description
Proxy Mode
Specify whether your circuit has a Static Proxy or No
Proxy.
Address Type
If your circuit uses a static Proxy, specify whether
the address is an IP Address or DNS Name.
Proxy IP
Enter the IP address of the proxy.
This is the outbound proxy, or the device from which
the instrument will send and receive all SIP messages. If you have a network that uses one server
for registration and another for placing and receiving
calls, the Proxy IP specifies the address for placing
and receiving calls.
Proxy User name
Enter a user name used to access the Proxy.
Proxy Password
Enter the password associated with the user name.
Ethernet, IP, TCP/UDP, Fibre Chan., VoIP, and Video Testing Manual
Chapter 10 VoIP Testing
Specifying VoIP settings
Setting
Description
DNS Name
If the address type is DNS Name, enter the DNS
name for the proxy.
Proxy Port
Enter the proxy port number.
Call Control Port
Enter the call control port number.
5 If you selected SCCP call control, in the panel on the left side of the tab,
select Call Manager, and then specify the following:
Setting
Description
Call Manager IP
Enter the IP address of the call manager.
Call Manager Port
Enter a number for the call manager port.
6 If you selected H.323 call control, in the panel on the left side of the tab,
select Gatekeeper, and then specify the following:
Setting
Description
Gatekeeper Mode
Specify the gatekeeper mode:
NO GATEKEEPER means no RAS (registration,
admission, and status) messages will be used.
AUTO DISCOVER automatically discovers the
gatekeeper.
STATIC allows you to enter the gatekeeper
address.
Authentication
Specify whether authentications is supported or
required.
Gatekeeper IP
Enter the gatekeeper IP address
Username
Enter the username to register with the gateway.
Password
Enter the password associated with the username.
Local RAS Port
Enter the UDP port that is used locally for registration (RAS messages)
Call Control Port
Enter the UDP port that is used for call control messages (for placing and receiving calls).
Gatekeeper RAS Port
Enter the UDP port that the gatekeeper uses for
registration (RAS messages).
Time Zone
Select the time zone where you are located.
7 In the left panel on the side of the tab, select Audio Codec and then
specify the following:
Setting
Description
Primary Codec
Select the codec type to be advertised/supported
for receiving audio packets.
The codec on the receiving and transmitting end
should match. The call may not be successful if the
codecs don’t match
Speech Per Frame
Specify the number of milliseconds of speech per
transmission frame the unit can receive.
Ethernet, IP, TCP/UDP, Fibre Chan., VoIP, and Video Testing Manual 239
Chapter 10 VoIP Testing
Specifying VoIP settings
Setting
Description
Jitter buffer
Set the jitter buffer length.This is the number of milliseconds of speech that will be collected before an
attempt will be made to play the speech back. This
allows lost, late, or out-of-sequence packets time to
arrive and be reassembled before playback.
Transmit Source
Select the transmit source: Voice conversation
(transmits and receives live voice), IP voice
announce (the unit repeats a sequence of words
including the calling party’s IP address), Tone
(transmits the specified frequency).
Language
If the Transmit Source is set to IP Voice Announce,
the Language selection becomes available. This
specifies the language for the transmitted voice
announcement.
Voice IP QOS
Enter a value to indicate the Voice IP Quality of Service.
The value you enter will be both the Differentiated
Services (DiffServ) code point and the type of service (ToS) indicator. The value will occupy a 6-bit
field in the packet headers of RTP stream voice
packets and will indicate how packets are treated at
each hop. You can specify a number from 0 to 63 to
indicate the per-hop behavior.
RTP Port Min/Max
Specify the RTP port minimum and maximum numbers.
The real-time transport protocol (RTP) port number
allows you to identify voice traffic versus other traffic. Some systems only accept RTP traffic on certain port numbers.
Silence Suppression
Specify whether silence suppression is supported.
8 In the left panel on the side of the tab, select QoS and then specify the
following:
Setting
Description
MOS Scaling
Specify the scale used for MOS results.
Jitter Threshold
Specify the pass and fail thresholds for the jitter result.
Delay Threshold
Specify the pass and fail thresholds for the delay
result.
Loss Threshold
Specify the pass and fail thresholds for the loss result.
Content Threshold
Specify the pass and fail thresholds for the MOS
results.
The VoIP settings are specified.
240
Ethernet, IP, TCP/UDP, Fibre Chan., VoIP, and Video Testing Manual
Chapter 10 VoIP Testing
Specifying VoIP Filters
Specifying VoIP Filters
If you wish to capture VoIP packets, you can specify filters to capture specific
types of packets.
To specify VoIP filter settings
1 If you haven’t already done so, use the Test Menu to select the test application for the interface you are testing. Refer to Table 28 on page 235 for a
list of applications.
2 Select the Setup soft key, and then select the VoIP Filters tab.
3 Specify the type of filter:
Setting
Description
Signaling
Only incoming and outgoing signaling/control packets
shall be captured. Incoming signaling/control packets
destined for the unit (based on destination IP address
of incoming packets) shall only be sent to the capture
buffer. Signaling packets shall include RTCP packets,
H.323/SIP/SCCP call control packets.
Audio
Only audio packets for the call in progress shall be
sent to the capture buffer. Incoming packets shall be
captured based on destination IP address and UDP
port number fields of the packets.
Signaling and Audio
Both signaling and audio packets shall be sent to the
capture buffer.
All Traffic
All incoming traffic will be captured.
The VoIP filters are specified.
Placing and receiving calls
To verify call setup and tear down, the instrument allows placing and receiving
calls.
NOTE:
If testing VoIP on a MTS8000 with DMC, no audio path is available. You can
place and receive calls to view results such as MOS scores but will not hear
audio.
Registering with the server
Before placing or receiving calls, you must register with the server (the Proxy/
Gateway/Call Manager, depending on call control). If H.323 call control is used,
you must manually register with the server after changing any call settings. If
SIP or SCCP call controls are used, the unit automatically deregisters and
registers with the server after a change in call settings.
Ethernet, IP, TCP/UDP, Fibre Chan., VoIP, and Video Testing Manual 241
Chapter 10 VoIP Testing
Placing and receiving calls
To register with the server
– Tap the Register action button to begin registering.
Figure 70 VoIP registration action button
NOTE:
The registration action button is not available if using H.323 call control with
NO Gatekeeper.
After successful registration, the button will turn yellow and change to
“Registered” and the Stack status indicator in the LED panel updates.
Figure 71 Successful registration
Placing calls
After specifying configuration settings and registering with the server, you can
place a VoIP call.
To place a VoIP call
1 Select the Place Call action button.
The button label changes to Hang Up.
After the call is connected, the Call status in the LED panel will update and
the timer begins counting.
2 While the call is up, observe the Transport and Content result categories.
3 Select the Hang up action button to end the call.
Receiving calls manually
After specifying configuration settings and registering with the server, you can
receive a VoIP call.
To receive a VoIP call
1 When the instrument indicates an incoming call, select the Answer Call
action button.
The button label changes to Hang Up.
After the call is connected, the Call status in the LED panel will update and
the timer begins counting.
2 While the call is up, observe the Transport and Content result categories.
3 Select the Hang up action button to end the call.
242
Ethernet, IP, TCP/UDP, Fibre Chan., VoIP, and Video Testing Manual
Chapter 10 VoIP Testing
Capturing packets for analysis
Automatically answering
calls
The Auto Answer feature allows you to verify incoming service.
To answer calls automatically
1 In the VoIP call bar, check the box for Auto Answer.
2 Place a call to the instrument from a VoIP phone (or a second instrument).
The call is automatically answered, and the following information is
logged:
– Time the call was answered
– Caller’s IP address
– Time the call ended
3 Tap the Hang up action button to end the call.
Capturing packets for analysis
If your instrument is configured and optioned to do so, you can use it to capture
transmitted and received packets, save it on the instrument or to an external
USB key, and then either send the packets to another technician for analysis,
or analyze it yourself using the PVA-1000 VoIP Analyzer software.
Understanding the Capture
toolbar
The buttons on the Capture toolbar (illustrated in Figure 72) are used to enable
or disable the capture feature, start and stop the capture process, save the
packets in the capture buffer to the internal USB drive (or an external drive), or
launch Wireshark® or J-Mentor to analyze the packets on the instrument.
Figure 72 Capture Toolbar
The % Buffer Full gauge shows the percentage of the available buffer capacity
that is used.
When you capture traffic at a high bandwidth or specify a small buffer size, if
you configure the capture to wrap (overwrite) the oldest packets in the buffer
with new captured packets in 1 MB increments, the buffer gauge may appear
to “jump around”. If you do not wrap the packets, the capture process may stop
very soon after you start it, because the buffer reaches capacity quickly. This
is expected behavior.
Specifying filter settings
If you specify VoIP filter settings (see “Specifying VoIP Filters” on page 241),
the settings determine which received traffic is captured to the buffer. The
Capture Toolbar (illustrated in Figure 72) indicates whether filters are active or
inactive. Transmitted frames are always captured to the buffer.
Capturing packets
Capturing packets involves launching and configuring a VoIP application,
specifying the capture settings, and, if you are capturing received traffic, specifying the filter settings.
Ethernet, IP, TCP/UDP, Fibre Chan., VoIP, and Video Testing Manual 243
Chapter 10 VoIP Testing
Capturing packets for analysis
While capturing packets in the VoIP application, it is recommended that you do
not save the captured packets until the call is ended (the phone is on hook).
When capturing packets, bear in mind that configuring the capture for a large
buffer (for example, 256 MB) with small packets (for example, 46 byte ping
packets), it will take a long time to fill the buffer. If you configure the capture for
a small buffer with large packets, it will take much less time.
To capture packets on the instrument
1 Select the Setup soft key, and then do one of the following:
– Specify the settings required to filter received traffic for the type you
want to capture and analyze.
– Clear all of the filters to capture all received traffic.
For details, refer to “Specifying filter settings” on page 243.
2 Select the Capture setup tab, and then specify the following settings:
Setting
Parameter
Capture buffer size (MB)
Specify a size ranging from 1 to 256 MB in a
1 MB increment. The default buffer size is 16 MB.
Capture frame slicing
If you want to capture the first 64 or 128 bytes of
each frame (and ignore the rest of the frame),
select 64 or 128; otherwise, select None.
If you select None (the default), the entire frame
is captured.
When capture buffer is
filled
If you want to overwrite the oldest packets with
new packets when the buffer becomes full, select
Wrap Capture; otherwise, select Stop Capture.
3 Select the Results soft key to return to the Main screen.
4 Select the Capture toolbar, and then select Start Capture.
A message appears in the message bar indicating that the capture has
started, and the action key states Capture Started.
5 If you want to manually stop capturing packets (for example, after the
instrument has transmitted and received a certain number of frames),
select the Capture Started action key.
The action key turns grey, and a message appears in the message bar
indicating that the capture is complete.
Packets were captured and are stored temporarily in the capture buffer. A
count of the number of packets processed is provided in the Ethernet
result group, in the Capture category.
WARNING: Changing applications or turning OFF the instrument
You will lose the entire contents of the capture buffer if you launch a new
application on the port that you are capturing packets on, or if you turn your
instrument OFF. To ensure that the packets are stored, save the capture
buffer before changing applications or turning the instrument OFF.
6 Select Save Capture Buffer and then specify the file name and other
parameters as needed.(For more information, see “Saving or exporting
captured packets” on page 98.)
244
Ethernet, IP, TCP/UDP, Fibre Chan., VoIP, and Video Testing Manual
Chapter 10 VoIP Testing
Capturing packets for analysis
Analyzing Audio Packets
Audio packets captured with the VoIP application can be analyzed using the
PVA-1000 VoIP Analyzer software from JDSU. PVA-1000 software provides
automated capture and detailed analysis of VoIP calls. It provides details of
signaling and quality performance issues.
When capturing packets in the VoIP application, it is recommended that you do
not save the captured packets until the call is ended (the phone is on hook).
Ethernet, IP, TCP/UDP, Fibre Chan., VoIP, and Video Testing Manual 245
Chapter 10 VoIP Testing
Capturing packets for analysis
246
Ethernet, IP, TCP/UDP, Fibre Chan., VoIP, and Video Testing Manual
Chapter 11
Fibre Channel Testing
11
This chapter provides information on testing Fibre Channel services. Topics
discussed in this chapter include the following:
– “About Fibre Channel Testing” on page 248
– “Features and capabilities” on page 248
– “Configuring layer 1 tests” on page 250
– “Configuring layer 2 Fibre Channel tests” on page 252
– “Transmitting and analyzing layer 2 traffic” on page 257
– “Loopback testing” on page 258
– “Transmitting and analyzing patterns” on page 258
– “Measuring service disruption time” on page 259
– “Inserting errors” on page 260
– “Measuring round trip delay” on page 260
– “Monitoring layer 2 traffic” on page 261
– “Emission Lowering Protocol” on page 262
Ethernet, IP, TCP/UDP, Fibre Chan., VoIP, and Video Testing Manual 247
Chapter 11 Fibre Channel Testing
About Fibre Channel Testing
About Fibre Channel Testing
If your instrument is configured and optioned to do so, you can use it to provision Fibre Channel service, verify end-to-end connectivity, and analyze link
performance by simulating different traffic conditions. Figure 73 illustrates the
Main screen when running a 10 Gigabit Fibre Channel application.
Group
Test
Category
Battery
Indicator
Menu Bar
Message Bar
Quick Config
LED Panel
Actions Panel
Result Window
soft keys
Figure 73 Main screen, 10 Gigabit Fibre Channel application
This release of the instrument supports 1, 2, 4, 8 and 10 Gigabit Fibre Channel
testing.
Features and capabilities
Features and capabilities of the MSAM include the following when testing Fibre
Channel service:
– 1 Gigabit, 2 Gigabit, and 4 Gigabit testing—You can run Layer 1 BER,
Layer 2 Traffic, and Layer 2 Pattern tests over 1, 2, and 4 Gigabit Fibre
Channel circuits. Dual port testing is possible in Terminate and Monitor/
Thru modes.
– 8 Gigabit testing—You can run Layer 2 Traffic tests in Terminate and
Monitor/Thru modes and Layer 2 Pattern tests in Terminate mode over
8 Gigabit Fibre Channel circuits using an XFP in an MSAM v2 assembly.
– 10 Gigabit testing—You can run Layer 1 BER and Layer 2 Traffic tests
over 10 Gigabit Fibre Channel circuits in Terminate and Monitor/Thru
modes using either port of an XFP in an MSAM v2 assembly.
248
Ethernet, IP, TCP/UDP, Fibre Chan., VoIP, and Video Testing Manual
Chapter 11 Fibre Channel Testing
Features and capabilities
– Fibre Channel login and flow control—The instrument supports Exchange
of Link Parameters (ELP) through distance extension equipment when
turning up a circuit, allowing you to login to another module at the far end.
Before logging into another module, you can specify the number of buffer
credits to verify that flow control is functioning properly.
– Frame verification—You can verify that the size and format of Fibre
Channel frames conform to ANSI X3T11 requirements, ensuring that
network elements can support reliable communications.
– BER testing—You can verify circuit performance by sending BERT
patterns over switched (layer 2) and unswitched (layer 1) networks.
– Scrambling— You can select to scramble all words transmitted between
Start of Frame (SOF) and the End of Frame (EOF) delimiters in Terminate
applications and descramble received traffic in Monitor/Through applications.
– Emissions Lowering Protocol (ELP)— You can configure ELP by specifying the ordered set to be transmitted during the Link INIT and for fill
words. The three configurable modes are OFF (IDLE/IDLE), ON/Enabled
IDLE/ARBff and ON Enabled ARBff/ARBff.
– Explicit Fabric/N-Port login; fabric topology—You can use your instrument
to login to an N_Port, and then verify that it can establish an operating
environment with a fabric and communicate with other destination N Ports
by indicating that the service you are testing uses a fabric topology. When
testing on a fabric topology, you specify source and destination N Port and
Node names for the login process.
– Explicit Fabric/N-Port login; point-to-point topology—You can use your
instrument to login to an N_Port, and then verify that it can communicate
with other destination N Ports by indicating that the network you are
testing uses a point-to-point topology. When testing on a point-to-point
topology, you specify a source N Port and Node name, and a destination
and source ID for the login process.
Understanding the graphical
user interface
When you configure your instrument for testing, graphical displays of Fibre
Channel frames are provided on the setup tabs for the application you
selected. You can specify frame characteristics for transmitted and filtered
traffic by selecting the corresponding field on the graphic, and then entering the
value for transmitted or filtered traffic. Colored and white fields can be edited;
fields in grey can not be modified.
Ethernet, IP, TCP/UDP, Fibre Chan., VoIP, and Video Testing Manual 249
Chapter 11 Fibre Channel Testing
Configuring layer 1 tests
Figure 74 illustrates the Frame Details for a layer 2 traffic test.
Figure 74 Frame Details
For details on specifying frame characteristics, see “Specifying Fibre Channel
frame settings” on page 255 and “Specifying Fibre Channel filter settings” on
page 256.
Fibre Channel test
applications
This release supports the applications listed in Table 29 when testing
1 Gigabit, 2 Gigabit, 4 Gigabit, 8 Gigabit and 10 Gigabit Fibre Channel circuits.
Table 29 Fibre Channel applications
Signal/Rate
Application
Test Modea
1Gig, 2Gig, and 4Gig
Layer 1 BERT
Terminate
Monitor/Through
Layer 2 Patterns
Terminate
Layer 2 Traffic
Terminate
Monitor/Through
Layer 2 Patterns
Terminate
Layer 2 Traffic
Terminate
Monitor/Through
Layer 1 BERT
Terminate
Monitor/Through
Layer 2 Traffic
Terminate
Monitor/Through
8Gig
10Gig
a. You must use two Fibre Channel SFPs or XFP s (8Gig and 10Gig) to test in monitor/through.
Configuring layer 1 tests
When testing Fibre Channel service, you can generate and receive layer 1 test
patterns utilizing 1, 2, 4 and 10 Gigabit Fibre Channel-capable PIMs. You can
also monitor and analyze Layer 2 Traffic and Patterns utilizing 1, 2, 4, 8 and
10 Gigabit Fibre Channel-capable PIMs.
250
Ethernet, IP, TCP/UDP, Fibre Chan., VoIP, and Video Testing Manual
Chapter 11 Fibre Channel Testing
Configuring layer 1 tests
When running a Layer 1 BERT test on a Fibre Channel circuit, you must
actively start transmission of the test pattern by pressing the
Start BERT Pattern action button.
NOTE:
Refer to IEEE 802.3ae-2002, Sections 49.2.8, 49.2.12, and 52.9.1 for
detailed descriptions of each pattern available when testing
10 Gigabit Fibre Channel circuits. For 1 Gigabit, 2 Gigabit, and 4 Gigabit
MF, LF, and HF Fibre Channel patterns, refer to the IEEE 802.3, 2000 Edition, Annex 26A. For 1 Gigabit RDPAT, JTPAT, and SNPAT patterns, refer to
the NCITS TR-25-1999 specifications.
BER testing layer 1
Use the layer 1 BERT terminate application to generate and receive layer 1 test
patterns.
To BER test layer 1
1 Using the Test Menu, select the layer 1 BERT terminate test application for
the interface you are testing (refer to Table 29 on page 250 for a list of
applications).
2 To specify the BER pattern, select the Setup soft key, select the Interface
tab, and do the following:
a If you want the unit to use the Tx BERT pattern as the Rx BERT
pattern, in BERT Rx<=Tx, select On; otherwise, select Off.
b Select a Tx Pattern.
c If the Rx=Tx setting is Off, select an Rx Pattern.
d If you are using SFPs and are testing in Monitor/Through mode, select
the tab corresponding to the second SFP jack, and then repeat step a
through step c.
3 Connect the module to the circuit.
4 On the Main screen, select the Laser button.
5 Verify that the green Signal Present and Pattern Sync LEDs are illuminated.
6 At a minimum, observe the test results in the following categories:
– Summary
– Error Stats
Layer 1 BER testing is complete.
When running the L1 BERT application, your LEDs may indicate that you have
L1 Pattern Sync without word sync. The word sync status is indicated on your
unit using a red Sync Acquired LED (if word sync was obtained, then lost), or
an extinguished LED (if word sync was never obtained since starting your test).
This is usually due to a temporary loss of signal or word sync when receiving
an L1 pattern that does not contain Fibre Channel compliant link characters
(for example, IDLE). To resolve this, stop transmitting the L1 pattern momentarily to allow the receiver to regain sync, and then begin transmitting the
pattern again.
If this occurs, be certain to determine why the signal or word sync was lost
temporarily.
Ethernet, IP, TCP/UDP, Fibre Chan., VoIP, and Video Testing Manual 251
Chapter 11 Fibre Channel Testing
Configuring layer 2 Fibre Channel tests
Monitoring layer 1 BER
Use the layer 1 BERT monitor application to analyze the received signal.
NOTE:
To pass the signal through to the unit’s transmitter, you must turn the laser
on using the button on the Main screen.
To monitor layer 1 BERT
1 Using the Test Menu, select the layer 1 BERT monitor/through test application for the interface you are testing (refer to Table 29 on page 250 for a
list of applications).
2 To specify the BER pattern for the traffic you are monitoring, select the
Setup soft key, select the Pattern tab, and then select the Rx Pattern.
3 Connect the module to the circuit.
4 On the Main screen, select the Laser button.
5 Verify that the green Signal LED is illuminated.
6 At a minimum, observe the test results in the following categories:
– Summary
– Error Stats
You are monitoring layer 1 traffic carrying the BERT pattern that you specified.
Configuring layer 2 Fibre Channel tests
Using the instrument, you can transmit, monitor, and analyze layer 2 Fibre
Channel traffic. Step-by-step instructions are provided in this section for the
following:
– “Specifying interface settings” on page 252
– “Specifying Fibre Channel frame settings” on page 255
– “Specifying Fibre Channel filter settings” on page 256
– “Specifying traffic load settings” on page 257
Specifying interface settings
Before you transmit layer 2 traffic, you can specify interface settings which:
– Turn flow control on, and specify the login method (Implicit, Explicit E-Port,
or Explicit Fabric/N-Port) and the number of transmit or receive buffer to
buffer credits to communicate to the module’s link partner during the login
process. When you turn flow control on, the module:
– Generates an R_RDY message for each frame received.
– Provides a count of received R_RDY messages.
– Specify the connector to use for the test (if more than one transceiver is
inserted in the PIMs).
– Specify a unit identifier to identify all traffic originating from the module. It
uses its default source ID when doing E-Port login and its user-specified
port name when logging into a fabric.
252
Ethernet, IP, TCP/UDP, Fibre Chan., VoIP, and Video Testing Manual
Chapter 11 Fibre Channel Testing
Configuring layer 2 Fibre Channel tests
To specify interface settings
1 If you haven’t already done so, use the Test Menu to select the layer 2
terminate test application for the interface you are testing (refer to
Table 29 on page 250 for a list of applications).
2 Select the Setup soft key, then select the Connector sub-tab to specify
which optical connector you are using for the transceiver.
3 Select the Physical Layer sub-tab, and then specify the settings required
for the type of login and, if applicable, topology that you specify:
Table 30 Fibre Channel Physical Layer settings
Explicit (Fabric/N-Port)
Setting
Values
Implicit
Explicit
(E-Port)
FlowControl
–
Select On if you want the instrument to operate as a creditbased transmitter.
– Select Off to generate frames
without crediting.
NOTE: You must turn flow control
ON to specify Login settings.
√
Login
(FlowControl is On)
–
To verify that both devices use
flow control and no login is
required, select Implicit, and
then specify the Tx Buffer to
Buffer credits.
To discover another instrument
or device’s settings, select
Explicit (E-Port), and then
specify the Rx Buffer to Buffer
credits.
To login to an N-Port on a circuit using a Point-to-Point or
Fabric topology, select Explicit
(Fabric/N-Port), and then specify the Rx Buffer to Buffer Credits.
Tx Buffer to Buffer
Credits
(Near-end B-B)
Rx Buffer to Buffer
Credits
(Far-end B-B)
Point-to-Point
Topology
Fabric
Topology
√
√
√
√
√
√
√
If you specified an Implicit login,
select this field, and then type the
number of buffer credits the far end
device can support. This number
should match the receive buffer
size for the far end device.
√
N/A
N/A
N/A
If you specified an Explicit (E-Port)
or Explicit (Fabric/N-Port) login,
select this field, and then type the
number of buffer credits the instrument will advertise that it can support during the ELP login exchange
with the far end device.
N/A
√
√
√
–
–
Ethernet, IP, TCP/UDP, Fibre Chan., VoIP, and Video Testing Manual 253
Chapter 11 Fibre Channel Testing
Configuring layer 2 Fibre Channel tests
Table 30 Fibre Channel Physical Layer settings (Continued)
Explicit (Fabric/N-Port)
Setting
Values
Implicit
Explicit
(E-Port)
Topology
–
N/A
–
To login to an N Port, and then
verify that it can communicate
with other destination N Ports,
select Point-to-Point.
To login to an N_Port, and then
verify that it can establish an
operating environment with a
fabric and communicate with
other destination N Ports, select
Fabric.
Point-to-Point
Topology
Fabric
Topology
N/A
√
√
Source N Port
Name
Specify the source port name carried in the login request.
N/A
N/A
√
√
Source Node Name
Specify the source node name carried in the login request.
N/A
N/A
√
√
Destination N Port
Name
Specify the destination port name
carried in the login request.
N/A
N/A
N/A
√
Destination Node
Name
Specify the destination node name
carried in the login request.
N/A
N/A
N/A
√
Destination ID
Specify the destination ID carried in
the login request.
N/A
N/A
√
N/A
Source ID
Specify the source ID carried in the
login request.
N/A
N/A
√
N/A
NOTE:
When you test flow control on a Fibre Channel circuit, specify the same
number of buffer credits for both the near-end and far-end instruments. If
you specify a different number of credits, or if you specify a very low number, you may not achieve desired bandwidth utilization.
4 Optional. If you want to transmit an ID for all loop up and loop down frames
originating from the module, select the Unit Identifier field, and then type
the ID. The default ID is JDSU 6000.
5 If you need to specify other settings for the test, select the appropriate tab;
otherwise, press Results to return to the Main screen.
The interface settings are specified. You can verify the login status and
observe test results associated with the login process by displaying the Fibre
Channel Login Status result category (see “Login Status results” on page 377).
254
Ethernet, IP, TCP/UDP, Fibre Chan., VoIP, and Video Testing Manual
Chapter 11 Fibre Channel Testing
Configuring layer 2 Fibre Channel tests
Specifying Fibre Channel
frame settings
Before you transmit layer 2 traffic, you can specify the frame characteristics of
the traffic, such as the frame length, and the type of payload carried in the
frames. You can also optionally specify the destination, source, sequence,
originator exchange, and responder IDs for transmitted frames.
NOTE:
If you change the frame length when the unit is already transmitting traffic,
the unit resets your test results, but some residual frames of the old length
may be counted if they are already in the traffic stream.
To specify Fibre Channel settings
1 If you haven’t already done so, use the Test Menu to select the layer 2
terminate test application for the interface you are testing (refer to
Table 29 on page 250 for a list of applications).
2 Select the Setup soft key, and then select the Fibre Channel tab.
3 In Tx Payload, select one of the following:
– Acterna. To transmit frames that contain a sequence number and time
stamp so that lost frames and round trip delay can be calculated, select
Acterna.
If you are measuring round trip delay on a 10 Gigabit circuit, in RTD
Setup, indicate whether you want to measure delay with a high degree
of precision, or a low degree of precision. In most instances, you should
select High Precision - Low Delay.
NOTE: You must select an Acterna payload to measure round trip delay
and count lost packets. For details, see “Measuring round trip delay” on
page 260.
– BERT. To transmit frames with payloads filled with the BERT pattern
you specify, select BERT, and then select a pattern.
Various pseudo-random and Fixed patterns are available. The Pseudorandom patterns continue from one frame into the next. The fixed
patterns restart each frame, such that the frame will always start with the
beginning of the pattern.
If you set the BERT Pattern to User Defined, in the User Pattern field,
specify the 32 bit fixed pattern that will be repeated in the payload.
NOTE:
The Transport Module and Multiple Services Application Module transmit
the bytes in user defined patterns from left to right; the FST-2802 transmits
the bytes in user defined patterns right to left.
For example, a user defined hexadecimal pattern of 12345678 populates
the frame as: 12345678.Using the same hexadecimal pattern, the FST-2802
would populate the frame as 78563412.
4 In Frame Length, select one of the listed frame lengths, or select User
Defined, and then enter a specific frame length in the USER Frame Length
field.
Ethernet, IP, TCP/UDP, Fibre Chan., VoIP, and Video Testing Manual 255
Chapter 11 Fibre Channel Testing
Configuring layer 2 Fibre Channel tests
5 Under Frame Channel Details, specify the following settings for the transmitted frames:
Settings
Values
D_ID
Type the destination ID of the port the frames will be transmitted to using a 3 byte format.
S_ID
Type the source ID for the port transmitting the frames
using a 3 byte format.
SEQ_ID
Type the sequence ID for the frames using a 1 byte hexadecimal format.
OX_ID
Type the originator exchange ID for the frames using a 2
byte hexadecimal format.
RX_ID
Type the responder ID for the frames using a 2 byte hexadecimal format.
6 If you need to specify other settings for the test, select the appropriate tab;
otherwise, press Results to return to the Main screen.
The frame settings are specified.
Specifying Fibre Channel
filter settings
Before transmitting layer 2 traffic, you can specify settings that indicate the
expected received payload and determine which frames will pass through the
receive filter and be counted in the test result categories for filtered layer 2
traffic. The settings may also impact other results.
For example, the incoming frames must pass the filter to be analyzed for a
BERT pattern. Local loopback is also only performed on frames that pass the
filter.
To specify Fibre Channel filter settings
1 If you haven’t already done so, use the Test Menu to select the layer 2
terminate test application for the interface you are testing (refer to
Table 29 on page 250 for a list of applications).
2 Select the Setup soft key, and then select the Fibre Channel Filter tab.
3 If you want to filter received traffic for a specific destination or source ID, or
using routing control, data type, or sequence control criteria, under Frame
Channel Details, select the corresponding field, enable the filter, by
selecting Yes, and then specify the filter value:
256
Settings
Values
R_CTL
Enter the routing control for filtered frames.
D_ID
Enter the destination ID for filtered frames.
S_ID
Enter the source ID for filtered frames.
Data Type
Enter the data type for filtered frames.
SEQ_CNT
Enter the sequence ID for filtered frames.
Ethernet, IP, TCP/UDP, Fibre Chan., VoIP, and Video Testing Manual
Chapter 11 Fibre Channel Testing
Transmitting and analyzing layer 2 traffic
4 If you want to filter traffic using payload criteria, select Data on the Fibre
Channel graphic, and then do the following:
– In Payload Analysis, select On.
– To use the Tx BERT pattern as the Rx BERT pattern, in Rx<=Tx, select
On; otherwise, select Off.
– If you are analyzing BERT data, and you turned Rx=Tx Off, specify a
BERT pattern.
5 If you need to specify other settings for the test, select the appropriate tab;
otherwise, press Results to return to the Main screen.
The filter settings are specified.
Specifying traffic load
settings
Before transmitting layer 2 traffic, you can specify the type of traffic load the
unit will transmit (Constant, Bursty, Ramp, or Flood). The settings vary
depending on the type of load. When configuring a load, you can specify the
bandwidth of the transmitted traffic in 1% increments.
For details on the various loads, refer to “Specifying traffic load settings” on
page 60 of Chapter 4 “Ethernet and IP Testing”. Before configuring a traffic
load for a Fibre Channel test, simply select a layer 2 Fibre Channel application
(instead of an Ethernet application).
NOTE:
When testing from 1Gig, 2Gig, or 4 Gig Fibre Channel interfaces, if you configure the instrument to transmit a constant, bursty, or ramped load of 100%,
it is designed to transmit slightly less than 100% traffic (99.90%) as a safeguard against overrunning network elements that can not support 100%.
When testing from an 8Gig or 10Gig Fibre Channel interface, the module
transmits traffic at 99.996% of the line rate.
If you are certain the elements can support true 100% traffic, configure your
unit to transmit a flood load (see “Transmitting a flooded load” on page 63).
Transmitting and analyzing layer 2 traffic
Before you transmit layer 2 traffic, you must specify:
– Interface settings (see “Specifying interface settings” on page 252).
– Frame characteristics of the transmitted traffic (see “Specifying Fibre
Channel frame settings” on page 255).
– Frame characteristics used to filter received traffic (see “Specifying Fibre
Channel filter settings” on page 256).
– Traffic load settings (see “Specifying traffic load settings” on page 257).
After you specify the layer 2 settings, you are ready to transmit and analyze the
layer 2 traffic.
To transmit and analyze layer 2 traffic
1 If you haven’t already done so, use the Test Menu to select the layer 2
terminate test application for the interface you are testing (refer to
Table 29 on page 250 for a list of applications).
Ethernet, IP, TCP/UDP, Fibre Chan., VoIP, and Video Testing Manual 257
Chapter 11 Fibre Channel Testing
Loopback testing
2 Select the Setup soft key, and then select the Interface tab to specify
settings that control the Fibre Channel interface (see “Specifying interface
settings” on page 252).
3 Select the Fibre Channel tab to specify settings that define the frame
characteristics of the transmitted traffic (see “Specifying Fibre Channel
frame settings” on page 255).
4 Select the Fibre Channel Filter tab to specify settings that filter the
received traffic based on specified frame characteristics (see “Specifying
Fibre Channel filter settings” on page 256).
5 Select the Traffic tab to specify the type of load the unit will transmit (see
“Specifying traffic load settings” on page 257).
NOTE
The Gap/Idle time parameter that rounds to 0.001% in Ethernet applications
rounds to the nearest 1% in FibreChannel applications.
6 Press Results to return to the Main screen.
7 Connect the module to the circuit.
8 On the Main screen, select the Laser button.
9 Select Start Traffic (for constant, bursty, or flood loads) or Start Ramp
(for ramped loads) to transmit traffic over the circuit.
10 Verify that the green Signal Present, Sync Acquired, Link Active, and
Frame Detect LEDs are illuminated.
11 At a minimum, observe the summary, layer 2 link statistics and counts,
layer 2 filter statistics and counts, error statistics, and layer 2 BERT statistics.
You have analyzed layer 2 traffic.
Loopback testing
Loopback testing allows you to transmit traffic from one JDSU test set, and
then loop the traffic back through a second unit on the far end of a circuit. For
details, refer to Chapter 8 “Loopback Testing”.
Transmitting and analyzing patterns
Using the instrument, you can stress the jitter and noise characteristics of
1 Gigabit, 2 Gigabit, 4 Gigabit, and 8 Gigabit Fibre Channel components and
systems by transmitting continuous random test patterns (CRPAT), continuous
jitter test patterns (CJPAT), and the compliant supply noise pattern (CSPAT).
These patterns are always transmitted automatically when you turn the laser
on.
To transmit a pattern
1 If you haven’t already done so, use the Test Menu to select the layer 2
pattern test application for the interface you are testing (refer to Table 29
on page 250 for a list of applications).
2 Select the Setup soft key. The Setup tab appears.
258
Ethernet, IP, TCP/UDP, Fibre Chan., VoIP, and Video Testing Manual
Chapter 11 Fibre Channel Testing
Measuring service disruption time
3 Select a pattern:
To…
Select…
Emulate a worst case scenario for deterministic
jitter by transmitting frames with a broad spectral content.
CRPAT
Stress the timing margins in the received eye
by exposing the data sampling circuits to large
systematic phase jumps.
CJPAT
Emulate a worse case scenario for power supply noise within network transceivers.
CSPAT
4 Press Results to return to the Main screen.
5 Connect the module to the circuit.
6 On the Main screen, select the Laser button.
7 Verify that the green SIGNAL LED is illuminated.
8 Select Start Pattern to transmit the pattern over the circuit.
9 At a minimum, observe the test results in the following categories:
– Summary
– Pattern Stats
You have transmitted layer 2 patterns.
Measuring service disruption time
You can use two instruments in an end-to-end configuration to measure the
service disruption time resulting from a switch in service to a protect line.
To measure service disruption time
1 On the near-end and far end units, if you haven’t already done so, use the
Test Menu to select the layer 2 terminate test application for the interface
you are testing (refer to Table 29 on page 250 for a list of applications).
2 On the near-end unit, select the Setup soft key, and then select the Traffic
tab to configure a constant load of traffic (see “Transmitting a constant
load” on page 60).
3 If you need to specify other settings for the test on the near-end unit, select
the appropriate tab; otherwise, press Results to return to the Main screen.
4 Connect the units to the circuit.
5 On the Main screen, select the Laser button.
6 Verify that the green Signal Present, Sync Acquired, and Link Active LEDs
are illuminated.
7 On the near-end unit, do the following:
a Start traffic.
b Clear the service disruption time by selecting the Reset Service Disruption Test button.
Ethernet, IP, TCP/UDP, Fibre Chan., VoIP, and Video Testing Manual 259
Chapter 11 Fibre Channel Testing
Inserting errors
8 Initiate the switch to the protect line.
9 Observe the service disruption result in the Fibre Channel L2 Link Stats
category.
Service disruption time is measured.
Inserting errors
Buttons on the Main screen allow you to insert errors into the traffic stream. If
you turn on a particular error insertion rate, the error insertion continues even
after you restart a test or change the test configuration.
To insert errors
1 Select one of the following error types.
– Code
– CRC
– Bit (BERT payload only)
2 Do the following:
– Specify the insert type (Single, Burst, or Rate).
– If you specified Burst, enter the quantity of errors in the burst, and then
select OK.
– If you specified Rate, select the rate.
3 Press the Error Insert button.
Error insertion starts, and the associated button turns yellow. To stop error
insertion, press the button again. Error insertion stops, and the associated
button turns grey.
Measuring round trip delay
When you perform loopback tests, you can measure round trip delay by transmitting an Acterna payload. Frames with an Acterna payload carry time
stamps, enabling the instrument to calculate the delay.
NOTE:
If you perform an end-to-end Fibre Channel test, invalid delay results appear.
You must use a loopback configuration when measuring round trip delay. For
details, refer to Chapter 8 “Loopback Testing”.
To measure round trip delay
1 If you haven’t already done so, use the Test Menu to select the layer 2
terminate test application for the interface you are testing (refer to
Table 29 on page 250 for a list of applications).
2 Select the Setup soft key, and then select the Fibre Channel tab.
3 Under Tx Payload, select an Acterna payload. The Acterna payload transmits frames with a time stamp and sequence number. You must select an
Acterna payload to measure round trip delay.
260
Ethernet, IP, TCP/UDP, Fibre Chan., VoIP, and Video Testing Manual
Chapter 11 Fibre Channel Testing
Monitoring layer 2 traffic
4 In Frame Length, select one of the listed frame lengths, or select User
Defined, and then enter a specific frame length in the USER Frame Length
field.
5 If you need to specify other settings for the test, select the appropriate tab;
otherwise, press Results to return to the Main screen.
6 Connect the module to the circuit.
7 On the Main screen, select the Laser button.
8 Select Start Traffic (for constant, bursty, or flood loads) or Start Ramp
(for ramped loads) to transmit traffic over the circuit.
9 Verify that the green Signal Present, Sync Acquired, and Link Active LEDs
are illuminated.
10 At a minimum, observe the delay test results in the Fibre Channel L2 Link
Stats category.
Round trip delay is measured.
Monitoring layer 2 traffic
Use the layer 2 traffic monitor application whenever you want to analyze the
received signal. When you configure your test, you can specify settings that
indicate the expected received payload and determine which frames will pass
through the receive filter and be counted in the test result categories for filtered
layer 2 traffic. The settings may also impact other results.
NOTE:
You must turn the laser on using the associated button to pass the signal
through the unit’s transmitter.
To monitor layer 2 traffic
1 If you haven’t already done so, use the Test Menu to select the layer 2
monitor/through test application for the interface you are testing (refer to
Table 29 on page 250 for a list of applications).
2 Select the Setup soft key, and then select the Fibre Channel Filter tab,
and then specify the filter settings for the traffic you want to monitor (see
“Specifying Fibre Channel filter settings” on page 256).
3 Press Results to return to the Main screen.
4 Connect the module to the circuit.
5 On the Main screen, select the Laser button.
6 Verify that the green Signal Present, Sync Acquired, and Link Active LEDs
are illuminated.
7 At a minimum, observe the summary, layer 2 link statistics and counts,
layer 2 filter statistics and counts, error statistics, and layer 2 BERT statistics test results.
Layer 2 traffic is monitored.
Ethernet, IP, TCP/UDP, Fibre Chan., VoIP, and Video Testing Manual 261
Chapter 11 Fibre Channel Testing
Emission Lowering Protocol
Emission Lowering Protocol
Use the Emission Lowering Protocol (ELP) configuration settings to change
the Ordered Sets that will be transmitted during the Link INIT and as fill words
after the link goes into the active state.
Depending on the hardware in the network, interoperability may be improved
by the use of a different configuration.
ELP configuration
1 Select ELP configuration from the Physical Layer subtab of the Interface
Tab in the Interface Quick Config settings area.
2 Select Mode. Then select the combination of Link INIT and Fill Words
desired.
a ELP OFF/Disabled - IDLE link INIT and IDLE fill words.
b ELP ON/Enabled IDLE/ARBff - IDLE Link INIT and ARBff fill words.
c ELP ON//Enabled ARBff/ARBff- ARBff Link INIT and ARBff fill word.
262
Ethernet, IP, TCP/UDP, Fibre Chan., VoIP, and Video Testing Manual
Chapter 12
Automated Testing
12
This chapter provides information on using the automated scripting programs
that are available, depending on the how the unit is equipped and configured.
These programs include TrueSAM, Automated RFC 2544, SAMComplete,
Fiber Channel, FTP Throughput, HTTP Throughput, TCP Throughput, and the
proprietary TrueSpeed sequence of tests that includes a Walk the Window
test.
The following topics are discussed in this chapter:
– “TrueSAM” on page 264
– “Launching a single automated test” on page 270
– “Automated RFC 2544 and Fibre Channel tests” on page 272
– “SAMComplete” on page 298
– “Automated VLAN tests” on page 309
– “Automated FTP Throughput tests” on page 310
– “Automated HTTP Throughput tests” on page 312
– “Automated TCP Throughput tests” on page 313
– “TrueSpeed Test” on page 314
– “Testing using TAM automation” on page 324
– “Saving automated test report data” on page 328
Ethernet, IP, TCP/UDP, Fibre Chan., VoIP, and Video Testing Manual 263
Chapter 12 Automated Testing
TrueSAM
TrueSAM
To assist in the turnup process of a single service, the TrueSAM function
provides a simple and complete method to run multiple tests on the system
without having to reconfigure each time a test is run. After answering a few
prompts, the tests will run automatically, without input from the user, and store
the test results in a report.
TrueSAM contains a number of different predefined testing options that are
readily available and allows selection of the following automated tests:
– J-Quick Check
– RFC 2544 or SAMComplete
– J-Proof
– TrueSpeed
NOTE: Depending upon how your unit is optioned and configured, your unit
may not have all of these options available.
To assist the user in the configuration process, TrueSAM has implemented a
Guide Me feature to step through the necessary configuration sequence. This
allows technicians with less experience to be able to effectively run the tests
for the environment in which they are operating.
To simplify the interface, TrueSAM now provides the complete, interactively
linked map of the configuration process as an optional display for the more
advanced user. This navigational aid is especially useful when reconfiguring a
saved profile.
After configuring the test settings, the setup profile can be saved for future use.
TrueSAM operates with the following constraints
– TrueSAM does not support one-way delay (OWD) measurements.
– TrueSAM is not available for the 40/100G Transport Module.
Setting up TrueSAM
Although TrueSAM is a scripting file that runs tests automatically, the appropriate tests (for the circuit being tested) must be selected, and the communications parameters defined, to have the equipment and links between them
tested.
To setup TrueSAM
1 From the Test menu, select the interface, and then TrueSAM Terminate.
264
Ethernet, IP, TCP/UDP, Fibre Chan., VoIP, and Video Testing Manual
Chapter 12 Automated Testing
TrueSAM
2 The Profile Selection page appears.
Figure 75 TrueSAM Profile Entry Method Selection
To load configuration settings set from a previously saved file, select Go
(green arrow) to the right of Load Configuration from a Profile. Go to
“Loading TrueSAM Profile” on page 268.
To configure all options yourself, select Go (green arrow) to the right of
Start a New Profile. Go to step 3.
3 The Operating Layer Select page appears.
Select Go (green arrow) after the layer on which your service operates either Layer 2 or Layer 3.
4 The TrueSAM main page appears.
Figure 76 TrueSAM Main Page
The Main page appears at the beginning and at major decision points in
the application. This page is used to initiate some of the major actions in
the application.
Actions that are not valid at any given time will be grayed out. For
example, when the test is first initiated, the Run TrueSAM button will be
grayed out because the test has not yet been configured.
Ethernet, IP, TCP/UDP, Fibre Chan., VoIP, and Video Testing Manual 265
Chapter 12 Automated Testing
TrueSAM
To view the component parts of these major actions, the Show Steps
checkbox can be selected. The configuration steps are displayed and can
be used to access these component steps by selecting them (see
Figure 77). Configuration steps not applicable for the chosen sequence of
tests will be grayed out.
Figure 77 TrueSAM Main Page with Steps shown
From this page you can initiate the following actions:
– Configure TrueSAM. To define all the parameters for the test at this
time, select Configure TrueSAM. For more information on configuring
the TrueSAM tests, go to step 5.
– Run TrueSAM. To initiate a configured test script, select Run
TrueSAM. For more information on running the TrueSAM tests, go to
“Running TrueSAM” on page 270
– View TrueSAM Report. To review a detailed report of the results
obtained from running the test, select View TrueSAM Report. For
more information on viewing the TrueSAM reports, go to “Running
TrueSAM” on page 270.
– Guided Configuration. To follow a guided path, accessing every applicable page in the configuration and testing sequence, the Guide Me
(green arrow) may be selected at the bottom of the window. Continue
selecting the green arrow at the bottom of every page until the necessary configuration selections have been made and the entire configuration and testing sequence is completed.
5 A status screen will momentarily appear with the current action being
implemented highlighted in the list. This list will appears at various times
while using the TrueSAM application to inform the user of the current
action and to indicate to the user actions that are valid. Valid actions will
be preceded by a green checkmark.
6 The Select Tests screen appears.
266
Ethernet, IP, TCP/UDP, Fibre Chan., VoIP, and Video Testing Manual
Chapter 12 Automated Testing
TrueSAM
The following tests are available to be included in the TrueSAM test.
– J-QuickCheck - automatically selected for all users to verify the ability
to run other tests.
– Enhanced RFC 2544 - not able to be run simultaneous with SAMComplete. For more information about this test, see “Automated RFC 2544
and Fibre Channel tests” on page 272.
– SAMComplete - not able to be run simultaneous with Enhanced RFC
2544. For more information about this test, see “SAMComplete” on
page 298.
– J-Proof - used to verify Layer 2 transparency (layer 2 services only).
For more information about this test, see “Using J-Proof to verify layer
2 transparency” on page 70.
– TrueSpeed - used to determine Throughput and Performance of the
circuit. For more information about this test, see “TrueSpeed Test” on
page 314.
If a test is not applicable for the current configuration it is grayed out.
Select the tests to be included in the TrueSAM test, then select the Next
arrow at the bottom of the screen.
7 The Communication (1) parameters screen appears.
Specify the communication parameters for the local unit.
a Choose whether the local MAC address is to be User Defined or
should the Factory Default be accepted.
b For Layer 3 services, select the L3-Source Type - Static or DHCP.
c Enter the Source IP, Subnet Mask and Default Gateway to be used
for this test.
Select the Next arrow at the bottom of the screen.
8 The Channel (Communication 2) parameters screen appears.
Specify the channel communication parameters for the remote unit.
– Specify the Encapsulation Method - None, VLAN or Q-in-Q.
– Specify the FrameType - DIX or 802.3.
– Specify the Interface connector. If
– Specify the Destination IP of the remote unit on the network.
NOTE:
If you are testing L3 services and are using DHCP to get an IP address for
the remote unit, communication issues may occur when using TrueSAM.
This is because the local end will switch tests on the far end as necessary in
order to run the selected tests. This test switching may cause the far end to
acquire a new IP address, in which case the near end would not be able to
communicate with it anymore. As an alternative, you could try using longer
DHCP leases on the far end (so the IP address will be maintained for longer), or use static IP addresses.
Select Connect to Channel to establish communications with the remote
unit. After the physical link has been established, the button turns yellow.
Select the Next arrow at the bottom of the screen.
Ethernet, IP, TCP/UDP, Fibre Chan., VoIP, and Video Testing Manual 267
Chapter 12 Automated Testing
TrueSAM
9 The Save Profile window appears.
Do one of the following:
a If no Profile is to be saved at his time, select the Skip Profiles arrow at
the bottom of the window. Go to step 11.
b If it is desired that the configuration be saved to memory (disk or USB),
specify the filename. To save somewhere other than the default location, press the Select button after the filename to define the directory
where it is to be stored.
c If it is desired that subsequent users be restricted from being able
modify this profile (may be modified if saved under different filename),
check the box Save as read-only.
d To save the file to memory, select the Save Profiles button. Then
select the Next arrow.
NOTE
Any TrueSAM (AMS) profile saved from BERT software prior to v.17 is not
compatible with the subsequent versions of the application. These profiles
must be re-configured and saved again to remove the incompatible settings.
Attempts to configure a unit with a TrueSAM application in BERT software
older than v.17 with profiles saved on a current unit (transferred on USB
stick, over network, etc.) will also be unsuccessful.
10 Do one of the following:
– Enter the desired name of the profile in the File Name box, and then
select Save Profile.
– Select Next to continue without saving the profile.
11 The TrueSAM Main Page appears.
The test is set up.
Go to step 4.
Loading TrueSAM Profile
Test profiles that configure all parameters of TrueSAM may have been previously saved into the memory. These tests can be loaded and run without any
changes or may be used as templates where any number of parameters may
be modified after loading.
NOTE
Any TrueSAM (AMS) profile saved from BERT software prior to v.17 is not
compatible with the subsequent versions of the application. These profiles
must be re-configured and saved again to remove the incompatible settings.
Attempts to configure a unit with a TrueSAM application in BERT software
older than v.17 with profiles saved on a current unit (transferred on USB
stick, over network, etc.) will also be unsuccessful.
268
Ethernet, IP, TCP/UDP, Fibre Chan., VoIP, and Video Testing Manual
Chapter 12 Automated Testing
TrueSAM
Loading profile from memory
The Profile selection window appears.
Figure 78 Saved Profiles window
The filenames of the saved profiles will be listed in the center of the window.
Do the following:
1 The default display will be of saved profiles for the currently selected interface. To select a configuration saved from another interface, select from
the drop-down list accessible by clicking on the up-down arrow at the right
end of the File Type field displayed under the files list window.
2 To manage files on the displayed list, select the desired file(s) and then
select the Delete or Delete All buttons to remove them from the memory.
3 To load a profile, select one from the list whose configuration is to be
loaded.
4 Select the Load Profile button to load the configuration for all tests. After
profile has successfully loaded select, OK and then select the Next arrow.
5 The Main TrueSAM window appears. Go to step 4 of “Setting up
TrueSAM” on page 265.
The TrueSAM profile has been loaded.
Ethernet, IP, TCP/UDP, Fibre Chan., VoIP, and Video Testing Manual 269
Chapter 12 Automated Testing
Launching a single automated test
Running TrueSAM
After specifying settings or loading a profile, you are ready to run the test.
To run TrueSAM
– Select Run tests.
When all test are completed, a report is automatically generated and saved to
memory. To view the report, select View Report on the main TrueSAM screen.
The contents of the report will vary considerably depending upon the circuit
under test and the test selected.
The TrueSAM test has been run.
Launching a single automated test
The TrueSAM application is ideal for service turn-ups. But, if the service is
already functioning and a specific problem needs to be examined, there are
automated tests that can be run individually.
Before launching an automated test, select the appropriate Traffic or Multiple
Streams application (in Terminate or Dual Terminate mode). When running a
script in Dual Terminate mode, you can only launch a script for one port. You
can not run scripts from both ports.
CAUTION: CORRUPTED RESULTS
Pressing Restart during a test could corrupt the results. To ensure accurate
script results, wait for the script to complete before pressing Restart.
Table 31 lists the available automated tests for each application.
Table 31 Automated Tests
270
Automated Test
Applicationa
Enhanced RFC 2544 Test
Ethernet
– Layer 2 Traffic
– Layer 3 Traffic
– Layer 4 Traffic
FC Test
Fibre Channel
– Layer 2 Traffic
SAMComplete (not applicable
with 40G/100G Transport
Module)
Ethernet
– Layer 2 Traffic
– Layer 2 Multiple Streams
– Layer 3 Traffic
– Layer 3 Multiple Streams
– Layer 4 TCP Wirespeed
VLAN
Ethernet
– Layer 2 Traffic
– Layer 3 Traffic
– Layer 4 Traffic
Ethernet, IP, TCP/UDP, Fibre Chan., VoIP, and Video Testing Manual
Chapter 12 Automated Testing
Launching a single automated test
Table 31 Automated Tests (Continued)
Automated Test
Applicationa
FTP Throughput
Ethernet
– Layer 3 Traffic
– Layer 4 Traffic
HTTP Throughput
Ethernet
– Layer 3 Traffic
– Layer 4 Traffic
TCP Throughput
Ethernet
– Layer 2 Traffic
– Layer 3 Traffic
– Layer 4 Traffic
TrueSpeed Test
Ethernet
– Layer 4 TCP Wirespeed
a. The RFC tests are not available when running NextGen GFP or OTN applications.
To launch an automated test
1 If you haven’t already done so, use the Test menu to select the appropriate application. Be certain to select Terminate or Dual Terminate mode.
2 Connect the modules on the near-end and the far end to the circuit.
3 If you are testing an optical interface, on both units, select the Laser
button to turn the laser on.
4 On both modules, verify that the green Signal Present, Sync Acquired, and
Link Active LEDs are illuminated.
5 If you are running the test with layer 3 traffic, and you enabled ARP,
observe the Message Log to verify that ARP successfully determined the
destination MAC address.
6 On the Main screen, do one of the following:
– If you are running the RFC 2544 test, press the Enhanced RFC 2544
Test soft key, and proceed to “Running the RFC 2544 or Fibre Channel
tests” on page 287.
– If you are running the automated Fibre Channel test, press the FC Test
or Enhanced FC Test soft key, and proceed to “Running the RFC 2544
or Fibre Channel tests” on page 287.
– If you are running the automated multiple Ethernet service verification
SAMComplete test, press the SAMComplete soft key, and proceed to
“SAMComplete” on page 298.
– If you are running the FTP Throughput or HTTP Throughput automated
test, press the press the Toolkit soft key, and then select the test you
want to run from the Select Tool menu. Proceed to “Throughput test”
on page 280 or “Automated HTTP Throughput tests” on page 312.
– If you are running the TCP Throughput automated test, press the
Toolkit soft key, and then select TCP Throughput. Proceed to
“Running TCP Host or Wirespeed applications” on page 156 of
Chapter 6 “TCP/UDP Testing”.
The automated test is launched.
Ethernet, IP, TCP/UDP, Fibre Chan., VoIP, and Video Testing Manual 271
Chapter 12 Automated Testing
Automated RFC 2544 and Fibre Channel tests
Automated RFC 2544 and Fibre Channel tests
If your instrument is configured and optioned to do so, you can use it to run
tests that automate the procedures recommended in RFC 2544 for layer 2
Ethernet, layer 3 IP, or layer 4 TCP/UDP (N/A 100G Ethernet Client in OTU4).
You can also run a test that uses similar parameters for layer 2 Fibre Channel.
The tests prompt you to select key parameters for throughput, round trip delay,
frame loss rate, and back to back frame tests, run the tests, and then automatically generates a text file of results for the tests and a log file detailing the progress of the script. A PDF file is also generated which includes the test results
in tabular and graphical formats.
Features and capabilities
The instrument supports the following features when running the RFC 2544
tests:
– Support for all Ethernet line rates.
– J-QuickCheck—Before running the Enhanced RFC 2544 test, you can run
the J-QuickCheck application to verify that the local and remote instruments are configured properly to bring up the link, verify auto negotiation
of the link, establish the link, establish a loopback, and then verify that the
link can support 100% traffic utilization. There is also an extended Layer 2
traffic test useful for quick turn-ups. For details, see “Running J-QuickCheck” on page 275.
– Graphical output of key results. When running the tests, frame loss,
throughput, and latency (round trip delay) results are now displayed graphically in their own result categories.
– Status bar. A status bar is also provided that lets you know how far the test
has progressed, and provides an estimate of the time remaining to run the
test.
– Report output. You can save the test results to a user-named file in PDF,
XML, or TXT format.
– Enhanced test. You can run the Enhanced RFC 2544 test, and indicate
whether you want to run a symmetrical test, or an upstream, downstream,
or combined asymmetrical test.
– Asymmetric RFC 2544 (not applicable with 40G/100G Transport Module).
You can run the Enhanced RFC 2544 test in asymmetric mode in an endto-end configuration. This is useful for testing circuits carrying traffic at
different upstream and downstream line rates. The test is initiated by a
master tester (on the near end). The master tester then automatically
configures the slave tester on the far end.
– TAM (Test Access Management) automation—If your instrument is configured and optioned to do so, you can now use it to remotely log into and
provision network elements (for example, switches and routers) from a
Mobility Switching Center (MSC) by issuing TL1 commands. For details,
see “Testing using TAM automation” on page 324.
– System recovery testing per RFC 2544 (not applicable with 40G/100G
Transport Module). You can use the instrument to determine the amount
of time it takes for a network element to recover from a state where it is
dropping frames.
– Exporting and importing of configurations for the Enhanced RFC test.
272
Ethernet, IP, TCP/UDP, Fibre Chan., VoIP, and Video Testing Manual
Chapter 12 Automated Testing
Automated RFC 2544 and Fibre Channel tests
– The Enhanced RFC tests supports both round-trip delay (RTD) and oneway delay (OWD). If your instrument is optioned and configured for oneway delay, you can choose whether to run a Latency (RTD) or Latency
(OWD) test.
– TCP Wirespeed test. This is a 5-step test to test TCP throughput for 64
connections.
About loopbacks
During the automated tests, the instrument checks for a loopback. It could be
one of the following types:
Active loop — the destination has responded to a loop command.
Hard loop — the source and destination addresses are the same for both the
returned frames and the outgoing frames.
Permanent loop — the source and destination addresses are switched in the
returned frames. Permanent loop is not available L2 or in L3 when ARP is
disabled.
J-QuickCheck
Running the J-QuickCheck application involves configuring the instrument for
the RFC 2544 test using the standard setup tabs and then launching the
Enhanced RFC 2544 test.
There are now three ways in which the J-QuickCheck test may be run - the
original, simple verification that the local and remote instruments are configured properly to bring up the link; an extended Layer 2 Turnup test and an automatic initiation of the full RFC 2544 test upon completion of the J-QuickCheck
test link verification utilizing maximum throughput rates determined by the JQuickCheck test. These options can be run in combination or separately.
Understanding the J-QuickCheck
stages
At each of the three stages of the J-QuickCheck application, the instrument
automatically performs certain actions. Some actions must occur before others
can take place. For example, the local port must be up before a loopback can
take place.
Local Port
If the application indicates that the local port is down, (indicated by a red
Not Connected button), if you are running the application for an optical circuit,
verify that the laser is ON on both near and far end instruments. If you are
running the application for an electrical circuit, verify that frame sync and link
LEDs are illuminated on both instruments.
Auto-negotiation
Auto-negotiation can not take place until the physical link is established (indicated by a green UP button for the local port). If the local port is UP, during the
auto-negotiation stage, the instrument does the following:
– If the near end instrument determines that the far end instrument advertises that it supports auto-negotiation, the near end instrument automatically turns auto-negotiation ON, and indicates the negotiated speed and
duplex capabilities.
Ethernet, IP, TCP/UDP, Fibre Chan., VoIP, and Video Testing Manual 273
Chapter 12 Automated Testing
Automated RFC 2544 and Fibre Channel tests
– If you are running the application on an electrical circuit, and the near end
instrument determines that the far end instrument does not support autonegotiation, the near end instrument automatically turns auto-negotiation
OFF, sets the duplex setting to FULL, and the line rate to the detected
speed. A warning also appears informing you that it’s possible the far end
port is in half duplex mode.
– If you are running the application on an optical circuit, and the near end
instrument determines that the far end instrument does not support autonegotiation, the near end instrument automatically turns the laser OFF,
turns auto-negotiation OFF, then turns the laser back ON. It then indicates
the speed and duplex settings.
If at any time during this phase the link or frame synchronization is lost, the
instrument will alert you, and will then restart the application automatically.
Remote Loop (traffic test mode)
A remote loop up can not take place until the physical link is established and
auto-negotiation succeeds (is either ON or OFF). The instrument sends a loop
down, followed by a loop up. If the second attempt fails:
– If running a Layer 2 test (in traffic test mode):
The instrument checks for a hardware loop. If a hardware loop is not
found, it then checks for a permanent loop. If a permanent loop is not
found, the instrument declares “No Loop Found”.
– If running a Layer 3 or 4 test:
The instrument checks for a permanent loop. If a permanent loop is not
found and if ARP is Disabled, the instrument checks for a hardware loop. If
a hardware loop is not found, the instrument declares “No Loop Found”. If
ARP is Enabled, the instrument declares “No Loop Found”. If all three
attempts fail, verify that the correct destination address or port is specified
in your application settings, then run the J-QuickCheck application again.
Remote Loop (LBM/LBR test mode)
A remote loop up can not take place until the physical link is established and
auto-negotiation succeeds (is either ON or OFF). After link and negotiation
have been satisfied, the unit attempts a LBM/LBR loop. If established, the Load
Test and Throughput will run. If a LBM/LBR loop is not established, the Remote
Loop and Basic Load Test indicators will turn red indicating a failed test.
Basic Load Test
The load test can not take place until a remote loop is established or detected.
If a loop is in place, the near end instrument automatically transmits a full load
of traffic (100% at the selected line rate) using the frame or packet size that you
specified for the application. The instrument then calculates the average
layer 2 bandwidth utilization, and displays it as a percentage.
Test at configured Max Bandwidth
With this option selected, the RFC 2544 test will automatically be run upon
completion of the J-QuickCheck test using the Max Bandwidth setting preconfigured on the Setup-All Tests tab.
This option may both be selected simultaneously with the “Layer 2 Quick Test”.
274
Ethernet, IP, TCP/UDP, Fibre Chan., VoIP, and Video Testing Manual
Chapter 12 Automated Testing
Automated RFC 2544 and Fibre Channel tests
Layer 2 Quick Test
The Layer 2 Quick Test extended test option operates in the symmetric, loopback mode only thereby eliminating the number of configuration options. The
test can be configured to set the length of time the test is to be run and to
configure the CIR in the RFC 2544 settings with a percentage of the
Throughput value detected. The default value will be 100% (i.e. CIR will be
100% of the JQuickCheck Throughput).
This option may both be selected simultaneously with “Test at configured Max
Bandwidth”.
Running J-QuickCheck
Running the J-QuickCheck application involves configuring the instrument for
the RFC 2544 test using the standard setup tabs, launching the Enhanced
RFC 2544 test, selecting the J-QuickCheck tab, selecting the optional configuration/Layer 2 testing and then pressing the Run J-QuickCheck button.
1 On each instrument, specify the settings required to auto-negotiate link
capabilities, establish the link, and establish a soft loopback. For details,
see:
– “Specifying interface settings” on page 42. These settings control the
auto-negotiation process between the instruments.
– “Specifying Ethernet frame settings” on page 45. When running the
application for layer 2 traffic, the instrument will transmit traffic with the
frame size you specify. It will also use the addresses you specify when
attempting to loop-up the instrument on the far end.
– “Specifying transmitted IPv4 packet settings” on page 80. When
running the application for layer 3 traffic, the instrument will transmit
traffic with the frame size you specify. It will also use the addresses you
specify when attempting to loop-up the instrument on the far end.
– “Specifying TCP/UDP settings for transmitted traffic” on page 151.
When running the application for layer 4 traffic, the instrument will
transmit traffic with the packet size you specify. It will also use the port
numbers you specify when attempting to loop-up the instrument on the
far end.
2 On the Main screen, select the Enhanced RFC 2544 Test button, and
then wait for the RFC 2544 Setup screen to appear. Depending on the
number of processes you have running, this may take several seconds.
Ethernet, IP, TCP/UDP, Fibre Chan., VoIP, and Video Testing Manual 275
Chapter 12 Automated Testing
Automated RFC 2544 and Fibre Channel tests
3 When RFC 2544 is completely loaded, the configuration screen will
appear as shown in Figure 79. This screen provides a listing of all the RFC
Figure 79 RFC 2544 Pre-Configured Files
2544 pre-configured settings files saved in the unit. If you want to load one
of these pre-configured settings files, highlight it. The configured settings
in these setups cannot be changed.
4 If you would like to save a configuration that is not currently in the memory,
there are two ways to enter a new configuration:
a manually configure all parameters (assumes no pre-configured setting
file has been chosen), then select the New button.
b select one of the existing configurations that closely resembles what
you want and select Copy Selected. This will populate some fields
(configuration dependant) and allow modification of all parameters.
In either case after selecting New or Copy Selected button, the next
screen allows you to enter a custom name (up to 45 characters) for your
configuration. Enter the desired name and select OK. The current
configuration will be saved under the name provided.
To learn more about configuration of the parameters in the RFC 2544
test see “Asymmetrical tests” on page 279, “Throughput test” on
page 280, “Latency (RTD) test” on page 281 and “Packet Jitter test” on
page 282.
5 Select the J-QuickCheck tab.
276
Ethernet, IP, TCP/UDP, Fibre Chan., VoIP, and Video Testing Manual
Chapter 12 Automated Testing
Automated RFC 2544 and Fibre Channel tests
6 Check the options that you would like to implement to the standard JQuickCheck test - Test at configured Max Bandwidth and /or Layer 2 extended
test.
Figure 80 J-QuickCheck-Setup
If you selected Layer 2 Quick test extended, specify the Duration and the
Throughput Scaling.
7 Select the Run J-QuickCheck button at the lower right corner of the tab.
The screen in Figure 81 appears.
Figure 81 J-QuickCheck Screen
8 Observe the network diagram. The following occurs:
Ethernet, IP, TCP/UDP, Fibre Chan., VoIP, and Video Testing Manual 277
Chapter 12 Automated Testing
Automated RFC 2544 and Fibre Channel tests
a The instrument indicates that it is waiting for a link, then connecting the
link, and provides the status of the auto-negotiation capabilities. If
negotiation succeeds, the negotiated link speed and duplex capabilities
appear.
b The instrument sends a loop down, followed by a loop up. If the second
attempt fails:
– If running a Layer 2 test:
The instrument checks for a hardware loop. If a hardware loop is not
found, we check for a permanent loop. If a permanent loop is not found,
the instrument declares “No Loop Found”.
– If running a Layer 3 or 4 test:
The instrument checks for a permanent loop. If a permanent loop is not
found and if ARP is Disabled, the instrument checks for a hardware
loop. If a hardware loop is not found, the instrument declares “No Loop
Found”. If Are is Enabled, the instrument declares “No Loop Found”.
c The instrument checks for an active loop. If there is none, it issues a
loopup command to establish the loop. If the command fails, it sends it
a second time. If the second attempt fails, the instrument checks for a
hard loop on the far end. If a hard loop is not found, the instrument
checks for a permanent loop. Finally, the status of the remote loop up
appears.
d If the loopup is successful (indicated with a green button in the Remote
Loop box), the instrument moves on to transmit traffic over the link at
100% of the line rate to verify the link’s ability to support a full load of
traffic. If the test is successful, the button under Basic Load Test is
green, and the instrument calculates and displays the expected
throughput.
Green graphics on the screen indicate that an action was successful,
yellow indicates an action is currently taking place (for example,
connecting the local port to the link), and red indicates that an action failed
(for example, the remote loop failed). In Figure 81 on page 277, autonegotiation was successful, but the remote loop failed. As a result, the
basic load test failed (because traffic could not be transmitted and looped
back).
The bottom section of the screen also provides status messages that let
you know what the instrument is currently doing, and whether or not each
action succeeded. You can scroll through the messages using the up and
down arrows to the right of the text display.
278
Ethernet, IP, TCP/UDP, Fibre Chan., VoIP, and Video Testing Manual
Chapter 12 Automated Testing
Automated RFC 2544 and Fibre Channel tests
9 When the J-QuickCheck test has been completed, depending on the
number of options selected, there will be different buttons available for
initiating further action:
Figure 82 J-Quick Check Complete
a To continue testing, if pre-configured for Layer 2 Quick Test, select
Run Layer 2 Quick Test to start.
b To continue testing, if pre-configured for Test at Configured Max Bandwidth and Layer 2 Quick Test, select Run Layer 2 Quick Test to
initiate the Layer 2 Quick test or Run Layer 2 Quick Test and RFC
2544 Test button to initiate the RFC 2544 test immediately after the
Layer 2 Quick Test has been completed. The Restrict RFC to Layer 2
Quick Test scaled bandwidth checkbox can be checked to use the
results of the Layer 2 Quick test Bandwidth limitations in the RFC 2544
test.
c To continue testing, if pre-configured for Test at Configured Max Bandwidth, select Run RFC 2544 Test.
d If neither Layer 2 Quick Test or RFC 2544 test are to be run, at this
time, select Exit J-QuickCheck to return to the RFC 2544 interface or
Exit to leave the RFC 2544 application.
You ran the J-QuickCheck application
Asymmetrical tests
When testing upstream and downstream circuits at different line rates, you
must run an asymmetric RFC test. Two JDSU Ethernet test instruments must
be used at each end of the circuit. One test instrument operates as the master
instrument, and executes the RFC test. The other instrument operates as a
slave instrument, and is controlled remotely by the master instrument.
Ethernet, IP, TCP/UDP, Fibre Chan., VoIP, and Video Testing Manual 279
Chapter 12 Automated Testing
Automated RFC 2544 and Fibre Channel tests
Throughput test
JDSU zeroing-in method
The throughput test is used to determine the highest possible bandwidth at
which no frames are lost.
The JDSU zeroing-in method functions as follows:
Attempting Phase
– The test starts transmitting traffic at the Maximum Bandwidth, then waits 3
seconds.
– The test does a restart, then waits 5 seconds.
– The test calculates the average layer 2 bandwidth utilized (L2 Avg. % Util).
– If the Bandwidth Accuracy is 1% and the L2 Avg. % Util is less than
99.98%, the throughput is the integer value of the measurement. Otherwise, throughput is 100%.
– If the Bandwidth Accuracy is .1% or .01%:
– For 1Gig the test increases the load 3% over the L2 Avg. % Util
measured above.
– For 10 Mb we increase the load 30% over the L2 Avg. % Util measured
above.
– For 100 Mb we increase the load 3% over the L2 Avg. % Util measured
above, or to 100%, if the above increase would exceed 100%.
– If the Bandwidth Accuracy is .1% or .01%:
– Start traffic at the rate calculated above
– Wait 3 seconds
– Do a test restart
– Wait 5 seconds
– Get the L2 Avg. % Util
For .1% accuracy, Throughput is calculated as:
– The (integer value of L2 Avg.) % Util * 10 divided by 10
For .01% accuracy, Throughput is calculated as:
– The (integer value of L2 Avg.) % Util * 100 divided by 100
NOTE:
The minimal throughput values for mismatched (asynchronous) rates are
100k to 10G. Anything below 100k (such as 10k) that comes into a 10G unit
will not be detected because it is below the threshold granularity supported.
(0.001% of 10G = 100k)
Verifying Phase
The load is set to the calculated throughput value, and transmitted for the
Throughput Duration time. If the frame loss tolerance is exceeded, instructions
are provided for testing the link manually for intermittent problems, and the test
is aborted.
280
Ethernet, IP, TCP/UDP, Fibre Chan., VoIP, and Video Testing Manual
Chapter 12 Automated Testing
Automated RFC 2544 and Fibre Channel tests
Throughput test results
The following results are reported for every frame length you selected.
Cfg Length (Mbps)
The bit rate for transmitted traffic (expressed in Mbps) at which no frames were
lost for a particular frame length.
Measured Rate (Mbps)
The measured bit rate (expressed in Mbps) at which no frames were lost for a
particular frame length.
Measured Rate (%)
The bit rate (expressed as a percentage of the line rate) at which no frames
were lost for a particular frame length.
Measured Rate (frms/sec)
The peak frame rate (expressed in frames per second) at which no frames
were lost for a particular frame length.
Pause Detected
Indicates whether or not pause frames were detected at the point where no
frames were lost for a particular frame length.
These results are also reported when you run the Latency and Packet Jitter
tests.
Pass/fail threshold
You can configure the test to optionally indicate whether the Throughput test
passed or failed. To do so, you specify the bandwidth for the Throughput Pass
Threshold. If the highest rate at which frames are not lost is equal to or exceeds
the threshold, the test indicates that the test passed for each transmitted frame
length. If it falls below the threshold, the test indicates that the test failed.
Latency (RTD) test
If you intend to run the Latency test as part of the test, you must also run the
Throughput test.
About the latency test
The Latency test transmits traffic at a specified percentage of the bandwidth at
which no frames were lost (as determined during the Throughput test) for each
frame length you selected. The average delay is then measured after transmitting traffic for each frame length for the period of time that you specified as the
Latency (RTD) Trial Duration.The test measures delay for each trial (specified
as the Number of Latency (RTD) Trials), and each measurement is then added
to a running total. After all of the trials are complete, the running total is divided
by the number of trials to come up with a total trial average.
Ethernet, IP, TCP/UDP, Fibre Chan., VoIP, and Video Testing Manual 281
Chapter 12 Automated Testing
Automated RFC 2544 and Fibre Channel tests
If the Throughput test reached the lowest bandwidth limit without ever successfully receiving all transmitted frames (in other words, it lost frames), the
average delay will also be unavailable. Delay measured under 4 microseconds
is averaged as 4 microseconds. Unavailable measurements are not included
in the total trial average.
NOTE:
When running the Latency test in asymmetric mode, after looping up the
instrument on the far end, the instrument performs a symmetric throughput
test. Because the instrument loops up the far end instrument, the upstream
and downstream latency measurements in asymmetric mode are actually
the same measurement. All other tests are performed end-to-end (no loopback is performed).
Pass/fail threshold
You can configure the test to optionally indicate whether the Latency test
passed or failed. To do so, you specify the Latency (RTD) Pass Threshold. If
the total trial average for measured average delay is equal to or less than the
threshold, the test indicates that the test passed for each transmitted frame
length. If it exceeds the threshold, the test indicates that the test failed.
Packet Jitter test
If you intend to run the Packet Jitter test as part of the test, you must also run
the Throughput test.
About the Packet Jitter test
The Packet Jitter test transmits traffic at the maximum bandwidth at which no
frames were lost (determined using the Throughput test) for each frame length
you selected. The packet jitter is then measured after transmitting traffic for
each frame length for the period of time that you specified as the Packet Jitter
Trial Duration.
The test measures the average packet jitter and maximum packet jitter for each
trial (specified as the Number of Packet Jitter Trials), and then each measurement is added to a running total. After all of the trials are complete, the running
total is divided by the number of trials to come up with a total trial average
measurement.
If the Throughput test reached the lowest bandwidth limit without ever successfully receiving all transmitted frames (in otherworlds, it lost frames), the packet
jitter measurements will also be unavailable. Unavailable average or maximum
average measurements are not included in the total trial average.
Packet Jitter test results
Pass/fail threshold
282
Packet Jitter results are presented statistically.
You can configure the test to optionally indicate whether the Packet Jitter test
passed or failed. To do so, you specify the Packet Jitter Pass Threshold. For
each frame length you selected, the test compares the average packet jitter for
the trial to the value that you specified as the threshold. If the average packet
jitter is less than or equal to that specified for the threshold, the test indicates
that the test passed. If it exceeds the threshold, the test indicates that the test
failed.
Ethernet, IP, TCP/UDP, Fibre Chan., VoIP, and Video Testing Manual
Chapter 12 Automated Testing
Automated RFC 2544 and Fibre Channel tests
About the System Recovery
test
If you intend to run the System Recovery test, the Enhanced RFC 2544 mode
must be Symmetric, and you must also select and run the Throughput test.
About the System Recovery test
The instrument uses the Throughput test to determine the maximum bandwidth at which no frames were lost, then the System Recovery test transmits
traffic at 110% of the bandwidth (referred to as the “overload rate”) to force the
receiving network element to drop frames for each frame length you selected.
The instrument transmits the overload rate for at least 60 seconds, then
reduces the transmission rate to 50 percent of the overload rate (referred to as
the “recovery rate”). The instrument then measures the time it takes for the
network element to reach a state where it is no longer dropping frames.
If the Throughput test reaches the lowest bandwidth limit without ever successfully receiving all transmitted frames (in otherworlds, it lost frames), the System
Recovery test will not run.
System Recovery test results
Frame Loss test
About the frame loss test
System Recovery results are presented statistically and graphically.
The Frame Lost test measures bandwidth until no frames are lost.
For each frame length you select, beginning at the maximum test bandwidth
you specified, the instrument transmits traffic for the amount of time you specified as the Frame Loss Trial Duration. If frames are lost during that time frame,
the instrument reduces the transmitted bandwidth by the amount you specified
as the Frame Loss Bandwidth Granularity, and then transmits the traffic at the
reduced bandwidth.
The test decreases the transmitted bandwidth accordingly until either no
frames are lost during the duration specified, or the transmitted bandwidth
reaches the lowest bandwidth limit (specified as the Frame Loss Bandwidth
Granularity).
If the instrument succeeds in transmitting frames without losing any at a particular bandwidth, it then reduces the bandwidth one more time (by the granularity
amount). If no frames are lost, the test stops. If frames are lost, the instrument
starts the entire process over again until two successive trials occur without
losing frames.
Frame Loss test results
Back to Back Frames test
(Burst test)
About the Back to Back Frames test
Frame Loss results are presented in a tabular format, illustrating the frame loss
rate versus the percent of the bandwidth.
This test determines the maximum back to back burst size supported by the
network under test.
Using the frame length and other settings such as the frame type and encapsulation, the instrument calculates the burst size required to transmit back to
back frames for the duration that you specify as the Back to Back Max Trial
Time. It then transmits the burst of frames over the circuit. If the number of
frames transmitted carrying an Acterna payload does not equal the number of
received frames carrying an Acterna payload (indicating that frames were lost
Ethernet, IP, TCP/UDP, Fibre Chan., VoIP, and Video Testing Manual 283
Chapter 12 Automated Testing
Automated RFC 2544 and Fibre Channel tests
during the transmission), the instrument goes through the stages described for
the Throughput test (see “Throughput test” on page 280) until no frames are
lost, or until the number of frames per burst from the last successful burst
exceeds the Back to Back Frames Granularity by a 1 frame burst.
The test counts the number of frames received for each trial (specified as the
Number of Back to Back Frame Trials), and each count is added to a running
total. After all of the trials are complete, the running total is divided by the
number of trials to come up with a total trial average count. The test then uses
this count to calculate the average amount of time a burst can be transmitted
before a frame is dropped.
Back to Back test results
Optimizing the test time
Back to Back test results are presented in a table.
When you configure an Enhanced RFC test in symmetric mode, you can optimize the time it takes to run the test time by doing the following:
– Ensure that the duration time for the Throughput, Packet Jitter, and
Latency (RTD) tests is the same.
– Ensure that the number of trials for the Latency (RTD) and Packet Jitter
tests is “1” (one trial only).
If you configure the test in this manner, all three tests (Throughput, Latency,
and Packet Jitter) will be run simultaneously. If the duration times vary, or if you
indicate that you want to run more than one trial, each test will be executed in
succession. As a result, the test will take longer to complete.
When running the Enhanced RFC 2544 test in asymmetric mode, the Latency
test is run after the Throughput test, because it needs the symmetric
Throughput measurement before it can measure latency.
In addition to the duration time and number of trial settings, you can control the
bandwidth transmitted during the course of the test.
– If you select Top Down, the test transmits traffic at the maximum bandwidth specified, and then decreases the bandwidth for each trial by the
granularity you specify until you reach the minimum bandwidth specified.
– If you select Bottom Up, the test transmits traffic at the minimum bandwidth specified, and then increases the bandwidth for each trial by the
granularity you specify until you reach the maximum bandwidth specified.
284
Ethernet, IP, TCP/UDP, Fibre Chan., VoIP, and Video Testing Manual
Chapter 12 Automated Testing
Automated RFC 2544 and Fibre Channel tests
Specifying the external test
settings
The automated RFC and FC tests allow you to specify most required settings;
however, certain settings need to be specified outside of the automated test
screens (using the procedures listed in Table 33).
Table 32 RFC 2544 and Fibre Channel Setup Tab Settings
Layer/Setting
To specify, see....
Ethernet Layer 2
– Frame Type
– Destination Type
– Ether Type
“Specifying Ethernet frame settings” on page 45
–
Encapsulation
“Configuring VLAN tagged traffic” on page 50
“Configuring Q-in-Q traffic” on page 50
“Configuring stacked VLAN traffic” on page 50
“Configuring VPLS traffic” on page 51
“Filtering traffic using MPLS criteria” on page 57
–
Unit Identifier
“Specifying interface settings” on page 42
Fibre Channel Layer 2
– Flow Control: ON
“Specifying interface settings” on page 252
Layer 3
– ARP
“Specifying Ethernet frame settings” on page 45
–
–
“Specifying transmitted IPv4 packet settings” on
page 80
TTL
TOS/DSCP
Layer 4
– ATP Listen Port
“Specifying TCP/UDP settings for transmitted traffic” on page 151
To specify the external test settings
1 Select the Setup soft key, and then do one of the following:
– Ensure that each instrument has a source IP address residing on the
same subnet (see “Discovering another JDSU test instrument using
J-Connect” on page 33
– If you are running the test with layer 2 Ethernet traffic, select the
Ethernet tab to specify settings that define the frame characteristics of
the transmitted traffic, such as an 802.3 frame type, or a VLAN ID and
priority (see “Specifying Ethernet frame settings” on page 45).
– If you are running the test with layer 3 Ethernet (IP) traffic, select the
Ethernet tab to enable or disable ARP, and then select the IP tab to
specify settings that define the packet characteristics of the transmitted
traffic, such as the destination IP address (see “Specifying transmitted
IPv4 packet settings” on page 80).
– If you are running the test with layer 2 Fibre Channel traffic, select the
Fibre Channel tab to specify settings that define the frame characteristics of the traffic (see “Specifying Fibre Channel frame settings” on
page 255).
– If you are running the test with layer 4 traffic, select the TCP/UDP tab to
specify the listen port settings and indicate whether you want to
transmit TCP or UDP traffic (see “Specifying TCP/UDP settings for
transmitted traffic” on page 151).
Ethernet, IP, TCP/UDP, Fibre Chan., VoIP, and Video Testing Manual 285
Chapter 12 Automated Testing
Automated RFC 2544 and Fibre Channel tests
2 Verify the following settings:
– Payload analysis is ON for your current test application. You can not
run the RFC 2544 or Fibre Channel test when the module is configured
to analyze live traffic.
– Traffic is not VPLS or MPLS encapsulated. You can not run the RFC
2544 test with VPLS or MPLS encapsulated traffic.
– The module is not configured to run a timed test. You can not run the
RFC 2544 or Fibre Channel test during a timed test.
3 Select the Results soft key to return to the Main screen.
The external settings are specified.
Importing and exporting RFC
config files
The instrument allows importing and exporting of configuration files. This
allows consistent testing configurations which yield more reliable test results.
You will need a USB stick for transferring the files.
To export a RFC configuration
1 Verify that you have a USB stick inserted into the instrument.
2 After specifying the settings for your Enhanced RFC test, save the configuration.
3 Exit the test.
4 From the Tools menu, select Export to USB, and then Saved Test
Config.
5 Locate the *.expert_rfc file or files you wish to export. Click on the file
to select it (click again to un-select it).
6 Do one of the following:
– If exporting multiple files and you wish to zip them before exporting,
click the Zip selected files as box and specify a file name for the
resulting .tar file, and then click Zip &Export.
– If exporting files without zipping or are exporting a single file, Click
Export.
The files are copied to the USB stick.
To import a RFC configuration
1 Verify that you have a USB stick inserted into the instrument.
2 From the Tools menu, select Import from USB, and then Saved Test
Config.
3 Locate the file or files you wish to import. Click on the file to select it (click
again to un-select it).
4 Do one of the following:
– If importing a zipped file, click Unzip& Import.
– If importing one or more files that are not compressed, click Import
Test.
The files are copied to the instrument’s file directory. The next time you launch
the test, the imported configuration(s) appear in the configuration list.
286
Ethernet, IP, TCP/UDP, Fibre Chan., VoIP, and Video Testing Manual
Chapter 12 Automated Testing
Automated RFC 2544 and Fibre Channel tests
Running the RFC 2544 or
Fibre Channel tests
Specifying the external test
settings
Before running these tests, it’s important to understand which settings need to
be specified externally (outside of the automated test screens), and how to
navigate through the screens and menus presented when you run the tests.
The automated tests allow you to specify most required settings; however,
certain settings need to be specified outside of the automated test screens
(using the procedures listed in Table 33.
Table 33 RFC 2544 and Fibre Channel Setup Tab Settings
Layer/Setting
To specify, see....
Ethernet Layer 2
– Frame Type
– Destination Type
– Ether Type
– Unit Identifier
“Specifying Ethernet frame settings” on page 45
Fibre Channel Layer 2
– Flow Control: ON
“Specifying interface settings” on page 252
“Specifying interface settings” on page 42
Layer 3
– ARP
– TTL
– TOS/DSCP
“Specifying Ethernet frame settings” on page 45
“Specifying transmitted IPv4 packet settings” on
page 80
Layer 4
– ATP Listen Port
“Specifying TCP/UDP settings for transmitted traffic” on page 151
To specify the external test settings
1 Select the Setup soft key, and then do one of the following:
– If you are running the test with layer 2 Ethernet traffic, select the
Ethernet tab to specify settings that define the frame characteristics of
the transmitted traffic, such as an 802.3 frame type, or a VLAN ID and
priority (see “Specifying Ethernet frame settings” on page 45).
– If you are running the test with layer 3 Ethernet (IP) traffic, select the
Ethernet tab to enable or disable ARP, and then select the IP tab to
specify settings that define the packet characteristics of the transmitted
traffic, such as the destination IP address (see “Specifying transmitted
IPv4 packet settings” on page 80).
NOTE:
If running two 6000/8000 instruments end-to-end, keep in mind that the
instrument’s PPPoE server is a demo server and does not support full
server functionality. Thus, round trip delay cannot be measured. To measure round trip delay, use a network server.
– If you are running the test with layer 2 Fibre Channel traffic, select the
Fibre Channel tab to specify settings that define the frame characteristics of the traffic (see “Specifying Fibre Channel frame settings” on
page 255).
– If you are running the test with layer 4 traffic, select the TCP/UDP tab to
specify the listen port settings and indicate whether you want to
transmit TCP or UDP traffic (see “Specifying TCP/UDP settings for
transmitted traffic” on page 151).
Ethernet, IP, TCP/UDP, Fibre Chan., VoIP, and Video Testing Manual 287
Chapter 12 Automated Testing
Automated RFC 2544 and Fibre Channel tests
2 Verify the following settings:
– Payload analysis is ON for your current test application. You can not
run the RFC 2544 or Fibre Channel test when the module is configured
to analyze live traffic.
– Traffic is not VPLS or MPLS encapsulated. You can not run the RFC
2544 test with VPLS or MPLS encapsulated traffic.
– The module is not configured to run a timed test. You can not run the
RFC 2544 or Fibre Channel test during a timed test.
3 Select the Results soft key to return to the Main screen.
The external settings are specified.
Running symmetrical Enhanced
RFC 2544 or Enhanced FC tests
To run a symmetrical Enhanced RFC 2544 or FC tests
1 On both instruments, use the Test menu on the Main screen to select the
appropriate application (see “Launching a single automated test” on
page 270), then specify the external settings required to establish a link
between the instruments (see “Specifying the external test settings” on
page 285).
2 Connect each instrument to the circuit, and verify that the
Link Active LEDs are green. For details, refer to the Getting Started
Manual that shipped with your instrument or upgrade.
3 On each instrument, on the Main screen, select the Enhanced RFC 2544
Test or Enhanced FC Test button, and then wait for the RFC 2544 Setup
or FC Setup screen to appear. Depending on the number of processes you
have running, this may take several seconds.
Figure 83 RFC 2544 Setup screen
288
Ethernet, IP, TCP/UDP, Fibre Chan., VoIP, and Video Testing Manual
Chapter 12 Automated Testing
Automated RFC 2544 and Fibre Channel tests
The screen provides buttons that allow you to:
– Copy existing configurations.
– Add new configurations
– Delete configurations that you no longer need.
– Exit the screen, and return to the Main screen.
– Move backwards and forwards through the setup tabs.
– Run the test.
4 Do one of the following:
– To create a completely new script configuration which is not based on
an existing configuration, select New, type the name for the configuration, and then select Ok.
– To create a new script configuration based on an existing configuration,
select the configuration, select Copy Selected, type the name for the
new configuration, and then select Ok.
– To modify settings for an existing configuration, select the configuration, and then proceed to step 5.
5 If you want to run the script configuration using the current settings, select
Run Test; otherwise, do the following:
a Select the Symmetry tab (see Figure 86 on page 296), and then select
Symmetric as the RFC 2544 mode.
b Select the Setup tab, then select the All Tests sub-tab. Select the
automated tests that you would like to run using the application.
Figure 84 All Tests tab
NOTE:
If your instrument is optioned and configured to test one-way delay, you will
have two selections for latency: Latency (RTD) to test round-trip delay, and
Latency (OWD) to test one-way delay. Only one can run at a time.
Since OWD is an asymmetric test, it cannot be combined with Throughput
or Packet Jitter if running a symmetrical test.
Ethernet, IP, TCP/UDP, Fibre Chan., VoIP, and Video Testing Manual 289
Chapter 12 Automated Testing
Automated RFC 2544 and Fibre Channel tests
c If you selected a layer 3 or layer 4 traffic application, indicate whether
or not you are specifying a frame size or packet length for transmitted
traffic.
d Specify the Frame Lengths to Test.
e Specify the Maximum Bandwidth (Mbps) to transmit when running the
script as a percentage of the line rate.
f
Specify the the Bit Rate format to use for load-related setups:
percentage, L1Mbps, L2Mbps, L1kbps, or L2 kbps.
Percent, Mbps, and kbps are available when running symmetrical tests
on electrical interfaces.
Percent and Mbps are available when running symmetrical tests on
optical interfaces.
Mbps and kbps are available when running asymmetrical tests on electrical interfaces.
Mbps only is available when running asymmetrical tests on optical interfaces.
g Proceed to step 6.
6 For each test that you indicated you wanted to run in step 5, do the
following:
Table 34 RFC 2544 and FC Script Settings
Setup Tab/Test
Settings
Throughput
Measurement Accuracy
Specify the accuracy for bandwidth measurements, from
1% down to 0.001%. 1% accuracy is recommended for
shorter test times.
Trial Duration
Specify the duration for each trial in seconds.
Pass / Fail
Indicate whether you want the Pass / Fail status to be
shown for the test.
Frame Loss Tolerance
Specify the maximum frame loss tolerance allowed to for
passed tests. Tests with values exceeding the tolerance
will be considered failures.
If you specify a value exceeding 0.00, the test will not
comply with the standards stated in RFC 2544.
Throughput Threshold
Specify the minimum bandwidth required (as a percentage of the line rate) for passed tests.
290
Ethernet, IP, TCP/UDP, Fibre Chan., VoIP, and Video Testing Manual
Chapter 12 Automated Testing
Automated RFC 2544 and Fibre Channel tests
Table 34 RFC 2544 and FC Script Settings (Continued)
Setup Tab/Test
Settings
Latency (RTD)
or Latency (OWD),
based on the selection on the “All Tests”
tab.
(One Way Delay not
available in Fibre
Channel test)
Number of Trials
Specify the number of trials for each frame size or
packet length selected.
Trial Duration (seconds)
Specify the duration for each trial in seconds.
Latency(RTD) Threshold (us)/ Pass / Fail
Select checkbox to indicate that you want the Pass / Fail
status to be shown for the test.
Enter the maximum delay, in usecs, at which the test will
pass.
Latency Bandwidth
Choose the % of the bandwidth found during the
throughput test at which you would like to run the
Latency test for each frame size.
OWD Policy
Specify the action to take in the event the OWD cannot
be performed due to no GPS or 1PPS sync: Abort Test
or Continue with RTD. If Continue with RTD is
selected, any Pass/Fail criteria specified for OWD is
ignored.
Remote IP Address
When in a L2 application and the RFC is configured to
run a Symmetric test, the Remote IP Address is used to
establish the asymmetric communication channel
required to perform OWD.
Packet Jitter
RFC 2544 only
Number of Trials
Specify the number of trials for each frame size or
packet length selected.
Packet Jitter Threshold
Specify the maximum average packet jitter measurement allowed for passed tests.
Trial Duration (seconds)
Specify the duration for each trial in seconds.
Pass / Fail
Indicate whether you want the Pass / Fail status to be
shown for the test.
System Recovery
(not available in Fibre
Channel test)
Number of Trials
Specify the number of trials to execute.
Trial Duration (seconds)
Specify the duration for each trial in seconds.
Ethernet, IP, TCP/UDP, Fibre Chan., VoIP, and Video Testing Manual 291
Chapter 12 Automated Testing
Automated RFC 2544 and Fibre Channel tests
Table 34 RFC 2544 and FC Script Settings (Continued)
Setup Tab/Test
Settings
Frame Loss
Test Procedure
Indicate whether you want to run the test as follows:
– RFC 2544. Transmits traffic at the maximum bandwidth, and then decreases the bandwidth for each
trial by the granularity you specify. The test ends
after two successive trials with no frames lost.
– Top Down. Transmits traffic at the maximum bandwidth specified in the Test Range setting, and then
decreases the bandwidth for each trial by the granularity you specify until you reach the minimum bandwidth specified for the Test Range.
– Bottom Up. Transmits traffic at the minimum bandwidth specified in the Test Range setting, and then
increases the bandwidth for each trial by the granularity you specify until you reach the maximum bandwidth specified for the Test Range.
Test Range
If you selected Top Down or Bottom Up as the test procedure, indicate the following:
– Min. Enter the minimum bandwidth for the range.
– Max. Enter the maximum bandwidth for the range.
Trial Duration (seconds)
Specify the duration for each trial in seconds.
Bandwidth Granularity (%)
Specify the percentage of the bandwidth to increase or
decrease for each trial (depending on the test procedure
that you selected).
292
Ethernet, IP, TCP/UDP, Fibre Chan., VoIP, and Video Testing Manual
Chapter 12 Automated Testing
Automated RFC 2544 and Fibre Channel tests
Table 34 RFC 2544 and FC Script Settings (Continued)
Setup Tab/Test
Settings
Back to Back
Back to Back Test Type
Select RFC2544 Standard or Committed Burst Size.
The RFC2544 test runs as described in the Frame Loss
Test Procedure above.
The CBS Test can be used to test Committed Burst Size
(CBS) policers. This test has several options that assist
in verifying that the network CBS is configured correctly.
During the CBS Tests, back to back bursts of various
sizes are generated depending on the test settings. The
bursts are generated with an average throughput rate
that is based on either the Throughput Test if selected to
run, or if not, the Maximum Bandwidth setting on the All
Tests page.
Number of Trials
Specify the number of trials for each frame size or packet
length selected.
CBS Test Options
Select whether to show the pass/fail status.
Select whether to run the Burst Policing Test. A Burst
Policing Test generates traffic burst lengths that exceed
the user configured CBS value in order to verify that the
equipment policer is limiting bursts that exceed the CBS.
If this test is selected (indicated by a check mark), specify the Overload %.
If the policier is working correctly, the test results will
indicate frame loss. This indicates the policier is limiting
bursts, causing frame loss.
Trial Time (seconds)
Specify the maximum time for each trial.
Pause Frame Policy
Select whether to ignore pause frames.
CBS Size (kB)
Specify whether to send CBS bytes only (the actual
burst size equals the committed burst size; if unchecked,
the burst will slightly exceed the CBS), and specify the
number of kB in each burst, where k = 1000. If the
policer is working correctly, all frames in the bursts will
be received on the far end, i.e. no frame loss.
Buffer Credit
(Fibre Channel only)
Flow Control Login Type
Indicate whether you want to use an Implicit (Transparent Link) or Explicit (E-Port) login.
Max Buffer Size
Specify the maximum buffer credit size. Verify that the
instrument looping back the traffic is set up as follows:
– Flow control must be ON
– Flow control login type must match the type specified
on the traffic originating instrument.
– Transmitted buffer credits match the number specified on the traffic originating instrument.
Duration
Specify the duration for each trial in seconds.
Ethernet, IP, TCP/UDP, Fibre Chan., VoIP, and Video Testing Manual 293
Chapter 12 Automated Testing
Automated RFC 2544 and Fibre Channel tests
7 After specifying the required settings, select Run Test.
The RFC 2544 or FC Results Progress screen appears, providing
messages that note the link and loopup status, and then run through the
tests that you selected. You can also observe detailed results for each test
by selecting the RFC 2544 or FC Results Summary tab at the top of the
screen.
8 After the report is generated, the Save Report screen appears.
Figure 85 Save Report screen
a To save the report do the following:
–
enter the filename under which you would like the report stored.
–
type the report header information that you would like to appear at
the beginning of the report in the appropriate fields.
–
select the checkbox, under Comments field, to have a progress log
appear at the end of the report,
–
When all fields are filled to your satisfaction, select Yes, and a .pdf
copy of the report will be saved to the report subdirectory in the
unit’s hard drive. Additionally, a text file of results for the tests (.txt)
and a log file detailing the progress of the script (_log.txt)are saved
under the specified filename.
b To decline saving of the report, at this time, select No.
c To preview the report, select the View Report button.
The test is complete.
Running asymmetrical Enhanced
RFC 2544 tests
294
To run an asymmetrical Enhanced RFC 2544 test
1 On the local test instruments, use the Test menu on the Main screen to
select a Layer 2 Traffic application in Terminate mode (see “Launching a
single automated test” on page 270), then specify the external settings
required to establish a link between the instruments (see “Specifying the
external test settings” on page 285).
Ethernet, IP, TCP/UDP, Fibre Chan., VoIP, and Video Testing Manual
Chapter 12 Automated Testing
Automated RFC 2544 and Fibre Channel tests
2 Connect each instrument to the circuit, and then on the local instrument,
select Connect to Remote.
Verify that the Link Active LEDs are green. For details, refer to the
Getting Started Manual that shipped with your instrument or upgrade.
3 Select the Remote Setup tab, and then specify the settings.
NOTE
A connection must be established between the local and remote instrument
before specifying the Remote Setup.
4 On the Main screen of the master instrument, select the Enhanced RFC
2544 Test, and then wait for the RFC 2544 Setup screen to appear.
Depending on the number of processes you have running, this may take
several seconds.
Do not select the Enhanced RFC 2544 Test button on the slave instrument.
5 On the master instrument, do one of the following:
– To create a completely new script configuration which is not based on
an existing configuration, select New, type the name for the configuration, and then select Ok.
– To create a new script configuration based on an existing configuration,
select the configuration, select Copy Selected, type the name for the
new configuration, and then select Ok.
– To modify settings for an existing configuration, select the configuration, and then proceed to step 5.
6 Select the Symmetry tab (see Figure 86 on page 296), then do the
following:
a In RFC 2544 mode, select Asymmetric.
b In Tx Direction, select one of the following:
– Upstream, to test the upstream link.
– Downstream, to test the downstream link.
– Combined, to test the upstream and downstream links.
Ethernet, IP, TCP/UDP, Fibre Chan., VoIP, and Video Testing Manual 295
Chapter 12 Automated Testing
Automated RFC 2544 and Fibre Channel tests
c In Remote IP Address, specify the IP address of the slave instrument.
This is the address the master instrument will use to control the slave
instrument remotely.
Figure 86 Symmetry tab
7 Upstream or Combined Tx Direction. To configure the test for the
upstream (from the master instrument towards the slave instrument), on
the master instrument, select Local Setup, then select the All Tests tab.
Do the following:
a Select the automated tests that you would like to run using the application.
b Specify the frame sizes or packet lengths to test.
c Specify the maximum bandwidth to transmit when running the application as a percentage of the line rate, or in Mbps. Be certain this value
represents the correct bandwidth for upstream traffic.
d Specify the settings on the remaining tabs as described in step 6 on
page 290 of “Running symmetrical Enhanced RFC 2544 or Enhanced
FC tests”.
e Select the Selected Tx Direction Upstream button (located at the
bottom of screen). The button changes to Selected Tx Direction
Downstream, and the tab name changes to Remote Setup.
f
Proceed to step 8.
8 Downstream or Combined Tx Direction. To configure the test for the
downstream (from the slave instrument towards the master instrument), on
the Remote Setup tab (shown in Figure 87 on page 297), do the following:
a Select the automated tests that you would like to run downstream.
b Specify the frame sizes or packet lengths to test.
c Specify the maximum bandwidth to transmit when running the application as a percentage of the line rate, or in Mbps. Be certain this value
represents the correct bandwidth for downstream traffic.
296
Ethernet, IP, TCP/UDP, Fibre Chan., VoIP, and Video Testing Manual
Chapter 12 Automated Testing
Automated RFC 2544 and Fibre Channel tests
d Specify the settings on the remaining tabs as described in step 6 on
page 290 of “Running symmetrical Enhanced RFC 2544 or Enhanced
FC tests”.
Figure 87 Remote Setup tab
NOTE:
If your instrument is optioned and configured to test one-way delay, you will
have two selections for latency: Latency (RTD) to test round-trip delay, and
Latency (OWD) to test one-way delay. Only one can run at a time.
Since OWD is an asymmetric test, it cannot be combined with Throughput
or Packet Jitter if running a symmetrical test.
9 After specifying the required settings, select Run Test.
The RFC 2544 Progress screen appears, providing messages that note
the link status and loopup status (if you are running the Latency test, and
then run through the tests that you selected. You can also observe detailed
results for each test by selecting the RFC 2544 or FC Results Summary
tab at the top of the screen.
Ethernet, IP, TCP/UDP, Fibre Chan., VoIP, and Video Testing Manual 297
Chapter 12 Automated Testing
SAMComplete
10 After the report is generated, the Save Report screen appears.
Figure 88 Save Report screen
a To save the report do the following:
–
enter the filename under which you would like the report stored.
–
type the report header information that you would like to appear at
the beginning of the report in the appropriate fields.
–
select the checkbox, under Comments field, to have a progress log
appear at the end of the report,
–
When all fields are filled to your satisfaction, select Yes, and a .pdf
copy of the report will be saved to the report subdirectory in the
unit’s hard drive. Additionally, a text file of results for the tests (.txt)
and a log file detailing the progress of the script (_log.txt)are saved
under the specified filename.
b To decline saving of the report, at this time, select No.
c To preview the report, select the View Report button.
The test is complete.
SAMComplete
SAMComplete functionality is standard on all units and all Ethernet line rates
supported. Although all applications do not include SAMComplete functionality, if your instrument is appropriately configured for a capable application,
you can use it to run the SAMComplete test.
This test is a multi-stream test based on ITU-T Y.1564 that performs a twophase test. First, the test verifies whether each Ethernet service is properly
configured. Second, multiple Ethernet service instances are verified simultane-
298
Ethernet, IP, TCP/UDP, Fibre Chan., VoIP, and Video Testing Manual
Chapter 12 Automated Testing
SAMComplete
ously, each meeting its assigned Committed Information Rate (CIR). All
services are transmitted at CIR and must pass all SLA parameters (FDV, FTD,
RTD and Availability)
To launch the SAMComplete test
1 If you haven’t already done so, use the Test Menu to select the Traffic
Terminate or Multistream application on Layer 2 or Layer 3; or the TCP
Wirespeed application on Layer 4 for the circuit you are testing (see
“Launching a single automated test” on page 270), and connect the instrument to the circuit. For details, refer to the Getting Started Manual that
shipped with your instrument or upgrade.
2 Select SAMComplete soft button.
If the button is greyed out, the test cannot be launched. This is typically
due to an invalid setup setting. For example, you are configured for VPLS/
MPLS, Stacked VLAN, or PPPoE.
The test launches and the SAMComplete Configuration menu appears.
NOTE:
If you are running SAMComplete on a 40G/100G TM, please take note of
the following facts:
It is possible to switch between SAMComplete and the Setup panel on the
user interface: Click the Go To button at the top of the screen and then click
the Results button in the dialog. You may switch between Setups and
Results using the appropriate soft buttons. Note that the SAMComplete soft
button is yellow to indicate it has been launched. You may return to SAMComplete by clicking it.
The default ATP version on 40/100G TM is ATPv2
For high-resolution between two 40/100G TM running SAMComplete, set
both units to ATPv3
When running SAMComplete between a 40G/100G TM and MSAM, use
ATPv2 on both units as MSAM strictly supports ATPv2
Configuring test settings
From the configuration page, the settings be configured manually, or if a profile
has been previously configured and saved, the test settings can be loaded into
SAMComplete.
To configure test settings
To configure all options yourself, select the green arrow to the right of
Configure Test Settings Manually. Go to step 2 on page 300.
To load configuration settings set from a previously saved file, select the
green arrow to the right of Load Configuration from a Profile.
1 The Profile selection window appears.
The filenames of the saved profiles will be listed on the left side of the
window and all sections of the currently loaded profile will be listed on the
right side of the screen.
Do the following:
a Select a profile from the list whose configuration is to be loaded.
Ethernet, IP, TCP/UDP, Fibre Chan., VoIP, and Video Testing Manual 299
Chapter 12 Automated Testing
SAMComplete
b Check those sections, on the right side of the screen, that are to be
loaded into the test. If no profile has yet been selected, the currently
configured profile sections will be checked.
Any section not selected will not be configured into the test. Any parameter of the test (checked or not checked) may be reconfigured at a later
point in the configuration process.
c Select the Load Profiles button to load all checked sections into the
test. After profile has successfully loaded select, OK and then select
the Next arrow. Go to “Choosing tests” on page 306.
TIPS:
1. Generally, selecting the Next button (right green arrow) on each page will
advance to the next step you need to do, but if at any time, you need to
return to the test configuration, skip to running tests, or review test results,
select the Go To... button, and then select the step to which you need to
return.
2. To save a view of the screen on the unit for future reference, use the
camera icon to capture a screenshot.
2 The first Symmetry page appears.
Do the following:
a Select the Throughput type:
NOTE:
Bidirectional tests must be initiated on an MSAM. The remote unit may be
an MSAM, T-BERD/MTS 5800 or a Transport Module. An HST-3000 (with
Ethernet SIM) cannot be used for bidirectional tests.
Symmetric – used where only one set of throughput parameters are
defined because upstream and downstream transmission is identical as
the signal is being looped back to the source or transmitted both downstream and upstream simultaneously.
Figure 89 Symmetric Connection - Loopback Option
300
Ethernet, IP, TCP/UDP, Fibre Chan., VoIP, and Video Testing Manual
Chapter 12 Automated Testing
SAMComplete
d
Figure 90 Symmetric Connection- Simultaneous Bidirectional
Option
Asymmetric – used where upstream and downstream parameters in a bidirectional test are individually specified and may be different.
Figure 91 Asymmetric Connection Option
NOTE:
ARP must be enabled on both units if running a bi-directional SAMComplete
test in L3 or Wirespeed applications.
Ethernet, IP, TCP/UDP, Fibre Chan., VoIP, and Video Testing Manual 301
Chapter 12 Automated Testing
SAMComplete
Unidirectional – test is only conducted in one direction. May be either
upstream or downstream.
Figure 92 Unidirectional Connection Options
b Depending upon the chosen Throughput Type, select Loopback or
One-Way Transmission and Direction, if needed:
– Loopback - only available with Symmetric throughput type as the signal
is being looped back to the source, thus identical parameters are
required.
– One-Way Transmission - tests are only conducted in a single direction.
For Unidirectional Throughput type direction, Upstream or Downstream
must be specified.
c If unit is configured with the One-Way Delay (OWD) sync hardware, the
Enable One-Way Delay checkbox will also appear at the bottom of the
page. Check this box to activate the CDMA or GPS receiver with onepulse-per-second sync to obtain OWD results.
Note that the diagram on the right of the interface page indicates the
type of testing to be done, and indicates if a second JDSU test instrument is required at the remote location.
d Select the Next button (right green arrow).
5 The Local Settings page appears.
Do the following:
a Specify the IP Settings (Source IP, Gateway and Subnet Mask) for
Remote Connections (Channel to Far End). This is not applicable for
Loopback testing so there is nothing to define.
b Advanced users: Select the Advanced button to specify other settings
- Frame Type, MAC Address, ARP mode, and Source IP Type. This is
not applicable for Loopback testing so there is nothing to define.
c Select the Next button (right green arrow). For Loopback go to step 7
on page 303.
302
Ethernet, IP, TCP/UDP, Fibre Chan., VoIP, and Video Testing Manual
Chapter 12 Automated Testing
SAMComplete
6 The Connect to Remote page appears.
a Specify the type of tagging employed by selecting the radio button for
the desired type.
b Enter the IP address of the Destination device.
c On Layer 3 or Layer 4 applications, to verify that there is a device at the
address specified, select the Ping button. If there is a device, a green
check mark will appear beside the Remote IP address.
d To connect to the remote unit, press the Connect to Remote button.
When the Communications Channel display turns green, a valid
connection to the remote device has been made.
e Select the NEXT button (right green arrow). If Skip Connect, is
selected, the configuration will advance to the next step without making
the connection.
7 The first Network Settings page appears. Do the following:
a If a multistream application is being configured, select the number of
services to be configured.
b Select the Service Name for each of the services being configured.
This specifies which service you are configuring.
c Select configure Triple Play, if needed. The Triple Play properties
screen appears. You can specify the properties for Voice, Data, HDTV
and SDTV. Repeat for each of the services defined.
d Choose from the drop-down list, which encapsulation is desired None, VLAN, or Q-in-Q.
e Select the Frame type desired - DIX or 802.3.
f
Advanced users (if displayed): Select the Advanced button to specify
other settings - Packet Length, TTL and MAC DA.
g Select the right green arrow to proceed.
h Depending on the application selected, a number of other Network
Connection parameters will need to be defined on a number of additional pages. For more detail on these settings, see “Specifying
Ethernet frame settings” on page 45.
i
On the final Network Connection parameters page, select the Next
button (right green arrow) at bottom of screen.
8 The SLA Throughput page appears.
a Specify the SLA values. Each service will have its own values.
Depending upon the application selected, the SLA Threshold and
Throughput can be specified for both the Local and Remote unit.
– CIR – Committed Information Rate. The threshold used to indicate the
maximum sustained throughput guaranteed by the SLA. If the CIR is 0,
the CIR test is skipped.
– EIR – Excess Information Rate. The threshold used to indicate the
maximum sustained throughput allowed by the SLA by which a service
can exceed the CIR. The throughput between CIR and EIR is not guaranteed. If the EIR is 0, the EIR test is skipped.
– Policing – Selects that policing be applied to the test. All traffic greater
than CIR + EIR is removed by the policer.
Ethernet, IP, TCP/UDP, Fibre Chan., VoIP, and Video Testing Manual 303
Chapter 12 Automated Testing
SAMComplete
– Max Load Display - Calculated from the values of CIR and EIR and
changes based upon policing selection, it is the maximum rate of traffic
to be generated. (If policing is not selected, Max Load is CIR+EIR. If
policing is selected, Max Load is CIR + 1.25xEIR, or when EIR is less
than 20% of CIR, Max Load is 1.25xCIR + EIR).
– M – Tolerance, or delta, in traffic rate which is allowed to be received
above CIR+EIR before declaring a policing failure. For some applications, the desired M value is specified on the SLA Throughput page.
For Multistream or Truespeed applications, M will be entered on a
following page labeled “SLA Policing”.
Specify the desired value for M.
b Select the NEXT button (right green arrow).
9 The SLA Burst page appears.
Do the following:
a Specify whether burst testing will be performed by selecting the radio
button next to Yes or No.
b Enter the CBS (in kB) where kB = 1000 bytes.
c Select Send CBS Only if you would like the actual burst size to equal
the committed burst size. If unchecked, the burst will slightly exceed
the CBS (includes CIR token rate during the burst time).
If the CBS (kB) and Send CBS only fields are greyed out, verify your
CIR. It cannot be zero.
d Select whether to run the burst Policing test. This test generates traffic
burst lengths that exceed the user configured CBS value in order to
verify that the equipment policer is limiting bursts that exceed the CBS.
If this test is selected (indicated by a check mark), specify the Overload %.
If the policier is working correctly, the test results will indicate frame loss.
This indicates the policier is limiting bursts, causing frame loss.
If the Policing and Overload fields are not visible, verify your EIR. It must
be zero.
e Select the NEXT button (right green arrow).
10 The SLA Policing page appears.
a Specify the value for M.
b Select the NEXT button (right green arrow).
11 The SLA Performance page appears.
a Specify the desired Threshold values. Each service may have its own
values.
– Frame Delay – The maximum allowed average delay/latency for all
throughput values.
– Frame Loss Ratio– The maximum ratio allowed of frames lost to total
frames.
– Delay Variation – The maximum allowed frame delay variation for all
throughput values.
b Select the NEXT button (right green arrow).
304
Ethernet, IP, TCP/UDP, Fibre Chan., VoIP, and Video Testing Manual
Chapter 12 Automated Testing
SAMComplete
12 The Test Controls page appears.
a Specify the Service Configuration and Service Performance settings.
– Number of steps below CIR – The number of steps, in information
rate, needed to reach the CIR.
The corresponding number of Step Values % CIR appear. The default
values will be equal parts, based on the number of steps (for example,
if 3 steps are used, each will be 25%). The values can be changed, if
required.
– Step Duration – The duration, in seconds, that traffic is generated for
each step.
– Step Values % CIR (Advanced) – These will be automatically populated with the equal part values calculated from the Number of Steps
below CIR parameter but can be changed to any value between 0 and
100.
– Test Duration – The duration, in minutes, that traffic is generated
before the service performance test completes.
NOTE:
When running bidirectional tests, the service performance test duration
applies to each direction. So, if you run an upstream and downstream test
and the test duration is set to 3 minutes, the test will run for 6 minutes.
b Select the Next button (right green arrow).
13 The Save Profiles window appears.
Do one of the following:
a If no Profile is to be saved at his time, select the Skip Profiles arrow at
the bottom of the window. Go to step 14.
b If it is desired that the configuration be saved to memory (disk or USB),
specify the filename. To save somewhere other than the default location, press the Select button after the filename to define the directory
where it is to be stored.
c If it is desired that subsequent users be restricted from being able
modify this profile, check the box Save as read-only.
d To save the file to memory, select the Save Profiles button. Then
select the Next arrow.
14 The Run/Edit window appears.
Do one of the following:
– To return to the beginning and modify the current configuration, select
the Go arrow after “Change Configuration”. Go to step 2 of “To
configure test settings” on page 299.
– To load a previously saved set of configuration parameters, select the
Go arrow after “Load Configuration from a Profile”. Go to step 1 of “To
configure test settings” on page 299.
– To run the test, as configured, select the Go arrow after “Select and
Run Tests”. Go to “Choosing tests” on page 306
SAMComplete has been configured
Ethernet, IP, TCP/UDP, Fibre Chan., VoIP, and Video Testing Manual 305
Chapter 12 Automated Testing
SAMComplete
Choosing tests
After specifying test settings, you must choose whether to run one or both of
the tests: Service Configuration or Service Performance.
To choose the tests
1 On the Select Y.1564 Tests page, select Enable if you wish to run the
Service Configuration and/or Service Performance tests.
2 If you wish to include the optional throughput measurement in the test,
check the box to enable the test, and then specify the Max throughput
allowed.
3 Select the Next button (right green arrow).
The J-QuickCheck page appears. Go to “Running tests” on page 306.
Running tests
After choosing the tests, you are ready to run the test.
To run tests
1 From the J-QuickCheck page, do one of the following:
– Select the Start button.
The J-QuickCheck test, using the source and destination data entered,
verifies that the connections detailed in the test setup are functioning as
needed for the proper operation of the test. As J-QuickCheck is
completing its analysis of the circuit, graphics along the top of the page
provide a visual indication of the circuit structure and its suitability for the
selected test.
If a remote device is necessary, J-QuickCheck first checks to see if a
connection to the remote device has been established. If it has not, a
message is displayed indicating the connection must first be established.
For Loopback tests, J-QuickCheck tests the Local port for proper operation and then checks for loopback in a remote device. If no remote
active loop is detected, it then verifies whether a hard loop is in place.
After J-QuickCheck completes, select the Next button (right green
arrow). Go to step 2.
– To skip the J-QuickCheck test, select the Skip J-QuickCheck button at
the bottom of the window.
2 The Run Y.1564 Tests page appears.
There is a display bar for each service under Service Configuration and
also for each test verdict under Service Performance. These indicate the
status of each test to be run. Please refer to the Test Status Key at the
bottom of the page to interpret these display bars.
Do the following:
a If you would like the test to continue when a failure occurs, un-check
the Stop on failure box.
b Select the Start button.
The test begins.
As the tests are run, the status display bars will show the results of each
test. In each case, you may view detailed results of that test by selecting
the “magnifying glass” icon when it appears on the status bar.
306
Ethernet, IP, TCP/UDP, Fibre Chan., VoIP, and Video Testing Manual
Chapter 12 Automated Testing
SAMComplete
While the tests are running, the status panel near the top of the screen
displays a blue progress bar and indicates the estimated time remaining
to complete the testing.
After the test finishes, the pass/fail results appear (green check mark or
red X) on each of the tests. The status panel near the top of the screen
displays an overall OK (PASS) or FAIL result
c Once the testing is completed, select the Next button (right green
arrow).
3 The Test Complete page appears.
Figure 93 SAMComplete Post-test Window
Do one of the following:
– To create a report of the results of the test that just completed, select
the Go arrow on the “Create Report” line. Go to step 4.
– To repeat the test that just ran, select the Go arrow on the “Repeat
Test” line. Go back to “Choosing tests” on page 306.
– To reconfigure the test and then run it again, select the Go arrow on the
“Change Configuration and Rerun Test” line. Go to step 2 of “Configuring test settings” on page 299.
– To view detailed results of the performance achieved during the test,
select the Go arrow on the “View Detailed Results” line.
The detailed results are presented on a sequence of windows that vary
depending upon the steps in the test that were selected to be run.
On the last page of the results select the right-pointing green arrow. Go
to step 5.
Ethernet, IP, TCP/UDP, Fibre Chan., VoIP, and Video Testing Manual 307
Chapter 12 Automated Testing
SAMComplete
4 The Report window appears.
Figure 94 SAMComplete Report Window
Do the following:
a Select the items to be included in the report by putting a checkmark in
front of the item. Entire groups may be selected or individual items
within a group. To expand the group listing to see the individual items,
select the “+” in front of the group name.
b Select the format in which the report is to be saved by selecting the
radio button under Format.
c Specify the filename of the report.
d You may view the report before and/or after its creation by selecting the
View Report button and/or checking the “View report after creation”
checkbox. The report will automatically load into the appropriate reader
(if available) depending upon the format in which it has been saved.
e When ready to save the report, select the Create Report button. After
it has been saved (and viewed), select the right-pointing green arrow.
5 The post-report/results window appears.
All options available on this window are described in step 3 with the exception of the “Exit Y.1564 test”.
To exit the SAMComplete application, select the Go arrow after “Exit
Y.1564 test”.
308
Ethernet, IP, TCP/UDP, Fibre Chan., VoIP, and Video Testing Manual
Chapter 12 Automated Testing
Automated VLAN tests
6 The Exit window appears.
Figure 95 SAMComplete Exit page
Do one of the following:
– To start the SAMComplete (Y.1564) test from the beginning, select the
Start Over button. Go to “Configuring test settings” on page 299.
– To restore the configuration setups to their default values when leaving
the application, check the box Restore Setups on Exit. To completely
exit the SAMComplete application, select Exit.
– To return to the previous window, select Cancel.
The SAMComplete test has been run.
Automated VLAN tests
If your instrument is configured and optioned to do so, you can use it to run the
automated VLAN test. This test is used to test a range of VLANs by transmitting and looping back frames for each VLAN in the range for a user-specified
test period, and then comparing the number of frames transmitted to the
number received. If all transmitted frames are received within the test period,
the test is considered a success for the VLAN. If one or more frames are lost,
the test is considered a failure.
To test a range of VLANs
1 Establish a LAN connection to the network using one of the Ethernet test
interfaces on the Transport Module or MSAM. Do not use the RJ-45
connector provided on the base unit.
2 If you haven’t already done so, use the Test Menu to select the Layer 2,
Layer 3 or Layer 4 Traffic Terminate application for the circuit you are
testing (see “Launching a single automated test” on page 270), and
connect the instrument to the circuit. For details, refer to the Getting
Started Manual that shipped with your instrument or upgrade.
Ethernet, IP, TCP/UDP, Fibre Chan., VoIP, and Video Testing Manual 309
Chapter 12 Automated Testing
Automated FTP Throughput tests
3 Specify the settings required to initialize the link (see “Specifying interface
settings” on page 42), and to establish a connection to the network (see
“Layer 2 testing” on page 42 and “Layer 3 testing” on page 75).
4 Launch the VLAN test (see “TrueSAM” on page 264), and then wait for the
VLAN ID Ranges screen to appear. Depending on the number of
processes you have running, this may take several seconds.
5 Select the Add Range button at the bottom of the screen. The Specify a
Range of VLAN IDs screen appears.
6 In Beginning of range, enter the ID for the first VLAN in the range to be
tested.
7 In End of range, enter the ID for the last VLAN in the range to be tested,
and then select OK to return to the Range of VLAN IDs screen.
8 In Time per VLAN (s), enter the number of seconds to transmit, loopback,
and receive frames for each VLAN in the range. The test period can range
from 5 seconds to 604,800 seconds (1 full week).
9 To run the test, select Start.
10 The VLAN Test dialog box appears, providing the status for each test
(Success, or FAILED).
11 When the test is complete, a dialog box appears asking if you would like to
save a test report. For details, see “Saving automated test report data” on
page 328.
The VLAN test is complete. The report will provide the total number of VLANs
tested, the total number of successes, and the total number of failures. It can
also optionally include the test progress log that appeared as you were running
the test.
Automated FTP Throughput tests
If your instrument is configured and optioned to do so, you can use it to run the
FTP Throughput test. This test is used to transfer files of a known size using
FTP, and then measure the actual FTP throughput. When calculating the
throughput, the test considers key factors such as the link speed, frame size,
latency on the link (delay), and the TCP window size.
For details, contact Customer Care for a copy of the FTP Throughput Testing
white paper.
To run the FTP Throughput test
1 Establish a LAN connection to the network using one of the Ethernet test
interfaces on the Transport Module or MSAM. Do not use the RJ-45
connector provided on the base unit.
2 If you haven’t already done so, use the Test Menu to select the Layer 3 or
Layer 4 Traffic application for the circuit you are testing (see “TrueSAM” on
page 264).
3 Specify the settings required to initialize the link (see “Specifying interface
settings” on page 42), and to establish a connection to the network (see
“Layer 3 testing” on page 75).
310
Ethernet, IP, TCP/UDP, Fibre Chan., VoIP, and Video Testing Manual
Chapter 12 Automated Testing
Automated FTP Throughput tests
4 Launch the FTP Throughput test (see “TrueSAM” on page 264), and then
wait for the Current Script dialog box to appear. Depending on the number
of processes you have running, this may take several seconds.
5 Select or create a new configuration for your test. Refer to “Running the
RFC 2544 or Fibre Channel tests” for detailed instructions.
After you select an existing configuration or create a new one, the Configuration Summary dialog box appears listing the current settings for your
test.
6 To modify the settings, press Next.
The Destination Configuration dialog box appears. Specify the Server ID,
Login Name, and Password required to establish a connection for the file
transfer, and then press Next.
The File Configuration dialog box appears.
7 Select the sizes of the files that you want to transfer, and then specify
number of trials for the transfers. Press Next to proceed to the Theoretical
Calculation dialog box.
8 To estimate the throughput, you must specify a theoretical bandwidth
utilized by the link, delay, and if applicable, encapsulation for the simulated
traffic. Specify each of these values, and then press Next.
The Configuration Summary dialog box appears, listing the settings that
you specified.
9 Review the settings. If they reflect the scenario that you want to emulate,
press Start to run the script.
10 The FTP Throughput dialog box appears, providing the status of the
connection, each of the file transfers, and throughput measurements. See
Figure 96.
Figure 96 FTP Throughput dialog box
When the test is complete, a dialog box appears asking if you would like to
save a test report. For details, see “Saving automated test report data” on
page 328.
Ethernet, IP, TCP/UDP, Fibre Chan., VoIP, and Video Testing Manual 311
Chapter 12 Automated Testing
Automated HTTP Throughput tests
The FTP Throughput test is complete. The report will provide a summary of the
parameters that you specified when you configured the test, and then it will
provide a summary with the minimum and maximum time in Mbps that it took
to send and receive files for each size selected. A table listing theoretical and
measured values follows the summaries.
Automated HTTP Throughput tests
If your instrument is configured and optioned to do so, you can use it to run the
HTTP Throughput test. This test is used to determine the amount of time it
takes to open an HTTP connection, reach a specific web server, and then open
the web page.
To run the HTTP Throughput test
1 Establish a LAN connection to the network using one of the Ethernet test
interfaces on the Transport Module or MSAM. Do not use the RJ-45
connector provided on the base unit.
2 If you haven’t already done so, use the Test Menu to select the Layer 3 or
Layer 4 Traffic application for the circuit you are testing (see “Launching a
single automated test” on page 270).
3 Specify the settings required to initialize the link (see “Specifying interface
settings” on page 42), and to establish a connection to the network (see
“Layer 3 testing” on page 75).
4 Launch the HTTP Throughput test (see “Launching a single automated
test” on page 270), and then wait for the Select URL dialog box to appear.
Depending on the number of processes you have running, this may take
several seconds.
5 If the URL you want to connect to appears in the selection box, select it,
otherwise, type the URL into the field provided.
6 Press Start.
312
Ethernet, IP, TCP/UDP, Fibre Chan., VoIP, and Video Testing Manual
Chapter 12 Automated Testing
Automated TCP Throughput tests
The HTTP Throughput Test dialog box appears, providing the status of the
connection, a list of the files downloaded to build the web page (such as
the style sheet and graphics, and the number of bytes retrieved from the
site. The average retrieval rate for the site is also listed (see Figure 97).
Figure 97 HTTP Throughput Test dialog box
You can select Refresh to issue a new request for the same web site, or
you can select New URL to connect to a different site.
When you are done testing, select Close. A dialog box appears asking if
you would like to save a test report. For details, see “Saving automated
test report data” on page 328.
The HTTP Throughput test is complete. The report will list each URL, the
number of times you visited it during the test, the size of the site in bytes, and
the minimum, maximum, and average rate in Mbps that it took to connect to
the site.
Automated TCP Throughput tests
If your instrument is configured and optioned to do so, you can use it to run the
TCP Throughput test. This test is used to establish a TCP connection to a peer,
and then estimate the maximum TCP throughput on a link for a variety of
window sizes (ranging from 8 Kbps to 64 Kbps), when running up to 10000
parallel sessions and factoring in the average delay. The window size represents the maximum number of bytes that can be transmitted before waiting to
receive an acknowledgement that the receiving port is receiving frames/
packets.
For example, the test may show that, with a current average delay of 10.25 ms,
the maximum possible throughput for one TCP session with a window size of
8 Kbps would be 0.098 Mbps.
The average delay value is obtained from the measurement provided in the
L2 Link Stats result category.
Ethernet, IP, TCP/UDP, Fibre Chan., VoIP, and Video Testing Manual 313
Chapter 12 Automated Testing
TrueSpeed Test
To run the TCP Throughput test
1 If you haven’t already done so, use the Test Menu to select the Layer 3 or
Layer 4 Traffic application for the circuit you are testing (see “Launching a
single automated test” on page 270), and connect the instrument to the
circuit. For details, refer to the Getting Started Manual that shipped with
your instrument or upgrade.
2 Specify the settings required to initialize the link (see “Specifying interface
settings” on page 42).
3 Press Setup, and then do the following to configure your test:
a Specify the layer 2 Ethernet settings (see “Layer 2 testing” on
page 42).
b Specify the layer 3 IP settings (see “Layer 3 testing” on page 75).
c If you are running a Layer 4 Traffic application, specify the layer 4 TCP
settings (see “Specifying layer 4 settings” on page 150).
4 Launch the TCP Throughput test (see “Launching a single automated test”
on page 270), and then wait for the Estimated TCP Throughput dialog box
to appear. Depending on the number of processes you have running, this
may take several seconds.
5 Estimated throughput for each of the window sizes appear in a tabular
format. The number of parallel sessions needed to obtain maximum
throughput for each window size is provided at the bottom of the dialog
box.
The TCP Throughput test is complete.
TrueSpeed Test
If your instrument is configured and optioned to do so, you can use it to run the
TrueSpeed Test. This test uses the Wirespeed application to test the upstream
and downstream links for transmission parameters.
There are two distinct functions for which the TrueSpeed test may be used circuit troubleshooting and circuit turnup. Distinctly different configuration
paths are provided for these options. The following topics are discussed in this
section:
– “TrueSpeed test steps” on page 314
– “Configuring the TrueSpeed test” on page 316
– “Running the TrueSpeed test” on page 322
TrueSpeed test steps
314
If your instrument is configured and optioned to do so, you can use it to run the
TrueSpeed Test for the purpose of troubleshooting a circuit experiencing
reduced performance or when turning-up a new circuit. This test uses the Wirespeed application and automates TCP throughput testing per the IETF draft
standard “ippm-tcp-throughput-framework” and to allow TCP throughput
testing for up to 64 connections. Unlike the RFC 2544 test which uses layer 2/
3, this test uses layer 4. The troubleshooting option validates that the network
is tuned as expected, verifies prioritization of services, and can eliminate
finger-pointing between the end user and the network provider.
Ethernet, IP, TCP/UDP, Fibre Chan., VoIP, and Video Testing Manual
Chapter 12 Automated Testing
TrueSpeed Test
In addition, the more basic turn-up testing, is a mostly automated test that
provides push-button pass/fail testing of a newly installed circuit. The upload
and download CIR’s need to be added to the configuration before it is run.
These parameters can be obtained from the RFC 2544 test that is often run
immediately prior to a TrueSpeed Test.
About the test steps
Per the IETF draft standard, this test includes five steps, described in the
following section.
In the turnup option, the test is configured to run the Path MTU (if userselected), RTT, Walk the Window and TCP throughput steps (Steps 1, 2, 3 and
4). Bidirectional tests can only be run in this mode.
When troubleshooting an existing circuit, it is recommended that the user run
all five steps for the first test and then run specific tests to further diagnose
issues. This is because the automated test uses results from prior steps (i.e.
RTT) as input for subsequent steps and eliminates much of the manual configuration.
IMPORTANT NOTE:
In troubleshooting mode, a 6000 Server or Iperf server must be active and
the 6000 Client (the 6000 running the automated test), must be configured to
communicate with the IP of the Server. This is specified in the Connect
configuration tab (step 2 of “TrueSpeed Circuit Turnup Option” on page 317
and step 1 of “TrueSpeed Circuit Troubleshooting Option” on page 320).
Step 1: Determine the path MTU
Packetization Layer Path MTU Discovery (PLPMTUD) is a method for TCP to
dynamically discover the MTU of a path by probing with progressively larger
packets. It resolves many of the robustness problems of the classical techniques (PMTUD) since it does not depend on the delivery of ICMP messages.
The general strategy is for the Packetization Layer to find an appropriate Path
MTU by probing the path with progressively larger packets. If a probe packet
is successfully delivered, then the effective Path MTU is raised to the probe
size. The packet probe size is raised until the packets fail to be delivered; this
implies that the IP “Do Not Frag” (DF) bit is set on all packets.
Step 2: Determine the baseline RTT
Before stateful TCP testing can begin, it is important to baseline the round trip
delay and bandwidth of the network to be tested.
These measurements provide estimates of the ideal TCP window size, which
will be used in subsequent test steps.
This test is equivalent to a “TCP Ping” and transfers a light load TCP traffic
stream from the client to the server and provides RTT values.
Step 3: Run an enhanced walk the windows scan
This step runs the traditional Walk the Window test with four different window
sizes, but the Results screens are enhanced to show measured versus
expected throughput results in troubleshooting mode if the RTT test was also
selected.
Ethernet, IP, TCP/UDP, Fibre Chan., VoIP, and Video Testing Manual 315
Chapter 12 Automated Testing
TrueSpeed Test
Step 4: Measure TCP throughput
This step estimates and measures the maximum TCP throughput on a link for
a specific window size and allows the user to specify a file size to transfer
between the client and the server.
This test produces a throughput dashboard result screen which clearly shows
the expected versus measured TCP throughput along with key loss and delay
related metrics. For the more advanced user, throughput versus loss and delay
graphs are also available.
Step 5: Evaluate traffic shaping
In most cases, the network connection between two geographic locations
(such as branch offices) is lower than the network connection of the host
computers. An example would be LAN connectivity of GigE and WAN connectivity of 100 Mbps. The WAN connectivity may be physically 100 Mbps or logically 100 Mbps (over a GigE WAN connection). In the later case, rate limiting
is used to provide the WAN bandwidth per the SLA.
This step evaluates traffic shaping. Simply stated, traffic policing marks and/or
drops packets which exceed the SLA bandwidth (in most cases, excess traffic
is dropped). Traffic shaping employs the use of queues to smooth the bursty
traffic and then send out within the SLA bandwidth limit (without dropping
packets unless the traffic shaping queue is exceeded).
Traffic shaping can provide improved TCP performance since the retransmissions are reduced, which in turn optimizes TCP throughput for the given available bandwidth.
The ability to detect proper traffic shaping is more easily diagnosed when
conducting a multiple TCP connection test. Proper shaping will provide a fair
distribution of the available bottleneck bandwidth, while traffic policing will not.
The traffic shaping evaluation builds upon the concepts of testing multiple
connections.
This test provides graphical test results which visually indicate whether the
bottleneck link is traffic shaped or policed.
Configuring the TrueSpeed
test
Configuration of the TrueSpeed test can be broken into two segments. The first
segment is common to all configurations and the second is specific for the
turnup option or the troubleshooting option.
Configuring the TrueSpeed test
1 Verify that the local and remote instrument are using the same firmware
rev. The test may not provide the expected result if the versions are
different.
2 If not already selected, use the Test Menu to select the L4 TCP Wirespeed
application for the interface you are testing. Refer to Table 31 on page 270
for a list of applications.
3 If troubleshooting a circuit, verify that a TCP Server (such as another
6000A running TCP Wirespeed) is activated or an Iperf server is available,
and that the IP address is specified. This will be automatically confirmed in
turnup mode.
4 On the right side of the main screen, select TrueSpeed Test soft button.
316
Ethernet, IP, TCP/UDP, Fibre Chan., VoIP, and Video Testing Manual
Chapter 12 Automated Testing
TrueSpeed Test
5 The Test Configuration options screen appears.
To configure all options yourself, select the green arrow to the right of
Configure Test Settings Manually. Go to step 7.
To load configuration settings set from a previously saved file select the
green arrow to the right of Load Configuration from a Profile.
6 The Profile selection window appears.
The filenames of the saved profiles will be listed on the left side of the
screen and all sections of the currently loaded profile will be listed on the
right side of the screen.
Do the following:
a Select a profile from the list whose configuration is to be loaded.
b Check those sections, on the right side of the screen, that are to be
loaded into the test. If no profile has yet been selected, the currently
configured profile sections will be checked.
Any section not selected will not be configured into the test. Any parameter of the test (checked or not checked) may be reconfigured at a later
point in the configuration process.
c Select the Load Profiles button to load all checked sections into the
test. After profile has successfully loaded select, OK and then select
the Next arrow. Go to “Running the configured TrueSpeed test” on
page 322.
7 The Mode Selection screen appears.
Do one of the following:
– To continue with troubleshooting, select the radio button for troubleshooting. Go to “TrueSpeed test steps” on page 314.
– To proceed with a circuit turnup, select the radio button for installing or
turning-up. Continue to “TrueSpeed Circuit Turnup Option”.
TrueSpeed Circuit Turnup Option
1 The Symmetry selection screen appears. Select the radio button for a
Symmetrical circuit (My downstream and upstream throughputs are the
same) or Asymmetrical (My downstream and upstream throughputs are
different). Then select the Next arrow.
Ethernet, IP, TCP/UDP, Fibre Chan., VoIP, and Video Testing Manual 317
Chapter 12 Automated Testing
TrueSpeed Test
2 The Connection Settings screen appears (see Figure 98).
Figure 98 TrueSpeed Turnup Connection Settings
Do the following:
a In the Local Settings portion of the window, define the parameters of
the local connection including MAC, IP addresses and encapsulation, if
any.
b In the Remote portion of the window, define the IP address of the
remote connection. To verify that there is a device at the address specified, select the Ping button. If there is a device, a green check mark
will appear beside the Remote IP address.
c To establish a valid connection for running the test, select the Connect
to Remote button. When the connection is determined to be valid, the
button will turn yellow. If the connection is invalid, a message window
will appear providing some information as to why the connection is
invalid. This connection issue must be resolved before the test can be
run, although configuration may continue.
To continue with the configuration, select the green arrow on the right at
the bottom of the screen (legend text will vary whether the connection
has been made or is to be skipped).
3 The TrueSpeed Controls window will appear (see Figure 99 and
Figure 100).
318
Ethernet, IP, TCP/UDP, Fibre Chan., VoIP, and Video Testing Manual
Chapter 12 Automated Testing
TrueSpeed Test
This window provides for the configuration of the parameters pertaining to
the Committed Information Rate (CIR) and TCP Threshold, among others,
which will be used on all subsequent TrueSpeed tests.
Figure 99 TrueSpeed Symmetrical Turnup Configuration
Figure 100TrueSpeed Asymmetrical Turnup Configuration
After all parameters have been specified, select the Next (right green)
arrow.
4 The Save Profiles window appears.
If no Profile is to be saved at his time, select the Skip Profiles arrow at the
bottom of the window. Go to “Running the TrueSpeed test” on page 322
Ethernet, IP, TCP/UDP, Fibre Chan., VoIP, and Video Testing Manual 319
Chapter 12 Automated Testing
TrueSpeed Test
If it is desired that the configuration be saved to memory (disk or USB),
specify the filename and the location where it is to be stored. If it is desired
that subsequent users be restricted from being able modify this profile,
check the box Save as read-only.
To save the file to memory, select the Save Profiles button. Then select
the Next button. The test will begin. Go to step 3 on page 323.
TrueSpeed Circuit Troubleshooting Option
1 The Connection Settings screen appears.
Figure 101TrueSpeed Troubleshooting Connection Settings
Do the following:
a In the Local Settings portion of the window, define the parameters of
the local connection including MAC, IP addresses and encapsulation, if
any.
b In the Remote portion of the window, define the IP address of the
remote connection. To verify that there is a device at the address specified, select the Ping button. If there is a device, a green check mark
will appear beside the Remote IP address.
c To continue with the configuration, select the right -pointing green
arrow on the right at the bottom of the screen.
320
Ethernet, IP, TCP/UDP, Fibre Chan., VoIP, and Video Testing Manual
Chapter 12 Automated Testing
TrueSpeed Test
2 The TrueSpeed Controls window will appear (see Figure 102).
Figure 102TrueSpeed Troubleshooting Controls Configuration
This window provides for the configuration of the parameters pertaining to
the Committed Information Rate (CIR) and TCP Threshold, among others,
which will be used on all subsequent TrueSpeed tests.
After all parameters have been specified, select the Next arrow.
3 The Step Configuration window appears (see Figure 103).
Figure 103TrueSpeed Step Configuration
Ethernet, IP, TCP/UDP, Fibre Chan., VoIP, and Video Testing Manual 321
Chapter 12 Automated Testing
TrueSpeed Test
Select the steps that are to be included in the TrueSpeed test. To learn
more about each step, see “About the test steps” on page 315. When all
desired steps are chosen, select the Next arrow.
4 The Path MTU window appears.
Specify the MTU Upper Limit (this value represents the starting point - the
upper value - with which the test set will begin the Path MTU search).
Then select the Next arrow.
5 The RTT window appears.
Enter the Duration of the Round Trip Delay test (this test will calculate the
inherent latency of the network) in seconds. Then select the Next arrow.
6 The Walk the Window window appears.
Specify the test window sizes and test duration (and Max Segment Size in
bytes if Path MTU is not selected).Then select the Next arrow.
7 The TCP Throughput window appears.
Specify the window size, file size per connection, and number of connections (and the RTT (in ms) and Max Segment Size (in bytes) if RTT and
Path MTU are not selected).Then select the Next arrow.
8 The Traffic Shaping window appears.
Specify the test duration (and window size and number of connections if
the RTT step is not selected). Then select the Next arrow.
9 The Save Profiles window appears.
Do one of the following:
a If no Profile is to be saved at his time, select the Skip Profiles arrow at
the bottom of the window. Go to “Running the TrueSpeed test” on
page 322.
b If it is desired that the configuration be saved to memory (disk or USB),
specify the filename and the location where it is to be stored. If it is
desired that subsequent users be restricted from being able modify this
profile, check the box Save as read-only.
To save the file to memory, select the Save Profiles button. Then select
the Next arrow. Go to “Running the TrueSpeed test” on page 322.
Running the TrueSpeed test
When the TrueSpeed test has been completely configured three options are
available - run the test as configured, reconfigure the test (possibly to save as
a different profile) or load a saved profile (except when profile has just been
loaded).
Running the configured TrueSpeed test
1 The Run/Edit window appears.
To return to the beginning and modify existing configuration, select the Go
arrow after “Change Configuration”. Go to step 7 of “Configuring the
TrueSpeed test” on page 316.
To load a previously saved set of configuration parameters, select the Go
arrow after “Load Configuration from a Profile” (or left green arrow at the
bottom of the window if coming from Profile Selection). Go to step 6 in
“Configuring the TrueSpeed test” on page 316.
To run the test, as configured, select the Go arrow after “Select and Run
Tests”.
322
Ethernet, IP, TCP/UDP, Fibre Chan., VoIP, and Video Testing Manual
Chapter 12 Automated Testing
TrueSpeed Test
2 The Run TrueSpeed Tests window appears.
The blinking button labeled Run Test indicates that the test is not yet
running. To start the test, press the Run Test button. The button will
change to a yellow background and the legend will change to Stop Test.
To abort the test, press the Stop Test button.
When the test has completed, if the turnup option had been selected, the
screen will show a pass/fail indication. For troubleshooting option, it will
not. To continue after the test has been stopped or it has finished, select
the Next arrow.
3 The post-test window appears.
Figure 104TrueSpeed Post-test Window
Do one of the following:
– To create a report of the results of the test that just completed, select
the Go arrow on the “Create Report” line. Go to step 4.
– To repeat the test that just ran, select the Go arrow on the “Repeat
Test” line. Go back to step 2.
– To reconfigure the test and then run it again, select the Go arrow on the
“Change Configuration and Rerun Test” line. Go to step 7 of “Configuring the TrueSpeed test” on page 316.
– To view detailed results of the performance achieved during the test,
select the Go arrow on the “View Detailed Results” line.
The detailed results are presented on a sequence of windows that vary
depending upon the steps in the test that were selected to be run.
On the last page of the results select the right-pointing green arrow. Go
to step 6.
4 The Report Info window appears.
Enter the desired information into the fields and identify the location of a
logo that should be added to the report. When all desired information has
been defined, select the Next arrow.
5 The Report window appears.
Identify the location where the report is to be saved, the format of the
report and the filename in which to save it.
You may view the report before and/or after its creation by selecting the
View Report button and/or checking the “View report after creation”
checkbox. The report will automatically load into the appropriate reader (if
available) depending upon the format in which it has been saved.
Ethernet, IP, TCP/UDP, Fibre Chan., VoIP, and Video Testing Manual 323
Chapter 12 Automated Testing
Testing using TAM automation
When ready to save the report, select the Create Report button. After it
has been saved (and viewed), select the right-pointing green arrow.
6 The post-report/results window appears.
All options available on this window are described in step 3 with the exception of the “Exit TrueSpeed test”.
To exit the TrueSpeed application, select the Go arrow after “Exit
TrueSpeed test”.
7 The Exit window appears.
Do one of the following:
– To start the TrueSpeed test from the beginning, select the Start Over
button. Go to step 5 in “Configuring the TrueSpeed test” on page 316.
– To restore the configuration setups to their default values when leaving
the application, check the box Restore Setups on Exit. To completely
exit the TrueSpeed application, select Exit.
– To return to the previous window, select Cancel.
The TrueSpeed test has been run.
Testing using TAM automation
If your instrument is configured and optioned to do so, you can use it to
remotely log into and provision network elements (for example, switches and
routers) from a Mobility Switching Center (MSC) by issuing TL1 commands
(See Figure 105).
Figure 105Provisioning NE using TAM
You can also use it to emulate a router on the network end of the Ethernet
Transport Service (ETS), then run an RFC 2554 script (see “Automated RFC
2544 and Fibre Channel tests” on page 272). The script puts a Network Inter-
324
Ethernet, IP, TCP/UDP, Fibre Chan., VoIP, and Video Testing Manual
Chapter 12 Automated Testing
Testing using TAM automation
face Device (NID) in loopback mode, then transmits traffic from the instrument.
The NID loops the traffic back to the instrument, where you can analyze results
for the traffic to determine link characteristics such as throughput and latency.
Figure 106Router emulation configuration
Before testing
Before connecting to an NE using the TAM tool, establish a Username and
Password for the test instrument. Be certain to grant privileges that allow the
instrument to:
– View the NE’s cross-connect definitions.
– Delete cross-connect definitions.
– Activate specific ingress and egress flows in the command line interfaces
(CLIs) for the switch ports.
Connecting to the
management network
Before running a TAM test, you must connect the instrument to the management network that the NE resides on using the Ethernet management port on
your instrument and a straight through Ethernet cable.
Ethernet, IP, TCP/UDP, Fibre Chan., VoIP, and Video Testing Manual 325
Chapter 12 Automated Testing
Testing using TAM automation
To connect the instrument to the network
1 Insert one end of a straight through Ethernet cable into the Ethernet
management port on your instrument.
– On the MTS/T-BERD 6000A base unit, the port is located on the top
panel of the base unit, in the left corner, adjacent to the two USB ports
(see Figure 107).
RJ 45 Ethernet
Management Port
Figure 107MTS/T-BERD 6000A Ethernet Management Port
– On the MTS/T-BERD 8000, the port is located on the top panel of the
base unit, in the middle, adjacent to the DB-9 serial port (see
Figure 108).
RJ 45 Ethernet Management Port
Figure 108MTS/T-BERD 8000 Ethernet Management Port
2 Connect the other end of the cable to the access port on the management
network that the NE resides on.
The instrument is physically connected to the network. To establish a complete
connection proceed to “Setting up a TAM test” on page 327.
Connecting to the test
network
In addition to the management connection, you must establish a connection for
the traffic transmitted by the instrument and received from the network
element.
The ports and cables used to connect the instrument to the circuit for testing
vary depending on the line rate of the test interface. For details on connecting
the instrument to the circuit for testing, refer to the Getting Started manual that
shipped with your instrument or upgrade.
326
Ethernet, IP, TCP/UDP, Fibre Chan., VoIP, and Video Testing Manual
Chapter 12 Automated Testing
Testing using TAM automation
Setting up a TAM test
Before monitoring or configuring a network element using the Test Access
Management tool, (TAM), you must specify the settings required to establish a
connection to the NE, indicate the test mode (Monitor or Emulate), and provide
the ingress and egress flow.
To specify the TAM settings
1 If you haven’t already done so, use the Test Menu to select the Layer 2 or
Layer 3 Traffic application for the circuit you are testing (see “Launching a
single automated test” on page 270), and connect the instrument to the
circuit. For details, refer to the Getting Started Manual that shipped with
your instrument or upgrade.
2 On the Main screen, select the Toolkit softkey, then select TAM Setup.
The TAM Setup screen appears, with tabs that allow you to specify
connection settings and test port settings. Tabs are also provided that
allow you to observe the status of the connection, and the version of the
TAM application currently running on your instrument.
3 On the Connection tab, specify the following settings:
Setting
Value
Network Element
Type
Select the type of NE that you are monitoring or configuring.
Network Element IP
Address
Enter the IP address for the NE.
Network Element IP
Port
Enter the port identifier for the NE’s management
port.
Username
Enter the username you created for the test instrument. This name is used to log on to the NE and to
ensure that the instrument is authenticated for TAM
testing.
Password
Enter the password required to log on to the NE.
Enable Password
Enter the password required to access privileged
functions after logging on to the NE.
4 Select the Test Port tab, then specify the following settings:
Setting
NE Type
Value
Method
Any
Indicate whether you intend to monitor the
NE, or emulate a router on the network end
of an ETS.
Test Port
Any
Enter the port identifier for the port that
your instrument is connected to for testing
(this is not the same port specified as the
NE’s management port).
– If the NE Type is 167x, the port ID must
be in a #/p#/p# format, where the last /
p# is optional.
– If the NE Type is 7x50, the port ID must
be in a #/#/# format.
Test VLAN
Any
Enter the VLAN ID carried in the traffic
transmitted or monitored on the instrument’s test port when the instrument is
emulating a router.
Ethernet, IP, TCP/UDP, Fibre Chan., VoIP, and Video Testing Manual 327
Chapter 12 Automated Testing
Saving automated test report data
Setting
NE Type
Value
Ingress Flow
Alcatel 1675
Alcatel 1678
Enter the name of the inbound flow.
Egress Flow
Alcatel 1675
Alcatel 1678
Enter the name of the outbound flow.
Service ID
Alcatel 7750
Alcatel 7450
Enter the ID for the epipe.
Customer
Port
Alcatel 7750
Alcatel 7450
Enter the port identifier for the customer
port.
Customer
VLAN
Alcatel 7750
Alcatel 7450
Enter the VLAN ID for the customer port.
5 Use the buttons at the bottom of the screen to do the following:
Button
Appears ...
Used to ...
Configure
At all times
Configure the NE port with the
values you specified, and take
you to the Status tab. The NE
IP address must be specified
before the port can be configured.
Restore
At all times
Restore the NE’s original configuration values and takes you
to the Status tab.
Exit
At all times
Exit the TAM script.
Upgrade
If the TAM script is
launched and the instrument detects an
upgrade on an attached
USB key.
Install a detected upgrade from
a USB key and take you to the
Status tab.
The TAM settings are specified. After a connection is established, you can use
the TAM script to configure and monitor the network element. You can observe
the status of each command executed on the Status tab. The current version
of the TAM server software appears on the Version tab.
For details on using TAM automation, refer to the QT-600 Ethernet and TriplePlay Probe User Interface Guide.
Saving automated test report data
When each automated test is complete, a dialog box appears asking if you
would like to save a test report. You can optionally append the progress log
(the text that appeared while you were running the test) to the end of the report.
328
Ethernet, IP, TCP/UDP, Fibre Chan., VoIP, and Video Testing Manual
Chapter 12 Automated Testing
Saving automated test report data
To save automated test report data
1 When the report dialog box appears, if you would like to append a progress log to the end of the report, select the option on the dialog box, then
reply with Yes or No. If you select Yes, specify the following:
– The customer’s name.
– Your name.
– The test location.
– Any additional comments you might have concerning the test.
A message appears asking you to wait as a PDF of the report is generated. After the report is complete, the path and file name of the PDF
appear, with a message instructing you to press Close to return to the
Main screen.
2 Select Close to close the dialog box and return to the Main screen.
The report is saved.
NOTE:
You can not view Chinese or Japanese PDFs on your test instrument. if you
save the report in a PDF format, you must export the PDF, then load it onto
a PC or workstation with a PDF Viewer.
If you need to view Chinese or Japanese reports on the test instrument,
save the report data as an HTML file.
Ethernet, IP, TCP/UDP, Fibre Chan., VoIP, and Video Testing Manual 329
Chapter 12 Automated Testing
Saving automated test report data
330
Ethernet, IP, TCP/UDP, Fibre Chan., VoIP, and Video Testing Manual
Chapter 13
Test Results
13
This chapter describes the categories and test results that are available when
performing Ethernet, Fibre Channel, TCP/UDP, and IP Video tests. Topics
discussed in this chapter include the following:
– “About test results” on page 332
– “Summary Status results” on page 332
– “CPRI/OBSAI test results” on page 333
– “Ethernet, IP, TCP/UDP, and Fibre Channel results” on page 336
– “Wander results” on page 385
– “IP Video results” on page 386
– “VoIP results” on page 397
– “Graphical results” on page 402
– “Histogram results” on page 403
– “Event Log results” on page 403
– “Time test results” on page 404
Ethernet, IP, TCP/UDP, Fibre Chan., VoIP, and Video Testing Manual 331
Chapter 13 Test Results
About test results
About test results
After you connect the instrument to the circuit and press the START/STOP
button, results for the configured test accumulate and appear in the Result
Windows in the center of the screen. The result groups and categories available depend on their applicability to the test you configured. For example, if
you select, configure, and start a SONET test application,
10 Gigabit Ethernet LAN categories are not available because they are not
applicable when running a SONET application.
A number of enhancements have been made to the test result layout; for
details, see “Step 5: Viewing test results” on page 4.
The following sections describe the test results for each of the categories.
Summary Status results
When running most applications, the Summary Status category displays a
large “ALL SUMMARY RESULTS OK” message on a green background if no
errors, anomalies, alarms, or defects have been detected (see Figure 109).
Figure 109ALL SUMMARY RESULTS OK message
If errors, anomalies, alarms, or defects have been detected, the background is
red, and the errored results are displayed (see Figure 110).
Figure 110Errored Summary Status results (NextGen application)
332
Ethernet, IP, TCP/UDP, Fibre Chan., VoIP, and Video Testing Manual
Chapter 13 Test Results
CPRI/OBSAI test results
This allows you to immediately view errored results without searching through
each category. The errored results are listed by group and category. To see all
results for the group/category, select the arrow key to the right of the group/
category name. You can also collapse or expand the results by selecting the
box to the left of the name.
If OoS (out of sequence) Layer 3 Packets, B8ZS Detect, Path Pointer Adjustment, or correctable FEC conditions occur, and no other errors occurred, the
background is yellow, indicating you should research each condition displayed.
In some instances, the conditions constitute errors; in other instances, the
conditions are expected and should not be interpreted as errors.
IP VIDEO RESULTS:
When running IP Video applications, the Summary Status results provide a
layered view of the state of the physical/link, transport stream, and video
stream quality layers. For details, see “IP Video results” on page 386.
CPRI/OBSAI test results
BERT results pertaining to frequency characteristcs, code violations and sync
and pattern errors are reported in the results pane on the UI when using Layer 1
applications.
Layer 2 applications additionally report on framing errors and other CPRI
specific data.
Categories discussed in this section include the following:
– “CPRI and OBSAI LEDs” on page 333
– “Interface/Signal results” on page 334
– “CPRI/OBSAI Error Stats” on page 335
– “CPRI/OBSAI Counts results” on page 335
– “CPRI L1 Inband Protocol results” on page 335
– “CPRI/OBSAI Payload BERT results” on page 336
CPRI and OBSAI LEDs
If the instrument loses any of the LED events, the green Status LED extinguishes, and the red Alarm LED in the history column illuminates indicating an
error condition has occurred.
Table 35 describes the LEDs, and indicates whether each LED is applicable
when testing a CPRI or OBSAI circuit.
Table 35 CPRI/OBSAI LEDs
LED
Indicates
SIgnal Present
Green
– A signal is present.
Red
– Received signal has been lost
since the last test start or
restart.
CPRI
OBSAI
√
√
Ethernet, IP, TCP/UDP, Fibre Chan., VoIP, and Video Testing Manual 333
Chapter 13 Test Results
CPRI/OBSAI test results
Table 35 CPRI/OBSAI LEDs
Interface/Signal results
LED
Indicates
Sync Acquired
Green
– Synchronization is established.
Red
– Synchronization has been lost
since the last test restart.
Frame Sync
Green
– Frame alignment has been
achieved.
Red
– Frame alignment has been
lost.
Pattern Sync
Green
– Synchronization with the
received test patterns has
been achieved.
Red
– Synchronization has been lost
since the last test restart.
CPRI
OBSAI
√
√
√
√
√
√
Table 36 describes the CPRI and OBSAI Interface/Signal results.
Table 36 CPRI/OBSAI Interface/Signal Results
334
Test Result
Description
Optical Rx Level (dBm)
Displays the receive level in dBm when testing optical
interfaces using average power consumption.
Optical Rx Overload
Displays current status of Optical Rx Overload condition (On/Off)
Rx Frequency (Hz)
Frequency of the clock recovered from the received
signal, expressed in Hz.
Rx Freq Deviation (ppm)
Current received frequency deviation. Displayed in
PPM.
Rx Freq Max Deviation
(ppm)
Maximum received frequency deviation.
Signal Losses
Number of times signal was lost during current test.
Signal Loss Seconds
Number of seconds during which a signal was not
present.
Sync Loss Seconds
Number of seconds during which a synchronization
was not present.
Tx Clock Source
Shows the source of the transmit timing standard
Tx Frequency (Hz)
Current transmitter clock frequency, expressed in Hz.
Tx Freq Deviation (ppm)
Current transmitted frequency deviation. Displayed in
PPM.
Tx Max Freq Deviation
(ppm)
Maximum transmitted frequency deviation.
Ethernet, IP, TCP/UDP, Fibre Chan., VoIP, and Video Testing Manual
Chapter 13 Test Results
CPRI/OBSAI test results
CPRI/OBSAI Error Stats
Table 38 shows the CPRI/OBSAI Error Stats test results.
Table 37 CPRI/OBSAI Error Stats results
CPRI/OBSAI Counts results
Code Violations
The number of code violations that have been received
since the last test restart.
Code Violations
Rate
The ratio of code violations to bits received since the last
test restart.
Code Violations
Seconds
The number of seconds in which code violations have
been received since the last test restart.
Rx K30.7 Words
The number of K30.7 words received since the last test
restart.
Frame Sync Losses
The number of frame sync losses that have been
received since the last test restart.
Frame Sync Loss
Seconds
The number of seconds in which frame sync losses have
been received since the last test restart.
Table 38 shows the CPRI/OBSAI Counts results.
Table 38 CPRI/OBSAI Counts results
CPRI L1 Inband Protocol
results
Rx Code Words
The total number of 10b code words received since last
test restart.
Tx Code Words
The total number of 10b code words transmitted since
last test restart.
Rx Frames
The total number of hyperframes (CPRI) or master
frames (OBSAI) received since last test restart.
Tx Frames
The total number of hyperframes (CPRI) or master
frames (OBSAI) transmitted since last test restart.
Table 39 shows the CPRI-specific L1 Inband Protocol results.
Table 39 CPRI Counts results
Rx Protocol Version
Received CPRI protocol version.
Rx C&M HDLC Rate
Received HDLC bit rate for the slow C&M channel.
Rx C&M Ethernet
Subchannel Number
Received subchannel number at which the control words
for the Ethernet channel starts within a hyperframe.
Start-up State
Current state of start-up sequence
Tx Protocol Version
Transmitted CPRI protocol version.
Tx C&M HDLC Rate
Transmitted HDLC bit rate for the slow C&M channel.
Tx C&M Ethernet
Subchannel Number
Transmitted subchannel number at which the control
words for the Ethernet channel starts within a hyperframe.
Port Type
Current status of port type selection (Master/Slave).
Ethernet, IP, TCP/UDP, Fibre Chan., VoIP, and Video Testing Manual 335
Chapter 13 Test Results
Ethernet, IP, TCP/UDP, and Fibre Channel results
CPRI/OBSAI Payload BERT
results
Table 40 shows the CPRI/OBSAI payload BERT results.
Table 40 CPRI/OBSAI Payload BERT results
Pattern Sync Losses
Count of the number of times pattern sync was lost
since initially acquiring pattern synchronization.
Pattern Sync Loss
Seconds
The number of seconds in which pattern sync was lost
since initially acquiring pattern synchronization.
Bit Error Rate
The ratio of pattern bit errors to received pattern bits
since initially acquiring pattern synchronization.
Bit Errors
Count of the number of bit errors received since initially
acquiring pattern synchronization.
(Bit) Errored Seconds
Count of the number of seconds containing bit errors
since initially acquiring pattern synchronization.
Error-Free Seconds
Count of the number of seconds containing no bit errors
since initially acquiring pattern synchronization.
Error-Free Seconds %
The ratio of Errored Seconds to Error-Free Seconds
since initially acquiring pattern synchronization.
Total Bits Received
The total number of bits received since initially acquiring
pattern synchronization.
Round Trip Delay Current (μs)
The currently calculated round trip delay, expressed in
microseconds.
Round Trip Delay Average (μs)
The average round trip delay over the last second,
expressed in microseconds.
Round Trip Delay Minimum (μs)
The minimum round trip delay since the last restart of
the test, expressed in microseconds.
Round Trip Delay Maximum (μs)
The maximum round trip delay since the last restart of
the test, expressed in microseconds.
Ethernet, IP, TCP/UDP, and Fibre Channel results
Test results such as link counts, statistics, error statistics, and BER results are
available when performing Ethernet, IP, TCP/UDP or Fibre Channel testing.
– If you are testing a 10 Gigabit WAN interface, SONET/SDH test results are
also available (see the PDH, SONET, SDH, NextGen, and OTN Testing
Manual that shipped with your instrument or upgrade.
– If you are testing using VPLS encapsulated traffic, link statistics, link
counts, filter statistics, filter counts, and BERT statistics for the customer
appear in the associated “Customer” result categories. Link statistics and
link counts for the service provider are also provided in “SP” categories.
– If you are testing using MAC-in-MAC (PBB) traffic, link statistics, link
counts, filter statistics, filter counts, and BERT statistics for the customer
frames appear in the associated “Customer” result categories. Link statistics and counts are also provided for the backbone frames.
– If you are testing using MPLS encapsulated traffic, the standard Layer 2
and layer 3 result categories are provided, and test results associated with
MPLS testing appear.
336
Ethernet, IP, TCP/UDP, Fibre Chan., VoIP, and Video Testing Manual
Chapter 13 Test Results
Ethernet, IP, TCP/UDP, and Fibre Channel results
– In all cases, only the results applicable to your test appear in each category. For example, if you are performing a Layer 2 Ethernet test with VLAN
tagged traffic, VPLS results and Fibre Channel results do not appear
because they are not applicable to your test.
Categories discussed in this section include the following:
– “Ethernet, IP, TCP/UDP, and Fibre Channel LEDs” on page 338
– “Cable Diagnostic results” on page 342
– “SLA/KPI” on page 344
– “Interface results” on page 344
– “L2 Link Stats results” on page 345
– “L2 Link Counts results” on page 349
– “L2 Filter Stats results” on page 351
– “L2 Filter Counts results” on page 355
– “J-Proof (transparency) results” on page 356
– “L2 BERT Stats results” on page 357
– “CDMA Receiver Status results” on page 358
– “CDMA/GPS Receiver Log” on page 358
– “Ethernet OAM Service OAM results” on page 359
– “Ethernet OAM Service OAM MEP Discovery results” on page 361
– “Ethernet OAM L-OAM Modes results” on page 362
– “Ethernet OAM L-OAM Counts results” on page 362
– “Ethernet OAM L-OAM States results” on page 363
– “Ethernet OAM L-OAM Error History results” on page 363
– “L3 Link Stats results” on page 364
– “L3 Link Counts results” on page 365
– “L3 Filter Stats results” on page 366
– “L3 Filter Counts results” on page 366
– “L3/IP Config Status results” on page 367
– “Ping results” on page 368
– “Traceroute results” on page 369
– “PCS Error Stats” on page 369
– “Ethernet Per Lane results” on page 370
– “Error Stats results” on page 371
– “Capture results” on page 375
– “Sync Status Messages” on page 375
– “AutoNeg Status results” on page 376
– “Login Status results” on page 377
– “PTP Link Counts results” on page 379
– “PTP Link Stats results” on page 380
– “PTP Graphs” on page 382
– “L4 Link Stats results” on page 382
– “Detailed L4 Stats” on page 382
– “Cumulative L4 results” on page 383
– “L4 Link Counts results” on page 384
Ethernet, IP, TCP/UDP, Fibre Chan., VoIP, and Video Testing Manual 337
Chapter 13 Test Results
Ethernet, IP, TCP/UDP, and Fibre Channel results
– “L4 Filter Stats results” on page 384
– “L4 Filter Counts results” on page 384
– “J-Profiler results” on page 384
Ethernet, IP, TCP/UDP, and
Fibre Channel LEDs
Table 41 describes the LEDs provided during Ethernet, IP, TCP/UDP, and
Fibre Channel testing. Only the LEDs that are applicable for your test appear
in the LED panel. For example, layer 2 Ethernet, layer 3 IP, and
layer 4 TCP/UDP LEDs do not appear if you configure your unit for a Layer 1
test.
If the instrument loses any of the LED events, the green Status LED extinguishes, and the red Alarm LED in the history column illuminates indicating an
error condition has occurred.
Table 41 describes the LEDs, and indicates whether each LED is applicable
when testing Ethernet, IP, and Fibre Channel.
ATP Frame Sync
Green
– Synchronization with a received ATP frame
has been achieved.
Red
– Synchronization has been lost since the last
test restart.
Frame Detect
Green
– Valid frames have been detected.
Red
– Frames were detected, and then not present for > 1 second.
HI-BER
Red (Status)
– High Bit Error Rate alarm is currently being
detected
Red (History)
– High Bit Error Rate alarm was detected at
some point since the last restart of the test.
IP Packet Detect
Green
– An IP Packet has been detected.
Red
– An IP Packet was detected, and then not
present for > 1 second.
338
√
√
√
√
Fibre Channel
Green
– A frame with an Acterna payload has been
detected.
Red
– An Acterna payload was detected, and then
not present for > 1 second.
TCP/UDP
Acterna Detect
IP
Indicates
√
√
√
√
√
√
10G, 40G &
100G onlyΓ
LED
MiM
Ethernet
Table 41 Ethernet, IP, TCP/UDP, and Fibre Channel LEDs
Ethernet, IP, TCP/UDP, Fibre Chan., VoIP, and Video Testing Manual
Chapter 13 Test Results
Ethernet, IP, TCP/UDP, and Fibre Channel results
Red
– Loss of Alignment (LOA) has occurred
between lanes.
Red
– Loss of Alignment (LOA) has occurred
between lanes at some point since the last
restart of the test.
LOAML
Red
– Loss of Alignment Marker Lock (LOAML)
has occurred between lanes.
Red
– Loss of Alignment Marker Lock (LOAML)
has occurred between lanes at some point
since the last restart of the test.
40G &
100G onlyΓ
LOBL
Red
– Loss of Block Lock (LOBL) has occurred
between lanes.
Red
– Loss of Block Lock (LOBL) has occurred
between lanes at some point since the last
restart of the test.
LPAC
Red
– A valid frame was not received within 10
seconds of the last test start or restart.
L1 Pattern Sync
Green
– Synchronization with the received Layer 1
patterns has been achieved.
Red
– Synchronization has been lost since the last
test restart.
√
L2 Pattern Sync
Green
– Synchronization with the received Layer 2
patterns has been achieved.
Red
– Synchronization has been lost since the last
test restart.
√
√
Link Active
Green
– Auto-negotiation was successful, and link is
established with the instrument’s link partner.
Red
– A link to the instrument’s link partner has
been lost since the last test restart.
√
√
Fibre Channel
LOA (Deskew)
40G &
100G onlyΓ
IP
TCP/UDP
Indicates
MiM
LED
40G &
100G onlyΓ
Ethernet
Table 41 Ethernet, IP, TCP/UDP, and Fibre Channel LEDs (Continued)
√
√
√
√
√
Ethernet, IP, TCP/UDP, Fibre Chan., VoIP, and Video Testing Manual 339
Chapter 13 Test Results
Ethernet, IP, TCP/UDP, and Fibre Channel results
Fibre Channel
Local Fault Detect
Red (Status)
– No local faults are currently being detected.
Red (History)
– A local fault occurred since the last test
restart.
10G, 40G &
100G only
TCP/UDP
Indicates
Marker Lock
Green
– (Alignment) Marker Lock has been achieved
across all lanes.
Red
– Alignment Marker Lock was lost on some
lane since the las test restart.
Pause Frame Detect
Green
– Pause frames have been detected.
Red
– Pause frames were detected, and then
were not present for > 1 second.
PBB Frame Detect
Green
– PBB (MAC-in-MAC) frames have been
detected.
Red
– PBB frames were detected, and then were
not present for > 1 second.
Remote Fault Detect
Red
– No remote faults are currently being
detected.
Red
– A lremote fault has occurred since the last
test restart.
Signal Present1
Green
– A signal is present.
Red
– Received signal has been lost since the last
test start or restart.
√
√
√
√
√
Status
Green
– N/A
Red
– An error has been recorded by the instrument, as shown in a red Summary Status
window.
√
√
√
√
√
SVLAN Frame Detect
Green
– SVLAN tagged Ethernet frames have been
detected.
Red
– SVLAN tagged Ethernet frames were
detected, and then not present for > 1 second.
√
√
√
340
√
IP
MiM
LED
40G &
100G onlyΓ
Ethernet
Table 41 Ethernet, IP, TCP/UDP, and Fibre Channel LEDs (Continued)
√
10G, 40G &
100G only
√
Ethernet, IP, TCP/UDP, Fibre Chan., VoIP, and Video Testing Manual
Chapter 13 Test Results
Ethernet, IP, TCP/UDP, and Fibre Channel results
Indicates
Sync Acquired
Green
– Synchronization is established.
Red
– Synchronization has been lost since the last
test restart.
TCP Packet Detect
Green
– TCP packets have been detected.
Red
– TCP packets were detected, and then not
present for > 1 second.
√
UDP Packet Detect
Green
– UDP packets have been detected.
Red
– UDP packets were detected, and then not
present for > 1 second.
√
VLAN Frame Detect
Green
– VLAN tagged Ethernet frames have been
detected.
Red
– VLAN tagged Ethernet frames were
detected, and then not present for > 1 second.
√
√
√
VLAN Stack Frame
Detect
Green
– VLAN stack tagged Ethernet frames have
been detected.
Red
– VLAN stack tagged Ethernet frames were
detected, and then not present for > 1 second.
√
√
√
CDMA/GPS Sync2
(OWD Time Source)
Green
– The instrument is within a CDMA/GPS network and has obtain synchronization with
the CDMA base station/GPS.
Red
– The instrument obtained synchronization
with the CDMA base station/GPS, and then
it was not present for > 1 second.
√
√
IP
MiM
LED
√
√
Fibre Channel
TCP/UDP
Ethernet
Table 41 Ethernet, IP, TCP/UDP, and Fibre Channel LEDs (Continued)
√
√
Ethernet, IP, TCP/UDP, Fibre Chan., VoIP, and Video Testing Manual 341
Chapter 13 Test Results
Ethernet, IP, TCP/UDP, and Fibre Channel results
Green
– The instrument is receiving the data that is
required to synchronize its internal clock
with the GPS time received from the 1 PPS
signal. After the CDMA/GPS Sync LED illuminates, this LED may take up to fifteen
additional seconds to illuminate.
Red
– The instrument synchronized the clock with
the 1PPS signal, and then it was not present for > 1 second.
Fibre Channel
1PPS Sync2
(OWD Time Source)
TCP/UDP
Indicates
IP
LED
MiM
Ethernet
Table 41 Ethernet, IP, TCP/UDP, and Fibre Channel LEDs (Continued)
√
1. The Signal Present LED is not applicable when testing 10/100/1000 Ethernet.
2. If your instrument is equipped with the One Way Delay option, these LEDs appear in the LED panel.
Cable Diagnostic results
The Cable Diagnostics screen shows measurements associated with running
cable diagnostics on an electrical link.
After running the Cable Diagnostics tool, the screen lists results for one of the
following states:
– Active 10M or 100M link. If a 10M or 100M link is established, the MDI/
MDIX status (see “MDI or MDIX Status result” on page 342) is reported.
– Active 1G electrical link. If a 1G electrical link is established, the pair
status, polarity, and pair skew for each MDI pair is reported. See “Skew
(ns) result” on page 343, “Polarity result” on page 344 and “Skew (ns)
result” on page 343.
– Inactive link. If the link is inactive, the unit indicates the type of fault and
the fault’s relative distance from the tester (see “Distance (m) result” on
page 343).
Results associated with cable diagnostics are also provided in the L2 Link
Stats result category (see “L2 Link Stats results” on page 345).
MDI or MDIX Status result
The MDI/MDIX Status result indicates the resolved wiring (MDI, or MDIX) of the
near end unit’s RJ-45 jack. For example, if the far end can not auto-configure
its interface, (in other words, the wiring is fixed), this result can help you determine whether a straight through or crossover cable is being used or the MDI/
MDIX wiring of the far end port.
– You must know the fixed MDI/MDIX status of the far end port to determine
the type of cable using the near end MDI/MDIX Status result. For example,
if you know that the far end port is fixed at MDI, and the near end port
detects MDIX, then you can conclude that a straight through cable is used.
– You must know the cable type used to determine the MDI/MDIX status of
the far end port using the near end MDI/MDIX Status result. For example,
if you know you are using a straight through cable, and the near end port
detects MDIX, you can conclude that the wiring at the far end port is MDI.
342
Ethernet, IP, TCP/UDP, Fibre Chan., VoIP, and Video Testing Manual
Chapter 13 Test Results
Ethernet, IP, TCP/UDP, and Fibre Channel results
Table 42 illustrates each of the possible resolutions.
Table 42
Transport Module Ethernet MDI/MDIX Resolution
Far end port
Cable
Near end port
MDIX
straight through
MDI
MDI
cross over
MDI
MDI
straight through
MDIX
MDIX
cross over
MDIX
NOTE:
If the speed detected on the line is 1G electrical, the MDI/MDIX Status
results are not applicable and therefore do not appear on the Cable Diagnostics screen.
Fault Type result
If a link is inactive, and a fault is detected, the instrument indicates the type of
fault detected (Open, Short, or Unknown) and the fault’s relative distance
from the tester within +/- 1 meter.
If you do not connect the cable to a far end device (completing the circuit), you
can also use the Open detection feature to measure the length of a cable.
Fault types are defined as follows:
Open—Indicates there is a cut on the pair (or that the cable is not connected
to a device at the far end of the circuit), and that the tester has detected an
impedance exceeding 333 ohms. The distance from the near end tester to the
end of the cable (or the cut) is also provided.
Short—Indicates a positive and negative line on the same pair are touching,
and that the tester has detected an impedance less than 33 ohms.
Unknown—Indicates the tester has detected impedance outside of the ranges
stated for Open and Short faults, or that the cable is properly terminated into
another Ethernet port. Unknown does not necessarily indicate that a fault was
detected.
NOTE:
If the far end of the cable is connected to a powered down IP phone, and the
phone is an older model, there is a filter that connects between pairs 1-2
and 3-6 in the phone. Depending on the characteristics of the filter, your tester may report a fault for pairs 1-2 and 3-6.
Distance (m) result
For each fault detected, the distance from the MSAM to the fault is listed. If no
fault is detected, N/A appears.
Skew (ns) result
The Skew result is a measurement of timing differences between the MDI pairs
on active 1G electrical links. Timing differences may occur for a variety of
reasons. For example, if different insulating materials are used on the pairs, a
Ethernet, IP, TCP/UDP, Fibre Chan., VoIP, and Video Testing Manual 343
Chapter 13 Test Results
Ethernet, IP, TCP/UDP, and Fibre Channel results
variance in the signal velocity (skew) may occur. If the skew is significant,
transmission of the signal may be impaired to such a degree that the received
signal can not be synchronized.
Pair skew is reported in +/- 8 ns increments.
Polarity result
The Polarity result indicates the polarity of each MDI pair on active 1G electrical links, indicating how each pair is physically wired to the unit’s port.
– Normal (+) indicates a normal polarity for the pair.
– Inverted (-) indicates an inverted polarity for the pair.
Pair result
The Pair results for 1G electrical links provide the current pair assignments for
the link. MDI pairs for 1G electrical links are assigned during the process of
auto-negotiation; therefore, if for any reason the link becomes inactive, and
then the link is re-established, the pair assignments could potentially change.
For example, the first time you establish a link after auto-negotiation, the
following pairs could be assigned:
Table 43 MDI pair assignments
MDI0
MDI1
MDI2
MDI3
1-2
3-6
4-5
7-8
If the link goes down (becomes inactive), and then is re-established, the
following pairs could be assigned:
Table 44 MDIX pair assignments
SLA/KPI
Interface results
MDI0
MDI1
MDI2
MDI3
3-6
1-2
7-8
4-5
The Summary SLA/KPI results provide the results relevant to the Service Level
Agreement (SLA) and Key Performance Indicators (KPI).
Table 45 describes the Interface/Signal results.
Table 45 Interface/Status results
344
Test Result
Description
Link Loss Seconds
Number of seconds during which the link was down (lost).
Local Fault Seconds
Displays the number of test seconds during which a local
fault occurred, indicating that the Transport Module could
not detect a received signal, could not obtain PCS block
synchronization, or detects 16 or more errored PCS block
sync headers in a 125 μs period. Only applicable when
testing 10 Gigabit Ethernet interfaces.
Optical Rx Level
(dBm)
Displays the receive level in dBm when testing optical
interfaces using average power consumption (sum of all
lanes).
Ethernet, IP, TCP/UDP, Fibre Chan., VoIP, and Video Testing Manual
Chapter 13 Test Results
Ethernet, IP, TCP/UDP, and Fibre Channel results
Table 45 Interface/Status results (Continued)
Test Result
Description
Optical Rx Overload
Displays ON if the received optical power level is greater
than the receiver shutdown specification as stated in the
specifications appendix of the Getting Started guide that
shipped with your instrument, or as stated in the vendor
specifications for the transceiver (SFP, XFP, QSFP+ or
CFP) you have inserted.
Remote Fault Seconds
Displays the number of test seconds during which the
instrument transmits a remote fault indication in response
to the receipt of a remote fault indication from its link partner. Only applicable when testing 10 Gigabit, 40 Gigabit,
and 100 Gigabit Ethernet interfaces.
Rx Frequency (Hz)
Frequency of the clock recovered from the received signal, expressed in Hz.
Rx Freq Deviation
(ppm)
Current received frequency deviation. Displayed in PPM.
Rx Freq Max Deviation (ppm)
Maximum received frequency deviation.
Signal Losses
Number of times signal was lost during current test.
Signal Loss Seconds
Number of seconds during which a signal was not present.
Sync Loss Seconds
Number of seconds during which a synchronization was
not present.
Tx Clock Source
Shows the source of the transmit timing standard
Tx Frequency (Hz)
Current transmitter clock frequency, expressed in Hz.
Tx Freq Deviation
(ppm)
Current transmitted frequency deviation. Displayed in
PPM.
Tx Freq Max Deviation (ppm)
Maximum transmitted frequency deviation.
Wavelength
Displays the current wavelength of the SFP in use.
Table 46 describes the Interface/Lambda results.
Table 46 Interface/Lambda Results (40G/100G applications only)
L2 Link Stats results
Test Result
Description
Optical Rx Level
(dBm)
Displays the receive level in dBm of each lane when testing some optical interfaces.
Table 47 describes the L2 Link Stats and L2 Customer Link Stats results such
as the average frame rate, peak frame rate, and the maximum, minimum, and
average round trip delay measurements. Only results that are applicable to
your test appear in the category. For example, the MPLS results only appear
when your unit is configured to test using layer 3, MPLS encapsulated traffic.
If your unit is configured for a Layer 2 test, MPLS results will not appear.
When testing VPLS or MPLS-TP encapsulated traffic, link statistic results
appear in the L2 Customer Link Stats and the L2 SP Link Stats categories.
Ethernet, IP, TCP/UDP, Fibre Chan., VoIP, and Video Testing Manual 345
Chapter 13 Test Results
Ethernet, IP, TCP/UDP, and Fibre Channel results
When testing MiM encapsulated traffic, link statistic results appear in the L2
Customer Link Stats and the L2 Backbone Link Stats categories.
Table 47 L2 Link Stats results
Test Result
Description
B-Tag
Displays the following for the last received backbone frame:
Value
– Displays the value carried in the B-Tag field (VLAN ID + Priority + Drop Eligible) in a hexadecimal format.
VLAN ID
– Displays the ID for the backbone VLAN used as the path to the destination carried in the
frame.
Priority
– Displays the VLAN priority carried in the frame.
DEI
– Displays the drop eligible bit carried in the frame.
Current Util, %
The current bandwidth utilized by received Broadcast, Unicast, or Multicast
traffic expressed as a percentage of the line rate of available bandwidth. This measurement
is an average taken over the prior second of test time.
Delay (μs), Round Trip
You must originate an Acterna payload to measure round trip delay. If a unit is in loopback
mode, or if the far end unit is not looped back, invalid results appear because the unit is not
originating the traffic.
Before measuring delay on 10 Gigabit Ethernet or 10 Gigabit Fibre Channel circuits, you can
indicate whether or not you want to make the measurement using a high or low degree of
precision. If your delay results say “Out of Range”, change your setting to low precision, and
then restart the measurement.
Average
The average round trip delay calculated in microseconds, with a resolution as follows:
– 10/100/1000 and 1 GigE Ethernet: 2.048 ms
– 10 Gigabit Ethernet: 2.048 ms
– 1G/2G/4Gigabit Fibre Channel: 2.409 ms
– 10 Gigabit Fibre Channel: 2.008 ms
Current
– The current round trip delay calculated in microseconds.
Maximum
– The maximum round trip delay calculated in microseconds.
Minimum
– The minimum round trip delay calculated in microseconds.
Frame Rate
Current
– The current rate of received frames taken over the prior second of test time.
Average
– The average rate is calculated over the time period elapsed since the last test restart.
Minimum
– The minimum rate is taken over a one second period.
Peak
– The maximum rate is taken over a one second period since frame detection.
All rates are expressed in frames per second.
Frame Size
The average, maximum, and minimum size of frames received since frame detection.
346
Ethernet, IP, TCP/UDP, Fibre Chan., VoIP, and Video Testing Manual
Chapter 13 Test Results
Ethernet, IP, TCP/UDP, and Fibre Channel results
Table 47 L2 Link Stats results (Continued)
Test Result
Description
I-Tag
Displays the following for the last received backbone frame:
Value
– Displays the value carried in the I-Tag field (Service ID + Priority + DEI + Use Customer
Address) in a hexadecimal format.
Service ID
– Displays the service ID carried in the last frame.
Priority
– Displays the priority carried in the last frame.
DEI
– Displays the drop eligible bit carried in the last frame.
Use Customer Address
– Displays the use customer address bit carried in the last frame.
MPLS Label Depth Max
Displays the maximum number of MPLS labels for all frames received since starting the test.
MPLS Label Depth Min
Displays the minimum number of MPLS labels for all frames received since starting the test.
MPLS1 ID
Displays label 1 of the last received MPLS encapsulated frame.
MPLS1 Priority
Displays the label 1 priority of the last received MPLS encapsulated frame.
MPLS1 TTL
Displays the label 1 TTL value for the last received MPLS encapsulated frame.
MPLS2 ID
Displays label 2 of the last received MPLS encapsulated frame.
MPLS2 Priority
Displays the label 2 priority of the last received MPLS encapsulated frame.
MPLS2 TTL
Displays the label 2 TTL value for the last received MPLS encapsulated frame.
MPLS-TP Label Depth
Max
Displays the maximum number of MPLS-TP labels for all frames received since starting the
test. Result appears in the L2 SP Link Stats category.
MPLS-TP Label Depth
Mim
Displays the minimum number of MPLS-TP labels for all frames received since starting the
test. Result appears in the L2 SP Link Stats category.
MPLS-TP Tunnel Label
Displays the tunnel label of the last MPLS-TP encapsulated frame.
MPLS-TP Tunnel Priority
Displays the tunnel priority of the last MPLS-TP encapsulated frame.
MPLS-TP Tunnel TTL
Displays the tunnel TTL value of the last MPLS-TP encapsulated frame.
MPLS-TP VC Label
Displays the VC label of the last MPLS-TP encapsulated frame.
MPLS-TP VC Priority
Displays the VC priority of the last MPLS-TP encapsulated frame.
MPLS-TP VC TTL
Displays the VC TTL value of the last MPLS-TP encapsulated frame.
One Way Delay (μs)
Average
The average one way delay calculated in microseconds, with a resolution as follows:
– 10/100/1000 and 1 GigE Ethernet: 2.048 ms
– 10 Gigabit Ethernet: 2.048 ms
– 1G/2G/4Gigabit Fibre Channel: 2.409 ms
– 10 Gigabit Fibre Channel: 2.008 ms
Current
– The current one way delay calculated in microseconds.
Maximum
– The maximum one way delay calculated in microseconds.
Minimum
– The minimum one way delay calculated in microseconds.
One Way Delay % Valid
The ratio of packets containing a GPS timestamp to the total number of Acterna Test Packets
received.
Ethernet, IP, TCP/UDP, Fibre Chan., VoIP, and Video Testing Manual 347
Chapter 13 Test Results
Ethernet, IP, TCP/UDP, and Fibre Channel results
Table 47 L2 Link Stats results (Continued)
Test Result
Description
OWD ATP Frame Count
The number of ATP-GPS frames received since test restart.
Packet Jitter (μs)
Instantaneous
– The current Packet Jitter measured over the prior second of test time.
Average
– The smoothed average value of the packet delay variation since the last test restart (per
RFC 1889), calculated in microseconds.
Max Average
– The maximum Packet Jitter, Avg (us) measured since the last test restart, calculated in
microseconds.
Peak
– The highest packet delay variation measured since the last test restart, calculated in
microseconds.
Preceding SVLANs
Displays the SVLAN ID, priority, and DEI of stacked VLANs.
Rx Mbps, Cur L1
The current bandwidth utilized by the received traffic expressed in megabits per second. This
measurement is an average taken over the prior second of test time.
Rx Mbps, Cur L2
The current data rate of received frames calculated over the prior second of test time. Data
rate is the frame bandwidth, excluding the preamble, start of frame delimiter, and minimum
inter-frame gap.
Rx Pause Length (ms)
The duration, in milliseconds of currently received pause frames taken over the prior second
of test time, and the minimum and maximum length since starting or restarting the test.
Svc Disruption (μs)
The service disruption time (maximum inter-frame gap) when service switches to a protect
line calculated in microseconds. Result appears in the L2 SP Link Stats category.
SVLAN Frame DEI
Displays the DEI of the last received tagged frame.
SVLAN ID
Displays the SVLAN ID of the last received tagged frame.
SVLAN User Priority
Displays the SVLAN priority of the last received tagged frame.
Total Util %
Average
– The average bandwidth utilized by the received traffic, expressed as a percentage of the
line rate of available bandwidth calculated over the time period since the last test restart.
Current
– The current bandwidth utilized by the received traffic expressed as a percentage of the
line rate of available bandwidth. This measurement is an average taken over the prior
second of test time.
Minimum
– The minimum bandwidth utilized by the received traffic since the last test restart
expressed as a percentage of the line rate of available bandwidth.
Peak
– The peak bandwidth utilized by the received traffic since the last test restart expressed as
a percentage of the line rate of available bandwidth.
Tx Mbps, Cur L1
The current bandwidth utilized by the transmitted traffic expressed in megabits per second.
This measurement is an average taken over the prior second of test time.
Tx Mbps, Cur L2
The current data rate of transmitted frames calculated over the prior second of test time. Data
rate is the frame bandwidth, excluding the preamble, start of frame delimiter, and minimum
inter-frame gap.
VLAN ID
Displays the VLAN ID of the last received tagged frame.
VLAN User Priority
Displays the VLAN priority of the last received tagged frame.
VPLS Label Depth Max
Displays the maximum number of VPLS labels for all frames received since starting the test.
Result appears in the L2 SP Link Stats category.
348
Ethernet, IP, TCP/UDP, Fibre Chan., VoIP, and Video Testing Manual
Chapter 13 Test Results
Ethernet, IP, TCP/UDP, and Fibre Channel results
Table 47 L2 Link Stats results (Continued)
Test Result
Description
VPLS Label Depth Min
Displays the minimum number of VPLS labels for all frames received since starting the test.
Result appears in the L2 SP Link Stats category.
VPLS Tunnel Label
Displays the tunnel label of the last received VPLS encapsulated frame.
VPLS Tunnel Priority
Displays the tunnel priority of the last received VPLS encapsulated frame.
VPLS Tunnel TTL
Displays the tunnel TTL value of the last received VPLS encapsulated frame.
VPLS VC Label
Displays the VC label of the last received VPLS encapsulated frame.
VPLS VC Priority
Displays the VC priority of the last received VPLS encapsulated frame.
VPLS VC TTL
Displays the VC TTL value of the last received VPLS encapsulated frame.
L2 Link Counts results
Table 48 describes the L2 Link Counts results, such as the number of received
frames, number of transmitted frames, and number of unicast, multicast, or
broadcast frames. The Received Frames result includes errored frames; all
other results count valid frames only.
When testing VPLS or MPLS-TP encapsulated traffic, the link count results
appear in the L2 Customer Link Counts and the L2 SP Link Counts categories.
When testing MiM encapsulated traffic, the link count results appear in the L2
Customer Link Counts and the L2 Backbone Link Counts categories.
Table 48 L2 Link Counts results
Test Result
Description
Jumbo Frames
Jumbo/Oversized frames are counted in this category.
This includes count of received Ethernet frames with a length greater than:
– 1518 bytes (non-tagged frames)
– 1522 bytes (VLAN tagged frames)
– 1526 bytes (Q-in-Q encapsulated frames)
1024 - 1518/1522/1526
A count of received Customer Ethernet frames between:
– 1024 bytes and 1518 bytes
– 1024 to 1522 bytes for VLAN-tagged frames
– 1024 to 1526 bytes for Q-in-Q encapsulated frames
1024 - < Jumbo Frames
A count of received Ethernet frames between 1024 bytes and less than Jumbo
frames
1024-2140 Byte Frames
A count of received Fibre Channel frames with lengths between 1024 and 2140
bytes, inclusive.
128-252 Byte Frames
A count of received Fibre Channel frames with lengths between 128 and 252 bytes,
inclusive.
128-255 Byte Frames
A count of received Ethernet frames with lengths between 128 and 255 bytes, inclusive.
256-508 Byte Frames
A count of received Fibre Channel frames with lengths between 256 and 5088 bytes,
inclusive.
256-511 Byte Frames
A count of received Ethernet frames with lengths between 256 and 511 bytes, inclusive.
28-64 Byte Frames
A count of received Fibre Channel frames with lengths between 28 and 64 bytes,
inclusive.
Ethernet, IP, TCP/UDP, Fibre Chan., VoIP, and Video Testing Manual 349
Chapter 13 Test Results
Ethernet, IP, TCP/UDP, and Fibre Channel results
Table 48 L2 Link Counts results (Continued)
Test Result
Description
512-1020 Byte Frames
A count of received Fibre Channel frames with lengths between 512 and 1020 bytes,
inclusive.
512-1023 Byte Frames
A count of received Ethernet frames with lengths between 512 and 1023 bytes, inclusive.
64 Byte Frames
A count of received Ethernet frames with a length of 64 bytes.
65-127 Byte Frames
A count of received Ethernet frames with lengths between 65 and 127 bytes, inclusive.
68-124 Byte Frames
A count of received Fibre Channel frames with lengths between 68 and 124 bytes,
inclusive.
Broadcast Frames
The number of Ethernet broadcast frames received since the last test restart.
Class 1 Frames
A count of received Fibre Channel Class 1 frames since the last test start or restart.
Class 2 Frames
A count of received Fibre Channel Class 2 frames since the last test start or restart.
Class 3 Frames
A count of received Fibre Channel Class 3 frames since the last test start or restart.
Class F Frames
A count of received Fibre Channel Class F frames since the last test start or restart.
Customer Tx Frame Bytes
A count of the total number of VPLS customer frame bytes transmitted since the test
was started. The count starts at the Destination Address and continues to the Frame
Check Sequence. The count does not include the preamble.
Far End B-B Credits
Count of the number of credits communicated by the far end during ELP login.
MPLS-TP Frames
A count of received MPLS-TP frames since the test was started, including errored
frames. Appears in the L2 SP Link Counts category.
Multicast Frames
The number of Ethernet multicast frames received since the last test restart.
Near-end B-B Credits
Count of the number of credits communicated by the near-end during Implicit login.
Pause Frames
A count of pause frames received from a remote Ethernet device. Pause frames are
utilized for flow control and alert the transmitting device that it must reduce the outgoing frame rate or risk a receiver overflow on the far end, resulting in dropped traffic.
Received Frames
A count of frames received since the last test restart, including errored frames.
Rx Acterna Frames
A count of received Acterna frames, including errored frames.
Rx Acterna OWD Frames
The number of ATP-GPS frames received since test restart.
Rx Collisions
A count of the number of times the unit has received a jam signal while it was not
transmitting frames. Result only appears for half-duplex 10/100 Ethernet tests.
Rx Frame Bytes
A count of the total number of frame bytes received since the test was started. The
count starts at the Destination Address and continues to the Frame Check Sequence.
– The count does not include the preamble or start of frame delimiter.
– The count does include errored frames.
Rx LBM Frames
A count of the total number of LBM frames received since the last test restart.
Rx LBR Frames
A count of the total number of LBR frames received since the last test restart.
Rx MPLS Frames
A count of received MPLS frames since the test was started, including errored
frames.
Rx Q-in-Q Frames
A count of received QinQ frames since the test was started, including errored frames.
Rx R_RDYs
A count of received Fibre Channel Rx_RDY primitives since the last test start or
restart.
Rx Stacked VLAN Frames
A count of received stacked VLAN frames as defined in IEEE 802.p/q since the test
was started, including errored frames.
350
Ethernet, IP, TCP/UDP, Fibre Chan., VoIP, and Video Testing Manual
Chapter 13 Test Results
Ethernet, IP, TCP/UDP, and Fibre Channel results
Table 48 L2 Link Counts results (Continued)
Test Result
Description
Rx VLAN Frames
A count of received VLAN frames as defined in IEEE 802.p/q since the test was
started, including errored frames.
Rx VPLS Frames
A count of received VPLS frames since the test was started, including errored frames.
Appears in the L2 SP Link Counts category.
Span Tree Frames
A count of received 802.1d spanning tree frames since frame detection after the last
test start or restart.
Transmitted Frames
A count of transmitted frames since the last test restart.
Tx Acterna Frames
A count of transmitted Acterna frames since the last test restart.
Tx Avail B-B Credit, Current
A count of the current number of credits the transmitter can use to send frames. Each
time a frame is transmitted, the count decreases by one; each time a frame is
acknowledged from the far end through an R_RDY, the count increases by one, up to
the maximum value established during login.
Tx Collisions
A count of the number of times the unit has transmitted a frame, and then received a
jam signal in the time slot for the frame. Result only appears for half duplex 10/100
Ethernet tests.
Tx Frame Bytes
A count of the total number of frame bytes transmitted since the test was started. The
count starts at the Destination Address and continues to the Frame Check Sequence.
The count does not include the preamble.
Tx Late Collisions
A count of the number of times the unit has transmitted a frame, and then experiences a collision more than 64 byte times after the transmission begins. Result only
appears for half-duplex 10/100 Ethernet tests.
Tx LBM Frames
A count of the total number of LBM frames transmitted since the last test restart
Tx R_RDYs
A count of transmitted Fibre Channel Rx_RDY primitives since the last test start or
restart.
Unicast Frames
The number of Ethernet unicast frames received since the last test restart.
L2 Filter Stats results
Table 49 describes the L2 Filter Stats and L2 Customer Filter Stats results for
filtered traffic such as the average frame rate, peak frame rate, and the
maximum, minimum, and average round trip delay measurements.
When testing VPLS or MPLS-TP encapsulated traffic, the Layer 2 filter statistic
results appear in the L2 Customer Filter Stats category.
Ethernet, IP, TCP/UDP, Fibre Chan., VoIP, and Video Testing Manual 351
Chapter 13 Test Results
Ethernet, IP, TCP/UDP, and Fibre Channel results
When testing MiM encapsulated traffic, the Layer 2 filter statistic results appear
in the L2 Customer Filter Stats and L2 Backbone Filter Stats categories.
Table 49 L2 Filter Stats and L2 Customer Filter Stats
Test Result
Description
B-Tag
Displays the following for the last filtered backbone frame:
Value
– Displays the value carried in the B-Tag field (VLAN ID + Priority + Drop Eligible)
in a hexadecimal format.
VLAN ID
– Displays the ID for the backbone VLAN used as the path to the destination carried in the frame.
Priority
– Displays the VLAN priority carried in the frame.
DEI
– Displays the drop eligible bit carried in the frame.
Delay (μs)
Average
The average round trip delay calculated in microseconds, with a resolution as follows:
– 10/100/1000 and 1 GigE Ethernet: 2.048 ms
– 10 Gigabit Ethernet: 2.048 ms
– 1G/2G/4Gigabit Fibre Channel: 2.409 ms
– 10 Gigabit Fibre Channel: 2.008 ms
Current
– The current round trip delay calculated in microseconds.
Maximum
– The maximum round trip delay calculated in microseconds.
Minimum
– The minimum round trip delay calculated in microseconds.
NOTE:
You must originate an Acterna payload to measure round trip delay. If a unit is in
loopback mode, or if the far end unit is not looped back, invalid results appear
because the unit is not originating the traffic.
Before measuring delay on 10 Gigabit Ethernet or 10 Gigabit Fibre Channel circuits,
you can indicate whether or not you want to make the measurement using a high or
low degree of precision. If your delay results say “Out of Range”, change your setting to low precision, and then restart the measurement.
Frame Rate
Current
– The current rate of filtered frames taken over the prior second of test time.
Average
– The average rate is calculated over the time period that elapsed since the last
test restart.
Minimum
– The minimum rate is taken over a one second period.
Peak
– The maximum rate is taken over a one second period since frame detection.
All rates are expressed in frames per second.
Frame Size
The average, maximum, and minimum size of filtered frames since frame detection.
352
Ethernet, IP, TCP/UDP, Fibre Chan., VoIP, and Video Testing Manual
Chapter 13 Test Results
Ethernet, IP, TCP/UDP, and Fibre Channel results
Table 49 L2 Filter Stats and L2 Customer Filter Stats (Continued)
Test Result
Description
I-Tag
Displays the following for the last filtered backbone frame:
Value
– Displays the value carried in the I-Tag field (Service ID + Priority + DEI + Use
Customer Address) in a hexadecimal format.
Service ID
– Displays the service ID carried in the last frame.
Priority
– Displays the priority carried in the last frame.
DEI
– Displays the drop eligible bit carried in the last frame.
Use Customer Address
– Displays the use customer address bit carried in the last frame.
MPLS1 ID
Displays label 1 of the last filtered MPLS encapsulated frame.
MPLS1 Priority
Displays the label 1 priority of the last filtered MPLS encapsulated frame.
MPLS1 TTL
Displays the label 1 TTL value for the last filtered MPLS encapsulated frame.
MPLS2 ID
Displays label 2 of the last filtered MPLS encapsulated frame.
MPLS2 Priority
Displays the label 2 priority of the last filtered MPLS encapsulated frame.
MPLS2 TTL
Displays the label 2 TTL value for the last filtered MPLS encapsulated frame.
MPLS-TP Tunnel Label
Displays the tunnel label of the last filtered MPLS-TP encapsulated frame.
MPLS-TP Tunnel Priority
Displays the tunnel priority of the last filtered MPLS-TP encapsulated frame.
MPLS-TP Tunnel TTL
Displays the tunnel TTL value of the last filtered MPLS-TP encapsulated frame.
MPLS-TP VC Label
Displays the VC label of the last filtered MPLS-TP encapsulated frame.
MPLS-TP VC Priority
Displays the VC priority of the last filtered MPLS-TP encapsulated frame.
MPLS-TP VC TTL
Displays the VC TTL value of the last filtered MPLS-TP encapsulated frame.
One Way Delay (μs)
Average
The average one way delay calculated in microseconds, with a resolution as follows:
– 10/100/1000 and 1 GigE Ethernet: 2.048 ms
– 10 Gigabit Ethernet: 2.048 ms
– 1G/2G/4Gigabit Fibre Channel: 2.409 ms
– 10 Gigabit Fibre Channel: 2.008 ms
Current
– The current one way delay calculated in microseconds.
Maximum
– The maximum one way delay calculated in microseconds.
Minimum
– The minimum one way delay calculated in microseconds.
One Way Delay % Valid
The ratio of packets containing a GPS timestamp to the total number of Acterna Test
Packets received.
OWD ATP Frame Count
The number of ATP-GPS frames received since test restart.
Ethernet, IP, TCP/UDP, Fibre Chan., VoIP, and Video Testing Manual 353
Chapter 13 Test Results
Ethernet, IP, TCP/UDP, and Fibre Channel results
Table 49 L2 Filter Stats and L2 Customer Filter Stats (Continued)
Test Result
Description
Packet Jitter (μs)
Instantaneous
– The current Packet Jitter measured over the prior second of test time.
Average
– The smoothed average value of the packet delay variation since the last test
restart (per RFC 1889), calculated in microseconds.
Max Average
– The maximum Packet Jitter, Avg (us) measured since the last test restart, calculated in microseconds.
Peak
– The highest packet delay variation measured since the last test restart, calculated in microseconds.
Rx Acterna OWD Frames
The number of filtered ATP-GPS frames received since test restart.
Rx Mbps, Cur L1
The current bandwidth utilized by the filtered traffic expressed in megabits per second. This measurement is an average taken over the prior second of test time.
Rx Mbps, Cur L2
The current data rate of filtered frames calculated over the prior second of test time.
Data rate is the frame bandwidth, excluding the preamble, start of frame delimiter,
and minimum inter-frame gap.
Rx Stacked VLAN Frames
A count of received stacked VLAN frames as defined in IEEE 802.p/q since the test
was started, including errored frames.
SVLANx ID, PRI, DEI
Displays the SVLAN ID, priority, and DEI of each VLAN in the stack.
Svc Disruption (μs)
The service disruption time (maximum inter-frame gap) when service switches to a
protect line calculated in microseconds.
Total Util %
Average
– The average bandwidth utilized by the filtered traffic, expressed as a percentage
of the line rate of available bandwidth calculated over the time period since the
last test restart.
Current
– The current bandwidth utilized by the filtered traffic expressed as a percentage
of the line rate of available bandwidth. This measurement is an average taken
over the prior second of test time.
Minimum
– The minimum bandwidth utilized by the filtered traffic since the last test restart
expressed as a percentage of the line rate of available bandwidth.
Peak
– The peak bandwidth utilized by the filtered traffic since the last test restart
expressed as a percentage of the line rate of available bandwidth.
VLAN ID
Displays the VLAN ID of the last filtered tagged frame.
VLAN User Priority
Displays the VLAN priority of the last filtered tagged frame.
VPLS Tunnel Label
Displays the tunnel label of the last filtered VPLS encapsulated frame.
VPLS Tunnel Priority
Displays the tunnel priority of the last filtered VPLS encapsulated frame.
VPLS Tunnel TTL
Displays the tunnel TTL value of the last filtered VPLS encapsulated frame.
VPLS VC Label
Displays the VC label of the last filtered VPLS encapsulated frame.
VPLS VC Priority
Displays the VC priority of the last filtered VPLS encapsulated frame.
VPLS VC TTL
Displays the VC TTL value of the last filtered VPLS encapsulated frame.
354
Ethernet, IP, TCP/UDP, Fibre Chan., VoIP, and Video Testing Manual
Chapter 13 Test Results
Ethernet, IP, TCP/UDP, and Fibre Channel results
L2 Filter Counts results
Table 50 describes the L2 Filter Counts L2 Customer Filter Counts results for
filtered traffic such as the number of received frames and the number of
received frames with an Acterna payload. Only valid frames are counted in this
category; errored frames are not counted.
When testing VPLS encapsulated traffic, Layer 2 filter count results appear in
the L2 Customer Filter Counts category..
Table 50 L2 Filter Counts results
Test Result
Description
>1518/1522
>1518/1526
A count of filtered Ethernet frames with a length greater than:
– 1518 bytes (non-tagged frames)
– 1522 bytes (VLAN tagged frames)
– 1526 bytes (Q-in-Q encapsulated frames)
NOTE: Jumbo frames are counted in this category.
1024 - 1518/1522
1024 - 1518/1526
A count of filtered Ethernet frames between:
– 1024 bytes and 1518 bytes
– 1024 to 1522 bytes for VLAN-tagged frames
– 1024 to 1526 bytes for Q-in-Q encapsulated frames
1024-2140 Byte Frames
A count of filtered Fibre Channel frames with lengths between 1024 and 2140 bytes,
inclusive.
128-252 Byte Frames
A count of filtered Fibre Channel frames with lengths between 128 and 252 bytes,
inclusive.
128-255 Byte Frames
A count of filtered Ethernet frames with lengths between 128 and 255 bytes, inclusive.
256-508 Byte Frames
A count of filtered Fibre Channel frames with lengths between 256 and 5088 bytes,
inclusive.
256-511 Byte Frames
A count of filtered Ethernet frames with lengths between 256 and 511 bytes, inclusive.
28-64 Byte Frames
A count of filtered Fibre Channel frames with lengths between 28 and 64 bytes, inclusive.
512-1020 Byte Frames
A count of filtered Fibre Channel frames with lengths between 512 and 1020 bytes,
inclusive.
512-1023 Byte Frames
A count of filtered Ethernet frames with lengths between 512 and 1023 bytes, inclusive.
64 Byte Frames
A count of filtered Ethernet frames with a length of 64 bytes.
65-127 Byte Frames
A count of filtered Ethernet frames with lengths between 65 and 127 bytes, inclusive.
68-124 Byte Frames
A count of filtered Fibre Channel frames with lengths between 68 and 124 bytes, inclusive.
Broadcast Frames
The number of filtered Ethernet broadcast frames since the last test restart.
Multicast Frames
The number of filtered Ethernet multicast frames received since the last test restart.
Rx Acterna Frames
A count of received Acterna frames, including errored frames.
Rx Acterna OWD Frames
The number of filtered ATP-GPS frames received since test restart.
Rx Frame Bytes
A count of the total number of frame bytes received since the test was started. The
count starts at the Destination Address and continues to the Frame Check Sequence.
– The count does not include the preamble or start of frame delimiter.
– The count does include errored frames.
Rx MPLS Frames
A count of filtered MPLS frames since the test was started, including errored frames.
Rx Q-in-Q Frames
A count of filtered Q-in-Q frames since the test was started, including errored frames.
Ethernet, IP, TCP/UDP, Fibre Chan., VoIP, and Video Testing Manual 355
Chapter 13 Test Results
Ethernet, IP, TCP/UDP, and Fibre Channel results
Table 50 L2 Filter Counts results (Continued)
Test Result
Description
Rx Stacked VLAN Frames
A count of received stacked VLAN frames as defined in IEEE 802.p/q since the test
was started, including errored frames.
Rx VLAN Frames
A count of filtered VLAN frames as defined in IEEE 802.p/q since the test was started,
including errored frames.
Rx VPLS Frames
A count of filtered VPLS frames since the test was started, including errored frames.
Appears in the L2 SP Link Counts category.
Span Tree Frames
A count of filtered 802.1d spanning tree frames since frame detection after the last test
start or restart.
Unicast Frames
The number of filtered Ethernet unicast frames since the last test restart.
Valid Rx Frames
Count of the number of filtered error-free frames since the test was started.
J-Proof (transparency)
results
Table 51 describes the Transparency results associated with the loopback of
control frames for various protocols. To view the Transparency results, launch
the Layer 2 Traffic application, and then run the transparency test (see “Using
J-Proof to verify layer 2 transparency” on page 70)..
Table 51 Transparency results
Test Result
Description
Name
Displays the name specified when you configured the test frame.
Tx
A count of the number of test frames for a particular test frame type transmitted by the instrument since the last test start or restart.
Rx
A count of the number of test frames for a particular test frame type received by the instrument
since the last test start or restart.
Status
Displays one of the following:
– N/A. Indicates that a particular test frame is not configured to be transmitted.
– IDLE. Indicates that a particular test frame is in the queue to be transmitted.
– In Progress. Indicates that a particular test frame is currently being transmitted, and has not
yet encountered an error.
– Timeout. Indicates that for a particular test frame a timeout was reached while waiting for a
transmitted frame to return; however, all frames were successfully looped back before the
end of the test frame’s transmission.
– Payload Errors. Indicates that for a particular test frame all transmitted frames were successfully looped back, but a received frame contained a payload that was not the same as its
transmitted payload.
– Header Errors. Indicates that for a particular test frame, all transmitted frames were successfully looped back, but a received frame contained a header that was different from its transmitted header.
– Count Mismatch. Indicates that the number of received frames for a particular test frame did
not match the number of frames transmitted.
356
Ethernet, IP, TCP/UDP, Fibre Chan., VoIP, and Video Testing Manual
Chapter 13 Test Results
Ethernet, IP, TCP/UDP, and Fibre Channel results
L2 BERT Stats results
Table 52 describes the L2 BERT Stats results typically associated with the
transmission of BERT patterns on a Layer 2 (switched) network. In some
instances, the instrument may detect BERT patterns while transmitting an
Acterna payload (for example, if a device on the far end of the link is transmitting an all ones BERT pattern).
To view the L2 BERT Stats results while BER testing, transmit traffic with a
BERT pattern in the payload over a Layer 2 network, and then set a result category to L2 BERT Stats.
When testing VPLS encapsulated traffic, Layer 2 BERT statistic results appear
in the L2 Customer BERT Stats category.
NOTE:
To display Layer 2 BERT Stat results, the MSAM must receive frames with a
BERT pattern matching the pattern specified in the receive settings (see
“Specifying Ethernet filter settings” on page 51).
Table 52 L2 BERT Stats results
Test Result
Description
Bit Error Rate
The ratio of pattern bit errors to received pattern bits since initially acquiring frame
synchronization.
NOTE: This ratio is determined using only the bits in the payload of the frame.
Bit Errored Seconds
The number of seconds during which one or more pattern bit errors occurred since
initial frame synchronization.
Bit Errors
A count of the number of received bits in a recognized pattern that do not match
the expected value since initially acquiring frame synchronization.
Bit Error-Free Seconds
Number of error-free seconds during which error analysis has been performed
since initial pattern synchronization.
Bit Error-Free Seconds,%
Number of error-free seconds divided by the number of seconds during which error
analysis has been performed since initial pattern synchronization, expressed as a
percentage.
Pattern Losses
Count of the number of times pattern synchronization was lost since initially acquiring pattern synchronization.
Pattern Loss Seconds
Count of the number of seconds during which pattern synchronization was lost
since initially acquiring pattern synchronization.
Ethernet, IP, TCP/UDP, Fibre Chan., VoIP, and Video Testing Manual 357
Chapter 13 Test Results
Ethernet, IP, TCP/UDP, and Fibre Channel results
CDMA Receiver Status
results
Table 53 describes the CDMA Receiver Status results used when testing one
way delay.
Table 53 CDMA Receiver results
Test Result
Description
Signal Processor State
Displays the state of the signal processor in the Præcis Cf device.
Base Station Pseudo
Noise Offset
Displays the PNO code of the base station that the Præcis Cf device is listening to, between
0 and 511.
Automatic Gain Control
Displays automatic gain control DAC byte, between 0 and 255, but typically between 150 and
220.
Carrier Signal to nose
Ratio
Displays the signal to noise ratio (SNR) for received CDMA broadcast channel, between 0.0
and 99.9, but typically between 2.5 and 11.0.
Sync Channel Frame
Error Rate
Displays the Sync Channel Frame Error Rate.
TCXO Control
Displays the status of TCXO voltage control. If the TCXO voltage control starts falling outside of
the typical range, the Præcis Cf device should be returned to the factory.
No Signal Time-Out
Indicates that the Præcis Cf unit was not able to acquire CDMA for one hour while the Time
Figure of merit has been 9.
Hardware Failure
Detected
Indicates the Præcis Cf device cannot be expected to work properly due to an internal
Time Figure of Merit
Indicates the GPS accuracy of the current signal.
Firmware Version
Displays the firmware of the connected CDMA receiver.
error.
CDMA/GPS Receiver Log
358
The CDMA Receiver Log provides a listing of significant events and messages,
such as sync acquired or CDMA loss.
Ethernet, IP, TCP/UDP, Fibre Chan., VoIP, and Video Testing Manual
Chapter 13 Test Results
Ethernet, IP, TCP/UDP, and Fibre Channel results
Ethernet OAM Service OAM
results
Table 54 describes the Service OAM results, such as the number of RDI
seconds, loss of continuity indicator, and the number of transmitted and
received CCM frames. Service OAM results are not applicable with 40G/100G
High Speed Transport Module.
Table 54 Ethernet OAM Service OAM results
Test Result
CCM
AIS
LBM
Description
Loss of Continuity
ON indicates that a loss of continuity has occurred.
Maint. ID
Displays the maintenance association ID configured for the CCM frame received.
MD Level
Displays the maintenance domain level configured for the CCM frame received.
Mismerge
ON indicates that CCM frames have been received with the same maintenance
domain level specified for transmitted frames, but the received CCM frames carry
a different maintenance association ID (MAID).
Peer MEG End Point ID
Displays the maintenance entity group end point ID for the instrument’s peer as
configured.
RDI
Indicates whether or not remote defect indication is ON or OFF.
RDI Seconds
Count of the number of seconds during which an RDI was declared since starting
or restarting the test.
Total Rx Frames
Count of the number of CCM frames received since the last OAM setting was
specified or changed.
Total Tx Frames
Count of the number of CCM frames transmitted since the last OAM setting was
specified or changed.
Unexpected MEG Level
ON indicates that CCM frames have been received with a maintenance entity
group level lower than that specified as the maintenance domain level when you
configured the OAM settings for the transmitting instrument.
Unexpected MEP
ON indicates that a CCM was received from a different maintenance end point
than that specified as the instrument’s peer MEG End Point.
Unexpected Period
ON indicates that a CCM was received with the correct maintenance domain
level, maintenance association ID, and maintenance end point ID, but with a
period value that was not the same as the instrument’s CCM rate.
AIS
Indicates whether AIS is ON or OFF.
AIS Seconds
Count of the number of seconds during which an AIS was declared since starting
or restarting the test.
Total Rx Frames
Count of the number of frames received since AIS was declared.
Total Tx Frames
Count of the number of frames transmitted since AIS was declared.
Unexpected Period
ON indicates that an AIS was received with the correct maintenance domain
level, maintenance association ID, and maintenance end point ID, but with a
period value that was not the same as the instrument’s AIS rate.
Total Rx LBM Frames
Count of the total number of LBM frame received since the last OAM setting was
specified or changed.
Total Tx LBM Frames
Count of the total number of LBM frames transmitted since the last OAM setting
was specified or changed.
Total Rx LBR Frames
Count of the total number of LBR frames received since the last OAM setting was
specified or changed.
Total Tx LBR Frames
Count of the total number of LBR frames transmitted since the last OAM setting
was specified or changed.
Ethernet, IP, TCP/UDP, Fibre Chan., VoIP, and Video Testing Manual 359
Chapter 13 Test Results
Ethernet, IP, TCP/UDP, and Fibre Channel results
Table 54 Ethernet OAM Service OAM results (Continued)
Test Result
LTM
CV/FFD
BDI
360
Description
Total Rx LTM Frames
Count of the total number of LTM frame received since the last OAM setting was
specified or changed.
Total Tx LTM Frames
Count of the total number of LTM frames transmitted since the last OAM setting
was specified or changed.
Total Rx LTR Frames
Count of the total number of LTR frames received since the last OAM setting was
specified or changed.
Total Tx LTR Frames
Count of the total number of LTR frames transmitted since the last OAM setting
was specified or changed.
Expected LSR ID
IPv6 ID entered during setup as the address of the expected LSR
Expected LSP ID
ID entered during setup as the ID of the expected LSP
Total Rx CV Frames
Count of the total number of CV OAM packets received since the first received
FFD
Total Tx CV Frames
Count of the total number of CV OAM packets sent
Total Rx FFD Frames
Count of the total number of FFD OAM packets received since the first received
FFD
Total Tx FFD Frames
Count of the total number of FFD OAM packets sent
Expected Frequency
(FFD)
Display of FFD OAM packets Frequency (Tx) as specifed in setup
dLOCV
Simple Loss of Connectivity Verification due to missing CV or FFD OAM packets
with expected TTSI
dTTSI Mismatch
Trail Termination Source ID mismatch defect due to unexpected or lack of
expected TTSI in CV or FFD OAM packets
dTTSI Mismerge
Trail Termination Source ID mismerge defect due to both unexpected and
expected TTSI in CV or FFD OAM packets
dExcess
Defect due to a rate of receipt of CV or FFD OAM packets in excess of the nominal receipt rate- 1 per second for CV or 20 per second for FFD
BDI
Status of BD transmit or receive condition. OFF = BDI button in action bar not
clicked
BDI Seconds
Total seconds since receipt of first BDI
Defect Type
Type of defect received in BDI OAM packets
Defect Location
Defect location received in BDI OAM packets
LSP ID
LSP ID from BDI OAM packets received
LSR ID
LSR ID from BDI OAM packets received
Total RX Frames
Total number of BDI packets received since the first BDI or FDI packet was
received
Total Tx Frames
Total number of BDI packets sent
Ethernet, IP, TCP/UDP, Fibre Chan., VoIP, and Video Testing Manual
Chapter 13 Test Results
Ethernet, IP, TCP/UDP, and Fibre Channel results
Table 54 Ethernet OAM Service OAM results (Continued)
Test Result
FDI
Description
FDI
Status of BDI or FDI transmit or receive condition. OFF = FDI or BDI button in
action bar not clicked
FDI Seconds
Total seconds since receipt of first FDI
Defect Type
Type of defect received in FDI OAM packets
Defect Location
Defect location received in FDI OAM packets
LSP ID
LSP ID from FDI OAM packets received
LSR ID
LSR ID from FDI OAM packets received
Total RX Frames
Total number of FDI packets received since the first BDI or FDI packet was
received
Total Tx Frames
Total number of FDI packets sent
Ethernet OAM Service OAM
MEP Discovery results
Table 55 describes the Ethernet OAM Service OAM MEP Discovery results,
dealing with identification of network OAM elements and some continuity
checking parameters.
Table 55 Ethernet OAM Service OAM MEP Discovery results
Test Result
Description
# of MEPs Discovered
Number of unique MEPs currently displayed
MEP ID
Displays configured ID of the MEG Endpoint (MEPin the incoming CCM)
Source MAC Address
Displays MAC address of the source of the incoming CCM
VLAN ID
Displays VLAN ID in the incoming CCM, if present
SVLAN ID
Displays SVLAN ID in the incoming CCM, if present
MD Level
Displays the configured level of the Maintenance Domain (MD) in the incoming CCM
Specify Domain ID
Displays the configured Specify Domain ID in the incoming CCM
MD ID
Displays the configured Maintenance Domain ID in the incoming CCM
MA ID
Displays configured Maintenance Association (MA) Name or Maintenance Entity Group
(MEG) Identification
CCM Rate
Displays configured transmission frequency of the incoming CCM
CCM Type
Displays the configured CCM type in the incoming CCM
* Results can be filtered by a specified value under any of these column headings. Enter data in Filter the Display settings
under the Results display window. To expand, select the icon in the lower left corner.
Ethernet, IP, TCP/UDP, Fibre Chan., VoIP, and Video Testing Manual 361
Chapter 13 Test Results
Ethernet, IP, TCP/UDP, and Fibre Channel results
Ethernet OAM L-OAM Modes
results
Table 56 describes the L-OAM Modes results, such as the remote and local
mode, parser action, and muxer action. The Link OAM State must be On to
observe these results.
L-OAM results are not applicable with 40G/100G High Speed Transport
Module.
Table 56 Ethernet OAM L-OAM Modes results (Remote and Local Operation)
Test Result
Description
Mode
Displays the current mode (Active or Passive) for the local or remote instrument.
Parser Action
Indicates the local or remote receiver is currently forwarding, looping back, or discarding nonOAM PDUs.
Muxer Action
Indicates the local or remote transmitter is currently forwarding or discarding non-OAM PDUs.
Vendor OUI
Displays the Vendor OUI (Organizationally Unique Identifier) for the local or remote instrument.
Vendor Specific Info
Displays vendor specific information for the local or remote instrument.
Max PDU Size
Displays the maximum PDU (Protocol Data Units) size supported by the local or remote instrument.
Unidirectional
Indicates whether the local or remote instrument advertises that it is capable of sending OAM
PDUs when the receive path is non-operational.
Link Events
Indicates whether the local or remote instrument is configured to monitor link events.
Loopback
Indicates whether the local or remote instrument advertises that it provides loopback support.
Variable Retrieval
Indicates whether the local or remote instrument supports sending Variable Response OAM
PDUs.
Revision
Displays the current TLV (Type Length Value) revision for the local or remote instrument.
MAC Address
Displays the MAC address for the remote instrument.
Ethernet OAM L-OAM Counts
results
Table 57 describes the L-OAM Counts results, such as the number of transmitted and received variable requests, variable responses, and loopback
control frames. The Link OAM State must be On to observe these results.
L-OAM results are not applicable with 40G/100G High Speed Transport
Module
Table 57 Ethernet OAM L-OAM Counts results
Test Result
Description
Information
A count of Information frames transmitted or received since starting the test.
Event Notification
A count of Event notification frames transmitted or received since starting the test.
Variable Request
A count of variable request frames transmitted or received since starting the test.
Variable Response
A count of Variable Response frames transmitted or received since starting the test.
Loopback Control
A count of Loopback Control frames transmitted or received since starting the test.
Duplicate Event
A count of duplicate Event notification frames transmitted or received since starting the test.
Unsupported
A count of unsupported frames transmitted or received since starting the test.
Organization Specific
A count of Organization Specific frames transmitted or received since starting the test.
362
Ethernet, IP, TCP/UDP, Fibre Chan., VoIP, and Video Testing Manual
Chapter 13 Test Results
Ethernet, IP, TCP/UDP, and Fibre Channel results
Ethernet OAM L-OAM States
results
Table 58 describes the L-OAM States results, such as the Discovery state, and
Dying Gasp events. The Link OAM State must be On to observe these results
L-OAM results are not applicable with 40G/100G High Speed Transport
Module.
Table 58 Ethernet OAM L-OAM States results
Test Result
Description
Discovery
State
Displays one of the following:
– Fault
– Active Send Local
– Passive Wait
– Send Local Remote
– Send Any
Local
Displays one of the following:
– 0 = Can’t complete
– 1 = Not completed
– 2 = Completed
– 3 = Reserved
Remote
Displays one of the following:
– 0 = Can’t complete
– 1 = Not completed
– 2 = Completed
– 3 = Reserved
Remote Events
Ethernet OAM L-OAM Error
History results
Link Fault
Indicates whether a link fault occurred.
Dying Gasp
Indicates whether an unrecoverable failure has occurred.
Critical
Indicates whether a critical event has occurred.
Table 59 describes the L-OAM Error History results for Symbol Period Events,
Frame Events, Frame Period Events, Frame Sec Summary Events. The Link
OAM State must be On to observe these results.
L-OAM results are not applicable with 40G/100G High Speed Transport
Module
Table 59 Ethernet OAM L-OAM Error History results
Test Result
Description
Remote Timestamp
Displays the time that the last event occurred.
Remote Window
Indicates the duration of the period.
Remote Threshold
Indicates the number of errors that must occur in the window to cause an event.
Remote Errored Frame Sec
A count of the number of errored seconds in the period.
Remote Errored Frames
A count of errored frames since in the period.
Remote Error Running Total
A count of the number of errors since starting the test.
Remote Running Total
A count of the number of events since starting the test.
Ethernet, IP, TCP/UDP, Fibre Chan., VoIP, and Video Testing Manual 363
Chapter 13 Test Results
Ethernet, IP, TCP/UDP, and Fibre Channel results
L3 Link Stats results
Table 60 describes the L3 Link Stats results, such as the average packet rate,
peak packet rate, and the maximum, minimum, and average round trip delay
measurements.
Table 60 L3 Link Stats results
Test Result
Description
Packet Rate
Average
– The average rate of received packets, calculated over the time period elapsed
since the last test restart.
Current
– The current rate of received packets. This measurement is an average taken over
the prior second of test time.
Minimum
– The minimum rate of received packets over a one second period.
Peak
– The maximum rate of received packets over a one second period.
The packet rate is expressed in packets per second.
Packet Size
Average
– The average size of packets received since IP packet detection.
Minimum
– The minimum size of packets received since IP packet detection.
Maximum
– The maximum size of packets received since IP packet detection.
Rx Mbps, Cur L3
The current bandwidth utilized by the received IP traffic expressed in megabits per
second. This measurement is an average taken over the prior second of test time.
Total Util %
Average
– The average bandwidth utilized by the received IP traffic. This measurement is an
average taken over the prior second of test time.
Current
– The current bandwidth utilized by the received IP traffic.
Minimum
– The minimum bandwidth utilized by the received IP traffic since the last test
restart.
Peak
– The peak bandwidth utilized by the received IP traffic since the last test restart.
Bandwidth utilization is expressed as a percentage of the line rate of available bandwidth.
Tx Mbps, Cur L3
The current bandwidth utilized by the transmitted IP traffic expressed in megabits per
second. This measurement is an average taken over the prior second of test time.
364
Ethernet, IP, TCP/UDP, Fibre Chan., VoIP, and Video Testing Manual
Chapter 13 Test Results
Ethernet, IP, TCP/UDP, and Fibre Channel results
L3 Link Counts results
Table 61 describes each of the L3 Link Counts results such as the number of
received packets, number of transmitted packets, and number of unicast,
multicast, or broadcast packets. The Received Packets result includes errored
packets; all other results count valid packets only., Checkmarks indicate
whether the result is provided for IPv4 or IPv6 traffic
Table 61 L3 Link Counts results
Test Result
IPv4
IPv6
Description
>1500 Byte Packets
√
√
A count of Ethernet IP packets with a length greater than 1500
bytes.
1024-1500 Byte Packets
√
√
A count of Ethernet IP packets with lengths between 1024 and
1500 bytes, inclusive.
128-255 Byte Packets
√
√
A count of Ethernet IP packets with lengths between 128 and
255 bytes, inclusive.
20-45 Byte Packets
√
√
A count of Ethernet IP packets with lengths between 20 and 45
bytes, inclusive.
256-511 Byte Packets
√
√
A count of Ethernet IP packets with lengths between 256 and
511 bytes, inclusive.
46-63 Byte Packets
√
√
A count of Ethernet IP packets with lengths between 46 and 63
bytes, inclusive.
512-1023 Byte Packets
√
√
A count of Ethernet IP packets with lengths between 512 and
1023 bytes, inclusive.
64-127 Byte Packets
√
√
A count of Ethernet IP packets with lengths between 64 and 127
bytes, inclusive.
Broadcast Packets
√
√
The number of Ethernet broadcast IP packets received since the
last test restart.
Multicast Packets
√
√
The number of Ethernet multicast IP packets received since the
last test restart.
Received Packets
√
√
A count of IP packets received since the last test restart, including errored packets.
√
A count of received router advertisement messages when running an IPv6 application. This count is not reset when you restart
a test; to reset the count you must bring down the link, reestablish the link, and then start the test again.
√
A count of IP packets transmitted since the last test restart. This
result does not appear when testing in Monitor mode.
√
A count of transmitted router solicitation messages when running
an IPv6 application. This count is not reset when you restart a
test; to reset the count you must bring down the link, reestablish
the link, and then start the test again.
√
The number of Ethernet unicast IP packets received since the
last test restart.
Rx Router Advertisements
Transmitted Packets
√
Tx Router Solicitations
Unicast Packets
√
Ethernet, IP, TCP/UDP, Fibre Chan., VoIP, and Video Testing Manual 365
Chapter 13 Test Results
Ethernet, IP, TCP/UDP, and Fibre Channel results
L3 Filter Stats results
Table 62 lists the L3 Filter Stats results for filtered traffic such as the average
packet rate, peak packet rate, and the maximum, minimum, and average
packet sizes. L3 Filter Stats and Filter Counts exclude errored frames.
Table 62 L3 Filter Stats results
Test Result
Description
Packet Rate
Average
– The average rate of filtered packets, calculated over the time period elapsed since
the last test restart.
Current
– The current rate of filtered packets. This measurement is an average taken over the
prior second of test time.
Minimum
– The minimum rate of filtered packets over a one second period.
Peak
– The maximum rate of filtered packets over a one second period.
The packet rate is expressed in packets per second.
Packet Size
Average
– The average size of filtered packets since IP packet detection.
Minimum
– The minimum size of filtered packets since IP packet detection.
Maximum
– The maximum size of filtered packets since IP packet detection.
Rx Mbps, Cur L3
The current bandwidth utilized by filtered IP traffic expressed in megabits per second.
This measurement is an average taken over the prior second of test time.
Total Util %
Average
– The average bandwidth utilized by filtered IP traffic. This measurement is an average
taken over the prior second of test time.
Current
– The current bandwidth utilized by filtered IP traffic.
Minimum
– The minimum bandwidth utilized by filtered IP traffic since the last test restart.
Peak
– The peak bandwidth utilized by filtered IP traffic since the last test restart.
Bandwidth utilization is expressed as a percentage of the line rate of available bandwidth.
L3 Filter Counts results
Table 63 describes each of the L3 Filter Counts results for filtered traffic such
as the number of received IP packets, and the number of received packets with
an Acterna payload.
Table 63 L3 Filter Counts results
Test Result
IPv4
IPv6
Description
>1500 Byte Packets
√
√
A count of filtered Ethernet IP packets with a length greater than
1500 bytes.
1024-1500 Byte Packets
√
√
A count of filtered Ethernet IP packets with lengths between 1024
and 1500 bytes, inclusive.
128-255 Byte Packets
√
√
A count of filtered Ethernet IP packets with lengths between 128
and 255 bytes, inclusive.
366
Ethernet, IP, TCP/UDP, Fibre Chan., VoIP, and Video Testing Manual
Chapter 13 Test Results
Ethernet, IP, TCP/UDP, and Fibre Channel results
Table 63 L3 Filter Counts results (Continued)
Test Result
IPv4
IPv6
Description
20-45 Byte Packets
√
√
A count of filtered Ethernet IP packets with lengths between 20
and 45 bytes, inclusive.
256-511 Byte Packets
√
√
A count of filtered Ethernet IP packets with lengths between 256
and 511 bytes, inclusive.
46-63 Byte Packets
√
√
A count of filtered Ethernet IP packets with lengths between 46
and 63 bytes, inclusive.
512-1023 Byte Packets
√
√
A count of filtered Ethernet IP packets with lengths between 512
and 1023 bytes, inclusive.
64-127 Byte Packets
√
√
A count of filtered Ethernet IP packets with lengths between 64
and 127 bytes, inclusive.
Broadcast Packets
√
√
The number of filtered Ethernet broadcast IP packets received
since the last test restart.
Multicast Packets
√
√
The number of filtered Ethernet multicast IP packets received
since the last test restart.
Received Packets
√
√
A count of filtered IP packets received since the last test restart,
including errored packets.
Unicast Packets
√
√
The number of filtered Ethernet unicast IP packets received since
the last test restart.
L3/IP Config Status results
Table 64 describes the L3 Config Status or IP Config Status results associated
with the assignment of static IP addresses, or the assignment if IP addresses
by a DHCP server.
Table 64 L3/IP Config Status results
Test Result
IPv4
IPv6
Description
Data Mode
√
Destination IP Address
√
√
Displays the destination IP address as defined for the currently
selected port.
Destination MAC Address
√
√
Displays the hardware (MAC) address of either the gateway or the
destination host as resolved by ARP for the currently selected port.
IP Gateway
√
√
Displays the Gateway address assigned by the DHCP server for
the currently selected port.
IP Subnet Mask
√
Indicates whether you are testing in IPoE or PPPoE mode.
Displays the Subnet mask assigned by the DHCP server for the
currently selected port.
Ethernet, IP, TCP/UDP, Fibre Chan., VoIP, and Video Testing Manual 367
Chapter 13 Test Results
Ethernet, IP, TCP/UDP, and Fibre Channel results
Table 64 L3/IP Config Status results (Continued)
Test Result
IPv4
IPv6
Description
PPPoE Status
√
Displays one of the following messages that indicate the current
status of the PPPoE session:
– INACTIVE
– PPPOE ACTIVE
– PPP ACTIVE
– PPPOE UP
– USER REQUESTED INACTIVE
– PPPOE TIMEOUT
– PPPOE FAILED
– PPP LCP FAILED
– PPP AUTHENTICATION FAILED
– PPP IPCP FAILED
– PPP UP FAILED
– INVALID CONFIG
Source IP Address
√
Displays the IP address assigned by the DHCP server to the currently selected port.
Src Global IP Address
√
Displays the global address assigned to the instrument manually,
or during the auto-configuration process for IPv6 connections.
Src Link-Local IP Address
√
Displays the link local address of the instrument if you are running
an IPv6 application. DAD (duplicate address detection) must
determine that there are no other devices with the link local
address before the address appears.
Subnet Prefix Length
√
Displays the subnet prefix length used to generate the required
IPv6 global address for the instrument.
Preferred DNS Address
√
√
The address of the preferred DNS server.
Alternate DNS Address
√
√
The address of the alternate DNS server.
Resolved Name
√
√
The resolved hostname. (The domain name associated with the IP
address.)
Ping results
Table 65 describes the Ping results associated with the transmission of
Ethernet Ping packets.
Table 65 Ping results
Test Result
Description
Delay, Avg (ms)
The round trip delay for all pings sent and successfully received by the Transport Module
since the last test restart. Calculated in milliseconds.
Delay, Max (ms)
The maximum round trip delay for the pings sent and successfully received by the
Transport Module. Calculated in milliseconds.
Delay, Min (ms)
The minimum round trip delay for the pings sent and successfully received by the
Transport Module. Calculated in milliseconds.
DNS Errors
Count of the DNS errors received during the course of trying to ping the host.
Lost Pings
Count of Ping requests sent by the Transport Module for which replies were not received
within 3 seconds.
Lost Pings, %
The percentage of the total test seconds during which replies were not received within 3
seconds.
368
Ethernet, IP, TCP/UDP, Fibre Chan., VoIP, and Video Testing Manual
Chapter 13 Test Results
Ethernet, IP, TCP/UDP, and Fibre Channel results
Table 65 Ping results (Continued)
Test Result
Description
Ping Replies Rx
Count of the ping replies received in response to the ping requests sent by the
Transport Module.
Ping Replies Tx
Count of the ping replies sent from the MSAM.
Ping Requests Rx
Count of the ping requests received by the Transport Module (in other words, requests sent
to the Transport Module’s IP address) from another Layer 3 device on the network.
Ping Requests Tx
Count of the ping requests sent from the Transport Module.
Traceroute results
Table 66 describes the results associated with the Traceroute application.
Table 66 Traceroute results
Test Result
Description
Delay (ms)
The round trip delay for the packet. Calculated in milliseconds.
Hop
Displays the hop number for each hop the packet takes while crossing the circuit.
IP Address
Displays the destination IP address for the packet.
PCS Error Stats
Table 67 lists and describes each of the test results available in the PCS Error
Stats result category.
Table 67 PCS Error Stats
Test Result
Description
Alignment Marker Loss
Seconds
Number of seconds during which Alignment Markers were not detected since initial frame
synchronization.
Alignment Marker Lock
Present
Alignment Marker Lock condition currently being detected.
Alignment Marker Lock
History
Alignment Marker Lock condition detected and then lost at some time since initial frame synchronization.
Invalid Alignment Markers
A count of the number of Invalid Alignment Markers since initial frame synchronization.
Invalid Alignment Markers
Rate
The ratio of the sum of Invalid Alignment Markers, across all lanes, to the sum of all Alignment Markers, across all lanes, since initial frame synchronization.
Invalid Alignment Marker
Seconds
A count of the number of seconds containing at least one Invalid Alignment Marker, any
lane, since initial frame synchronization.
BIP-8 AM Bit Errors
A count of the sum of BIP-8 bit errors, across all lanes, since initial frame synchronization.
BIP-8 AM Bit Errors Rate
The ratio of the sum of BIP-8 bit errors, across all lanes, to the total number of Alignment
Markers, across all lanes, since initial frame synchronization.
BIP-8 AM Bit Error Seconds
A count of the number of seconds containing at least one BIP-8 AM Bit Error since initial
frame synchronization.
BIP-8 AM Block Errors
A count of the sum total of BIP-8 Block Errors across all lanes since initial frame synchronization.
BIP-8 AM Block Errors
Rate
The ratio of the sum of BIP-8 block errors, across all lanes, to the total number of Alignment
Markers since initial frame synchronization.
Ethernet, IP, TCP/UDP, Fibre Chan., VoIP, and Video Testing Manual 369
Chapter 13 Test Results
Ethernet, IP, TCP/UDP, and Fibre Channel results
Table 67 PCS Error Stats (Continued)
Test Result
Description
BIP-8 AM Block Error Seconds
A count of the number of seconds containing at least one BIP-8 AM Block Error since initial
frame synchronization.
Maximum Skew (bits)
The maximum skew (in bits) between lanes that was detected since Alignment Marker Lock.
LOA (Deskew)
Loss of Alignment of the lanes due excessive interlane skew or invalid Alignment Marker
data.
Maximum Skew (ns)
The maximum skew (in ns) between lanes that was detected since Alignment Marker Lock.
Current Maximum Skew
(bits)
The maximum inter-lane skew (in bits) that was detected during the period specified for error
insertion.
Current Maximum Skew
(ns)
The maximum inter-lane skew (in ns) that was detected during the period specified for error
insertion.
HI BER Seconds
A count of the number of seconds where High Bit Error Rate (HI BER) was detected in the
Sync Bits since initial frame synchronization.
HI BER Present
A High Bit Error Rate (HI BER) was detected in the the Sync Bits since initial frame synchronization.
HI BER History
A High Bit Error Rate (HI BER) was detected in the the Sync Bits at some time in the past
after initial frame synchronization.
PCS Block Errors
A count of the number of PCS Block Errors since initial frame synchronization.
PCS Block Error Rate
The ratio of the sum of block errors to the total number of blocks since initial frame synchronization.
PCS Block Error Seconds
A count of the number of seconds containing at least one PCS Block Error since initial frame
synchronization.
Ethernet Per Lane results
Table 68 lists and describes each of the test results shown in the Ethernet Per
Lane display when performing Ethernet testing. These results appear in a
different category depending on the application: for single stream apps, they
appear in the Ethernet category, in the multiple stream app, they appear under
the link category
Table 68 Ethernet Per Lane results
Test Result
Description
Max Skew VL ID
Shows Virtual Lane ID for virtual lane having the greatest skew.
Min Skew VL ID
Shows Virtual Lane ID for virtual lane having the least skew.
Max Skew (ns)
Shows skew value in nsecs for virtual lane having the greatest skew.
Max Skew (bits)
Shows skew value in bits for virtual lane having the greatest skew.
Lane #
Shows the virtual Lanes in the signal:40G- #0 - #3, 100G- #0 -#19.
Virtual Lane ID
Shows Lane ID for each virtual lane.
Skew (bits)
Shows skew value in bits for each virtual lane.
Skew (ns)
Shows skew value in nsecs for each virtual lane.
Sync Acquired
Display of sync acquisition status for each virtual lane.
Marker Lock
Display of marker lock status for each virtual lane.
370
Ethernet, IP, TCP/UDP, Fibre Chan., VoIP, and Video Testing Manual
Chapter 13 Test Results
Ethernet, IP, TCP/UDP, and Fibre Channel results
Table 68 Ethernet Per Lane results (Continued)
Test Result
Description
Code Violations
Count of number of code violations for each virtual lane.
Invalid Alignment Markers
Count of the number of invalid alignment markers for each virtual lane.
BIP-8 AM Bit Errors
Count of number of BIP-8 AM Bit errors for each virtual lane.
BIP-8 AM Block Errors
Count of number of BIP-8 AM Block errors for each virtual lane since the start of the test.
Figure 111Ethernet Per Lane Results Table
Error Stats results
Error Stats (Layer 1 BERT)
The Error Stats category lists error statistics such as the number of bit errors,
FCS or CRC errored frames, jabbers, runts, and code violations for the Layer 1
BERT, and Layer 2 traffic test applications.
Table 69 describes the test results for the Layer 1 BERT patterns.
Table 69 Error Stats results (B Seed, A Seed, and PRBS31 patterns)
Pattern 1B Seed
Pattern 2A Seed
Pattern 3 PRBS31
Test Result
Description
Bit Error Rate
The ratio of pattern bit errors to received
pattern bits since initially acquiring pattern synchronization.
√
Bit Errors
A count of the number of received bits in
a recognized pattern that do not match
the expected value.
√
Code Violation Rate
The ratio of code violations to bits
received since the last test restart.
√
√
Code Violation Seconds
A count of the number of seconds during
which code violations occurred.
√
√
Code Violations
A count of each invalid 66-bit code word
in the bit stream due to synchronization
header errors.
For 10GigE and 10G Fibre Channel
streams, code words with PCS block
errors are also counted as code violations.
√
√
Error- Free Seconds,%
The percentage of seconds that the
received pattern is error free.
Delay
√
Ethernet, IP, TCP/UDP, Fibre Chan., VoIP, and Video Testing Manual 371
Chapter 13 Test Results
Ethernet, IP, TCP/UDP, and Fibre Channel results
Table 69 Error Stats results (B Seed, A Seed, and PRBS31 patterns) (Continued)
Pattern 1B Seed
Pattern 2A Seed
Pattern 3 PRBS31
Test Result
Description
Errored Seconds
A count of the number of seconds that
the received pattern contained at least
one error.
√
Error-Free Seconds
A count of the number of seconds the
pattern is received without any errors.
√
Pattern Errors
A count of the number of received patterns that do not match the expected
pattern.
√
√
Pattern Error Rate
The ratio of pattern errors to received
patterns since initially acquiring pattern
synchronization.
√
√
Pattern Error- Free Seconds, %
The percentage of seconds that the
received pattern is error free.
√
√
Pattern Errored Seconds
A count of the number of seconds that
the received pattern contained at least
one error.
√
√
Pattern Error-Free Seconds
A count of the number of seconds the
pattern is received without any errors.
√
√
Pattern Loss Seconds
A count of the number of seconds during
which pattern synchronization is lost.
√
√
Total Bits Received
A count of the total number of bits
received since the last test restart.
Pattern Sync Losses
Count of the number of times pattern
synchronization was lost since initially
acquiring pattern synchronization.
√
Pattern Sync Loss Seconds
Count of the number of seconds during
which pattern synchronization was lost
since initially acquiring pattern synchronization.
√
Round Trip Delay,
Current
The current round trip delay calculated
in microseconds. This measurement is
an average taken over the prior second
of time.
√
Round Trip Delay,
Average
The average round trip delay measured
since starting the test, calculated in
microseconds.
√
Round Trip Delay,
Minimum
The minimum round trip delay measured
since starting the test, calculated in
microseconds.
√
Round Trip Delay,
Maximum
The maximum round trip delay measured since starting the test, calculated
in microseconds.
√
372
Delay
√
√
Ethernet, IP, TCP/UDP, Fibre Chan., VoIP, and Video Testing Manual
Chapter 13 Test Results
Ethernet, IP, TCP/UDP, and Fibre Channel results
Error Stats (Layer 2 Traffic)
For Layer 2 Ethernet and Fibre Channel test applications, to view the Layer 2
Error Stats results described in Table 70, set the result category to Error Stats.
Table 70 Error Stats results (Layer 2 traffic)
Test Result
Description
Alignment Errors
A count of the number of frames received containing both a framing error and an FCS
error. Only applicable when testing on 10/100 Mbps circuits.
Alignment Marker Loss Seconds
A count of the seconds since the last valid alignment marker.
Block Sync Losses (PCS)
Count of the number of instances when block synchronization was lost since the last
test start or restart. Only applicable when running 10 GigE applications.
Code Violation Rate
The ratio of code violations to bits received since the last test restart.
Code Violation Seconds
A count of the number of seconds during which code violations occurred.
Code Violations
A count of each invalid 66-bit code word in the bit stream due to synchronization
header errors.
For 10GigE and 10G Fibre Channel streams, code words with PCS block errors are
also counted as code violations.
CRC Errored Frames
A summed count of Fibre Channel frames containing Cyclic Redundancy Check (CRC)
errors. When receiving Fibre Channel jumbo frames containing CRC errors, the CRC
error count does not increment. Instead, these frames are counted as Fibre Jabbers.
Errored Blocks (PCS)
Count of the errored blocks received since the last test start or restart. Only applicable
when running 10 GigE applications.
Errored Frames
–
–
For Ethernet, a summed count of FCS Errored Frames, Jabbers, and Undersized
Frames.
For Fibre Channel, a summed count of CRC Errored Frames, Fibre Jabbers, and
Undersized Frames.
FCS Errored Frames
A count of Ethernet frames containing Frame Check Sequence (FCS) errors. When
receiving Ethernet jumbo frames containing FCS errors, the FCS error count does not
increment. Instead, these frames are counted as Jabbers.
Fibre Jabbers
A count of Fibre Channel frames that have a byte value greater than the maximum
2140 frame length and an errored CRC.
Fibre Runts
A count of Fibre Channel frames under the minimum 28 byte frame length containing
CRC errors.
Frame Loss Ratio
The ratio of frames lost to the number of frames expected.
Invalid Alignment Markers
A count of the number of alignment markers lost.
Invalid Alignment Marker Rate
A ratio of the number of alignment marks lost to the total number of markers.
Invalid Alignment Marker Seconds
A count of the seconds in which there was at least one invalid alignment marker.
Jabbers
A count of received Ethernet frames that have a byte value greater than the maximum
1518 frame length (or 1522 bytes for VLAN tagged frames or 1526 bytes for Q-in-Q
encapsulated frames) and an errored FCS.
Lost Frames
A count of lost Acterna test frames in the traffic. For example, if the MSAM detects
sequence numbers: 1, 2, 3, 6, 7, 8, (frames 4 and 5 were not detected), the lost frame
count is incremented by two (frames 4 and 5 are lost). If the MSAM then detects
sequence numbers 9, 10, 14, 15, 16 (frames 11, 12, and 13 are missing), the lost frame
count is incremented by three, resulting in a total count of five lost frames.
NOTE: If the MSAM receives frames containing errors in the sequence number field,
the Lost Frames count may be incorrect.
Ethernet, IP, TCP/UDP, Fibre Chan., VoIP, and Video Testing Manual 373
Chapter 13 Test Results
Ethernet, IP, TCP/UDP, and Fibre Channel results
Table 70 Error Stats results (Layer 2 traffic) (Continued)
Test Result
Description
OoS frames
A count of each instance where the MSAM detects out of sequence Acterna test
frames in the filtered traffic. For example, if the MSAM detects sequence numbers: 1, 2,
3, 6, 7, 8, (frame 6 is detected immediately following frame 3), the out of sequence
count is incremented by one, resulting in a count of one instance of out of sequence
frames. If the MSAM then detects sequence numbers 9, 10, 14, 15, 16 (frame 14 is
detected immediately following frame 10), the out of sequence number is incremented
again by one, resulting in a total count of two instances of out of sequence frames.
Runts
A count of Ethernet frames under the minimum 64 byte frame length containing Frame
Check Sequence (FCS) errors.
Symbol Errors
A count of each incorrect 64B/66B block found, as defined by IEEE 802.3ae.
Undersized Frames
A count of frames under the minimum 64 byte with a good FCS.
Error Stats (Layer 3 Traffic)
For layer 3 test applications, to view the layer 3 Error Stats results described
in Table 71, set the result category to Error Stats.
Table 71 Error Stats results (layer 3 traffic)
Test Result
Description
Acterna Payload Errors
A count of received IP packets containing Acterna Payload checksum errors.
NOTE: This result only appears if you receive an Acterna payload.
Code Violation Rate
The ratio of code violations to bits received since the last test restart.
Code Violation Seconds
A count of the number of seconds during which code violations occurred.
Code Violations
A count of each invalid 66-bit code word in the bit stream due to synchronization header
errors.
For 10GigE and 10G Fibre Channel streams, code words with PCS block errors are
also counted as code violations.
Errored Frames
A summed count of FCS Errored Frames, Jabbers, and Undersized Frames.
Errored Second
The number of available seconds during which one or more relevant errors were present.
Errored Second Ratio
The ratio of errored seconds to the number of available seconds.
FCS Errored Frames
A count of Ethernet frames containing Frame Check Sequence (FCS) errors. When
receiving Ethernet jumbo frames containing FCS errors, the FCS error count does not
increment. Instead, these frames are counted as Jabbers.
Frame Loss Ratio
The ratio of frames lost to the number of frames expected.
IP Checksum Errors
A count of received IP packets with a checksum error in the header.
IP Packet Length Errors
A count of received IP packets that exceed the available Ethernet payload field.
Jabbers
A count of received Ethernet frames that have a byte value greater than the maximum
1518 frame length (or 1522 bytes for VLAN tagged frames) and an errored FCS.
Lost Frames
A count of lost Acterna test frames in the traffic. For example, if the MSAM detects
sequence numbers: 1, 2, 3, 6, 7, 8, (frames 4 and 5 were not detected), the lost frame
count is incremented by two (frames 4 and 5 are lost). If the MSAM then detects
sequence numbers 9, 10, 14, 15, 16 (frames 11, 12, and 13 are missing), the lost frame
count is incremented by three, resulting in a total count of five lost frames.
NOTE: If the MSAM receives frames containing errors in the sequence number field,
the Lost Frames count will be incorrect.
374
Ethernet, IP, TCP/UDP, Fibre Chan., VoIP, and Video Testing Manual
Chapter 13 Test Results
Ethernet, IP, TCP/UDP, and Fibre Channel results
Table 71 Error Stats results (layer 3 traffic) (Continued)
Test Result
Description
OoS Frames
A count of each instance where the MSAM detects out of sequence Acterna test frames
in the filtered traffic. For example, if the MSAM detects sequence numbers: 1, 2, 3, 6, 7,
8, (frame 6 is detected immediately following frame 3), the out of sequence count is
incremented by one, resulting in a count of one instance of out of sequence frames. If
the MSAM then detects sequence numbers 9, 10, 14, 15, 16 (frame 14 is detected
immediately following frame 10), the out of sequence number is incremented again by
one, resulting in a total count of two instances of out of sequence frames.
Packet Error Rate
The ratio of lost packets to the number of total packets.
Runts
A count of Ethernet frames under the minimum 64 byte frame length containing Frame
Check Sequence (FCS) errors.
Severely Errored Second
Seconds during which 30% or more of the frames were lost, contained FCS errors, or
Loss of Link was detected.
The following calculation is used to declare an SES:
(FCS Error count + Lost Frame count) / (Frames Received count + Lost Frames) > 0.3.
Severely Errored Second Ratio
The ratio of severely errored seconds to the number of available seconds.
Symbol Errors
A count of each incorrect 64B/66B block found, as defined by IEEE 802.3ae, or
1 Gigabit Ethernet, 1 Gigabit/2 Gigabit Fibre Channel frames with at least one code violation.
Unavailable Second
Unavailable time is defined as ten (10) consecutive severely errored seconds. These
ten seconds are included in the UAS count.
For example, if 12 consecutive SES occur, the UAS count will be 12. If only 3 consecutive SES occur, the UAS count will be zero.
Undersized Frames
A count of frames under the minimum 64 byte with a good FCS.
Capture results
Sync Status Messages
If you capture packets to analyze using Wireshark®, the Capture category
provides a count of the number of packets processed, and displays a gauge
indicating the percent of the buffer that is filled with captured packets.
If you are testing on a SyncE or GigE circuit (except 40GigE or 100GigE), the
Sync Status Messages category provides results related to SyncE testing.
Table 72 describes the test results for the Layer 1 BERT patterns.
Table 72 Sync Status Messages results
Test Result
Description
Decoded QL Message
Decode of the last quality level (QL) message
SSM Message Count
Total
Count of all SSM messages received.
SSM Message Count
Event
Count of the SSM Event messages received.
SSM Message Count
Information
Count of the SSM Information messages received.
SSM Message Count
Malformed
Count of the SSM Malformed messages received.
SSM PDU Rate (pps)
Rate of the PDU (Protocol Data Unit).
Ethernet, IP, TCP/UDP, Fibre Chan., VoIP, and Video Testing Manual 375
Chapter 13 Test Results
Ethernet, IP, TCP/UDP, and Fibre Channel results
On the Summary results page, the “Wrong SSM PDU Rate” result may appear.
This alarm indicates that the PDU rate is slower than 1pps or faster than 10pps.
AutoNeg Status results
The AutoNeg Status category displays results associated with the auto-negotiation of capabilities between two Ethernet devices.
Table 73 describes each of the results for 10/100/1000 links.
NOTE:
AutoNeg Status results only appear when auto-negotiation is turned ON on
the MSAM.
Table 73 AutoNeg Status results
Test Result
Description
1000Base - TX FDX
Indicates that the Ethernet link partner is full duplex capable at 1000Base-TX (YES or
NO).
1000Base - TX HDX
Indicates that the Ethernet link partner is half duplex capable 1000Base-TX (YES or
NO).
100Base-TX FDX
Indicates whether the Ethernet link partner is full duplex capable at 100Base-TX (YES
or NO).
100Base-TX HDX
Indicates whether the Ethernet link partner is half duplex capable at 100Base-TX (YES
or NO).
10Base-TX FDX
Indicates whether the Ethernet link partner is full duplex capable at 10Base-TX (YES or
NO).
10Base-TX HDX
Indicates whether the Ethernet link partner is half duplex capable at 10Base-TX (YES or
NO).
Duplex
Indicates the negotiated duplex setting for the link (half or full).
Link Advt. Status
Indicates that the MSAM has received a valid auto-negotiation capability advertisement
from the Ethernet link partner and sent an acknowledgement.
Link Config ACK
Indicates that the Ethernet link partner has acknowledged the receipt of a valid autonegotiation capability advertisement from the MSAM.
Mstr/Slv Resolution
Indicates whether the Ethernet link partner is operating as the master (providing the
clock for timing), or slave (deriving the clock from the MSAM). Applicable when testing
1000 Base-Tx only.
Remote Fault
If supported by the Ethernet link partner, indicates a reason for auto-negotiation failure.
If auto-negotiation succeeded, the result will read “NO”.
Speed (Mbps)
Indicates the negotiated speed setting for the link (10 or 100 Mbps).
Table 74 describes each of the results for 1 Gigabit Ethernet optical links.
Table 74 1 Gigabit Ethernet Optical AutoNeg Status results
Test Result
Description
FDX Capable
Indicates whether the Ethernet link partner is full duplex capable (YES or NO).
Flow Control
Indicates whether Flow Control is turned On or Off on your unit.
HDX Capable
Indicates whether the Ethernet link partner is half duplex capable (YES or NO).
376
Ethernet, IP, TCP/UDP, Fibre Chan., VoIP, and Video Testing Manual
Chapter 13 Test Results
Ethernet, IP, TCP/UDP, and Fibre Channel results
Table 74 1 Gigabit Ethernet Optical AutoNeg Status results (Continued)
Test Result
Description
Link Advt. Status
Indicates that the MSAM has received a valid auto-negotiation capability advertisement from the Ethernet link partner and sent an acknowledgement.
Link Config ACK
Indicates that the Ethernet link partner has acknowledged the receipt of a valid autonegotiation capability advertisement from the MSAM.
Pause Capable
Indicates the flow control capabilities of the Ethernet link partner. Those capabilities
are:
– Tx Only:
The Ethernet link partner will transmit PAUSE frames to alert the Transport Module
to reduce the transmitted bandwidth momentarily, however it will not reduce its
transmitted bandwidth if it receives PAUSE frames.
– Rx Only:
The Ethernet link partner will reduce its transmitted bandwidth momentarily if it
receives PAUSE frames but it will not transmit PAUSE frames to alert the
Transport Module to reduce the transmitted bandwidth.
– Both Rx and Tx:
The Ethernet link partner will transmit PAUSE frames to alert the Transport Module
to reduce the transmitted bandwidth momentarily and it will reduce its transmitted
bandwidth momentarily if it receives PAUSE frames
– Neither Rx or Tx:
The Ethernet link partner will not transmit PAUSE frames to alert the
Transport Module to reduce the transmitted bandwidth and it will not reduce its
transmitted bandwidth if it receives PAUSE frames.
Remote Fault
If supported by the Ethernet link partner, indicates a reason for auto-negotiation failure. If auto-negotiation succeeded, the result will read “NO”.
Login Status results
Implicit or Explicit (E-Port) login
The Login Status category displays results associated with the login status
between two Fibre Channel devices.
Table 75 describes each of the results when using an Implicit or Explicit
(E-Port) login.
Table 75 Login Status results - Implicit or Explicit (E-Port) login
Test Result
Description
Login Status
Indicates the status of the Fibre Channel login process by displaying one of the following:
– IN PROGRESS
– COMPLETE
– FAILED/LOOP
RX ELP Accept
Count of accept messages received in response to login requests.
RX ELP Ack1
Count of acknowledgements received in response to login requests or accept/reject
messages.
RX ELP Reject
Count of rejections received in response to login requests.
RX ELP Request
Count of login requests received from another JDSU compliant Ethernet tester or a distance extension device.
TX ELP Accept
Count of accept messages transmitted in response to login requests from another
JDSU compliant Ethernet tester or a distance extension device.
Ethernet, IP, TCP/UDP, Fibre Chan., VoIP, and Video Testing Manual 377
Chapter 13 Test Results
Ethernet, IP, TCP/UDP, and Fibre Channel results
Table 75 Login Status results - Implicit or Explicit (E-Port) login (Continued)
Test Result
Description
TX ELP Ack1
Count of acknowledgements transmitted in response to login requests or accept/reject
messages from another JDSU compliant Ethernet tester or a distance extension
device.
TX ELP Reject
Count of rejections transmitted in response to login requests from JDSU compliant
Ethern