1
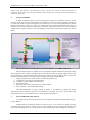
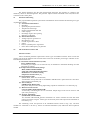
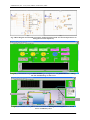
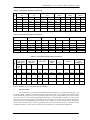
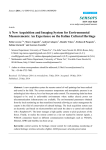
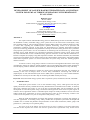
IGHEM-2010, Oct. 21-23, 2010, AHEC, IIT Roorkee, India DEVELOPMENT OF LABVIEW BASED INTEGRATED DATA ACQUISITION SYSTEM FOR PUMP AS TURBINE GENERATOR UNIT PERFORMANCE EVALUATION Rajkumar Viral M.Tech AHES Alternate Hydro Energy Centre Indian Institute of Technology Roorkee, Roorkee-247 667, (India) E-mail: [email protected] S. N. Singh Senior Scientific Officer Alternate Hydro Energy Centre Indian Institute of Technology Roorkee, Roorkee-247 667, (India) E-mail: [email protected] ABSTRACT The rapid evolution of Renewable Energy Sources (RESs) during the last two decades resulted in the installation of many renewable energy power systems all over the world such as small hydro, wind, solar, biomass based etc. The increasing application of these RESs requires use of data acquisition in order to collect data, regarding the installed system operation monitoring, control of its operation and performance evaluation purposes. In this paper, the development of a computer based data acquisition system for monitoring parameters and performance of Pump As Turbine (PAT) generator unit is presented. The proposed system consists of a set of transducers for measuring both non-electrical (e.g. turbine head, discharge, power, speed, efficiency etc.) and electrical parameters (generator voltage, current, power, speed etc.).The collected data are first conditioned using precision electronic circuits and then interfaced to a Personal Computer (PC)/Laptop using data-acquisition modules. The National Instrument (NI) LabVIEW program is used to further process, display and store the collected data in the PC/laptop. The modern feature of this data acquisition system is to access and monitor the system using more user friendly graphical interface software. In context to above, using pump as turbine is an attractive and significant alternative in the range of small hydro. Pumps are relatively simple machines with no special designing and are readily available in most developing countries. Besides, their installation, commissioning & maintenance are easy and cheap. The proposed architecture permits the rapid system development and has the advantage of flexibility in the case of changes, while it can be easily extended for monitoring and control I/O (Input/output) of PAT based Small Hydro Power (SHP) station operation by some essential hardware modifications. This may be also led to help in monitoring the SHPs remotely/wirelessly. Keywords: PAT; Renewable Energy System; Data- acquisition system; Transducers; Internet; LabVIEW. 1. INTRODUCTION Small hydro power stations is one of the renewable energy source, which grown from the past rapidly and used to electrify isolated and remotely distributed rural communities like in India. To electrify these areas, mini/micro/pico hydro is one of the best conventional RESs; but the installation cost and development of such kind of plants using conventional turbine-generator units seems not quite logical. In context to above, application of PAT is a feasible option. Pumps are readily available in various sizes. Past studies found many applications of PAT in mini/micro/pico hydro in most developing countries. The overall cost of such plants is very low as compared to other plants [1, 2 &3]. With the rapid developments of internet and computer technologies, accessing and operating of real time applications is becoming reality. Many modern data acquisition system have developed and available now to evaluate the parameter and performance of such kind of machines (turbine, pumps and generator etc.), when they are in operation [4&5]. This paper is set out as follows; the second section of paper is emphasis on the PAT background. The third section acquaints the readers with the PAT generator unit experimental setup. Fourth section 127 IGHEM-2010, Oct. 21-23, 2010, AHEC, IIT Roorkee, India familiar with data collection and interfacing process. Section five focuses on data representation in LabVIEW. Sixth section shows the experimental results and discussion. The last section summarizes the conclusion of the paper. 2. PUMP AS TURBINE In many developing countries, the micro hydropower stations are in demand, specially in remote locations. In the range of micro hydro standard size of turbine are not easily and economically available. So we need same machine for each site but pumps are available in no. of size, covering different range of head, discharge and capacity. Clearly, says pump is a suitable option for meeting the demand in micro hydro if running in reverse mode. Except the micro hydro nowadays, applications of PAT have been developed in villages, farms, irrigation systems, as pressure dropping valves and as small pump storage power stations [6&7]. Specifications of PAT Test RIG Water Lifting Pump Total head: 32.8m Flow rate: 14.5 lps Pump input: 8.18kW Speed: 1450 rpm *Motor pump of 30 H.P, can produce maximum head of 60 m at 24.0 lps Tank Size: (1.35x1.35x1.6m) Generator Type Synchronous Terminal voltage: 415V Reactive power: 12.5 KVA Active power: 10 kW Power factor: 0.8 Frequency: 50 Hz Speed: 1500 rpm Fig. 3(a) Schematic of Test Rig (Hydro mechanical laboratory at AHEC IIT Roorkee) Small centrifugal pumps are suitable for use as hydraulic turbines and have the advantage of being mass produced in many countries throughout the world. When used with an integral induction motor, they can be installed as a combined turbine and generator unit. Pumps are mass-produced, and as a result, have the following advantages for micro-hydro power compared with purpose-made turbines. i. Integral pump and motor can be used as a turbine and generator set ii. Available for a wide range of heads and flows iii. Available in a large number of standard sizes iv. Short delivery time v. Spare parts such as seals and bearings are easily available vi. Easy installation - uses standard pipe fittings The main disadvantage of using a pump as turbine is the difficulty of finding the turbine characteristics that are needed to select the correct pump for a particular site [8]. It is also possible to plot the performance curve for PAT which assists in PAT operation and selection. 3. PAT GENERATOR TEST SETUP A complete test rig of a PAT generator (directly coupled) is installed in Alternate Hydro Energy Centre (AHEC), Indian Institute of Technology, Roorkee as shown in Fig. 3 (a). It consists of a metallic open tank, a constant speed pump motor set, a flow meter, two flow regulating valves (one motorsied control valve) and a turbine (pump) generator set. The pump draws water from the open tank and supplies to the turbine. 128 IGHEM-2010, Oct. 21-23, 2010, AHEC, IIT Roorkee, India The turbine discharges into the same tank through draft tube. The generator is coupled to the turbine by means of shaft arrangement. The generator output terminal connected to the load, and it also connected to the control panel. 3.1 Parameter Measuring The proposed data acquisition system under consideration used to measure the following two types of parameters namely: (i) Non-electrical Parameters Discharge Speed of pump and Generators Temperature of bearings Pressure measurement inlet and outlet of pump Percentage of gate valve opening Efficiency of the PAT (ii) Electrical Parameters Voltage output of generator of three phases in r.m.s. Current of generator in three phases kW, kVA,kVAR power of generator Power factor and frequency of generator 3.2 The Transducers/sensors and Interface Circuits Above mentioned parameter required the various type of transducers/sensors which convert the primary non electrical quantities into electrical which can be use for further processing to interface circuit. The transducers/sensors are: (i) Ultrasonic Transit Time Flow (UTTF) meter (Model PT878) Transducer gives output 0-10 V and 4-20 mA, for minimum to maximum discharge for each particular set [9 &10]. (ii) Temperature measurement (Omega Made, Model OS530E/OS520E) Using non contact infrared temperature thermometer are used for bearing temperature measurement [11]. (iii) Speed measurement (TIMIC Made, MOC 7811/TCST2103} A slotted disc of sixty teeth with 21 cm diameter and MOC7811 optical sensor are used. Give analog output of 0-5/20mA [12]. (iv) Power Analyser (HIOKI Made, Model 3165) One power analyzer sensor having eight analog outputs all of them have 2 V/ full scale [13]. (v) Motorised Control Valve (AVCON Made, Model MV5512A/B) A electrically controlled gate valve is monitored. Output ranges 4-20 mA for closed to full open valve position [14]. (vi) Pressure Transmitter (SMAR made, Model LD301) Two Absolute LD301model pressure transmitters are used to measure the inlet and outlet pressure of turbine in kg/cm2. Which give the necessary head. The output of the transmitter is in 0-20mA [15]. The interfacing circuit and position of all transducers/sensors shown in Fig. 3(b). All these modules are connected to the PC by means of National Instruments (NI) USB 6212 data acquisition module. 129 IGHEM-2010, Oct. 21-23, 2010, AHEC, IIT Roorkee, India Fig. 3(b) Block diagram of interfacing circuit and position of various transducer/sensors Fig.3(c) show the actual pictures of the of Experimental test setup comprising various above mentioned equipments. Fig. 3(c) Experimental setup Fig. 3(d) Actual experimental test setup 4. DATA COLLECTION AND PROCESSING INTERFACE As in Fig. 3(b) the data received by instruments (sensors) is to be transferred to NI USB-6212. The NI USB-6212, M Series is a low-cost multifunction DAQ board optimized for cost-sensitive applications, all the data is communicated to this specific DAQ module through 16 analog input channels as shown in Fig. 3(b) & 4. The NI USB-6212 series is a family of network data acquisition providing analog I/O, digital I/O (input/output), timer/counter and other functions. Also consider the high-speed M Series devices for 5X faster sampling rates or the high-accuracy M Series devices for 4X resolution and superior measurement accuracy [16 &17]. Fig.4 NI USB 6212 module 130 IGHEM-2010, Oct. 21-23, 2010, AHEC, IIT Roorkee, India 4.1 Specification of NI USB 6212 [18] Analog Input Channels Sample Rate Max Voltage Range Minimum Voltage Rang Analog Output Channels Max O/P Voltage Digital I/O Bidirectional Channels Counter/Timers Resolution Power Requirement 16 400 kS/s -10V, 10V -200mV, 200mV 2 10 V 32 2 16bit 4.5-5.25V (No external Power, in configured state via USB Port) All transducers output connected to the analog input of NI 6212 card between A0-A15 (as shown in Fig.3(b)).The output of this card transferred to the PC by USB port. This can be read further by LabVIEW software. 5. DATA REPRESENTATION The data-acquisition card is controlled by a properly developed interface, using the LabVIEW software, running on the PC. It consists of two parts first is a graphical environment with components such as displays, buttons and charts in order to provide a convenient-to-use environment for the system operator called front panel, and second is the program code, which is in block-diagram format and consists of builtin virtual instruments (VIs) performing functions such as analog channel sampling, mathematical operations, file management etc. The LabVIEW 8.6 software runs under the Windows 95/98/NT/2000 operating system or earlier than [19, & 20]. It contains Dials, Graphs etc. to display the parameters. LabVIEW is programmed to sense change in parameters every second and according to that display on the screen. The screen contains block diagram for each parameter measurement, which can be seen, after stop the program, it shows the virtual form of cable connection and the values of data at each stage of transfer. The greater reliability of LabVIEW program is that it can be access through internet using its web publishing tool in tool menu. This tool allows modifying the look of the document in the web browser. Title, Header, and Footer text and the previewing the document in web browser, then click save to disk. This is saved to the .html file to the www directory. Name and save the file then click ok. This will bring up another window giving the URL name of the document for putting in the web browser. The sample code block diagram and the final user’s monitoring screen developed in LabVIEW program is illustrated in Fig.5 (a&b), (c) respectively. The front panel in Fig.5(d) also show the real time discharge Vs time and Efficiency Vs Power output Characteristic. 6. EXPERIMENTAL RESULTS & DISCUSSION The PAT generator unit set monitored through LabVIEW software and manually. The numerical values of various parameters are given in the table 6 (a), (b) & (c). Table 6 (a & b) shows the Electrical parameter reading measured manually and using software on PC/laptop. Similarly, table 6(c & d) represent the Non-electrical parameters. The front panel also show the real time discharge Vs time and Efficiency Vs Power output Characteristic , which could easily help to evaluation of performance of PAT generator unit set. The results clearly shows that the IDAS are give accurate and correct results. It is also show deviation in LabVIEW reading (PC Reading) and Meter Readings (M.R). 131 IGHEM-2010, Oct. 21-23, 2010, AHEC, IIT Roorkee, India (a) (b) Fig. 5 Block diagram of LabVIEW program for monitoring Electrical & Non-electrical parameters of PAT generator unit respectively Fig. 5 (c) LabVIEW Front panel-I for monitoring of PAT generator unit parameters after running the unit with Discharge vs Time curve Power Vs efficiency Plot Discharge Vs time Fig. 5 (d) LabVIEW Front panel-II after few minute of starting the of PAT generator unit with Power vs Efficiency curve 132 IGHEM-2010, Oct. 21-23, 2010, AHEC, IIT Roorkee, India Table 6 (a) Electrical parameters monitored S. No. V1 Ph-1 (V) M.R* P C * V2 Ph-2 (V) M . R P V3 Ph-3 (V) M . R P I1 Ph-1 (mA) M.R P C I2 Ph-2 (mA) M.R P C I3 Ph-3 (mA) M.R P C 1 256.2 255.35 256.3 255.67 257.00 256.8 106 100 97 90 70 60 2 247.7 247.62 247.8 247.46 248.20 248.55 882 870 887 870 918 910 3 229.3 230.17 230.2 230.23 230.50 231.25 2379 2370 2412 240 2445 2440 4 5 225.2 237.0 225.53 237.83 225.2 238 225.51 237.92 224.34 238 .00 225.34 238.96 2345 860 2340 850 3150 857 3100 850 3175 900 3170 890 C C (M.R*.-Meter Reading, P.C.-LabVIEW Reading) Table 6 (b) Electrical parameters monitored Poutput kW M.R kVA PC 0.200 0.610 0.980 1.400 1.690 0.201 0.698 0.980 1.401 1.690 M.R kVAr PC 0.069 0.663 1.665 1.940 0.614 M.R 0.07 0.67 1.69 1.92 0.60 0.063 0.160 0.450 1.195 0.624 Pf PC 0.06 0.18 0.41 1.98 0.63 M.R 0.421 0.987 0.993 0.222 0.103 Hz PC 0.370 0.960 0.980 0.280 0.107 M.R 56.2 54.4 50.6 49.6 48.4 PC 56.13 54.40 50.64 49.41 48.56 S.No. Table 6 (c) Non-Electrical parameters monitored 1 Percent of gate valve opening (%) Scale PC Readi ng 100 80.15 Pressure of inlet valve (kg/cm²) M.R PC 3.40 3.43 2 3 90 90 80.15 80.15 3.59 3.71 3.57 3.67 4 85 80.15 3.80 3.78 5 95 80.15 4.14 4.12 Discharge (Q, m³/sec) *PInput= 9.81QH (kW) Efficienc y η (%) PC R.P.M of turbine M.R PC Temperature of the bearings (ºC) M.R PC M.R PC 0.019 5 0.020 0.021 9 0.022 4 0.023 2 0.0193 6.504 3.075 1683 1682 39 40.10 0.020 0.0217 7.043 7.970 8.660 12.295 1634 1523 1633 1519 44 52 43.00 51.10 0.0221 8.350 16.765 1491 1485 56 55.20 0.0230 9.422 17.936 1567 1563 58 57.50 (*PInput, & H is calculated by software for Efficiency evaluation which can be directly observe and represent in Power vs Efficiency curve on the Front panel of LabVIEW 7. CONCLUSION The development of a computer based IDAS for PAT generator set is analyzed in this paper. The proposed method is based on precision electronic circuits and an easy-to-use graphical environment, based on the LabVIEW program, for processing, displaying and storing the collected data. The system operator can easily process of the measured parameters and evaluate the performance (efficiency) of the system directly from the user front panel of LabVIEW in very short time. The system can be monitor remotely by using internet and web publishing tool of LabVIEW. It is helpful in monitor the PAT based small hydro power plants (mini/micro/pico); which is generally located at remote and isolate places. The IDAS can be extended in future for control the I/O remotely of PAT generator by some hardware modification. 133 IGHEM-2010, Oct. 21-23, 2010, AHEC, IIT Roorkee, India REFERENCES [1] A. Nourbakhsh, G. Jahangiri, “Inexpensive small hydropower stations for small areas of developing countries, in: Conference on Advanced in Planning-Design and Management of Irrigation Systems as Related to Sustainable Land use”, Louvain, Belgium, 1992, pp. 313–319. [2] Benghanem M, Maafi A., “Data acquisition system for photovoltaic systems performance monitoring”. IEEE Trans. Instrument. Meas. 1998; 47:30–3. [3] Benghanem M, Arab AH, Mukadam K., “Data acquisition system for photovoltaic water pumps”, Renewable Energy 1999; 17:385–96. [4] Wichert B, Dymond M, Lawrance W, Friese T., “Development of a test facility for photovoltaic– diesel hybrid energy systems”, Renewable Energy 2001; 22:311–9. [5] Koutroulis E.; Kalaitzakis K., “Development of an integrated data-acquisition system for renewable energy sources systems monitoring”, Renewable Energy, vol. 28, 2003, pp. 139-152. [6] Kraub A, Weimar U, Gopel W. “LabView for sensor data acquisition”, Trends Anal. Chem.1999; 18:312–8. [7] Derakhshan Shahram; Nourbakhsh Ahmad, “Experimental study of characteristic curves of centrifugal pumps working as turbines in different specific speeds, Experimental thermal and fluid science”, vol. 32 2008, pp.800-807. [8] Williams A. A, “pump as turbine for low cost micro hydro power”, WREC-1996, pp1227-1234. [9] GE Infrastructure Sensing, Transport Model PT878, “Panametrics Portable Liquid Flowmeter”, User’s Manual, March 2005. [10] “PT878 Portable Liquid Flowmeter”, Operation & Installation Guide 910-219B2, GE Panametrics, Dec. 2008. [11] Quick Start Manual, “Handheld Infrared Thermometer”, Omega Instruments, http://www.omega.com/Manuals/manualpdf/QSM4088.pdf,Jan-2009. [12] “Optocoupler data book”, TEMIC Semiconductor, http://www.datasheetarchive.com/MOC7811- datasheet.html, 1996. [13] Instruction manual, “CLAMP ON DIGITAL Hi TESTER 3165”, http://www.hioki.com/discon/pdf/power/3165.pdf, 1994. [14] “DATASHEET MODEL MV 5512A/B 2/2-Way Motorised Control Valves with Electric Actuator”, www.avconindia.com, http:// www. avconindia.com/ catalog_5512 ab.html, Jan. 1981. [15] LD-301, “Manual for smart pressure transmitter”, www.smar.com, Dec.2008. [16] User Manual M series about NI 622xDevices. Jun -2007 [17] Getting Start user manual NI 622x Devices. Jun -2009 [18] NI DAQ max and DAQ device installation guide, Jun.-2009. [19] User manual “LabView”, National Instruments, July- 2008. [20] User manual “LabView”, National Instruments, July- 2009. 134