1
Revision D
3-9000-745
October 2010
MON 20/20
Software for Gas Chromatographs
Applies to all Emerson XA Series Gas Chromatographs
MON 20/20 Software for Gas Chromatographs
User Manual
NOTICE
DANIEL MEASUREMENT AND CONTROL, INC.
AND ROSEMOUNT ANALYTICAL
(COLLECTIVELY, “SELLER”) SHALL NOT BE LIABLE FOR TECHNICAL OR EDITORIAL
ERRORS IN THIS MANUAL OR OMISSIONS FROM THIS MANUAL. SELLER MAKES NO
WARRANTIES, EXPRESSED OR IMPLIED, INCLUDING THE IMPLIED WARRANTIES OF
MERCHANTABILITY AND FITNESS FOR A PARTICULAR PURPOSE WITH RESPECT TO
THIS MANUAL AND, IN NO EVENT, SHALL SELLER BE LIABLE FOR ANY SPECIAL OR
CONSEQUENTIAL DAMAGES INCLUDING, BUT NOT LIMITED TO, LOSS OF
PRODUCTION, LOSS OF PROFITS, ETC.
PRODUCT NAMES USED HEREIN ARE FOR MANUFACTURER OR SUPPLIER
IDENTIFICATION ONLY AND MAY BE TRADEMARKS/REGISTERED TRADEMARKS OF
THESE COMPANIES.
THE CONTENTS OF THIS PUBLICATION ARE PRESENTED FOR INFORMATIONAL
PURPOSES ONLY, AND WHILE EVERY EFFORT HAS BEEN MADE TO ENSURE THEIR
ACCURACY, THEY ARE NOT TO BE CONSTRUED AS WARRANTIES OR GUARANTEES,
EXPRESSED OR IMPLIED, REGARDING THE PRODUCTS OR SERVICES DESCRIBED
HEREIN OR THEIR USE OR APPLICABILITY. WE RESERVE THE RIGHT TO MODIFY OR
IMPROVE THE DESIGNS OR SPECIFICATIONS OF SUCH PRODUCTS AT ANY TIME.
SELLER DOES NOT ASSUME RESPONSIBILITY FOR THE SELECTION, USE OR
MAINTENANCE OF ANY PRODUCT. RESPONSIBILITY FOR PROPER SELECTION, USE
AND MAINTENANCE OF ANY SELLER PRODUCT REMAINS SOLELY WITH THE
PURCHASER AND END-USER.
DANIEL AND THE DANIEL LOGO ARE REGISTERED TRADEMARKS OF DANIEL
MEASUREMENT AND CONTROL, INC. ROSEMOUNT AND THE ROSEMOUNT
ANALYTICAL LOGO ARE REGISTERED TRADEMARKS OF ROSEMOUNT ANALYTICAL.
THE EMERSON LOGO IS A TRADEMARK AND SERVICE MARK OF EMERSON ELECTRIC
CO.
COPYRIGHT © 2010 BY DANIEL MEASUREMENT AND CONTROL, INC., HOUSTON,
TEXAS, U.S.A.
All rights reserved. No part of this work may be reproduced or copied in any form or by any
means - graphic, electronic, or mechanical — without first receiving the written permission of
Daniel Measurement and Control, Inc. Houston, Texas, U.S.A.
WARRANTY
1. LIMITED WARRANTY: Subject to the limitations contained in Section 2 herein and except as
otherwise expressly provided herein, Daniel Measurement and Control, Inc. and Rosemount
Analytical, (collectively“Seller”) warrants that the firmware will execute the programming
instructions provided by Seller, and that the Goods manufactured or Services provided by Seller
will be free from defects in materials or workmanship under normal use and care until the
expiration of the applicable warranty period. Goods are warranted for twelve (12) months from
the date of initial installation or eighteen (18) months from the date of shipment by Seller,
whichever period expires first. Consumables and Services are warranted for a period of 90 days
from the date of shipment or completion of the Services. Products purchased by Seller from a third
party for resale to Buyer ("Resale Products") shall carry only the warranty extended by the
original manufacturer. Buyer agrees that Seller has no liability for Resale Products beyond
making a reasonable commercial effort to arrange for procurement and shipping of the Resale
Products. If Buyer discovers any warranty defects and notifies Seller thereof in writing during the
applicable warranty period, Seller shall, at its option, promptly correct any errors that are found
by Seller in the firmware or Services, or repair or replace F.O.B. point of manufacture that
portion of the Goods or firmware found by Seller to be defective, or refund the purchase price of
the defective portion of the Goods/Services. All replacements or repairs necessitated by
inadequate maintenance, normal wear and usage, unsuitable power sources, unsuitable
environmental conditions, accident, misuse, improper installation, modification, repair, storage or
handling, or any other cause not the fault of Seller are not covered by this limited warranty, and
shall be at Buyer's expense. Seller shall not be obligated to pay any costs or charges incurred by
Buyer or any other party except as may be agreed upon in writing in advance by an authorized
Seller representative. All costs of dismantling, reinstallation and freight and the time and
expenses of Seller's personnel for site travel and diagnosis under this warranty clause shall be
borne by Buyer unless accepted in writing by Seller. Goods repaired and parts replaced during the
warranty period shall be in warranty for the remainder of the original warranty period or ninety
(90) days, whichever is longer. This limited warranty is the only warranty made by Seller and
can be amended only in a writing signed by an authorized representative of Seller. Except as
otherwise expressly provided in the Agreement, THERE ARE NO REPRESENTATIONS OR
WARRANTIES OF ANY KIND, EXPRESSED OR IMPLIED, AS TO MERCHANTABILITY,
FITNESS FOR PARTICULAR PURPOSE, OR ANY OTHER MATTER WITH RESPECT TO ANY
OF THE GOODS OR SERVICES. It is understood that corrosion or erosion of materials is
not covered by our guarantee.
2. LIMITATION OF REMEDY AND LIABILITY: SELLER SHALL NOT BE LIABLE FOR
DAMAGES CAUSED BY DELAY IN PERFORMANCE. THE SOLE AND EXCLUSIVE REMEDY
FOR BREACH OF WARRANTY HEREUNDER SHALL BE LIMITED TO REPAIR,
CORRECTION, REPLACEMENT OR REFUND OF PURCHASE PRICE UNDER THE LIMITED
WARRANTY CLAUSE IN SECTION 1 HEREIN. IN NO EVENT, REGARDLESS OF THE FORM
OF THE CLAIM OR CAUSE OF ACTION (WHETHER BASED IN CONTRACT,
INFRINGEMENT, NEGLIGENCE, STRICT LIABILITY, OTHER TORT OR OTHERWISE),
SHALL SELLER'S LIABILITY TO BUYER AND/OR ITS CUSTOMERS EXCEED THE PRICE
TO BUYER OF THE SPECIFIC GOODS MANUFACTURED OR SERVICES PROVIDED BY
SELLER GIVING RISE TO THE CLAIM OR CAUSE OF ACTION. BUYER AGREES THAT IN
NO EVENT SHALL SELLER'S LIABILITY TO BUYER AND/OR ITS CUSTOMERS EXTEND
TO INCLUDE INCIDENTAL, CONSEQUENTIAL OR PUNITIVE DAMAGES. THE TERM
"CONSEQUENTIAL DAMAGES" SHALL INCLUDE, BUT NOT BE LIMITED TO, LOSS OF
ANTICIPATED PROFITS, LOSS OF USE, LOSS OF REVENUE AND COST OF CAPITAL.
IMPORTANT INSTRUCTIONS
•
Read all instructions prior to installing, operating, and servicing this product.
•
Follow all warnings, cautions, and instructions marked on and supplied with this product.
•
Inspect the equipment packing case and if damage exists, notify your local carrier for
liability.
•
Open the packing list and carefully remove equipment and spare or replacement parts
from the case. Inspect all equipment for damage and missing parts.
•
If items are damaged or missing, contact the manufacturer at 1 (713) 827-6314 for
instructions about receiving replacement parts.
•
Install equipment as specified per the installation instructions and per applicable local
and national codes. All connections shall be made to proper electrical and pressure
sources.
•
Ensure that all equipment doors are closed and protective covers are in place, except
when maintenance is being performed by qualified persons, to prevent personal injury.
•
Use of this product for any purpose other than its intended purpose may result in
property damage and/or serious injury or death.
•
Before opening the flameproof enclosure in a flammable atmosphere, the electrical
circuits must be interrupted.
•
Repairs must be performed using only authorized replacement parts as specified by the
manufacturer. Use of unauthorized parts can affect the product's performance and place
the safe operation of the product at risk.
•
When installing or servicing ATEX-certified units, the ATEX approval applies only to
equipment without cable glands. When mounting the flameproof enclosures in a
hazardous area, only flameproof cable glands certified to IEC 60079-1 must be used.
•
Technical assistance is available 24 hours a day, 7 days a week by calling 1 (713) 8276314.
This page is intentionally left blank.
Table of Contents
Section 1:
Getting started
What’s new in MON 20/20 . . . . . . . . . . . . . . . . . . . . . . . . . . . . . .1-3
Getting started with MON 20/20 . . . . . . . . . . . . . . . . . . . . . . . . .1-6
System requirements . . . . . . . . . . . . . . . . . . . . . . . . . . . .1-6
Installing MON 20/20 . . . . . . . . . . . . . . . . . . . . . . . . . . .1-7
Launching MON 20/20 . . . . . . . . . . . . . . . . . . . . . . . . . .1-7
Registering MON 20/20 . . . . . . . . . . . . . . . . . . . . . . . . . .1-7
Setting up the data folder . . . . . . . . . . . . . . . . . . . . . . . .1-9
Configuring MON 20/20 to connect to a gas
chromatograph . . . . . . . . . . . . . . . . . . . . . . . . . . . . . . . .1-10
Importing or exporting the GC directory table . . . . . .1-13
Launching MON 20/20 from the SNAP-ON for
DeltaV . . . . . . . . . . . . . . . . . . . . . . . . . . . . . . . . . . . . . . .1-15
Launching MON 20/20 from the AMS Device
Manager . . . . . . . . . . . . . . . . . . . . . . . . . . . . . . . . . . . . .1-17
The MON 20/20 user interface . . . . . . . . . . . . . . . . . . .1-20
Connecting to a gas chromatograph . . . . . . . . . . . . . . .1-25
Disconnecting from a gas chromatograph . . . . . . . . . .1-28
Keyboard commands . . . . . . . . . . . . . . . . . . . . . . . . . . . . . . . . . .1-28
Procedures guide . . . . . . . . . . . . . . . . . . . . . . . . . . . . . . . . . . . . .1-30
Configuring a gas chromatograph . . . . . . . . . . . . . . . . . . . . . . .1-33
Editing a configuration file . . . . . . . . . . . . . . . . . . . . . .1-33
Saving a gas chromatograph’s current
configuration . . . . . . . . . . . . . . . . . . . . . . . . . . . . . . . . .1-35
Importing a configuration file . . . . . . . . . . . . . . . . . . . .1-35
Configuring your printer . . . . . . . . . . . . . . . . . . . . . . . . . . . . . .1-36
Using online help . . . . . . . . . . . . . . . . . . . . . . . . . . . . . . . . . . . .1-37
Operating modes for MON 20/20 . . . . . . . . . . . . . . . . . . . . . . . .1-37
Viewing the Physical Name column . . . . . . . . . . . . . . . . . . . . .1-37
Selecting the GC’s networking protocol . . . . . . . . . . . . . . . . . . .1-39
Using the context-sensitive variable selector . . . . . . . . . . . . . .1-41
Section 2:
Using the
chromatograph
functions
Viewing chromatograms . . . . . . . . . . . . . . . . . . . . . . . . . . . . . . . .2-1
Data displayed in the chromatogram window . . . . . . . .2-2
Viewing a live chromatogram . . . . . . . . . . . . . . . . . . . . .2-3
Viewing an archived chromatogram . . . . . . . . . . . . . . . .2-5
Protecting or unprotecting an archived
chromatogram . . . . . . . . . . . . . . . . . . . . . . . . . . . . . . . . .2-9
Viewing a saved chromatogram . . . . . . . . . . . . . . . . . .2-13
Working with the graph . . . . . . . . . . . . . . . . . . . . . . . . . . . . . . .2-15
Editing the display properties of the chromatograph . . . . . . . .2-16
The Graph bar . . . . . . . . . . . . . . . . . . . . . . . . . . . . . . . .2-16
Additional plot commands . . . . . . . . . . . . . . . . . . . . . . .2-19
i
User Manual
3-9000-745
MON20/20 Software for Gas Chromatographs
OCTOBER 2010
Working with a chromatogram . . . . . . . . . . . . . . . . . . . . . . . . .
Editing a chromatogram trace . . . . . . . . . . . . . . . . . . .
Viewing chromatogram results . . . . . . . . . . . . . . . . . .
Saving a chromatogram trace . . . . . . . . . . . . . . . . . . .
Removing a chromatogram trace from view . . . . . . . .
Forcing a calibration . . . . . . . . . . . . . . . . . . . . . . . . . .
Controlling the display of data in the Timed Events
and Components tables . . . . . . . . . . . . . . . . . . . . . . . .
Saving a comparison file . . . . . . . . . . . . . . . . . . . . . . .
Opening a comparison file . . . . . . . . . . . . . . . . . . . . . .
Miscellaneous commands . . . . . . . . . . . . . . . . . . . . . . . . . . . . .
Working with the Timed Events table . . . . . . . . . . . .
Editing Timed Events from the Time Events
window . . . . . . . . . . . . . . . . . . . . . . . . . . . . . . . . . . . . .
Editing Timed Events from the Chromatogram
Viewer . . . . . . . . . . . . . . . . . . . . . . . . . . . . . . . . . . . . . .
Using the Chromatogram Viewer’s cursor to
update a Timed Event . . . . . . . . . . . . . . . . . . . . . . . . .
Working with the Component Data Table . . . . . . . . .
Editing retention times from the Chromatogram
Viewer . . . . . . . . . . . . . . . . . . . . . . . . . . . . . . . . . . . . . .
Viewing raw data . . . . . . . . . . . . . . . . . . . . . . . . . . . . .
Setting the gas chromatograph’s date and time . . . . . . . . . . .
Adjusting daylight savings . . . . . . . . . . . . . . . . . . . . .
Section 3:
Using the hardware
functions
ii
2-21
2-21
2-23
2-25
2-26
2-27
2-28
2-30
2-30
2-31
2-32
2-33
2-33
2-35
2-37
2-38
2-38
2-40
2-42
Controlling the temperature of the gas chromatograph’s
heaters . . . . . . . . . . . . . . . . . . . . . . . . . . . . . . . . . . . . . . . . . . . . . 3-1
Renaming a heater . . . . . . . . . . . . . . . . . . . . . . . . . . . . . 3-2
Setting the heater’s type . . . . . . . . . . . . . . . . . . . . . . . . 3-3
Monitoring the temperature of a heater . . . . . . . . . . . . 3-4
Monitoring the operational status of a heater . . . . . . . 3-5
Setting the desired temperature . . . . . . . . . . . . . . . . . . 3-6
Setting PWM Output . . . . . . . . . . . . . . . . . . . . . . . . . . . 3-7
Removing a heater from service . . . . . . . . . . . . . . . . . . 3-9
Configuring the valves . . . . . . . . . . . . . . . . . . . . . . . . . . . . . . . 3-10
Renaming a valve . . . . . . . . . . . . . . . . . . . . . . . . . . . . . 3-10
Setting a valve’s operational mode . . . . . . . . . . . . . . . 3-12
Monitoring the operational status of a valve . . . . . . . 3-13
Inverting the polarity of a valve . . . . . . . . . . . . . . . . . 3-14
Setting the usage mode for a valve . . . . . . . . . . . . . . . 3-15
Controlling the detectors . . . . . . . . . . . . . . . . . . . . . . . . . . . . . 3-17
Offsetting the baseline . . . . . . . . . . . . . . . . . . . . . . . . . 3-19
Igniting the FID flame . . . . . . . . . . . . . . . . . . . . . . . . . 3-21
Resetting the preamp value . . . . . . . . . . . . . . . . . . . . . 3-22
Balancing the preamp . . . . . . . . . . . . . . . . . . . . . . . . . 3-22
MON20/20 Software for Gas Chromatographs
OCTOBER 2010
User Manual
3-9000-745
Managing your gas chromatograph’s discrete inputs . . . . . . . .3-24
Renaming a discrete input . . . . . . . . . . . . . . . . . . . . . .3-24
Setting a discrete input’s operational mode . . . . . . . . .3-25
Monitoring the operational status of a discrete
input . . . . . . . . . . . . . . . . . . . . . . . . . . . . . . . . . . . . . . . .3-27
Inverting the polarity of a discrete input . . . . . . . . . . .3-28
Managing your gas chromatograph’s discrete outputs . . . . . . .3-29
Renaming a discrete output . . . . . . . . . . . . . . . . . . . . .3-29
Setting a discrete output’s operational mode . . . . . . . .3-30
Monitoring the operational status of a discrete
output . . . . . . . . . . . . . . . . . . . . . . . . . . . . . . . . . . . . . . .3-32
Setting the usage mode for a discrete output . . . . . . . .3-33
Managing your gas chromatograph’s analog inputs . . . . . . . . .3-34
Renaming an analog input . . . . . . . . . . . . . . . . . . . . . .3-35
Setting a analog input’s operational mode . . . . . . . . . .3-36
Setting the scale values for an analog input
device . . . . . . . . . . . . . . . . . . . . . . . . . . . . . . . . . . . . . . .3-37
Setting the type of analog input signal . . . . . . . . . . . .3-37
Monitoring the status of an analog input . . . . . . . . . . .3-39
Calibrating an analog input . . . . . . . . . . . . . . . . . . . . .3-40
Managing your gas chromatograph’s analog outputs . . . . . . . .3-43
Renaming an analog output . . . . . . . . . . . . . . . . . . . . .3-43
Setting a analog output’s operational mode . . . . . . . . .3-44
Setting the scale values for an analog output
device . . . . . . . . . . . . . . . . . . . . . . . . . . . . . . . . . . . . . . .3-45
Mapping a system variable to an analog output . . . . .3-46
Monitoring the status of an analog output . . . . . . . . . .3-47
Calibrating an analog output . . . . . . . . . . . . . . . . . . . .3-48
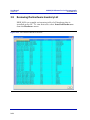
Reviewing the Hardware Inventory List . . . . . . . . . . . . . . . . . .3-52
Section 4:
Using the
Application
functions
Managing the system . . . . . . . . . . . . . . . . . . . . . . . . . . . . . . . . . .4-2
Managing Component Data Tables . . . . . . . . . . . . . . . . . . . . . . .4-5
Editing a Component Data Table . . . . . . . . . . . . . . . . . .4-6
Adding a component to a Component Data
Table . . . . . . . . . . . . . . . . . . . . . . . . . . . . . . . . . . . . . . . .4-10
Removing a component from a Component
Data Table . . . . . . . . . . . . . . . . . . . . . . . . . . . . . . . . . . .4-12
Viewing the standard values for a component . . . . . . .4-13
Viewing raw data . . . . . . . . . . . . . . . . . . . . . . . . . . . . . .4-15
Managing timed events . . . . . . . . . . . . . . . . . . . . . . . . . . . . . . .4-17
Editing valve events . . . . . . . . . . . . . . . . . . . . . . . . . . .4-20
Editing integration events . . . . . . . . . . . . . . . . . . . . . .4-22
Editing spectrum gain events . . . . . . . . . . . . . . . . . . . .4-26
Setting the cycle and analysis time . . . . . . . . . . . . . . .4-29
Removing an event from the Timed Event
Table . . . . . . . . . . . . . . . . . . . . . . . . . . . . . . . . . . . . . . . .4-31
Adding an event to the Timed Event Table . . . . . . . . .4-33
iii
User Manual
3-9000-745
MON20/20 Software for Gas Chromatographs
OCTOBER 2010
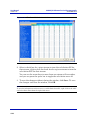
Managing Validation Data Tables . . . . . . . . . . . . . . . . . . . . . .
Managing calculations . . . . . . . . . . . . . . . . . . . . . . . . . . . . . . .
Setting standard calculations by stream . . . . . . . . . .
Editing average calculations . . . . . . . . . . . . . . . . . . . .
Viewing an archive of averages for a given variable .
Copying stream settings . . . . . . . . . . . . . . . . . . . . . . .
Copying component settings . . . . . . . . . . . . . . . . . . . .
Creating Custom Calculations . . . . . . . . . . . . . . . . . . . . . . . . .
Inserting a Comment . . . . . . . . . . . . . . . . . . . . . . . . . .
Inserting a Conditional Statement . . . . . . . . . . . . . . .
Inserting an Expression . . . . . . . . . . . . . . . . . . . . . . . .
Creating a Constant . . . . . . . . . . . . . . . . . . . . . . . . . . .
Creating or Editing a Temporary Variable . . . . . . . . .
Inserting a System Variable . . . . . . . . . . . . . . . . . . . .
Using User-defined Calculations . . . . . . . . . . . . . . . . .
Setting the calculation method . . . . . . . . . . . . . . . . . . . . . . . . .
Setting alarm limits . . . . . . . . . . . . . . . . . . . . . . . . . . . . . . . . .
Managing system alarms . . . . . . . . . . . . . . . . . . . . . . . . . . . . .
Managing streams . . . . . . . . . . . . . . . . . . . . . . . . . . . . . . . . . . .
Designating how a stream will be used . . . . . . . . . . .
Assigning a valve to a stream and setting the
relationship between the stream’s open state to
the valve’s On/Off state . . . . . . . . . . . . . . . . . . . . . . . .
Assigning a data table to a particular stream . . . . . .
Changing the base pressure for a stream . . . . . . . . . .
Creating a stream sequence for a detector . . . . . . . . . . . . . . .
Communications . . . . . . . . . . . . . . . . . . . . . . . . . . . . . . . . . . . .
Creating or editing registers . . . . . . . . . . . . . . . . . . . .
Creating a new map file . . . . . . . . . . . . . . . . . . . . . . . .
Assigning a variable to a register . . . . . . . . . . . . . . . .
Viewing or editing scales . . . . . . . . . . . . . . . . . . . . . . .
Configuring the gas chromatograph’s Ethernet port . . . . . . .
Working with local operator interface variables . . . . . . . . . . .
Mapping Foundation Fieldbus variables . . . . . . . . . . . . . . . . .
Section 5:
Logs and reports
iv
4-35
4-37
4-37
4-39
4-42
4-44
4-45
4-47
4-54
4-56
4-59
4-61
4-63
4-64
4-65
4-67
4-69
4-72
4-74
4-74
4-76
4-77
4-78
4-78
4-80
4-81
4-86
4-92
4-92
4-95
4-96
4-98
Viewing and clearing alarms . . . . . . . . . . . . . . . . . . . . . . . . . . . 5-1
Viewing unacknowledged and active alarms . . . . . . . . 5-2
Acknowledging and clearing alarms . . . . . . . . . . . . . . . 5-3
Viewing the alarm log . . . . . . . . . . . . . . . . . . . . . . . . . . 5-4
Viewing the maintenance log . . . . . . . . . . . . . . . . . . . . . . . . . . . 5-7
Adding an Entry to the Maintenance Log . . . . . . . . . . 5-8
Deleting an entry from the maintenance log . . . . . . . . 5-9
Working with the parameter list . . . . . . . . . . . . . . . . . . . . . . . 5-10
Viewing and editing the parameter list . . . . . . . . . . . 5-10
Importing and exporting the parameter list . . . . . . . . 5-12
Working with drawings and documents . . . . . . . . . . . . . . . . . 5-13
Viewing drawings or documents . . . . . . . . . . . . . . . . . 5-15
MON20/20 Software for Gas Chromatographs
OCTOBER 2010
User Manual
3-9000-745
Adding files to the GC . . . . . . . . . . . . . . . . . . . . . . . . . .5-17
Deleting files from the GC . . . . . . . . . . . . . . . . . . . . . . .5-18
Viewing the event log . . . . . . . . . . . . . . . . . . . . . . . . . . . . . . . . .5-19
Displaying reports . . . . . . . . . . . . . . . . . . . . . . . . . . . . . . . . . . .5-22
Understanding report types . . . . . . . . . . . . . . . . . . . . .5-22
Viewing reports from live data . . . . . . . . . . . . . . . . . . .5-32
Viewing a saved report . . . . . . . . . . . . . . . . . . . . . . . . .5-35
Viewing reports based on archived data . . . . . . . . . . . . . . . . . .5-37
Viewing analysis and calibration reports based
on archived data . . . . . . . . . . . . . . . . . . . . . . . . . . . . . . .5-37
Viewing average reports based on archived data . . . .5-41
Printing reports automatically . . . . . . . . . . . . . . . . . . .5-44
Viewing trend data . . . . . . . . . . . . . . . . . . . . . . . . . . . . . . . . . . .5-46
Viewing live trend data . . . . . . . . . . . . . . . . . . . . . . . . .5-46
Viewing saved trend data . . . . . . . . . . . . . . . . . . . . . . .5-50
Working with the Trend Graph . . . . . . . . . . . . . . . . . . . . . . . . .5-52
Editing the display properties of the graph . . . . . . . . . . . . . . .5-54
The graph bar . . . . . . . . . . . . . . . . . . . . . . . . . . . . . . . . .5-54
Working with a trend graph . . . . . . . . . . . . . . . . . . . . . . . . . . . .5-58
Editing a trend graph . . . . . . . . . . . . . . . . . . . . . . . . . .5-59
Entering a description for a trend graph . . . . . . . . . . .5-60
Saving a trend trace . . . . . . . . . . . . . . . . . . . . . . . . . . .5-61
Removing a trend graph from view . . . . . . . . . . . . . . .5-62
Displaying trend data . . . . . . . . . . . . . . . . . . . . . . . . . .5-62
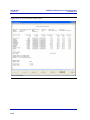
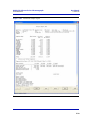
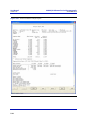
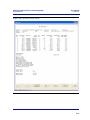
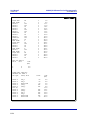
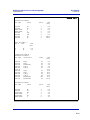
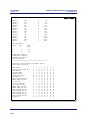
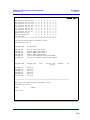
Generating a GC Configuration Report . . . . . . . . . . . . . . . . . . .5-65
Deleting archived data from the gas chromatograph . . . . . . . .5-88
The molecular weight vs. response factor graph . . . . . . . . . . . .5-89
Section 6:
Controlling
Analyses
Halting an analysis . . . . . . . . . . . . . . . . . . . . . . . . . . . . . . . . . . . .6-1
Auto sequencing . . . . . . . . . . . . . . . . . . . . . . . . . . . . . . . . . . . . . .6-2
Analyzing a single stream . . . . . . . . . . . . . . . . . . . . . . . . . . . . . .6-4
Calibrating the gas chromatograph . . . . . . . . . . . . . . . . . . . . . . .6-5
Validating the Gas Chromatograph . . . . . . . . . . . . . . . . . . . . . .6-7
Stopping an Analysis Run . . . . . . . . . . . . . . . . . . . . . . . . . . . . . .6-9
Section 7:
Using MON 20/20
Tools
Using the Modbus Test program . . . . . . . . . . . . . . . . . . . . . . . . .7-1
Comparing Modbus protocols . . . . . . . . . . . . . . . . . . . . .7-2
Setting communication parameters . . . . . . . . . . . . . . . .7-3
Getting Modbus Data . . . . . . . . . . . . . . . . . . . . . . . . . . .7-5
Transmitting using a single data type . . . . . . . . . . . . . .7-7
Transmitting using a template . . . . . . . . . . . . . . . . . . .7-10
Setting the log parameters . . . . . . . . . . . . . . . . . . . . . .7-13
Saving Modbus data . . . . . . . . . . . . . . . . . . . . . . . . . . .7-15
Printing Modbus data . . . . . . . . . . . . . . . . . . . . . . . . . .7-15
Assigning scale ranges to User_Modbus registers . . . .7-15
Troubleshooting communication errors . . . . . . . . . . . . . . . . . . .7-15
v
User Manual
MON20/20 Software for Gas Chromatographs
3-9000-745
OCTOBER 2010
Managing users . . . . . . . . . . . . . . . . . . . . . . . . . . . . . . . . . . . . .
Creating users . . . . . . . . . . . . . . . . . . . . . . . . . . . . . . .
Exporting a list of user profiles . . . . . . . . . . . . . . . . . .
Importing a list of user profiles . . . . . . . . . . . . . . . . . .
Editing users . . . . . . . . . . . . . . . . . . . . . . . . . . . . . . . .
Removing a user . . . . . . . . . . . . . . . . . . . . . . . . . . . . . .
Changing a user’s password . . . . . . . . . . . . . . . . . . . .
Finding out who is connected to the gas
chromatograph . . . . . . . . . . . . . . . . . . . . . . . . . . . . . . .
Upgrading the firmware . . . . . . . . . . . . . . . . . . . . . . . . . . . . . .
Cold booting . . . . . . . . . . . . . . . . . . . . . . . . . . . . . . . . . . . . . . . .
Viewing diagnostics . . . . . . . . . . . . . . . . . . . . . . . . . . . . . . . . . .
Adjusting the sensitivity of the LOI Keys . . . . . . . . . . . . . . . .
Setting the ROC card type . . . . . . . . . . . . . . . . . . . . . . . . . . . .
7-17
7-20
7-21
7-23
7-26
7-27
7-28
7-30
7-30
7-33
7-33
7-35
7-36
Appendix A: Component Data Table
Appendix B:
Data computations
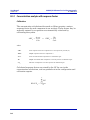
Data acquisition . . . . . . . . . . . . . . . . . . . . . . . . . . . . . . . . . . . . . B-1
Peak detection . . . . . . . . . . . . . . . . . . . . . . . . . . . . . . . . . . . . . . . B-2
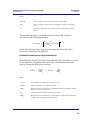
Analysis computations . . . . . . . . . . . . . . . . . . . . . . . . . . . . . . . . B-3
Concentration analysis with response factor . . . . . . . . B-4
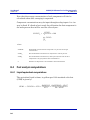
Post analysis computations . . . . . . . . . . . . . . . . . . . . . . . . . . . . B-6
Liquid equivalent computations . . . . . . . . . . . . . . . . . . B-6
Heating value calculations . . . . . . . . . . . . . . . . . . . . . . B-7
Multi-level calibration . . . . . . . . . . . . . . . . . . . . . . . . . B-13
Indirect calibration . . . . . . . . . . . . . . . . . . . . . . . . . . . B-14
Appendix C:
Modbus registers list for
2350A GC
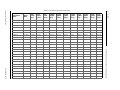
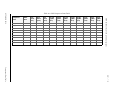
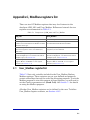
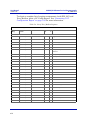
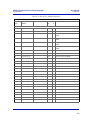
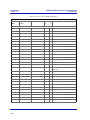
User_Modbus register list . . . . . . . . . . . . . . . . . . . . . . . . . . . . . . C-1
SIM_2251 Modbus register list . . . . . . . . . . . . . . . . . . . . . . . . . C-7
Appendix D:
Basic and advanced
system variables
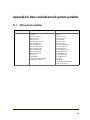
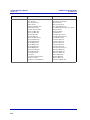
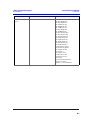
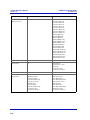
GPA system variables . . . . . . . . . . . . . . . . . . . . . . . . . . . . . . . . . D-1
ISO system variables . . . . . . . . . . . . . . . . . . . . . . . . . . . . . . . . D-10
Appendix E:
Creating custom
calculations
Inserting a comment . . . . . . . . . . . . . . . . . . . . . . . . . . . . . . . . . . E-7
Inserting a conditional statement . . . . . . . . . . . . . . . . . . . . . . . E-9
Inserting an expression . . . . . . . . . . . . . . . . . . . . . . . . . . . . . . . E-11
Creating a constant . . . . . . . . . . . . . . . . . . . . . . . . . . . . . . . . . . E-14
Creating or editing a temporary variable . . . . . . . . . . . . . . . . E-15
Inserting a system variable . . . . . . . . . . . . . . . . . . . . . . . . . . . E-16
Using user-defined calculations . . . . . . . . . . . . . . . . . . . . . . . . E-17
vi
Section 1: Getting started
Welcome to MON 20/20—a menu-driven, Windows-based software
program designed to remotely operate and monitor the Daniel®
Danalyzer™ XA series and the Rosemount® Analytical XA series of gas
chromatographs.
MON 20/20 operates on an IBM-compatible personal computer (PC)
running the Windows XP operating system or later.
MON 20/20 can initiate or control the following gas chromatograph (GC)
functions:
• Alarm parameters
• Alarm and event processing
• Analog scale adjustments
• Analyses
• Baseline runs
• Calculation assignments and configurations
• Calibrations
• Component assignments and configurations
• Diagnostics
• Event sequences
• Halt operations
• Stream assignments and sequences
• Valve activations
• Timing adjustments
1-1
User Manual
MON20/20 Software for Gas Chromatographs
3-9000-745
OCTOBER 2010
MON 20/20 can generate the following reports:
• 24-Hour Averages
• Analysis (GPA)
• Analysis (ISO)
• Calibration
• Final Calibration
• Validation
• Final Validation
• Hourly Averages
• Monthly Averages
• GC Configuration
• Raw Data
• Variable Averages
• Weekly Averages
• Dew Temperature Calculation (optional)
MON 20/20 can access and display the following GC-generated logs:
• Alarm Log
• Event Log
• Parameter List
• Maintenance Log
1-2
MON20/20 Software for Gas Chromatographs
OCTOBER 2010
1.1
User Manual
3-9000-745
What’s new in MON 20/20
Users familiar with MON2000 or MON2000 Plus will find a few changes
when using MON 20/20:
• Login security is at the gas chromatograph level instead of at the
software level. This means that you no longer have to log in after
starting MON 20/20—but you do have to log in to the gas
chromatograph to which you are trying to connect. For more
information, see “Connecting to a gas chromatograph” on page 1-25.
• An “administrator” role has been added to the list of user roles. This
new role has the highest level of authority and is the only role that can
create or delete all other roles. For more information, see “Managing
users” on page 7-17.
• Multiple users can connect to the same gas chromatograph simultaneously. By default, the first user to log in to the GC with “supervisor”
authority will have read/write access; all other users, including other
supervisor-level users, will have read access only. This configuration
can be changed so that all supervisor-level users have read/write
access regardless of who logs in first. For more information, see
“Managing the system” on page 4-2.
• Users can display multiple windows within MON 20/20.
• Automatic reconnection. If MON 20/20 loses its connection with the
GC, it automatically attempts to reconnect.
• Users can view multiple instances of certain windows. To aid in data
processing or troubleshooting, MON 20/20 is capable of displaying
more than one instance of certain data-heavy windows such as the
Chromatogram Viewer and the Trend Data window.
1-3
User Manual
MON20/20 Software for Gas Chromatographs
3-9000-745
OCTOBER 2010
• Enhanced Chromatogram Viewer. The following enhancements have
been made to the Chromatogram Viwer:
-
-
-
-
-
Users can view an unlimited number of chromatograms, in any
configuration. For example, a user can view an archived
chromatogram and a live chromatogram. For more information,
see “Viewing chromatograms” on page 2-1.
The “Keep Last CGM” option. Upon starting a new run, MON 20/
20 can keep the most recently completed chromatogram on the
graph for reference.
Overview window. When zoomed in to a smaller section of a
chromatogram, the user can open a miniature ‘overview’ window
that displays the entire chromatogram, for reference. For more
information, see “Additional plot commands” on page 2-19.
Older chromatograms available. MON 20/20 has access to
archived chromatograms as old as four or five days. For more
information, see “Viewing an archived chromatogram” on page 2-5.
Full screen mode. For more information, see “Working with the
graph” on page 2-15.
Protected chromatograms. Chromatograms that you designate as
“protected” will not be deleted. For more information, see
“Protecting or unprotecting an archived chromatogram” on page 29.
• The “Invert Polarity “option. This feature reverses a device’s effect.
For more information, see “Inverting the polarity of a valve” on
page 3-14 and “Inverting the polarity of a discrete input” on page 3-28.
• Streamlined variables-picking menu. The method for selecting
variables for calculations and other purposes is contained within one
simple, self-contained menu. For more information, see “Using the
context-sensitive variable selector” on page 1-42.
• GC Time. The GC Status Bar displays the date and time based on the
GC’s physical location, which may be different than the PC’s location.
For more information, see “Setting the gas chromatograph’s date and
time” on page 2-40.
• Daylight savings time. You have option of enabling a GC’s daylight
savings time feature. Also, there are two options for setting the start
and end times for daylight savings time on the GC. For more
information, see “Adjusting daylight savings” on page 2-42.
1-4
MON20/20 Software for Gas Chromatographs
OCTOBER 2010
User Manual
3-9000-745
• Baseline offsetting. In some situations that involve TCD detectors the
baseline may be displayed either too high on the graph, in which case
the tops of the peaks are cut off, or too low on the graph, so that the
bases of the peaks are cut off. If this occurs it is possible to offset the
baseline either up or down so that the entire peak can be displayed on
the graph. This offset will be applied to all traces—live, archived and
saved—that are displayed thereafter. For more information, see
“Viewing raw data” on page 2-38.
• Microsoft Excel-based Parameter List. The Parameter List has been
expanded to offer seven pages of information, and is Microsoft® Excelbased to allow for access outside of MON 20/20. The document can be
imported to and exported from GCs. For more information, see
“Working with the parameter list” on page 5-10.
• Optional Foundation Fieldbus variables. If your GC is installed with
a Foundation Fieldbus, you can map up to 64 GC variables to monitor
using the AMS Suite. For more information, see “Mapping
Foundation Fieldbus variables” on page 4-98.
• Optional local operator interface (LOI) variables. If your GC is
installed with an LOI, you can configure up to 25 GC parameters to
monitor using the LOI’s Display mode. For more information, see
“Working with local operator interface variables” on page 4-96.
• Access to GC-related drawings such as flow diagrams, assembly
drawings, and electrical diagrams.
• Validation runs. During a validation run, the GC performs a test
analysis to verify that it is working properly. For more information,
see “Managing Validation Data Tables” on page 4-35 and “Validating
the Gas Chromatograph” on page 6-7.
1-5
User Manual
MON20/20 Software for Gas Chromatographs
3-9000-745
1.2
OCTOBER 2010
Getting started with MON 20/20
This section covers such issues as installing, registering and setting up
the software, as well as configuring MON 20/20 to meet your specific
needs.
1.2.1 System requirements
To achieve maximum performance when running MON 20/20, ensure
your PC meets the following specifications:
• Software
-
Windows® XP (Service Pack 2 or later), Windows® Vista, or
Windows® 7.
-
Internet Explorer® 6.0 or later.
• Hardware
-
1-6
PC with a 400 MHz Pentium or higher processor.
256 MB of RAM or higher.
100 MB of free hard disk space. (An additional 280 MB is required
on Windows® XP if .NET 2.0 is not previously installed.)
Super VGA monitor with 1024x768 or higher resolution.
For on-line operations, one serial port available for remote/local
connection to gas chromatograph.
For on-line operations, one Ethernet port available for remote/local
connection to gas chromatograph.
-
For remote connection only, a Windows®-compatible modem.
-
Windows®-compatible printer (optional)
MON20/20 Software for Gas Chromatographs
User Manual
OCTOBER 2010
3-9000-745
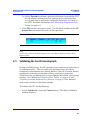
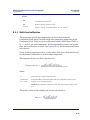
1.2.2 Installing MON 20/20
You must install MON 20/20 from the Emerson Process Management
MON 20/20 Software for Gas Chromatographs CD-ROM onto your hard
drive; you cannot run the program from the CD-ROM.
Double-click the Setup file and follow the on-screen installation
instructions.
Upon successful installation, MON 20/20 creates a shortcut icon on the
computer’s desktop.
Note
MON 20/20 is not an upgrade to MON2000; therefore, MON 20/20 should be installed to
its own directory, separate from the MON2000 directory.
Note
You must be logged onto the computer as an administrator to install MON 20/20. Vista
and Windows 7 users, even with administrator privileges, will be prompted by the
operating system’s User Account Control feature to allow or cancel the installation.
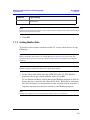
1.2.3 Launching MON 20/20
To launch MON 20/20, double-click its desktop icon or click the Start
button and select Emerson Process Management → MON 20/20.
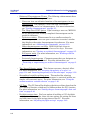
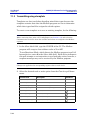
1.2.4 Registering MON 20/20
Each time you start MON 20/20 it will prompt you to register if you have
not already done so. To delay or suspend this registration prompt, see
Step 3.
Note
An active Internet connection is required to register.
Registering your copy of MON 20/20 allows you to receive information
about free updates and related products.
1-7
User Manual
MON20/20 Software for Gas Chromatographs
3-9000-745
OCTOBER 2010
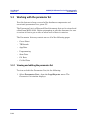
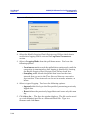
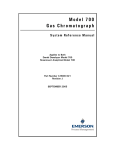
Figure 1-1. The Register MON 20/20 window, page 1
1. Enter your name, your company’s name, and the serial number for
your copy of MON 20/20 into the appropriate fields on the Register
MON 20/20 window.
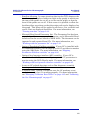
2. Click Next to continue.
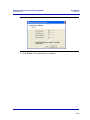
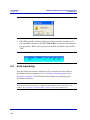
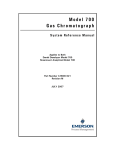
3. Choose the desired registration method by clicking the corresponding
checkbox.
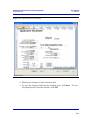
Figure 1-2. The Register MON 20/20 window, page 2
1-8
MON20/20 Software for Gas Chromatographs
OCTOBER 2010
User Manual
3-9000-745
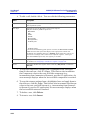
Note
To delay registration, check Register later (remind me). MON 20/20 will display the
Register MON 20/20 window the next time you start the program. To prevent the
Register MON 20/20 window from displaying with each program startup—and without
registering—check Register later (don’t remind me).
Note
You can register at any time by selecting Register MON 20/20... from the Help menu.
4. Click Finish.
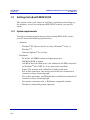
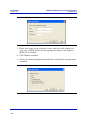
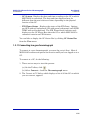
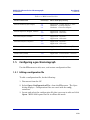
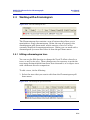
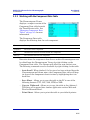
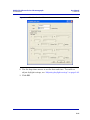
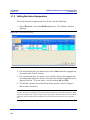
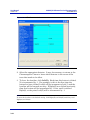
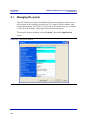
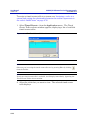
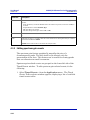
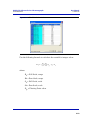
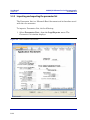
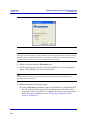
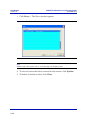
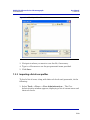
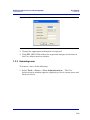
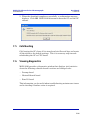
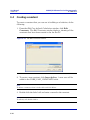
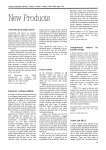
1.2.5 Setting up the data folder
The data folder stores GC-specific files such as reports and
chromatograms. The default location for the data folder is C:\GCXP
Data. If you want MON 20/20 to store its data in a different location—on
a network drive, for instance—do the following:
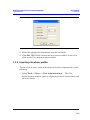
1. Move the GCXP Data folder to its new location.
2. Select Program Settings... from the File menu.
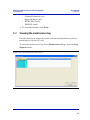
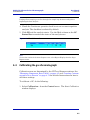
3. The current location of the data folder displays in the Data Folder
field.
Figure 1-3. The Program Settings window
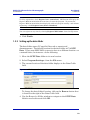
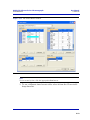
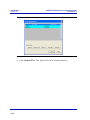
To change the data folder’s location, click on the Browse button that
is located to the right of the Data Folder field.
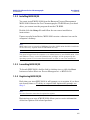
4. Use the Browse for Folder window to navigate to the GCXP Data
folder’s new location and click OK.
1-9
User Manual
MON20/20 Software for Gas Chromatographs
3-9000-745
OCTOBER 2010
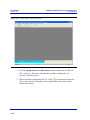
Note
Another method for changing the folder location is to type the folder’s location into the
Data Folder field and press ENTER. When the “Create the folder?” message appears,
click Yes.
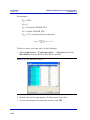
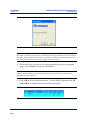
5. The Data Folder field updates to display the new location.
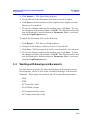
Figure 1-4. The Program Settings window
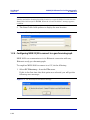
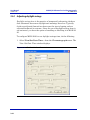
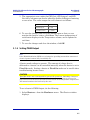
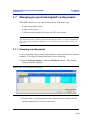
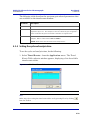
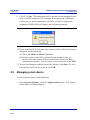
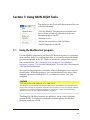
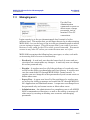
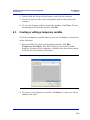
1.2.6 Configuring MON 20/20 to connect to a gas chromatograph
MON 20/20 can communicate via its Ethernet connection with any
Ethernet-ready gas chromatograph.
To congifure MON 20/20 to connect to a GC, do the following:
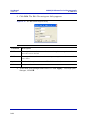
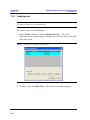
1. Select GC Directory... from the File menu.
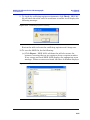
If this is the first time that this option was selected, you will get the
following error message:
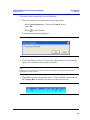
Figure 1-5. “GC directory file not found” message
1-10
MON20/20 Software for Gas Chromatographs
OCTOBER 2010
User Manual
3-9000-745
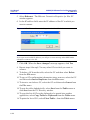
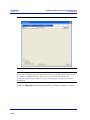
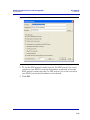
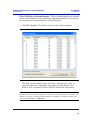
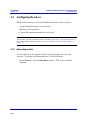
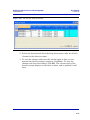
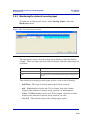
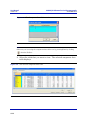
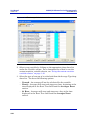
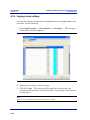
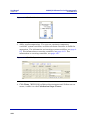
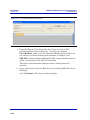
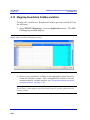
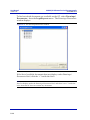
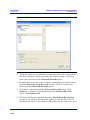
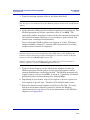
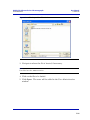
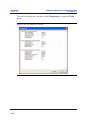
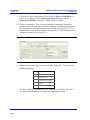
If you get the “GC directory file not found” message, click OK. The GC
Directory window appears and displays a table containing an
inventory of the GCs to which MON 20/20 can connect.
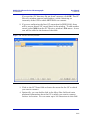
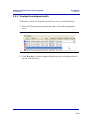
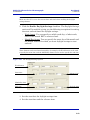
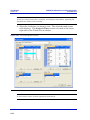
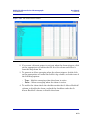
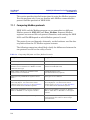
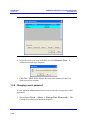
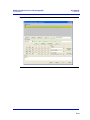
2. If you are configuring the first GC connection for MON 20/20, there
will be on one generic GC record listed in the window. To add another
record, select Add from the GC Directory window’s File menu. A new
row will be added to the bottom of the table.
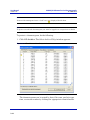
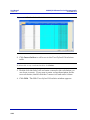
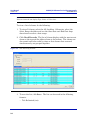
Figure 1-6. The GC directory window
3. Click in the GC Name field and enter the name for the GC to which
you want to connect.
4. Optionally, you can double-click in the Short Desc field and enter
pertinent information about the GC to which you want to connect,
such as its location. You can enter up to 100 characters in this field.
1-11
User Manual
MON20/20 Software for Gas Chromatographs
3-9000-745
OCTOBER 2010
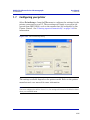
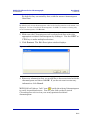
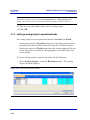
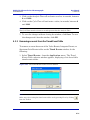
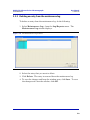
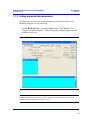
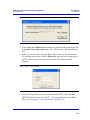
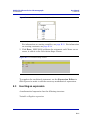
5. Select Ethernet. The Ethernet Connection Properties for New GC
window appears.
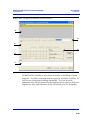
6. In the IP address field, enter the IP address of the GC to which you
want to connect.
Figure 1-7. The Ethernet Connection Properties for New GC window
Note
If you type in an invalid IP address, you will get an error message when MON 20/20
attempts to connect to the GC.
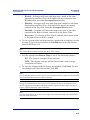
7. Click OK. When the Save changes? message appears, click Yes.
8. Repeat steps 2 through 7 for any other GCs to which you want to
connect.
9. To delete a GC from the table, select the GC and then select Delete
from the File menu.
10. To copy a GCs configuration information into a new row, select the GC
and then select Insert Duplicate from the File menu.
11. To insert a row below a GC, select the GC and then select Insert from
the File menu.
12. To sort the table alphebetically, select Sort from the Table menu or
click Sort from the GC Directory window.
13. To copy the list of GCs to the clipboard to be pasted into another
application, select Copy Table to Clipboard from the Table menu.
14. To print the list of GCs, select Print Table... from the Table menu.
1-12
MON20/20 Software for Gas Chromatographs
OCTOBER 2010
User Manual
3-9000-745
15. To save the changes and keep the window open click Save from the
GC Directory window. To save the changes and close the window,
click OK. When the Save changes? message appears, click Yes.
For more details about configuring MON 20/20 connections, see
“Configuring the gas chromatograph’s Ethernet port” on page 4-95.
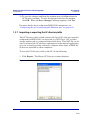
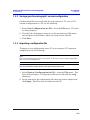
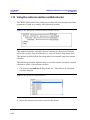
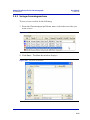
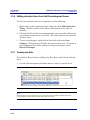
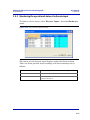
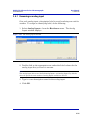
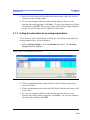
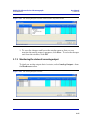
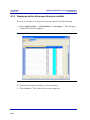
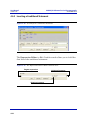
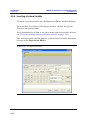
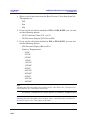
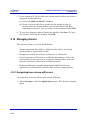
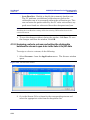
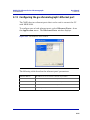
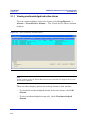
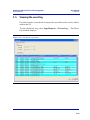
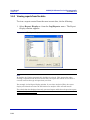
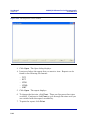
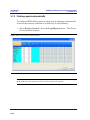
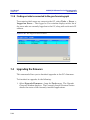
1.2.7 Importing or exporting the GC directory table
The GC Directory table, which contains the list of GCs that are currently
configured for MON 20/20, can be saved as a DAT file to a PC or other
storage media such as a compact disk or flash drive. This DAT file can be
used to restored the GC directory information to the original application,
or it can be used to quickly and easily configure other copies of MON 20/
20 that are installed on other computers.
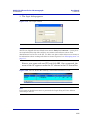
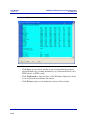
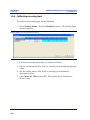
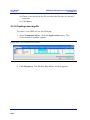
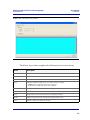
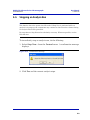
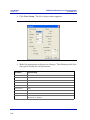
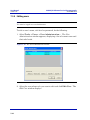
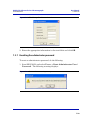
To save the GC Directory table to the PC, do the following:
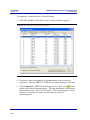
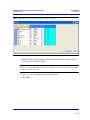
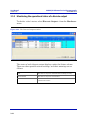
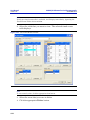
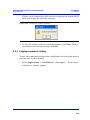
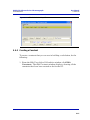
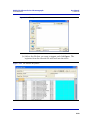
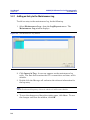
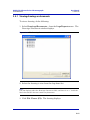
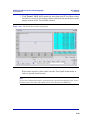
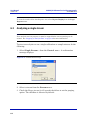
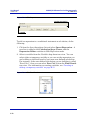
1. Click Export. The Export GC Directory window displays.
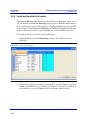
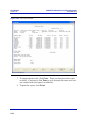
Figure 1-8. The Export GC Directory
1-13
User Manual
MON20/20 Software for Gas Chromatographs
3-9000-745
OCTOBER 2010
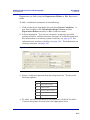
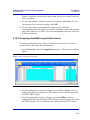
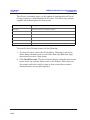
2. Select the checkbox for each gas chromatograph who information you
want to save. If you want to save the entire list, click Select All.
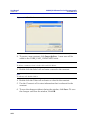
3. Click OK. The Export GC Directory File save as dialog displays.
4. Choose a save location. The default location is GCXP Data.
5. The file is automatically given the name of
GC_DIRECTORY_EXPORT.DAT. If you prefer a different name,
type it into the File name field.
6. Click Save.
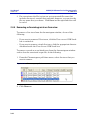
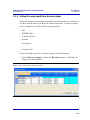
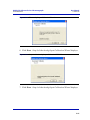
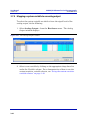
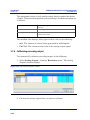
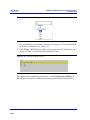
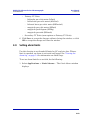
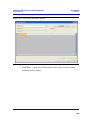
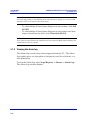
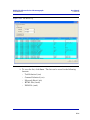
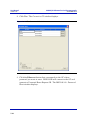
To import a GC Directory file, do the following:
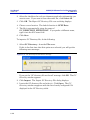
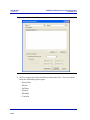
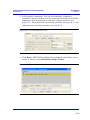
1. Select GC Directory... from the File menu.
If this is the first time that this option was selected, you will get the
following error message:
Figure 1-9. “GC directory file not found” message
If you get the “GC directory file not found” message, click OK. The GC
Directory window appears
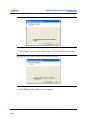
2. Click Import. The Import GC Directory File dialog displays.
3. Locate the GC directory file and select it. Click Open. The GC
Directory window reappears with the list of newly configured GCs
displayed in the GC Directory table.
1-14
MON20/20 Software for Gas Chromatographs
OCTOBER 2010
User Manual
3-9000-745
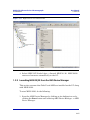
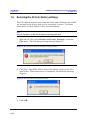
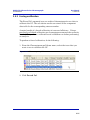
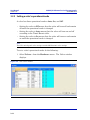
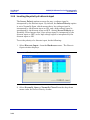
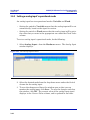
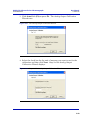
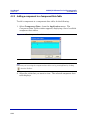
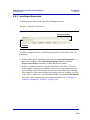
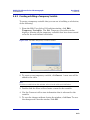
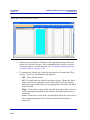
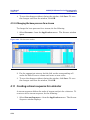
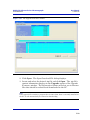
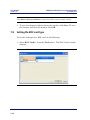
1.2.8 Launching MON 20/20 from the SNAP-ON for DeltaV
This section assumes that DeltaV is installed on the PC along with MON
20/20.
Note
To successfully use MON 20/20 SNAP-ON for DeltaV, you must be familiar with using
the DeltaV digital automation system.
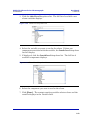
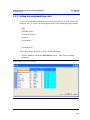
To start MON 20/20, do the following:
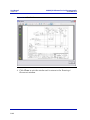
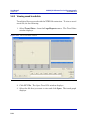
1. Start the DeltaV Explorer by clicking on its desktop icon or by clicking
the Start button and selecting DeltaV → Engineering → DeltaV
Explorer.
2. In the Device Connection View, open device icons by clicking once on
each icon. Follow the path of connections until you locate the desired
gas chromatograph icon.
1-15
User Manual
3-9000-745
MON20/20 Software for Gas Chromatographs
OCTOBER 2010
Figure 1-10. The Device Connection View
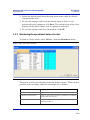
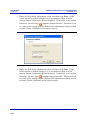
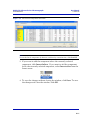
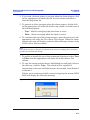
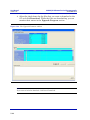
3. Right-click on a connected gas chromatograph icon to display the
context menu.
1-16
MON20/20 Software for Gas Chromatographs
OCTOBER 2010
User Manual
3-9000-745
Figure 1-11. Right-click to view context menu
4. Select SNAP-ON/Linked Apps → Launch MON 20/20. MON 20/20
starts and connects automatically to the GC.
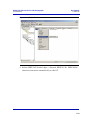
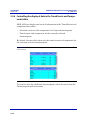
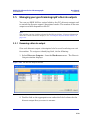
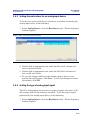
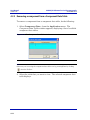
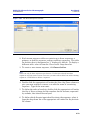
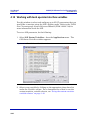
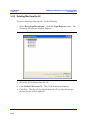
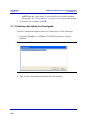
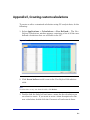
1.2.9 Launching MON 20/20 from the AMS Device Manager
This section assumes that DeltaV and AMS are installed on the PC along
with MON 20/20.
To start MON 20/20, do the following:
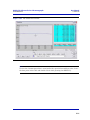
1. Start the AMS Device Manager by clicking on its desktop icon or by
clicking the Start button and selecting AMS Device Manager → AMS
Device Manager.
1-17
User Manual
3-9000-745
MON20/20 Software for Gas Chromatographs
OCTOBER 2010
Figure 1-12. Device Explorer
2. In the Device Connection View, open device icons by clicking once on
each icon. Follow the path of connections until you locate the desired
gas chromatograph icon.
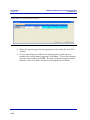
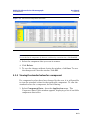
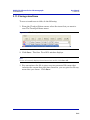
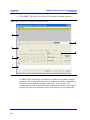
3. Right-click on a connected gas chromatograph icon to display the
context menu.
1-18
MON20/20 Software for Gas Chromatographs
OCTOBER 2010
User Manual
3-9000-745
Figure 1-13. Right-click to view the context menu
4. Select SNAP-ON/Linked Apps → Launch MON 20/20. MON 20/20
starts and connects automatically to the GC.
1-19
User Manual
MON20/20 Software for Gas Chromatographs
3-9000-745
OCTOBER 2010
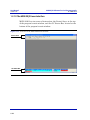
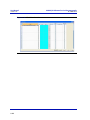
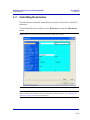
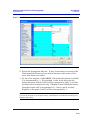
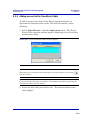
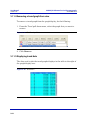
1.2.10 The MON 20/20 user interface
MON 20/20 has two areas of interaction: the Control Area, at the top
of the program’s main window, and the GC Status Bar, located at the
bottom of the program’s main window.
Figure 1-14. Features of the MON 20/20 main window
Control Area
GC Status Bar
1-20
MON20/20 Software for Gas Chromatographs
OCTOBER 2010
User Manual
3-9000-745
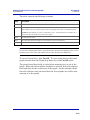
The main user interface
The main user interface of the main window contains the menus and
icons that allow you to control MON 20/20 and the GC to which MON
20/20 is connected.
Figure 1-15. The Control Area
Titlebar
Menu bar
Toolbar
Dialog Control Tabs
Titlebar - The Titlebar displays the name of the program, and well as
the program’s connection status. MON 20/20 has the following three
overall status modes:
-
-
Not connected - If MON 20/20 is not connected to a GC, then “MON
20/20” displays in the Titlebar.
Connected - If MON 20/20 is connected to a GC, then “MON 20/20 Connected to” and the name of the GC and the connection type
displays in the Titlebar.
Offline Edit - If MON 20/20 is in offline edit mode, then “MON 20/
20 - Offline Edit <filename>” displays in the Titlebar.
• Menu bar - The Menu bar contains the commands that allow you to
control and monitor gas chromatographs.
1-21
User Manual
MON20/20 Software for Gas Chromatographs
3-9000-745
OCTOBER 2010
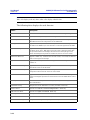
• Toolbar - The Toolbar contains shortcut icons for the most important
and/or most often used MON 20/20 commands. From the Toolbar you
can do such things as connect to and disconnect from a GC, view chromatographs, and view help files.
Table 1-1. Function of the shortcut icons on the Toolbar
Connect to a gas chromatograph.
Disconnect from a gas chromatograph.
Open a configuration file.
Print a GC configuration report.
View the Timed Events window.
View the Component Data window.
Clear or acknowledge alarms.
Open the CGM Viewer window.
Begin auto sequencing.
Halt auto sequencing.
Open the About MON 20/20 window.
1-22
MON20/20 Software for Gas Chromatographs
OCTOBER 2010
User Manual
3-9000-745
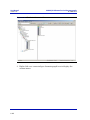
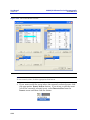
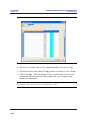
• Dialog Control Tabs bar - The Dialog Control Tabs bar contains
four buttons that allow you to manage the behavior of all windows
that are open in the main window. The four buttons are Minimize
All, Maximize All, Restore All, and Close All.
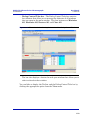
Figure 1-16. The main window showing the function of the Dialog Control Tabs bar
The bar also displays a button for each open window that allows you to
select or deselect that window.
You can hide or display the Toolbar and the Dialog Control Tabs bar by
clicking the appropriate option from the View menu.
1-23
User Manual
MON20/20 Software for Gas Chromatographs
3-9000-745
OCTOBER 2010
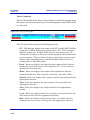
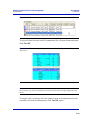
The GC Status Bar
The GC Status Bar of the main window displays useful information about
the status and functioning of the gas chromatograph to which MON 20/20
is connected.
Figure 1-17. The GC Status Bar
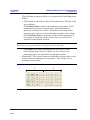
The GC Status Bar contains the following sections:
• GC - The first row displays the name of the GC to which MON 20/20 is
connected. If MON 20/20 is not connected to a GC, “Not Connected”
displays in this row. If MON 20/20 loses its connection to the GC,
“Comm Fail” displays in this row, and the program will automatically
try to reconnect. The second row displays status flags such as active
alarms (with red background), unacknowledged alarms (with red
background), or File Edit modes.
• Det # - Each row displays the identification number of the detector
monitoring the alarm status of the connected GC. A GC can have a
maximum of two detectors.
• Mode - Each row displays the mode of the appropriate detector.
Potential modes are: Idle, Auto Cal, Auto Base, Auto Anly, FCal.
• Stream - Each row displays the current stream being analyzed by the
appropriate detector.
• Next - Each row displays the next stream to be analyzed by the
appropriate detector.
• Anly - Each row displays the analysis time for the appropriate
stream.
• Cycle - Each row displays the total cycle time, in seconds, before the
next analysis starts for the appropriate detector.
• Run - Each row displays the amount of time, in seconds, that has
elapsed since the current cycle began for the appropriate detector.
1-24
MON20/20 Software for Gas Chromatographs
User Manual
OCTOBER 2010
3-9000-745
• GC System - Displays the date and time according to the GC to which
MON 20/20 is connected. The date and time displayed may be
different from the user’s date and time, depending on the physical
location of the GC.
• FID Flame Status - Displays the status of the FID flame. Options
are OFF with red background, ON with green background, and OVER
TEMP with red background. The FID Flame Status indicator only
displays on the GC Status Bar when the GC to which MON 20/20 is
connected contains an FID detector.
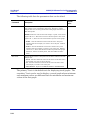
You can hide or display the GC Status Bar by clicking GC Status Bar
from the View menu.
1.2.11 Connecting to a gas chromatograph
To connect to a gas chromatograph, you must log on to it first. Most of
MON 20/20’s menus and options are inactive until you have logged on to a
GC.
To connect to a GC, do the following:
1. There are two ways to start the process:
(a.) On the Toolbar, click
.
(b.) Select Connect... from the Chromatograph menu.
2. The Connect to GC dialog, which displays a list of all the GCs to which
you can connect, appears.
1-25
User Manual
3-9000-745
MON20/20 Software for Gas Chromatographs
OCTOBER 2010
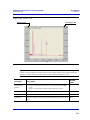
Figure 1-18. The Connect to GC window
Note
If you want to edit the connection parameters for one or all GCs listed in the Connect to
GC window, click Edit Directory. The GC Directory window will appear. See
“Configuring MON 20/20 to connect to a gas chromatograph” on page 1-10 for more
information.
Click the Ethernet button beside the GC to which you want to connect.
1-26
MON20/20 Software for Gas Chromatographs
OCTOBER 2010
User Manual
3-9000-745
3. The Login dialog appears.
Figure 1-19. The Login window
Note
All GCs are shipped with two default user names: daniel and emerson. A user pin is
not required when using either of these user names and both user names allow
administrator-level access to the GC. To add a user pin to either of these user names or
for information about creating and edit user names in general, see “Managing users” on
page 7-17.
Enter a user name and user PIN and click OK. Once connected, the
name of the GC appears under the GC column in the GC Status Bar.
Figure 1-20. The GC Status Bar showing a successful connection to a GC
Note
If you enter an invalid user name or password, the Login dialog will close without
connecting to the GC.
1-27
User Manual
MON20/20 Software for Gas Chromatographs
3-9000-745
OCTOBER 2010
1.2.12 Disconnecting from a gas chromatograph
Disconnecting from a GC will automatically log you off of the GC.
To disconnect from a gas chromatograph, do one of the following:
• On the Toolbar, click
.
• Select Disconnect from the Chromatograph menu.
Note
If you are connected to a GC and want to connect to a different GC, it is not necessary to
disconnect first; simply connect to the second GC, and in the process MON 20/20 will
disconnect from the first GC.
1.3
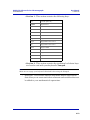
Keyboard commands
You can use the following keyboard keystrokes throughout the program:
Table 1-2. Frequently Used Keystrokes
Keystroke
Action
ARROW
keys
Moves cursor:
• Left or right in a data field.
• Up or down in a menu or combo box.
• Up or down (column), left or right (row) through displayed data entries.
DELETE
• Deletes the character after cursor.
• Deletes selected rows from a table or return row values to the default
settings.
ENTER
Activates the default control element (e.g., the OK button) in current window.
ESC
Exits application or active window without saving data.
F1
Accesses context-sensitive help topics.
INSERT
• Toggles between insert and type-over mode in selected cell.
• Inserts a new row above the highlighted row.
SHIFT+TAB
Moves to previous control element (e.g., button) or data field in window; see
TAB description.
1-28
MON20/20 Software for Gas Chromatographs
User Manual
OCTOBER 2010
3-9000-745
Table 1-2. Frequently Used Keystrokes (Continued)
Keystroke
Action
SPACE
Toggles settings (via radio buttons or check boxes).
TAB
Moves to the next control element (e.g., button) in the window; to use TAB key
to move to next data field, select Program Settings... from the File menu
and clear the Tab from spreadsheet to next control check box.
You can use the following function keys from the main window:
Table 1-3. Main menu function keys
Function
Key
Action
F2
Starts the Auto-Sequencing function. See “Auto sequencing” on page 6-2 for
more information.
F3
Halts the GC (e.g., an analysis run) at the end of the current cycle. See “Halting
an analysis” on page 6-1 for more information.
F5
Displays the Timed Event table per specified stream. See “Managing timed
events” on page 4-17 for more information.
F6
Displays the Component Data table per specified stream. See “Managing
Component Data Tables” on page 4-5 for more information.
F7
Displays the chromatogram for the sample stream being analyzed. See
“Viewing a live chromatogram” on page 2-3 for more information.
F8
Displays any chromatogram stored in the GC Controller. See “Viewing an
archived chromatogram” on page 2-5 for more information.
1-29
User Manual
MON20/20 Software for Gas Chromatographs
3-9000-745
1.4
OCTOBER 2010
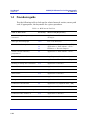
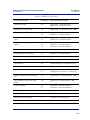
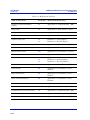
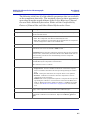
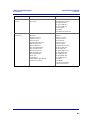
Procedures guide
Use the following table to look up the related manual section, menu path
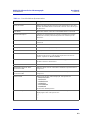
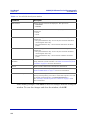
and, if appropriate, the keystroke for a given procedure.
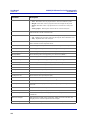
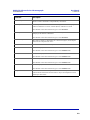
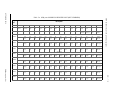
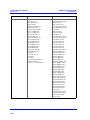
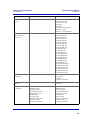
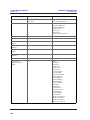
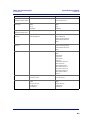
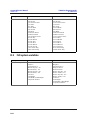
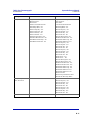
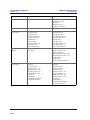
Table 1-4. MON 20/20 Task List
Task or Data Item
Section(s)
Menu Path [Keystroke]
24-hour average, component(s)
measured
4.5.2
Application → Calculations →
Averages...
Add a gas chromatograph
1.2.6
File → GC Directory
Alarms, related components
4.2
4.8
3.4
Application → Component Data... [F6]
Application → Limit Alarms → User...
Hardware → Discrete Outputs...
Alarms, stream number(s)
programmed
4.8
Application → Limit Alarms → User...
Analysis Report (on/off)
5.7.3
Logs/Reports → Printer Control...
Analysis time
4.3.4
Application → Timed Events... [F5]
Starting or ending auto-calibration
4.10
Application → Streams...
Auto-calibration interval
4.10
Application → Streams...
Auto-calibration start time
4.10
Application → Streams...
Autocal time
4.10
Application → Streams...
Baseline
4.10
Application → Streams...
Base pressure used for calculations
4.10
Application → Streams...
Calibration concentration
4.2
Application → Component Data... [F6]
Calibration cycle time
4.3.4
Application → Timed Events... [F5]
Calibration runs, number averaged
4.10
Application → Streams...
Calibration runs, number of
4.10
Application → Streams...
Calibration stream number
4.10
Application → Streams...
1-30
MON20/20 Software for Gas Chromatographs
User Manual
OCTOBER 2010
3-9000-745
Table 1-4. MON 20/20 Task List
Task or Data Item
Section(s)
Menu Path [Keystroke]
Communications
4.12
Application → Communication...
Application → Ethernet Ports...
Component code and name
4.2
Application → Component Data... [F6]
Component full scale (for output)
4.1
3.6
Application → System...
Hardware → Analog Outputs...
Component(s) programmed for
input
3.5
3.3
Application → Analog Inputs...
Application → Discrete Inputs...
Component(s) programmed for
output
4.8
3.6
3.4
Application → Limit Alarms → User...
Hardware → Analog Outputs...
Hardware → Discrete Outputs...
Component, retention time
4.2
Application → Component Data... [F6]
Component zero (for output)
3.6
Hardware → Analog Outputs...
Compressibility (on/off)
4.5.1
Application → Calculations → Control...
Current date
2.6
Chromatograph → View/Set GC Time...
Current time
2.6
Chromatograph → View/Set GC Time...
Cycle time
4.3.4
Application → Timed Events... [F5]
Delete alarms
4.8
5.1
Application → Limit Alarms...
Logs/Reports → Alarms → Alarm Log...
Delete component from component
list
4.2
Application → Component Data... [F6]
Delete inhibit, integration, peak
width
4.3.4
Application → Timed Events... [F5]
Delete output(s)
3.6
3.4
Hardware → Analog Outputs...
Hardware → Discrete Outputs...
Enable or disable multi-user write
4.1
Application → System...
Existing alarm(s)
5.1
Logs/Reports → Alarms → Alarm Log...
Full-scale value (for input)
3.5
Hardware → Analog Inputs...
GPM liquid equivalent (on/off)
4.5.1
Application → Calculations → Control...
1-31
User Manual
MON20/20 Software for Gas Chromatographs
3-9000-745
OCTOBER 2010
Table 1-4. MON 20/20 Task List
Task or Data Item
Section(s)
Menu Path [Keystroke]
Height or area measurement
method
4.2
Application → Component Data... [F6]
High alarm
4.8
Application → Limit Alarms → User...
(Analyzer) I.D.
4.1
Application → System...
Inhibit on-off times
4.3.4
Application → Timed Events... [F5]
Input(s) being used
3.5
3.3
Hardware → Analog Inputs...
Hardware → Discrete Inputs...
Integration on-off times
4.3.4
Application → Timed Events... [F5]
Low alarm
4.8
Application → Limit Alarms → User...
Mole percent (on/off)
4.5.1
Application → Calculations → Control...
Normalization (on/off)
4.5.1
Application → Calculations → Control...
Outputs being used
4.8
3.6
3.4
Application → Limit Alarms → User...
Hardware → Analog Outputs...
Hardware → Discrete Outputs...
Peak width, on time
4.3.4
Application → Timed Events... [F5]
Ratio (on/off)
4.6
Application → Calculations → User
Defined...
Ratio denominator
4.6
Application → Calculations → User
Defined...
Ratio, stream number(s)
4.6
Application → Calculations → User
Defined...
Relative density (on/off)
4.5.1
Application → Calculations → Control...
Response factor
4.2
Application → Component Data... [F6]
Response factor, percent deviation
4.2
Application → Component Data... [F6]
Retention time, percent deviation
4.2
Application → Component Data... [F6]
Spectrum gain
4.3.3
Application → Timed Events... [F5]
1-32
MON20/20 Software for Gas Chromatographs
User Manual
OCTOBER 2010
3-9000-745
Table 1-4. MON 20/20 Task List
Task or Data Item
Section(s)
Menu Path [Keystroke]
Stream number(s) (for output)
4.8
3.6
3.4
Application → Limit Alarms → User...
Hardware → Analog Outputs...
Hardware → Discrete Outputs...
Stream sequences skipped, number
4.1
4.10
Application → System...
Application → Streams...
Streams analyzed, number
4.1
4.10
Application → System...
Application → Streams...
Streams analyzed, sequence
4.1
4.10
Application → System...
Application → Streams...
Valve on/off times
4.3.1
Application → Timed Events... [F5]
Weight percent (on/off)
4.5.1
Application → Calculations → Control...
Wobbe value (on/off)
4.5.1
Application → Calculations → Control...
Zero value (for input)
3.5
Hardware → Analog Inputs...
1.5
Configuring a gas chromatograph
Use the File menu to edit, save, and restore configuration files.
1.5.1 Editing a configuration file
To edit a configuration file, do the following:
1. Disconnect from the GC.
2. Select Open Configuration File... from the File menu. The Open
dialog displays. Configuration files are saved with the .xcfg
extension.
3. Locate and select the configuration file that you want to edit and click
Open. MON 20/20 opens the file in offline edit mode.
1-33
User Manual
3-9000-745
MON20/20 Software for Gas Chromatographs
OCTOBER 2010
Figure 1-21. MON 20/20 in offline edit mode
4. Use the Application and Hardware menu commands to edit the
GC’s settings. For more information on these commands, see
Section 3 and Section 4.
5. When finished configuring the GC, click
to disconnect from the
GC and to save the changes to the configuration file and to leave
offline edit mode.
1-34
MON20/20 Software for Gas Chromatographs
OCTOBER 2010
User Manual
3-9000-745
1.5.2 Saving a gas chromatograph’s current configuration
Configuration files are saved with the .xcfg extension. To save a GC’s
current configuration to a PC, do the following:
1. Select Save Configuration (to PC)... from the File menu. The Save
as dialog displays.
2. Give the file a descriptive name or use the pre-generated file name
and navigate to the folder to which you want to save the file.
3. Click Save.
1.5.3 Importing a configuration file
To import a new configuration into a GC or to restore a GC’s previous
configuration, do the following:
Note
The current configuration will be overwritten, so be sure to save it before importing a
new or previous configuration.
Note
The GC should be in Idle mode while performing this task.
1. Select Restore Configuration (to GC)... from the File menu. The
Open dialog displays. Configuration files are saved with the .xcfg
extension.
2. Locate and select the configuration file that you want to import and
click Open. The file’s data is loaded into the GC.
1-35
User Manual
MON20/20 Software for Gas Chromatographs
3-9000-745
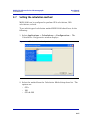
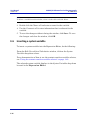
1.6
OCTOBER 2010
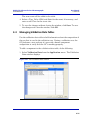
Restoring the GC to its factory settings
The GC’s default timed event, component data and validation data tables
are created at the factory and are not accessable by users. To restore
these tables to their default values, do the following:
Note
The GC should be in Idle mode while performing this task.
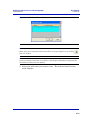
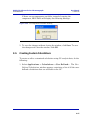
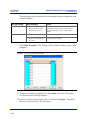
1. With the GC idle, select Restore to Factory Settings... from the
File menu. The following warning message displays:
Figure 1-22. Restore to Factory Settings warning message
2. Click Yes. The MON 20/20 restores the default values to the GC’s
data tables. When the process is completed, the following message
displays:
Figure 1-23. Restoration completed message
3. Click OK.
1-36
MON20/20 Software for Gas Chromatographs
OCTOBER 2010
1.7
User Manual
3-9000-745
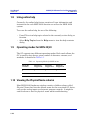
Configuring your printer
Select Print Setup... from the File menu to configure the settings for the
printer connected to your PC. These settings will apply to any print job
queued from MON 20/20, such as the reports that are configured by the
Printer Control. See “Printing reports automatically” on page 5-44 for
information.
Figure 1-24. The Print Setup dialog
The settings available depend on the printer model. Refer to the printer
manufacture’s user manual for more information.
Note
Your new configuration will be cleared, i.e., the settings will return to the default values,
when you exit MON 20/20.
1-37
User Manual
MON20/20 Software for Gas Chromatographs
3-9000-745
1.8
OCTOBER 2010
Using online help
Currently, the online help feature contains all user information and
instructions for each MON 20/20 function as well as the MON 20/20
system.
To access the online help, do one of the following:
• Press F1 to view help topics related to the currently active dialog or
function.
• Select Help Topics from the Help menu to view the help contents
dialog.
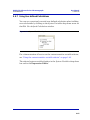
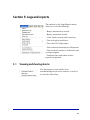
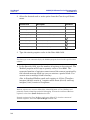
1.9
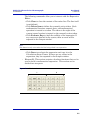
Operating modes for MON 20/20
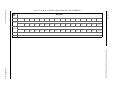
The GC supports two different operating modes. Each mode allows the
GC to analyze data from a given number of detectors, streams, and
methods, as detailed in Table 1-5.
Table 1-5. Operating Modes for MON 20/20
Mode ID
Number
Detectors
Supported
Streams
Supported
Methods
Supported
0
1
1
1
1
2
1
1
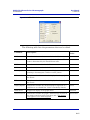
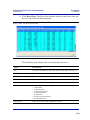
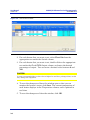
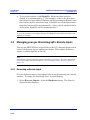
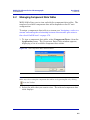
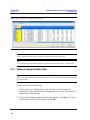
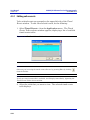
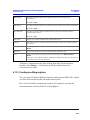
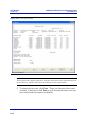
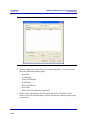
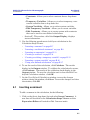
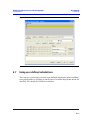
1.10 Viewing the Physical Name column
Most MON 20/20 hardware windows contain a hidden column called
Physical Name that lists the default name for the associated GC device,
such as the analog inputs or electronic pressure controls. It might be
useful to know a device’s physical name while troubleshooting.
1-38
MON20/20 Software for Gas Chromatographs
OCTOBER 2010
User Manual
3-9000-745
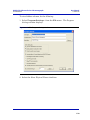
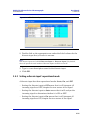
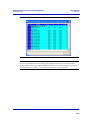
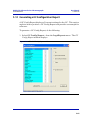
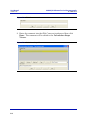
To view hidden columns, do the following:
1. Select Program Settings... from the File menu. The Program
Settings window displays.
Figure 1-25. The Program Settings window
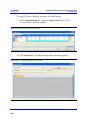
2. Select the Show Physical Names checkbox.
1-39
User Manual
MON20/20 Software for Gas Chromatographs
3-9000-745
OCTOBER 2010
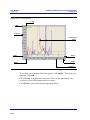
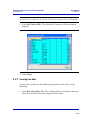
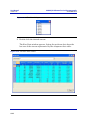
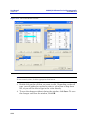
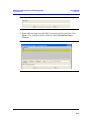
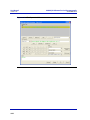
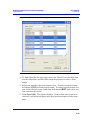
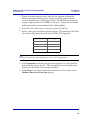
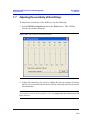
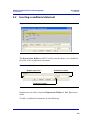
3. Click OK. The Physical Name column now will be visible on all
windows that have the column, such as the Heater window shown in
the example below.
Figure 1-26. The Heater window showing Physical Name column
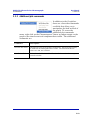
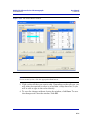
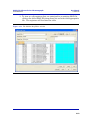
1.11 Selecting the GC’s networking protocol
MON 20/20 can connect to the GC using one of two networking protocols:
PPP or SLIP. If the version level of the GC’s firmware is 1.2 or lower,
MON 20/20 should be configured to use the SLIP protocol; otherwise, the
PPP protocol should be used.
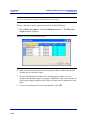
To select the GC’s networking protocol, do the following:
1. Select Program Settings... from the File menu. The Program
Settings window displays.
1-40
MON20/20 Software for Gas Chromatographs
OCTOBER 2010
User Manual
3-9000-745
Figure 1-27. The Program Settings window
2. To use the PPP protocol, make sure the Use PPP protocol for serial
connection (use SLIP if unchecked) checkbox is selected; to use the
SLIP protocol, make sure the Use PPP protocol for serial connection
(use SLIP if unchecked) checkbox is not selected.
3. Click OK.
1-41
User Manual
MON20/20 Software for Gas Chromatographs
3-9000-745
OCTOBER 2010
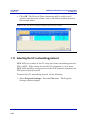
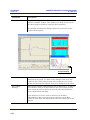
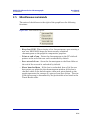
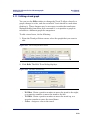
1.12 Using the context-sensitive variable selector
The MON 20/20 method for selecting variables for calculations and other
purposes is based on a simple, self-contained system.
Figure 1-28. Example of a context-sensitive variable selector
The context-sensitive variable selector consists of a first-level element,
called the context, that is followed by a series of tiered, drop-down lists.
The options available from the drop-down lists depend upon the context
element.
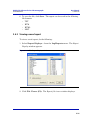
The following example explains how to use the context-sensitive variable
selector to select a user alarm variable:
1. Click on the second-level drop-down list. The full list of available
streams displays.
Figure 1-29. Second-level drop-down list
2. Select the stream you want to use for the alarm.
1-42
MON20/20 Software for Gas Chromatographs
OCTOBER 2010
User Manual
3-9000-745
3. Click the third-level drop-down list. The full list of available user
alarm variables displays.
Figure 1-30. Third-level drop-down list
4. Select the variable you want to use for the alarm. If there are
components associated with the variable, the fourth-level drop-down
list will display.
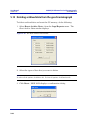
5. If displayed, click the fourth-level drop-down list. The full list of
available components displays.
Figure 1-31. Fourth-level drop-down list
6. Select the component you want to use for the alarm.
7. Click [Done]. The context-sensitive variable selector closes and the
variable displays in the Variable field.
1-43
User Manual
3-9000-745
Figure 1-32. Variable selected
1-44
MON20/20 Software for Gas Chromatographs
OCTOBER 2010
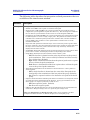
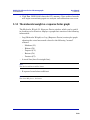
Section 2: Using the chromatograph functions
For viewing and managing chromatograms,
MON 20/20 is flexible and straighforward.
This chapter shows you how to connect to and
disconnect from a gas chromatograph. This
chapter also shows you how to access the
Chromatogram Viewer, as well as to use it to
view, print and manipulate various types of
chromatograms.
Finally, this chapter explains how to set a gas chromatograph’s date and
time.
2.1
Viewing chromatograms
Use the Chromatogram Viewer to display and print live, archived, or
saved chromatograms. There is no limit to the number of archived and
saved chromatograms that can be displayed at once; however, to
maximize performance, the number of chromatograms displayed should
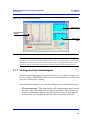
be limited to 25 or less. The Chromatogram Viewer can display all three
types of chromatograms together, alone, or in any combination.
The Chromatogram Viewer contains a host of information about both
current and past GC analyses, and it contains just as many ways of
editing and manipulating that data.
2-1
User Manual
MON20/20 Software for Gas Chromatographs
3-9000-745
OCTOBER 2010
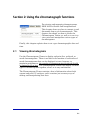
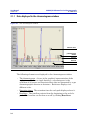
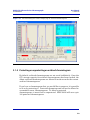
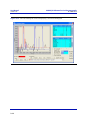
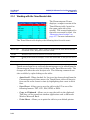
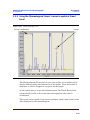
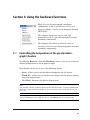
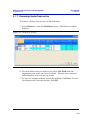
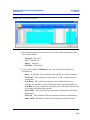
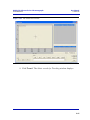
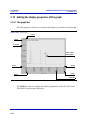
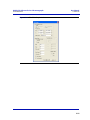
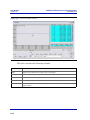
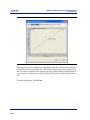
2.1.1 Data displayed in the chromatogram window
Figure 2-1. The chromatogram window
trace #1
retention time
peak detection
marker
trace #1
trace #2
timed event marker
The following elements are displayed in the chromatogram window:
• The chromatogram. A trace is the graphical representation of the
analysis results from a single detector; a chromatogram is the
collection of all traces and associated data that are generated by a gas
chromatograph’s detector or detectors. Each trace displays in a
different color.
• Retention times. The retention time for each peak displays above it.
• Baselines. The baseline projects from the beginning to the end of a
peak. The baseline can be turn on or off by clicking Baselines.
2-2
MON20/20 Software for Gas Chromatographs
User Manual
OCTOBER 2010
3-9000-745
• Timed event markers. These markers, which correspond to events
from the Timed Events table, display on the chromatogram as black
marks descending from the trace-line. There are three types of timed
event markers:
-
Valve events display as long descending marks.
Integration events display as medium descending marks.
Spectrum gain events display as short descending marks.
• Peak detection markers. These markers display on the chromatogram
as black marks ascending from the trace-line. Each peak has two
peak detection markers: one at its beginning and one at its end.
2.1.2 Viewing a live chromatogram
To view a live chromatogram, do the following:
1. Connect to the GC.
2. Select Chromatogram Viewer... from the Chromatograph menu.
Note
Another way to display the Chromatogram Viewer is to click
the Toolbar.
, which is located on
WARNING
To prevent the loss of any new data, be sure to save the chromatogram before closing
the Chromatogram Viewer. For more information, see “Saving a chromatogram trace”
on page 2-25.
3. From the Chromatogram Viewer window, check View current CGM.
2-3
User Manual
MON20/20 Software for Gas Chromatographs
3-9000-745
OCTOBER 2010
Figure 2-2. View Current CGM
The chromatogram displays in the chromatogram window. If the
chromatogram contains one trace, the Det1 checkbox is automatically
checked; if the chromatogram contains two traces, the Det1 and Det2
checkboxes are automatically checked. To remove a trace, uncheck its
detector checkbox.
Each trace that displays is color-coded; use the Chromatogram pulldown menu to select a specific trace.
Figure 2-3. Chromatogram pull-down menu
The list of GC events associated with the production of the
chromatogram, along with each event’s status and time, displays in
the Timed Events table to the right of the chromatogram display
window. The Component Data table, to the lower right of the
chromatogram display window, lists the components measured during
the analysis. These tables are updated in real-time, just as the
chromatogram is.
2-4
MON20/20 Software for Gas Chromatographs
OCTOBER 2010
User Manual
3-9000-745
Figure 2-4. The Chromatogram Viewer
timed events
chromatogram
window
component
data
Note
By default, the timed events and component data tables are configured to scroll to and
highlight the next occurring event in the analysis cycle. To disable this feature, rightclick on one of the tables and uncheck the Auto Scroll option on the pop-up menu.
2.1.3 Viewing an archived chromatogram
Archived chromatograms are stored on the GC, so you must be logged in
to access them. With MON 20/20 archived chromatograms as old as four
days are available for viewing.
Archived chromatograms are sorted and displayed on four tabbed panes:
• Chromatograms - This view displays all chromatogram types sorted
by time so that the newest file is always listed first. This view can be
further configured to display only the files from the last five runs for
each stream, or to display all the files that are stored on the GC.
2-5
User Manual
MON20/20 Software for Gas Chromatographs
3-9000-745
OCTOBER 2010
• Protected chromatograms - Protected chromatograms are never
deleted from the GC. To protect a chromatogram, see “Protecting or
unprotecting an archived chromatogram” on page 2-9.
Note
Protected chromatogram files have a “lock” icon (
) displayed beside them.
• Final Calibration chromatograms - MON 20/20 will store up to
one year’s worth—or approximately 370—of final calibration
chromatograms; once the limit is reached, MON 20/20 will delete the
oldest non-protected final calibration chromatogram for each new final
calibration chromatogram that is created. If multiple final calibration
chromatograms are created on the same day, the last chromatogram
created is archived, unless MON 20/20 has been configured to archive
all final calibration chromatograms.
Note
See “Managing the system” on page 4-2 to learn how to configure MON 20/20’s archiving
behavior.
2-6
MON20/20 Software for Gas Chromatographs
User Manual
OCTOBER 2010
3-9000-745
Final Validation chromatograms - These chromatograms are treated
in the same manner as final calibration chromatogram files.To view one
or more archived chromatograms, do the following:
1. Click GC Archive. The Select archive file(s) window appears.
Figure 2-5. The Select archive file(s) window
The files can be sorted by date, file name, analysis type, time, or
stream number by clicking the appropriate column header. By
default, they are sorted by date, with the newest file listed first.
Note
By default, only recent chromatograms—that is, the last five runs for each stream—are
displayed. To view all archived chromatograms, click All. To return to viewing only
recent chromatograms, click Recent.
2-7
User Manual
MON20/20 Software for Gas Chromatographs
3-9000-745
OCTOBER 2010
2. Select one or more archive files by clicking them. Use the SHIFT or
CTRL key to make multiple selections.
Note
To save the selected files to the PC, select the Download and save selected
chromatograms check box and click Download & Save.
3. Click Download & Show. The Select window displays for each
chromatogram that contains data from more than one detector.
Figure 2-6. The Select window
4. For each chromatogram, double-click either “Detector 1”, “Detector 2”,
or “Both” from the Select window.
MON 20/20 plots the archived chromatogram(s) and the corresponding
data displays in the timed event and component data tables.
2-8
MON20/20 Software for Gas Chromatographs
OCTOBER 2010
User Manual
3-9000-745
Figure 2-7. The Chromatogram Viewer displaying an archived chromatogram
2.1.4 Protecting or unprotecting an archived chromatogram
By default, archived chromatograms are not saved indefinitely. Once the
GC’s storage capacity for archived chromatograms has been reached, the
oldest archived chromatograms are deleted to make room for the newest
archived chromatograms.
If you have a chromatogram that you would like to preserve, it is possible
to do so by protecting it. Protected chromatograms will not be deleted to
accomodate newer chromatograms. To delete a protected
chromatograms, it must first be unprotected. MON 20/20 will save up to
100 protected chromatograms.
2-9
User Manual
MON20/20 Software for Gas Chromatographs
3-9000-745
OCTOBER 2010
Note
Protected chromatograms have a “lock” icon (
) displayed beside them.
Note
To protect an archived chromatogram you must be logged in as a supervisor or admin.
To protect a chromatogram, do the following:
1. Click GC Archive. The Select Archive File(s) window appears.
Figure 2-8. The Select archive file(s) window
The chromatograms can be sorted by date, file name, analysis type,
time, or stream number by clicking the appropriate column header.
2-10
MON20/20 Software for Gas Chromatographs
OCTOBER 2010
User Manual
3-9000-745
By default, they are sorted by date, with the newest chromatogram
listed first.
Note
By default, only recent chromatograms—that is, the last five runs for each stream—are
displayed. To view all archived chromatograms, click All. To return to viewing only
recent chromatograms, click Recent.
2. Make sure the Chromatogram tab is selected and then select the
appropriate archived chromatogram by clicking it. Use the SHIFT or
CTRL key to make multiple selections.
3. Click Protect. The Edit Description window displays.
Figure 2-9. The Edit Description window
4. Enter any information that you would like to have associated with the
chromatogram and then click OK. If you do not want to enter any
information, click Cancel.
) beside the selected chromatogram
MON 20/20 will place a “lock” icon (
to verify its protected status. You can also click on the Protected
Chromatograms tab to view your newly protected archived
chromatogram.
2-11
User Manual
MON20/20 Software for Gas Chromatographs
3-9000-745
OCTOBER 2010
To unprotect a protected file, do the following:
1. Click GC Archive. The Select archive file(s) window appears.
Figure 2-10. The Select archive file(s) window
2. Locate and select the protected chromatogram that you want to
unprotect. Use the SHIFT or CTRL key to make multiple selections.
) from
3. Click Unprotect. MON 20/20 will remove the “lock” icon (
beside the selected chromatogram. The chromatogram’s description
information, if any, will also be deleted. This chromatogram is now
eligible to be deleted to make room for newer archived
chromatograms.
2-12
MON20/20 Software for Gas Chromatographs
OCTOBER 2010
User Manual
3-9000-745
2.1.5 Viewing a saved chromatogram
To view a chromatogram that was saved to disk, do the following:
1. Click PC File. The Open dialog appears.
2. Navigate to the desired .xcgm file or .xcmp comparison file and select
it. To make multiple selections, use the SHIFT or CTRL key.
3. Click OK. The Select window displays for each chromatogram that
contains data for more than one detector.
Figure 2-11. The Select window
4. For each chromatogram, double-click either “Detector 1”, “Detector 2”,
or “Both” from the Select window.
MON 20/20 plots the archived chromatogram(s) and the corresponding
data displays in the timed event and component data tables.
2-13
User Manual
MON20/20 Software for Gas Chromatographs
3-9000-745
Figure 2-12. The Chromatogram Viewer displaying a saved chromatogram
2-14
OCTOBER 2010
MON20/20 Software for Gas Chromatographs
OCTOBER 2010
2.2
User Manual
3-9000-745
Working with the graph
Right-clicking with the mouse on the graph brings up the following
commands and keyboard shortcuts:
Command Name
Shortcut
Description
Zoom In
“+” (NUMPAD)
Zooms in on the entire graph.
NOTE: Another way to zoom in is by clicking and
dragging your mouse to select the region of the graph
that you want to zoom in on.
Zoom Out
“-” (NUMPAD)
Zooms out from the entire graph.
Zoom X In
“6” (NUMPAD)
Zooms in on the X axis.
Zoom X Out
“4” (NUMPAD)
Zooms out from the X axis.
Zoom Y In
“8” (NUMPAD)
Zooms in on the Y axis.
Zoom Y Out
“2” (NUMPAD)
Zooms out from the Y axis.
Save State
CTRL + HOME
Saves current or archived display settings for the
selected chromatogram.
NOTE: The Save State function is available only
when viewing a live or archived chromatogram.
Restore State
HOME
Restores the last saved display settings for the
selected chromatogram.
NOTE: Pressing HOME returns the user to the
saved state.
Toggle Full Screen
F11
Toggles the display of the Chromatogram Viewer’s
tables and buttons and maximizes the chromatogram
window.
Cursor to Nearest
Point
F8
Snaps the cursor to the nearest point on the
chromatograph in both the X and Y directions.
Toggle Coarse/
Fine Cursor
F4
Toggles the cursor from coarse and less accurate to
fine and more accurate.
Toggle Lines/Dots
Displays
F9
Toggles the chromatographs from lines to dots, or
dots to lines.
2-15
User Manual
MON20/20 Software for Gas Chromatographs
3-9000-745
OCTOBER 2010
Command Name
Shortcut
Description
Toggle Mouse
Position Tip
CTRL + F4
The graph’s cursor follows the movement of the
mouse while a hovering tooltip displays the exact
coordinates of the current point.
Toggle Nearest
Position Tip
CTRL + F9
The graph’s cursor follows the movement of the
mouse cursor.
Print
CTRL + P
Prints the chromatogram.
Copy to clipboard
CTRL + C
Copies from the graph the raw detector data that was
used to plot the selected chromatogram. This data
can be pasted into another application such as
Microsoft Word or Microsoft Excel.
Paste from
clipboard
CTRL + V
Plots a range of points copied from another
application such as Microsoft Word or Microsoft
Excel.
2.3
Editing the display properties of the chromatograph
MON 20/20 allows you to change the appearance of many of the
chromatogram’s elements, such as its x-axis and y-axis values, the color
of the chromatograph’s background, and the display status of its labels.
2.3.1 The Graph bar
Use the Graph bar buttons to change the display parameters of the
chromatogram.
Click Edit from the Graph bar. The Edit Scales window displays.
2-16
MON20/20 Software for Gas Chromatographs
User Manual
OCTOBER 2010
3-9000-745
Figure 2-13. The Edit Scales window
The following table lists the parameters that can be edited:
Command
Description
Default
Value
X Min
Sets the minimum value, in seconds, for the X axis.
0
X Max
Sets the maximum value, in seconds, for the X axis. The is
value is determined by the Timed Events table.
100
Y Min
Sets the minimum value for the Y axis.
-10
Y Max
Sets the maximum value for the Y axis.
100
Print Speed
Sets the number of inches per second for the x-axis while
printing a chromatogram, similar to an XY plotter.
0
X Intervals
Sets the number of intervals to be displayed on the graph for
the X axis.
10
Y Intervals
Sets the number of intervals to be displayed on the graph for
the Y axis.
11
Display Option
Determines whether the chromatograph is displayed as a
solid line or as a dotted line. Lines is checked by default.
Lines
Show labels
Toggles the display of the graph labels.
Checked
Scroll newest X
Determines whether the graph’s window moves to focus on
the most recent data point along the x axis. This feature
only applies to live chromatograms.
Unchecked
2-17
User Manual
MON20/20 Software for Gas Chromatographs
3-9000-745
OCTOBER 2010
Figure 2-14. A chromatogram
Y axis
Y Max
Y interval
color-coded
traces
Y Min
X axis
X max
X Min
X interval
To see how your changes affect the graph, click Apply. To accept your
changes, click OK.
• Click Cursor to toggle the cursor size from coarse movement (less
accurate) to fine movement (more accurate).
• Click Print to print the chromatogram window.
2-18
MON20/20 Software for Gas Chromatographs
OCTOBER 2010
User Manual
3-9000-745
2.3.2 Additional plot commands
In addition to the Graph bar,
there are a few other commands
available that allow you to
manipulate the look and feel of
the graph. To access the
additional plot commands
menu, right-click on the Chromatogram Viewer anywhere except on the
graph or the timed event and component data tables. The additional
commands are:
Command
Description
Set Plot Area Color
Changes the color of the graph’s background. This may be necessary
to make the chromatograms more visible. The default RGB color
values are 236, 233, and 216.
Auto Resize Series
Scales down the X-axis and the Y-axis to fit the entire chromatogram
onto the window.
2-19
User Manual
MON20/20 Software for Gas Chromatographs
3-9000-745
OCTOBER 2010
Command
Description
Show Mini Plot
Toggles the display of a smaller version of the chromatogram in a
separate, resizable window. This allows you to keep an overview of
the entire graph at all times, especially when zoomed in.
This window automatically displays whenever you zoom in on the
original chromatogram.
mini-plot window
Rearrange Series
Resizes and offsets two or more traces so that they can both be fully
displayed on the graph. To offset a trace means to raise its Y-axis
relative to the Y-axis of the previous trace so that one trace is not
drawn over the other but instead one trace is drawn above the other.
Trace Offset
Settings
Indicates the amount of offset between two or more traces. To offset a
trace means to raise its Y-axis relative to the Y-axis of the previous
trace so that one trace is not drawn over the other but instead one
trace is drawn above the other.
If two detectors are in use, each set of traces can be offset
independently--that is, the traces for one detector can be offset
relative to each other, but independent of the traces from the second
detector.
2-20
MON20/20 Software for Gas Chromatographs
OCTOBER 2010
2.4
User Manual
3-9000-745
Working with a chromatogram
Figure 2-15. The Chromatogram bar
The Chromatogram bar contains a row of buttons that allows you to
manipulate a single chromatogram. Below the row of buttons is the
chromatogram pull-down menu, which contains a list of all of the
currently displayed chromatograms/traces. Before you can work with a
chromatogram you must first select it from the pull-down menu.
2.4.1 Editing a chromatogram trace
You can use the Edit function to change the X and Y offset values for a
trace, as well as its color. These changes may be necessary to make the
trace more distinguishable from those that surround it, or to align a trace
with a different trace for comparison.
To edit a trace, do the following:
1. Select the trace that you want to edit from the Chromatogram pulldown menu.
Figure 2-16. Chromatogram pull-down menu
2-21
User Manual
MON20/20 Software for Gas Chromatographs
3-9000-745
OCTOBER 2010
2. Click Edit. The Edit Chromatogram dialog appears.
Figure 2-17. The Edit Chromatogram dialog
Command
Description
X Offset
Enter a positive number to move the trace to the right, or a negative number to
move the trace to the left.
Y Offset
Enter a positive number to move the trace up, or a negative number to move the
trace down.
# points
Number of data points in the trace. This field is read-only.
Color
Assigns a color to the trace.
3. To see how your changes affect the trace, click Apply. To accept your
changes, click OK.
2-22
MON20/20 Software for Gas Chromatographs
OCTOBER 2010
User Manual
3-9000-745
2.4.2 Viewing chromatogram results
To display a table of calculation results for a trace, do the following:
1. From the Chromatogram pull-down menu, select the appropriate
trace.
Figure 2-18. Chromatogram pull-down menu
2. Click Results. A window appears displaying the calculation results
for the selected trace.
2-23
User Manual
MON20/20 Software for Gas Chromatographs
3-9000-745
OCTOBER 2010
Figure 2-19. The results window
• Click Save to save these results in one of the following formats:
tab-delimited (.txt), comma-delimited (.csv), Microsoft Excel (.xls),
HTM (.htm), or XML (.xml).
• Click Clipboard to copy the data to the Windows clipboard, where
it can be pasted into another document.
• Click Print to print a tab-delimited version of the results.
2-24
MON20/20 Software for Gas Chromatographs
OCTOBER 2010
User Manual
3-9000-745
2.4.3 Saving a chromatogram trace
To save a trace to disk, do the following:
1. From the Chromatogram pull-down menu, select the trace that you
want to save.
Figure 2-20. Chromatogram pull-down menu
2. Click Save. The Save As window displays.
Figure 2-21. The Save As window
2-25
User Manual
MON20/20 Software for Gas Chromatographs
3-9000-745
OCTOBER 2010
3. For convenience the file is given an auto-generated file name that
includes the trace’s creation date and time; however, you can give the
file any name that you choose. Click Save and the specified trace will
be saved.
2.4.4 Removing a chromatogram trace from view
To remove a live trace from the chromatogram window, do one of the
following:
• If you want to remove all live traces, click the View current CGM check
box to uncheck it.
• If you want to remove a single live trace, click the appropriate detector
checkbox beside the View current CGM check box.
To remove a saved or an archived trace from the chromatogram window
and to close the associated .xcgm file, do the following:
1. From the Chromatogram pull-down menu, select the trace that you
want to remove.
Figure 2-22. Chromatogram pull-down menu
2. Click Remove.
2-26
MON20/20 Software for Gas Chromatographs
OCTOBER 2010
User Manual
3-9000-745
2.4.5 Forcing a calibration
The Forced Cal command uses an archived chromatogram’s raw data to
calibrate the GC. The calculation results are stored in the component
data table for the corresponding stream number.
A major benefit of a forced calibration is increased efficiency. Using a
previously validated calibration gas chromatogram removes the necessity
for the GC to perform a calibration and validation run before performing
an analysis.
To perform a forced calibration, do the following:
1. From the Chromatogram pull-down menu, select the trace that you
want to use to calibrate the GC.
Figure 2-23. Chromatogram pull-down menu
2. Click Forced Cal.
2-27
User Manual
MON20/20 Software for Gas Chromatographs
3-9000-745
OCTOBER 2010
2.4.6 Controlling the display of data in the Timed Events and Components tables
MON 20/20 can display two levels of information in the Timed Events and
component data tables:
• All timed events and all components for all open chromatograms.
• Timed events and components for the currently selected
chromatogram.
By default, the two tables show only the timed events and components for
the currently selected chromatogram.
Figure 2-24. Timed events and component data tables showing data for a currently
selected trace
To view the data for a different chromatogram, select the trace from the
Chromatogram pull-down menu.
2-28
MON20/20 Software for Gas Chromatographs
OCTOBER 2010
User Manual
3-9000-745
Figure 2-25. Chromatogram pull-down menu
To view all timed events and all components for all open chromatograms,
click Cur/All.
Figure 2-26. Timed events and component data tables showing data for all currently
open traces
Note
The brackets ([ ]) on the Cur/All button indicate which mode is being displayed in the
tables.
To toggle back to viewing only the timed events and components for the
currently selected chromatogram, click Cur/All again.
2-29
User Manual
MON20/20 Software for Gas Chromatographs
3-9000-745
OCTOBER 2010
2.4.7 Saving a comparison file
A comparison file allows you to save your current view, including all open
chromatograms, for later review and reuse. To save a comparison file, do
the following:
1. Click Save Cmp. The Save As dialog appears.
2. Navigate to the folder in which you want to save the file.
3. For convenience the file is given an auto-generated file name that
includes the current date and time; however, you can give the file any
name that you choose.
4. Click Save.
2.4.8 Opening a comparison file
To open a comparison file, do the following:
1. Click PC File. The Open dialog displays.
2. Select XA CMP Files (*.xcmp) from the Files of type drop-down
menu.
3. Navigate to the folder that contains the comparison file that you want
to open and select the file.
4. Click Open.
2-30
MON20/20 Software for Gas Chromatographs
OCTOBER 2010
2.5
User Manual
3-9000-745
Miscellaneous commands
The series of check boxes to the right of the graph have the following
functions:
Figure 2-27. Miscellaneous options
• Keep last CGM - When viewing a live chromatogram, upon starting a
new run, MON 20/20 keeps the most recently completed
chromatogram on the graph for comparative purposes.
• Print at end of run - Prints the chromatogram to the PC's default
printer at the end of the run and is unchecked by default.
• Save at end of run - Saves the chromatogram to the Data folder at
the end of the run and is unchecked by default.
• Show bunched data - If this box is unchecked, then all of the raw
data points are plotted to the chromatogram window; if this box is
checked, which is the default option, then each point plotted on the
graph represents the average of a group of raw data values. The size
of the data group is determined by the peak width value listed in the
Timed Events table.
2-31
User Manual
MON20/20 Software for Gas Chromatographs
3-9000-745
OCTOBER 2010
2.5.1 Working with the Timed Events table
The Chromatogram Viewer
displays a compact version of the
Timed Events table, located on
the upper right side of the
window. The events displayed in
the table are sorted by time. See
“Managing timed events” on
page 4-17 for more information.
The Timed Event table displays the following data for each event:
Name
Description
Event Type
The type of timed event. These events are mapped to the Time Events window
and include Valve, Integration and Gain events.
Vlv/Det
Identifies which valve or detector is involved in the event.
Value
Setting of the event; for example, a valve was turned ON, or the gain was set to
4.
Time (s)
The number of seconds into the cycle that the event occurred or will occur.
Timed events from live or archived chromatograms can be edited from the
Chromatogram Viewer by right-clicking on the Timed Events table. The
changes will affect the next analysis run. The following commands are
also available by right-clicking on the table:
• Auto Scroll - When checked, if a live trace has been selected from the
Chromatogram pull-down menu, the Timed Event table will keep its
focus on the event closest in time by highlighting that event in dark
blue.
• Save Sheet - Allows you to save the table to the PC in one of the
following formats: TXT, CSV, XLS, HTM, or XML.
• Copy to Clipboard - Allows you to copy the table to the clipboard .
This data can be pasted into another application such as Microsoft
Word or Microsoft Excel.
• Print Sheet - Allows you to print the table to your default printer.
2-32
MON20/20 Software for Gas Chromatographs
OCTOBER 2010
User Manual
3-9000-745
2.5.2 Editing Timed Events from the Time Events window
To launch the Timed Events dialog directly, right-click on the
Chromatogram Viewer’s Timed Events table and select Edit Timed
Events Table. The Timed Events dialog displays. See “Managing timed
events” on page 4-17 for more information.
2.5.3 Editing Timed Events from the Chromatogram Viewer
To edit timed events from the Chromatogram Viewer, do the following:
1. From the Chromatogram pull-down menu, select the chromatogram
whose timed events you want to edit.
2. Depending on the type of event that you want to edit, do the following:
-
-
-
To edit valve events, right-click on the Timed Events table and
select Edit Timed Events (Valve Events). The Valve Events
table from the Timed Events dialog displays. See “Editing valve
events” on page 4-20 for more information.
To edit integration events, right-click on the Timed Events table
and select Edit Timed Events (Integration Events). The
Integration Events table from the Timed Events dialog displays.
See “Editing integration events” on page 4-22 for more
information.
To edit gain events, right-click on the Timed Events table and
select Edit Timed Events (Gain Events). The Spectrum Gain
Events table from the Timed Events dialog displays. See “Editing
spectrum gain events” on page 4-26 for more information.
3. To remove a selected event from the table, right-click on the event and
select Delete Row.
Note
This option is only available while in edit mode.
2-33
User Manual
MON20/20 Software for Gas Chromatographs
3-9000-745
OCTOBER 2010
4. To insert an event above the currently select event, right-click on the
table and select Insert before. To insert an event below the
currently select event, right-click on the table and select Insert after.
The new row will be added. The options available for configuring the
new event depends upon which edit mode you are in—Valve,
Integration, or Gain.
Note
These options are only avialable while in edit mode.
5. To save your changes, right-click on the table and select Save
Changes. The changes will affect the next analysis run. To return to
the Timed Events table without saving your changes, select Discard
Changes.
2-34
MON20/20 Software for Gas Chromatographs
OCTOBER 2010
User Manual
3-9000-745
2.5.4 Using the Chromatogram Viewer’s cursor to update a Timed
Event
Figure 2-28. Chromatograph cursor
cursor coordinates
cursor
The Chromatogram Viewer has its own cursor that can be displayed by
double-clicking within the boundaries of the graph. Once the cursor is
displayed, it can be dragged to any point on the graph.
As the cursor moves across the chromatogram, the Timed Event table
automatically scrolls to the event that corresponds to the cursor’s
coordinates.
The cursor can be useful if you want to change a timed event based on the
data displayed by the chromatogram.
2-35
User Manual
MON20/20 Software for Gas Chromatographs
3-9000-745
OCTOBER 2010
To update a timed event based on the location of the Chromatogram
Viewer’s cursor, do the following:
1. Select the live or archived trace that you want to use as the source for
changing the timed event.
2. Double-click on the graph to display the cursor. The cursor’s
coordinates display in the upper left corner of the graph. The xcoordinate represents the analysis time in seconds. With this
information in mind, drag the cursor to the desired location.
Note
To toggle the cursor’s size between coarse movement (less accurate) and fine movement
(more accurate), click Cursor from the Graph bar.
3. Go to the Time Events table and right-click on the event.
4. Select Update Time from Cursor. The event’s time will be changed
to match the cursor’s time (x-coordinate).
5. To save your changes, right-click on the table and select Save
Changes. The changes will affect the next analysis run. To return to
the Timed Events table without saving your changes, select Discard
Changes.
2-36
MON20/20 Software for Gas Chromatographs
OCTOBER 2010
User Manual
3-9000-745
2.5.5 Working with the Component Data Table
The Chromatogram Viewer
displays a compact version of the
Component Data table beneath
the Timed Events table. See
“Managing Component Data
Tables” on page 4-5 for more
information.
The Component Data table
displays the following data for each component:
Name
Description
Componet
The name of the component.
Det
Identifies the detector associated with the component.
Time (s)
The retention time for the component.
Retention times for components from live or archived chromatograms can
be edited from the Chromatogram Viewer by right-clicking on the
Component Data table. The changes will affect the next analysis run.
The following commands are also available by right-clicking on the table:
• Auto Scroll - When checked, if a live trace has been selected from the
Chromatogram pull-down menu, the Component Data table will keep
its focus on the component closest in time by highlighting that it in
dark blue.
• Save Sheet - Allows you to save the table to the PC in one of the
following formats: TXT, CSV, XLS, HTM, or XML.
• Copy to Clipboard - Allows you to copy the table to the clipboard .
This data can be pasted into another application such as Microsoft
Word or Microsoft Excel.
• Print Sheet - Allows you to print the table to your default printer.
2-37
User Manual
MON20/20 Software for Gas Chromatographs
3-9000-745
OCTOBER 2010
2.5.6 Editing retention times from the Chromatogram Viewer
To edit the retention time for a component, do the following:
1. Right-click on the Component Data table and select Edit Retention
Times. The Ret column turns white, indicating that its cells are
editable.
2. Click on the Ret cell for the component that you want edit, and enter a
new retention time value, in seconds. The value must be less than the
Analysis time.
3. To save your changes, right-click on the table and select Save
Changes. The changes will affect the next analysis run. To return to
the Component Data table without saving your changes, select
Discard Changes.
2.5.7 Viewing raw data
Use the Raw Data button to display the Raw Data table for the selected
trace.
1. Use the Chromatogram pull-down menu to select a specific trace.
Figure 2-29. Chromatogram pull-down menu
Note
Even though you are selecting a trace, the data that is displayed will be fore the
chromatogram, which may include more than one trace.
2-38
MON20/20 Software for Gas Chromatographs
OCTOBER 2010
User Manual
3-9000-745
2. Click Raw Data. The Raw Data window displays and shows the raw
data for the selected chromatogram.
Figure 2-30. The Raw Data window
The following data displays for each peak from the trace:
Name
Description
No.
Numerical identifier for the peak, listed by the order of discovery.
Ret Time
Time, in seconds, that the component eluted.
Peak Area
The area under the peak.
Peak Height
The maximum height of the peak.
Det
The detector associated with the peak.
Method
Method of peak detection. Options are:
• 1 (Baseline)
• 2 (Fused Peak)
• 3 (Last Fused Peak)
• 4 (Tangent Skim)
• 100 (Inhibit)
• 300 (Forced Integration)
• 500 (Summation)
Integ. Start
Time, in seconds, when integration started.
2-39
User Manual
MON20/20 Software for Gas Chromatographs
3-9000-745
OCTOBER 2010
Name
Description
Integ. Stop
Time, in seconds, when integration stopped.
Peak Width Half Height
The width of the peak taken at half of the peak’s height.
Is Partial Peak
If Y, then the Partial Peak value is used in the summation
calculation; if N, then the Partial Peak value is not used in the
summation calculation.
2.6
Setting the gas chromatograph’s date and time
When MON 20/20 connects to a gas chromatograph, the Status Bar
displays the gas chromatograph’s date and time.
Note
The date and time displayed for the GC may be different from the user’s date and time,
depending on the physical location of the GC.
To set the gas chromatograph’s date and time, do the following:
1. Select View/Set Date Time... from the Chromatograph menu. The
View/Set Date Time window displays.
2-40
MON20/20 Software for Gas Chromatographs
OCTOBER 2010
User Manual
3-9000-745
Figure 2-31. The View/Set Date Time window
2. Use the drop-down menus to set the date and time. To enable or
adjust daylight savings, see “Adjusting daylight savings” on page 2-42.
3. Click OK.
2-41
User Manual
MON20/20 Software for Gas Chromatographs
3-9000-745
OCTOBER 2010
2.6.1 Adjusting daylight savings
Daylight savings time is the practice of temporarily advancing clocks so
that afternoons have more daylight and mornings have less. Typically
clocks are adjusted forward one hour near the start of spring and are
adjusted backward in autumn. Since the use of daylight savings time is
not universal, you have the option of enabling or disabling it in MON 20/
20.
To configure MON 20/20 to use daylight savings time, do the following:
1. Select View/Set Date Time... from the Chromatograph menu. The
View/Set Date Time window displays.
Figure 2-32. The View/Set Date Time window
2-42
MON20/20 Software for Gas Chromatographs
OCTOBER 2010
User Manual
3-9000-745
Note
Make sure the GC is set to the current date and time before enabling the daylight
savings feature.
2. Click the Enable Daylight Savings checkbox. The Daylight Savings
section will be enabled, giving you the following two options for setting
the start and end times for daylight savings:
• Week format. You can specify on which week day, of what week,
and of what month DST to start and end.
• Month/Day format. You can specify the exact day of the month and
the month number for which you want daylight savings to start
and end.
Note
These formats can be used interchangeably; for example, the Week format can be used
to specify the start date, and the Month/Day format can be used to specify the end date.
Figure 2-33. The Daylight Savings options
Week format
Start time
Advance time
Month/day time
End time
Set back time
3. Set the start date for daylight savings time.
4. Set the start time and the advance time.
2-43
User Manual
MON20/20 Software for Gas Chromatographs
3-9000-745
OCTOBER 2010
5. Set the end date for daylight savings time.
6. Set the end time and the setback time.
7. To implement your changes without closing the View/Set Date Time
window, click Save. To implement your changes and close the View/
Set Date Time window, click OK.
Note
Daylight savings time should be configured each time the feature is enabled; thereafter,
each year MON 20/20 will automatically compute the start and end times based on the
initial configuration.
2-44
Section 3: Using the hardware functions
Many of a gas chromatograph’s hardware
components—such as its heaters, valves, and
discrete outputs—can be easily managed through
MON 20/20.
This chapter shows you how to view and
administer each of a gas chromatograph’s major
hardware components.
This chapter also shows you how to view an
inventory of all of a gas chromatograph’s installed
hardware components.
3.1
Controlling the temperature of the gas chromatograph’s heaters
By selecting Heaters... from the Hardware menu, you can set a heater’s
desired temperature or fix its power output.
Each heater can be set to one of the following modes:
• Auto - Allows you to set the desired tempature for the heater.
• Fixed On - Allows you to set the power output for the heater without
regard to temperature.
• Not Used - Removes the heater from service.
Note
This window contains a hidden column labelled Physical Name. For more information
about this column and how to display it, see “Viewing the Physical Name column” on
page 1-38.
Note
Typically, Heater 1 is the “high hat” heater, and Heater 2 is the column heater.
3-1
User Manual
MON20/20 Software for Gas Chromatographs
3-9000-745
SEPTEMBER 2010
3.1.1 Renaming a heater
To assign an identifying label to a heater, do the following:
1. Select Heaters... from the Hardware menu. The Heaters window
displays.
Figure 3-1. The Heaters window
2. Double-click on the appropriate row under the Label column for the
heater that you want to name.
Note
The heaters are labelled Heater 1 - Heater N by default, where N equals the total
number of heaters available to the GC.
3. Type in a descriptive name for the heater. This name must be unique;
two heaters cannot share the same label.
4. Click OK.
3-2
MON20/20 Software for Gas Chromatographs
SEPTEMBER 2010
User Manual
3-9000-745
3.1.2 Setting the heater’s type
To set a heater’s type, do the following:
1. Select Heaters... from the Hardware menu.
Figure 3-2. The Heaters window
2. Click on the appropriate Heater Type cell and select AC or DC from
the drop-down list.
3. To save the changes without closing the window, click Save. To save
the changes and close the window, click OK.
3-3
User Manual
MON20/20 Software for Gas Chromatographs
3-9000-745
SEPTEMBER 2010
3.1.3 Monitoring the temperature of a heater
To check a heater’s temperature, select Heaters... from the Hardware
menu.
Figure 3-3. The Heaters window
The current temperature of each heater displays under the Temperature
column, and updates in real time. The percentage of the GC’s power
output that is being used by each heater displays under the Current PWM
column.
3-4
MON20/20 Software for Gas Chromatographs
User Manual
SEPTEMBER 2010
3-9000-745
3.1.4 Monitoring the operational status of a heater
To check a heater’s status, select Heaters... from the Hardware menu.
Figure 3-4. The Heaters window
The status of each heater displays under the Status column. There are
four possible status states, and their meanings are as follows:
OK
The heater’s control card is installed and is working correctly.
Not Installed
The heater’s control card is not installed.
Out of Control
The heater is running and is in the process of reaching its temperature
set point.
Error
The GC cannot communicate with the heater.
3-5
User Manual
MON20/20 Software for Gas Chromatographs
3-9000-745
SEPTEMBER 2010
3.1.5 Setting the desired temperature
To set the desired temperature for a heater, do the following:
1. Select Heaters... from the Hardware menu. The Heaters window
displays.
Figure 3-5. The Heaters window
2. For each heater that you want to set, select Auto from the appropriate
row under the Switch column.
3. For each heater that you want to set, double-click on the appropriate
row under the Setpoint column, and enter the desired temperature, in
degrees Celsius. You can enter a value between 20 and 500.
4. To exclude a heater from the Warm Start process, select its Ignore
Warm Start check box.
Note
A warm start occurs when the GC restarts after having been shut down during an auto
sequence analysis run. The GC will activate the heaters and wait until they reach their
setpoints and the temperature stabilizes; the GC will then resume the auto sequence
run.
3-6
MON20/20 Software for Gas Chromatographs
User Manual
SEPTEMBER 2010
3-9000-745
5. The appropriate rows under the PID Gain, PID Integral, and PID
Derivative columns can also be edited by double-clicking and entering
a new value. The value ranges for each column is as follows:
PID Gain
0 - 500
PID Integral
0 - 500
PID Derivative
0 - 50000
6. To save the changes and leave the window open so that you can
monitor the heaters’ status, click Save. The current temperature of
each heater displays in the Temperature column, and is updated in
real time.
7. To save the changes and close the window, click OK.
3.1.6 Setting PWM Output
Note
Pulse-Width Modulation (PWM) is a technique for providing intermediate amounts of
electrical power between fully on and fully off.
A heater needs voltage to operate. The amount of voltage that is
delivered to a heater can be controlled manually when the heater is set to
Fixed On mode. Setting a heater to Fixed On mode can be useful when
troubleshooting heater issues.
CAUTION
Fixed On mode is not recommended for general GC operations. Switching a heater to
Fixed On mode removes its ability to maintain a constant temperature because the
power delivered to the heater will not fluctuate based on the temperature setpoint, but
will instead remain at the level set by the user.
To set a heater’s PWM Output, do the following:
1. Select Heaters... from the Hardware menu. The Heaters window
displays.
3-7
User Manual
MON20/20 Software for Gas Chromatographs
3-9000-745
SEPTEMBER 2010
Figure 3-6. The Heaters window
2. For each heater that you want to set, select Fixed On from the
appropriate row under the Switch column.
3. For each heater that you want to set, double-click on the appropriate
row under the Fixed PWM Output column, and enter the desired
percentage of output. You can enter a decimal value between 0 and
100.
CAUTION
It is not recommended that a value of 95 or higher be used for a prolonged time, as this
may damage the equipment.
4. To save the changes and leave the window open so that you can
monitor the heaters’ status, click Save. The current temperature of
each heater displays in the Temperature column, and is updated in
real time.
5. To save the changes and close the window, click OK.
3-8
MON20/20 Software for Gas Chromatographs
SEPTEMBER 2010
User Manual
3-9000-745
3.1.7 Removing a heater from service
To remove a heater from service, do the following:
1. Select Heaters... from the Hardware menu. The Heaters window
displays.
Figure 3-7. The Heaters window
2. For each heater that you want to set, select Not Used from the
appropriate row under the Switch column. The row turns turqoise,
indicating that it is no longer in service.
3. To save the changes without closing the window, click Save. To save
the changes and close the window, click OK.
3-9
User Manual
MON20/20 Software for Gas Chromatographs
3-9000-745
3.2
SEPTEMBER 2010
Configuring the valves
MON 20/20 allows you to do the following from the Valves window:
• Assign identifying labels to each valve.
• Monitor valve operation.
• Control the operation modes for each valve.
Note
This window contains a hidden column labelled Physical Name. For more information
about this column and how to display it, see “Viewing the Physical Name column” on
page 1-38.
3.2.1 Renaming a valve
Give each valve a descriptive label to avoid confusing one valve for
another. To assign an identifying label, do the following:
1. Select Valves... from the Hardware menu. The Valves window
displays.
3-10
MON20/20 Software for Gas Chromatographs
SEPTEMBER 2010
User Manual
3-9000-745
Figure 3-8. The Valves window with Physical Name column
2. Double-click on the appropriate row under the Label column for the
valve that you want to name.
Note
The valves are labelled Valve 1 - Valve N by default, where N equals the total number
of valves available to the GC.
3. Type in a new descriptive name for the valve.
4. Click OK.
3-11
User Manual
MON20/20 Software for Gas Chromatographs
3-9000-745
SEPTEMBER 2010
3.2.2 Setting a valve’s operational mode
A valve has three operational modes: Auto, On, and Off.
• Setting the valve to Off means that the valve will turn off and remain
off until the operational mode is changed.
• Setting the valve to Auto means that the valve will turn on and off
according to the Timed Events table.
• Setting the valve to On means that the valve will turn on and remain
on until the operational mode is changed.
Note
The GC’s switch panel valve settings override MON 20/20’s valve settings.
To set a valve’s operational mode, do the following:
1. Select Valves... from the Hardware menu. The Valves window
displays.
Figure 3-9. The Valves window
3-12
MON20/20 Software for Gas Chromatographs
SEPTEMBER 2010
User Manual
3-9000-745
2. Select the desired mode from the drop-down menu under the Switch
cloumn for the valve.
3. To save the changes and leave the window open so that you can
monitor the valve’s progress, click Save. The current state of the valve
displays in the State column, and is updated in real time.
4. To save the changes and close the window, click OK.
3.2.3 Monitoring the operational status of a valve
To check a valve’s status, select Valves... from the Hardware menu.
Figure 3-10. The Valves window
The status of each valve displays under the Status column. There are five
possible status readings, and their meanings are as follows:
OK
The valve is installed and is working correctly.
Not Installed
The valve is not installed.
Under/Over Current Error
Unable to switch the solenoid on or off. There is a potential
problem with the solenoid.
Error
The Heater/Solenoid board is installed but the GC cannot
communicate with it.
3-13
User Manual
MON20/20 Software for Gas Chromatographs
3-9000-745
SEPTEMBER 2010
3.2.4 Inverting the polarity of a valve
The Invert Polariy option reverses the effect of switching a valve on or
off. By default, the Invert Polarity option is set to FALSE, which means
that switching a valve to ON activates it, and switching the valve to OFF
deactivates it. Setting Invert Polarity to TRUE means that switching a
valve to ON deactivates it, and switching the valve to OFF activates it.
To set the polarity of a valve, do the following:
1. Select Valves... from the Hardware menu. The Valves window
displays.
Figure 3-11. The Valves window
2. If the Invert Polarity checkbox is selected, it is set to True; to set it to
False, uncheck the box by clicking it. If the Invert Polarity checkbox is
not selected, it is set to False; to set it to True, click the box.
3-14
MON20/20 Software for Gas Chromatographs
SEPTEMBER 2010
User Manual
3-9000-745
3.2.5 Setting the usage mode for a valve
A valve’s usage mode determines its general function, or role, during an
analysis run. A valve can be assigned one of the following usage modes:
• DO
• FID H2 Valve
• Common Alarm
• Stream
• Analyzer01
...
• Analyzer016
To set the usage mode for a valve, do the following:
1. Select Valves... from the Hardware menu. The Valves window
displays.
Figure 3-12. The Valves window
3-15
User Manual
MON20/20 Software for Gas Chromatographs
3-9000-745
SEPTEMBER 2010
2. Select the desired mode from the drop-down menu under the Usage
cloumn for the valve.
3. To save the changes and leave the window open so that you can
monitor the valve’s progress, click Save. The current state of the valve
displays in the State column, and is updated in real time.
4. To save the changes and close the window, click OK.
3-16
MON20/20 Software for Gas Chromatographs
SEPTEMBER 2010
3.3
User Manual
3-9000-745
Controlling the detectors
Use the Detectors window to monitor the activity and status of the GC’s
detectors.
To view the Detectors window, select Detectors... from the Hardware
menu.
Figure 3-13. The Detectors window showing a TCD and an FID
Note
Before making any modifications to this window, halt the analysis. See “Halting an
analysis” on page 6-1 for more information.
3-17
User Manual
MON20/20 Software for Gas Chromatographs
3-9000-745
SEPTEMBER 2010
Note
Blue cells display read-only data; white cells display editable data.
The following data displays for each detector:
Name
Description
Det #
Numerical identifier for the detector to which the following data applies.
Detector
Options, which depend on your GC’s configuration, are TCD, FPD, or FID.
FID Temp RTD
Applies to FIDs only. Select the appropriate RTD from the drop-down list.
The RTD measures the temperature of the FID flame.
FID Ignition
Applies to FIDs only. Select Manual if you want to control the ignition of
the FID; select Auto if you want the GC to control the ignition of the FID.
Ignition Attempts
Applies to FIDs only. Indicates the number of times the GC will try to light
the flame. If an 'Auto' FID ignition sequence fails to light the flame after
the specified number of attempts, the GC will close the hydrogen valve,
switch the FID ignition parameter to Manual, and set an active alarm.
Wait Time Bet Tries
Applies to FIDs only. Indicates the amount of time, in seconds, the GC will
wait between ignition attempts.
Igniter On Duration
Applies to FIDs only. Indicates the length of time that the igniter will
remain on.
Flame On Sense Temp
Applies to FIDs only. The flame ignites when the FID internal temperature
exceeds the value set in this field.
Flame Out Sense Temp
Applies to FIDs only. The flame is extinguished when the FID internal
temperature falls below the value set in this field.
FPD Flame Status DI
Applies to FPDs only. Allows you to select from a list of available digital
inputs. The digital input that is selected will receive the FPD’s flame status
value.
Preamp Val
FID count. Read-only. See “Resetting the preamp value” on page 3-22 for
more information.
FID Flame Temp
Temperature of the FID flame as read by the RTD. Read-only.
Flame Status
Options are: Off, On, and Over Temperature. Read-only.
H2 Valve Cur State
Options are: Open and Closed. Read-only.
Scaling Factor
Preamp calibration factor.
Igniter Status
Options are: Off and On. Read-only.
Electrometer Voltage
Output at first stage of FID preamp. Read-only.
3-18
MON20/20 Software for Gas Chromatographs
User Manual
SEPTEMBER 2010
3-9000-745
Name
Description
Pre Amplifier Voltage
Output at second stage of FID preamp. Read-only.
Polarizing Voltage
Igniter voltage. Read-only.
FID Gain Status
Options are: Low and High.
Status
Options are: Ok, Not Installed and Internal Error. Read-only.
3.3.1 Offsetting the baseline
In some situations that involve TCD detectors the baseline may be
displayed either too high on the graph, in which case the tops of the peaks
are cut off, or too low on the graph, so that the bases of the peaks are cut
off. If this occurs it is possible to offset the baseline either up or down so
that the entire peak can be displayed on the graph. This offset will be
applied to all traces—live, archived and saved—that are displayed
thereafter.
To offset the baseline, do the following:
1. Select Detectors... from the Hardware menu. The Detectors window
displays.
3-19
User Manual
3-9000-745
MON20/20 Software for Gas Chromatographs
SEPTEMBER 2010
Figure 3-14. The Detectors window
2. Select the appropriate detector. It may be necessary to return to the
Chromatogram Viewer to learn which detector is the source of the
trace that needs to be offset.
3. To lower the baseline, click Left(N). Each time this button is clicked,
N is incremented by -1. For example, is this is the first time the
button has been clicked, Left(0) will be increment to Left(-1) and the
baseline will be lowered one step. If Right(N) was clicked previously,
then that button will be incremented by -1 first, until it reached
Right(0); at the point, Left(N) will be incremented by -1.
Note
To reset the baseline to its default setting, click Right(N) and Left(N) until they read
Right(0) and Left(0).
3-20
MON20/20 Software for Gas Chromatographs
SEPTEMBER 2010
User Manual
3-9000-745
4. To raise the baseline, click Right(N). Each time this button is
clicked, N is incremented by 1. For example, is this is the first time
the button has been clicked, Right(0) will be increment to Right(1) and
the baseline will be raised one step. If Left(N) was clicked previously,
then that button will be incremented by 1 first, until it reaches Left(0);
at the point, Right(N) will be incremented by 1.
Note
To reset the baseline to its default setting, click Right(N) and Left(N) until they read
Right(0) and Left(0).
5. After the baseline has been raised or lowered to your satisfaction, click
OK.
3.3.2 Igniting the FID flame
If the FID Ignition field on the Detectors window is set to “Manual” and if
the Flame status field is set to “Off”, do the following to restart the flame:
1. Click Open H2 Valve. The H2 Valve Cur State field changes to
“Open”.
2. Click Ignite. The Flame Status field changes to “On” when the FID
internal temperature exceeds the value set in the Flame On Sense
Temp field.
Note
If the FID Ignition field is set to “Auto”, the GC will automatically restart the flame if it
goes out.
3-21
User Manual
MON20/20 Software for Gas Chromatographs
3-9000-745
SEPTEMBER 2010
3.3.3 Resetting the preamp value
To reset the Preamp Val field on the Detectors window to 0, click AutoZero.
3.3.4 Balancing the preamp
In some situations that involve TCD detectors the baseline may be
displayed either too high on the graph, in which case the tops of the peaks
are cut off, or too low on the graph, so that the bases of the peaks are cut
off. If this occurs it is possible to offset the baseline either up or down so
that the entire peak can be displayed on the graph. This offset will be
applied to all traces—live, archived and saved—that are displayed
thereafter.
To offset the baseline, do the following:
1. Select Detectors... from the Hardware menu. The Detectors window
displays.
3-22
MON20/20 Software for Gas Chromatographs
SEPTEMBER 2010
User Manual
3-9000-745
Figure 3-15. The Detectors window
2. Select the appropriate detector. It may be necessary to return to the
Chromatogram Viewer to learn which detector is the source of the
trace that needs to be offset.
3. To lower the baseline, click Left(N). Each time this button is clicked,
N is incremented by -1. For example, is this is the first time the
button has been clicked, Left(0) will be increment to Left(-1) and the
baseline will be lowered one step. If Right(N) was clicked previously,
then that button will be incremented by -1 first, until it reached
Right(0); at the point, Left(N) will be incremented by -1.
Note
To reset the baseline to its original setting, click Right(N) and Left(N) until they read
Right(0) and Left(0).
3-23
User Manual
3-9000-745
MON20/20 Software for Gas Chromatographs
SEPTEMBER 2010
4. To raise the baseline, click Right(N). Each time this button is
clicked, N is incremented by 1. For example, is this is the first time
the button has been clicked, Right(0) will be increment to Right(1) and
the baseline will be raised one step. If Left(N) was clicked previously,
then that button will be incremented by 1 first, until it reaches Left(0);
at the point, Right(N) will be incremented by 1.
Note
To reset the baseline to its original setting, click Right(N) and Left(N) until they read
Right(0) and Left(0).
3.4
Managing your gas chromatograph’s discrete inputs
You can use MON 20/20 to assign labels to the GC’s discrete inputs and to
control the discrete inputs’ operational modes. The number of discrete
inputs available depends on the GC.
Note
This window contains a hidden column labelled Physical Name. For more information
about this column and how to display it, see “Viewing the Physical Name column” on
page 1-38.
3.4.1 Renaming a discrete input
Give each discrete input a descriptive label to avoid confusing one unit for
another. To assign an identifying label, do the following:
1. Select Discrete Inputs... from the Hardware menu. The Discrete
Inputs window displays.
3-24
MON20/20 Software for Gas Chromatographs
SEPTEMBER 2010
User Manual
3-9000-745
Figure 3-16. The Discrete Inputs window
2. Double-click on the appropriate row under the Label column for the
discrete input that you want to rename.
Note
The discrete inputs are labelled Discrete Input 1 - Discrete Input N by default,
where N equals the total number of discrete inputs available to the GC.
3. Type in a new descriptive name for the discrete input.
4. Click OK.
3.4.2 Setting a discrete input’s operational mode
A discrete input has three operational modes: Auto, On, and Off.
• Setting the discrete input to Off means that it will interpret all
incoming signals as OFF, despite the true nature of the signal.
• Setting the discrete input to Auto means that it will analyze the
incoming signal to determine whether it is ON or OFF.
• Setting the discrete input to On means that it will interpret all
incoming signals as ON, despite the true nature of the signal.
3-25
User Manual
MON20/20 Software for Gas Chromatographs
3-9000-745
SEPTEMBER 2010
Note
The GC’s switch panel settings override MON 20/20’s settings.
To set a discrete input’s operational mode, do the following:
1. Select Discrete Input... from the Hardware menu. The Discrete
Input window displays.
Figure 3-17. The Discrete Inputs window
2. Select the desired mode from the drop-down menu under the Switch
cloumn for the discrete input.
3. To save the changes and leave the window open so that you can
monitor the discrete input’s progress, click Save. The current state of
the discrete input displays in the State column, and is updated in real
time.
4. To save the changes and close the window, click OK.
3-26
MON20/20 Software for Gas Chromatographs
SEPTEMBER 2010
User Manual
3-9000-745
3.4.3 Monitoring the operational status of a discrete input
To check a valve’s status, select Discrete Input... from the Hardware
menu.
Figure 3-18. The Discrete Inputs window
The status of each discrete input displays under the Status column.
There are three possible status readings, and their meanings are as
follows:
OK
The discrete input is installed and is working correctly.
Not Installed
The discrete input is not installed.
Error
The Heater/Solenoid board is installed but the GC cannot
communicate with it.
3-27
User Manual
MON20/20 Software for Gas Chromatographs
3-9000-745
SEPTEMBER 2010
3.4.4 Inverting the polarity of a discrete input
The Invert Polariy option reverses the way a voltage signal is
interpreted by the discrete input. By default, the Invert Polarity option
is set to Normally Open, which means that a low voltage signal is
interpreted by the discrete input as ON, and a high voltage signal is
interpreted by the discrete input as OFF. Setting Invert Polarity to
Normally Closed means that a low voltage signal is interpreted by the
discrete input as OFF, and a high voltage signal is interpreted by the
discrete input as ON.
To set the polarity of a discrete input, do the following:
1. Select Discrete Input... from the Hardware menu. The Discrete
Inputs window displays.
Figure 3-19. The Discrete Inputs window
2. Select Normally Open or Normally Closed from the drop-down
menu under the Invert Polarity cloumn.
3-28
MON20/20 Software for Gas Chromatographs
SEPTEMBER 2010
3.5
User Manual
3-9000-745
Managing your gas chromatograph’s discrete outputs
You can use MON 20/20 to assign labels to the GC’s discrete outputs and
to control the discrete outputs’ operational modes. The number of discrete
outputs available depends on the GC.
Note
This window contains a hidden column labelled Physical Name. For more information
about this column and how to display it, see “Viewing the Physical Name column” on
page 1-38.
3.5.1 Renaming a discrete output
Give each discrete output a descriptive label to avoid confusing one unit
for another. To assign an identifying label, do the following:
1. Select Discrete Outputs... from the Hardware menu. The Discrete
Outputs window displays.
Figure 3-20. The Discrete Outputs window
2. Double-click on the appropriate row under the Label column for the
discrete output that you want to rename.
3-29
User Manual
MON20/20 Software for Gas Chromatographs
3-9000-745
SEPTEMBER 2010
Note
The discrete outputs are labeled Discrete Output 1 - Discrete Output N by default,
where N equals the total number of discrete outputs available to the GC.
3. Type in a new descriptive name for the discrete output.
4. Click OK.
3.5.2 Setting a discrete output’s operational mode
A discrete output has three operational modes: Auto, On, and Off.
• Setting the discrete output to Off means that the discrete output will
turn off and remain off until the operational mode is changed.
• Setting the discrete output to Auto means that the discrete output
will turn on and off according to the Timed Events table or the
Discrete Outputs table.
• Setting the discrete output to On means that the discrete output will
turn on and remain on until the operational mode is changed.
To set a discrete output’s operational mode, do the following:
1. Select Discrete Output... from the Hardware menu. The Discrete
Output window displays.
3-30
MON20/20 Software for Gas Chromatographs
SEPTEMBER 2010
User Manual
3-9000-745
Figure 3-21. The Discrete Outputs window
2. Select the desired mode from the drop-down menu under the Switch
cloumn for the discrete output.
3. To save the changes and leave the window open so that you can
monitor the discrete output’s progress, click Save. To save the
changes and close the window, click OK. The current state of the
discrete output displays in the State column, and is updated in real
time.
3-31
User Manual
MON20/20 Software for Gas Chromatographs
3-9000-745
SEPTEMBER 2010
3.5.3 Monitoring the operational status of a discrete output
To check a valve’s status, select Discrete Output... from the Hardware
menu.
Figure 3-22. The Discrete Outputs window
The status of each discrete output displays under the Status column.
There are three possible status readings, and their meanings are as
follows:
3-32
OK
The discrete output is installed and is working correctly.
Not Installed
The discrete output is not installed.
Error
The Heater/Solenoid board is installed but the GC cannot
communicate with it.
MON20/20 Software for Gas Chromatographs
SEPTEMBER 2010
User Manual
3-9000-745
3.5.4 Setting the usage mode for a discrete output
A discrete output’s usage mode determines which signals are routed to it
via the Limited Alarm and Discrete Alarm functions. A discrete output
can be assigned one of the following usage modes:
• DO
• FID H2 Valve
• Common Alarm
• Stream
• Analyzer01
...
• Analyzer016
To set the usage mode for a discrete output, do the following:
1. Select Discrete Output... from the Hardware menu. The Discrete
Output window displays.
Figure 3-23. The Discrete Outputs window
3-33
User Manual
MON20/20 Software for Gas Chromatographs
3-9000-745
SEPTEMBER 2010
2. Select the desired mode from the drop-down menu under the Usage
cloumn for the discrete output.
3. If you select DO for Usage, and Auto for Switch, then you must also
set the Start Time and Duration. Double-click on the appropriate row
under the Start Time column and enter the time that the digital
output should be turned on. Double-click on the appropriate row
under the Duration column and enter the amount of time, in seconds,
that the digital output should remain on. Double-click on the
appropriate row under the Interval column and enter the amount of
time, in hours, that should pass before the digital output turns on
again.
4. To save the changes and leave the window open so that you can
monitor the discrete output’s progress, click Save. To save the
changes and close the window, click OK. The current statr of the
discrete output displays in the State column, and is updated in real
time.
3.6
Managing your gas chromatograph’s analog inputs
With MON 20/20 you can control analog inputs in the following ways:
• Assign identifying labels.
• Assign scale ranges.
• Calibrate analog inputs for zero and full scale values.
Electrical current signals ranging from 4 to 20 mA (±10%) are accepted as
analog inputs.
Note
This window contains a hidden column labelled Physical Name. For more information
about this column and how to display it, see “Viewing the Physical Name column” on
page 1-38.
3-34
MON20/20 Software for Gas Chromatographs
SEPTEMBER 2010
User Manual
3-9000-745
3.6.1 Renaming an analog input
Give each analog input a descriptive label to avoid confusing one unit for
another. To assign an identifying label, do the following:
1. Select Analog Inputs... from the Hardware menu. The Analog
Inputs window displays.
Figure 3-24. The Analog Inputs window
2. Double-click on the appropriate row under the Label column for the
analog input that you want to rename.
Note
The analog input devices are labelled Analog Input 1 and Analog Input N by default,
where N equals the total number of analog inputs available to the GC.
3. Type in a new descriptive name for the analog input.
4. Click OK.
3-35
User Manual
MON20/20 Software for Gas Chromatographs
3-9000-745
SEPTEMBER 2010
3.6.2 Setting a analog input’s operational mode
An analog input has two operational modes: Variable and Fixed.
• Setting the switch to Variable means that the analog input will be set
automatically, based on the signal it receives.
• Setting the switch to Fixed means that the analog input will be set to
the value that you enter in the appropriate row under the Fixed Value
column.
To set an analog input’s operational mode, do the following:
1. Select Analog Input... from the Hardware menu. The Analog Input
window displays.
Figure 3-25. The Analog Inputs window
2. Select the desired mode from the drop-down menu under the Switch
cloumn for the analog input.
3. To save the changes and leave the window open so that you can
monitor the analog input, click Save. To save the changes and close
the window, click OK. The current value of the analog input signal
displays in the Current Value column, and is updated in real time.
3-36
MON20/20 Software for Gas Chromatographs
SEPTEMBER 2010
User Manual
3-9000-745
3.6.3 Setting the scale values for an analog input device
To set the zero scale and full scale, which are used when converting the
analog input value, do the following:
1. Select Analog Input... from the Hardware menu. The Analog Input
window displays.
Figure 3-26. The Analog Inputs window
2. Double-click on appropriate row under the Zero Scale column and
enter a zero scale value.
3. Double-click on appropriate row under the Full Scale column and
enter a full scale value.
4. To save the changes and leave the window open so that you can
monitor the analog input, click Save. To save the changes and close
the window, click OK.
3.6.4 Setting the type of analog input signal
The GC’s analog inputs can receive two types of signal: volts and a 4-20
mA current, which is the industry standard. To set the type of signal
generated by the analog input device, do the following:
1. Select Analog Input... from the Hardware menu. The Analog Input
window displays.
3-37
User Manual
3-9000-745
MON20/20 Software for Gas Chromatographs
SEPTEMBER 2010
Figure 3-27. The Analog Inputs window
2. Select the signal type from the appropriate row under the mA/Volt
column.
3. To save the changes and leave the window open so that you can
monitor the analog input’s progress, click Save. To save the changes
and close the window, click OK. The type of signal being generated
displays in the mA/Volts column, and is updated in real time.
3-38
MON20/20 Software for Gas Chromatographs
SEPTEMBER 2010
User Manual
3-9000-745
3.6.5 Monitoring the status of an analog input
To check an analog input’s status, select Analog Input... from the
Hardware menu.
Figure 3-28. The Analog Inputs window
The operational status of each analog input displays under the Status
column. There are three possible status readings, and their meanings are
as follows:
OK
The analog input is installed and is working correctly.
Not Installed
The analog input is not installed.
Error
The analog input is installed but the GC cannot communicate
with it.
This window also displays other types of data, such as the following:
• mA/Volts - The type of analog input signal being received.
• mA - If mA displays in the mA/Volts column, then this column
displays the amount of current being received, in milliamperes.
• Volts - If Volts displays in the mA/Volts column, then this column
displays the amount of current being received, in volts.
• Cur Val - The current value of the analog input signal.
3-39
User Manual
MON20/20 Software for Gas Chromatographs
3-9000-745
SEPTEMBER 2010
3.6.6 Calibrating an analog input
To calibrate an analog input, do the following:
1. Select Analog Input... from the Hardware menu. The Analog Input
window displays.
Figure 3-29. The Analog Inputs window
2. Click on the analog input that you want to calibrate.
3. Set the analog input’s Zero Scale by entering its minimum anticipated
value.
4. Set the analog input’s Full Scale by entering your maximum
anticipated value.
5. Click AutoCal...(F4) or press F4. The Analog Input Calibration
Wizard runs.
3-40
MON20/20 Software for Gas Chromatographs
SEPTEMBER 2010
User Manual
3-9000-745
Figure 3-30. The Analog Input Calibration Wizard
6. Click Next. Step 2 of the Analog Input Calibration Wizard displays.
Figure 3-31. Step 2 of the Analog Input Calibration WIZARD
7. Click Next. Step 3 of the Analog Input Calibration Wizard displays.
3-41
User Manual
MON20/20 Software for Gas Chromatographs
3-9000-745
SEPTEMBER 2010
Figure 3-32. Step 3 of the Analog Input Calibration Wizard
8. Click Next. Step 4 of the Analog Input Calibration Wizard displays.
Figure 3-33. Step 4 of the Analog Input Calibration Wizard
9. Click Finish. The calibration is complete.
3-42
MON20/20 Software for Gas Chromatographs
SEPTEMBER 2010
3.7
User Manual
3-9000-745
Managing your gas chromatograph’s analog outputs
With MON 20/20 you can control them in the following ways:
• Assign identifying labels.
• Assign scale ranges.
• Calibrate analog outputs for zero and full scale values.
Note
This window contains a hidden column labelled Physical Name. For more information
about this column and how to display it, see “Viewing the Physical Name column” on
page 1-38.
3.7.1 Renaming an analog output
Give each analog output a descriptive label to avoid confusing one unit for
another. To assign an identifying label, do the following:
10. Select Analog Outputs... from the Hardware menu. The Analog
Outputs window displays.
Figure 3-34. The Analog Outputs window
11. Double-click on the appropriate row under the Label column for the
analog output that you want to rename.
3-43
User Manual
MON20/20 Software for Gas Chromatographs
3-9000-745
SEPTEMBER 2010
Note
The analog output devices are labelled Analog Output 1 - Analog Output N by
default, where N equals the total number of analog outputs available to the GC.
12. Type in a new descriptive name for the analog output.
13. Click OK.
3.7.2 Setting a analog output’s operational mode
An analog output has two operational modes: Variable and Fixed.
• Setting the switch to Variable means that the analog output will be
proportional to the variable selected in from the Variables column.
• Setting the switch to Fixed means that the analog output will be set
to the value that is entered in the appropriate row under the Fixed
Value column.
To set an analog output’s operational mode, do the following:
1. Select Analog Output... from the Hardware menu. The Analog
Output window displays.
Figure 3-35. The Analog Outputs window
3-44
MON20/20 Software for Gas Chromatographs
SEPTEMBER 2010
User Manual
3-9000-745
2. Select the desired mode from the drop-down menu under the Switch
cloumn for the analog output.
3. To save the changes and leave the window open so that you can
monitor the analog output, click Save. To save the changes and close
the window, click OK. The current value of the analog output displays
in the Cur Val column, and is updated in real time.
3.7.3 Setting the scale values for an analog output device
To set the zero scale and full scale, which are used when converting the
analog output value, do the following:
1. Select Analog Output... from the Hardware menu. The Analog
Output window displays.
Figure 3-36. The Analog Outputs window
2. Click on appropriate row under the Zero Scale column and enter a
zero scale value.
3. Click on appropriate row under the Full Scale column and enter a full
scale value.
4. To save the changes and leave the window open so that you can
monitor the analog input’s progress, click Save. To save the changes
and close the window, click OK.
3-45
User Manual
MON20/20 Software for Gas Chromatographs
3-9000-745
SEPTEMBER 2010
3.7.4 Mapping a system variable to an analog output
To select the system variable on which to base the signal level of the
analog output, do the following:
1. Select Analog Output... from the Hardware menu. The Analog
Output window displays.
Figure 3-37. The Analog Outputs window
2. Select a new variable by clicking on the appropriate drop-down list
under the Variable column. For a demonstration of how to use the
context-sensitive variable selector, see “Using the context-sensitive
variable selector” on page 1-42.
3-46
MON20/20 Software for Gas Chromatographs
SEPTEMBER 2010
User Manual
3-9000-745
Figure 3-38. The Analog Outputs window with Variable drop-down menu
3. To save the changes and leave the window open so that you can
monitor the analog output’s progress, click Save. To save the changes
and close the window, click OK.
3.7.5 Monitoring the status of an analog output
To check an analog output device’s status, select Analog Output... from
the Hardware menu.
Figure 3-39. The Analog Outputs window
3-47
User Manual
MON20/20 Software for Gas Chromatographs
3-9000-745
SEPTEMBER 2010
The operational status of each analog output displays under the Status
column. There are three possible status readings, and their meanings are
as follows:
OK
The analog output device is installed and is working
correctly.
Not Installed
The analog output device is not installed.
Error
The Heater/Solenoid board is installed but the GC cannot
communicate with it.
This window also displays other types of data, such as the following:
• mA - The amount of current being generated in milliamperes.
• Cur Val - The current scaled value of the analog output signal.
3.7.6 Calibrating an analog output
To automatically calibrate an analog output, do the following:
1. Select Analog Output... from the Hardware menu. The Analog
Outputs window displays.
Figure 3-40. The Analog Outputs window
2. Click on the analog output that you want to calibrate.
3-48
MON20/20 Software for Gas Chromatographs
SEPTEMBER 2010
User Manual
3-9000-745
3. Click AutoCal...(F4) or press F4. The Analog Output Calibration
Wizard runs.
Figure 3-41. The Analog Output Calibration Wizard
4. Select the check box for the unit of measure you want to use for the
calibration and then click Next. Step 2 of the Analog Output
Calibration Wizard displays.
Figure 3-42. Step 2 of the Analog Output Calibration Wizard
3-49
User Manual
MON20/20 Software for Gas Chromatographs
3-9000-745
SEPTEMBER 2010
5. Enter the Zero Scale Adjustment value and then click Next. If the
value entered is within tolerance, it is accepted and Step 3 of the
Analog Output Calibration Wizard displays. If the value is not within
tolerance, an error icon (
) appears beside the field. Tolerance is set
to ±1mA of the analog output’s default zero adjustment setting, which
is 4mA. Enter a different value and try again.
Figure 3-43. Step 3 of the Analog Output Calibration Wizard
6. Enter the Full Scale Adjustment value and then click Next. If the
value entered is within tolerance, it is accepted and Step 4 of the
Analog Output Calibration Wizard displays. If the value is not within
tolerance, an error icon (
) appears beside the field. Tolerance is set
to ±1mA of the analog output’s default full adjustment setting, which
is 20mA. Enter a different value and try again.
3-50
MON20/20 Software for Gas Chromatographs
SEPTEMBER 2010
User Manual
3-9000-745
Figure 3-44. Step 4 of the Analog Output Calibration Wizard
7. Click Finish. The calibration is complete.
3-51
User Manual
MON20/20 Software for Gas Chromatographs
3-9000-745
3.8
SEPTEMBER 2010
Reviewing the Hardware Inventory List
MON 20/20 can compile an inventory table of all hardware that is
installed on the GC. To view this table, select Installed Hardware...
from the Hardware menu.
Figure 3-45. The Installed Hardware window
3-52
MON20/20 Software for Gas Chromatographs
SEPTEMBER 2010
User Manual
3-9000-745
The type of hardware installed is listed under the Device Description
column. The other types of information available on this screen are the
following:
• IO Function - Describes the function of the device.
• Slot Number - Describes the location of the device on the GC. The
slot number refers to the card cage assembly, which is located in the
GC’s lower enclosure and which has eight slots:
-
Slot 1
Slot 2
Slot 3
Slot 4
Base IO
ROC Expansion 1
ROC Expansion 2
CPU.
• Revision - The revision number of the backplane.
3-53
User Manual
MON20/20 Software for Gas Chromatographs
3-9000-745
SEPTEMBER 2010
This page is intentionally left blank.
3-54
Section 4: Using the Application functions
Many of the variables that a gas chromatograph
uses during an analysis run—such as timed
events, stream sequence, and calculation
types—can be easily managed through MON
20/20.
This chapter explains how to do the following:
• View and edit general information about the
GC to which MON 20/20 is connected, such as
name, model, and default stream sequence.
• View and edit component data, validation
data, and timed event tables.
• View and change control, average, and userdefined calculations.
• View and edit limit alarm data.
• View and change stream data.
• View and edit the stream sequence.
• View and edit communication and ethernet port data.
• View and map LOI status variables.
• View and map the Foundation Fieldbus Process Variables.
4-1
User Manual
3-9000-745
4.1
MON20/20 Software for Gas Chromatographs
SEPTEMBER 2010
Managing the system
Use this function to select the default GC stream sequence and to set or
edit system-wide variables such as the GC’s name, serial number, and
system description. See Table 5-1 for a list of the items that are available
on the System window, along with their related functions.
To view the System window, select System... from the Application
menu.
Figure 4-1. The System window
4-2
MON20/20 Software for Gas Chromatographs
User Manual
SEPTEMBER 2010
3-9000-745
Table 4-1. List of fields from System window
Field Name
Description
Analyzer Name
Defines the GC name that appears in the Status Bar on the main
window when MON 20/20 is connected to the GC. Can contain up to
12 characters.
GC Model
The model number of the GC to which MON 20/20 is connected.
System Description
A field to record miscellaneous reference information to further
identify the currently connected system. Can contain up to 28
characters.
Firmware Version
Revision level of firmware of the GC to which MON 20/20 is
connected.
GC Serial No
Serial number of the GC to which MON 20/20 is connected.
Company Name
The name of the company that operates the GC.
GC Location
The physical location of the GC to which MON 20/20 is connected.
Is Multi User Write Enabled?
Determines whether all supervisor-level users that connect to the
GC have write access, or just the first supervisor-level user to
connect. Options are True and False.
Maintenance Mode
Switches the GC to maintenance mode and triggers an alarm that
the GC is down for maintenance.
Sync GC with FFB time
Sets the GC’s time to match the Foundation Fieldbus’ time.
Standard Component Table
Version for GPA
Indicates which version of the GPA’s standard component table is
being used.
Standard Component Table
Version for ISO
Indicates which version of the ISO’s standard component table is
being used.
Date Format
Defines how the date will be displayed. The options are:
• MM$$DD$$YYYY
• MM$DD$YY
• DD$MM$YYYY
• DD$MM$YY
• YYYY$MM$DD
• YY$MM$DD
$ is the Date Field Separator.
Date Field Separator
Defines the text symbol that will be used as the separator when
displaying the date. The options are:
• /
• • .
4-3
User Manual
MON20/20 Software for Gas Chromatographs
3-9000-745
SEPTEMBER 2010
Table 4-1. List of fields from System window
Field Name
Description
Time Format
Defines how the time will be displayed. The options are:
• HH:MM:SS
• HH:MM
Time Notation
Defines the cycle of time to use when displaying the time. The
options are:
• 12 Hr
• 24 Hr
CGM FCAL Archive
Sets the storage behavior for final calibration chromatograms. The
options are:
• Keep Last FCAL Per Day - Saves only the last final calibration
chromatogram of the day.
• Keep All FCAL Per Day - Saves all final calibration chromatograms.
CGM FVAL Archive
Sets the storage behavior for final validation chromatograms. The
options are:
• Keep Last FVAL Per Day - Saves only the last final validation
chromatogram of the day.
• Keep All FVAL Per Day - Saves all final validation chromatograms.
Show Advanced System
Variables
Determines whether advanced system variables will be displayed
along with basic system variables. See “Basic and advanced system
variables” on page D-1 for more information.
Site Id
Holds customer-defined site identification information.
GC Mode
Allows you to select an operating mode for the GC. See “Operating
modes for MON 20/20” on page 1-38 for more information.
Default Stream Sequence
Sets the default sequence to be used by the indicated detector
during auto-sequencing. To create a new stream sequence or to edit
an already-created sequence, click Stream Sequence....
See “Creating a stream sequence for a detector” on page 4-78 for
more information.
After making changes, click Save to save the changes without closing the
window. To save the changes and close the window, click OK.
4-4
MON20/20 Software for Gas Chromatographs
SEPTEMBER 2010
4.2
User Manual
3-9000-745
Managing Component Data Tables
MON 20/20 allows you to view and edit the component data tables. The
number of available component data tables depends on the GC unit
configuration.
To assign a component data table to a stream, see “Assigning a valve to a
stream and setting the relationship between the stream’s open state to
the valve’s On/Off state” on page 4-76.
1. To view a component data table, select Component Data... from the
Application menu. The Component Data Tables window appears,
displaying a list of available component data tables.
Figure 4-2. The Component Data Tables window
Note
Other ways of accessing the component data tables are by pressing F6 or by clicking
from the Toolbar.
2. Select the table that you want to view. The selected component data
table displays.
4-5
User Manual
MON20/20 Software for Gas Chromatographs
3-9000-745
SEPTEMBER 2010
Figure 4-3. The selected component data table
Note
To see a different table, select it from the Choose table drown-down list.
Note
To sort the list of components by detector, and then by retention time, click Sort RT.
4.2.1 Editing a Component Data Table
Note
Table cells with a white background are editable; table cells with a turqoise background
are not editable.
To edit a cell, do the following:
1. Click on the cell. Depending on the cell type, you will either be
required to select a value from a drop-down list, or you will be able to
type in the value directly.
2. To save the changes without closing the window, click Save. To save
the changes and close the window, click OK.
4-6
MON20/20 Software for Gas Chromatographs
SEPTEMBER 2010
User Manual
3-9000-745
The following table lists all of the editable parameters that are available
on the component data table. The standard values for these parameters
were taken from the second editions of the Orifice Metering of Natural
Gas and Other Related Hydrocarbon Fluids and the Compressibility
Factors of Natural Gas and Other Related Hydrocarbon Gases.
Parameter
Description
Component
This drop-down list contains the complete catalog of available components
for the selected stream.
Usr Std
Indicates the source of the component:
• Usr - The component was edited or defined by the user.
• Std - The component was selected from the standard list of components
and no changes were made to its standard data.
Det #
The component’s detector number.
Ret Time
Time in seconds before the apex of the component's peak will appear. The
rentention time can be set from 0 to 3600 seconds.
CAUTION: Ensure that the component retention times do not exceed the
analysis time, as defined by the Timed Events table. MON 20/20 does not
automatically prevent the user from defining excessive component
retention times.
Resp Fact
A component’s response factor is equal to the raw data of the component's
peak divided by the component's concentration.
The maximum value is 1.0E+38.
Calib Type
MON 20/20 can perform four types of calibrations:
• Single-Level - Uses the standard calibration in which the response
factor is needed to determine the mole percentage during the calibration.
• Fixed - During the calibration, the response factor is not updated.
• Relative - Calibration in which a reference component is used to
compute the mole percentage.
• Multi-Level - Uses a polynomial equation to compute the mole percentage during the calibration. Values must be entered in the Mult-level
Calib 'a', Mult-level Calib 'b', Mult-level Calib 'c', and Mult-level Calib
'd' cells. See “Multi-level calibration” on page B-13 for more information.
Calib Conc
The amount, in mole percent, parts per million (ppm) or parts per billion
(ppb), of the component that is present in the calibration gas.
Unit
Indicates the unit of measure used when calculating and displaying the
component’s calibration concentration. Options are Mole%, ppm and
ppb.
4-7
User Manual
MON20/20 Software for Gas Chromatographs
3-9000-745
SEPTEMBER 2010
Parameter
Description
Anly Meth
Used to determine the component’s raw data value. Options are:
• Area - Raw data value is proportional to the area under the peak.
• Height - Raw data value is proportional to the height of the peak.
• Fixed - Raw data value is proportional to a value that is set by the
user.
• Analog Input - Data signal comes from an external analyzer.
RT Secs Dev
The maximum acceptable deviation time, in seconds, of the new retention
time from the current retention time.
RT Upd Meth
Determines when the retention time will be updated. Options are:
• Cal - Updates the retention time only during the final calibration run.
• Anly - Updates after each analysis.
Resp Fact %
The maximum acceptable percent of deviation between the new response
factor and the current response factor.
Gross Dry BTU
Gross energy content per cubic foot (ft3), assuming no water is present.
Net Dry BTU
Net energy content per cubic foot, assuming no water is present.
Gross Dry BTU per lb
Gross energy content per pound, assuming no water is present.
HV Sup MJ/m3
Gross heating value in megajoules per cubic meter (MJ/m3).
HV Inf MJ/m3
Net heating value in megajoules per cubic meter (MJ/m3).
HV Sup MJ/kg
Gross heating value in megajoules per kilogram (MJ/kg).
HV Inf MJ/kg
Net heating value in megajoules per kilogram (MJ/kg).
Sum Factor Pri
Used to calculate the compressibility factor.
Sum Factor Sec
Used to calculate the compressibility factor.
CV Superior Pri
Gross caloric value per kilojoule (kJ).
CV Inferior Pri
Net caloric value per kilojoule (kJ).
CV Superior Sec
Gross caloric value per kilojoule (kJ).
CV Inferior Sec
Net caloric value per kilojoule (kJ).
Gals/1000 SCF
Liquid equivalent volume in gallons/1000ft3.
Reid Vapor
The component's vapor pressure in pounds per square inch (psia) at
100.0°F
LBs/Gallon
Liquid density for the component at base conditions.
Rel Dens Gas
The relative density of the gas phase for the component at base conditions.
Rel Dens Liquid
The relative density of the liquid phase for the component at base
conditions.
Molecular Weight
The molecular weight of the component, which is used to calculate the
weight percent of each component in the sample.
Carbon Weight
The molecular weight of the carbon atoms in the component.
4-8
MON20/20 Software for Gas Chromatographs
User Manual
SEPTEMBER 2010
3-9000-745
Parameter
Description
AGA 8 Component
The name of the component according to the American Gas Association,
which is used in the AGA 8 compressibility calculation.
Ref Comp
The component not found in the calibration gas but in the sample gas for
indirect calibration. If 'none', normal (direct) calibration is used.
Not editable unless the calibration type is set to Relative.
Rel Resp Fact
A fixed multiple of the response factor of the component found in the
sample gas for indirect calibration.
Not editable unless the calibration type is set to Relative.
Rel Dens Liquid 15C
The relative density in kilograms per cubic meter (kg/m3) of the liquid
phase for the component at 15°C.
Molar Mass
The mass of one mole of the component.
Mult-level Calib 'a'
Third-order polynomial coefficient for multi-level calibrations.
Not editable unless the calibration type is set to Multi-Level.
Mult-level Calib 'b'
Second-order polynomial coefficient for multi-level calibrations.
Not editable unless the calibration type is set to Multi-Level.
Mult-level Calib 'c'
First-order polynomial coefficient for multi-level calibrations.
Not editable unless the calibration type is set to Multi-Level.
Mult-level Calib 'd'
Zero-order polynomial coefficient for multi-level calibrations.
Not editable unless the calibration type is set to Multi-Level.
Component Code
An index number that corresponds to the standard component numbers
taken from the American Gas Association. Up to 20 components can be
defined per data table.
4-9
User Manual
MON20/20 Software for Gas Chromatographs
3-9000-745
SEPTEMBER 2010
4.2.2 Adding a component to a Component Data Table
To add a component to a component data table, do the following:
1. Select Component Data... from the Application menu. The
Component Data Tables window appears, displaying a list of available
component data tables.
Figure 4-4. The Component Data Tables window
Note
Other ways of accessing the component data tables are by pressing F6 or by clicking
from the Toolbar.
2. Select the table that you want to view. The selected component data
table displays.
4-10
MON20/20 Software for Gas Chromatographs
SEPTEMBER 2010
User Manual
3-9000-745
Figure 4-5. The selected component data table
Note
To sort the list of components by detector, and then by retention time, click Sort RT.
3. If you want to add the component above the currently selected
component, click Insert before. If you want to add the component
below the currently selected component, select Insert after from the
Insert arrow.
4. To save the changes without closing the window, click Save. To save
the changes and close the window, click OK.
4-11
User Manual
MON20/20 Software for Gas Chromatographs
3-9000-745
SEPTEMBER 2010
4.2.3 Removing a component from a Component Data Table
To remove a component from a component data table, do the following:
1. Select Component Data... from the Application menu. The
Component Data Tables window appears, displaying a list of available
component data tables.
Figure 4-6. The Component Data Tables window
Note
Other ways of accessing the component data tables are by pressing F6 or by clicking
from the Toolbar.
2. Select the table that you want to view. The selected component data
table displays.
4-12
MON20/20 Software for Gas Chromatographs
SEPTEMBER 2010
User Manual
3-9000-745
Figure 4-7. The selected component data table
Note
To sort the list of components by detector, and then by retention time, click Sort RT.
3. Select the component that you want to remove.
4. Click Delete.
5. To save the changes without closing the window, click Save. To save
the changes and close the window, click OK.
4.2.4 Viewing the standard values for a component
If a component’s values have been changed by the user, it is still possible
to view the standard values for that particular component. To view the
standard values for a component, do the following:
1. Select Component Data... from the Application menu. The
Component Data Tables window appears, displaying a list of available
component data tables.
4-13
User Manual
MON20/20 Software for Gas Chromatographs
3-9000-745
SEPTEMBER 2010
Figure 4-8. The Component Data Tables window
Note
Other ways of accessing the component data tables are by pressing F6 or by clicking
from the Toolbar.
2. Select the table that you want to view. The selected component data
table displays.
Figure 4-9. The selected component data table
4-14
MON20/20 Software for Gas Chromatographs
SEPTEMBER 2010
User Manual
3-9000-745
Note
To sort the list of components by detector, and then by retention time, click Sort RT.
3. Click Std Values (F3). The Standard Component Values window
displays.
Figure 4-10. The Standard Component Values window
4. Click Close.
4.2.5 Viewing raw data
To view the raw data for the displayed component data table, do the
following:
1. Click Raw Data (F4). The Select dialog displays, listing the streams
that are associated with the component data table.
4-15
User Manual
MON20/20 Software for Gas Chromatographs
3-9000-745
SEPTEMBER 2010
Figure 4-11. The Select dialog
2. Double-click the desired stream.
The Raw Data window appears, listing the peak raw data from the
last run of the stream represented by the component data table.
Figure 4-12. The Raw Data window
4-16
MON20/20 Software for Gas Chromatographs
User Manual
SEPTEMBER 2010
3-9000-745
The following data displays for each peak:
Name
Description
Peak No
Numerical identifier for the peak, listed by the order of discovery.
Ret Time
Time, in seconds, that the component eluted.
Peak Area
The area under the peak.
Peak Height
The maximum height of the peak.
Det #
The detector associated with the peak.
Method
Method of peak end detection. Options are:
• 1 (Baseline)
• 2 (Fused Peak)
• 3 (Last Fused Peak)
• 4 (Tangent Skim)
• 100 (Inhibit)
• 300 (Forced Integration)
• 500 (Summation)
Integration Start
Time, in seconds, when integration started.
Integration Stop
Time, in seconds, when integration stopped.
Peak Width Half Height
The width of the peak taken at half of the peak’s height.
Is Partial Peak
If Y, then the Partial Peak value is used in the summation calculation; if N,
then the Partial Peak value is not used in the summation calculation.
3. Click Close to return to the component data table.
4.3
Managing timed events
Use this function to view and/or edit the timed events tables assigned to
and used by particular gas streams. The number of available timed
events depends on the GC unit configuration. The standard GC
application contains four timed events tables.
Note
See “Editing Timed Events from the Time Events window” on page 2-33 for more
information.
4-17
User Manual
MON20/20 Software for Gas Chromatographs
3-9000-745
SEPTEMBER 2010
To assign a timed events table to a stream, see “Assigning a valve to a
stream and setting the relationship between the stream’s open state to
the valve’s On/Off state” on page 4-76.
1. Select Timed Events... from the Application menu. The Timed
Events Tables selector window appears, displaying a list of available
timed events tables.
Figure 4-13. The Timed Events Tables selector window
Note
Other ways of accessing the timed event tables are by pressing F5 or by clicking
from the Toolbar.
Note
If only one timed events table is available, it will display immediately, bypassing the
Timed Events Tables selector window.
2. Select the table that you want to view. The selected timed events
table displays.
4-18
MON20/20 Software for Gas Chromatographs
SEPTEMBER 2010
User Manual
3-9000-745
Figure 4-14. The Timed Events window
Note
To sort events by time, click the appropriate Sort button.
3. To see a different timed events table, select it from the Choose table
drop-down list.
4-19
User Manual
MON20/20 Software for Gas Chromatographs
3-9000-745
SEPTEMBER 2010
4.3.1 Editing valve events
Valve-related events are grouped on the upper left side of the Timed
Events window. To edit valve-related events, do the following:
1. Select Timed Events... from the Application menu. The Timed
Events Tables selector window appears, displaying a list of available
timed events tables.
Figure 4-15. The Timed Events Tables selector window
Note
Other ways of accessing the timed event tables are by pressing F5 or by clicking
from the Toolbar.
Note
If only one timed events table is available, it will display immediately, bypassing the
Timed Events Tables selector window.
2. Select the table that you want to view. The selected timed events
table displays.
4-20
MON20/20 Software for Gas Chromatographs
SEPTEMBER 2010
User Manual
3-9000-745
Figure 4-16. The Timed Events window
Note
To sort events by time, click the appropriate Sort button.
3. Click on the cell that you want to edit. Depending on the cell type, you
will either be required to select a value from a drop-down list, or you
will be able to type in the value directly.
4. To save the changes without closing the window, click Save. To save
the changes and close the window, click OK.
4-21
User Manual
MON20/20 Software for Gas Chromatographs
3-9000-745
SEPTEMBER 2010
The following table describes the valve-related parameters that are
available on the timed events window.
Parameter
Description
TEV Type
The type of event. You have the following choices:
• Valve # - A valve.
• DO # - A discrete output.
• Strm Sw - Switches to the next stream in the sequence.
• FID Gain - Sets the FID to high or low gain.
• FID Auto Zero - Zeros the FID preamp after a gain change.
Valve/DO #
Use the drop-down menu to select the specific valve or discrete output that should be
used for the event.
This column does not apply if Strm Sw, FID Gain or FID Auto Zero was selected from
the TEV Type column.
State
Turns the valve or discrete output on or off, or sets the FID to high or low.
This column does not apply if Strm Sw or FID Auto Zero was selected from the TEV
Type column.
Time
Indicates the time, in seconds, that the event should occur during the analysis. Enter a
value between 0.0 and 3600.0.
NOTE: Event times must be less than the analysis time.
4.3.2 Editing integration events
Integration-related events are grouped on the upper right side of the
Timed Events window. To edit integration-related events, do the
following:
1. Select Timed Events... from the Application menu. The Timed
Events Tables selector window appears, displaying a list of available
timed events tables.
4-22
MON20/20 Software for Gas Chromatographs
SEPTEMBER 2010
User Manual
3-9000-745
Figure 4-17. The Timed Events Tables selector window
Note
Other ways of accessing the timed event tables are by pressing F5 or by clicking
from the Toolbar.
Note
If only one timed events table is available, it will display immediately, bypassing the
Timed Events Tables selector window.
2. Select the table that you want to view. The selected timed events
table displays.
4-23
User Manual
MON20/20 Software for Gas Chromatographs
3-9000-745
SEPTEMBER 2010
Figure 4-18. The Timed Events window
Note
To sort events by time, click the appropriate Sort button.
3. Double-click on the cell that you want to edit. Depending on the cell
type, you will either be required to select a value from a drop-down
list, or you will be able to type in the value directly.
4. To save the changes without closing the window, click Save. To save
the changes and close the window, click OK.
4-24
MON20/20 Software for Gas Chromatographs
SEPTEMBER 2010
User Manual
3-9000-745
The following table describes the integration-related parameters that are
available on the timed events window.
Parameter
Description
TEV Type
The type of integration event. You have the following options:
• Inhibit: Set to Off to start a peak; set to On to end a peak.
• Integrate: Set to On and Off to set a region in which the area under the trace is
computed as a peak regardless of peak onset discovery. The resulting area is added to
the raw data as a peak with the retention time set to the Integration Off time.
• Summation: Set to On and Off to set a region in which the area of all peaks found will
be added together to create a single, larger, peak. The peaks that contribute to the
summation are marked as partial peaks in the raw data table, and the summation
total is added to the raw data as a new peak with the retention time set to the
Summation OFF time.
• Slope Sens: The peak starts when the slope of six consecutive points is greater than
the slope sensitivity value that is displayed in the Value column; the peak ends when
the slope of six consecutive points is less than the slope sensitivity value that is
displayed in the Value column.
• Peak Width: Each point displayed on the graph represents the average of N raw data
points, where N is the value displayed in the corresponding Value column.
• Single Base: Determines how the baseline is drawn under a peak.
• Off: The baseline is drawn from the point of peak onset to the point of
peak termination. This is not necessarily horizontal and if fact usually
has a slight slope. (Default)
• Bgn: Draws a horizontal baseline from the point of peak onset to a point
above or below the peak termination.
• End: Draws a horizontal baseline from a point above or below the peak
onset to the point of peak termination.
• Fused Ovrrd: Determines how the baseline is drawn when two or more peaks are
'fused' together.
• Off: A single baseline is drawn from the onset of the first peak of the
fused group to the termination of the last peak of the group. (Default)
• On: Causes a separate baseline to be drawn for each peak in the fused
group.
• Negative Peak: Determines whether peak detection will detect inverted peaks, which
are peaks that point downward from the baseline. At any given moment we can
detect positive or negative peaks but not both at once.
• Off: Detect positive peaks. (Default)
• On: Detective negative peaks.
• SW Auto Zero: Re-baselines the trace at the specified time for the specified detector.
Used after a FID gain change event or a spectrum gain change event.
Note: The Single Base and Fused Override events can act together to produce
multiple horizontal baselines, at different heights, for a fused peak group.
4-25
User Manual
MON20/20 Software for Gas Chromatographs
3-9000-745
SEPTEMBER 2010
Parameter
Description
Value
The values available depend on the integration type selected from the TEV Type
column.
• Slope Sensitivity and Peak Width: Enter the number of points, between 1 and 99, to
be used.
• Single Baseline: Select Off, End, Bgn.
• SW Auto Zero: No options.
• All other integration types: Select On or Off.
Det #
The ID number of the detector that will be affected by the event. Valid values are 1 and
2.
Time
Indicates the time, in seconds, that the event should occur during the analysis. Enter a
value between 0.0 and 3600.0.
NOTE: Event times must be less than the analysis time.
4.3.3 Editing spectrum gain events
The spectrum gain feature graphically magnifies the size of a
chromatogram’s peaks. The data itself is not affected; only the
presentation of the data. This feature can be useful for viewing peaks
that are otherwise too small to examine.
Spectrum gain-related events are grouped on the lower left side of the
Timed Events window. To edit spectrum gain-related events, do the
following:
1. Select Timed Events... from the Application menu. The Timed
Events Tables selector window appears, displaying a list of available
timed events tables.
4-26
MON20/20 Software for Gas Chromatographs
SEPTEMBER 2010
User Manual
3-9000-745
Figure 4-19. The Timed Events Tables selector window
Note
Other ways of accessing the timed event tables are by pressing F5 or by clicking
from the Toolbar.
Note
If only one timed events table is available, it will display immediately, bypassing the
Timed Events Tables selector window.
2. Select the table that you want to view. The selected timed events
table displays.
4-27
User Manual
MON20/20 Software for Gas Chromatographs
3-9000-745
SEPTEMBER 2010
Figure 4-20. The Timed Events window
Note
To sort events by time, click the appropriate Sort button.
3. Click on the cell that you want to edit. Depending on the cell type, you
will either be required to select a value from a drop-down list, or you
will be able to type in the value directly.
4. To save the changes without closing the window, click Save. To save
the changes and close the window, click OK.
4-28
MON20/20 Software for Gas Chromatographs
SEPTEMBER 2010
User Manual
3-9000-745
The following table describes the spectrum gain-related parameters that
are available on the timed events window.
Parameter
Description
Det #
The ID number of the detector that will be affected by the event. Select 1 or 2.
Gain
Enter a value between 0 and 64. This is the exponent value in the following
expression: 2gain value. For example, a value of 0 means no gain is applied; a
value of 5 means the gain is increased to 32 times it’s original value.
Time
Indicates the time, in seconds, that the event should occur during the
analysis. Enter a value between 0.0 and 3600.0.
NOTE: Event times must be less than the analysis time.
4.3.4 Setting the cycle and analysis time
To set the cycle and analysis time, do the following:
1. Select Timed Events... from the Application menu. The Timed
Events Tables selector window appears, displaying a list of available
timed events tables.
Figure 4-21. The Timed Events Tables selector window
Note
Other ways of accessing the timed event tables are by pressing F5 or by clicking
from the Toolbar.
4-29
User Manual
MON20/20 Software for Gas Chromatographs
3-9000-745
SEPTEMBER 2010
Note
If only one timed events table is available, it will display immediately, bypassing the
Timed Evetns Tables selector window.
2. Select the table that you want to view. The selected timed events
table displays. The Analysis Time section is located on the lower
right side of the Timed Events window.
Figure 4-22. The Timed Events window
Note
To sort events by time, click the appropriate Sort button.
4-30
MON20/20 Software for Gas Chromatographs
SEPTEMBER 2010
User Manual
3-9000-745
3. Click on the Analysis Time cell and enter a value, in seconds, between
0 and 3600.
4. Click on the Cycle Time cell and enter a value, in seconds, between 0
and 3620.
Note
The Cycle Time must be atleast 10 seconds greater than the Analysis Time.
5. To save the changes without closing the window, click Save. To save
the changes and close the window, click OK.
4.3.5 Removing an event from the Timed Event Table
To remove an event from one of the Valve Events, Integrate Events, or
Spectrum Gain Events tables on the Timed Events window, do the
following:
1. Select Timed Events... from the Application menu. The Timed
Events Tables selector window appears, displaying a list of available
timed events tables.
Figure 4-23. The Timed Events Tables selector window
Note
Other ways of accessing the timed event tables are by pressing F5 or by clicking
from the Toolbar.
4-31
User Manual
MON20/20 Software for Gas Chromatographs
3-9000-745
SEPTEMBER 2010
Note
If only one timed events table is available, it will display immediately, bypassing the
Timed Events Tables selector window.
2. Select the table that you want to view. The selected timed events
table displays.
Figure 4-24. The Timed Events window
Note
To sort events by time, click the appropriate Sort button.
3. Select the event that you want to delete.
4. Click the appropriate Delete button.
4-32
MON20/20 Software for Gas Chromatographs
SEPTEMBER 2010
User Manual
3-9000-745
4.3.6 Adding an event to the Timed Event Table
To add an event to one of the Valve Events, Integrate Events, or
Spectrum Gain Events tables on the Timed Events window, do the
following:
1. Select Timed Events... from the Application menu. The Timed
Events Tables selector window appears, displaying a list of available
timed events tables.
Figure 4-25. The Timed Events Tables selector window
Note
Other ways of accessing the timed event tables are by pressing F5 or by clicking
from the Toolbar.
Note
If only one timed events table is available, it will display immediately, bypassing the
Timed Events Tables selector window.
2. Select the table that you want to view. The selected timed events
table displays.
4-33
User Manual
MON20/20 Software for Gas Chromatographs
3-9000-745
SEPTEMBER 2010
Figure 4-26. The Timed Events window
Note
To sort events by time, click the appropriate Sort button.
3. If you want to add the event above the currently selected event, click
the appropriate Insert before button. If you want to add the event
below the currently selected event, select Insert after from the
Insert arrow and then click the button.
4-34
MON20/20 Software for Gas Chromatographs
SEPTEMBER 2010
User Manual
3-9000-745
The new event will be added to the table.
4. Select a Type, Valve/DO#, and State for the event, if necessary, and
enter a new Time for the event also.
5. To save the changes without closing the window, click Save. To save
the changes and close the window, click OK.
4.4
Managing Validation Data Tables
Use the validation data table to hold information about the composition of
the gas that is used in the validation run. During a validation run, the
GC performs a test analysis of a gas with a known component
composition to verify that the GC is working properly.
To add a component to the validation data table, do the following:
1. Select Validation Data from the Application menu. The Validation
Data window displays.
Figure 4-27. The Validation Data window
4-35
User Manual
MON20/20 Software for Gas Chromatographs
3-9000-745
SEPTEMBER 2010
2. If the appropriate table is not displayed, select it from the Choose
Table drop-down list.
3. Select a new variable by clicking on the appropriate drop-down list
under the Variable column. For a demonstration of how to use the
context-sensitive variable selector, see “Using the context-sensitive
variable selector” on page 1-42.
4. Enter the component’s concentration percentage in the appropriate
cell under the Nominal Value column. To ensure accuracy, this value,
which is compared to the GC’s analysis results at the end of the
validation run, should be taken from the documentation provided with
the gas cylinder.
5. Enter a value in the appropriate Percent Deviation cell. If you enter
10 in this field, and the GC’s analysis result for the component differs
from the component’s Nominal Value by ±10% or more, then an alarm
is generated.
6. To copy a component variable to the next empty row, click C + Copy.
The component will be increment to the next available component—
for example, from Ammonia to Benzene. The Nominal Value and
Percent Deviation values will also be copied.
Note
You can select and copy more than one component at a time.
If there are no components available, instead of copying the
component, MON 20/20 will display the following message:
Figure 4-28. No components warning
7. To save the changes without closing the window, click Save. To save
the changes and close the window, click OK.
4-36
MON20/20 Software for Gas Chromatographs
User Manual
SEPTEMBER 2010
4.5
3-9000-745
Managing calculations
MON 20/20’s Calculations
submenu allows you to activate
and define how the output of
standard or user-defined
chromatograph analysis data is
used in various calculations.
You can configure the following types of calculations:
• Control - Allows you to designate, by streams, the standard
calculations that should be performed from the analysis data.
• Averages - Allows you to designate, by streams and components,
averages of standard calculations MON 20/20 should perform.
• User Defined - Allows you to create and edit customized calculations
using analysis data.
• Dewpoint - This optional feature allows you to calculate dewpoint
temperatures and to estimate the cricondentherm, which is the
temperature above which no liquid will form at any pressure.
4.5.1 Setting standard calculations by stream
To designate, by streams, the standard calculations—for example, mole
percent, liquid volume, gas density, Wobbe index, etc.—that should be
performed from the analysis data, do the following:
1. Select Applications → Calculations → Control.... The Control
Calculations window appears.
4-37
User Manual
MON20/20 Software for Gas Chromatographs
3-9000-745
SEPTEMBER 2010
Figure 4-29. The Control Calculations window
2. Select a check box for a given stream to turn the calculation ON for
that stream; click to clear the check box for a given stream to turn the
calculation OFF for that stream.
You can use the arrow keys to move from one stream cell to another,
and you can press the space bar to toggle the calculation on or off.
3. To save the changes without closing the window, click Save. To save
the changes and close the window, click OK.
Note
To save the information on this screen to a tab-delimited text file, right-click on the table
and select Save Sheet from the right-click menu.
4-38
MON20/20 Software for Gas Chromatographs
User Manual
SEPTEMBER 2010
3-9000-745
Note
To copy the information on this screen to the clipboard so that it can be pasted into
another application such Microsoft Word or Excel, right-click on the table and select
Copy to clipboard from the right-click menu.
Note
To print the information on this screen, right-click on the table and select Print Sheet
from the right-click menu.
4.5.2 Editing average calculations
To designate, by streams and components, averages of standard
calculations the GC should perform, do the following:
1. Select Applications → Calculations → Averages.... The Averages
Calculations window appears.
4-39
User Manual
MON20/20 Software for Gas Chromatographs
3-9000-745
SEPTEMBER 2010
Figure 4-30. The Averages Calculations window
2. Select a new variable by clicking on the appropriate drop-down list
under the Variable column. For a demonstration of how to use the
context-sensitive variable selector, see “Using the context-sensitive
variable selector” on page 1-42.
3. Select the type of average to be calculated from the Average Type dropdown list. You have the following options:
• Unused - An average will not be calculated for the variable.
• Hourly - Averages will start and stop every hour, beginning at the
time displayed in the Reset Time field from the Averages Reset
section.
• 24 Hour - Averages will start and stop once a day at the time
displayed in the Reset Time field from the Averages Reset
section.
4-40
MON20/20 Software for Gas Chromatographs
SEPTEMBER 2010
User Manual
3-9000-745
• Weekly - Averages will start and stop once a week at the time
displayed in the Reset Time field and on the day entered in the
Weekday field, from the Averages Reset section.
• Monthly - Averages will start and stop once a month at the time
displayed in the Reset Time field and on the day of the month
entered in the Day field, from the Averages Reset section.
• Variable - Averages will start and stop every hour at the time
entered in the Hours column, instead of at the Reset Time.
• Everyrun - No average will be stored; instead, the current value
at the end of the run will be stored.
4. To set a custom start and stop time for a particular calculation, set the
Average Type for the calculation to Variable and enter the desired
time in the Hours cell.
Note
The custom Hours setting overrides the Reset Time setting.
5. Set the appropriate Restart Flag to one of the following options:
• NO - The current average will not be reset.
• CUR - The current average will be cleared and a new average
calculation will start.
6. To save the changes without closing the window, click Save. To save
the changes and close the window, click OK.
Note
To save the information on this screen to a tab-delimited text file, right-click on the table
and select Save Sheet from the right-click menu.
Note
To copy the information on this screen to the clipboard so that it can be pasted into
another application such Microsoft Word or Excel, right-click on the table and select
Copy to clipboard from the right-click menu.
Note
To print the information on this screen, right-click on the table and select Print Sheet
from the right-click menu.
4-41
User Manual
MON20/20 Software for Gas Chromatographs
3-9000-745
SEPTEMBER 2010
4.5.3 Viewing an archive of averages for a given variable
To view an archive of averages for a given variable, do the following:
1. Select Applications → Calculations → Averages.... The Averages
Calculations window appears.
Figure 4-31. The Averages Calculations window
2. Click on the desired variable to view its history.
3. Click Archive. The archive data screen appears.
4-42
MON20/20 Software for Gas Chromatographs
SEPTEMBER 2010
User Manual
3-9000-745
Figure 4-32. The archive data window
Note
To copy the information in this table to the clipboard so that it can be pasted into
another application such as Microsoft Word or Excel, select the cells that you want to
copy and then press CTRL + C to copy the information to the clipboard.
4-43
User Manual
MON20/20 Software for Gas Chromatographs
3-9000-745
SEPTEMBER 2010
4.5.4 Copying stream settings
To copy the stream settings from a highlighted row and apply them to the
next row, do the following:
1. Select Applications → Calculations → Averages.... The Averages
Calculations window appears.
Figure 4-33. The Averages Calculations window
2. Select the row that you want to copy.
3. Click S + Copy. The stream will be copied to the next row and
incremented to the next available stream—for example, from Stream
2 to Stream 3.
Note
You can select and copy more than one stream at a time.
4-44
MON20/20 Software for Gas Chromatographs
SEPTEMBER 2010
User Manual
3-9000-745
If there are no streams available, instead of copying the stream, MON
20/20 will display the following message:
Figure 4-34. No streams available warning
4. To save the changes without closing the window, click Save. To save
the changes and close the window, click OK.
4.5.5 Copying component settings
To copy the component settings from a highlighted row and apply them to
the next row, do the following:
1. Select Applications → Calculations → Averages.... The Averages
Calculations window appears.
4-45
User Manual
MON20/20 Software for Gas Chromatographs
3-9000-745
SEPTEMBER 2010
Figure 4-35. The Averages Calculations window
2. Select the row that contains the component that you want to copy.
3. Click the arrow beside the S + Copy button to switch it to C + Copy.
4. Click C + Copy. The component will be copied to the next row and
incremented to the next available component—for example, from
Ammonia to Benzene.
Note
You can select and copy more than one component at a time.
4-46
MON20/20 Software for Gas Chromatographs
SEPTEMBER 2010
User Manual
3-9000-745
If there are no components available, instead of copying the
component, MON 20/20 will display the following message:
Figure 4-36. No components available warning
5. To save the changes without closing the window, click Save. To save
the changes and close the window, click OK.
4.6
Creating Custom Calculations
To create or edit a customized calculation using GC analysis data, do the
following:
1. Select Applications → Calculations → User Defined.... The User
Defined Calculations window appears, containing a list of all the userdefined calculations that are available to the GC.
4-47
User Manual
MON20/20 Software for Gas Chromatographs
3-9000-745
SEPTEMBER 2010
Figure 4-37. The User Defined Calculations window
2. Click Insert before to add a row to the User Defined Calculations
table.
Note
To delete this--or any--row from the table, click Delete.
3. Double-click the Label cell and enter a name for the calculation you
are about to create. If you want to enter a short description for the
new calculation, double-click the Comment cell and enter it there.
4. Click Edit. The Edit User-defined Calculation window appears.
4-48
MON20/20 Software for Gas Chromatographs
SEPTEMBER 2010
User Manual
3-9000-745
Figure 4-38. The Edit User-defined Calculation window
A
B
C
E
D
F
In MON 20/20, building a calculation is similar to building a simple
program. You have constants and two types of variables available, as
well as two calculation-building commands. You can also add
comments that will be ignored by the application but that can help you
explain the logic and structure of the calculation you are designing.
4-49
User Manual
MON20/20 Software for Gas Chromatographs
3-9000-745
SEPTEMBER 2010
The following is a description of the design elements of the Edit Userdefined Calculation window:
• Element A - Called the Calculation Steps Viewer, this element
displays the line-by-line construction of the calculation as it is
being built. The following commands allow you to interact with
this area:
• Click Clear All to clear the content of the Calculation Steps
Viewer.
• Click Clear Line to clear the content of the selected line.
Note
If the selected line is an "If-Then" statement, then the entire condition is cleared. This
button is disabled when the cursor is on an "else" or "endif" condition.
• Click Delete Line to delete the selected line.
Note
If the selected line is the beginning of a conditional statement, then the entire "If-Then"
block will be deleted along with the expressions that constitute the "If-Then" construct.
If the selected line is part of the conditional "If-Then" construct—that is, the line only
has "Else" or "Endif" in it—then the entire "If-Then" construct will be deleted.
• Click Copy to copy the selected line to the clipboard. You cannot
copy keywords such as “else” or “endif.”
• Click Paste to paste the content of the clipboard into a selected
line. If the line already has a calculation in it, it is cleared before
the content of the clipboard is pasted into it.
• Element B - A drop-down menu with the following three
commands:
• Insert Comment - Adds a comment to the calculation. Each
comment is preceded by “//.”
• Insert Condition - Adds an “If-Then” statement to the
calculation.
• Insert Expression - Adds a mathematical expression to the
calculation.
• Element C - Also called the Expression Editor, this section is the
work area where the comment, condition or expression is built
before being added to the Calculation Steps Viewer. There are four
modes of the Expression Editor, depending upon what action is
being performed:
4-50
MON20/20 Software for Gas Chromatographs
SEPTEMBER 2010
User Manual
3-9000-745
Figure 4-39. Expression Editor - No Action
Figure 4-40. Expression Editor - Insert Comment
Figure 4-41. Expression Editor - Insert Condition
Figure 4-42. Expression Editor - Insert Expression
4-51
User Manual
MON20/20 Software for Gas Chromatographs
3-9000-745
SEPTEMBER 2010
The following commands allow you to interact with the Expression
Editor:
• Click Clear to clear the content of the entire line. The line itself
is not deleted.
• Click Delete Item to delete the currently active token. Each
mathematical function, numeric data, and mathematical
operation is treated as a token. The token to the right of the
current cursor location is treated as the currently active token.
• Click Evaluate Exp to check the validity of the expression. If
any errors are detected in the syntax, then an error will be
reported in the Output window.
Note
This button is only active when the line being edited is an expression.
• Click Done to evaluate the expression and copy it to the
Calculations Steps Viewer. If there are any errors in the
expression, they are reported in the Output window.
• Element D - This section contains calculator functions that can be
used to build a mathematical expression. This section can be
divided into two parts:
Figure 4-43. Calculator functions
1
4-52
2
MON20/20 Software for Gas Chromatographs
SEPTEMBER 2010
User Manual
3-9000-745
• Section 1 - This section contains the following keys:
x^y
x to the power of y
SQRT
Square Root
abs
Absolute Value
sin
Sine
cos
Cosine
tan
Tan
log10
Logarithm to the base 10
log2
Logarithm to the base 2
ln
Logarithm to the base e
and
Logical AND
or
Logical OR
xor
Logical XOR
(
Open bracket
)
Close bracket
• Section 2 - This section contains the traditional calculator keys
and can be used with your keyboard’s Numpad.
Note
Make sure to engage your keyboard’s Numlock before using the Numpad.
• Section E - This section contains drop-down menus and buttons
that allow you to create and select constants and variables that can
be added to your mathematical expressions.
4-53
User Manual
MON20/20 Software for Gas Chromatographs
3-9000-745
SEPTEMBER 2010
• Constants - Allows you to select constants from a drop-down
list.
• Temporary Variables - Allows you to select temporary, usercreated variables from a drop-down list.
• System Variables - Allows you to select system variables.
• Edit Temporary Variables - Allows you to create variables.
• Edit Constants - Allows you to create system-wide constants
that can be used in user-defined calculations.
• Section F - This section, called the Output Display, displays
status information.
5. Use the following procedures to build your calculation in the
Calculation Steps Viewer:
•
•
•
•
•
•
•
“Inserting a Comment” on page 4-54
“Inserting a Conditional Statement” on page 4-56
“Inserting an Expression” on page 4-59
“Creating a Constant” on page 4-61
“Creating or Editing a Temporary Variable” on page 4-63
“Inserting a System Variable” on page 4-64
“Using User-defined Calculations” on page 4-65
6. To see the result of the calculation, click Calculate. The results
display in the Output window. To validate the calculation for errors,
click Evaluate. The results of the validation check display in the
Output window. To save the calculation and to close the Edit Userdefined Calculation window, click OK.
7. On the User Defined Calculations window, to save the changes
without closing the window, click Save. To save the changes and close
the window, click OK.
4.6.1 Inserting a Comment
To add a comment to the calculation, do the following:
1. Click on the Insert drop-down list and select Insert Comment. A
new line will be added to the Calculation Steps Viewer and the
Expression Editor will switch to Edit Comment mode.
4-54
MON20/20 Software for Gas Chromatographs
SEPTEMBER 2010
User Manual
3-9000-745
Figure 4-44. Edit Comment mode
2. Enter the comment into the Edit Comment textbox and then click
Done. The comment will be added to the Calculation Steps
Viewer.
Figure 4-45. Calculation Steps Viewer
4-55
User Manual
MON20/20 Software for Gas Chromatographs
3-9000-745
SEPTEMBER 2010
4.6.2 Inserting a Conditional Statement
Figure 4-46. An example of a conditional statement
The Expression Editor in Edit Condition mode allows you to build the
first line of the conditional statement:
Figure 4-47. The Expression Editor in Edit Condition mode
Regular expression
Relational operator
4-56
Variables/Constants
MON20/20 Software for Gas Chromatographs
SEPTEMBER 2010
User Manual
3-9000-745
Expressions are built using the Expression Editor in Edit Expression
mode.
To add a conditional statement, do the following:
1. Click on the Insert drop-down list and select Insert Condition. A
new line is added to the Calculation Steps Viewer and the
Expression Editor switches to Edit Condition mode.
2. Add an expression. You can use constants, temporary variables,
system variables, and the calculator functions to build the expression.
For information on inserting system variables, see page 4-64. For
information on creating variables, see page 4-63. For information on
creating constants, see page 4-61.
Figure 4-48. Edit Expression area
3. Select a relational operator from the drop-down list. You have the
following options:
<
Less than
<=
Less than or equal
>
Greater than
>=
Greater than or equal
==
Equal
!=
Not equal
4. To add a variable or constant to the expression, click the Variable/
Constant drop-down list and select the appropriate item.
4-57
User Manual
MON20/20 Software for Gas Chromatographs
3-9000-745
SEPTEMBER 2010
Figure 4-49. the Variable/Constant drop-down list
For information on creating variables, see page 4-63. For information
on creating constants, see page 4-61.
5. Click Done. MON 20/20 validates the statement and if there are no
errors, it adds it to the Calculation Steps Viewer.
Figure 4-50. Calculation Steps Viewer
To complete the conditional statement, use the Expression Editor in
Edit Expression mode to add the necessary mathematical expressions.
4-58
MON20/20 Software for Gas Chromatographs
User Manual
SEPTEMBER 2010
3-9000-745
4.6.3 Inserting an Expression
A mathematical expression has the following structure:
Variable = Regular expression
Figure 4-51. Edit Expression area
regular expression
variable
To add an expression to a conditional statement or calculation, do the
following:
1. Click on the Insert drop-down list and select Insert Expression. A
new line is added to the Calculation Steps Viewer and the
Expression Editor switches to Edit Expression mode.
2. Select a variable from the Variable drop-down tree view. You can
select either a temporary variable or you can set the expression you
are building as the final result of your new user-defined calculation.
For instance, if the user-defined calculation you are building is called
‘User Calc 1,’ then you can select User Calc 1 from the Final Result
tree view. For information on creating variables, see “Creating or
Editing a Temporary Variable” on page 4-63.
4-59
User Manual
3-9000-745
MON20/20 Software for Gas Chromatographs
SEPTEMBER 2010
Figure 4-52. The Final Result tree view
3. Add a regular expression. You can use constants, temporary
variables, system variables, and the calculator functions to build the
expression. For information on inserting system variables, see page 464. For information on creating variables, see page 4-63. For
information on creating constants, see page 4-61.
Figure 4-53. The Edit Expression area
4. Click Done. MON 20/20 validates the statement and if there are no
errors, it adds it to the Calculation Steps Viewer.
4-60
MON20/20 Software for Gas Chromatographs
SEPTEMBER 2010
User Manual
3-9000-745
Figure 4-54. The Calculation Steps Viewer
4.6.4 Creating a Constant
To create a constant that you can use in building a calculation, do the
following:
1. From the Edit User-defined Calculation window, click Edit
Constants. The Edit Constants window displays, showing all the
constants that have been created so far for the GC.
4-61
User Manual
MON20/20 Software for Gas Chromatographs
3-9000-745
SEPTEMBER 2010
Figure 4-55. The Edit Constants window
2. To create a new constant, click Insert before. A new row will be
added to the USER_CALC_CONSTANTS table.
Note
To delete a constant, select it in the table and click Delete.
3. Double-click the Label cell and enter a name for the constant.
Note
To edit any cell, double-click it.
4. Double-click the Value cell and enter a value for the constant.
5. Use the Comment cell to store information that is relevant for the
constant.
6. To save the changes without closing the window, click Save. To save
the changes and close the window, click OK.
4-62
MON20/20 Software for Gas Chromatographs
User Manual
SEPTEMBER 2010
3-9000-745
4.6.5 Creating or Editing a Temporary Variable
To create a temporary variable that you can use in building a calculation,
do the following:
1. From the Edit User-defined Calculation window, click Edit
Temporary Variables. The Edit Temporary Variables window
displays, showing all the temporary variables that have been created
so far for the user-defined calculation.
Figure 4-56. The Edit Temporary Variables window
2. To create a new temporary variable, click Insert. A new row will be
added to the table.
Note
To delete a variable from this window, select it in the table and click Delete.
3. Double-click the Name cell and enter a name for the variable.
4. Use the Comment cell to store information that is relevant for the
variable.
5. To save the changes without closing the window, click Save. To save
the changes and close the window, click OK.
4-63
User Manual
3-9000-745
MON20/20 Software for Gas Chromatographs
SEPTEMBER 2010
4.6.6 Inserting a System Variable
To insert a system variable into the Expression Editor, do the following:
From the Edit User-defined Calculation window, click on the System
Variables drop-down arrow.
For a demonstration of how to use the context-sensitive variable selector,
see “Using the context-sensitive variable selector” on page 1-42.
The selected system variable displays in the System Variables drop-down
box and in the Expression Editor.
Figure 4-57. The Expression Editor
4-64
MON20/20 Software for Gas Chromatographs
SEPTEMBER 2010
User Manual
3-9000-745
4.6.7 Using User-defined Calculations
You can use a previously-created user-defined calculation when building
new calculations by clicking on the System Variables drop-down arrow on
the Edit User-defined Calculation window.
Figure 4-58. System Variables drop-down menu
For a demonstration of how to use the context-sensitive variable selector,
see “Using the context-sensitive variable selector” on page 1-42.
The selected system variable displays in the System Variables drop-down
box and in the Expression Editor.
4-65
User Manual
3-9000-745
Figure 4-59. The Expression Editor
4-66
MON20/20 Software for Gas Chromatographs
SEPTEMBER 2010
MON20/20 Software for Gas Chromatographs
User Manual
SEPTEMBER 2010
4.7
3-9000-745
Setting the calculation method
MON 20/20 can be configured to perform GPA calculations, ISO
calculations, or both.
To set which type of calculation method MON 20/20 should use, do the
following:
1. Select Applications → Calculations → Configuration.... The
Calculations Configuration window displays.
Figure 4-60. The Calculations Configuration window
2. Select the method from the Calculation Method drop-down list. The
options are:
• GPA
• ISO
• GPA & ISO
4-67
User Manual
MON20/20 Software for Gas Chromatographs
3-9000-745
SEPTEMBER 2010
3. Select a unit of measure from the Base Pressure Units drop-down list.
The options are:
• PSI
• Bar
• kPa
4. If you set the calculation method to GPA or GPA & ISO, you can also
set the following options:
• GPA Calculator Units (U.S. or S.I.)
• GPA Pressure Display (PSI, Bar or kPa)
5. If you set the calculation method to ISO or GPA & ISO, you can also
set the following options:
• ISO Pressure Display (Bar or kPa)
• Primary Temperatures
- 0C/0C
- 0C/15C
- 0C/20C
- 15C/0C
- 15C/15C
- 15C/20C
- 20C/0C
- 20C/15C
- 20C/20C
- 25C/0C
- 25C/15C
- 25C/20C
Note
Updating this field also updates the primary values—Sum Factor Pri, CV Superior Pri
and CV Inferior Pri—that display in the CDT.
• Secondary Temperatures (same options as Primary Temperatures)
Note
Updating this field also updates the secondary values—Sum Factor Sec, CV Superior
Sec and CV Inferior Sec—that display in the CDT.
4-68
MON20/20 Software for Gas Chromatographs
User Manual
SEPTEMBER 2010
3-9000-745
• Primary CV Units
- kilojoules per cubic meter (kJ/m3)
- kilocalories per cubic meter (kCal/m3)
- kilowatt hours per cubic meter (kWhrs/m3)
- megajoule per cubic meter (MJ/m3)
- megajoule per kilogram (MJ/kg)
- megajoule per mole (MJ/mole)
• Secondary CV Units (same options as Primary CV Units)
6. Click Save to accept the changes without closing the window, or click
OK to accept the change and close the window.
4.8
Setting alarm limits
Use this function to set threshold limits for GC analysis data. When a
limit is exceeded, an alarm is activated and logged. See “Viewing the
alarm log” on page 5-4 for information on Alarm Logs.
To set an alarm limit for a variable, do the following:
1. Select Applications → Limit Alarms.... The Limit Alarms window
displays.
4-69
User Manual
MON20/20 Software for Gas Chromatographs
3-9000-745
SEPTEMBER 2010
Figure 4-61. The Limit Alarms window
2. Select a new variable by clicking on the appropriate drop-down list
under the Variable column. For a demonstration of how to use the
context-sensitive variable selector, see “Using the context-sensitive
variable selector” on page 1-42.
3. To change the alarm type, click the appropriate cell under the Type
column. You have the following the options:
• Off - Turns off the alarm.
• All - Use high and low limits to activate alarms. Enter the lower
limit value in the appropriate cell under the Low Limit column.
Enter the upper limit value in the appropriate cell under the High
Limit column.
• High - If the status value of the variable rises above the value set
in the corresponding High Limit column, the high limit alarm is
activated.
• Low - If the status value of the variable falls below the value set in
the corresponding Low Limit column, the low limit alarm is
activated.
4-70
MON20/20 Software for Gas Chromatographs
SEPTEMBER 2010
User Manual
3-9000-745
4. If you want a discrete output to activate when the alarm triggers, click
on the appropriate cell under the DO # to Set column and select it
from the drop-down list.
5. To prevent or allow averaging when the alarm triggers, double-click
on the appropriate cell under the Inhibit Avg column, and select one of
the following options:
• True - Inhibits averaging when the alarm is active.
• False - Allows averaging when the alarm is active.
6. To customize the text of the alarm message, enter the new text in the
appropriate cell under the User Alarm Text column. When the alarm
triggers, this text will display under the Alarm Message column on the
Unack/Active Alarms window.
Note
If an alarm message is changed, all affected alarm entries, including those previously
recorded, will include that change.
7. To enable or disable the use of the customized alarm text, select True
or False from the appropriate cell under the Inhibit Alarm Text
column.
8. To copy the stream settings from a highlighted row and apply them to
the next row, click S + Copy. The stream will be copied and
incremented to the next available stream--for example, from Stream 2
to Stream 3.
If there are no streams available, instead of copying the stream, MON
20/20 will display the following message:
Figure 4-62. No streams available warning
4-71
User Manual
MON20/20 Software for Gas Chromatographs
3-9000-745
SEPTEMBER 2010
9. Click C + Copy. The component will be copied and incremented to the
next available component--for example, from Ammonia to Benzene.
If there are no more components available, instead of copying the
component, MON 20/20 will display the following message:
Figure 4-63. No components available warning
10. If you want the GC to halt after the current analysis when an alarm is
triggered, do the following:
(a.) Select the Halt on Alarm? checkbox.
(b.) Enter a value in the Delay column for the length of time, in
seconds, that the alarm condition should exist before the Halt
command is executed. You can enter a value between 0 and 1800.
11. To save the changes without closing the window, click Save. To save
the changes and close the window, click OK.
4.9
Managing system alarms
To edit system alarms, do the following:
1. Select System Alarms... from the Applications menu. The System
Limit Alarms window displays.
4-72
MON20/20 Software for Gas Chromatographs
SEPTEMBER 2010
User Manual
3-9000-745
Figure 4-64. The Limit Alarms window
2. If you want a discrete output to activate when the alarm triggers, click
on the appropriate cell under the DO # to Set column and select it
from the drop-down list.
3. To prevent or allow averaging when the alarm triggers, double-click
on the appropriate cell under the Inhibit Avg column, and select one of
the following options:
• True - Inhibits averaging when the alarm is active.
• False - Allows averaging when the alarm is active.
4. To enable the alarm check the checkbox under the Is Alarm Enabled?
column; to disable the alarm, uncheck the checkbox under the Is
Alarm Enabled? column; to disable the alarm.
4-73
User Manual
MON20/20 Software for Gas Chromatographs
3-9000-745
SEPTEMBER 2010
5. If you want the GC to halt after the current analysis when an alarm is
triggered, do the following:
(a.) Select the Halt on Alarm? checkbox.
(b.) Enter a value in the Delay column for the length of time, in
seconds, that the alarm condition should exist before the Halt
command is executed. You can enter a value between 0 and 1800.
6. To save the changes without closing the window, click Save. To save
the changes and close the window, click OK.
4.10 Managing streams
This function allows you to do the following:
• Assign component data tables, validation data tables, and timed
events tables to a particular stream.
• Designate a stream for analysis, validation, or calibration.
• Control automatic calibration or validation parameters, such as the
total number of runs, runs to be averaged, starting times, and time
between automatic calibrations and baseline runs.
• Define baseline pressure and temperature conditions that are
applicable to calculated GC analysis data, such as compressibility.
4.10.1 Designating how a stream will be used
To assign how a stream will be used, do the following:
1. Select Streams... from the Application menu. The Streams window
opens.
4-74
MON20/20 Software for Gas Chromatographs
SEPTEMBER 2010
User Manual
3-9000-745
Figure 4-65. The Streams window
2. For the appropriate stream, select one of the following options from
the Usage column:
•
•
•
•
Unused - Not used
Cal - Calibration
Analy - Analysis
Validate - Validation
3. If you select Cal or Validation, you can also edit the following
parameters:
• Auto - If checked, the calibration or validation will be automatic.
• Tot Runs - The number of runs, from 1 to 10, to make for each
calibration.
• Avg Runs - The number of most-recent calibration runs to
average; for instance, if five calibration runs are performed and
Avg Run is set to 3, then the last three runs of the five will be used
to average the calibration results.
• Start Time - The time the first automatic calibration should be
performed.
• Interval - The number of hours between automatic calibrations.
• Auto Calib - Enable or disable the automatic calibration run.
4-75
User Manual
MON20/20 Software for Gas Chromatographs
3-9000-745
SEPTEMBER 2010
• Auto Baseline - Enable or disable the automatic baseline run.
The GC performs an additional calibration run (before the
calibration runs to be averaged) without the calibration gas. This
run evaluates the peaks caused by the GC valve action alone; any
peak areas found are subtracted from the subsequent analyses.
Note
Disabling the Auto Baseline setting will delete existing CDT baseline data for the
associated stream.
4. To save the changes without closing the window, click Save. To save
the changes and close the window, click OK.
4.10.2 Assigning a valve to a stream and setting the relationship
between the stream’s open state to the valve’s On/Off state
To assign a valve to a stream, do the following:
1. Select Streams... from the Application menu. The Streams window
opens.
Figure 4-66. The Streams window
2. Go to the Stream Valve column for the corresponding stream and
select the appropriate valve from the drop-down list.
4-76
MON20/20 Software for Gas Chromatographs
SEPTEMBER 2010
User Manual
3-9000-745
Details about the valves in the drop-down list can be viewed from the
Valves window.
3. To save the changes without closing the window, click Save. To save
the changes and close the window, click OK.
4. To have the stream open when the valve is ON, select the
corresponding Stream Valve On to Select checkbox; to have the stream
open when the valve is OFF, clear the corresponding Stream Valve On
to Select checkbox.
4.10.3 Assigning a data table to a particular stream
To assign a component data table, a validation data table, or a timed
events table to a stream, do the following:
1. Select Streams... from the Application menu. The Streams window
opens.
Figure 4-67. The Streams window
2. For the appropriate stream, if Usage is set to Cal or Analy, select a
component data table from the CDT column and a timed events table
from the TEV column.
3. For the appropriate stream, if Usage is set to Validate, select a
component data table from the CDT column, a timed events table from
the TEV column, and a validation data table from the VDT column.
4-77
User Manual
MON20/20 Software for Gas Chromatographs
3-9000-745
SEPTEMBER 2010
4. To save the changes without closing the window, click Save. To save
the changes and close the window, click OK.
4.10.4 Changing the base pressure for a stream
To change the base pressure for a stream, do the following:
1. Select Streams... from the Application menu. The Streams window
opens.
Figure 4-68. The Streams window
2. For the appropriate stream, double-click on the corresponding cell
under the Base Pressure column and enter an new value.
3. To save the changes without closing the window, click Save. To save
the changes and close the window, click OK.
4.11 Creating a stream sequence for a detector
A stream sequence defines the order of stream analysis for a detector. To
create or edit a stream sequence, do the following:
1. Select Stream Sequence... from the Application menu. The Stream
Sequence window displays.
4-78
MON20/20 Software for Gas Chromatographs
SEPTEMBER 2010
User Manual
3-9000-745
Figure 4-69. The Stream Sequence window
2. Each stream sequence table can contain up to three sequences--a
primary, or default, sequence, and two auxiliary sequences. The table
for detector that is designated as “1” displays by default. To display a
different table, select it from the Choose table: drop-down list.
3. To create a new stream sequence, click Insert before.
Note
There can only be three sequences per detector. If a detector already has three
sequences and you want to create a new one, you must edit or delete one of the existing
sequences. Click Delete to delete a sequence.
4. Double-click the appropriate cell under the Strm Seq Name column to
give your new sequence a name, or to edit the name of an existing
sequence. Type in the new name.
5. To define the order of analysis, double-click the appropriate cell under
the Seq of Strms column and the numbers for the streams, seperated
by commas, that should be analyzed.
6. To define which discrete input should activate the sequence, select it
from the drop-down list of the appropriate cell under the Seq Activate
DI column.
4-79
User Manual
MON20/20 Software for Gas Chromatographs
3-9000-745
SEPTEMBER 2010
Note
No two sequences can be activated by the same discrete input.
7. Select the type of analysis the detector should perform when following
the sequence. There are two options:
• Analysis - The detector performs a real analysis of the streams.
• Validation - The detector performs a test analysis to verify that it
is working properly.
8. To save the changes without closing the window, click Save. To save
the changes and close the window, click OK.
4.12 Communications
Use this function to configure and manipulate the communication
settings the GC uses to connect with a Data Collection System (DCS).
To add a new communications port setting to the Communication
window, click Insert before. A new row will be added to the
Communication table.
The following table lists the parameters that can be edited for the
communications port setting:
Name
Description
Label
The name of the group of settings.
ModBus Id
Identification number of the ModBus device.
Baud Rate
The baud rate setting. Options are: 1200, 2400, 9600, 19200, 38400, and 57600.
For high performing PCs, set the baud rate to 38400. If you experience a
communications failure at this rate, set the baud rate to 9600. Baud rate settings
less than 9600 may result in real-time delivery that is unacceptably slow.
Data Bits
The number of data bits. Options are 7 and 8 (default).
Stop Bit
The number of stop bits. Options are 1 (default) and 2.
Parity
The parity check method. Options are None (default), Even and Odd.
HW Flow Cntrl
Allows you to enable or disable hardware handshaking signals (RTS/CTS).
4-80
MON20/20 Software for Gas Chromatographs
SEPTEMBER 2010
RTS Off Dly
User Manual
3-9000-745
The delay in milliseconds between RTS termination and the end of data
transmission.
Range: 0 to 1000
RTS ON Sly
The delay in milliseconds between RTS activation and the start of data transmission
Range: 0 to 1000
Port Resp Dly
The delay in milliseconds the communication port will wait before sending a
response back to device.
Range: 0 to 100
Port Avail
Allows you to enable or disable the communication port.
Timeout
The time interval in seconds within which the GC is required to read the response
from device.
Unit System
Sets the type of measurement system to use. Options are U.S. Customary or
Metric.
MAP File
Points to the file that contains the registers that should be used.
Port
Allows you to set the type of protocol to be used for the port: RS232, RS422 or
RS485.
If the port is set to RS422 or RS485, additional configuration steps are required; see
your GC manual for more information
To delete a communications port setting from the Communication
window, click Delete. A selected row will be deleted from the
Communication table.
4.12.1 Creating or editing registers
You can map GC data to Modbus registers and generate MAP files, which
can then be associated with communications ports.
For a list of variable assignments made to all registers, consult the
Communication section of the PC Config Report.
4-81
User Manual
MON20/20 Software for Gas Chromatographs
3-9000-745
SEPTEMBER 2010
To map GC data to Modbus registers, do the following:
1. Select Communication... from the Application menu. The
Communication window appears.
Figure 4-70. The Communication window
2. Click Registers. The Modbus Map Editor window appears.
Figure 4-71. The Modbus Map Editor window
4-82
MON20/20 Software for Gas Chromatographs
SEPTEMBER 2010
User Manual
3-9000-745
3. To view or edit registers that are contained in an existing MAP file,
click on the Select MAP File drop-down list and select the appropriate
file. The registers will load into the table.
Figure 4-72. The Modbus Map Editor window
4-83
User Manual
MON20/20 Software for Gas Chromatographs
3-9000-745
SEPTEMBER 2010
4. To edit a cell, double-click it. You can edit the following parameters:
Name
Description
Register Number
Displays the number for the Modbus register that will be polled by a connected
data acquisition system.
Data Type
Describes the type of data that is stored in the register.
SIM_2251 and User_Modbus options are:
• BOOLEAN
• INT
• LONG
• FLOAT
• Bitmap(INT)
• Bitmap(LONG)
• SCALED_FP1
...
• SCALED_FP32
If one of the scaled floating point options is chosen, the Zero Scale and Full
Scale values for that option will display in the appropriate column cells.
The default User_Modbus data type is FLOAT, which means the value is not
converted to an integer and is stored in two adjacent registers. Data types
other than FLOAT require only one register per variable.
Variable(s)
Displays the variable(s) whose value is to be stored in the register. To change
the variable, see “Assigning a variable to a register” on page 4-92.
Access
Determines whether the register will be read-only (RD_ONLY) or read/write
(RD_WR).
5. To copy the component settings from a highlighted row and apply
them to the next row, click C + Copy. This feature also increments
the Component value to the next available component (e.g.,
incrementing from Ammonia to Benzene), per the GC application. An
error message displays when the last available component is reached.
6. To copy the stream settings from a highlighted row and apply them to
the next row, click S + Copy. This feature also increments the Stream
value to the next available stream (e.g., incrementing from Stream 2
to Stream 3), per the GC application. An error message displays when
the last available stream is reached.
7. To delete a row, click Delete.
8. To insert a row, click Insert.
4-84
MON20/20 Software for Gas Chromatographs
SEPTEMBER 2010
User Manual
3-9000-745
9. To check for conflicting register assignments, click Check. MON 20/
20 will check the table and if it encounters a conflict it will display the
following message:
Figure 4-73. Conflicting registers warning
Review the table to locate the conflicting registers and change one.
10. To save the MAP file, do the following:
(a.) Click Export. MON 20/20 validates the table for errors--for
instance, ensuring that no two registers share a register number.
If any errors are found MON 20/20 displays the appropriate error
message. When no errors are found, the Save As window displays.
Figure 4-74. The Save As window
4-85
User Manual
MON20/20 Software for Gas Chromatographs
3-9000-745
SEPTEMBER 2010
(b.) Enter a new name for the file or select the file that you want to
overwrite.
(c.) Click Save.
4.12.2 Creating a new map file
To create a new MAP file, do the following:
1. Select Communication... from the Application menu. The
Communication window appears.
Figure 4-75. The Communication window
2. Click Registers. The Modbus Map Editor window appears.
4-86
MON20/20 Software for Gas Chromatographs
SEPTEMBER 2010
User Manual
3-9000-745
Figure 4-76. The Modbus Map Editor window
3. Click New. A new row will be added to the table and the column
headings will be empty.
4-87
User Manual
MON20/20 Software for Gas Chromatographs
3-9000-745
SEPTEMBER 2010
Figure 4-77. The Modbus Map Editor window
4. From the Register Type drop-down list, select the type of PLC
emulation protocol you want to use. You have two options:
User_Modbus, which is a PLC emulation Modbus protocol that can
use scaling to convert floating point numbers to integers, and
SIM_2251, which emulates the Daniel 2500 communication protocol
and is a simulation of the 2251 GC controller.
The table’s column headers change based on which protocol is
selected.
5. If you want to base the new MAP file on an existing MAP file, do the
following:
(a.) Click Import. The Open window displays.
4-88
MON20/20 Software for Gas Chromatographs
SEPTEMBER 2010
User Manual
3-9000-745
Figure 4-78. The Open window
(b.) Select the file that you want to import and click Open. The
registers from the selected file will load into the table.
Figure 4-79. The Modbus Map Editor
4-89
User Manual
MON20/20 Software for Gas Chromatographs
3-9000-745
SEPTEMBER 2010
6. To edit a cell, double-click it. You can edit the following parameters:
Name
Description
Register Number
Displays the number for the Modbus register that will be polled by a connected
data acquisition system.
Data Type
Describes the type of data that is stored in the register.
SIM_2251 registers use only one data type: FLOAT.
User_Modbus options are:
• BOOLEAN
• INT
• LONG
• FLOAT
• Bitmap(INT)
• Bitmap(LONG)
• SCALED_FP1
...
• SCALED_FP32
If one of the scaled floating point options is chosen, the Zero Scale and Full Scale
values for that option will display in the appropriate column cells.
The default User_Modbus data type is FLOAT, which means the value is not
converted to an integer and is stored in two adjacent registers. Data types other
than FLOAT require only one register per variable.
Variable(s)
Displays the variable(s) whose value is to be stored in the register. To change the
variable, see “Assigning a variable to a register” on page 92.
Access
Determines whether the register will be read-only (RD_ONLY) or read/write
(RD_WR).
7. To copy the component settings from a highlighted row and apply
them to the next row, click C + Copy. This feature also increments
the Component value to the next available component (e.g.,
incrementing from Ammonia to Benzene), per the GC application. An
error message displays when the last available component is reached.
8. To copy the stream settings from a highlighted row and apply them to
the next row, click S + Copy. This feature also increments the Stream
value to the next available stream (e.g., incrementing from Stream 2
to Stream 3), per the GC application. An error message displays when
the last available stream is reached.
9. To delete a row, click Delete.
10. To insert a row, click Insert.
4-90
MON20/20 Software for Gas Chromatographs
SEPTEMBER 2010
User Manual
3-9000-745
11. To check for conflicting register assignments, click Check. MON 20/
20 will check the table and if it encounters a conflict it will display the
following message:
Figure 4-80. Conflicting registers warning
Review the table to locate the conflicting registers and change one.
12. To save the MAP file, do the following:
(a.) Click Export. MON 20/20 validates the table for errors--for
instance, ensuring that no two registers share a register number.
If any errors are found MON 20/20 displays the appropriate error
message. When no errors are found, the Save As window displays.
Figure 4-81. The Save As window
4-91
User Manual
MON20/20 Software for Gas Chromatographs
3-9000-745
SEPTEMBER 2010
(b.) Enter a new name for the file or select the file that you want to
overwirte.
(c.) Click Save.
4.12.3 Assigning a variable to a register
To assign a variable to a register, from the Modbus Map Editor window,
double-click the appropriate Variable(s) cell and select a new variable.
For a demonstration of how to use the context-sensitive variable selector,
see “Using the context-sensitive variable selector” on page 1-42.
4.12.4 Viewing or editing scales
Scales allow you to use one register to store floating point variables
instead of the customary two registers. By using a scale, floating point
data can then be converted to integer values.
MON 20/20 supports 32 different scales that are labelled SCALED_FP1
through SCALED_FP32. The Data Type column on the Modbus Map
Editor window displays the type of scale, if any, that is being used for a
particular register. If a scale is being used, the Zero Scale and Full Scale
columns will display the lower and upper values for the chosen scale.
To view the list of scales, select Application → Communication... →
Registers and click Edit Scales from the Modbus Map Editor window.
The Edit Scales window displays all of the scales, along with each scales
lower and upper values.
4-92
MON20/20 Software for Gas Chromatographs
SEPTEMBER 2010
User Manual
3-9000-745
Figure 4-82. The Edit Scales window
Use the following formula to calculate the variable’s integer value:
RF – RZ
integer = ⎛ -------------------⎞ ( D fp – S Z ) + R Z
⎝ SF – SZ ⎠
where:
RF = Full Scale, range
RZ = Zero Scale, range
SF = Full Scale, scale
SZ = Zero Scale, scale
Dfp = Floating Point value
4-93
User Manual
MON20/20 Software for Gas Chromatographs
3-9000-745
SEPTEMBER 2010
For example:
RF = 65535
RZ = 0
SF = 100 (from SCALED_FP1)
SZ = 0 (from SCALED_FP1)
Dfp = 97.13 (scaled percent for methane)
65535 – 0
63654 = ⎛ ------------------------⎞ ( 97.13 – 0 ) + 0
⎝ 100 – 0 ⎠
To edit or create your own scale, do the following:
1. Select Application → Communication... → Registers and click
Edit Scales from the Modbus Map Editor window.
Figure 4-83. The Edit Scales window
2. Double-click on the appropriate cell and enter a new value.
3. To save the changes and close the window, click OK.
4-94
MON20/20 Software for Gas Chromatographs
SEPTEMBER 2010
User Manual
3-9000-745
4.13 Configuring the gas chromatograph’s Ethernet port
The 700XA has two ethernet ports that can be used to connect the GC
with MON 20/20.
To configure one or both ethernet ports, select Ethernet Ports... from
the Application menu. The Ethernet Ports window displays.
Figure 4-84. The Ethernet Ports window
The following table describes the ethernet ports’ parameters:
Eth0 IP Address
IP address to use to connect to the GC at port Eth0.
Eth0 Mask
Subnet mask for the IP address at port Eth0.
Eth1 IP Address
IP address to use to connect to the GC at port Eth1.
Eth1 Mask
Subnet mask for the IP address at port Eth1.
Gateway
Default gateway address for the network.
4-95
User Manual
MON20/20 Software for Gas Chromatographs
3-9000-745
SEPTEMBER 2010
4.14 Working with local operator interface variables
Use this window to select and configure up to 25 GC parameters that you
would like to monitor using the LOI’s Display mode. Refer to the 700XA
Gas Chromatograph System Reference Manual (P/N# 3-9000-744) for
more information about the LOI.
To set an LOI parameter, do the following:
1. Select LOI Status Variables... from the Application menu. The
LOI Status Variables window appears.
Figure 4-85. The LOI Status Variables window
2. Select a new variable by clicking on the appropriate drop-down list
under the Variable column. For a demonstration of how to use the
context-sensitive variable selector, see “Using the context-sensitive
variable selector” on page 1-42.
4-96
MON20/20 Software for Gas Chromatographs
SEPTEMBER 2010
User Manual
3-9000-745
Note
If Include Mole Percents for current stream is checked, the maximum number of
variables you can select is five; if Include Mole Percents for current stream is not
checked, you can choose up to 25 variables.
3. To copy the stream settings from a highlighted row and apply them to
the next row, click S + Copy. This feature also increments the Stream
value to the next available stream—for instance, incrementing from
Stream 2 to Stream 8, per the GC application.
4. To copy the component settings from a highlighted row and apply
them to the next row, click C + Copy. This feature also increments the
Component value to the next available component—incrementing
from Ammonia to Benzene, per the GC application.
5. Enter a value in the Precision column to indicate the number of
decimal places to display for this particular variable. For component
concentrations, the range of possible Precision values is between 2 and
6. For all other variables, the range of possible values is between 0
and 6.
6. To save the changes without closing the window, click Save. To save
the changes and close the window, click OK.
4-97
User Manual
MON20/20 Software for Gas Chromatographs
3-9000-745
SEPTEMBER 2010
4.15 Mapping Foundation Fieldbus variables
To map a GC variable to a Foundation Fieldbus process variable (PV), do
the following:
1. Select FFB PV Mappings... from the Application menu. The FFB
PV Mappings window displays.
Figure 4-86. The FFB PV Mappings window
2. Select a new variable by clicking on the appropriate drop-down list
under the Variable column. For a demonstration of how to use the
context-sensitive variable selector, see “Using the context-sensitive
variable selector” on page 1-42.
Note
The PV Value column displays the current value of the GC variable indicated in the
Variable column.
4-98
MON20/20 Software for Gas Chromatographs
SEPTEMBER 2010
User Manual
3-9000-745
Note
The PV Status column indicates the state of the data displayed in the PV Value column.
If the data was generated under predictable conditions, then the status for all mapped
process variables will be Good; if the data was generated under unpredictable
conditions—that is, if any alerts were triggered during the analysis cycle—then the
status for all mapped process variables will be Bad, because the GC cannot guarantee
the results of the analysis.
3. To copy the stream settings from a highlighted row and apply them to
the next row, click S + Copy. This feature also increments the Stream
value to the next available stream—for instance, incrementing from
Stream 2 to Stream 8, per the GC application.
4. To copy the component settings from a highlighted row and apply
them to the next row, click C + Copy. This feature also increments the
Component value to the next available component—incrementing
from Ammonia to Benzene, per the GC application.
5. If necessary, enter a date or time format into the Date/Time Format
column.
6. To save the changes without closing the window, click Save. To save
the changes and close the window, click OK.
4-99
User Manual
MON20/20 Software for Gas Chromatographs
3-9000-745
SEPTEMBER 2010
This page is intentionally left blank.
4-100
Section 5: Logs and reports
The options in the Logs/Reports menu
allow you to do the following:
•Keep a maintenance record.
•Keep a parameter record.
• View alarm, system and event logs.
•View and print trend data.
•View the GC Config report.
•View relevants drawings and diagrams.
•View archived analysis, calibration and
averages reports.
•Configure how and when certain
reports are printed.
5.1
Viewing and clearing alarms
Use this menu to view and/or clear
unacknowledged and active alarms, as well as
to view the Alarm Log.
5-1
User Manual
MON20/20 Software for Gas Chromatographs
3-9000-745
SEPTEMBER 2010
5.1.1 Viewing unacknowledged and active alarms
To view unacknowledged and active alarms, select Logs/Reports →
Alarms → Unack/Active Alarms.... The Unack/Active Alarms window
displays.
Figure 5-1. The Unack/Active Alarms window
Note
Double-clicking on the GC Status Bar from the main window also displays the Unack/
Active Alarms window.
There are three display options for viewing alarms on this window:
• To view both unacknowledged alarms and active alarms, check All
Alarms.
• To view unacknowledged alarms only, check Unacknowledged
Alarms.
5-2
MON20/20 Software for Gas Chromatographs
SEPTEMBER 2010
User Manual
3-9000-745
• To view active alarms only, check Active Alarms. This is the default
display option.
The Unack/Active Alarms window supplies the following data for each
alarm:
Name
Description
Status
Indicates whether the alarm has been acknowledged or not.
State
Indicates whether the alarm is ACTIVE or INACTIVE.
Date
Indicates the date and time at the GC when the alarm condition began.
Alarm Message
Describes the alarm condition.
Type
Indicates whether a high limit or low limit alarm was trigger:
• HI means a high limit alarm was triggered.
• LO means a high limit alarm was triggered.
Limit
Indicates the value that was set as the trigger for the alarm.
Value
Indicates the current status value being output by the device.
Name
Indicates the name of the variable that triggered the alarm.
Note
Discrete alarms do not display Type, Limit, or Value data.
5.1.2 Acknowledging and clearing alarms
There are three ways to acknowledge and clear alarms:
• To acknowledge and clear alarms without viewing them, select Logs/
Reports → Alarms → Clear/Ack All Active Alarms.
• Another method to acknowledge and clear alarms without viewing
them is to click
from the Toolbar.
• To view the alarms before acknowledging and clearing them, select
Logs/Reports → Alarms → Unack/Active Alarms.... The Unack/
Active Alarms window provides several options:
• To acknowledge an alarm, select it and then click Ack Selected
(F2).
5-3
User Manual
MON20/20 Software for Gas Chromatographs
3-9000-745
SEPTEMBER 2010
Note
An alarm triggered by a user-defined value will continue to display as an active alarm
until that value is no longer in the alarm state.
• To acknowledge all the alarms displayed on the window, click Ack
All (F3).
• To acknowledge all the alarms displayed on the window and then
remove them from the table, click Clear/Ack All (F4).
Note
If an alarm is cleared before the condition has been resolved, MON 20/20 redisplays the
alarm entry as an active alarm.
5.1.3 Viewing the alarm log
The Alarm Log records every alarm triggered from the GC. The Alarm
Log window gives you the option of viewing the total list of alarms, or a
date-filtered list.
To view the Alarm Log, select Logs/Reports → Alarms → Alarm Log....
The Alarm Log window displays.
5-4
MON20/20 Software for Gas Chromatographs
SEPTEMBER 2010
User Manual
3-9000-745
Figure 5-2. The Alarm Log window
The Alarm Log window supplies the following data for each alarm:
Name
Description
Date
Indicates the date and time at the GC when the alarm condition began.
Alarm Message
Describes the alarm condition.
Status
Indicates whether the alarm is SET (active) or CLR (inactive).
Type
Indicates whether a high limit or low limit alarm was trigger:
• High means a high limit alarm was triggered.
• Low means a high limit alarm was triggered.
Limit
Indicates the value that was set as the trigger for the alarm.
Value
Indicates the current status value being output by the device.
Unit
If applicable, unit of measurement for the displayed values.
Name
Indicates the name of the variable that triggered the alarm.
User
Indicates which user made the change.
5-5
User Manual
MON20/20 Software for Gas Chromatographs
3-9000-745
SEPTEMBER 2010
Note
Discrete alarms do not display Type, Limit, or Value data.
To view a list of alarms, do the following:
1. To view all alarms, select the All checkbox. Otherwise, select the
Select Range checkbox and use the Start Date and End Date dropdown boxes to select a date range.
2. Click Read Records. The list of alarms display with the most recent
alarm at the top and the oldest alarm at the bottom. The alarms are
also sorted and color-coded by time so that alarms that occurred
simultaneously are grouped together.
Figure 5-3. The Alarm Log window
3. To save the list, click Save. The list can be saved in the following
formats:
• Tab-Delimited (.txt)
5-6
MON20/20 Software for Gas Chromatographs
SEPTEMBER 2010
•
•
•
•
User Manual
3-9000-745
Comma-Delimited (.csv)
Microsoft Excel (.xls)
HTML File (.html)
XML File (.xml)
4. To close the window, click Close.
5.2
Viewing the maintenance log
Use this function to manually record and track maintenance activities
performed on a given GC unit.
To view the maintenance log, select Maintenance Log... from the Log/
Reports menu.
Figure 5-4. The Maintenance Log window
5-7
User Manual
MON20/20 Software for Gas Chromatographs
3-9000-745
SEPTEMBER 2010
5.2.1 Adding an Entry to the Maintenance Log
To add an entry to the maintenance log, do the following:
1. Select Maintenance Log... from the Log/Reports menu. The
Maintenance Log window displays.
Figure 5-5. The Maintenance Log window
2. Click Insert At Top. A new row appears on the maintenance log
table. The Date field contains the GC’s current date and time, and is
editable.
3. Double-click the Message cell and enter the relevant information for
the log entry.
Note
NOTE: To edit an old log entry, click on it and the cell will become editable.
4. To save the changes and keep the window open, click Save. To save
the changes and close the window, click OK.
5-8
MON20/20 Software for Gas Chromatographs
SEPTEMBER 2010
User Manual
3-9000-745
5.2.2 Deleting an entry from the maintenance log
To delete an entry from the maintenance log, do the following:
1. Select Maintenance Log... from the Log/Reports menu. The
Maintenance Log window displays.
Figure 5-6. The Maintenance Log window
2. Select the entry that you want to delete.
3. Click Delete. The entry is removed from the maintenance log.
4. To save the changes and keep the window open, click Save. To save
the changes and close the window, click OK.
5-9
User Manual
MON20/20 Software for Gas Chromatographs
3-9000-745
5.3
SEPTEMBER 2010
Working with the parameter list
Use this feature to keep a record of the hardware components and
associated parameters for a given GC.
The Parameter List is a Microsoft Excel document that can be viewed and
edited from MON 20/20. Before attempting to edit the document, be sure
to review it first to get an idea of what sorts of data it contains.
The Parameter List may contain one or all of the following pages:
• Cover Sheet
• TE Rework
• App Data
• Programming
• Strm Data
• Col Data
• Cal Std Data
5.3.1 Viewing and editing the parameter list
To view and edit the Parameter List, do the following:
1. Select Parameter List... from the Logs/Reports menu. The
Parameter List window displays.
5-10
MON20/20 Software for Gas Chromatographs
SEPTEMBER 2010
User Manual
3-9000-745
Figure 5-7. The Parameter List window
2. Make your changes to the Parameter List.
3. To save the changes and keep the window open, click Save. To save
the changes and close the window, click OK.
5-11
User Manual
MON20/20 Software for Gas Chromatographs
3-9000-745
SEPTEMBER 2010
5.3.2 Importing and exporting the parameter list
The Parameter List is a Microsoft Excel document and is therefore saved
with the .xls extension.
To import a Parameter List, do the following:
1. Select Parameter List... from the Logs/Reports menu. The
Parameter List window displays.
Figure 5-8. The Parameter List window
5-12
MON20/20 Software for Gas Chromatographs
SEPTEMBER 2010
User Manual
3-9000-745
2. Click Import.... The Open dialog displays.
3. Locate and select the Parameter List that you want to import.
4. Click Open and the document will be imported and displayed in the
Parameter List window.
5. To save the changes and keep the window open, click Save. To save
the changes and close the window, click OK. This Parameter List will
now be displayed by default whenever Parameter List... is selected
from the Logs/Reports menu.
To export the Parameter List, do the following:
1. Click Export.... The Save as dialog displays.
2. Navigate to the folder to which you want to save the file.
3. Click Save. The Parameter List will be saved with the .xls extension.
4. To save the changes and keep the window open, click Save. To save
the changes and close the window, click OK. This Parameter List will
now be displayed by default whenever Parameter List... is selected
from the Logs/Reports menu.
5.4
Working with drawings and documents
Use this feature to access GC-related drawings and documents such as
flow diagrams, the GC's sales order, assembly drawings, and electrical
diagrams. These items are stored on the GC in the following formats:
• PDF
• TIFF
• GC Trend file (.xtrd)
• XA CGM file (.xcgm)
• XA Comparison file (.xcpm)
• GC Configuration file (.xcfg)
5-13
User Manual
MON20/20 Software for Gas Chromatographs
3-9000-745
SEPTEMBER 2010
To find out which documents are available on the GC, select Drawings/
Documents... from the Logs/Reports menu. The Drawings/Documents
window displays.
Figure 5-9. The Drawings/Documents window
If the list of available documents does not display under Drawings/
Documents label, click the “+” beside the label.
Note
If no list displays under the Drawings/Documents label, and there is no “+” beside the
label, then this GC does not contain any documents.
5-14
MON20/20 Software for Gas Chromatographs
SEPTEMBER 2010
User Manual
3-9000-745
5.4.1 Viewing drawings or documents
To view a drawing, do the following:
1. Select Drawings/Documents... from the Logs/Reports menu. The
Drawings/Documents window displays.
Figure 5-10. The Drawings/Documents window
2. Select the drawing to view from the drop-down list.
Note
If no list displays under the Drawings/Documents label, and there is no “+” beside the
label, then this GC does not contain any documents.
3. Click File Viewer (F3). The drawing displays.
5-15
User Manual
3-9000-745
MON20/20 Software for Gas Chromatographs
SEPTEMBER 2010
Figure 5-11. The File Viewer
4. Click Close to exit the window and to return to the Drawings/
Documents window.
5-16
MON20/20 Software for Gas Chromatographs
User Manual
SEPTEMBER 2010
3-9000-745
5.4.2 Adding files to the GC
To add files, such as new or updated drawings, to the GC, do the
following:
1. Select Drawings/Documents... from the Logs/Reports menu. The
Drawings/Documents window displays.
Figure 5-12. The Drawings/Documents window
2. Click Add File(s) to GC. The Open dialog displays.
3. Locate and select the file to add to the GC.
4. Click Open. The file will be saved to the GC and the Drawings/
Documents list will be updated.
5-17
User Manual
MON20/20 Software for Gas Chromatographs
3-9000-745
SEPTEMBER 2010
5.4.3 Deleting files from the GC
To delete drawings from the GC, do the following:
1. Select Drawings/Documents... from the Logs/Reports menu. The
Drawings/Documents window displays.
Figure 5-13. The Drawings/Documents window
2. Select the file to delete from the GC.
3. Click Delete File from GC. The Confirm message displays.
4. Click Yes. The file will be deleted from the GC and the Drawings/
Documents list will be updated.
5-18
MON20/20 Software for Gas Chromatographs
SEPTEMBER 2010
5.5
User Manual
3-9000-745
Viewing the event log
Use this function to track the changes that are made to the various tables
within the GC.
To view the Event Log, select Logs/Reports → Event Log.... The Event
Log window displays.
Figure 5-14. The Event Log window
5-19
User Manual
MON20/20 Software for Gas Chromatographs
3-9000-745
SEPTEMBER 2010
The Event Log window gives you the option of viewing the total list of
change events, or a date-filtered list of events. The Event Log window
supplies the following data for each event:
Name
Description
User ID
Indicates which user made the change.
Date
Indicates the date at the GC when the event occurred.
Time
Indicates the time at the GC when the event occurred.
Event Message
Provides a description of the event.
Old Value
If applicable, indicates the value in the cell before the change.
New Value
If applicable, indicates the value in the cell after change.
To view the list of change events, do the following:
1. To view all events, select the All checkbox. Otherwise, select the
Select Range checkbox and use the Start Date and End Date dropdown boxes to select a date range.
2. Click Read Records. The list of events display with the most recent
event at the top and the oldest event at the bottom. The events are
also sorted and color-coded by time so that events that occurred
simultaneously are grouped together.
5-20
MON20/20 Software for Gas Chromatographs
SEPTEMBER 2010
User Manual
3-9000-745
Figure 5-15. The Event Log
3. To save the list, click Save. The list can be saved in the following
formats:
•
•
•
•
•
Tab-Delimited (.txt)
Comma-Delimited (.csv)
Microsoft Excel (.xls)
HTML File (.html)
XML File (.xml)
5-21
User Manual
MON20/20 Software for Gas Chromatographs
3-9000-745
5.6
SEPTEMBER 2010
Displaying reports
This function allows you to immediately display, print, or store
preconfigured reports of GC analysis data. Data is reported in real-time
from the GC or from saved files.
5.6.1 Understanding report types
MON 20/20 can generate the following types of reports:
• Analysis: Displays a list of the components that were detected, based
on raw data. Displays a list of calculations for each component, based
on the table located at Application → Calculations → Control....
See “Setting standard calculations by stream” on page 4-37 for more
information.
There are two types of analysis reports: Analysis (GPA) and Analysis
(ISO). See page 5-25 for an example Analysis (GPA) report. See
page 5-26 for an example Analysis (ISO) report.
• Calibration: Displays a list of the components that were detected,
along with each component’s calibration concentration, raw data
value, new response factor, and new retention time. See page 5-27 for
an example report.
• Final Calibration: The Final Calibration report displays the list of
components along with each component’s old and new response
factors, and each component’s old and new retention times, based on
the averaged data. See page 5-28 for an example report.
• Validation: For the most recent validation cycle, displays the
Nominal Value, Allowed Percent Deviation, and the Measured Value
of each variable in the Validation Data table. See page 5-29 for an
example report.
Note
If the actual deviation is beyond the allowed amount, then the row will be flagged with
an *.
5-22
MON20/20 Software for Gas Chromatographs
SEPTEMBER 2010
User Manual
3-9000-745
• Final Validation: For the most recent validation run, shows the
Nominal Value, Allowed Percent Deviation, and the Average Value of
each variable in the Validation Data table. See page 5-30 for an
example report.
Note
If the actual deviation is beyond the allowed amount, then the row will be flagged with
an *.
• Raw Data: Displays a list of data for each peak that was detected
during the run, including the retention time, peak area, and peak
height. See page 5-31 for an example report.
• Every Run: Displays a configurable list of calculations after each
run. See “Editing average calculations” on page 4-39 for more
information.
• Hourly: Displays a configurable list of average calculations each
hour, beginning at the time set in the Average Calculations window
at Application → Calculations → Averages.... See “Editing
average calculations” on page 4-39 for more information.
• 24 Hour: Displays a configurable list of average calculations each
day, beginning at the time set in the Average Calculations window
at Application → Calculations → Averages.... See “Editing
average calculations” on page 4-39 for more information.
• Weekly: Displays a configurable list of average calculations each
week, beginning on the day set in the Average Calculations window
at Application → Calculations → Averages.... See “Editing
average calculations” on page 4-39 for more information.
• Monthly: Displays a configurable list of average calculations each
month, beginning on the day of the month set in the Average
Calculations window at Application → Calculations →
Averages.... See “Editing average calculations” on page 4-39 for more
information.
• Variable: Displays a configurable list of average calculations every
hour at the time entered in the Hours column in the Average
Calculations window at Application → Calculations →
Averages.... See “Editing average calculations” on page 4-39 for more
information.
5-23
User Manual
MON20/20 Software for Gas Chromatographs
3-9000-745
SEPTEMBER 2010
Each report begins with the following header information:
• Date-Time: The GC’s date and time when the report was generated.
• Analysis Time: The duration, in seconds, of the analysis. Can be
configured at Application → Timed Events.... See “Setting the
cycle and analysis time” on page 4-29 for more information.
• Cycle Time: The duration, in seconds, between two consecutive
analyses. Can be configured at Application → Timed Events....
See “Setting the cycle and analysis time” on page 4-29 for more
information.
• Stream: The stream that was analyzed. Selected as part of the report
generation process. See “Viewing a saved report” on page 5-35 for
more information.
• Mode: Displays the operational status of the detector.
• Cycle Start Time: The date and time that the cycle started.
• Analyzer: Name of the GC that generated the data used for the
report.
• Stream Sequence: The identification and order of the streams that
were analyzed. Can be configured at Applications → Stream
Sequence.... See “Creating a stream sequence for a detector” on
page 4-78 for more information.
5-24
MON20/20 Software for Gas Chromatographs
SEPTEMBER 2010
User Manual
3-9000-745
Figure 5-16. Analysis (GPA) sample report
5-25
User Manual
3-9000-745
Figure 5-17. Analysis (ISO) sample report
5-26
MON20/20 Software for Gas Chromatographs
SEPTEMBER 2010
MON20/20 Software for Gas Chromatographs
SEPTEMBER 2010
User Manual
3-9000-745
Figure 5-18. Calibration sample report
5-27
User Manual
3-9000-745
Figure 5-19. Final Calibration sample report
5-28
MON20/20 Software for Gas Chromatographs
SEPTEMBER 2010
MON20/20 Software for Gas Chromatographs
SEPTEMBER 2010
User Manual
3-9000-745
Figure 5-20. Validation sample report
5-29
User Manual
3-9000-745
Figure 5-21. Final Validation sample report
5-30
MON20/20 Software for Gas Chromatographs
SEPTEMBER 2010
MON20/20 Software for Gas Chromatographs
SEPTEMBER 2010
User Manual
3-9000-745
Figure 5-22. RawData sample report
5-31
User Manual
3-9000-745
MON20/20 Software for Gas Chromatographs
SEPTEMBER 2010
5.6.2 Viewing reports from live data
To view a report created from the most recent data, do the following:
1. Select Report Displays... from the Log/Reports menu. The Report
Display window appears.
Figure 5-23. The Report Display window
Note
By default, the Update automatically checkbox is selected. This means that when
viewing a report based on the most recent data, the report will refresh as new data is
created, based on the type of report that you select.
For example, in the Report Display window, if you select Analysis (GPA), the report
display will refresh each time the GC finishes an analysis of the selected stream.
The refresh function displays the newly generated report and deletes the previous report
(unless already saved to disk).
5-32
MON20/20 Software for Gas Chromatographs
SEPTEMBER 2010
User Manual
3-9000-745
2. Select the type of report to view from the following list:
•
•
•
•
•
•
•
•
•
•
•
•
•
Analysis (GPA)
Analysis (ISO)
Calibration
Final Calibration
Validation
Final Validation
Every Run
Hourly
24 Hour
Weekly
Monthly
Variable
Raw data
3. Select the appropriate stream.
4. Click Start (F2). The report displays.
5-33
User Manual
3-9000-745
MON20/20 Software for Gas Chromatographs
SEPTEMBER 2010
Figure 5-24. The report window
Note
If the report doesn’t appear right away, check the status of the report generation process
in the status bar, which is below the row of buttons on the report window.
5. To change the font size, click Font.. There are five preset font sizes
available. Continue to click Font to cycle through the sizes until you
are satisfied with the report’s readability.
5-34
MON20/20 Software for Gas Chromatographs
SEPTEMBER 2010
User Manual
3-9000-745
6. To save the file, click Save. The report can be saved in the following
file formats:
•
•
•
•
TXT
HTM
HTML
MHT
5.6.3 Viewing a saved report
To view a saved report, do the following:
1. Select Report Displays... from the Log/Reports menu. The Report
Display window appears.
Figure 5-25. The Report Display window
2. Click File Viewer (F3). The Report file viewer window displays.
5-35
User Manual
MON20/20 Software for Gas Chromatographs
3-9000-745
SEPTEMBER 2010
Figure 5-26. The Report file viewer window
3. Click Open. The Open dialog displays.
4. Locate and select the report that you want to view. Reports can be
found in the following file formats:
•
•
•
•
•
TXT
RPT
HTM
HTML
MHT
5. Click Open. The report displays.
6. To change the font size, click Font.. There are five preset font sizes
available. Continue to click Font to cycle through the sizes until you
are satisfied with the report’s readability.
7. To print the report, click Print.
5-36
MON20/20 Software for Gas Chromatographs
User Manual
SEPTEMBER 2010
5.7
3-9000-745
Viewing reports based on archived data
based on archived GC runs.
Use the Archive Report
commands to generate
analysis, calibration,
and average reports
5.7.1 Viewing analysis and calibration reports based on archived data
To generate and view an analysis or calibration report from archived
data, do the following:
1. Select Logs/Reports → Archive Report → Analysis/Calibration/
Validation.... The Analysis/Calibration/Validation Archive Report
window displays.
5-37
User Manual
MON20/20 Software for Gas Chromatographs
3-9000-745
SEPTEMBER 2010
Figure 5-27. The Analysis/Calibration Archive Report window
2. Select a report type from the Report drop-down list. You can choose
from the following report types:
•
•
•
•
•
•
•
Analysis
Calibration
Final Calibration
Validation
Final Validation
Raw Data
Dew Point Calculations (optional)
3. Select a stream from the Stream drop-down list. By default, the
Archive Records table displays all records for the selected report type
and stream.
5-38
MON20/20 Software for Gas Chromatographs
SEPTEMBER 2010
User Manual
3-9000-745
Figure 5-28. The Analysis/Calibration Archive Report window
4. To date-filter the list of records, select the Time Period checkbox and
use the Start Date and End Date drop-down boxes to select a date
range.
5. Select the record(s) that you want to view. To select several records,
hold down CTRL and select each record. To select several records in a
row, select the first record and then hold down SHIFT and select the
last record in the series.
6. Click Start (F2). The report displays. If more than one record was
selected, each report displays after that previous report on the same
page.
5-39
User Manual
3-9000-745
MON20/20 Software for Gas Chromatographs
SEPTEMBER 2010
Figure 5-29. The report window
7. To change the font size, click Font.. There are five preset font sizes
available. Continue to click Font to cycle through the sizes until you
are satisfied with the report’s readability.
8. To print the report, click Print.
5-40
MON20/20 Software for Gas Chromatographs
SEPTEMBER 2010
User Manual
3-9000-745
9. To save the file, click Save. The report can be saved in the following
file formats:
•
•
•
•
TXT
HTM
HTML
MHT
5.7.2 Viewing average reports based on archived data
To generate and view an average report from archived data, do the
following:
1. Select Logs/Reports → Archive Report → Average.... The Average
Archive Report window displays.
5-41
User Manual
MON20/20 Software for Gas Chromatographs
3-9000-745
SEPTEMBER 2010
Figure 5-30. The Analysis/Calibration Archive Report window
2. Select a report type from the Report drop-down list. You can choose
from the following report types:
•
•
•
•
•
•
5-42
Every Run
Hourly
24 Hour
Weekly
Monthly
Variable
MON20/20 Software for Gas Chromatographs
SEPTEMBER 2010
User Manual
3-9000-745
3. Select a stream from the Stream drop-down list. By default, the List
of Averages table displays all records for the selected report type and
stream.
4. To date-filter the list of records, select the Time Period checkbox and
use the Start Date and End Date drop-down boxes to select a date
range.
5. Select the record(s) that you want to view. To select several records,
hold down CTRL and select each record. To select several records in a
row, select the first record and then hold down SHIFT and select the
last record in the series.
6. Click Start (F2). The report displays. If more than one record was
selected, each report displays after that previous report on the same
page.
7. To change the font size, click Font.. There are five preset font sizes
available. Continue to click Font to cycle through the sizes until you
are satisfied with the report’s readability.
8. To print the report, click Print.
9. To save the file, click Save. The report can be saved in the following
file formats:
•
•
•
•
TXT
HTM
HTML
MHT
5-43
User Manual
MON20/20 Software for Gas Chromatographs
3-9000-745
SEPTEMBER 2010
5.7.3 Printing reports automatically
To configure MON 20/20 to print a report of your choosing automatically
based on that report’s schedule of availability, do the following:
1. Select Printer Control... from the Logs/Reports menu. The Printer
Control window displays.
Figure 5-31. The Printer Control window
Note
MON 20/20 must be connected to the GC for the report to be printed.
5-44
MON20/20 Software for Gas Chromatographs
SEPTEMBER 2010
User Manual
3-9000-745
2. The following types of potential reports are listed in the Report Name
column:
• Analysis (GPA) - An analysis report will print after an analysis
run is completed.
Note
If ISO is set in the Calculations Configuration screen, Analysis (ISO) will be listed
under the Report Name column instead of Analysis (GPA); if GPA & ISO is set in the
Calculations Configuration screen, the both Analysis (ISO) and Analysis (GPA) will be
listed under the Report Name column.
• Calibration - An calibration report will print after an calibration
run is completed.
• Final Calibration - An final calibration report will print after a
final calibration run is completed.
• Validation - An validation report will print after an validation
run is completed.
• Final Validation - An final validation report will print after a
final validation run is completed.
• Every Run - A report will be generated each time an Every Run
average calculation is run.
• Hourly: A report will be generated each time an Hourly average
calculation is run.
• 24 Hour: A report will be generated each time a 24 Hour average
calculation is run.
• Weekly: A report will be generated each time a Weekly average
calculation is run.
• Monthly: A report will be generated each time a Monthly average
calculation is run.
• Variable: A report will be generated each time a Variable average
calculation is run.
• Raw Data - Each time raw data is generated, a report will be
printed.
3. To print a report after a run, check the appropriate checkbox from the
Print After Completion? column.
5-45
User Manual
MON20/20 Software for Gas Chromatographs
3-9000-745
SEPTEMBER 2010
4. To print a report at a fixed interval, check the appropriate checkbox
from the Print At Fixed Interval? column.
(a.) Enter a start time in the Start Time column.
(b.) Enter an interval, in hours, in the Interval column.
5. Use the columns numbered 1 through 20 to select the streams that
you want to use for data collection.
6. To save the changes without closing the window, click Save. To save
the changes and close the window, click OK.
5.8
Viewing trend data
This function allows you to view, print, or save graphical representations,
or trend lines, of accumulated analysis data from the GC.
5.8.1 Viewing live trend data
Note
You cannot view a live trend if the corresponding analysis record does not exist in the
GC’s memory.
To view live trend data, do the following:
1. Select Trend Data... from the Logs/Reports menu. The Trend Data
window displays.
5-46
MON20/20 Software for Gas Chromatographs
SEPTEMBER 2010
User Manual
3-9000-745
Figure 5-32. The Trend Data window
2. Click Trend. The Select records for Trending window displays.
5-47
User Manual
MON20/20 Software for Gas Chromatographs
3-9000-745
SEPTEMBER 2010
Figure 5-33. The Select records for Trending window
3. Select the analysis or calibration records that you want to trend from
the Select Analysis/Calibration Records selection menu. Click > to
move your selection to the Selected Records queue.
4. If applicable, select the type of average record that you want to trend
from the Select Average Records section. Click > to move your
selection to the Selected Records queue.
5. To remove a selection from the Selected Records queue, click
Remove. To remove all selections from the Selected Records
queue, click Remove All.
6. Click the All Records checkbox from the Trend Record Selection
section to use all data for the trend report, or click the Time Period
checkbox and select a Start Date and End Date for the data to be used.
5-48
MON20/20 Software for Gas Chromatographs
SEPTEMBER 2010
User Manual
3-9000-745
7. Click Trend. MON 20/20 reads the data from the GC and then closes
the Select records for Trending window and plots the trend data on the
graph section of the Trend Data window.
Figure 5-34. The Trend Data window with graphs
Each trend record is color-coded; use the Trend pull-down menu to
select a specific trend record.
Note
To view the chromatogram that is associated with a particular trend data point, locate
the data point in the table and double-click it while pressing the SHIFT key.
5-49
User Manual
MON20/20 Software for Gas Chromatographs
3-9000-745
SEPTEMBER 2010
5.8.2 Viewing saved trend data
Trend data files are saved with the XTRD file extension. To view a saved
trend file, do the following:
1. Select Trend Data... from the Logs/Reports menu. The Trend Data
window displays.
Figure 5-35. The Trend Data window
2. Click PC File. The Open Trend File window displays.
3. Select the file that you want to view and click Open. The trend graph
displays.
5-50
MON20/20 Software for Gas Chromatographs
SEPTEMBER 2010
User Manual
3-9000-745
Figure 5-36. The Trend Data window
Note
To view the chromatogram that is associated with a particular trend data point, locate
the data point in the table and double-click it while pressing the SHIFT key.
5-51
User Manual
MON20/20 Software for Gas Chromatographs
3-9000-745
5.9
SEPTEMBER 2010
Working with the Trend Graph
Right-clicking with the mouse on the graph brings up the following
commands and keyboard shortcuts:
Command Name
Shortcut
Description
Zoom In
“+” (NUMPAD)
Zooms in on the entire graph.
NOTE: Another way to zoom in is by clicking and dragging
your mouse to select the region of the graph that you want
to zoom in on.
Zoom Out
“-” (NUMPAD)
Zooms out from the entire graph.
Zoom X In
“6” (NUMPAD)
Zooms in on the X axis.
Zoom X Out
“4” (NUMPAD)
Zooms out from the X axis.
Zoom Y In
“8” (NUMPAD)
Zooms in on the Y axis.
Zoom Y Out
“2” (NUMPAD)
Zooms out from the Y axis.
NOTE: When the Selected Data checkbox is selected, the
small table to the right of the graph displays the trend data
for the visible area of the graph when zooming in and out.
Save State
CTRL + HOME
Saves current or archived display settings for the selected
trend graph.
NOTE: The Save State function is available only when
viewing a live or archived trend graph.
Restore State
HOME
Restores the last saved display settings for the selected
trend graph.
NOTE: Pressing HOME returns the user to the saved
state.
Toggle Full Screen
F11
Maximizes the display of the graph in the Trend Data
window.
Cursor to Nearest
Point
F8
Snaps the cursor to the nearest point on the trend graph in
both the X and Y directions.
5-52
MON20/20 Software for Gas Chromatographs
SEPTEMBER 2010
User Manual
3-9000-745
Command Name
Shortcut
Description
Toggle Coarse/Fine
Cursor
F4
Toggles the cursor from coarse and less accurate to fine and
more accurate.
Toggle Lines/Dots
Displays
F9
Toggles the trend graph from lines to dots, or dots to lines.
Toggle Mouse
Position Tip
CTRL + F4
The graph’s cursor follows the movement of the mouse
while a hovering tooltip displays the exact coordinates of
the current point.
Toggle Nearest
Position Tip
CTRL + F9
The graph’s cursor follows the movement of the mouse
cursor.
Print
CTRL + P
Prints the trend graph.
Copy to clipboard
CTRL + C
Copies from the graph the raw detector data that was used
to plot the selected trend graph. This data can be pasted
into another application such as Microsoft Word or
Microsoft Excel.
Paste from clipboard
CTRL + V
Plots a range of points copied from another application such
as Microsoft Word or Microsoft Excel.
5-53
User Manual
MON20/20 Software for Gas Chromatographs
3-9000-745
SEPTEMBER 2010
5.10 Editing the display properties of the graph
5.10.1 The graph bar
Use the graph bar buttons to change the display parameters of the graph.
Figure 5-37. The graph
Y axis
Y Max
Y interval
color-coded
trend graph
Y Min
X axis
X Min
X max
X interval
Click Edit to view or change the display properties of the X and Y axes.
The Edit Graph window displays.
5-54
MON20/20 Software for Gas Chromatographs
SEPTEMBER 2010
User Manual
3-9000-745
Figure 5-38. The Edit Graph window
5-55
User Manual
MON20/20 Software for Gas Chromatographs
3-9000-745
SEPTEMBER 2010
The following table lists the parameters that can be edited:
Command
Description
Point
Sets the X-axis values to points. For the purposes of this graph,
each sample run is considered a data point. Therefore, if 2500
sample runs were used to generate the trend graph, then there are
2500 data points.
Default
Value
0
NOTE: The X-axis value for the first sample, or point, in the trend
graph is 0, not 1. The X-axis value for the final point in the trend
graph is N - 1, where N is the total number of points in the graph.
• X Min - Sets the minimum value for the X axis to the point
number of the first sample you want to use in the plot. Default
value is 0.
• X Max - Sets the maximum value for the X axis to the point
number of the last sample you want to use in the plot. Default
value is N - 1, where N is the total number of points in the graph.
Therefore, if there are 2500 points, then the X Max would be
2499.
Date Time
Sets the X-axis values to the particular GC dates and times of each
sample runs.
• From - Sets the minimum value for the X axis to the date of the
first sample you want to use in the plot.
• To - Sets the maximum value for the X axis to the date of the
last sample you want to use in the plot.
• Date Format - Options are MM-DD-YYYY or DD-MM-YYYY.
N/A
The primary Y axis is the default axis for displaying trend graphs. The
secondary Y axis can be used to display a second graph whose minimum
and maximum values are different than the minimum and maximum
values of the first graph.
5-56
MON20/20 Software for Gas Chromatographs
User Manual
SEPTEMBER 2010
3-9000-745
Figure 5-39. Primary axes
primary Y axis
secondary Y axis
Note
If three or more graphs are displayed, only the second graph will be plotted using the
secondary Y axis; all other graphs will be plotted with the primary Y axis.
Default
Value
Command
Description
Y axis Display
Format
• Percent - Sets the Y-axis values to a percentage of the Y Max
value.
• Value - Sets the Y-axis values to the sample run values.
0
Y Min
Sets the minimum value for the Y axis.
N/A
Y Max
Sets the maximum value for the Y axis.
N/A
Y Intervals
Sets the number of intervals to be displayed on the graph for the Y
axis.
N/A
5-57
User Manual
MON20/20 Software for Gas Chromatographs
3-9000-745
SEPTEMBER 2010
Default
Value
Command
Description
Print Speed
Sets the number of inches per second for the x-axis while printing a
chromatogram, similar to an XY plotter.
N/A
X Intervals
Sets the number of intervals to be displayed on the graph for the X
axis.
10
Display Option
Determines whether the chromatograph is displayed as a solid line
or as a dotted line.
Lines
Show labels
Determines whether each axis is labelled.
Checked
Scroll newest X
Determined whether the graph’s window moves to focus on the
most recent data point along the x axis.
Checked
To accept your changes, click OK.
Click Cursor to toggle the cursor size from coarse movement (less
accurate) to fine movement (more accurate).
Click Print to print the graph window.
5.11 Working with a trend graph
Figure 5-40. The Trend bar
The Trend bar contains a row of buttons that allows you to manipulate a
single trend trace. Below the row of buttons is the trace pull-down menu,
which contains a list of all of the currently displayed traces that make up
the trend graph. Before you can work with a trend trace you must first
select it from the pull-down menu.
5-58
MON20/20 Software for Gas Chromatographs
SEPTEMBER 2010
User Manual
3-9000-745
5.11.1 Editing a trend graph
You can use the Edit window to change the X and Y offset values for a
graph, change its color, and also set which Y axis should be used when
plotting it. These changes may be necessary to make the trend more
distinguishable from those that surround it, or to position a graph in
relation to a different graph for comparison.
To edit a trend trace, do the following:
1. From the Trend pull-down menu, select the graph that you want to
edit.
Figure 5-41. The Trend pull-down menu
2. Click Edit. The Edit Trend dialog displays.
Figure 5-42. The Edit Trend dialog
• X Offset - Enter a positive number to move the trend to the right,
or a negative number to move the trend to the left.
• Y Offset - Enter a positive number to move the trend up, or a
negative number to move the trend down.
• Color - Assigns a color to the trend.
5-59
User Manual
MON20/20 Software for Gas Chromatographs
3-9000-745
SEPTEMBER 2010
• Add Trace to - Sets which Y axis should be used when plotting
the graph. See “The graph bar” on page 5-54 for more information.
3. To accept your changes, click OK.
5.11.2 Entering a description for a trend graph
To add or change description text for a trend graph, do the following:
1. From the Trend bar, click Desc. The Edit Description window
displays.
Figure 5-43. The Edit Description window
2. Type or edit a description and then close the window.
5-60
MON20/20 Software for Gas Chromatographs
SEPTEMBER 2010
User Manual
3-9000-745
5.11.3 Saving a trend trace
To save a trend trace to disk, do the following:
1. From the Trend pull-down menu, select the trace that you want to
save.The Trend pull-down menu.
Figure 5-44. The Trend pull-down menu
2. Click Save. The Save Trend File window displays.
Note
To save all currently displayed trend traces into one file, click Save All.
3. For convenience the file is given an auto-generated file name that
includes the current date and time; however, you can give the file any
name that you choose. Click Save.
5-61
User Manual
MON20/20 Software for Gas Chromatographs
3-9000-745
SEPTEMBER 2010
5.11.4 Removing a trend graph from view
To remove a trend graph from the graph display, do the following:
1. From the Trend pull-down menu, select the graph that you want to
remove.
Figure 5-45. The Trend pull-down menu
2. Click Remove.
5.11.5 Displaying trend data
The data used to plot the trend graphs displays in the table to the right of
the graph display area.
Figure 5-46. Trend data
5-62
MON20/20 Software for Gas Chromatographs
SEPTEMBER 2010
User Manual
3-9000-745
The table contains the following columns:
Label
Description
TRD
Indicates the identifcation number of the trend graph.
Pt #
For the purposes of trend graphs, each sample run is considered a data point. Therefore, if
2500 sample runs were used to generate the trend graph, then there are 2500 data points.
NOTE: The first sample, or point, is counted as 0, not 1. The final point is counted as N - 1,
where N is the total number of points in the graph.
Value
The data point’s value.
Data
The GC’s date when the sample was run and the value was calculated.
Time
The GC’s time when the sample was run and the value was calculated.
Note
To view the chromatogram that is associated with a particular trend data point, locate
the data point in the table and double-click it while pressing the SHIFT key.
To view all trend data, click Cur/All. To view trend data for the trend
graph selected from the Trend drop-down list, click Cur/All again.
The second trend data table is useful when zooming in to or out of the
graph. When the Selected Data checkbox is selected, this table displays
the trend data for the visible area of the graph. As the example shows,
the table indicates that the trend data for five samples are visible after
zooming in to the graph.
5-63
User Manual
MON20/20 Software for Gas Chromatographs
3-9000-745
SEPTEMBER 2010
Figure 5-47. The Trend Data window
The table contains the following columns:
Label
Description
TRD
Indicates the identifcation number of the trend graph.
Average
Indicates the average data point value of the selected samples.
Minimum
Inidicates the lowest data point value of the selected samples.
Maximum
Inidicates the highest data point value of the selected samples.
Samples
Inidicates the number of samples that were selected and that are displayed in the
graph window.
5-64
MON20/20 Software for Gas Chromatographs
SEPTEMBER 2010
User Manual
3-9000-745
5.12 Generating a GC Configuration Report
A GC Config Report displays all current settings for the GC. This section
explains how to produce a GC Config Report and provides an example for
reference.
To generate a GC Config Report, do the following:
1. Select GC Config Report... from the Logs/Reports menu. The GC
Config Report window displays.
Figure 5-48. The GC Config Report window
5-65
User Manual
MON20/20 Software for Gas Chromatographs
3-9000-745
SEPTEMBER 2010
2. Select the checkbox for each option that you want to include in the
report.
Note
To select all the options, click Select All (F2). To clear all options, click Clear All (F3).
3. Select the type of output you want for the report.
Note
When choosing a Printer option, if you want to use a printer different from the one that
you usually use, deselect the Use default printer checkbox and when the report is ready,
the printer configuration window will display.
Note
When choosing the File option, the Save window will display, allowing you to name the
text file and choose a location in which to save it.
4. Click Start (F4). MON 20/20 will generate the customized report and
print or save it, according to the output option you selected.
Note
A GC Config Report that includes all options can take several minutes to generate and
save. Printing a full report can take longer. If you press ESC, MON 20/20 will stop after
the current option is completed.
5-66
MON20/20 Software for Gas Chromatographs
User Manual
SEPTEMBER 2010
3-9000-745
System Report from Model
03/12/2009 12:51:58 PM
Description
[SAMPLE]
Austin
Value
Stream Sequence
1,2,3
Analyzer Name
Austin
GC Model
GC700XA
System Description
Firmware Version
GC Serial Number
Company Name
GC Location
Number of Valves
3
Number of Serial Ports
3
Daylight Saving Time
CGM Analog O/P Cfg.
0
Baseline Offset
Archive Days
0
****************************************
Component Data Table Report from Model
03/12/2009 12:51:59 PM
Austin
Component Data Table #1
Component
C6+ 47/35/17
PROPANE
i-BUTANE
n-BUTANE
NEOPENTANE
i-PENTANE
n-PENTANE
NITROGEN
METHANE
CARBON DIOXIDE
ETHANE
n-NONANE
n-HEXANE
n-HEPTANE
n-OCTANE
Component
C6+ 47/35/17
PROPANE
i-BUTANE
U/S
Det #
Standard
Standard
Standard
Standard
Standard
Standard
Standard
Standard
Standard
Standard
Standard
Standard
Standard
Standard
Standard
Retention
Time (sec)
Response
Factor
38.00
50.16
63.12
70.88
0.00
101.92
113.84
141.68
145.80
178.68
206.20
34.80
105.00
148.08
255.96
891250
4.655095e+07
5.513906e+07
5.610726e+07
0
6.363212e+07
6.487665e+07
3.865339e+07
2.679253e+07
3.795704e+07
4.166654e+07
9.057038e+08
5.647477e+08
7.3743e+08
7.554687e+08
1
1
1
1
1
1
1
1
1
1
1
2
2
2
2
Calibration Con
0.0000%
0.9995%
0.3000%
0.3000%
0.0000%
0.1000%
0.1000%
2.4990%
89.5920%
0.9997%
5.0000%
0.0100%
0.0598%
0.0200%
0.0201%
Analysis
Method
RT Dev.
(sec)
RT Dev.
(%)
Update
Method
Gross BTU
Net Dry BTU
Fixed
Area
Area
3
3
3
0.00
5.00
5.00
Cal
Cal
Cal
5288.7002
2522.0000
3259.5000
4900.6001
2320.3999
3006.8999
5-67
User Manual
MON20/20 Software for Gas Chromatographs
3-9000-745
SEPTEMBER 2010
SAMPLE cont.
n-BUTANE
NEOPENTANE
i-PENTANE
n-PENTANE
NITROGEN
METHANE
CARBON DIOXIDE
ETHANE
n-NONANE
n-HEXANE
n-HEPTANE
n-OCTANE
Component
C6+ 47/35/17
PROPANE
i-BUTANE
n-BUTANE
NEOPENTANE
i-PENTANE
n-PENTANE
NITROGEN
METHANE
CARBON DIOXIDE
ETHANE
n-NONANE
n-HEXANE
n-HEPTANE
n-OCTANE
Component
C6+ 47/35/17
PROPANE
i-BUTANE
n-BUTANE
NEOPENTANE
i-PENTANE
n-PENTANE
NITROGEN
METHANE
CARBON DIOXIDE
ETHANE
n-NONANE
n-HEXANE
5-68
Area
Fixed
Area
Area
Area
Area
Area
Area
Area
Area
Area
Area
3
3
3
3
3
3
4
5
3
3
4
5
5.00
5.00
5.00
5.00
5.00
5.00
5.00
5.00
0.00
0.00
0.00
0.00
Cal
Cal
Cal
Cal
Cal
Cal
Cal
Cal
Cal
Cal
Cal
Cal
3269.8999
3993.8999
4010.2000
4018.0000
0.0000
1012.3000
0.0000
1773.8000
7012.6001
4767.0000
5515.2002
6263.3999
3018.0000
3691.3999
3707.6001
3715.6001
0.0000
911.1000
0.0000
1622.8000
6508.0000
4414.2002
5111.7998
5809.3999
Molecular
Weight
AGA 8
Component
Reid
Vapor
Relative
Density Gas
Relative
Density Lqd
95.956
44.096
58.122
58.122
72.150
72.149
72.149
28.013
16.042
44.010
30.069
128.260
86.175
100.200
114.230
C6mix1
PROPANE
i-BUTANE
n-BUTANE
i-PENTANE
i-PENTANE
n-PENTANE
NITROGEN
METHANE
CO2
ETHANE
n-NONANE
n-HEXANE
n-HEPTANE
n-OCTANE
3.020
188.690
72.484
51.683
35.900
20.456
15.558
0.000
5000.000
0.000
800.000
0.170
4.961
1.620
0.537
3.3135
1.5227
2.0071
2.0071
2.4911
2.4914
2.4914
0.9673
0.5540
1.5197
1.0383
4.4289
2.9758
3.4601
3.9445
0.6800
0.5074
0.5630
0.5841
0.5967
0.6246
0.6311
0.8069
0.3000
0.8220
0.3564
0.7219
0.6640
0.6882
0.7070
HV Sup
MJ/m3
HV Inf
MJ/m3
HV Sup
MJ/kg
HV Inf
MJ/kg
Relative
Response Factor
196.980
93.936
121.400
121.790
148.760
149.360
149.660
0.000
37.707
0.000
66.067
261.190
177.550
182.520
86.419
112.010
112.400
137.490
138.090
138.380
0.000
33.949
0.000
60.429
242.400
164.400
48.558
50.370
49.389
49.547
48.750
48.950
49.046
0.000
55.576
0.000
51.952
48.153
48.717
44.989
46.340
45.568
45.726
45.060
45.255
45.350
0.000
50.037
0.000
47.518
44.689
45.108
0.0
0.0
0.0
0.0
0.0
0.0
0.0
0.0
0.0
0.0
0.0
0.0
0.0
MON20/20 Software for Gas Chromatographs
User Manual
SEPTEMBER 2010
3-9000-745
SAMPLE cont.
n-HEPTANE
n-OCTANE
205.420
233.290
Component
Reference
Component
C6+ 47/35/17
PROPANE
i-BUTANE
n-BUTANE
NEOPENTANE
i-PENTANE
n-PENTANE
NITROGEN
METHANE
CARBON DIOXIDE
ETHANE
n-NONANE
n-HEXANE
n-HEPTANE
n-OCTANE
190.390
216.370
48.474
48.289
MultiLevel
Calib 'a'
44.927
44.788
MultiLevel
Calib 'b'
0.0
0.0
MultiLevel
Calib 'c'
MultiLevel
Calib 'd'
none
none
none
none
none
none
none
none
none
none
none
none
none
none
none
Component Data Table #2
Component
C6+ 47/35/17
PROPANE
i-BUTANE
n-BUTANE
NEOPENTANE
i-PENTANE
n-PENTANE
NITROGEN
METHANE
CARBON DIOXIDE
ETHANE
H2S
Component
C6+ 47/35/17
PROPANE
i-BUTANE
n-BUTANE
NEOPENTANE
i-PENTANE
U/S
Det #
Standard
Standard
Standard
Standard
Standard
Standard
Standard
Standard
Standard
Standard
Standard
Standard
Retention
Time (sec)
Response
Factor
Calibration Con
26.50
46.90
57.40
64.30
70.10
89.40
99.90
143.40
147.00
179.50
208.60
300.10
7697800
4322000
4993200
5085100
5673100
5683100
5731600
3080000
2362600
3568900
4078100
0
0.0204
0.4995
0.1012
0.1007
0.0503
0.0499
0.0503
0.5984
97.1310
0.3991
0.9992
0.0000
1
1
1
1
1
1
1
1
1
1
1
1
Analysis
Method
RT Dev.
(sec)
RT Dev.
(%)
Update
Method
Gross BTU
Net Dry BTU
area
area
area
area
area
area
0
0
0
0
0
0
5.00
5.00
5.00
5.00
5.00
5.00
Cal
Cal
Cal
Cal
Cal
Cal
5288.7100
2522.0200
3259.5000
3269.9500
3993.8999
4010.1599
4900.6201
2320.3601
3006.8999
3017.9700
3691.3999
3707.5601
5-69
User Manual
MON20/20 Software for Gas Chromatographs
3-9000-745
SEPTEMBER 2010
SAMPLE cont.
n-PENTANE
NITROGEN
METHANE
CARBON DIOXIDE
ETHANE
H2S
Component
C6+ 47/35/17
PROPANE
i-BUTANE
n-BUTANE
NEOPENTANE
i-PENTANE
n-PENTANE
NITROGEN
METHANE
CARBON DIOXIDE
ETHANE
H2S
Component
C6+ 47/35/17
PROPANE
i-BUTANE
n-BUTANE
NEOPENTANE
i-PENTANE
n-PENTANE
NITROGEN
METHANE
CARBON DIOXIDE
ETHANE
H2S
Component
C6+ 47/35/17
PROPANE
i-BUTANE
n-BUTANE
5-70
area
area
area
area
area
area
0
0
0
0
0
0
5.00
5.00
5.00
5.00
5.00
0.00
Cal
Cal
Cal
Cal
Cal
Cal
4017.9700
0.0000
1012.3400
0.0000
1773.8000
638.5800
3715.5801
0.0000
911.1030
0.0000
1622.7500
588.1600
Molecular
Weight
AGA 8
Component
Reid
Vapor
Relative
Density Gas
Relative
Density Lqd
95.956
44.096
58.122
58.122
72.150
72.149
72.149
28.013
16.042
44.010
30.069
34.082
C6mix1
PROPANE
i-BUTANE
n-BUTANE
i-PENTANE
i-PENTANE
n-PENTANE
NITROGEN
METHANE
CO2
ETHANE
H2S
3.020
188.690
72.484
51.683
35.900
20.456
15.558
0.000
5000.000
0.000
800.000
395.550
3.3135
1.5227
2.0071
2.0071
2.4911
2.4914
2.4914
0.9673
0.5540
1.5197
1.0383
1.1769
0.6800
0.5074
0.5630
0.5841
0.5967
0.6246
0.6311
0.8069
0.3000
0.8220
0.3564
0.8027
HV Sup
MJ/m3
HV Inf
MJ/m3
HV Sup
MJ/kg
HV Inf
MJ/kg
Relative
Response Factor
196.980
93.936
121.400
121.790
148.760
149.360
149.660
0.000
37.707
0.000
66.067
23.785
182.520
86.419
112.010
112.400
137.490
138.090
138.380
0.000
33.949
0.000
60.429
21.910
48.558
50.370
49.389
49.547
48.750
48.950
49.046
0.000
55.576
0.000
51.952
16.501
44.989
46.340
45.568
45.726
45.060
45.255
45.350
0.000
50.037
0.000
47.518
15.200
0.0
0.0
0.0
0.0
0.0
0.0
0.0
0.0
0.0
0.0
0.0
0.0
Reference
Component
none
none
none
none
MultiLevel
Calib 'a'
MultiLevel
Calib 'b'
MultiLevel
Calib 'c'
MultiLevel
Calib 'd'
MON20/20 Software for Gas Chromatographs
User Manual
SEPTEMBER 2010
3-9000-745
SAMPLE cont.
NEOPENTANE
i-PENTANE
n-PENTANE
NITROGEN
METHANE
CARBON DIOXIDE
ETHANE
H2S
none
none
none
none
none
none
none
none
Component Data Table #3
Component Data Table #4
**************************************************************************************
Timed Event Table Report from Model
03/12/2009 12:52:01 PM
Timed Event Table #1 Hardware TEV table 1
TEV Type
Valve/ DO #
Austin
State
Time
(Sec)
SSO_1
SSO_2
DualColumn
S/BF_1
S/BF_2
On
On
On
On
On
SSO_1
SSO_2
S/BF_1
S/BF_2
DualColumn
DualColumn
Off
Off
Off
Off
Off
On
0.0
1.0
2.0
5.0
6.0
11.0
15.0
16.0
26.5
28.0
43.5
132.5
Software TEV table 1
TEV Type
Value
Det #
Valve #
Valve #
Valve #
Valve #
Valve #
Strm Sw
Valve #
Valve #
Valve #
Valve #
Valve #
Valve #
Inhibit
Inhibit
Peak Width
Slope Sens
On
On
6
24
2
1
2
2
Time
(Sec)
0.0
0.0
0.0
0.0
5-71
User Manual
MON20/20 Software for Gas Chromatographs
3-9000-745
SEPTEMBER 2010
SAMPLE cont.
Slope Sens
Peak Width
Inhibit
Inhibit
Inhibit
Inhibit
Inhibit
Inhibit
Summation
Inhibit
Inhibit
Summation
Inhibit
Peak Width
Slope Sens
Inhibit
Inhibit
Inhibit
Peak Width
Inhibit
Peak Width
Slope Sens
Inhibit
Inhibit
Inhibit
48
4
Off
Off
On
On
Off
Off
On
On
Off
Off
On
2
16
Off
On
On
8
Off
8
48
Off
On
On
1
1
2
1
2
1
1
2
2
1
1
2
1
1
1
1
2
1
2
2
1
1
1
1
2
3.0
4.0
31.3
33.0
38.5
43.5
48.0
72.5
72.6
85.0
87.0
105.0
133.0
134.0
134.5
137.5
170.0
170.0
170.5
171.0
171.0
171.5
172.0
290.0
291.0
State
Time
(Sec)
SSO_1
SSO_2
DualColumn
S/BF_1
S/BF_2
On
On
On
Off
Off
S/BF_2
S/BF_1
SSO_1
SSO_2
DualColumn
DualColumn
Off
Off
Off
Off
Off
On
0.0
0.0
2.0
5.0
6.0
11.0
24.5
25.5
40.0
40.0
45.0
157.0
Gain TEV table 1
Det #
Gain
1
2
Time
(Sec)
4
4
0.0
0.0
Timed Event Table #2 Hardware TEV table 2
TEV Type
Valve/ DO #
Valve #
Valve #
Valve #
Valve #
Valve #
Strm Sw
Valve #
Valve #
Valve #
Valve #
Valve #
Valve #
5-72
MON20/20 Software for Gas Chromatographs
User Manual
SEPTEMBER 2010
3-9000-745
SAMPLE cont.
Software TEV table 2
TEV Type
Value
Det #
Time
(Sec)
1
2
1
2
1
2
1
2
0.0
0.0
0.0
0.0
0.1
0.1
285.0
285.0
State
Time
(Sec)
SSO_1
SSO_2
DualColumn
S/BF_1
S/BF_2
On
On
On
On
On
SSO_1
SSO_2
S/BF_1
S/BF_2
DualColumn
DualColumn
On
On
On
On
Off
On
0.0
1.0
2.0
5.0
6.0
11.0
15.0
16.0
26.5
28.0
42.5
133.0
Software TEV table 3
TEV Type
Value
Det #
Inhibit
Inhibit
Peak Width
Peak Width
Inhibit
Inhibit
Inhibit
Inhibit
On
On
2
2
Off
Off
On
On
Gain TEV table 2
Det #
Gain
1
2
Time
(Sec)
12
12
0.0
0.0
Timed Event Table #3 Hardware TEV table 3
TEV Type
Valve/ DO #
Valve #
Valve #
Valve #
Valve #
Valve #
Strm Sw
Valve #
Valve #
Valve #
Valve #
Valve #
Valve #
Inhibit
Inhibit
Slope Sens
Peak Width
Slope Sens
Peak Width
On
On
48
2
48
2
1
2
1
1
2
2
Time
(Sec)
0.0
0.0
3.0
3.5
4.0
4.5
5-73
User Manual
MON20/20 Software for Gas Chromatographs
3-9000-745
SEPTEMBER 2010
SAMPLE cont.
Inhibit
Inhibit
Inhibit
Inhibit
Inhibit
Inhibit
Inhibit
Inhibit
Inhibit
Inhibit
Inhibit
Inhibit
Inhibit
Inhibit
Off
Off
On
On
Off
On
Off
Off
On
On
On
On
Off
On
Gain TEV table 3
Det #
Gain
1
2
4
4
1
2
1
2
1
1
1
2
2
1
1
1
1
1
5.0
5.5
13.0
13.5
25.0
27.0
28.0
28.3
31.5
34.0
45.0
48.0
133.2
141.5
Time
(Sec)
0.0
0.0
Timed Event Table #4 Hardware TEV table 4
Software TEV table 4
Gain TEV table 4
*************************************************
Calculation Control Report from Model
03/12/2009 12:52:02 PM
Description
Average Limit Alarm Test
Mole Percent
Liquid Volume
Weight Percent
Normalize Results
Gas Density
Real Rel Den Gas Prim
Wobbe Index Sup Sec
Z Fact Prim
Dry Gross Heating
Sat Gross Heating
Wobbe Index Sup Prim
Wobbe Index Inf Sec
Gallons/1000 SCF C2+
Gallons/1000 SCF C3+
Gallons/1000 SCF C4+
Gallons/1000 SCF C5+
Gallons/1000 SCF C6+
Avg Mol Wt
5-74
1
N
Y
Y
Y
N
N
Y
Y
Y
Y
Y
Y
Y
Y
Y
Y
Y
Y
Y
2
Y
Y
Y
Y
Y
N
Y
Y
Y
Y
Y
Y
Y
Y
Y
Y
Y
Y
Y
3
N
N
N
N
N
N
N
N
N
N
N
N
N
N
N
N
N
N
N
Austin
4
N
N
N
N
N
N
N
N
N
N
N
N
N
N
N
N
N
N
N
5
N
Y
N
N
Y
N
N
N
N
N
N
N
N
N
N
N
N
N
N
6
N
Y
N
N
Y
N
N
N
N
N
N
N
N
N
N
N
N
N
N
7
N
Y
N
N
Y
N
N
N
N
N
N
N
N
N
N
N
N
N
N
8
N
Y
N
N
Y
N
N
N
N
N
N
N
N
N
N
N
N
N
N
MON20/20 Software for Gas Chromatographs
User Manual
SEPTEMBER 2010
3-9000-745
SAMPLE cont.
Sup Calorific Val Dry Prim
N
N
N
N
N
N
N
N
Sup Calorific Val Sat Prim
N
N
N
N
N
N
N
N
Inf Calorific Val Dry Prim
N
N
N
N
N
N
N
N
Inf Calorific Val Sat Prim
N
N
N
N
N
N
N
N
Sup Calorific Val Dry Sec
N
N
N
N
N
N
N
N
Sup Calorific Val Sat Sec
N
N
N
N
N
N
N
N
Inf Calorific Val Dry Sec
N
N
N
N
N
N
N
N
Inf Calorific Val Sat Sec
N
N
N
N
N
N
N
N
Wobbe Index Inf Prim
N
N
N
N
N
N
N
N
Real Rel Den Gas Sec
N
N
N
N
N
N
N
N
Gas Den Kg/m3
N
N
N
N
N
N
N
N
**********************************************************
Calculation Average Report from Model
03/12/2009 12:52:02 PM
Austin
Average Label
Variable Name
Average
Average
Average
Average
Average
Average
1-C9 Cal Gas.Gross Dry BTU
Heaters.Temperature.Heater 1
Heaters.Temperature.Heater 2
Heaters.Temperature.Heater 3
1-C9 Cal Gas Component.Peak Area.METHANE
1-C9 Cal Gas Component.Peak Height.METHANE
001
002
003
004
005
006
Average Label
Average Type
Average
Average
Average
Average
Average
Average
Everyrun
Everyrun
Everyrun
Everyrun
Everyrun
Everyrun
001
002
003
004
005
006
Hours
Restart Time
(hh:mm)
Weekday
Day
****************************************************************************
Calculation User-Defined Report from Model
03/12/2009 12:52:03 PM
Label
Austin
Comment
User Cal 01
5-75
User Manual
MON20/20 Software for Gas Chromatographs
3-9000-745
SEPTEMBER 2010
SAMPLE cont.
Label
Cal Freq.
User Cal 01
User Defined
Start Time
(mm-dd-yyyy hh:mm:ss)
Interval
(sec)
01-01-1970 00:00:00
5
*************************************************************************
Limit Alarms Report from Model
03/12/2009 12:52:04 PM
Austin
System Alarm Table Label
Alarm
Alarm
Alarm
Alarm
Alarm
Alarm
Alarm
Alarm
Alarm
Alarm
Alarm
Alarm
Alarm
Alarm
Alarm
Alarm
Alarm
Alarm
Alarm
Alarm
Alarm
Alarm
Alarm
Alarm
Alarm
Alarm
Alarm
Alarm
Alarm
Alarm
Alarm
Alarm
Alarm
Alarm
Alarm
Alarm
5-76
Variable
001
002
003
004
005
006
007
008
009
010
011
012
013
014
015
016
017
018
019
020
021
022
023
024
025
026
027
028
029
030
031
032
033
034
035
036
Electronic Pressure Control.Status.EPC1
Electronic Pressure Control.Status.EPC2
Electronic Pressure Control.Status.EPC3
Electronic Pressure Control.Status.EPC4
Electronic Pressure Control.Status.EPC5
Valves.Status.S/BF_1
Valves.Status.DualColumn
Valves.Status.S/BF_2
Valves.Status.SSO_1
Valves.Status.SSO_2
Valves.Status.Stream 1
Valves.Status.Stream 2
Valves.Status.Stream 3
Valves.Status.Stream 4
Valves.Status.unused 1
Valves.Status.unused 2
Valves.Status.unused 3
Heaters.Status.Heater 1
Heaters.Status.Heater 2
Heaters.Status.Heater 3
Heaters.Status.Heater 4
Detectors.Status.TCD 1
Detectors.Status.TCD 2
Detectors.Scaling Factor.TCD 1
Detectors.Scaling Factor.TCD 2
Streams.Status.1-C9 Cal Gas
Streams.Status.2-C6 Chamber
Streams.Status.Stream 3
Streams.Status.Stream 4
Streams.Status.Stream 5
Streams.Status.Stream 6
Streams.Status.Stream 7
Streams.Status.Stream 8
GC Status.Status
GC Status.Warmup Status
GC Status.Is Last Calibration Run Invalid
MON20/20 Software for Gas Chromatographs
User Manual
SEPTEMBER 2010
3-9000-745
SAMPLE cont.
Alarm
Alarm
Alarm
Alarm
Alarm
Alarm
Alarm
Alarm
Alarm
037
038
039
040
041
042
043
044
045
Label
Alarm
Alarm
Alarm
Alarm
Alarm
Alarm
Alarm
Alarm
Alarm
Alarm
Alarm
Alarm
Alarm
Alarm
Alarm
Alarm
Alarm
Alarm
Alarm
Alarm
Alarm
Alarm
Alarm
Alarm
Alarm
Alarm
Alarm
Alarm
Alarm
Alarm
Alarm
Alarm
Alarm
Alarm
Alarm
Alarm
Alarm
1-C9 Cal Gas Final Calib.RF Dev Alarm
2-C6 Chamber Final Calib.RF Dev Alarm
Stream 3 Final Calib.RF Dev Alarm
Stream 4 Final Calib.RF Dev Alarm
Stream 5 Final Calib.RF Dev Alarm
Stream 6 Final Calib.RF Dev Alarm
Stream 7 Final Calib.RF Dev Alarm
Stream 8 Final Calib.RF Dev Alarm
System Status.Is User Calculation Failed
Type
001
002
003
004
005
006
007
008
009
010
011
012
013
014
015
016
017
018
019
020
021
022
023
024
025
026
027
028
029
030
031
032
033
034
035
036
037
High
High
High
High
High
High
High
High
High
High
High
High
High
High
High
High
High
High
High
High
High
High
High
High
High
High
High
High
High
High
High
High
High
High
High
High
High
Low Limit
High Limit
DO# to Set
3
3
3
3
3
3
3
3
3
3
3
3
3
3
3
3
3
3
3
3
3
4
4
12.19999981
12.19999981
1
1
1
1
1
1
1
1
1
1
2
1
5-77
User Manual
MON20/20 Software for Gas Chromatographs
3-9000-745
SEPTEMBER 2010
SAMPLE cont.
Alarm
Alarm
Alarm
Alarm
Alarm
Alarm
Alarm
Alarm
Label
038
039
040
041
042
043
044
045
High
High
High
High
High
High
High
High
Inhibit
Calcs
1
1
1
1
1
1
1
1
Inhibit
Average
Inhibit
Alarm Text
User Alarm
Text
Alarm 001
False
False
False __MSG_SWITCH__{3:Config Error}{4:Out of
Control}{5:Internal Error}
Alarm 002
False
False
False __MSG_SWITCH__{3:Config Error}{4:Out of
Control}{5:Internal Error}
Alarm 003
False
False
False __MSG_SWITCH__{3:Config Error}{4:Out of
Control}{5:Internal Error}
Alarm 004
False
False
False __MSG_SWITCH__{3:Config Error}{4:Out of
Control}{5:Internal Error}
Alarm 005
False
False
False __MSG_SWITCH__{3:Config Error}{4:Out of
Control}{5:Internal Error}
Alarm 006
False
False
False __MSG_SWITCH__{3:Intrnl Err}{4:HAL Open
Failed}{5:HAL Close Failed}{6:HAL Intrnl Err}{7:Protocol Err}{8:Device Intrnl Err}{9:Unkn
own Device}{10:Under/Over Current}{11:Time Out}
Alarm 007
False
False
False __MSG_SWITCH__{3:Intrnl Err}{4:HAL Open
Failed}{5:HAL Close Failed}{6:HAL Intrnl Err}{7:Protocol Err}{8:Device Intrnl Err}{9:Unkn
own Device}{10:Under/Over Current}{11:Time Out}
Alarm 008
False
False
False __MSG_SWITCH__{3:Intrnl Err}{4:HAL Open
Failed}{5:HAL Close Failed}{6:HAL Intrnl Err}{7:Protocol Err}{8:Device Intrnl Err}{9:Unkn
own Device}{10:Under/Over Current}{11:Time Out}
Alarm 009
False
False
False __MSG_SWITCH__{3:Intrnl Err}{4:HAL Open
Failed}{5:HAL Close Failed}{6:HAL Intrnl Err}{7:Protocol Err}{8:Device Intrnl Err}{9:Unkn
own Device}{10:Under/Over Current}{11:Time Out}
Alarm 010
False
False
False __MSG_SWITCH__{3:Intrnl Err}{4:HAL Open
Failed}{5:HAL Close Failed}{6:HAL Intrnl Err}{7:Protocol Err}{8:Device Intrnl Err}{9:Unkn
own Device}{10:Under/Over Current}{11:Time Out}
Alarm 011
False
False
False __MSG_SWITCH__{3:Intrnl Err}{4:HAL Open
Failed}{5:HAL Close Failed}{6:HAL Intrnl Err}{7:Protocol Err}{8:Device Intrnl Err}{9:Unkn
own Device}{10:Under/Over Current}{11:Time Out}
Alarm 012
False
False
False __MSG_SWITCH__{3:Intrnl Err}{4:HAL Open
Failed}{5:HAL Close Failed}{6:HAL Intrnl Err}{7:Protocol Err}{8:Device Intrnl Err}{9:Unkn
own Device}{10:Under/Over Current}{11:Time Out}
Alarm 013
False
False
False __MSG_SWITCH__{3:Intrnl Err}{4:HAL Open
Failed}{5:HAL Close Failed}{6:HAL Intrnl Err}{7:Protocol Err}{8:Device Intrnl Err}{9:Unkn
own Device}{10:Under/Over Current}{11:Time Out}
Alarm 014
False
False
False __MSG_SWITCH__{3:Intrnl Err}{4:HAL Open
Failed}{5:HAL Close Failed}{6:HAL Intrnl Err}{7:Protocol Err}{8:Device Intrnl Err}{9:Unkn
own Device}{10:Under/Over Current}{11:Time Out}
5-78
MON20/20 Software for Gas Chromatographs
SEPTEMBER 2010
User Manual
3-9000-745
SAMPLE cont.
Alarm 015
False
False
False __MSG_SWITCH__{3:Intrnl Err}{4:HAL Open
Failed}{5:HAL Close Failed}{6:HAL Intrnl Err}{7:Protocol Err}{8:Device Intrnl Err}{9:Unkn
own Device}{10:Under/Over Current}{11:Time Out}
Alarm 016
False
False
False __MSG_SWITCH__{3:Intrnl Err}{4:HAL Open
Failed}{5:HAL Close Failed}{6:HAL Intrnl Err}{7:Protocol Err}{8:Device Intrnl Err}{9:Unkn
own Device}{10:Under/Over Current}{11:Time Out}
Alarm 017
False
False
False __MSG_SWITCH__{3:Intrnl Err}{4:HAL Open
Failed}{5:HAL Close Failed}{6:HAL Intrnl Err}{7:Protocol Err}{8:Device Intrnl Err}{9:Unkn
own Device}{10:Under/Over Current}{11:Time Out}
Alarm 018
False
False
False __MSG_SWITCH__{3:Out of Range}{4:Intern
al Error}
Alarm 019
False
False
False __MSG_SWITCH__{3:Out of Range}{4:Intern
al Error}
Alarm 020
False
False
False __MSG_SWITCH__{3:Out of Range}{4:Intern
al Error}
Alarm 021
False
False
False __MSG_SWITCH__{3:Out of Range}{4:Intern
al Error}
Alarm 022
False
False
False
Internal Error
Alarm 023
False
False
False
Internal Error
Alarm 024
False
False
False
Out Of Limit
Alarm 025
False
False
False
Out Of Limit
Alarm 026
False
False
False
Stream Skipped
Alarm 027
False
False
False
Stream Skipped
Alarm 028
False
False
False
Stream Skipped
Alarm 029
False
False
False
Stream Skipped
Alarm 030
False
False
False
Stream Skipped
Alarm 031
False
False
False
Stream Skipped
Alarm 032
False
False
False
Stream Skipped
Alarm 033
False
False
False
Stream Skipped
Alarm 034
False
False
False __MSG_SWITCH__{1:Stream Sequence Table
Is Empty}{2:Undefined Stream Sequence}{3:Invalid Stream Sequence/Stream Not Configured}{4:
Stream Sequence is empty}{5:Invalid Stream Number}
Alarm 035
False
False
False __MSG_SWITCH__{0:Success}{1:Failure}
Alarm 036
False
False
False Missing Peak/Component During Calibration
Alarm 037
False
False
False Response Factor is Out of Limit
Alarm 038
False
False
False Response Factor is Out of Limit
Alarm 039
False
False
False Response Factor is Out of Limit
Alarm 040
False
False
False Response Factor is Out of Limit
Alarm 041
False
False
False Response Factor is Out of Limit
Alarm 042
False
False
False Response Factor is Out of Limit
Alarm 043
False
False
False Response Factor is Out of Limit
Alarm 044
False
False
False Response Factor is Out of Limit
Alarm 045
False
False
False User calculation failed
5-79
User Manual
MON20/20 Software for Gas Chromatographs
3-9000-745
SEPTEMBER 2010
SAMPLE cont.
User Alarm Table -
***************************************************************************************
Streams Report from Model
03/12/2009 12:52:06 PM
Austin
Name
Use
Det #
CDT
Table
TEV
Table
Total
Run
Avg
Run
Start Time
(mm-dd-yyyy hh:mm:ss)
Cal
Cal
Unused
Unused
Unused
Unused
Unused
Unused
1,2
1,2
1
1
1
1
1
1
CDT_1
CDT_1
TEV_1
TEV_1
1
1
1
1
01-01-1970 00:00:01
01-01-1970 00:00:01
1-C9 Cal Gas
2-C6 Chamber
Stream 3
Stream 4
Stream 5
Stream 6
Stream 7
Stream 8
Name
Interval
(hour)
Auto
Calib
Auto
Baseline
1-C9 Cal Gas
2-C6 Chamber
1
1
False
False
False
False
Name
Optional Base
Pressure 1 (PSI)
1-C9 Cal Gas
2-C6 Chamber
Base Conditions
Base Pressure
Base Temparature
(PSI)
(Deg. F)
14.73
14.73
Optional Base Pressures
Optional Base
Pressure 2 (PSI)
0.00
0.00
60
60
Optional Base
Pressure 3 (PSI)
0.00
0.00
0.00
0.00
**************************************************************************************
Analog Input Report from Model
03/12/2009 12:52:06 PM
Label
Analog Input 1
Analog Input 2
Austin
Zero Scale
Full Scale
Switch
mA/Volts
0
0
1
1
Variable
Variable
mA
mA
Fixed
Value
**************************************************************************************
5-80
MON20/20 Software for Gas Chromatographs
User Manual
SEPTEMBER 2010
3-9000-745
SAMPLE cont.
Analog Output Report from Model
03/12/2009 12:52:07 PM
Label
Analog
Analog
Analog
Analog
Analog
Analog
Analog
Analog
Analog
Analog
Variable
Output
Output
Output
Output
Output
Output
Output
Output
Output
Output
1
2
3
4
5
6
7
8
9
10
Label
Analog
Analog
Analog
Analog
Analog
Analog
Analog
Analog
Analog
Analog
Austin
Switch
Output
Output
Output
Output
Output
Output
Output
Output
Output
Output
1
2
3
4
5
6
7
8
9
10
Fixed Value
Zero Scale
Variable
Variable
Variable
Variable
Variable
Variable
Variable
Variable
Variable
Variable
Full Scale
0
0
0
0
0
0
0
0
0
0
0
0
0
0
0
0
100
100
100
100
***************************************************************************************
Discrete Input Report from Model
03/12/2009 12:52:07 PM
Label
Discrete
Discrete
Discrete
Discrete
Discrete
Discrete
Discrete
Discrete
Discrete
Discrete
Discrete
Discrete
Discrete
Input
Input
Input
Input
Input
Input
Input
Input
Input
Input
Input
Input
Input
1
2
3
4
5
1
2
3
4
5
11
12
13
Austin
Switch
Invert Polarity
Auto
Auto
Auto
Auto
Auto
Auto
Auto
Auto
Auto
Auto
Auto
Auto
Auto
False
False
False
False
False
False
False
False
False
False
False
False
False
5-81
User Manual
MON20/20 Software for Gas Chromatographs
3-9000-745
SEPTEMBER 2010
SAMPLE cont.
Discrete Input 14
Discrete Input 15
Auto
Auto
False
False
******************************************************
Discrete Output Report from Model
03/12/2009 12:52:08 PM
Label
Discrete
Discrete
Discrete
Discrete
Discrete
Discrete
Discrete
Discrete
Discrete
Discrete
Discrete
Discrete
Discrete
Discrete
Discrete
Output
Output
Output
Output
Output
Output
Output
Output
Output
Output
Output
Output
Output
Output
Output
1
2
3
4
5
6
7
8
9
10
11
12
13
14
15
Austin
Switch
Invert
Polarity
Auto
Auto
Auto
Auto
Auto
Auto
Auto
Auto
Auto
Auto
Auto
Auto
Auto
Auto
Auto
False
False
False
False
False
False
False
False
False
False
False
False
False
False
False
Start Time
(mm-dd-yyyy hh:mm:ss)
01-01-1970
01-01-1970
01-01-1970
01-01-1970
01-01-1970
01-01-1970
01-01-1970
01-01-1970
01-01-1970
01-01-1970
01-01-1970
01-01-1970
01-01-1970
01-01-1970
01-01-1970
01:23:20
00:00:00
00:00:00
00:00:00
00:00:00
00:00:00
00:00:00
00:00:00
00:00:00
00:00:00
00:00:00
00:00:00
00:00:00
00:00:00
00:00:00
Duration
(hh:mm:ss)
Interval
(hour)
02:02:59
00:00:00
00:00:00
00:00:00
00:00:00
00:00:00
00:00:00
00:00:00
00:00:00
00:00:00
00:00:00
00:00:00
00:00:00
00:00:00
00:00:00
1
1
1
1
1
1
1
1
1
1
1
1
1
1
1
**************************************************************************************
Valve Report from Model
03/12/2009 12:52:08 PM
Label
S/BF_1
DualColumn
S/BF_2
SSO_1
SSO_2
Stream 1
Stream 2
Stream 3
Stream 4
unused 1
unused 2
unused 3
Austin
Switch
Usage
Invert Polarity
Auto
Auto
Auto
Auto
Auto
Auto
Auto
Auto
Auto
Off
Off
Off
analyzr01
analyzr02
analyzr03
analyzr04
analyzr05
stream 1
stream 2
stream 3
stream 4
unused
unused
unused
False
False
False
False
False
False
False
False
False
False
False
False
*************************************************************
5-82
MON20/20 Software for Gas Chromatographs
User Manual
SEPTEMBER 2010
3-9000-745
SAMPLE cont.
Serial Port Report from Model
03/12/2009 12:52:09 PM
Austin
Label
Physical Name
First
PORT C
Label
Port Type
First
Slave
ModBus
ID
Unit System
MAP File
32
U.S. Customary
UsrMap.txt
Port Address
Port Available
Available
Label
Baud
Rate
Data
Bits
Stop
Bit
Parity
HW Flow Ctrl
Timeout
(sec)
First
38400
8
1
None
Disable
0
Label
RTS ON Delay
(msec)
RTS OFF Delay
(msec)
Port Resp Delay
(msec)
First
0
0
0
File Name
Date
Version
Author
Type
Comment
:
:
:
:
:
:
Name
Range
SCALED_FP1
SCALED_FP2
SCALED_FP3
SCALED_FP4
SCALED_FP5
SCALED_FP6
SCALED_FP7
SCALED_FP8
SCALED_FP9
SCALED_FP10
UsrMap
8/4/2008
1.0
daniel
User_Modbus
Comment
Zero Scale
Full Scale
0.000000
0.000000
0.000000
0.000000
0.000000
0.000000
0.000000
0.000000
0.000000
0.000000
0.000000
65535.000000
100.000000
1.000000
2.000000
5.000000
10.000000
20.000000
30.000000
40.000000
50.000000
60.000000
5-83
User Manual
MON20/20 Software for Gas Chromatographs
3-9000-745
SEPTEMBER 2010
SAMPLE cont.
SCALED_FP11
SCALED_FP12
SCALED_FP13
SCALED_FP14
SCALED_FP15
SCALED_FP16
SCALED_FP17
SCALED_FP18
SCALED_FP19
SCALED_FP20
SCALED_FP21
SCALED_FP22
SCALED_FP23
SCALED_FP24
SCALED_FP25
SCALED_FP26
SCALED_FP27
SCALED_FP28
SCALED_FP29
SCALED_FP30
SCALED_FP31
SCALED_FP32
0.000000
0.000000
0.000000
0.000000
0.000000
0.000000
0.000000
0.000000
0.000000
0.000000
0.000000
0.000000
0.000000
0.000000
0.000000
0.000000
0.000000
0.000000
0.000000
0.000000
0.000000
0.000000
70.000000
80.000000
90.000000
120.000000
200.000000
300.000000
400.000000
600.000000
700.000000
800.000000
900.000000
1000.000000
2000.000000
3000.000000
4000.000000
5000.000000
6000.000000
7000.000000
8000.000000
9000.000000
10000.000000
20000.000000
Register
Variable
3001
3003
3005
3007
3009
3011
3013
3015
3017
3019
3021
3023
3025
3027
3029
3031
3033
3035
3037
3039
3041
3043
3045
3047
3049
3051
3053
1-C9 Cal Gas Component.Mole %.PROPANE
1-C9 Cal Gas Component.Mole %.i-BUTANE
1-C9 Cal Gas Component.Mole %.n-BUTANE
1-C9 Cal Gas Component.Mole %.NEOPENTANE
1-C9 Cal Gas Component.Mole %.i-PENTANE
1-C9 Cal Gas Component.Mole %.n-PENTANE
1-C9 Cal Gas Component.Mole %.NITROGEN
1-C9 Cal Gas Component.Mole %.METHANE
1-C9 Cal Gas Component.Mole %.CARBON DIOXIDE
1-C9 Cal Gas Component.Mole %.ETHANE
1-C9 Cal Gas Component.Mole %.n-NONANE
1-C9 Cal Gas Component.Mole %.n-HEXANE
1-C9 Cal Gas Component.Mole %.n-HEPTANE
1-C9 Cal Gas Component.Mole %.n-OCTANE
1-C9 Cal Gas Component.Mole %.H2S
Heaters.Temperature.Heater 1
Heaters.Temperature.Heater 2
Heaters.Temperature.Heater 3
Electronic Pressure Control.Current Pressure.EPC1
Electronic Pressure Control.Current Pressure.EPC2
Heaters.Setpoint.Heater 4
1-C9 Cal Gas Component.Ret Time.PROPANE
1-C9 Cal Gas Component.Ret Time.i-BUTANE
1-C9 Cal Gas Component.Ret Time.n-BUTANE
1-C9 Cal Gas Component.Ret Time.NEOPENTANE
1-C9 Cal Gas Component.Ret Time.i-PENTANE
1-C9 Cal Gas Component.Ret Time.n-PENTANE
5-84
MON20/20 Software for Gas Chromatographs
User Manual
SEPTEMBER 2010
3-9000-745
SAMPLE cont.
3055
3057
3059
3061
3063
3065
3067
3069
3071
3073
3075
3077
3079
3081
3083
3085
3087
3089
3091
3093
3095
3097
3099
3101
3103
3105
3107
3109
3111
3113
3115
3117
3119
3121
3123
3125
1-C9
1-C9
1-C9
1-C9
1-C9
1-C9
1-C9
1-C9
1-C9
1-C9
1-C9
1-C9
2-C6
1-C9
1-C9
1-C9
1-C9
1-C9
2-C6
2-C6
1-C9
1-C9
1-C9
1-C9
1-C9
1-C9
1-C9
1-C9
1-C9
1-C9
1-C9
1-C9
1-C9
1-C9
1-C9
1-C9
Cal Gas Component.Ret Time.NITROGEN
Cal Gas Component.Ret Time.METHANE
Cal Gas Component.Ret Time.CARBON DIOXIDE
Cal Gas Component.Ret Time.ETHANE
Cal Gas Component.Ret Time.n-NONANE
Cal Gas Component.Ret Time.n-HEXANE
Cal Gas Component.Ret Time.n-HEPTANE
Cal Gas Component.Ret Time.n-OCTANE
Cal Gas Component.Ret Time.H2S
Cal Gas.Base Press
Cal Gas.Tot Gross BTU
Cal Gas.Gross Dry BTU
Chamber.Gross Sat BTU
Cal Gas.Act Gross BTU
Cal Gas.Net Dry BTU
Cal Gas.Tot Net BTU
Cal Gas.Net Sat BTU
Cal Gas.Act Net BTU
Chamber.Tot Liq Vol
Chamber.Gal/1000 SCF C2+
Cal Gas.Gal/1000 SCF C3+
Cal Gas.Gal/1000 SCF C4+
Cal Gas.Gal/1000 SCF C5+
Cal Gas.Gal/1000 SCF C6+
Cal Gas.Tot Sup MJ/m3
Cal Gas.Sup Dry MJ/m3
Cal Gas.Tot Inf MJ/m3
Cal Gas.Inf Dry Corr MJ/kg
Cal Gas.Sup Dry Corr MJ/kg
Cal Gas.Inf Dry MJ/kg
Cal Gas.Cycle Time
Cal Gas.Analysis Time
Cal Gas.Wobbe Index
Cal Gas.Real Rel Den Gas
Cal Gas.Unnormalized Mole %
Cal Gas.Z factor
Register
Data Type
Access
3001
3003
3005
3007
3009
3011
3013
3015
3017
3019
3021
3023
FLOAT
FLOAT
FLOAT
FLOAT
FLOAT
FLOAT
FLOAT
FLOAT
FLOAT
FLOAT
FLOAT
FLOAT
RD_ONLY
RD_ONLY
RD_ONLY
RD_ONLY
RD_ONLY
RD_ONLY
RD_ONLY
RD_ONLY
RD_ONLY
RD_ONLY
RD_ONLY
RD_ONLY
Zero Scale
Full Scale
5-85
User Manual
3-9000-745
MON20/20 Software for Gas Chromatographs
SEPTEMBER 2010
SAMPLE cont.
3025
FLOAT
RD_ONLY
3027
FLOAT
RD_ONLY
3029
FLOAT
RD_ONLY
3031
FLOAT
RD_ONLY
3033
FLOAT
RD_ONLY
3035
FLOAT
RD_ONLY
3037
FLOAT
RD_ONLY
3039
FLOAT
RD_ONLY
3041
FLOAT
RD_WR
3043
FLOAT
RD_ONLY
3045
FLOAT
RD_ONLY
3047
FLOAT
RD_ONLY
3049
FLOAT
RD_ONLY
3051
FLOAT
RD_ONLY
3053
FLOAT
RD_ONLY
3055
FLOAT
RD_ONLY
3057
FLOAT
RD_ONLY
3059
FLOAT
RD_ONLY
3061
FLOAT
RD_ONLY
3063
FLOAT
RD_ONLY
3065
FLOAT
RD_ONLY
3067
FLOAT
RD_ONLY
3069
FLOAT
RD_ONLY
3071
FLOAT
RD_ONLY
3073
FLOAT
RD_ONLY
3075
FLOAT
RD_ONLY
3077
FLOAT
RD_ONLY
3079
FLOAT
RD_ONLY
3081
FLOAT
RD_ONLY
3083
FLOAT
RD_ONLY
3085
FLOAT
RD_ONLY
3087
FLOAT
RD_ONLY
3089
FLOAT
RD_ONLY
3091
FLOAT
RD_ONLY
3093
FLOAT
RD_ONLY
3095
FLOAT
RD_ONLY
3097
FLOAT
RD_ONLY
3099
FLOAT
RD_ONLY
3101
FLOAT
RD_ONLY
3103
FLOAT
RD_ONLY
3105
FLOAT
RD_ONLY
3107
FLOAT
RD_ONLY
3109
FLOAT
RD_ONLY
3111
FLOAT
RD_ONLY
3113
FLOAT
RD_ONLY
3115
FLOAT
RD_ONLY
3117
FLOAT
RD_ONLY
3119
FLOAT
RD_ONLY
3121
FLOAT
RD_ONLY
3123
FLOAT
RD_ONLY
3125
FLOAT
RD_ONLY
***************************************************************************************
5-86
MON20/20 Software for Gas Chromatographs
User Manual
SEPTEMBER 2010
3-9000-745
SAMPLE cont.
Report from Model Austin
03/12/2009 12:52:10 PM
Report Name
Report Type
Analysis
Calibration
Final Calibration
Raw Data
Every Run
Hourly
24 Hour
Weekly
Monthly
Variable
Analysis
Calibration
Final Calibration
Raw Data
Everyrun Average
Hourly Average
Daily Average
Weekly Average
Monthly Average
Variable Average
Report Name
Report Template
Analysis
Calibration
Final Calibration
Raw Data
Every Run
Hourly
24 Hour
Weekly
Monthly
Variable
/home/Daniel/ReportTemplates/Default_AnalysisReport.xml
/home/Daniel/ReportTemplates/CalibrationReport.xml
/home/Daniel/ReportTemplates/FinalCalibrationReport.xml
/home/Daniel/ReportTemplates/RawDataAvgReport.xml
/home/Daniel/ReportTemplates/EveryrunAvgReport.xml
/home/Daniel/ReportTemplates/HourlyAvgReport.xml
/home/Daniel/ReportTemplates/DailyAvgReport.xml
/home/Daniel/ReportTemplates/WeeklyAvgReport.xml
/home/Daniel/ReportTemplates/MonthlyAvgReport.xml
/home/Daniel/ReportTemplates/VariableAvgReport.xml
**************************************************************************************
5-87
User Manual
MON20/20 Software for Gas Chromatographs
3-9000-745
SEPTEMBER 2010
5.13 Deleting archived data from the gas chromatograph
To delete archived data and reset the GC memory, do the following:
1. Select Reset Archive Data... from the Logs/Reports menu. The
Reset Archive Data window displays.
Figure 5-49. The Reset Archive Data window
2. Select the types of data that you want to delete.
Note
To select all the options, click Select All. To clear all options, click Deselect All.
3. Click Reset. MON 20/20 displays a confirmation dialog.
5-88
MON20/20 Software for Gas Chromatographs
SEPTEMBER 2010
User Manual
3-9000-745
4. Click Yes. MON 20/20 clears the GC’s memory. New archived records
will begin accumulating again as analysis and calibration runs occur.
5.14 The molecular weight vs. response factor graph
The Molecular Weight Vs. Response Factor window, which can be useful
in checking valve function, displays a graph that consists of the following
information:
• Log (Molecular Weight) vs. Log (Response Factor) scatter plot graph
showing the actual measured values for the following "normal"
alkanes:
-
Methane (C1)
Ethane (C2)
Propane (C3)
Butane (C4)
Pentane (C5)
• A trend line (best fit straight line);
Note
The ideal trend line would be linear.
• R-squared correlation coefficient.
Note
The closer RSq is to 1, the better.
5-89
User Manual
MON20/20 Software for Gas Chromatographs
3-9000-745
SEPTEMBER 2010
Figure 5-50. Molecular Weight vs. Response Factor window
This graph is only available for calibration streams, which can be selected
from the Stream drop-down list. By default, the newest final calibration
data is used to generate the graph, but any archived final calibration file
can be used by selecting it from the Final Calibration Record drop-down
list.
To print the graph, click Print.
5-90
MON20/20 Software for Gas Chromatographs
SEPTEMBER 2010
User Manual
3-9000-745
This page is intentionally left blank.
5-91
User Manual
3-9000-745
5-92
MON20/20 Software for Gas Chromatographs
SEPTEMBER 2010
Section 6: Controlling Analyses
The options in the Control pull-down menu allow
you to manage analysis runs as well as calibration,
validation and baseline runs. Control menu
commands also allow you to stop an analysis run
immediately or at the end of the run.
6.1
Halting an analysis
Before a new analysis run can be initiated, the current analysis must be
stopped. To stop the current analysis at the end of its cycle, do the
following:
1. There are three ways to halt an analysis run:
• Select Halt... from the Control menu.
• Press F3.
• Click
on the Toolbar.
If you running in a mode that uses two detectors, MON 20/20 displays
a selector window.
Figure 6-1. The selector window
2. Choose the appropriate detector. A confirmation message displays.
6-1
User Manual
3-9000-745
MON20/20 Software for Gas Chromatographs
SEPTEMBER 2010
Figure 6-2. Confirmation message
3. Click Yes and the analysis will stop at the end of the current cycle.
Use the Mode column on the GC Status Bar to monitor the status of
the operation. When the analysis has halted, the Mode value will be
“Idle”.
Figure 6-3. The GC Status Bar
6.2
Auto sequencing
Use this function to start continuous GC analysis runs that follow a
predefined stream sequence. See “Creating a stream sequence for a
detector” on page 4-78 for detailed instructions on configuring the
predefined sequence.
Note
If an analysis run is in progress, it must be stopped before auto sequencing can be
started. See “Stopping an Analysis Run” on page 6-9 for more information.
6-2
MON20/20 Software for Gas Chromatographs
SEPTEMBER 2010
User Manual
3-9000-745
To initiate auto-sequencing, do the following:
1. There are three ways of initiating auto sequencing:
• Select Auto Sequence... from the Control menu.
• Press F2.
• Click
on the Toolbar.
A confirmation message displays.
Figure 6-4. Confirmation message
2. Check the Purge stream for 60 seconds check box to set the purging
option. The checkbox is selected by default.
Note
Purging allows sample gas to flow through the sample loop for 60 seconds prior to
beginning the first analysis.
3. Click Yes and auto sequencing starts. Use the Mode column on the
GC Status Bar to monitor the status of the analysis run.
Figure 6-5. The GC Status Bar
6-3
User Manual
MON20/20 Software for Gas Chromatographs
3-9000-745
SEPTEMBER 2010
Note
To view the results of the Auto Sequence run, select Report Display from the Logs/
Reports menu.
6.3
Analyzing a single stream
Note
If an analysis run is in progress, it must be stopped before auto sequencing can be
started. See “Stopping an Analysis Run” on page 6-9 for more information.
To start an analysis run on a single calibration or sample stream, do the
following:
1. Select Single Stream... from the Control menu. A confirmation
message displays.
Figure 6-6. Confirmation message
2. Select a stream from the Stream menu.
3. Check the Purge stream for 60 seconds check box to set the purging
option. The checkbox is selected by default.
6-4
MON20/20 Software for Gas Chromatographs
SEPTEMBER 2010
User Manual
3-9000-745
Note
Purging allows sample gas to flow through the sample loop for 60 seconds prior to
beginning the first analysis.
4. Check the Continuous operation check box to set or unset repetitive
analysis. The checkbox is selected by default.
5. Click OK and the analysis starts. Use the Mode column on the GC
Status Bar to monitor the status of the analysis run.
Figure 6-7. The GC Status Bar
Note
To view the results of the Auto Sequence run, select Report Display from the Logs/
Reports menu.
6.4
Calibrating the gas chromatograph
Calibration runs are determined by the CDT and Streams settings. See
“Managing Component Data Tables” on page 4-5 and “Creating a stream
sequence for a detector” on page 4-78 for detailed instructions on how to
edit these settings.
To calibrate a GC, do the following:
1. Select Calibration... from the Control menu. The Start Calibration
window displays.
6-5
User Manual
MON20/20 Software for Gas Chromatographs
3-9000-745
SEPTEMBER 2010
Figure 6-8. The Start Calibration window
Note
If the GC is in Auto Sequence mode, calibration will not start until two or more analysis
runs have been completed. This delay is required to complete the current analysis and
the analysis of the stream currently purging through the valve.
2. Select a stream from the Stream menu.
3. Check the Purge stream for 60 seconds check box to set the purging
option. The checkbox is selected by default.
Note
Purging allows sample gas to flow through the sample loop for 60 seconds prior to
beginning the first analysis.
4. Select the desired calibration type.
(a.) Select Normal to perform a manual calibration in which the CDT
for the selected stream(s) will be updated with calibration data
unless the data is outside the acceptable deviations, as listed on the
CDT. For more information, see “Managing Component Data
Tables” on page 4-5.
6-6
MON20/20 Software for Gas Chromatographs
SEPTEMBER 2010
User Manual
3-9000-745
(b.) Select Forced to perform a manual calibration in which the CDT
for the selected stream(s) will be updated with calibration data
even if that data is outside the acceptable deviations, as listed on
the CDT. For more information, see “Managing Component Data
Tables” on page 4-5.
5. Click OK and the calibration starts. Use the Mode column on the GC
Status Bar to monitor the status of the operation.
Figure 6-9. The GC Status Bar
Note
To view the results of the Auto Sequence run, select Report Display from the Logs/
Reports menu.
6.5
Validating the Gas Chromatograph
During a validation run, the GC performs a test analysis to verify that it
is working properly. The test analysis is performed on a gas whose
component concentrations are already known; if the GC’s results deviate
significantly from the predetermined data, an alarm is generated.
Validation runs are determined by the validation data table and streams
settings. See “Managing Validation Data Tables” on page 4-35 and
“Creating a stream sequence for a detector” on page 4-78 for detailed
instructions on how to edit these settings.
To validate the GC, do the following:
1. Select Validation... from the Control menu. The Start Validation
window displays.
6-7
User Manual
MON20/20 Software for Gas Chromatographs
3-9000-745
SEPTEMBER 2010
Figure 6-10. The Start Validation window
Note
If the GC is in Auto Sequence mode, validation will not start until two or more analysis
runs have been completed. This delay is required to complete the current analysis and
the analysis of the stream currently purging through the valve.
2. Check the Purge stream for 60 seconds check box to set the purging
option. The checkbox is selected by default.
Note
Purging allows sample gas to flow through the sample loop for 60 seconds prior to
beginning the first analysis.
3. Click OK and the validation starts. Use the Mode column on the GC
Status Bar to monitor the status of the operation.
Figure 6-11. The GC Status Bar
6-8
MON20/20 Software for Gas Chromatographs
SEPTEMBER 2010
6.6
User Manual
3-9000-745
Stopping an Analysis Run
Note
This function forces the system into Idle mode. If Stop Now is performed while an
analysis is in progress, the components may continue to elute from the columns during.
No analysis data will be generated.
Do not perform a Stop Now unless absolutely necessary. Whenever possible, use the
Halt function.
To immediately stop an analysis run, do the following:
1. Select Stop Now... from the Control menu. A confirmation message
displays.
Figure 6-12. Confirmation message
2. Click Yes and the current analysis stops.
6-9
User Manual
MON20/20 Software for Gas Chromatographs
3-9000-745
SEPTEMBER 2010
This page is intentionally left blank.
6-10
Section 7: Using MON 20/20 Tools
The options in the Tools pull-down menu allow you
to do the following:
•Use the Modbus Test program to confirm that
data is being accurately relayed from the gas
chromatograph to the PC.
•Manage users.
•Adjust the sensitivity of the LOI keys.
•Install upgrades to the GC.
7.1
Using the Modbus Test program
Use the Modbus program to poll the GC’s Modbus registers (or registers
from another device) to confirm that data is accurately relayed from the
gas chromatograph to the PC. Then, as necessary, assign data types to
the returned data. See “Assigning scale ranges to User_Modbus
registers” on page 7-15 for more information. You can save all settings to
a file for future reference.
You can use this program to facilitate software debugging or for special
installations. With this program, you can troubleshoot any device that
employs registers including the GC, an ultrasonic meter, or a flow
computer.
CAUTION
NOT REQIURED FOR NORMAL GC OPERATION
The Modbus Test is reserved for advanced functions. The Modbus Test function is not
required for normal GC operation. Skip this section unless you are developing software,
engaging in a software debugging process, or designing a custom installation that
directly accesses the GC Controller Modbus registers.
Traditionally, Modbus registers are polled by using a data collection
system (DCS). To facilitate installation and debugging, the Modbus
program emulates a DCS.
7-1
User Manual
MON20/20 Software for Gas Chromatographs
3-9000-745
SEPTEMBER 2010
This section provides detailed instructions for using the Modbus program.
Use this program only if you are familiar with Modbus communication
protocol and the operation of MON 20/20.
7.1.1 Comparing Modbus protocols
MON 20/20 and the Modbus program can accommodate two different
Modbus protocols: SIM_2251 and User_Modbus. Separate Modbus
registers are reserved for each protocol; therefore, some settings for MON
20/20 and WinMB depend on which Modbus protocol is used.
The protocol you need depends, ultimately, on the hardware used for data
acquisition from the GC Modbus register contents.
The following comparison should help clarify the differences between the
two protocols as well as the utility of each.
Table 7-1. Comparing SIM_2251 and User_Modbus Protocols
SIM_2251
User_Modbus
Serial slave port
Serial slave port
Modified protocol that allows floating point
numbers to be transmitted over Modbus via 2251
emulation slave type
Standard Gould protocol that accommodates PLC
Emulation LO-HI (PLC-LH)
Most register contents are predefined; some
registers can be user-defined
Predefined Boolean (coils)
User-defined Numeric (registers)
Data types are predefined for registers 1000 to
9000
Data types are user-defined
Variables assigned to registers can be listed in the
GC Config Report. For instructions and an
example report, see Section 5.12. See Appendix C
for more detail about individual registers.
Variables assigned to registers can be listed in the
GC Config Report. For instructions and an
example report, see Section 5.12. See Appendix C
for more detail about individual registers.
When using the Modbus program, set Register
Mode to “DANIEL” to view register contents.
When using the Modbus program, set Register
Mode to “PLC- LH” or “PLC-HL” to view register
contents.
It is not necessary to assign scales to registers.
It may be necessary to assign scales to registers, to
convert floating point values to whole integer
representations.
7-2
MON20/20 Software for Gas Chromatographs
SEPTEMBER 2010
User Manual
3-9000-745
7.1.2 Setting communication parameters
To determine or reset the communications parameters used by the
Modbus program, do the following:
1. Select Modbus Test... from the Tools menu. The Modbus Test
Program window displays. The current port settings display in the
window’s title bar.
Figure 7-1. The Modbus Test Program window with current port setting in title bar
Note
If MON 20/20 displays an error message, verify the installation directory via the
Program Settings window (see Section 1.2.5).
7-3
User Manual
MON20/20 Software for Gas Chromatographs
3-9000-745
SEPTEMBER 2010
2. Click Port Setup. The Port Setup window appears.
Figure 7-2. The Port Setup window
3. Make the appropriate configuration changes. The following table lists
the typical setting for each parameter:
7-4
Parameter
Typical Setting
Port
COM1 or COM2
Baud Rate
9600
Data Bits
7 or 8
Parity
Even or None
Stop Bits
1
Flow Control
None
Read Timeout
500 ms
Try
2
Register Mode
Daniel (SIM_2251)
PLC-LH (User_Modbus)
MON20/20 Software for Gas Chromatographs
SEPTEMBER 2010
User Manual
3-9000-745
Parameter
Typical Setting
Protocol
ASCII Modbus
RTU Modbus
Note
For a direct connection to the GC, ensure that the port setting is the same as the Com ID
number of the serial port used.
4. Click OK.
7.1.3 Getting Modbus Data
To read or write register contents to the GC, or any other device, do the
following:
Note
Before retrieving data, print a GC Config Report (see Section 5.12) and review the
Communication section to learn the variable names that are assigned to the Modbus
registers.
Note
Modbus registers assigned to alarms are application-specific.
1. In the Slave Addr field, type the COM ID of the GC. The Modbus
program will accept a slave address value of 1 to 247.
To use Broadcast Mode, which directs the Modbus program to poll all
known devices, enter 0 in the Slave Addr field. Each device interprets
this poll attempt as an instruction to read and take action; however, a
response message may not be received by the Modbus program.
Note
Changes are applied to the corresponding register value at each device.
7-5
User Manual
MON20/20 Software for Gas Chromatographs
3-9000-745
SEPTEMBER 2010
2. Select the desired read or write option from the Function pull down
menu.
Function Code
Description
1 (Read Coil)
Reads one or more coil values.
2 (Read Input Status)
Reads one or more input status values.
3 (Read Multiple Regs)
Reads one or more register values.
4 (Read Input Regs)
Reads one or more input register values.
5 (Set Single Coil)
set (write) one coil value
6 (Set Single Reg)
set (write) one register value
15 (Set Multiple Coils)
set (write) multiple coil values
16 (Set Multiple Regs)
set (write) multiple register values
Broadcast
3. Type the starting register value in the Data Addr field.
Note
The data type is set automatically by the Modbus program, based on the specified data
address.
4. In the Quantity field, type the number of registers to be retrieved. The
Modbus program will accept a quantity value of 1 to 2016. The
requested number of registers cannot exceed the amount contained by
the selected message block but you can retrieve a partial block. You
cannot cross a message block boundary.
Also, in Standard Modbus mode each register is 16 bits. Therefore,
integers (SHORT) consist of 1 register while floats (FLOAT) and long
integers (LONG) consist of 2 registers.
Note
Boolean registers are not user-defined (for either SIM_2251 or User_Modbus) and
primarily contain alarm flags useful for debugging. To view the contents of Boolean
registers, select the 1 (Read Coil) function code.
Numeric registers for User_Modbus can be user-defined. To view the contents of
Numeric registers, select the 3 (Read Regs) function code.
7-6
MON20/20 Software for Gas Chromatographs
SEPTEMBER 2010
User Manual
3-9000-745
5. Type the desired repeat count, which is the number of times the
Modbus program should read or set the specified registers before
ceasing transmission, in the Repeat field. The Modbus program will
accept a repeat value of 1 to 9999. A value of –1 produces an infinite
polling loop that can be terminated by clicking Stop.
7.1.4 Transmitting using a single data type
To assign a data type to a group of registers you will read or edit, do the
following:
Note
Before retrieving data, print a GC Config Report (see Section 5.12) and review the
Communication section to learn the variable names that are assigned to the Modbus
registers.
1. In the Slave Addr field, type the COM ID of the GC. The Modbus
program will accept a slave address value of 1 to 247.
To use Broadcast Mode, which directs the Modbus program to poll all
known devices, enter 0 in the Slave Addr field. Each device interprets
this poll attempt as an instruction to read and take action; however, a
response message may not be received by the Modbus program.
Note
Changes are applied to the corresponding register value at each device.
7-7
User Manual
MON20/20 Software for Gas Chromatographs
3-9000-745
SEPTEMBER 2010
2. Select the desired read or write option from the Function pull down
menu.
Function Code
Description
1 (Read Coil)
Reads one or more coil values.
2 (Read Input Status)
Reads one or more input status values.
3 (Read Multiple Regs)
Reads one or more register values.
4 (Read Input Regs)
Reads one or more input register values.
5 (Set Single Coil)
set (write) one coil value
6 (Set Single Reg)
set (write) one register value
15 (Set Multiple Coils)
set (write) multiple coil values
16 (Set Multiple Regs)
set (write) multiple register values
Broadcast
3. Type the starting register value in the Data Addr field.
Note
The data type is set automatically by the Modbus program, based on the specified data
address.
4. In the Quantity field, type the number of registers to be retrieved. The
Modbus program will accept a quantity value of 1 to 2016. The
requested number of registers cannot exceed the amount contained by
the selected message block but you can retrieve a partial block. You
cannot cross a message block boundary.
Also, in Standard Modbus mode each register is 16 bits. Therefore,
integers (SHORT) consist of 1 register while floats (FLOAT) and long
integers (LONG) consist of 2 registers.
Note
Boolean registers are not user-defined (for either SIM_2251 or User_Modbus) and
primarily contain alarm flags useful for debugging. To view the contents of Boolean
registers, select the 1 (Read Coil) function code.
Numeric registers for User_Modbus can be user-defined. To view the contents of
Numeric registers, select the 3 (Read Regs) function code.
7-8
MON20/20 Software for Gas Chromatographs
User Manual
SEPTEMBER 2010
3-9000-745
5. Type the desired repeat count, which is the number of times the
Modbus program should read or set the specified registers before
ceasing transmission, in the Repeat field. The Modbus program will
accept a repeat value of 1 to 9999. A value of –1 produces an infinite
polling loop that can be terminated by clicking Stop.
6. Select the Use <data type> to decode registers check box.
7. Select a data type from the pull-down menu. The following table lists
the default data types for each block of SIM_2251 registers.
Register Range
Default Type
1000 – 2999
Boolean
3000 – 4999
Integer
5000 – 6900
Long
7000 – 8999
Float
Note
To ensure the best data type assignments, review a GC Config Report.
8. Click Transmit to retrieve the selected registers (i.e., the specified
data addresses) from the GC. The transmitted/received packet data
displays in the Packet Input-Output window.
9. Click Stop to end the transmission of the data and to return to the
Modbus Function Selection options.
7-9
User Manual
MON20/20 Software for Gas Chromatographs
3-9000-745
SEPTEMBER 2010
7.1.5 Transmitting using a template
Templates are best used when decoding mixed data types because the
template contains data that the Modbus program can use to determine
which data type should be assigned to which register.
To create a new template or to use an existing template, do the following:
Note
Before retrieving data, print a GC Config Report (see Section 5.12) and review the
Communication section to learn the variable names that are assigned to the Modbus
registers.
1. In the Slave Addr field, type the COM ID of the GC. The Modbus
program will accept a slave address value of 1 to 247.
To use Broadcast Mode, which directs the Modbus program to poll all
known devices, enter 0 in the Slave Addr field. Each device interprets
this poll attempt as an instruction to read and take action; however, a
response message may not be received by the Modbus program.
Note
Changes are applied to the corresponding register value at each device.
2. Select the desired read or write option from the Function pull down
menu.
7-10
Function Code
Description
1 (Read Coil)
Reads one or more coil values.
2 (Read Input Status)
Reads one or more input status values.
3 (Read Multiple Regs)
Reads one or more register values.
4 (Read Input Regs)
Reads one or more input register values.
5 (Set Single Coil)
set (write) one coil value
6 (Set Single Reg)
set (write) one register value
15 (Set Multiple Coils)
set (write) multiple coil values
16 (Set Multiple Regs)
set (write) multiple register values
Broadcast
MON20/20 Software for Gas Chromatographs
SEPTEMBER 2010
User Manual
3-9000-745
3. Type the starting register value in the Data Addr field.
Note
The data type is set automatically by the Modbus program, based on the specified data
address.
4. In the Quantity field, type the number of registers to be retrieved. The
Modbus program will accept a quantity value of 1 to 2016. The
requested number of registers cannot exceed the amount contained by
the selected message block but you can retrieve a partial block. You
cannot cross a message block boundary.
Also, in Standard Modbus mode each register is 16 bits. Therefore,
integers (SHORT) consist of 1 register while floats (FLOAT) and long
integers (LONG) consist of 2 registers.
Note
Boolean registers are not user-defined (for either SIM_2251 or User_Modbus) and
primarily contain alarm flags useful for debugging. To view the contents of Boolean
registers, select the 1 (Read Coil) function code.
Numeric registers for User_Modbus can be user-defined. To view the contents of
Numeric registers, select the 3 (Read Regs) function code.
5. Type the desired repeat count, which is the number of times the
Modbus program should read or set the specified registers before
ceasing transmission, in the Repeat field. The Modbus program will
accept a repeat value of 1 to 9999. A value of –1 produces an infinite
polling loop that can be terminated by clicking Stop.
6. Depending on your intent, select Use template to decode registers or
Use template to decode logs. The Record No field becomes active.
7. Enter the desired record number in the Record No field. To verify
which record number should be entered, consult the Modbus
specifications for your device. For more information on GC Modbus
registers, see Appendix C.
7-11
User Manual
MON20/20 Software for Gas Chromatographs
3-9000-745
SEPTEMBER 2010
The following table describes the relationship between templates and
record numbers:
Data Type Setting
Other Setting(s)
Result
Register template
• Enter Data Addr value.
• Enter Record No. value.
• Enter Quantity value.
Read Quantity fields (i.e., the number of fields
specified by the Quantity setting) from the
specified Record No. of the register (Data
Addr).
Log template
• Enter Record No. value.
Read all fields associated with the Record No.
• Enter Data Addr value.
• Enter “0” for the Record
No. value.
Read all fields in all records for the specified
log register (Data Addr).
8. Click Edit Template. The Template File window displays with a new
template.
Figure 7-3. The Edit Template window
9. To open an existing template file, click Open. The Select Template
Configuration File dialog displays.
10. Locate and select the template file, and then click Open. Template
files are saved with the .cfg extension.
7-12
MON20/20 Software for Gas Chromatographs
SEPTEMBER 2010
User Manual
3-9000-745
11. To edit the template, select a data type for each desired offset.
12. To change all offsets to the same data type, change the first offset to
the desired data type, and then click Auto Reset. The data type for
the remainder of the offsets switch to the data type of the first offset.
13. To save the displayed file to disk, click Save As.... The Select
Template Configuration File dialog appears. Type in a filename and
click Save.
14. Click OK to apply your selections and return to the main window.
7.1.6 Setting the log parameters
The Log Data window allows you to log the polled data to a specified file.
Note
The Log Data function is not necessary to transmit Modbus data. To disable this
function, clear the Enable Logging ‘Data’ Registers and Values check box on the Log
Data window.
To set the log parameters for the Modbus program, do the following:
1. Click Log Data. The Log Data window displays.
7-13
User Manual
MON20/20 Software for Gas Chromatographs
3-9000-745
SEPTEMBER 2010
Figure 7-4. The Log Data window
2. Select the Enable Logging ‘Data’ Registers and Values check box to
enable data logging and to activate the Log Data Parameters
section.
3. Select a Logging Mode from the pull-down menu. You have the
following options:
• Continuous mode records the polled data continuously until the
connection is terminated or data logging is disabled by clearing
the Enable Logging ‘Data’ Registers and Values check box.
• Sampling mode records the polled data based on the time
interval that you set in the Time Interval between consecutive
logs text box. Time intervals can be set in seconds, minutes, or
hours.
4. Select a type of logging. You have the following options:
• Append adds this log to the file specified, preserving previously
logged data.
• Reset deletes the previously-logged data and saves only this new
log.
5. Click Save As.... The Save As window displays. The file can be saved
as a tab-delimited text file or a Microsoft Excel file. Type in a
filename and click Save.
7-14
MON20/20 Software for Gas Chromatographs
User Manual
SEPTEMBER 2010
3-9000-745
7.1.7 Saving Modbus data
To save the data table to a separate file, do the following:
1. Click Save Data. The Save ‘Data’ Displayed As dialog appears. The
file can be saved as a tab-delimited text file, an HTML file or a
Microsoft Excel file.
2. Type in a filename and click Save.
7.1.8 Printing Modbus data
To print Modbus data, click Print Data. The standard print dialog
displays.
MON 20/20 prints the report to your previously configured printer. See
Section 1.7 for more information.
7.1.9 Assigning scale ranges to User_Modbus registers
By assigning scale ranges, floating point data can be converted to integer
values. This is an optional task that applies to applications using the
User_Modbus protocol.
Use the Register command described in Section 4.12.4, “Viewing or
editing scales” on page 92 to assign scale ranges. See Appendix C for more
information regarding the gas chromatograph’s Modbus registers.
7.2
Troubleshooting communication errors
The Modbus program’s Error Log is maintained in a circular buffer that
holds up to 512 entries.
The Modbus program tracks the errors for a given session but does not
store them. When you exit the Modbus program, all errors are cleared.
To view any communication errors that occurred during the data
transfer, do the following:
7-15
User Manual
MON20/20 Software for Gas Chromatographs
3-9000-745
SEPTEMBER 2010
1. Click Error.... The Error window appears.
Figure 7-5. The Error window
Note
Double-click a Description cell to “scroll through” the displayed text.
2. To view all errors that have occurred in this session, click Update.
3. To delete all entries to date, click Clear.
7-16
MON20/20 Software for Gas Chromatographs
SEPTEMBER 2010
7.3
User Manual
3-9000-745
Managing users
Use the User
Administration
commands to create or
delete users, change
passwords, and to
monitor PC-to-GC
connections.
Login security is at the gas chromatograph level instead of at the
software level. This means that you no longer have to log in after starting
MON 20/20—but you do have to log in to the gas chromatograph to which
you are trying to connect. This also means that if you create a new user,
that user is only valid for the GC to which you are connected. You cannot
connect to any other GC unless you create the same user on it first.
MON 20/20 recognizes the following four user types, or roles, each with
an increasing level of access to functionality:
• Read-only - A read-only user has the lowest level of access and can
view data but cannot make any changes. A read-only user can change
his or her password only.
• Regular - A regular user has all of the privileges of a read-only user,
as well as the ability to acknowledge and clear alarms. A regular user
can also control the GC through MON 20/20’s Control menus. A
regular user can change his or her password only and cannot create or
delete other users.
• Super User - A super user has all of the privileges of a regular user,
as well as the ability to manage and control the GC through MON 20/
20’s Application and Hardware menus. A super user can change his or
her password only and cannot create or delete other users.
• Administrator - An administrator has complete access to all of MON
20/20’s commands and functions, as well as the ability to manage all
other users by creating or deleting user accounts, and changing
passwords.
7-17
User Manual
MON20/20 Software for Gas Chromatographs
3-9000-745
SEPTEMBER 2010
Note
Each GC ships with two administrator accounts: daniel and emerson. By default,
these two accounts do not require a password, but a password can be added, if desired.
The following table lists in detail the functions and commands that
are available to each user role:
Admin
User
Super
User
Regular
User
Read-Only
User
Menu
Commands
File
Connection Directory
Y
Y
Y
Y
Program Settings
Y
Y
Y
Y
Print Setup
Y
Y
Y
Y
Connect
Y
Y
Y
Y
Disconnect
Y
Y
Y
Y
Chromatogram Viewer
Y
Y
Y
Y
Chromatogram - Forced
Cal
Y
Y
N
N
GC Time
Y
Y
read-only
read-only
Heaters
Y
Y
read-only
read-only
Valves
Y
Y
read-only
read-only
Detectors
Y
Y
read-only
read-only
Discrete Inputs
Y
Y
read-only
read-only
Discrete Outputs
Y
Y
read-only
read-only
Analog Inputs
Y
Y
read-only
read-only
Analog Outputs
Y
Y
read-only
read-only
read-only
read-only
read-only
read-only
System
Y
Y
read-only
read-only
Component Data
Y
Y
read-only
read-only
Timed Events
Y
Y
read-only
read-only
Calculations - Control
Y
Y
read-only
read-only
Calculations - Averages
Y
Y
read-only
read-only
Chromatograph
Hardware
Installed Hardware
Application
7-18
MON20/20 Software for Gas Chromatographs
User Manual
SEPTEMBER 2010
Menu
Logs/Reports
3-9000-745
Commands
Regular
User
Read-Only
User
Y
Y
read-only
read-only
Limit Alarms
Y
Y
read-only
read-only
System Alarms
Y
Y
read-only
read-only
Streams
Y
Y
read-only
read-only
Stream Sequence
Y
Y
read-only
read-only
Communication
Y
Y
read-only
read-only
Unack/Active Alarms
Y
Y
Y
read-only
read-only
read-only
read-only
read-only
Ack/Clear Alarms
Y
Y
Y
N
Maintenance Log
Y
Y
Y
read-only
Event Log
read-only
read-only
read-only
read-only
Report Display
read-only
read-only
read-only
read-only
Archive Report
read-only
read-only
read-only
read-only
Printer Control
Y
Y
Y
read-only
read-only
read-only
read-only
read-only
Reset Archive Data
Y
N
N
N
Start Auto Seq
Y
Y
Y
N
Start Single Stream
Y
Y
Y
N
Halt
Y
Y
Y
N
Calibration
Y
Y
Y
N
Stop
Y
Y
Y
N
User Administration
Y
N
N
N
Any
Own
Own
Own
Trend Data
Tools
Super
User
Calculations - User
Defined
Alarm Logs
Control
Admin
User
Change User Password
7-19
User Manual
MON20/20 Software for Gas Chromatographs
3-9000-745
SEPTEMBER 2010
7.3.1 Creating users
Note
You must be logged in as an administrator.
To create a user, do the following:
1. Select Tools → Users → User Administration.... The User
Administration window appears, displaying a list of current users and
their role levels.
Figure 7-6. The User Administration window
2. To add a user, click Add User. The Add User window displays.
7-20
MON20/20 Software for Gas Chromatographs
SEPTEMBER 2010
User Manual
3-9000-745
Figure 7-7. The Add User window
3. Enter the appropriate information into the text fields.
4. Click OK. MON 20/20 creates the new user and adds it to the User
table on the User Administration window.
7.3.2 Exporting a list of user profiles
To save a list of users, along with their role levels and passwords, do the
following:
1. Select Tools → Users → User Administration.... The User
Administration window appears, displaying a list of current users and
their role levels.
7-21
User Manual
MON20/20 Software for Gas Chromatographs
3-9000-745
SEPTEMBER 2010
Figure 7-8. The User Administration window
2. Click Export File. The Export User File window displays.
7-22
MON20/20 Software for Gas Chromatographs
User Manual
SEPTEMBER 2010
3-9000-745
Figure 7-9. The Export User File window
3. Navigate to where you want to save the file, if necessary.
4. Type in a file name or use the pre-generated name provided.
5. Click Save.
7.3.3 Importing a list of user profiles
To load a list of users, along with their role levels and passwords, do the
following:
1. Select Tools → Users → User Administration.... The User
Administration window appears, displaying a list of current users and
their role levels.
7-23
User Manual
MON20/20 Software for Gas Chromatographs
3-9000-745
SEPTEMBER 2010
Figure 7-10. The User Administration window
2. Click Import File. The Import User File window displays.
7-24
MON20/20 Software for Gas Chromatographs
SEPTEMBER 2010
User Manual
3-9000-745
Figure 7-11. The Import User File window
3. Navigate to where the file is located, if necessary.
Note
User files have the .xusr extension.
4. Click on the file to be loaded.
5. Click Open. The users will be added to the User Administration
window.
7-25
User Manual
MON20/20 Software for Gas Chromatographs
3-9000-745
SEPTEMBER 2010
7.3.4 Editing users
Note
You must be logged in as an administrator.
To edit a user’s name, role level or password, do the following:
1. Select Tools → Users → User Administration.... The User
Administration window appears, displaying a list of current users and
their role levels.
Figure 7-12. The User Administration window
2. Select the user whose role you want to edit and click Edit User. The
Edit User window displays.
7-26
MON20/20 Software for Gas Chromatographs
SEPTEMBER 2010
User Manual
3-9000-745
Figure 7-13. The Edit User window
3. Change the appropriate information as required.
4. Click OK. MON 20/20 makes the requested changes and returns to
the User Administration window.
7.3.5 Removing a user
To remove a user, do the following:
1. Select Tools → Users → User Administration.... The User
Administration window appears, displaying a list of current users and
their role levels.
7-27
User Manual
MON20/20 Software for Gas Chromatographs
3-9000-745
SEPTEMBER 2010
Figure 7-14. The User Administration window
2. Select the user you want to delete and click Remove User. A
confirmation message displays.
3. Click Yes. MON 20/20 deletes the user and returns to the User
Administration window.
7.3.6 Changing a user’s password
A user without administrator-level access can only change his or her
password.
1. Select Select Tools → Users → Change User Password.... The
Change User Password window displays.
7-28
MON20/20 Software for Gas Chromatographs
SEPTEMBER 2010
User Manual
3-9000-745
Figure 7-15. The Change User Password window
2. Enter the appropriate information in the text fields and click OK.
7.3.7 Resetting the adminstrator password
To reset an administrator password, do the following:
1. Start MON 20/20 and select Users → Reset Administrator User /
Password. The following warning displays:
Figure 7-16. Password reset warning message
7-29
User Manual
MON20/20 Software for Gas Chromatographs
3-9000-745
SEPTEMBER 2010
2. Click Yes. The Connect to GC window displays.
Figure 7-17. The Connect to GC window
3. Click the Ethernet button that corresponds to the GC whose
password you want to reset. MON 20/20 will connect to the GC and
generate a Password Reset Request ID. The MON 20/20 - Password
Reset window displays.
7-30
MON20/20 Software for Gas Chromatographs
SEPTEMBER 2010
User Manual
3-9000-745
Figure 7-18. The MON 20/20 - Password Reset window
4. Click Copy to Clipboard and email the Password Reset Request ID
to [email protected]. You will be sent a Password Reset
Key.
5. After you receive the Password Reset Key, return to the Connect to
GC window and again click the Ethernet button that corresponds to
the GC whose password you want to reset. The Login window
displays.
Figure 7-19. Login window
6. Enter the User Name and the Password Reset Key and click OK.
MON 20/20 will connect to the GC. To change the Password Reset
Key, see “Changing a user’s password” on page 7-28.
7-31
User Manual
MON20/20 Software for Gas Chromatographs
3-9000-745
SEPTEMBER 2010
7.3.8 Finding out who is connected to the gas chromatograph
To ascertain which users are connect to the GC, select Tools → Users →
Logged on Users.... The Logged on Users window displays with a list of
the users who are currently logged on to the GC, along with each user’s IP
address.
Figure 7-20. The Logged on Users window
7.4
Upgrading the firmware
This command allows you to download upgrades to the GC’s firmware.
To download an upgrade, do the following:
1. Select Upgrade Firmware... from the Tools menu. The Upgrade
Firmware window displays. The Currently Install Versions section
details the status of the currently-installed applications.
7-32
MON20/20 Software for Gas Chromatographs
SEPTEMBER 2010
User Manual
3-9000-745
Figure 7-21. The Upgrade Firmware window
2. Click Open. The Open Download File dialog displays.
3. Locate and select the desired .zip file and click Open. The .zip file’s
content information displays in the Upgrade section of the Upgrade
Firmware window. The Information column will alert you to the new
files that should be selected and downloaded to the GC.
Note
If the upgrade file contains a program that is newer than what is currently installed on
the GC, it will automatically be selected to downloading.
7-33
User Manual
MON20/20 Software for Gas Chromatographs
3-9000-745
SEPTEMBER 2010
4. Select the check boxes for the files that you want to download to the
GC and click Download. While the files are downloading, you can
monitor their status in the Upgrade Progress section.
Figure 7-22. The Upgrade Firmware window
Note
If you want to halt the download, click Cancel Download.
7-34
MON20/20 Software for Gas Chromatographs
SEPTEMBER 2010
User Manual
3-9000-745
5. When the download completes successfully, a confirmation message
displays. Click OK. MON 20/20 disconnects from the GC and the GC
reboots.
7.5
Cold booting
Cold booting the GC clears all its stored analysis files and logs and resets
all the tables to the default settings. This is a necessary step towards
refurbishing the GC or CPU board.
7.6
Viewing diagnostics
MON 20/20 provides a diagnostics window that displays vital statistics
about the following software boards’ revision and voltage levels:
• Preamp board
• Heater/Solenoid board
• Base IO board
This information can be useful when troubleshooting maintenance issues
and in deciding if further action is required.
7-35
User Manual
3-9000-745
MON20/20 Software for Gas Chromatographs
SEPTEMBER 2010
To view the Diagnostics window, select Diagnostics... from the Tools
menu.
Figure 7-23. The Diagnostics window
7-36
MON20/20 Software for Gas Chromatographs
SEPTEMBER 2010
7.7
User Manual
3-9000-745
Adjusting the sensitivity of the LOI Keys
To adjust the sensitivity of the LOI keys, do the following:
1. Select LOI Key Sensitivity from the Tools menu. The LOI Key
Sensitivity window displays.
Figure 7-24. The LOI Key Sensitivity window
2. Adjust the sensitivity for a key by sliding the bar up or down. Raising
the bar increases the sensitivity or the key; lowering the bar decreases
the sensitivity.
Note
To manipulate all of the sliders togethers, select the Apply same key sensitivity to all
keys check box.
7-37
User Manual
MON20/20 Software for Gas Chromatographs
3-9000-745
SEPTEMBER 2010
Note
Click Restore Factory Defaults to return the sliders to their original settings.
3. To save the changes without closing the window, click Save. To save
the changes and close the window, click OK.
7.8
Setting the ROC card type
To set the card type for a ROC card, do the following:
1. Select ROC Cards... from the Tools menu. The ROC Cards window
displays.
Figure 7-25. The Roc Cards window
7-38
MON20/20 Software for Gas Chromatographs
SEPTEMBER 2010
User Manual
3-9000-745
2. Select the card type for the ROC card from the ROC Card Type dropdown list. The options are:
•
•
•
•
None (Default)
ROC Analog Output
ROC Communication Module RS-232
ROC Communication Module RS-485
3. To save the changes without closing the window, click Save. To save
the changes and close the window, click OK.
7-39
User Manual
3-9000-745
7-40
MON20/20 Software for Gas Chromatographs
SEPTEMBER 2010
Appendix A, Component Data Table
A
This appendix provides a sample standard component data table as well
as a table of the ISO-related components.
• Table A-1, Example Standard Component Data Table
• Table A-2, ISO Component Data Table
All values depend on a base pressure of 14.73 PSIA and a base
temperature of 60 oF (15.56 oC).
BTU components reference GPA Standard 2145-09.
Note
An asterisk (*) denotes components that are assigned temporary I.D. codes, starting
with 150, as they are used.
A-1
A-2
Component Data Table
Table A-1 Example Standard Component Data Table
AGA 8
Component
Daniel Sim
2251 I.D.
No.
1476.9
1426.5
Ethane
22
0.104759
0
0
AIRmix1
26
0
0
0
0
Argon
46
0.6173
5.15
0.0874
435.4
359.8
None
*
2.6969
0.8844
7.373
0.2798
3750.5
3599.2
n-Hexane
*
62.1055
2.0068
0.573515
4.78155
0.32117
3264.64
3012.45
n-Butane
33
56.11
63.05
1.9372
0.6013
5.013
0.2956
3087
2885.4
n-Butane
28
Butenes
56.11
55.448
1.9372
0.6097
5.0833
0.2916
3077.4
2875.73
n-Butane
32
1,2-Butadiene
54.09
20
1.8676
0.658
5.486
0.2604
2946.7
2795.5
n-Butane
35
1,3-Butadiene
54.09
60
1.8676
0.6272
5.229
0.2732
2886.6
2735.3
n-Butane
34
C3+
44.0956
188.62
1.5225
0.50719
4.2285
0.275429
2521.92
2320.36
Propane
47
C4+
58.1222
51.567
2.0068
0.5842
4.8706
0.315183
3269.85
3017.97
n-Butane
48
C4=1
56.11
63.05
1.9372
0.6013
5.013
0.2956
3087
2885.4
n-Butane
29
C5+
72.1488
15.576
2.4911
0.63071
5.2584
0.362396
4017.97
3715.58
n-Pentane
49
C6+ 47/35/17
95.9558
3.01891
3.31309
0.679907
5.66853
0.446214
5288.71
4900.62
C6mix1
08
C6+ 50/50/00
93.1887
3.29
3.21755
0.676145
5.63715
0.43619
5141.12
4762.99
C6mix2
09
C6+ Gpa 2261-99
93.1887
3.51579
3.21755
0.67556
5.63228
0.436267
5141.09
4762.99
C6mix3
10
C6+ 57/28/14
94.1904
3.37386
3.25214
0.677036
5.64458
0.439881
5194.53
4812.82
C6mix4
11
Carbon Monoxide
28.01
0
0.9671
0.801
6.68
0
321.2
321.2
CO
15
Carbon Dioxide
44.0095
0
1.5195
0.81716
6.8129
0.170618
0
0
CO2
17
Cis-2-Butene
56.11
45.54
1.9372
0.6271
5.228
0.2835
3079.3
2877.6
n-Butane
31
Component Name
Reid
Vapor
Rel Dens
Gas
Rel Dens
Liquid
Gross Dry
Lb/Gal GPM Factor
BTU
Acetylene
26.04
0
0.899
0.615
0
0
Air
28.9625
0
1
0.87586
7.3022
Argon
39.95
0
1.3792
0
Ammonia
17.03
212
0.588
Benzene
78.11
3.224
Butanes
58.1222
Butene-1
MON 20/20 Software for Gas Chromatographs
OCTOBER 2010
Net Dry
BTU
Mol
Wt
AGA 8
Component
Daniel Sim
2251 I.D.
No.
0
0
None
42
0
1267
1267
None
41
6.531
0.3403
4492.1
4189.4
n-Hexane
*
0.7504
6.256
0.2961
3772.4
3520.2
n-Pentane
*
3.9439
0.6979
5.819
0.5185
6247.9
5793.9
n-Octane
*
7.404
2.9753
0.6664
5.556
0.4096
4756
4403.1
n-Hexane
*
100.21
3.492
3.4596
0.6782
5.654
0.4682
5494.6
5091.4
n-Heptane
*
2,4-Dimethpenta
100.21
3.292
3.4596
0.6773
5.647
0.4686
5499.4
5096
n-Heptane
*
3,3-Dimethpenta
100.2
2.773
3.4596
0.6976
5.816
0.455
5501.5
5098.2
n-Heptane
*
Ethane
30.069
800
1.0382
0.35628
2.9704
0.267369
1773.79
1622.75
Ethane
01
Ethyl Alcohol
46.07
2.3
1.5906
0.794
6.62
0.1839
1602.8
1451.5
None
*
Ethylbenzene
106.17
0.371
3.6655
0.8718
7.268
0.3858
5234.3
4982
n-Octane
*
Ethylene
28.0532
0
0.9686
0
0
0
1603.4
1502.47
Ethane
21
Ethylene Oxide
44.05
0
1.49
0
0
0
1459.4
1410.2
None
36
3-Ethylpentane
100.21
2.012
3.4596
0.7028
5.859
0.4517
5513.4
5110.1
n-Heptane
*
H2S
34.0809
395
1.1767
0.79886
6.6602
0.135156
638.57
588.15
H2S
40
HCL
36.46
925
1.2588
0.8558
7.135
0.1349
0
0
None
*
Helium
4.0026
0
0.1382
0.12486
1.041
0.101559
0
0
Helium
13
Hydrogen
2.02
0
0.0696
0.07
0
0
325
274.4
Hydrogen
12
i-Butane
58.1222
72.644
2.0068
0.56283
4.6925
0.327158
3259.42
3006.94
i-Butane
03
i-Butene
56.11
63.4
1.9372
0.6004
5.006
0.296
3068.2
2866.5
n-Butane
27
i-Pentane
72.1488
20.474
2.4911
0.62514
5.212
0.365621
4010.16
3707.56
i-Pentane
05
Component Name
Reid
Vapor
Rel Dens
Gas
Rel Dens
Liquid
Gross Dry
Lb/Gal GPM Factor
BTU
COS
60.08
0
0
0
0
0
CS2
76.14
0
2.6298
0
0
Cyclohexane
84.16
3.264
2.9057
0.7834
Cyclopentane
70.14
9.914
2.4215
Diisobutyl
114.23
1.101
2,3-Dimethbutan
86.18
2,2-Dimethpenta
A-3
Component Data Table
Net Dry
BTU
Mol
Wt
MON 20/20 Software for Gas Chromatographs
OCTOBER 2010
Table A-1 Example Standard Component Data Table (Continued)
AGA 8
Component
Daniel Sim
2251 I.D.
No.
5976.6
5674
n-Nonane
*
0.5199
6246.1
5792.2
n-Octane
*
2.5
0.169487
1012.34
911.5
Methane
00
0.796
6.64
0.1275
868.7
767.9
None
*
2.9057
0.7536
6.283
0.3538
4511.6
4209.1
n-Hexane
*
1.609
3.39
0.774
6.453
0.4019
5228
4874.9
n-Heptane
*
100.21
2.271
3.4596
0.683
5.694
0.4647
5507.3
5104
n-Heptane
*
3-Methylhexane
100.21
2.13
3.4596
0.6917
5.767
0.4589
5511.3
5107.8
n-Heptane
*
m-Xylene
106.17
0.326
3.6655
0.8687
7.243
0.3871
5219.9
4967.8
n-Octane
*
n-Butane
58.1222
51.567
2.0068
0.5842
4.8706
0.315183
3269.85
3017.97
n-Butane
04
n-Decane
142.2817
0.06148
4.9126
0.73458
6.1244
0.613636
7760.81
7206.63
n-Decane
*
n-Heptane
100.2019
1.619
3.4597
0.68823
5.7379
0.461258
5515.33
5111.8
n-Heptane
45
n-Hexane
86.1754
4.961
2.9754
0.66406
5.5364
0.411121
4766.9
4414.19
n-Hexane
39
n-Nonane
128.2551
0.1809
4.4283
0.72224
6.0215
0.562592
7012.49
6508.02
n-Nonane
38
n-Octane
114.2285
0.5349
3.944
0.70655
5.8907
0.512168
6263.46
5809.41
n-Octane
20
n-Pentane
72.1488
15.576
2.4911
0.63071
5.2584
0.362396
4017.97
3715.58
n-Pentane
06
Neohexane
86.18
9.856
2.9753
0.654
5.453
0.4175
4747.2
4394.1
n-Hexane
*
Neopentane
72.15
35.9
2.4911
0.5967
4.975
0.383
3993.9
3691.4
i-Pentane
07
Nitrogen
28.0134
0
0.9672
0.80687
6.7271
0.10999
0
0
Nitrogen
14
NO2
46
0
0
0
0
0
0
0
None
19
NO
30.01
0
0
0
0
0
0
0
None
*
N2O
44.02
0
0
0
0
0
0
0
None
18
Component Name
Reid
Vapor
Rel Dens
Gas
Rel Dens
Liquid
Gross Dry
Lb/Gal GPM Factor
BTU
i-Propylbenzene
120.19
0.188
4.1498
0.8663
7.223
0.4396
i-Octane
114.23
1.708
3.9439
0.6962
5.804
Methane
16.0425
5000
0.5539
0.3
Methyl Alcohol
32.04
4.63
1.1063
Methylcyclo C5
84.16
4.503
Methylcyclo C6
98.19
2-Methylhexane
MON 20/20 Software for Gas Chromatographs
OCTOBER 2010
Net Dry
BTU
Mol
Wt
A-4
Component Data Table
Table A-1 Example Standard Component Data Table (Continued)
Net Dry
BTU
AGA 8
Component
Daniel Sim
2251 I.D.
No.
5222
4969.7
n-Octane
*
0.088739
0
0
Oxygen
16
5.383
0.3441
3835.4
3583.3
n-Pentane
37
0.50719
4.2285
0.275429
2521.92
2320.36
Propane
02
1.411
0
0
0
2254.2
2254.2
Propane
24
227.3
1.4529
0.5226
4.3571
0.255087
2338.4
2187.05
Propane
23
40.07
0
1.411
0
0
0
2246.2
2246.2
Propane
25
p-Xylene
106.17
0.342
3.6655
0.8657
7.218
0.3885
5220.8
4968.6
n-Octane
*
Sulfur Dioxide
64.06
88
2.2117
1.397
11.65
0.1453
0
0
CO2
43
Styrene
104.15
0.24
3.5959
0.911
7.595
0.3622
5042.7
4841
n-Octane
*
Toluene
92.14
1.032
3.1812
0.8718
7.268
0.3348
4485.4
4283.5
n-Heptane
*
Trans-2-Butene
56.11
49.8
1.9372
0.61
5.086
0.2914
3075.1
2873.4
n-Butane
30
Triptane
100.21
3.374
3.4596
0.6946
5.791
0.4571
5496.2
5093
n-Heptane
*
Water
18.0153
0.9505
0.62202
1
8.3372
0.057072
50.43
0
Water
44
Component Name
Mol
Wt
Reid
Vapor
Rel Dens
Gas
Rel Dens
Liquid
Gross Dry
Lb/Gal GPM Factor
BTU
o-Xylene
106.2
0.264
3.6655
0.8848
7.377
0.3801
Oxygen
31.9988
0
1.1048
1.1423
9.5238
1-Pentene
70.14
19.115
2.4215
0.6457
Propane
44.0956
188.62
1.5225
Propadiene
40.07
0
Propylene
42.0797
Propyne
MON 20/20 Software for Gas Chromatographs
OCTOBER 2010
Table A-1 Example Standard Component Data Table (Continued)
A-5
Component Data Table
A-6
Component Data Table
Table A-2 ISO Component Data Table
Molar
Mass
Sum
Factor
(0°C)
Sum
Factor
(15°C)
Sum
Factor
(20°C)
CV Sup
kJ/Mol
(0°C)
CV Sup
kJ/Mol
(15°C)
CV Sup
kJ/Mol
(20°C)
CV Sup
kJ/Mol
(25°C)
CV Inf
kJ/Mol
(0°C)
CV Inf
kJ/Mol
(15°C)
CV Inf
kJ/Mol
(20°C)
CV Inf
kJ/Mol
(25°C)
Acetylene
26.038
0.0949
0.0837
0.0837
1301.86
1301.37
1301.21
1301.05
1256.79
1256.94
1256.98
1257.03
Air
28.9625
0
0
0
0
0
0
0
0
0
0
0
Argon
39.948
0.0316
0.0283
0.0265
0
0
0
0
0
0
0
0
Ammonia
17.0306
0.1225
0.1095
0.1049
384.57
383.51
383.16
382.81
316.96
316.86
316.82
316.79
Benzene
78.114
0.3017
0.272
0.253
3305.03
3302.86
3302.15
3301.43
3169.81
3169.56
3169.48
3169.38
Butanes
58.1222
0.2059
0.183
0.1743
2879.01
2875.17
2873.98
2872.8
2653.64
2653.01
2652.86
2652.72
Butene-1
56.108
0.1871
0.1732
0.1673
2721.55
2718.7
2717.75
2716.82
2541.25
2540.97
2540.86
2540.76
Butenes
56.108
0.1923
0.176
0.1717
2713.09
2710.23
2709.31
2708.36
2532.79
2532.49
2532.42
2532.27
1,2-Butadiene
54.092
0.2121
0.1924
0.1871
2597.13
2595.12
2594.45
2593.79
2461.91
2461.82
2461.78
2461.74
1,3-Butadiene
54.092
0.1844
0.1703
0.1643
2544.13
2542.1
2541.43
2540.77
2408.91
2408.8
2408.76
2408.72
C3+
44.0956
0.1682
0.1534
0.147
2461.51
2458.25
2457.23
2456.16
2264.71
2264.52
2264.38
2264.25
C4+
58.1222
0.2281
0.2049
0.1947
3081.63
3077.47
3076.32
3074.97
2841.63
2841.98
2841.83
2841.68
C4=1
56.108
0.1871
0.1732
0.1673
2721.55
2718.7
2717.75
2716.82
2541.25
2540.97
2540.86
2540.76
C5+
72.1488
0.2999
0.2651
0.2505
3754.2
3749.68
3748.71
3746.71
3464.63
3468.87
3468.75
3468.52
C6+ 47/35/17
95.9558
0.389
0.3459
0.3331
4663.16
4657.69
4655.86
4654.08
4316.22
4315.67
4315.46
4315.27
C6+ 50/50/00
93.1887
0.3704
0.3305
0.3183
4533.05
4527.71
4525.93
4524.19
4194.99
4194.46
4194.25
4194.07
C6+ GPA 226199
93.1887
0.3943
0.3503
0.3373
4697.93
4692.42
4690.58
4688.78
4348.61
4348.06
4347.84
4347.66
C6+ 57/28/14
94.1904
0.3781
0.3367
0.3243
4580.15
4574.76
4572.96
4571.2
4238.87
4238.34
4238.12
4237.94
Carbon Monoxide
28.01
0.0265
0.0224
0.02
282.8
282.91
282.95
282.98
282.8
282.91
282.95
282.98
Carbon Dioxide
44.0095
0.0819
0.0748
0.0728
0
0
0
0
0
0
0
0
Cis-2-Butene
56.108
0.1975
0.1817
0.1761
2714.9
2711.9
2711
2710
2534.6
2534.2
2534.1
2533.9
COS
60.076
0.1225
0.114
0.1095
548.01
548.15
548.19
548.23
548.01
548.15
548.19
548.23
MON 20/20 Software for Gas Chromatographs
OCTOBER 2010
Component
Name
Molar
Mass
Sum
Factor
(0°C)
Sum
Factor
(15°C)
Sum
Factor
(20°C)
CV Sup
kJ/Mol
(0°C)
CV Sup
kJ/Mol
(15°C)
CV Sup
kJ/Mol
(20°C)
CV Sup
kJ/Mol
(25°C)
CV Inf
kJ/Mol
(0°C)
CV Inf
kJ/Mol
(15°C)
CV Inf
kJ/Mol
(20°C)
CV Inf
kJ/Mol
(25°C)
CS2
76.143
0.2145
0.1949
0.1871
1104.06
1104.32
1104.41
1104.49
1104.06
1104.32
1104.41
1104.49
Cyclohexane
84.161
0.3209
0.2864
0.2757
3960.67
3956.02
3954.47
3952.96
3690.23
3689.42
3689.13
3688.86
Cyclopentane
70.14
0.255
0.2302
0.2236
3326.14
3322.19
3320.88
3319.59
3100.77
3100.03
3099.76
3099.51
Diisobutyl
114.23
0
0
0
0
0
0
0
0
0
0
0
2,3-Dimethbutan
86.177
0.3
0.2739
0.2569
4193.63
4188.6
4186.93
4185.28
3878.11
3877.57
3877.36
3877.17
2,2-Dimethpenta
100.21
0
0
0
0
0
0
0
0
0
0
0
2,4-Dimethpenta
100.21
0
0
0
0
0
0
0
0
0
0
0
3,3-Dimethpenta
100.2
0
0
0
0
0
0
0
0
0
0
0
Ethane
30.069
0.1
0.0922
0.0894
1564.34
1562.14
1561.41
1560.69
1429.12
1428.84
1428.74
1428.64
Ethyl Alcohol
46.07
0
0
0
0
0
0
0
0
0
0
0
Ethylbenzene
106.167
0.4858
0.4207
0.4037
4613.14
4609.53
4608.32
4607.15
4387.77
4387.37
4387.2
4387.07
Ethylene
28.0532
0.0866
0.08
0.0775
1413.51
1412.11
1411.65
1411.18
1323.36
1323.24
1323.2
1323.15
Ethylene Oxide
44.05
0
0
0
0
0
0
0
0
0
0
0
3-Ethylpentane
100.21
0
0
0
0
0
0
0
0
0
0
0
H2S
34.0809
0.1
0.1
0.1
562.94
562.38
562.19
562.01
517.87
517.95
517.97
517.99
HCL
36.46
925
1.2588
0.8558
7.135
0.1349
0
0
0
0
0
0
Helium
4.0026
0.0006
0.0002
0
0
0
0
0
0
0
0
0
Hydrogen
2.0159
-0.004
-0.0048
-0.0051
286.63
286.15
285.99
285.83
241.56
241.72
241.76
241.81
i-Butane
58.1222
0.2049
0.1789
0.1703
2874.2
2870.58
2869.38
2868.2
2648.83
2648.42
2648.26
2648.12
i-Butene
56.108
0.1871
0.1703
0.1673
2704.8
2702
2701.1
2700.2
2524.5
2524.3
2524.2
2524.1
i-Pentane
72.1488
0.251
0.228
0.2168
3535.98
3531.68
3530.24
3528.83
3265.54
3265.08
3264.89
3264.73
i-Propylbenzene
120.19
0
0
0
0
0
0
0
0
0
0
0
i-Octane
114.23
0
0
0
0
0
0
0
0
0
0
0
Methane
16.0425
0.049
0.0447
0.0436
892.97
891.56
891.09
890.63
802.82
802.69
802.65
802.6
A-7
Component Data Table
Component
Name
MON 20/20 Software for Gas Chromatographs
OCTOBER 2010
Table A-2 ISO Component Data Table
Molar
Mass
Sum
Factor
(0°C)
Sum
Factor
(15°C)
Sum
Factor
(20°C)
CV Sup
kJ/Mol
(0°C)
CV Sup
kJ/Mol
(15°C)
CV Sup
kJ/Mol
(20°C)
CV Sup
kJ/Mol
(25°C)
CV Inf
kJ/Mol
(0°C)
CV Inf
kJ/Mol
(15°C)
CV Inf
kJ/Mol
(20°C)
CV Inf
kJ/Mol
(25°C)
Methyl Alcohol
32.042
0.4764
0.3578
0.3286
766.59
765.09
764.59
764.09
676.44
676.22
676.14
676.06
Methylcyclo C5
84.161
0.313
0.2811
0.2702
3977.04
3972.46
3970.93
3969.44
3705.34
3705.59
3705.86
3706.6
Methylcyclo C6
98.188
0.3808
0.3376
0.3256
4600.64
4602.35
4604.09
4609.34
4292.53
4292.78
4293.06
4293.82
2-Methylhexane
100.21
0
0
0
0
0
0
0
0
0
0
0
3-Methylhexane
100.21
0
0
0
0
0
0
0
0
0
0
0
m-Xylene
106.167
0
0
0
0
0
0
0
0
0
0
0
n-Butane
58.1222
0.2069
0.1871
0.1783
2883.82
2879.76
2878.57
2877.4
2658.45
2657.6
2657.45
2657.32
n-Decane
142.2817
0.7523
0.645
0.614
6842.69
6834.9
6832.31
6829.77
6346.88
6346.14
6345.85
6345.59
n-Heptane
100.2019
0.4123
0.3661
0.3521
4862.87
4857.18
4855.29
4853.43
4502.28
4501.72
4501.49
4501.3
n-Hexane
86.1754
0.3286
0.295
0.2846
4203.23
4198.24
4196.58
4194.95
3887.71
3887.21
3887.01
3886.84
n-Nonane
128.2551
0.6221
0.5385
0.5148
6182.91
6175.82
6173.46
6171.15
5732.17
5731.49
5731.22
5730.99
n-Octane
114.2285
0.5079
0.445
0.4278
5522.4
5516.01
5513.88
5511.8
5116.73
5116.11
5115.87
5115.66
n-Pentane
72.1488
0.2864
0.251
0.2345
3542.89
3538.6
3537.17
3535.77
3272.45
3272
3271.83
3271.67
Neohexane
86.177
0.2898
0.2627
0.255
4185.84
4180.83
4179.15
4177.52
3870.32
3869.8
3869.59
3869.41
Neopentane
72.15
0.2387
0.2121
0.2025
3521.72
3517.43
3516.01
3514.61
3251.28
3250.83
3250.67
3250.51
Nitrogen
28.0134
0.0224
0.0173
0.0173
0
0
0
0
0
0
0
0
NO2
46.0006
0
0
0
0
0
0
0
0
0
0
0
NO
30.006
0
0
0
0
0
0
0
0
0
0
0
N2O
44.02
0
0
0
0
0
0
0
0
0
0
0
o-Xylene
106.167
0.5128
0.4427
0.4231
4602.17
4598.64
4597.48
4596.31
4376.8
4376.48
4376.34
4376.23
Oxygen
31.9988
0.0316
0.0283
0.0265
0
0
0
0
0
0
0
0
1-Pentene
70.14
0.249
0.2258
0.2191
3381.29
3377.75
3376.57
3375.42
3155.92
3155.59
3155.45
3155.34
Propane
44.0956
0.1453
0.1338
0.1288
2224.01
2221.1
2220.13
2219.17
2043.71
2043.37
2043.23
2043.11
Propadiene
40.065
0.1414
0.1304
0.1265
1945.25
1943.96
1943.53
1943.11
1855.1
1855.09
1855.08
1855.08
MON 20/20 Software for Gas Chromatographs
OCTOBER 2010
Component
Name
A-8
Component Data Table
Table A-2 ISO Component Data Table
Component
Name
Molar
Mass
Sum
Factor
(0°C)
Sum
Factor
(15°C)
Sum
Factor
(20°C)
CV Sup
kJ/Mol
(0°C)
CV Sup
kJ/Mol
(15°C)
CV Sup
kJ/Mol
(20°C)
CV Sup
kJ/Mol
(25°C)
CV Inf
kJ/Mol
(0°C)
CV Inf
kJ/Mol
(15°C)
CV Inf
kJ/Mol
(20°C)
CV Inf
kJ/Mol
(25°C)
Propylene
42.0797
0.1378
0.1265
0.1225
2061.57
2059.43
2058.72
2058.02
1926.35
1926.13
1926.05
1925.97
Propyne
40.065
0
0
0
0
0
0
0
0
0
0
0
p-Xylene
106.167
0
0
0
0
0
0
0
0
0
0
0
Sulfur Dioxide
64.065
0.1549
0.1449
0.1414
0
0
0
0
0
0
0
0
Styrene
104.15
0
0
0
0
0
0
0
0
0
0
0
Toluene
92.141
0.3886
0.3421
0.3286
3952.72
3949.81
3948.84
3947.89
3772.42
3772.08
3771.95
3771.83
Trans-2-Butene
56.108
0.1975
0.1789
0.1761
2711.1
2708.3
2707.4
2706.4
2530.8
2530.5
2530.5
2530.3
Triptane
100.21
0
0
0
0
0
0
0
0
0
0
0
Water
18.0153
0.2646
0.2345
0.2191
45.074
44.433
44.224
44.016
0
0
0
0
MON 20/20 Software for Gas Chromatographs
OCTOBER 2010
Table A-2 ISO Component Data Table
A-9
Component Data Table
A-10
Component Data Table
This page is intentionally left blank.
MON 20/20 Software for Gas Chromatographs
OCTOBER 2010
Appendix B, Data computations
A
B.1
Data acquisition
Every second, exactly 50 equally-spaced data samples are taken (i.e., one
data sample every 20 milliseconds) for analysis by the controller
assembly.
As a part of the data acquisition process, groups of incoming data samples
are averaged together before the result is stored for processing. Nonoverlapping groups of N samples are averaged and stored, and thus
reduce the effective incoming data rate to 40/N samples per second. For
example, if N = 5, then a total of 40/5 or 6 (averaged) data samples are
stored every second.
The value for the variable N is determined by the selection of a Peak
Width parameter (PW). The relationship is:
N = PW
where PW is given in seconds. Allowable values of N are 1 to 63; this
range corresponds to PW values of 2 to 63 seconds.
The variable N is known as the integration factor. This term is used
because N determines how many points are averaged, or integrated, to
form a single value. The integration of data upon input, before storing,
serves two purposes:
• The statistical noise on the input signal is reduced by the square root
of N. In the case of N = 4, a noise reduction of two would be realized.
• The integration factor controls the bandwidth of the chromatograph
signal. It is necessary to match the bandwidth of the input signal to
that of the analysis algorithms in the controller assembly. This
prevents small, short-duration perturbations from being recognized as
true peaks by the program. It is therefore important to choose a Peak
Width that corresponds to the narrowest peak in the group under
consideration.
B-1
User Manual
3-9000-745
B.2
MON20/20 Software for Gas Chromatographs
OCTOBER 2010
Peak detection
For normal area or peak height concentration evaluation, the
determination of a peak's start point and end point is automatic. The
manual determination of start and end points is used only for area
calculations in the Forced Integration mode. Automatic determination of
peak onset or start is initiated whenever Integrate Inhibit is turned off.
Analysis is started in a region of signal quiescence and stability, such
that the signal level and activity can be considered as baseline values.
Note
The controller assembly software assumes that a region of signal quiescence and
stability will exist.
Having initiated a peak search by turning Integrate Inhibit off, the
controller assembly performs a point by point examination of the signal
slope. This is achieved by using a digital slope detection filter, a
combination low pass filter and differentiator. The output is continually
compared to a user-defined system constant called Slope Sensitivity. A
default value of 8 is assumed if no entry is made. Lower values make
peak onset detection more sensitive, and higher values make detection
less sensitive. Higher values (20 to 100) would be appropriate for noisy
signals, e.g. high amplifier gain.
Onset is defined where the detector output exceeds the baseline constant,
but peak termination is defined where the detector output is less than the
same constant.
Sequences of fused peaks are also automatically handled. This is done by
testing each termination point to see if the region immediately following
it satisfies the criteria of a baseline. A baseline region must have a slope
detector value less than the magnitude of the baseline constant for a
number of sequential points. When a baseline region is found, this
terminates a sequence of peaks.
A zero reference line for peak height and area determination is
established by extending a line from the point of the onset of the peak
sequence to the point of the termination. The values of these two points
are found by averaging the four integrated points just prior to the onset
point and just after the termination points, respectively.
B-2
MON20/20 Software for Gas Chromatographs
User Manual
OCTOBER 2010
3-9000-745
The zero reference line will, in general, be non-horizontal, and thus
compensates for any linear drift in the system from the time the peak
sequence starts until it ends.
In a single peak situation, peak area is the area of the component peak
between the curve and the zero reference line. The peak height is the
distance from the zero reference line to the maximum point on the
component curve. The value and location of the maximum point is
determined from quadratic interpolation through the three highest points
at the peak of the discrete valued curve stored in the controller assembly.
For fused peak sequences, this interpolation technique is used both for
peaks, as well as, valleys (minimum points). In the latter case, lines are
dropped from the interpolated valley points to the zero reference line to
partition the fused peak areas into individual peaks.
The use of quadratic interpolation improves both area and height
calculation accuracy and eliminates the effects of variations in the
integration factor on these calculations.
For calibration, the controller assembly may average several analyses of
the calibration stream.
B.3
Analysis computations
There are two basic analysis algorithms included in the GC:
• Area Analysis – calculates area under component peak
• Peak Height Analysis – measures height of component peak
B-3
User Manual
MON20/20 Software for Gas Chromatographs
3-9000-745
OCTOBER 2010
B.3.1 Concentration analysis with response factor
Calibration
The concentration calculations discussed as follows require a unique
response factor for each component in an analysis. These factors may be
manually entered by an operator or automatically calculated by
calibrating the system.
Area n
ARF n = --------------Cal n
or
Ht n
HRF n = ----------Cal n
where
ARFn
Area response factor for component n in area per mole percent (%).
HRFn
Height response factor for component n.
Arean
Area associated with component n in calibration gas.
Htn
Height associated with component n in mole percent in calibration gas.
Caln
Amount of component n in mole percent of calibration gas.
Calculated response factors are stored by the GC for use in the
concentration calculations, and are printed out in the configuration and
calibration reports.
k
∑ RFi
i=1
RFAVG n = -----------------k
B-4
MON20/20 Software for Gas Chromatographs
User Manual
OCTOBER 2010
3-9000-745
where
RFAVGn
Area or height average response factor for component n.
RFi
Area or height response factor for component n from the calibration
run.
k
Number of calibration runs actually used to calculate the response
factors.
The percent deviation of new RF average from old RF average is
calculated in the following manner:
RF new – RF old
deviation = ----------------------------------- × 100
RF old
where the absolute value of percent deviation for alarm has been
previously entered by the operator.
Calculation in mole percent w/o normalization
Once response factors have been determined by the controller or entered
by the operator, component concentrations are determined for each
analysis using the following equations:
Area n
CONC n = --------------ARF n
or
Ht n
CONC n = -------------HRF n
where
CONCn
Concentration of component n in mole percent.
AREAn
Area of component n in unknown sample.
ARFn
Response factor of component n calculated from area of calibration sample.
Units are area per mole percent.
Htn
Peak height of component n in unknown sample.
HRFn
Response factor of component n calculated from peak height of calibration
sample. Units are height per mole percent.
B-5
User Manual
MON20/20 Software for Gas Chromatographs
3-9000-745
OCTOBER 2010
Note that the average concentration of each component will also be
calculated when data averaging is requested.
Component concentrations may be input through analog inputs 1 to 4 or
may be fixed. If a fixed value is used, the calibration for that component is
the mole percent that will be used for all analyses:.
CONC n
- × 100
CONCN n = --------------------------k
∑ CONCi
i=1
where
B.4
CONCNn
Normalized concentration of component n in percent of total gas
concentration.
CONCn
Non-normalized concentration of component n in mole percent.
CONCi
Non-normalized concentration (in mole percent) from each of the k
components to be grouped into this normalization.
k
Number of components to be included in the normalization.
Post analysis computations
B.4.1 Liquid equivalent computations
The equivalent liquid volume, in gallons per 1000 standard cubic feet
(GPM) is given by:
BASEPRS BASETEMP + 459.67
GPM n = CONCN n × LCF n × -------------------------- × ------------------------------------------------------14.73
60 + 459.67
B-6
MON20/20 Software for Gas Chromatographs
User Manual
OCTOBER 2010
3-9000-745
where
GPMn
Gallons/1000 standard cubic feet of component n.
CONCNn
Normalized (if selected) concentration of component n.
LCFn
Liquid equivalent conversion factor for component n at 14.73 PSIA and 60
degrees F.
BASE PRS
Base (contact) Pressure specified; defaults to 14.73.
B.4.2 Heating value calculations
• Dry Gross BTU of Total Gas
P
∑ [ ( CONCN )n ( BTU CF )n ]
=1
DRYBTU CF = n------------------------------------------------------------------------100
where
DRYBTU/CF
Uncorrected dry BTU content per cubic foot of total gas sample.
CONCNn
Normalized (if selected) concentration of component n, calculated
from peak analysis.
BTU/CFn
Energy content per cubic foot of component n, stored in permanent
memory.
P
Total number of components to be used in calculation of total BTU/
CF.
100
Removed the 100 factored into the calculation of the concentration
earlier in the analysis.
• Ideal Gas Relative Density
P
∑ CONCn ( RDn )
=1
TOTALRD = n--------------------------------------------100
B-7
User Manual
MON20/20 Software for Gas Chromatographs
3-9000-745
OCTOBER 2010
where
RDn
Relative Density of component “n”
TOTAL RD
Relative Density of total gas sample
CONCNn
Normalized (if selected) concentration of component n, calculated
from peak analysis.
P
Total number of components to be used in calculation of total BTU/
CF.
100
Removed the 100 factored into the calculation of the concentration
earlier in the analysis.
• Real (corrected) Gas Relative Density
The Ideal Gas Relative Density, DI, is corrected to the Real Gas
Relative Density, DR, by dividing by the compressibility factor, Z, for
gas mixture at 60 oF and one atmosphere pressure and multiplying by
the compressibility factor of air at the same conditions:
D I Z b ( air )
D R = --------------------Z b ( gas )
where
DI
Ideal Gas Relative Density. See Appendix A for more information.
Zb(air)
Compressibility factor of air, or 0.99959.
Zb(gas)
Compressibility factor of gas mixture.
• Compressibility Factor Dry BTU
Compressibility equations use calculations from the American Gas
Association’s Compressibility Factors of Natural Gas and Other
Related Hydrocarbon Gases: AGA Report #8.
DRYBTU
CORRDRYBTU = -----------------------Z
B-8
MON20/20 Software for Gas Chromatographs
User Manual
OCTOBER 2010
3-9000-745
where
DRYBTU
Dry Gross BTU of Total Gas; see page 7 for details.
Z
Compressibility factor.
BASE PRS
Base (contract) pressure specified; defaults to 14.73 PSIA.
• Corrected Saturated BTU
( DRYBTU ) ( 0.9826 )
CORRSATBTU = --------------------------------------------------Z
where
DRYBTU
Dry Gross BTU of Total Gas; see page 7 for details.
CORRSATBTU
Corrected saturated BTU content per cubic foot of total gas sample at
base conditions of BASE PRS and 60 °F.
Z
Compressibility Factor Dry BTU; see page 8 for details.
BASEPRS
Base (contract) pressure specified; defaults to 14.73 PSIA.
• Compressibility and Base Pressure
Compressibility and base pressure corrections for Dry BTU are:
DryBTUatBasePressure ContractPressure
CorrDryBTU = ⎛ -----------------------------------------------------------------⎞ ⎛ ------------------------------------------------⎞
⎝
⎠ ⎝ BasePressure ⎠
Z
where
CORRDRYBTU
Dry Gross BTU of Total Gas; see page 7 for details.
Z
Compressibility Factor Dry BTU; see page 8 for details.
BASE PRESSURE
Base (contract) pressure specified; defaults to 14.73 PSIA
• BTU Calculations
Note that the BTU calculations apply to Gross dry, saturated, actual
BTU and Net dry, saturated, and actual BTU
( WVC )
GrossActualBTU ( corr ) = GrossDryBTU ( corr ) × ⎛ 100 – ------------------⎞
⎝
100 ⎠
B-9
User Manual
MON20/20 Software for Gas Chromatographs
3-9000-745
OCTOBER 2010
where
WVC
Water volume content provided by a “live analog input”.
CORR ( GROSS )BTU
WI = -----------------------------------------------------RD
where
W.I.
Wobbe index value
CORRGROSSBTU
Corrected Dry BTU for Total Gas Sample; see page 8 for details.
RD
Real Relative Density; see page 8 for details.
Note
All components in the sample must be measured in order to calculate weight percent.
( CONC n ) ( MW n )
- × 100
WTpercent n = ------------------------------------------------k
∑ ( CONCi ) ( MWi )
i=1
where
WTpercentn
Weight percent of component n.
CONCn
Concentration in mole percent of component n.
Mwn
Molecular weight of component n.
k
∑
Sum of weights of all components in sample.
i=1
k
AVGMW =
∑ ( CONCi ) ( MWi )
i=1
B-10
MON20/20 Software for Gas Chromatographs
OCTOBER 2010
User Manual
3-9000-745
where
AVGMW
Average molecular weight.
Sum of weights of all components in sample.
k
∑
i=1
( WTpercent n ) ÷ ( D n )
- × 100
LVpercent = ------------------------------------------------------------k
∑ ( WTpercenti ) ÷ ( Di )
i=1
Note
All components in the sample must be measured in order to calculate liquid volume from
mole percent.
where
LV percent
Liquid volume.
WT percent
Weight percent.
D
Density.
k
∑
Sum of all components in sample.
i=1
k
∑ ( CONCi ) ( VPi )
=1
RVP = i---------------------------------------------100
where
RVP
Reid vapor pressure.
CONCi
Normalized concentration of component i in mole percent.
VPi
Vapor pressure at 100 degrees F of component i (GPA2145 = 94).
B-11
User Manual
MON20/20 Software for Gas Chromatographs
3-9000-745
OCTOBER 2010
Note
All components in the sample must be measured in order to calculate LRDT.
k
∑ ( LVpercenti ) ( LRDi )
=1
LRD T = i------------------------------------------------------------100
where
LRDT
Liquid Relative Density of sample, relative to water at 60 °F.
LRDi
Liquid Relative Density of component i (GPA2145-94).
LVpercent
Liquid Volume Percent.
Note
All components in the sample must be measured in order to calculate liquid density.
k
∑ ( LVi ) ( LDi )
i=1
LD T = ------------------------------------100
where
LDT
Liquid Density of total sample in pounds per gallon
LDi
Liquid Density of component i (GPA 2145-94).
LVi
Liquid Volume Percent of component i.
GD = ( RD ) ( 76.4976 )
B-12
MON20/20 Software for Gas Chromatographs
User Manual
OCTOBER 2010
3-9000-745
where
GD
Gas Density in lb/1000 ft3.
RD
Relative Density (relative to air).
76.4976
Density of air at 14.73 PSIA and 60 °F, in lb/1000 ft3.
B.4.3 Multi-level calibration
The properties of each gas component can be viewed using the
Component Data menu. Included with the component properties in the
Component Data Table are four coefficients labeled Multi-Level Calib 'a',
'b', 'c', and 'd', for each component. If these parameters are all set to zero,
then linear calibration is used. See Section B.3.1 for the Response Factor
calculations.
If any of these parameters have a value other than zero, then multi-level,
or polynomial calibration is used for that component.
The response factors are then calculated as:
3
2
aP + bP + cP + d
ResponseFactor = ---------------------------------------------------------------------CalibrationConcentration (mol %)
where
P
Peak size from average calibration runs.
Coefficients:
a,b,c, and d
Calculated offline and entered after multi-level calibration using several-typically seven--calibration gases.
NOTE: If the coefficient values are correct, the response factor will be close
to 1.
The mole% value in the sample gas is then calculated as
3
Mole % =
2
aP
+ bP + cP + d
----------------------------------------------responsefactor
B-13
User Manual
MON20/20 Software for Gas Chromatographs
3-9000-745
OCTOBER 2010
where
P
Peak size measured in sample gas.
Coefficients:
a,b,c, and d
Calculated offline and entered after multi-level calibration using
several--typically seven--calibration gases.
NOTE: If the coefficient values are correct, the response factor will be
close to 1.
B.4.4 Indirect calibration
Component gases that are not found in the calibration gas, but may be
found in the sample gas, can be assigned a relative response factor that is
a fixed multiple of a reference component that is found in the calibration
gas.
The Relative Response Factors and Reference Component Values are
included in the Component Data Table. See Appendix A for more
information.
If the Reference Component is None, then normal (direct) calibration is
used.
If the Reference Component is defined, (e.g. Propane) then the mole%
value for the indirect component (e.g. neoC5), is calculated as:
⎛ P ( neoC5 ) ⎞
mole% (neoC5) = mole% (Propane) ⎝ -------------------------------⎠ ( RRFneoC5 )
P ( Propane )
where
B-14
P
Peak size
RRF
Relative Response Factor
Appendix C, Modbus registers list
A
There are two GC Modbus registers that may be of interest to the
developer: SIM_2251 and User_Modbus. Differences betweeb the two
registers are summarized in Table C-1.
Table C-1 Comparison of SIM_2251 and User_Modbus
SIM_2251
User_Modbus
Serial slave port.
Serial slave port.
Modified protocol that allows floating point
numbers to be transmitted over Modbus via 2251
emulation slave type.
The standard Gould Modbus protocol that
accommodates PLC Emulation LO-HI.
Nearly all register contents are predefined; a few
9000-series registers can be user-defined (i.e.,
read-write).
Boolean (coils) are predefined. Numeric
(registers) are user-defined.
Variables assigned to registers can be listed in
the GC Config Report. For instructions and an
example report, see Section 5.12.
Variables assigned to registers can be listed in
the GC Config Report. For instructions and an
example report, see Section 5.12.
When using the Modbus Test program, set
Register Mode to “DANIEL” to view register
contents (see Section 7.1.2).
When using the Modbus Test software, set
Register Mode to “PLC LH” to view register
contents (see Section 7.1.2).
C.1
User_Modbus register list
Table C-2 lists only variables included in the User_Modbus Boolean
Modbus registers. These registers are not user-defined and primarily
contain alarm flags that may be useful for debugging purposes. To use the
Modbus program to view the contents of these registers, you will need to
set the Function parameter to 1 (Read Coil). See Section 7.1 for details
on using the Modbus program.
All other User_Modbus registers can be defined by the user. To define
User_Modbus register contents, see Section 4.12.3.
C-1
User Manual
MON20/20 Software for Gas Chromatographs
3-9000-745
OCTOBER 2010
To obtain a complete list of register assignments, both SIM_2251 and
User_Modbus, print a GC Config Report. See “Generating a GC
Configuration Report” on page 5-65 for more information.
Table C-2 List of User_Modbus Registers
Slave Name USER_MODBUS
Modbus
Reg.
Variable
Name
Field Name
Indices
S
C
Boolean (Coils)
0
sysalarm_set
1
1
Application Checksum Failure
1
sysalarm_set
2
1
ROM Checksum Failure
2
sysalarm_set
3
1
RAM Diagnostics Failure
3
sysalarm_set
4
1
A/D Converter Failure
4
sysalarm_set
5
1
Detector Oven Failure
5
sysalarm_set
6
1
Liquid Sample Valve Heater
Failure
6
sysalarm_set
7
1
Sample System Oven Failure
7
sysalarm_set
8
1
Catalytic Converter Failure
8
sysalarm_set
9
1
Heater 5 Failure
9
sysalarm_set
10
1
Heater 6 Failure
10
sysalarm_set
11
1
Heater 1 Controller Failure
11
sysalarm_set
12
1
Heater 2 Controller Failure
12
sysalarm_set
13
1
Heater 3 Controller Failure
13
sysalarm_set
14
1
Heater 4 Controller Failure
14
sysalarm_set
15
1
Heater 5 Controller Failure
15
sysalarm_set
16
1
Heater 6 Controller Failure
16
sysalarm_set
17
1
FID Flame out
17
sysalarm_set
18
1
Warmstart Calibration Failure
18
sysalarm_set
19
1
Valve Timing Failure
19
sysalarm_set
20
1
Excess Response Factor Deviation
20
sysalarm_set
21
1
M200 Invalid Non-Volatile Data
21
sysalarm_set
22
1
M200 Invalid A Module Data
22
sysalarm_set
23
1
M200 Invalid B Module Data
23
sysalarm_set
24
1
M200 Bad Options
24
sysalarm_set
25
1
M200 Stack Overflow
C-2
MON20/20 Software for Gas Chromatographs
User Manual
OCTOBER 2010
3-9000-745
Table C-2 List of User_Modbus Registers
Slave Name USER_MODBUS
Modbus
Reg.
Variable
Name
Field Name
Indices
S
C
Boolean (Coils)
25
sysalarm_set
26
1
M200 Hardware Shutdown
26
sysalarm_set
27
1
M200 Synchronization Failure
27
sysalarm_set
28
1
Preamp Input 1 Out of Range DET1
28
sysalarm_set
29
1
Preamp Input 2 Out of Range DET1
29
sysalarm_set
30
1
Preamp Input 3 Out of Range DET1
30
sysalarm_set
31
1
Preamp Input 4 Out of Range DET1
31
sysalarm_set
32
1
Preamp Failure - DET1
32
sysalarm_set
33
1
Analog Output 1 HIGH
33
sysalarm_set
34
1
Analog Output 2 HIGH
34
sysalarm_set
35
1
Analog Output 3 HIGH
35
sysalarm_set
36
1
Analog Output 4 HIGH
36
sysalarm_set
37
1
Analog Output 5 HIGH
37
sysalarm_set
38
1
Analog Output 6 HIGH
38
sysalarm_set
39
1
Analog Output 7 HIGH
39
sysalarm_set
40
1
Analog Output 8 HIGH
40
sysalarm_set
41
1
Analog Output 9 HIGH
41
sysalarm_set
42
1
Analog Output 10 HIGH
42
sysalarm_set
43
1
Analog Output 11 HIGH
43
sysalarm_set
44
1
Analog Output 12 HIGH
44
sysalarm_set
45
1
Analog Output 13 HIGH
45
sysalarm_set
46
1
Analog Output 14 HIGH
46
sysalarm_set
47
1
Analog Output 15 HIGH
47
sysalarm_set
48
1
Analog Output 16 HIGH
48
sysalarm_set
49
1
Analog Output 1 LOW
49
sysalarm_set
50
1
Analog Output 2 LOW
50
sysalarm_set
51
1
Analog Output 3 LOW
C-3
User Manual
MON20/20 Software for Gas Chromatographs
3-9000-745
OCTOBER 2010
Table C-2 List of User_Modbus Registers
Slave Name USER_MODBUS
Modbus
Reg.
Variable
Name
Field Name
Indices
S
C
Boolean (Coils)
51
sysalarm_set
52
1
Analog Output 4 LOW
52
sysalarm_set
53
1
Analog Output 5 LOW
53
sysalarm_set
54
1
Analog Output 6 LOW
54
sysalarm_set
55
1
Analog Output 7 LOW
55
sysalarm_set
56
1
Analog Output 8 LOW
56
sysalarm_set
57
1
Analog Output 9 LOW
57
sysalarm_set
58
1
Analog Output 10 LOW
58
sysalarm_set
59
1
Analog Output 11 LOW
59
sysalarm_set
60
1
Analog Output 12 LOW
60
sysalarm_set
61
1
Analog Output 13 LOW
61
sysalarm_set
62
1
Analog Output 14 LOW
62
sysalarm_set
63
1
Analog Output 15 LOW
63
sysalarm_set
64
1
Analog Output 16 LOW
64
sysalarm_set
65
1
Analyzer Failure
65
sysalarm_set
66
1
Power Failure
66
sysalarm_set
67
1
Fused Peak Overflow - Noisy
Baseline
67
sysalarm_set
68
1
CPU Battery Low
68
sysalarm_set
69
1
GC Idle
69
sysalarm_set
70
1
Real-Time Clock Failure
70
sysalarm_set
71
1
Analog Input 1 HIGH
71
sysalarm_set
72
1
Analog Input 2 HIGH
72
sysalarm_set
73
1
Analog Input 3 HIGH
73
sysalarm_set
74
1
Analog Input 4 HIGH
74
sysalarm_set
75
1
Analog Input 1 LOW
75
sysalarm_set
76
1
Analog Input 2 LOW
76
sysalarm_set
77
1
Analog Input 3 LOW
77
sysalarm_set
78
1
Analog Input 4 LOW
78
sysalarm_set
79
1
NA
C-4
MON20/20 Software for Gas Chromatographs
User Manual
OCTOBER 2010
3-9000-745
Table C-2 List of User_Modbus Registers
Slave Name USER_MODBUS
Modbus
Reg.
Variable
Name
Field Name
Indices
S
C
Boolean (Coils)
79
sysalarm_set
80
1
NA
80
sysalarm_set
81
1
NA
81
sysalarm_set
82
1
NA
82
sysalarm_set
83
1
NA
83
sysalarm_set
84
1
NA
84
sysalarm_set
85
1
NA
85
lmtalarm_set
1
1
86
lmtalarm_set
2
1
87
lmtalarm_set
3
1
88
lmtalarm_set
4
1
89
lmtalarm_set
5
1
90
lmtalarm_set
6
1
91
lmtalarm_set
7
1
92
lmtalarm_set
8
1
93
lmtalarm_set
9
1
94
lmtalarm_set
10
1
95
lmtalarm_set
11
1
96
lmtalarm_set
12
1
97
lmtalarm_set
13
1
98
lmtalarm_set
14
1
99
lmtalarm_set
15
1
100
lmtalarm_set
16
1
101
lmtalarm_set
17
1
102
lmtalarm_set
18
1
103
lmtalarm_set
19
1
104
lmtalarm_set
20
1
105
stream_data
stream_togg
1
1
106
stream_data
stream_togg
2
1
107
stream_data
stream_togg
3
1
C-5
User Manual
MON20/20 Software for Gas Chromatographs
3-9000-745
OCTOBER 2010
Table C-2 List of User_Modbus Registers
Slave Name USER_MODBUS
Modbus
Reg.
Variable
Name
Field Name
Indices
S
C
Boolean (Coils)
108
stream_data
stream_togg
4
1
109
stream_data
stream_togg
5
1
110
stream_data
stream_togg
6
1
111
stream_data
stream_togg
7
1
112
stream_data
stream_togg
8
1
113
doutcur
1
1
114
doutcur
2
1
115
doutcur
3
1
116
doutcur
4
1
117
doutcur
5
1
C-6
MON20/20 Software for Gas Chromatographs
User Manual
OCTOBER 2010
C.2
3-9000-745
SIM_2251 Modbus register list
To use the Modbus Test program and view the contents of SIM_2251
registers, set the Register Mode to “Daniel,” as noted in Table C-1.
For a complete list of register assignments, both SIM_2251 and
User_Modbus, print a GC Config Report. See “Generating a GC
Configuration Report” on page 5-65 for more information.
Note
The information in the following tables is derived from engineering specification number
ES-17128-005, “Model 2251 Enhanced Specification Chromatograph Controller Modbus
Communication Indices.”
Table C-3 List of SIM_2251 Registers
Reg. No.
Description
3001
Component Table n (where n equals the CDT # used during the last run) - Component #1
3002
Component Table n (where n equals the CDT # used during the last run) - Component #2
3003
Component Table n (where n equals the CDT # used during the last run) - Component #3
3004
Component Table n (where n equals the CDT # used during the last run) - Component #4
3005
Component Table n (where n equals the CDT # used during the last run) - Component #5
3006
Component Table n (where n equals the CDT # used during the last run) - Component #6
3007
Component Table n (where n equals the CDT # used during the last run) - Component #7
3008
Component Table n (where n equals the CDT # used during the last run) - Component #8
3009
Component Table n (where n equals the CDT # used during the last run) - Component #9
3010
Component Table n (where n equals the CDT # used during the last run) - Component #10
3011
Component Table n (where n equals the CDT # used during the last run) - Component #11
3012
Component Table n (where n equals the CDT # used during the last run) - Component #12
3013
Component Table n (where n equals the CDT # used during the last run) - Component #13
3014
Component Table n (where n equals the CDT # used during the last run) - Component #14
3015
Component Table n (where n equals the CDT # used during the last run) - Component #15
3016
Component Table n (where n equals the CDT # used during the last run) - Component #16
3017
Component Table n (where n equals the CDT # used during the last run) - Component #1
3018
Component Table n (where n equals the CDT # used during the last run) - Component #2
3019
Component Table n (where n equals the CDT # used during the last run) - Component #3
C-7
User Manual
MON20/20 Software for Gas Chromatographs
3-9000-745
OCTOBER 2010
Table C-3 List of SIM_2251 Registers
Reg. No.
Description
3020
Component Table n (where n equals the CDT # used during the last run) - Component #4
3021
Component Table n (where n equals the CDT # used during the last run) - Component #5
3022
Component Table n (where n equals the CDT # used during the last run) - Component #6
3023
Component Table n (where n equals the CDT # used during the last run) - Component #7
3024
Component Table n (where n equals the CDT # used during the last run) - Component #8
3025
Component Table n (where n equals the CDT # used during the last run) - Component #9
3026
Component Table n (where n equals the CDT # used during the last run) - Component #10
3027
Component Table n (where n equals the CDT # used during the last run) - Component #11
3028
Component Table n (where n equals the CDT # used during the last run) - Component #12
3029
Component Table n (where n equals the CDT # used during the last run) - Component #13
3030
Component Table n (where n equals the CDT # used during the last run) - Component #14
3031
Component Table n (where n equals the CDT # used during the last run) - Component #15
3032
Component Table n (where n equals the CDT # used during the last run) - Component #16
3033
Analysis Time (in 1/30ths of a second)
3034
Current Stream
3035
Mask of streams associated with Component Table #1 (Bit 2n = 1 implies stream n
included)
3036
Current Month (1-12)
3037
Current day (1-31)
3038
Current Year (0-99)
3039
Current Hour (0-24)
3040
Current Minute (0-59)
3041
Cycle Start Time - Month
3042
Cycle Start Time - Day
3043
Cycle Start Time - Year
3044
Cycle Start Time - Hour
3045
Cycle Start Time - Minute
C-8
Reg.
No.
Description
15
14
13
12
11
10
3046
checksum
failure
3047
spare
9
8
7
6
5
4
3
2
1
0
anlyzr
failure
D/A 3
high
D/A 3
low
D/A 2
high
D/A 2
low
D/A 1
high
D/A 1
low
spare
spare
A/D 2
high
A/D 2
low
A/D 1
high
A/D 1
low
spare
spare
spare
spare
spare
spare
spare
spare
spare
spare
spare
spare
spare
adjust
preamp
preamp
failure
RF %
dev
power
failure
#7
low
#6
low
#5
low
#4
low
#3
low
#2
low
O.D.A.
#1 low
#7
high
#6
high
#5
high
#4
high
#3
high
#2
high
O.D.A.
#1 high
#7
low
#6
low
#5
low
#4
low
#3
low
#2
low
O.D.A.
#1 low
#7
high
#6
high
#5
high
#4
high
#3
high
#2
high
O.D.A.
#1 high
#7
low
#6
low
#5
low
#4
low
#3
low
#2
low
O.D.A.
#1 low
#7
high
#6
high
#5
high
#4
high
#3
high
#2
high
O.D.A.
#1 high
#7
low
#6
low
#5
low
#4
low
#3
low
#2
low
O.D.A.
#1 low
#7
high
#6
high
#5
high
#4
high
#3
high
#2
high
O.D.A.
#1 high
Stream #1
3048
#15
low
#14
low
#13
low
#12
low
#11
low
#10
low
#9
low
#8
low
Stream #1
3049
#15
high
#14
high
#13
high
#12
high
#11
high
#10
high
#9
high
#8
high
Stream #2
3050
#15
low
#14
low
#13
low
#12
low
#11
low
#10
low
#9
low
#8
low
MON 20/20 Software for Gas Chromatographs
OCTOBER 2010
Table C-4 SIM_2251 MODBUS REGISTER LIST (BIT NUMBERS)
Stream #2
3051
#15
high
#14
high
#13
high
#12
high
#11
high
#10
high
#9
high
#8
high
Stream #3
3052
#15
low
#14
low
#13
low
#12
low
#11
low
#10
low
#9
low
#8
low
Stream #3
3053
#15
high
#14
high
#13
high
#12
high
#11
high
#10
high
#9
high
#8
high
#15
low
#14
low
#13
low
#12
low
#11
low
#10
low
#9
low
#8
low
Stream #4
3055
#15
high
#14
high
#13
high
#12
high
#11
high
#10
high
#9
high
#8
high
C-9
Modbus registers list
Stream #4
3054
Reg.
No.
C-10
Modbus registers list
Table C-4 SIM_2251 MODBUS REGISTER LIST (BIT NUMBERS)
Description
15
14
13
12
11
10
9
8
7
6
5
4
3
2
1
0
Stream #5
3056
#15
low
#14
low
#13
low
#12
low
#11
low
#10
low
#9
low
#8
low
#7
low
#6
low
#5
low
#4
low
#3
low
#2
low
O.D.A.
#1 low
#7
high
#6
high
#5
high
#4
high
#3
high
#2
high
O.D.A.
#1 high
Stream #5
3057
#15
high
#14
high
#13
high
#12
high
#11
high
#10
high
#9
high
#8
high
3058
New data flag. Set upon completion of calculations.
3059
Cal/Analysis flag. Set to 1 if analysis data. Set to 0 if calculation data.
MON 20/20 Software for Gas Chromatographs
OCTOBER 2010
MON20/20 Software for Gas Chromatographs
OCTOBER 2010
User Manual
3-9000-745
Table C-5 SIM_2251 Modbus register list (32-bit integers)
Reg. No.
Description
5001
Cycle time (in 1/30ths of a second)
5002
Calibration cycle time (in 1/30ths of a second)
Note
The following registers contain no values until the completion of atleast one analysis
run.
Table C-6 SIM_2251 Modbus register list (floating point)
Reg. No.
Description
7001
Mole % - Component #1
7002
Mole % - Component #2
7003
Mole % - Component #3
7004
Mole % - Component #4
7005
Mole % - Component #5
7006
Mole % - Component #6
7007
Mole % - Component #7
7008
Mole % - Component #8
7009
Mole % - Component #9
7010
Mole % - Component #10
7011
Mole % - Component #11
7012
Mole % - Component #12
7013
Mole % - Component #13
7014
Mole % - Component #14
7015
Mole % - Component #15
7016
Mole % - Component #16
7017
GPM or Weight % - Component #1
7018
GPM or Weight % - Component #2
7019
GPM or Weight % - Component #3
7020
GPM or Weight % - Component #4
7021
GPM or Weight % - Component #5
C-11
User Manual
MON20/20 Software for Gas Chromatographs
3-9000-745
OCTOBER 2010
Table C-6 SIM_2251 Modbus register list (floating point)
Reg. No.
Description
7022
GPM or Weight % - Component #6
7023
GPM or Weight % - Component #7
7024
GPM or Weight % - Component #8
7025
GPM or Weight % - Component #9
7026
GPM or Weight % - Component #10
7027
GPM or Weight % - Component #11
7028
GPM or Weight % - Component #12
7029
GPM or Weight % - Component #13
7030
GPM or Weight % - Component #14
7031
GPM or Weight % - Component #15
7032
GPM or Weight % - Component #16
7033
BTU Dry
7034
BTU Saturated
7035
Specific Gravity
7036
Compressibilty
7037
WOBBE Index
7038
Total Unnormalized Mole %
7039
Total GPM
7040
Calculation, User-defined #1
7041
Calculation, User-defined #2
7042
Calculation, User-defined #3
7043
Calculation, User-defined #4
7044
Calculation, User-defined #5
7045-7053
Unused
7054
Actual BTU
7055
Averages, User-defined #1
7056
Averages, User-defined #2
7057
Averages, User-defined #3
7058
Averages, User-defined #4
7059
Averages, User-defined #5
7060
Averages, User-defined #6
C-12
MON20/20 Software for Gas Chromatographs
OCTOBER 2010
User Manual
3-9000-745
Table C-6 SIM_2251 Modbus register list (floating point)
Reg. No.
Description
7061
Averages, User-defined #7
7062
Averages, User-defined #8
7063
Averages, User-defined #9
7064
Averages, User-defined #10
7065
Averages, User-defined #11
7066
Averages, User-defined #12
7067
Averages, User-defined #13
7068
Averages, User-defined #14
7069
Averages, User-defined #15
7070
First Archive of Average, User-defined #1
7071
First Archive of Average, User-defined #2
7072
First Archive of Average, User-defined #3
7073
First Archive of Average, User-defined #4
7074
First Archive of Average, User-defined #5
7075
First Archive of Average, User-defined #6
7076
First Archive of Average, User-defined #7
7077
First Archive of Average, User-defined #8
7078
First Archive of Average, User-defined #9
7079
First Archive of Average, User-defined #10
7080
First Archive of Average, User-defined #11
7081
First Archive of Average, User-defined #12
7082
First Archive of Average, User-defined #13
7083
First Archive of Average, User-defined #14
7084
First Archive of Average, User-defined #15
7085
Analog Input #1 - Current Value in Engineering Units
7086
Analog Input #2 - Current Value in Engineering Units
7087
Actual BTU (Last Calibration)
7088
Dry BTU (Last Calibration)
7089
Saturated BTU (Last Calibration)
7090
WOBBE Index (Last Calibration)
7091
Relative Density (Last Calibration)
C-13
User Manual
MON20/20 Software for Gas Chromatographs
3-9000-745
OCTOBER 2010
Table C-6 SIM_2251 Modbus register list (floating point)
Reg. No.
Description
7092
Compressibilty (Last Calibration)
7093
Total GPM (Last Calibration)
7094
Total Unnormalized (Last Calibration)
7095-7110
Response Factors (#1-16), Component Table n (where n equals the CDT # used during
the last run)
7111-7126
Response Factors (#1-16), Component Table n (where n equals the CDT # used during
the last run)
7127-7162
Averages, User-define 1-36
Note: Registers 7127-7141 are copies of registers 7055-7069.
7163-7198
Maximum values from averages, User-define 1-36
7199-7234
Minimum values from averages, User-define 1-36
7235-7270
First (most recent) archive of averages, User-define 1-36
Note: Registers 7235-7249 are copies of registers 7070-7084.
7271-7306
First (most recent) archive of maximum values from averages, User-define 1-36
7307-7342
First (most recent) archive of minimum values from averages, User-define 1-36
7343-7378
Second archive of averages, User-define 1-36
7379-7414
Second archive of maximum values from averages, User-define 1-36
7415-7450
Second archive of minimum values from averages, User-define 1-36
7451-7486
Third (oldest) archive of averages, User-define 1-36
7487-7522
Third (oldest) archive of maximum values from averages, User-define 1-36
7523-7558
Third (oldest) archive of minimum values from averages, User-define 1-36
Table C-7 SIM_2251 Modbus Communication Indices
Reg.
No.
Description: RW = read/write (1) or read-only (0)
LEN = length
REGS = number of Modbus registers required
RW
TYPE
LEN
REGS
VARIABLE NAME, POINTER, OR DESCRIPTION
9001
0
string
6
3
device model number
9004
0
string
4
2
software revision
9006
1
integer
2
1
system time month (1-12)
9007
1
integer
2
1
system time day (1-31)
9008
1
integer
2
1
system time year (0-99)
C-14
MON20/20 Software for Gas Chromatographs
User Manual
OCTOBER 2010
3-9000-745
Table C-7 SIM_2251 Modbus Communication Indices
Reg.
No.
Description: RW = read/write (1) or read-only (0)
LEN = length
REGS = number of Modbus registers required
RW
TYPE
LEN
REGS
VARIABLE NAME, POINTER, OR DESCRIPTION
9009
1
integer
2
1
system time hour (0-23)
9010
1
integer
2
1
system time minutes (0-59)
9011
1
integer
2
1
system time seconds (0-59)
9012
1
integer
2
1
system time day (0-6)
9013
0
integer
2
1
plug ID (Modbus or Device ID, per DIP switch settings)
9014
1
long
4
2
site ID
9016
0
string
12
5
device serial number
9022
0
integer
2
1
analysis time 1
9023
0
integer
2
1
analysis time 2 (for dual detector system)
9024
0
integer
2
1
cycle time 1
9025
0
integer
2
1
cycle time 2 (for dual detector system)
9026
0
integer
2
1
run time 1
9027
0
integer
2
1
run time 2 (for dual detector system)
9028
0
integer
2
1
current stream 1
9029
0
integer
2
1
current stream 2 (for dual detector system)
9030
0
integer
2
1
system mode 1
9031
0
integer
2
1
system mode 2 (for dual detector system)
9032
0
integer
2
1
calibrating 1
9033
0
integer
2
1
calibrating 2 (for dual detector system)
9034
0
integer
2
1
active alarm (red light at GC controller)
9035
0
integer
2
1
unack’d alarm (yellow light at GC controller)
9036
0
integer
2
1
hourly average reset - year
9037
0
integer
2
1
hourly average reset - month
9038
0
integer
2
1
hourly average reset - day
9039
0
integer
2
1
hourly average reset - hour
9040
0
integer
2
1
hourly average reset - minutes
9041
0
integer
2
1
24-hour average reset - year
9042
0
integer
2
1
24-hour average reset - month
9043
0
integer
2
1
24-hour average reset - day
C-15
User Manual
MON20/20 Software for Gas Chromatographs
3-9000-745
OCTOBER 2010
Table C-7 SIM_2251 Modbus Communication Indices
Reg.
No.
Description: RW = read/write (1) or read-only (0)
LEN = length
REGS = number of Modbus registers required
RW
TYPE
LEN
REGS
VARIABLE NAME, POINTER, OR DESCRIPTION
9044
0
integer
2
1
24-hour average reset - hour
9045
0
integer
2
1
24-hour average reset - minutes
9046
0
integer
2
1
weekly average reset - year
9047
0
integer
2
1
weekly average reset - month
9048
0
integer
2
1
weekly average reset - day
9049
0
integer
2
1
weekly average reset - hour
9050
0
integer
2
1
weekly average reset - minutes
9051
0
integer
2
1
monthly average reset - year
9052
0
integer
2
1
monthly average reset - month
9053
0
integer
2
1
monthly average reset - day
9054
0
integer
2
1
monthly average reset - hour
9055
0
integer
2
1
monthly average reset - minutes
9056
0
integer
2
1
variable average reset - year
9057
0
integer
2
1
variable average reset - month
9058
0
integer
2
1
variable average reset - day
9059
0
integer
2
1
variable average reset - hour
9060
0
integer
2
1
variable average reset - minutes
C-16
Appendix D, Basic and advanced system variables
D
D.1
GPA system variables
Group
Basic Calculations
Advanced Calculations
Analysis Component
Mole %
Weight %
Weight % Carbon
Liquid Volume %
Gal/1000 SCF
GPA Real Rel Den Gas
HV Gross BTU Dry
HV Net BTU Dry
HV Gross BTU/lb Dry
HV Sup MJ/m3 Dry
HV Inf MJ/m3 Dry
HV Sup MJ/kg Dry
HV Inf MJ/kg Dry
Peak Area
Peak Height
Peak Width @ Half-Height
Component Number
Mole %
Weight %
Weight % Carbon
Liquid Volume %
Gal/1000 SCF
Response Factor
Retention Time
GPA Real Rel Den Gas
HV Gross BTU Dry
HV Net BTU Dry
HV Gross BTU/lb Dry
HV Sup MJ/m3 Dry
HV Inf MJ/m3 Dry
HV Sup MJ/kg Dry
HV Inf MJ/kg Dry
Peak Area
Peak Height
Peak Width @ Half-Height
Component Number
D-1
System Reference Manual
3-9000-744
700XA Gas Chromatograph
OCTOBER 2010
Group
Basic Calculations
Advanced Calculations
Analysis Stream
Avg Molecular Weight
Base Pressure
Base Temperature
GPA Z Factor
GPA Real Rel Den Gas
GPA Wobbe Index
Gas Den lbm/1000 ft3
HV Gross BTU Dry
HV Gross BTU Sat
HV Net BTU Dry
HV Net BTU Sat
HV Gross BTU/lb Dry
HV Sup MJ/m3 Dry
HV Sup MJ/m3 Sat
HV Inf MJ/m3 Dry
HV Inf MJ/m3 Sat
HV Sup MJ/kg Dry
HV Inf MJ/kg Dry
HV Sup Kcal/kg Dry
HV Inf Kcal/kg Dry
Reid Vapor Press
Start Time
Total Unnormalized Conc
Weight % Carbon
Weight % C from Methane
Analysis Time
Avg Molecular Weight
Base Pressure
Base Temperature
CricondenTherm Pres
CricondenTherm Temp Cycle Time
Dewpoint Pres
Dewpoint Temp
GPA Z Factor
GPA Gas Den kg/m3
GPA Real Rel Den Gas
GPA Wobbe Index
Gal/1000 SCF C2+
Gal/1000 SCF C3+
Gal/1000 SCF C4+
Gal/1000 SCF C5+
Gal/1000 SCF C6+
Gas Den lbm/1000 ft3
HV Gross BTU Dry
HV Gross BTU Sat
HV Gross BTU Act
HV Net BTU Dry
HV Net BTU Sat
HV Net BTU Act
HV Gross BTU/lb Dry
D-2
700XA Gas Chromatograph
System Reference Manual
OCTOBER 2010
Group
Analysis Stream
(cont.)
3-9000-744
Basic Calculations
Advanced Calculations
HV Sup MJ/m3 Dry
HV Sup MJ/m3 Sat
HV Sup MJ/m3 Act
HV Inf MJ/m3 Dry
HV Inf MJ/m3 Sat
HV Inf MJ/m3 Act
HV Sup MJ/kg Dry
HV Inf MJ/kg Dry
HV Sup Kcal/m3 Dry
HV Sup Kcal/m3 Sat
HV Sup Kcal/m3 Act
HV Inf Kcal/m3 Dry
HV Inf Kcal/m3 Sat
HV Inf Kcal/m3 Act
HV Sup Kcal/kg Dry
HV Inf Kcal/kg Dry
Liquid Density lb/gal
Liquid Density kg/m3
No of Peaks Found
No of Comp
Reid Vapor Press
Rel Den Liq @ 60F
Rel Den Liq @ 15C
Start Time
Total Unnormalized Conc
Weight % Carbon
Weight % C from Methane
D-3
System Reference Manual
700XA Gas Chromatograph
3-9000-744
OCTOBER 2010
Group
Basic Calculations
Advanced Calculations
Analysis Optional
Base Pressures
n/a
Opt Base Pressure
Gal/1000 SCF C2+
Gal/1000 SCF C3+
Gal/1000 SCF C4+
Gal/1000 SCF C5+
Gal/1000 SCF C6+
HV Gross BTU Dry
HV Gross BTU Sat
HV Gross BTU Act
HV Net BTU Dry
HV Net BTU Sat
HV Net BTU Act
HV Sup MJ/m3 Dry
HV Sup MJ/m3 Sat
HV Sup MJ/m3 Act
HV Inf MJ/m3 Dry
HV Inf MJ/m3 Sat
HV Inf MJ/m3 Act
HV Sup Kcal/m3 Dry
HV Sup Kcal/m3 Sat
HV Sup Kcal/m3 Act
HV Inf Kcal/m3 Dry
HV Inf Kcal/m3 Sat
HV Inf Kcal/m3 Act
Calibration
n/a
Area or Height
Component
n/a
Resp Factor
Resp Factor % Dev
Ret Time
Ret Time % Dev
Component Number
Calibration Stream
n/a
Start Time
Final Calibration
Component
Calib Conc
Old Resp Factor
New Resp Factor
New RF Update Flag
Resp Factor % Dev
Old Ret Time
New Ret Time
New RT Update Flag
Ret Time % Dev
Component Number
Calib Conc
Old Resp Factor
New Resp Factor
New RF Update Flag
Resp Factor % Dev
Old Ret Time
New Ret Time
New RT Update Flag
Ret Time % Dev
Component Number
D-4
700XA Gas Chromatograph
System Reference Manual
OCTOBER 2010
3-9000-744
Group
Basic Calculations
Advanced Calculations
Final Calibration
Stream
RF Dev Alarm
Start Time
GPA Z Factor
GPA Real Rel Den Gas
GPA Wobbe Index
HV Gross BTU Dry
HV Gross BTU Sat
RF Dev Alarm
Start Time
Total Unnormalized Conc
Last Analysis
Component
Mole %
Weight %
Weight % Carbon
Liquid Volume %
Gal/1000 SCF
GPA Real Rel Den Gas
HV Gross BTU Dry
HV Net BTU Dry
HV Gross BTU/lb Dry
HV Sup MJ/m3 Dry
HV Inf MJ/m3 Dry
HV Sup MJ/kg Dry
HV Inf MJ/kg Dry
Peak Area
Peak Height
Peak Width @ Half-Height
Component Number
Mole %
Weight %
Weight % Carbon
Liquid Volume %
Gal/1000 SCF
Response Factor
Retention Time
GPA Real Rel Den Gas
HV Gross BTU Dry
HV Net BTU Dry
HV Gross BTU/lb Dry
HV Sup MJ/m3 Dry
HV Inf MJ/m3 Dry
HV Sup MJ/kg Dry
HV Inf MJ/kg Dry
Peak Area
Peak Height
Peak Width @ Half-Ht
Component Number
D-5
System Reference Manual
700XA Gas Chromatograph
3-9000-744
OCTOBER 2010
Group
Basic Calculations
Advanced Calculations
Last Analysis Stream
Avg Molecular Weight
Base Pressure
Base Temperature
GPA Z Factor
GPA Real Rel Den Gas
GPA Wobbe Index
Gas Den lbm/1000 ft3
HV Gross BTU Dry
HV Gross BTU Sat
HV Net BTU Dry
HV Net BTU Sat
HV Gross BTU/lb Dry
HV Sup MJ/m3 Dry
HV Sup MJ/m3 Sat
HV Inf MJ/m3 Dry
HV Inf MJ/m3 Sat
HV Sup MJ/kg Dry
HV Inf MJ/kg Dry
HV Sup Kcal/kg Dry
HV Inf Kcal/kg Dry
Is Cal Run
Reid Vapor Press
Start Time
Stream No
Total Unnormalized Conc
Weight % Carbon
Weight % C from Methane
Analysis Time
Avg Molecular Weight
Base Pressure
Base Temperature
CricondenTherm Pres
CricondenTherm Temp
Cycle Time
Dewpoint Pres
Dewpoint Temp
GPA Z Factor
GPA Gas Den kg/m3
GPA Real Rel Den Gas
GPA Wobbe Index
Gal/1000 SCF C2+
Gal/1000 SCF C3+
Gal/1000 SCF C4+
Gal/1000 SCF C5+
Gal/1000 SCF C6+
Gas Den lbm/1000 ft3
HV Gross BTU Dry
HV Gross BTU Sat
HV Gross BTU Act
HV Net BTU Dry
HV Net BTU Sat
HV Net BTU Act
HV Gross BTU/lb Dry
HV Sup MJ/m3 Dry
HV Sup MJ/m3 Sat
HV Sup MJ/m3 Act
HV Inf MJ/m3 Dry
HV Inf MJ/m3 Sat
HV Inf MJ/m3 Act
HV Sup MJ/kg Dry
HV Inf MJ/kg Dry
HV Sup Kcal/m3 Dry
HV Sup Kcal/m3 Sat
HV Sup Kcal/m3 Act
HV Inf Kcal/m3 Dry
HV Inf Kcal/m3 Sat
HV Inf Kcal/m3 Act
HV Sup Kcal/kg Dry
HV Inf Kcal/kg Dry
Is Cal Run
Liquid Density lb/gal
Liquid Density kg/m3
No of Peaks Found
No of Comp
D-6
700XA Gas Chromatograph
System Reference Manual
OCTOBER 2010
Group
3-9000-744
Basic Calculations
Last Analysis Stream
(cont.)
Advanced Calculations
Reid Vapor Press
Rel Den Liq @ 60F
Rel Den Liq @ 15C
Start Time
Stream No
Total Unnormalized Conc
Weight % Carbon
Weight % C from Methane
Last Analysis
Optional Base
Pressures
n/a
Opt Base Pressure
Gal/1000 SCF C2+
Gal/1000 SCF C3+
Gal/1000 SCF C4+
Gal/1000 SCF C5+
Gal/1000 SCF C6+
HV Gross BTU Dry
HV Gross BTU Sat
HV Gross BTU Act
HV Net BTU Dry
HV Net BTU Sat
HV Net BTU Act
HV Sup MJ/m3 Dry
HV Sup MJ/m3 Sat
HV Sup MJ/m3 Act
HV Inf MJ/m3 Dry
HV Inf MJ/m3 Sat
HV Inf MJ/m3 Act
HV Sup Kcal/m3 Dry
HV Sup Kcal/m3 Sat
HV Sup Kcal/m3 Act
HV Inf Kcal/m3 Dry
HV Inf Kcal/m3 Sat
HV Inf Kcal/m3 Act
Last Calibration
Component
n/a
Area or Height
Resp Factor
Ret Time
Component Number
Last Calibration
Stream
n/a
Start Time
Stream No
Last Final Calibration
Component
Calib Conc
Old Resp Factor
New Resp Factor
New RF Update Flag
Resp Factor % Dev
Old Ret Time
New Ret Time
New RT Update Flag
Ret Time % Dev
Component Number
Calib Conc
Old Resp Factor
New Resp Factor
New RF Update Flag
Resp Factor % Dev
Old Ret Time
New Ret Time
New RT Update Flag
Ret Time % Dev
Component Number
D-7
System Reference Manual
700XA Gas Chromatograph
3-9000-744
OCTOBER 2010
Group
Basic Calculations
Advanced Calculations
Last Final Calibration
RF Dev Alarm
Start Time
GPA Z Factor
GPA Real Rel Den Gas
Stream
Stream No
GPA Wobbe Index
HV Gross BTU Dry
HV Gross BTU Sat
RF Dev Alarm
Start Time
Stream No
Total Unnormalized Conc
Hardware - Heaters
Temperature
Temperature
Hardware - Valves
Current Value
Current Value
Hardware - Discrete
Inputs
Current Value
Current Value
Hardware - Discrete
Outputs
Current Value
Current Value
Hardware - Analog
Inputs
Current Value
Current Value
Hardware - Analog
Outputs
Current Value
Current Value
Application - System
Default Stream Sequence
Default Stream Sequence
Application Component Data
Table
n/a
Det #
Ret Time
Resp Fact
Calib Conc
RT Secs Dev
Resp Fact %
Gross Dry BTU
Net Dry BTU
Gross Dry BTU/lb
HV Sup MJ/m3
HV Inf MJ/m3
HV Sup MJ/kg
HV Inf MJ/kg
Gals/1000 SCF
Reid Vapor
LBs/Gallon
Rel Dens Gas
Rel Dens Liquid
Mole Weight
Carbon Weight
Rel Resp Fact
Multi-level Calib 'a'
Multi-level Calib 'b'
Multi-level Calib 'c'
Multi-level Calib 'd'
D-8
700XA Gas Chromatograph
System Reference Manual
OCTOBER 2010
3-9000-744
Group
Basic Calculations
Advanced Calculations
Application Validation Data Table
n/a
Nominal Value
Percent Deviation
Application Averages
Min
Max
Avg
Samples
Min
Max
Avg
Samples
Application - User
Defined Calculation
Calc Result
Calc Result
Application - Limit
Alarms
Alarm Low On
Alarm High On
Alarm Low On
Alarm High On
Value Causing Alarm
Violated Alarm Limit
Date
Application - System
Alarms
Alarm On
Alarm On
Value Causing Alarm
Violated Alarm Limit
Date
Application - Streams
n/a
Usage
TEV
Total Runs
Avg Runs
Start Time
Interval
Calibration Stream
Base Pressure
Base Temperature
Optional Pressure 1
Optional Pressure 2
Optional Pressure 3
Next Cal/Val Time
Status
Validation
Average Value
Current Value
Average Value
Current Value
GC Control
Auto Sequence
Halt
Single Stream
Calibration
Validation
Auto Sequence
Halt
Single Stream
Calibration
Validation
D-9
System Reference Manual
700XA Gas Chromatograph
3-9000-744
OCTOBER 2010
Group
Basic Calculations
Advanced Calculations
GC Status
Current Stream
Last Stream
Cycle Clock Counter
Cycle Time
Anly Time
Current Mode
Next Stream
Last Mode
Calibration Failed
Validation Failed
Cycle Complete Pulse
Current Day
Current Month
Current Year
Current Hour
Current Minute
Current Second
Active Alarm Flag
UnAck Alarm Flag
Current Stream
Last Stream
Cycle Clock Counter
Cycle Time
Anly Time
Current Mode
Next Stream
Last Mode
Calibration Failed
Validation Failed
Cycle Complete Pulse
Current Day
Current Month
Current Year
Current Hour
Current Minute
Current Second
Active Alarm Flag
UnAck Alarm Flag
D.2
ISO system variables
Group
Basic Calculations
Advanced Calculations
Analysis Component
Mole %
Weight %
Liquid Volume %
ISO CV Sup Dry - Pri
ISO CV Inf Dry - Pri
ISO CV Sup Dry - Sec
ISO CV Inf Dry - Sec
Peak Area
Peak Height
Peak Width @ Half-Height
Component Number
Mole %
Weight %
Liquid Volume %
Response Factor
Retention Time
ISO CV Sup Dry - Pri
ISO CV Inf Dry - Pri
ISO CV Sup Dry - Sec
ISO CV Inf Dry - Sec
Peak Area
Peak Height
Peak Width @ Half-Height
Component Number
D-10
700XA Gas Chromatograph
System Reference Manual
OCTOBER 2010
3-9000-744
Group
Basic Calculations
Advanced Calculations
Analysis Stream
Avg Molecular Weight
Base Pressure
Start Time
Total Unnormalized Conc
ISO Temp RefC - Pri
ISO Temp RefV - Pri
ISO CV Sup Dry - Pri
ISO CV Sup Sat - Pri
ISO CV Inf Dry - Pri
ISO CV Inf Sat - Pri
ISO Gas Den kg/m3 - Pri
ISO Real Rel Den Gas - Pri
ISO Wobbe Index Sup - Pri
ISO Wobbe Index Inf - Pri
Avg Molecular Weight
Base Pressure
Start Time
Total Unnormalized Conc
ISO Temp RefC - Pri
ISO Temp RefV - Pri
ISO CV Sup Dry - Pri
ISO CV Sup Sat - Pri
ISO CV Inf Dry - Pri
ISO CV Inf Sat - Pri
ISO Gas Den kg/m3 - Pri
ISO Real Rel Den Gas - Pri
ISO Wobbe Index Sup - Pri
ISO Wobbe Index Inf - Pri
ISO CV Sup Dry - Pri
ISO CV Sup Sat - Pri
ISO CV Inf Dry - Pri
ISO CV Inf Sat - Pri
ISO CV Sup Dry - Sec
ISO CV Sup Sat - Sec
ISO CV Inf Dry - Sec
ISO CV Inf Sat - Sec
ISO Z Factor - Pri
ISO Z Factor - Sec
ISO Gas Den kg/m3 - Pri
ISO Gas Den kg/m3 - Sec
ISO Real Rel Den Gas - Pri
ISO Real Rel Den Gas - Sec
ISO Wobbe Index Sup - Pri
ISO Wobbe Index Sup - Sec
ISO Wobbe Index Inf - Pri
ISO Wobbe Index Inf - Sec
ISO Soot Index
ISO Incomp Combustion Fact
ISO Latent Heat Cap Ratio
Analysis Optional
Base Pressures
n/a
Opt Base Pressure
ISO CV Sup Dry - Pri
ISO CV Sup Sat - Pri
ISO CV Inf Dry - Pri
ISO CV Inf Sat - Pri
ISO CV Sup Dry - Sec
ISO CV Sup Sat - Sec
ISO CV Inf Dry - Sec
ISO CV Inf Sat - Sec
Calibration
n/a
Area or Height
D-11
System Reference Manual
700XA Gas Chromatograph
3-9000-744
OCTOBER 2010
Group
Basic Calculations
Advanced Calculations
Component
n/a
Resp Factor
Resp Factor % Dev
Ret Time
Ret Time % Dev
Component Number
Calibration Stream
n/a
Start Time
Final Calibration
Component
Calib Conc
Old Resp Factor
New Resp Factor
New RF Update Flag
Resp Factor % Dev
Old Ret Time
New Ret Time
New RT Update Flag
Ret Time % Dev
Component Number
Calib Conc
Old Resp Factor
New Resp Factor
New RF Update Flag
Resp Factor % Dev
Old Ret Time
New Ret Time
New RT Update Flag
Ret Time % Dev
Component Number
Final Calibration
Stream
RF Dev Alarm
Start Time
ISO CV Sup Dry - Pri
ISO CV Sup Sat - Pri
ISO Z Factor - Pri
ISO Real Rel Den Gas - Pri
ISO Wobbe Index Sup - Pri
RF Dev Alarm
Start Time
Total Unnormalized Conc
Last Analysis
Component
Mole %
Weight %
Liquid Volume %
ISO CV Sup Dry - Pri
ISO CV Inf Dry - Pri
ISO CV Sup Dry - Sec
ISO CV Inf Dry - Sec
Peak Area
Peak Height
Peak Width @ Half-Ht
Component Number
Mole %
Weight %
Liquid Volume %
Response Factor
Retention Time
ISO CV Sup Dry - Pri
ISO CV Inf Dry - Pri
ISO CV Sup Dry - Sec
ISO CV Inf Dry - Sec
Peak Area
Peak Height
Peak Width @ Half-Ht
Component Number
D-12
700XA Gas Chromatograph
System Reference Manual
OCTOBER 2010
3-9000-744
Group
Basic Calculations
Advanced Calculations
Last Analysis Stream
Avg Molecular Weight
Base Pressure
Is Cal Run
Start Time
Stream No
Total Unnormalized Conc
ISO Temp RefC - Pri
ISO Temp RefV - Pri
ISO CV Sup Dry - Pri
ISO CV Sup Sat - Pri
ISO CV Inf Dry - Pri
ISO CV Inf Sat - Pri
ISO Gas Den kg/m3 - Pri
ISO Real Rel Den Gas - Pri
ISO Wobbe Index Sup - Pri
ISO Wobbe Index Inf - Pri
Analysis Time
Avg Molecular Weight
Base Pressure
CricondenTherm Pres
CricondenTherm Temp
Cycle Time
Dewpoint Pres
Dewpoint Temp
Is Cal Run
No of Peaks Found
No of Comp
Reid Vapor Press
Rel Den Liq @ 60F
Rel Den Liq @ 15C
Start Time
Stream No
Total Unnormalized Conc
ISO Temp RefC - Pri
ISO Temp RefV - Pri
ISO Temp RefC - Sec
ISO Temp RefV - Sec
ISO CV Sup Dry - Pri
ISO CV Sup Sat - Pri
ISO CV Inf Dry - Pri
ISO CV Inf Sat - Pri
ISO CV Sup Dry - Sec
ISO CV Sup Sat - Sec
ISO CV Inf Dry - Sec
ISO CV Inf Sat - Sec
ISO Z Factor - Pri
ISO Z Factor - Sec
ISO Gas Den kg/m3 - Pri
ISO Gas Den kg/m3 - Sec
ISO Real Rel Den Gas - Pri
ISO Real Rel Den Gas - Sec
ISO Wobbe Index Sup - Pri
ISO Wobbe Index Sup - Sec
ISO Wobbe Index Inf - Pri
ISO Wobbe Index Inf - Sec
ISO Soot Index
ISO Incomp Combustion Fact
ISO Latent Heat Cap Ratio
Last Analysis
Optional Base
Pressures
n/a
Opt Base Pressure
ISO CV Sup Dry - Pri
ISO CV Sup Sat - Pri
ISO CV Inf Dry - Pri
ISO CV Inf Sat - Pri
ISO CV Sup Dry - Sec
ISO CV Sup Sat - Sec
ISO CV Inf Dry - Sec
ISO CV Inf Sat - Sec
D-13
System Reference Manual
700XA Gas Chromatograph
3-9000-744
OCTOBER 2010
Group
Basic Calculations
Advanced Calculations
Last Calibration
Component
n/a
Area or Height
Resp Factor
Ret Time
Component Number
Last Calibration
Stream
n/a
Start Time
Stream No
Last Final Calibration
Component
Calib Conc
Old Resp Factor
New Resp Factor
New RF Update Flag
Resp Factor % Dev
Old Ret Time
New Ret Time
New RT Update Flag
Ret Time % Dev
Component Number
Calib Conc
Old Resp Factor
New Resp Factor
New RF Update Flag
Resp Factor % Dev
Old Ret Time
New Ret Time
New RT Update Flag
Ret Time % Dev
Component Number
Last Final Calibration
RF Dev Alarm
Start Time
ISO CV Sup Dry - Pri
ISO CV Sup Sat - Pri
Stream
Stream No
ISO Z Factor - Pri
ISO Real Rel Den Gas - Pri
ISO Wobbe Index Sup - Pri
RF Dev Alarm
Start Time
Stream No
Total Unnormalized Conc
Hardware - Heaters
Temperature
Temperature
Hardware - Valves
Current Value
Current Value
Hardware - Discrete
Inputs
Current Value
Current Value
Hardware - Discrete
Outputs
Current Value
Current Value
Hardware - Analog
Inputs
Current Value
Current Value
Hardware - Analog
Outputs
Current Value
Current Value
Application - System
Default Stream Sequence
Default Stream Sequence
D-14
700XA Gas Chromatograph
System Reference Manual
OCTOBER 2010
3-9000-744
Group
Basic Calculations
Advanced Calculations
Application Component Data
Table
n/a
Det #
Ret Time
Resp Fact
Calib Conc
RT Secs Dev
Resp Fact %
Sum Factor - Pri
Sum Factor - Sec
CV Sup KJ/mol - Pri
CV Inf KJ/mol - Pri
CV Sup KJ/mol - Sec
CV Inf KJ/mol - Sec
Rel Dens Gas
Rel Dens Liquid
Mole Weight
Rel Resp Fact
Multi-level Calib 'a'
Multi-level Calib 'b'
Multi-level Calib 'c'
Multi-level Calib 'd'
Application Validation Data Table
n/a
Percent Deviation
Percent Deviation
Application Averages
Min
Max
Avg
Samples
Min
Max
Avg
Samples
Application - User
Defined Calculation
Calc Result
Calc Result
Application - Limit
Alarms
Alarm Low On
Alarm High On
Alarm Low On
Alarm High On
Value Causing Alarm
Violated Alarm Limit
Date
Application - System
Alarms
Alarm On
Alarm On
Value Causing Alarm
Violated Alarm Limit
Date
D-15
System Reference Manual
700XA Gas Chromatograph
3-9000-744
OCTOBER 2010
Group
Basic Calculations
Advanced Calculations
Application - Streams
n/a
Usage
TEV
Total Runs
Avg Runs
Start Time
Interval
Calibration Stream
Base Pressure
Optional Pressure 1
Optional Pressure 2
Optional Pressure 3
Next Cal/Val Time
Status
Validation
Average Value
Current Value
Average Value
Current Value
GC Control
Auto Sequence
Halt
Single Stream
Calibration
Validation
Auto Sequence
Halt
Single Stream
Calibration
Validation
GC Status
Current Stream
Last Stream
Cycle Clock Counter
Cycle Time
Anly Time
Current Mode
Next Stream
Last Mode
Calibration Failed
Validation Failed
Cycle Complete Pulse
Current Day
Current Month
Current Year
Current Hour
Current Minute
Current Second
Active Alarm Flag
UnAck Alarm Flag
Current Stream
Last Stream
Cycle Clock Counter
Cycle Time
Anly Time
Current Mode
Next Stream
Last Mode
Calibration Failed
Validation Failed
Cycle Complete Pulse
Current Day
Current Month
Current Year
Current Hour
Current Minute
Current Second
Active Alarm Flag
UnAck Alarm Flag
D-16
700XA Gas Chromatograph
OCTOBER 2010
System Reference Manual
3-9000-744
This page is intentionally left blank.
D-17
System Reference Manual
3-9000-744
D-18
700XA Gas Chromatograph
OCTOBER 2010
Appendix E, Creating custom calculations
To create or edit a customized calculation using GC analysis data, do the
following:
1. Select Applications → Calculations → User Defined.... The User
Defined Calculations window appears, containing a list of all the userdefined calculations that are available to the GC.
Figure E-1. The User Defined Calculations window
2. Click Insert before to add a row to the User Defined Calculations
table.
Note
To delete this--or any--row from the table, click Delete.
3. Double-click the Label cell and enter a name for the calculation you
are about to create. If you want to enter a short description for the
new calculation, double-click the Comment cell and enter it there.
E-1
User Manual
MON20/20 Software for Gas Chromatographs
3-9000-745
OCTOBER 2010
4. Click Edit. The Edit User-defined Calculation window appears.
Figure E-2. The Edit User-defined Calculation window
A
B
C
E
D
F
In MON 20/20, building a calculation is similar to building a simple
program. You have constants and two types of variables available, as
well as two calculation-building commands. You can also add
comments that will be ignored by the application but that can help you
explain the logic and structure of the calculation you are designing.
E-2
MON20/20 Software for Gas Chromatographs
OCTOBER 2010
User Manual
3-9000-745
The following is a description of the design elements of the Edit Userdefined Calculation window:
• Element A - Called the Calculation Steps Viewer, this element
displays the line-by-line construction of the calculation as it is
being built. The following commands allow you to interact with
this area:
• Click Clear All to clear the content of the Calculation Steps
Viewer.
• Click Clear Line to clear the content of the selected line.
Note
If the selected line is an "If-Then" statement, then the entire condition is cleared. This
button is disabled when the cursor is on an "else" or "endif" condition.
• Click Delete Line to delete the selected line.
Note
If the selected line is the beginning of a conditional statement, then the entire "If-Then"
block will be deleted along with the expressions that constitute the "If-Then" construct.
If the selected line is part of the conditional "If-Then" construct—that is, the line only
has "Else" or "Endif" in it—then the entire "If-Then" construct will be deleted.
• Click Copy to copy the selected line to the clipboard. You cannot
copy keywords such as “else” or “endif.”
• Click Paste to paste the content of the clipboard into a selected
line. If the line already has a calculation in it, it is cleared before
the content of the clipboard is pasted into it.
• Element B - A drop-down menu with the following three
commands:
• Insert Comment - Adds a comment to the calculation. Each
comment is preceded by “//.”
• Insert Condition - Adds an “If-Then” statement to the
calculation.
• Insert Expression - Adds a mathematical expression to the
calculation.
• Element C - Also called the Expression Editor, this section is the
work area where the comment, condition or expression is built
E-3
User Manual
MON20/20 Software for Gas Chromatographs
3-9000-745
OCTOBER 2010
before being added to the Calculation Steps Viewer. There are four
modes of the Expression Editor, depending upon what action is
being performed:
Figure E-3. Expression Editor - No Action
Figure E-4. Expression Editor - Insert Comment
Figure E-5. Expression Editor - Insert Condition
Figure E-6. Expression Editor - Insert Expression
E-4
MON20/20 Software for Gas Chromatographs
User Manual
OCTOBER 2010
3-9000-745
The following commands allow you to interact with the Expression
Editor:
• Click Clear to clear the content of the entire line. The line itself
is not deleted.
• Click Delete Item to delete the currently active token. Each
mathematical function, numeric data, and mathematical
operation is treated as a token. The token to the right of the
current cursor location is treated as the currently active token.
• Click Evaluate Exp to check the validity of the expression. If
any errors are detected in the syntax, then an error will be
reported in the Output window.
Note
This button is only active when the line being edited is an expression.
• Click Done to evaluate the expression and copy it to the
Calculations Steps Viewer. If there are any errors in the
expression, they are reported in the Output window.
• Element D - This section contains calculator functions that can be
used to build a mathematical expression. This section can be
divided into two parts:
Figure E-7. Calculator functions
1
2
E-5
User Manual
MON20/20 Software for Gas Chromatographs
3-9000-745
OCTOBER 2010
• Section 1 - This section contains the following keys:
x^y
x to the power of y
SQRT
Square Root
abs
Absolute Value
sin
Sine
cos
Cosine
tan
Tan
log10
Logarithm to the base 10
log2
Logarithm to the base 2
ln
Logarithm to the base e
and
Logical AND
or
Logical OR
xor
Logical XOR
(
Open bracket
)
Close bracket
• Section 2 - This section contains the traditional calculator keys
and can be used with your keyboard’s Numpad.
Note
Make sure to engage your keyboard’s Numlock before using the Numpad.
• Section E - This section contains drop-down menus and buttons
that allow you to create and select constants and variables that can
be added to your mathematical expressions.
E-6
MON20/20 Software for Gas Chromatographs
User Manual
OCTOBER 2010
3-9000-745
• Constants - Allows you to select constants from a drop-down
list.
• Temporary Variables - Allows you to select temporary, usercreated variables from a drop-down list.
• System Variables - Allows you to select system variables.
• Edit Temporary Variables - Allows you to create variables.
• Edit Constants - Allows you to create system-wide constants
that can be used in user-defined calculations.
• Section F - This section, called the Output Display, displays
status information.
5. Use the following procedures to build your calculation in the
Calculation Steps Viewer:
•
•
•
•
•
•
•
“Inserting a comment” on page E-7
“Inserting a conditional statement” on page E-9
“Inserting an expression” on page E-11
“Creating a constant” on page E-14
“Creating or editing a temporary variable” on page E-15
“Inserting a system variable” on page E-16
“Using user-defined calculations” on page E-17
6. To see the result of the calculation, click Calculate. The results
display in the Output window. To validate the calculation for errors,
click Evaluate. The results of the validation check display in the
Output window. To save the calculation and to close the Edit Userdefined Calculation window, click OK.
7. On the User Defined Calculations window, to save the changes
without closing the window, click Save. To save the changes and close
the window, click OK.
E.1
Inserting a comment
To add a comment to the calculation, do the following:
1. Click on the Insert drop-down list and select Insert Comment. A
new line will be added to the Calculation Steps Viewer and the
Expression Editor will switch to Edit Comment mode.
E-7
User Manual
3-9000-745
MON20/20 Software for Gas Chromatographs
OCTOBER 2010
Figure E-8. Edit Comment mode
2. Enter the comment into the Edit Comment textbox and then click
Done. The comment will be added to the Calculation Steps
Viewer.
Figure E-9. Calculation Steps Viewer
E-8
MON20/20 Software for Gas Chromatographs
User Manual
OCTOBER 2010
E.2
3-9000-745
Inserting a conditional statement
Figure E-10. An example of a conditional statement
The Expression Editor in Edit Condition mode allows you to build the
first line of the conditional statement:
Figure E-11. The Expression Editor in Edit Condition mode
Regular expression
Variables/Constants
Relational operator
Expressions are built using the Expression Editor in Edit Expression
mode.
To add a conditional statement, do the following:
E-9
User Manual
MON20/20 Software for Gas Chromatographs
3-9000-745
OCTOBER 2010
1. Click on the Insert drop-down list and select Insert Condition. A
new line is added to the Calculation Steps Viewer and the
Expression Editor switches to Edit Condition mode.
2. Add an expression. You can use constants, temporary variables,
system variables, and the calculator functions to build the expression.
For information on inserting system variables, see page E-16. For
information on creating variables, see page E-15. For information on
creating constants, see page E-14.
Figure E-12. Edit Expression area
3. Select a relational operator from the drop-down list. You have the
following options:
<
Less than
<=
Less than or equal
>
Greater than
>=
Greater than or equal
==
Equal
!=
Not equal
4. To add a variable or constant to the expression, click the Variable/
Constant drop-down list and select the appropriate item.
E-10
MON20/20 Software for Gas Chromatographs
OCTOBER 2010
User Manual
3-9000-745
Figure E-13. the Variable/Constant drop-down list
For information on creating variables, see page E-15. For information
on creating constants, see page E-14.
5. Click Done. MON 20/20 validates the statement and if there are no
errors, it adds it to the Calculation Steps Viewer.
Figure E-14. Calculation Steps Viewer
To complete the conditional statement, use the Expression Editor in
Edit Expression mode to add the necessary mathematical expressions.
E.3
Inserting an expression
A mathematical expression has the following structure:
Variable = Regular expression
E-11
User Manual
MON20/20 Software for Gas Chromatographs
3-9000-745
OCTOBER 2010
Figure E-15. Edit Expression area
regular expression
variable
To add an expression to a conditional statement or calculation, do the
following:
1. Click on the Insert drop-down list and select Insert Expression. A
new line is added to the Calculation Steps Viewer and the
Expression Editor switches to Edit Expression mode.
2. Select a variable from the Variable drop-down tree view. You can
select either a temporary variable or you can set the expression you
are building as the final result of your new user-defined calculation.
For instance, if the user-defined calculation you are building is called
‘User Calc 1,’ then you can select User Calc 1 from the Final Result
tree view. For information on creating variables, see “Creating or
editing a temporary variable” on page E-15.
Figure E-16. The Final Result tree view
E-12
MON20/20 Software for Gas Chromatographs
OCTOBER 2010
User Manual
3-9000-745
3. Add a regular expression. You can use constants, temporary
variables, system variables, and the calculator functions to build the
expression. For information on inserting system variables, see
page E-16. For information on creating variables, see page E-15. For
information on creating constants, see page E-14.
Figure E-17. The Edit Expression area
4. Click Done. MON 20/20 validates the statement and if there are no
errors, it adds it to the Calculation Steps Viewer.
Figure E-18. The Calculation Steps Viewer
E-13
User Manual
MON20/20 Software for Gas Chromatographs
3-9000-745
E.4
OCTOBER 2010
Creating a constant
To create a constant that you can use in building a calculation, do the
following:
1. From the Edit User-defined Calculation window, click Edit
Constants. The Edit Constants window displays, showing all the
constants that have been created so far for the GC.
Figure E-19. The Edit Constants window
2. To create a new constant, click Insert before. A new row will be
added to the USER_CALC_CONSTANTS table.
Note
To delete a constant, select it in the table and click Delete.
3. Double-click the Label cell and enter a name for the constant.
Note
To edit any cell, double-click it.
E-14
MON20/20 Software for Gas Chromatographs
User Manual
OCTOBER 2010
3-9000-745
4. Double-click the Value cell and enter a value for the constant.
5. Use the Comment cell to store information that is relevant for the
constant.
6. To save the changes without closing the window, click Save. To save
the changes and close the window, click OK.
E.5
Creating or editing a temporary variable
To create a temporary variable that you can use in building a calculation,
do the following:
1. From the Edit User-defined Calculation window, click Edit
Temporary Variables. The Edit Temporary Variables window
displays, showing all the temporary variables that have been created
so far for the user-defined calculation.
Figure E-20. The Edit Temporary Variables window
2. To create a new temporary variable, click Insert. A new row will be
added to the table.
E-15
User Manual
3-9000-745
MON20/20 Software for Gas Chromatographs
OCTOBER 2010
Note
To delete a variable from this window, select it in the table and click Delete.
3. Double-click the Name cell and enter a name for the variable.
4. Use the Comment cell to store information that is relevant for the
variable.
5. To save the changes without closing the window, click Save. To save
the changes and close the window, click OK.
E.6
Inserting a system variable
To insert a system variable into the Expression Editor, do the following:
From the Edit User-defined Calculation window, click on the System
Variables drop-down arrow.
For a demonstration of how to use the context-sensitive variable selector,
see “Using the context-sensitive variable selector” on page 1-42.
The selected system variable displays in the System Variables drop-down
box and in the Expression Editor.
E-16
MON20/20 Software for Gas Chromatographs
OCTOBER 2010
User Manual
3-9000-745
Figure E-21. The Expression Editor
E.7
Using user-defined calculations
You can use a previously-created user-defined calculation when building
new calculations by clicking on the System Variables drop-down arrow on
the Edit User-defined Calculation window.
E-17
User Manual
MON20/20 Software for Gas Chromatographs
3-9000-745
OCTOBER 2010
Figure E-22. System Variables drop-down menu
For a demonstration of how to use the context-sensitive variable selector,
see “Using the context-sensitive variable selector” on page 1-42.
The selected system variable displays in the System Variables drop-down
box and in the Expression Editor.
E-18
MON20/20 Software for Gas Chromatographs
OCTOBER 2010
User Manual
3-9000-745
Figure E-23. The Expression Editor
E-19
User Manual
3-9000-745
E-20
MON20/20 Software for Gas Chromatographs
OCTOBER 2010
WARRANTY CLAIM PROCEDURES
To make a warranty claim, you, the Purchaser, must:
1. Provide Daniel Measurement and Control, Inc. or Rosemount
Analytical, Inc. with proof of the Date of Purchase and proof of the
Date of Shipment of the product in question.
2. Return the product to Daniel Measurement Services (DMS) within 12
months of the date of original shipment of the product, or within 18
months of the date of original shipment of the product to destinations
outside of the United States. The Purchaser must prepay any shipping
charges. In addition, the Purchaser is responsible for insuring any
product shipped for return, and assumes the risk of loss of the product
during shipment.
3. To obtain warranty service or to locate the nearest DMS office, sales
office, or service center, do one of the following:
•
Call (713) 827-6380
•
Fax a request to (713) 827-6312
•
Write to:
Daniel Measurement Services
11100 Brittmore Park Drive
Houston, Texas 77041
•
Contact DMS via www.emersonprocess.com/daniel
4. When contacting DMS for product service, the Purchaser is asked to
provide information as indicated on the following page entitled
"Customer Repair Report".
5. For product returns from locations outside the United States, it will be
necessary for you to obtain the import consignment address so that
DMS's customs broker can handle the importation with the U.S.
Customs Service.
6. DMS offers both on call and contract maintenance service designed to
afford single source responsibility for all its products.
7. DMS reserves the right to make changes at any time to any product to
improve its design and to insure the best available product.
This page is intentionally left blank.
CUSTOMER REPAIR REPORT
FOR SERVICE, COMPLETE THIS FORM, AND RETURN IT ALONG WITH THE AFFECTED EQUIPMENT
TO CUSTOMER SERVICE AT THE ADDRESS INDICATED BELOW.
COMPANY NAME: ____________________________________________________________________________
TECHNICAL CONTACT:_____________________________________ PHONE: __________________________
REPAIR P. O. #:________________________ IF WARRANTY, UNIT S/N: ________________________________
INVOICE ADDRESS: ___________________________________________________________________________
_____________________________________________________________________________________________
_____________________________________________________________________________________________
SHIPPING ADDRESS: __________________________________________________________________________
_____________________________________________________________________________________________
_____________________________________________________________________________________________
RETURN SHIPPING METHOD: __________________________________________________________________
EQUIPMENT MODEL #:____________________ S/N:__________________FAILURE DATE: _______________
DESCRIPTION OF PROBLEM:___________________________________________________________________
_____________________________________________________________________________________________
_____________________________________________________________________________________________
WHAT WAS HAPPENING AT TIME OF FAILURE?__________________________________________________
_____________________________________________________________________________________________
ADDITIONAL COMMENTS: ____________________________________________________________________
_____________________________________________________________________________________________
_____________________________________________________________________________________________
REPORT PREPARED BY:__________________________________ TITLE: ______________________________
IF YOU REQUIRE TECHNICAL ASSISTANCE, PLEASE FAX OR WRITE THE CUSTOMER SERVICE
DEPARTMENT AT:
DANIEL MEASUREMENT SERVICES
DIVISION OF EMERSON PROCESS MANAGEMENT
ATTN: CUSTOMER SERVICE
11100 BRITTMOORE PARK DRIVE
HOUSTON, TEXAS 77041
PHONE: (713) 827-6380
FAX: (713) 827-6312
FOR FASTEST SERVICE CONTACT DANIEL MEASUREMENT SERVICES VIA OUR WEBSITE:
www.emersonprocess.com/daniel
This page is intentionally left blank.
Daniel Measurement and Control, Inc., Daniel Measurement Services, Inc., and Rosemount Analytical
Inc., Divisions of Emerson Process Management, reserves the right to make changes to any of its products
or services at any time without prior notification in order to improve that product or service and to supply
the best product or service possible.
www.emersonprocess.com