1
®
Map Intelligence Client – User Manual
1
Map Intelligence Client – User Manual
2
CONTENTS
INTRODUCTION ......................................................................................................... 5
Purpose ...................................................................................................................................................5
Audience..................................................................................................................................................5
Conventions ............................................................................................................................................6
CONCEPTS................................................................................................................. 7
What is Map Intelligence?......................................................................................................................7
The Map Intelligence Client ............................................................................................................7
The Map Intelligence Server and MI Viewer ..................................................................................7
What is a Layer? .....................................................................................................................................8
Layer Types ....................................................................................................................................8
What is the MI Viewer? ................................................................................................................10
MAP INTELLIGENCE CLIENT EXCEL - OVERVIEW ............................................. 11
Overview ................................................................................................................................................11
Prerequisites ................................................................................................................................11
Starting the MI Client ............................................................................................................................12
Map Intelligence Client Help ........................................................................................................12
Loading a template ...............................................................................................................................13
Loading a local template ..............................................................................................................13
Loading a template from a remote server ....................................................................................13
Accessing the MI Viewer......................................................................................................................15
MI CLIENT CONFIGURATION ................................................................................. 17
Global Settings .....................................................................................................................................17
Map Intelligence Layers .......................................................................................................................26
Overview ......................................................................................................................................26
Configure Point Layers .................................................................................................................27
Configure Relationship Layers .....................................................................................................39
Configure Area Group Layer ........................................................................................................72
Configure Pivot Layers ...............................................................................................................104
SELECTION ............................................................................................................ 113
Configuring Layers for Selection ......................................................................................................113
Making a selection from the map ...............................................................................................113
Accessing selections ..................................................................................................................113
CREATING APPLICATIONS .................................................................................. 114
Saving Settings and Configurations as a Template .......................................................................114
Saving Templates.......................................................................................................................114
Publishing Sessions ..........................................................................................................................116
Templates v Publishing Sessions ....................................................................................................117
Map Intelligence Client – User Manual
3
USING FILTERS ..................................................................................................... 118
ADVANCED TOPICS .............................................................................................. 120
Clearing Temporary Files ..................................................................................................................120
Auto Pilot Mode ..................................................................................................................................122
Independent Maps and Legends .......................................................................................................123
Getting a print template image from a full request .........................................................................125
MI Viewers ...........................................................................................................................................127
APPENDICES ......................................................................................................... 128
Appendix A: Features Rendering Attributes ...................................................................................128
Appendix B: Using the Unshaded and Transparent Color Options ..............................................132
Region Relationship and Area Group Layers ............................................................................132
Radius Relationship Layers .......................................................................................................133
Appendix C: Map Intelligence Query Tool .......................................................................................136
Appendix D: Map Intelligence Manuals and Guides .......................................................................137
GLOSSARY ............................................................................................................ 138
Map Intelligence Client – User Manual
4
INTRODUCTION
PURPOSE
This manual provides information about the Map Intelligence Client - Excel (MI Client). It explains the MI Client
features and options and contains the concepts, processes, procedures and examples that you need to use this
software.
AUDIENCE
The effective use of Map Intelligence involves a number of separate processes which can be performed by
different user groups. The user groups involved are described below.
LAYER DESIGNERS
Layer Designers are responsible for creating the templates that result from configuring Map Intelligence layers
that are displayed on the MI Viewer. This user group should have a firm understanding of the spatial analysis
required.
Layer Designers are advised to read the following sections of this manual:
Introduction
Concepts
Map Intelligence Client Excel - Overview
MI Client Configuration
Selection
Publishing Sessions
Creating Applications
Using Filters
Advanced Topics
END USERS
End Users are users who want to view the configured layers on a map. Their roles include launching the MI
Viewer to generate spatial representations of the data.
End Users are advised to read the following sections of this manual and MI Viewer User Manual (see Appendix
D: Map Intelligence Manuals and Guides on page 137).
Introduction
Concepts
Map Intelligence Client Excel - Overview
Publishing Sessions
Using Excel Filters
Selection
Some End Users may have the Map Intelligence Excel Client Viewer installed. See The Map Intelligence
Client.
Map Intelligence Client – User Manual
5
SERVER ADMINISTRATORS
Another type of user exists that is responsible for the installation and management of the Map Intelligence
Server. These users should be familiar with the organization’s mapping server (hereinafter referred to as GIS
Provider). Server Administrators are advised to read the separate Server Tools & Administration Guide (see
Appendix D: Map Intelligence Manuals and Guides on page 137).
CONVENTIONS
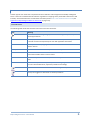
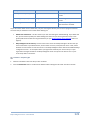
The following table shows the conventions that are used in this document.
Item
Meaning
An arrow indicates the beginning of procedures consisting of sequential steps or
one-step procedures.
<>
In examples, < > indicate that the enclosed elements are optional or they are
instances of code to be replaced by the user with applicable information.
Bold
Bold in procedural steps highlights user interface elements on which the user must
perform actions.
Example text
Courier font indicates that the example test is code or syntax.
Courier italics
Courier italic text indicates a variable field in command syntax. Substitute a value in
place of the variable shown in Courier italics.
n,x
Italic n stands for a variable number; italic x can stand for a variable number or a
letter.
Mouse Orientation
This document provides examples and procedures using a right-handed mouse. If
you use a left-handed mouse, adjust the procedures accordingly.
The Note icon indicates additional information relating to the topic.
The Tip icon suggests an alternative or shortcut procedure.
Map Intelligence Client – User Manual
6
CONCEPTS
WHAT IS MAP INTELLIGENCE?
Map Intelligence extends the "no programming" paradigm into mapping and merges location and spatial
analytics into enterprise decision support and Business Intelligence applications.
Map Intelligence enables bi-directional analysis between data visualized on maps and other more traditional
representations such as tables of data, charts and reports. In this environment a user can easily discover
previously hidden information and data relationships.
Map Intelligence reduces the time needed to develop the applications from weeks and months to days and
hours. In many cases organizations have given up before solving the technical challenges that Map Intelligence
solves.
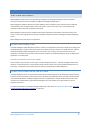
Map Intelligence has two principal components:
THE MAP INTELLIGENCE CLIENT
The Map Intelligence Client (MI Client) includes a number of configuration screens that enable you to design your
mapping application. Using the Client you select the underlying map you want to use, specify the ‘look and feel’
and build the different Map Intelligence layers to be used in your analysis. Once this has been done, your
application is finished and in operation the Client sends a request to the Map Intelligence Server to display your
application in a web browser.
THE MAP INTELLIGENCE EXCEL CLIENT VIEWER
Some End Users may only wish to view maps and layers designed by others. The Map Intelligence Excel Client
Viewer is a streamlined version of the standard client and only allows users to load predefined templates and
view maps. The MI Excel Client Viewer does not allow any configuration of Map Intelligence.
THE MAP INTELLIGENCE SERVER AND MI VIEWER
The Map Intelligence Server is the powerhouse behind the mapping application you designed using the Client. It
processes all the information sent from the Client to produce your application which you view and interact with
in the browser MI Viewer. The Map Intelligence Server is supplied with a number of administration tools that
include license administration, global default settings for the ‘look and feel’ and customization of various
applications features.
For further information on the Map Intelligence MI Viewer, refer to the MI Viewer User Manual (see Appendix
D: Map Intelligence Manuals and Guides on page 137).
Map Intelligence Client – User Manual
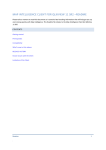
7
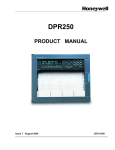
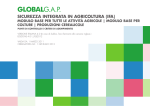
Figure 1. The Map Intelligence Platform.
WHAT IS A LAYER?
Maps are built with layers. Each layer holds characteristics that may be of interest to end-users. Layers contain
features of the map such as streets, parks, postal districts, cities, radio towers, rivers and so on. Each map layer
sits on top of another layer, e.g. a country layer may sit all the way at the bottom with street layers sitting right
at the top.
Layers can also be created dynamically from data found in external sources. Map Intelligence is capable of
generating a variety of layer types to aid analysis.
In this manual, layers that reside as part of the mapping environment are referred to as built-in layers. Layers
created dynamically from external data sources are known as Map Intelligence layers.
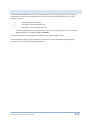
LAYER TYPES
The following layers can be created and configured using Map Intelligence:
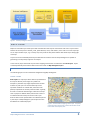
POINT LAYERS
Point Layers are map layers where data is represented on
the map as discrete point images or symbols. For
example: a particular layer might represent the location
of stores as push-pin icons and another layer could
represent accidents as colored dots, where the color
(theme) represents the severity of the accident. Typically,
the rows in a table of data belong to a business concept
such as people or address details, where each column is
an attribute of that concept. Thus each row in your
business data can be represented as an individual point in
a point layer. In Map Intelligence, point layers form the
foundation for relationship layers.
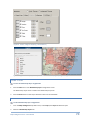
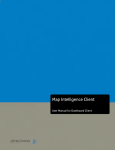
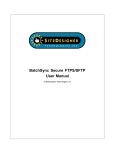
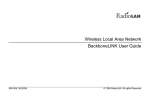
Figure 2: The MI Viewer displaying a Point layer. The points,
represented by colored circles, indicate the location of fast
food outlets in the Sydney area.
Map Intelligence Client – User Manual
8
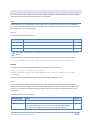
RELATIONSHIP LAYERS
Radius relationship layers are circular regions with
themes around certain points of interest that show
information about other points which fall within that
circular region. These layers are generated by Map
Intelligence. They are based on calculations made by Map
Intelligence on the specified data values as defined by the
Layer Designer. For example: different colored circles
indicate the average house price within half a kilometer of
a proposed waste plant. Another example is where
different colored circles indicate the number of burglaries
that have occurred within a five-mile distance of houses
belonging to known burglars. In the current version of
Map Intelligence, the circle center points (e.g. houses
belonging to known burglars) and the data being analyzed
(burglaries), must be point layers.
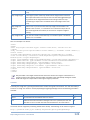
A Region Relationship layer corresponds to a map area of
any shape that is solely geographical in its definition, and
is not generated by Map Intelligence. Examples would be
suburbs, zip / postal codes, local government areas, or
police precincts. Region Relationship layers can be given
themes according to specified data rules associated with
the points that fall within that region. An example of such
a theme could be color-coding precincts according to the
number of crimes that have taken place within their
boundaries, or applying different hatches to suburbs
based on the total value of house sales that have occurred
in each one. Map Intelligence works out in which region a
point (e.g. a sale or an accident) physically belongs to by
doing a spatial calculation.
Map Intelligence Client – User Manual
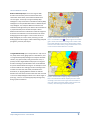
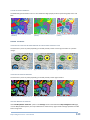
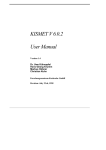
Figure 3: The MI Viewer displaying a Radius Relationship
layer. The small blue circles represent gyms. Around each
gym is a 2km radius colored according to the number of fast
food outlets offering a low fat menu. Yellow Circles indicate
there are more than 5 outlets, orange circles between 1 and
5 and red circles indicate there are no outlets.
Figure 4: The MI Viewer displaying a Region Relationship
layer. Local Government Areas of Sydney are color-coded
according to the most common type of fast food outlets in
each area. Yellow areas show chicken outlets are the most
common, red areas burger and blue areas pizza.
9
AREA GROUP LAYER
Area Group layers also correspond to existing areas on a
map. As for Region Relationship layers, the displayed
theme is based on data attribute values, but in this case
no spatial calculation is required. Instead, a column in
your business data is designated to have values that
match a column in the map data. For example, an existing
map layer of suburbs may correspond to a data column
for suburbs where the values are the suburb names. Then,
for transaction data that represents customer complaints
and that also contains a suburb column, it is possible to
make a cross-reference between the transaction and the
map area using the suburb name. An example that would
use this correlation is displaying a theme on a suburb’s
area on the map that reflects the most common
complaint type received from that suburb.
Figure 5: The MI Viewer displaying an Area Group layer. The
Local Government Areas of Sydney have been color-coded
according to the average household income. The darker the
area the higher the income.
Like built-in map layers, Map Intelligence layers also have a specific order in which they are placed on the map.
Point layers are placed on top of Radius Relationship layers, which in turn sit on top of the built-in map layers.
Region Relationship and Area Group layers shade existing built-in layers.
WHAT IS THE MI VIEWER?
The MI Viewer displays the configured Map Intelligence layers overlaid on a specified map. The MI Viewer also
provides a number of controls and features that allow you to navigate around the map or to change the theme
displayed on the map. A number of tools are also available from the MI Viewer that allow you to perform highlevel analysis.
Mapping Viewer examples used in this manual show the default MI “Modern” Viewer. For information
relating to the MI MING Viewer refer to the MI Viewer: MING – Quick Guide - Appendix D: Map
Intelligence Manuals and Guides on page 137).
The MI Viewer may have been configured to display in an embedded browser in a separate worksheet in
your Excel Workbook.
Map Intelligence Client – User Manual
10
MAP INTELLIGENCE CLIENT EXCEL - OVERVIEW
OVERVIEW
The Map Intelligence Client Excel (MI Client) allows you to open a Microsoft Excel worksheet or comma
separated variable (csv) file and configure parameters to display data from multiple sheets in a spatial
application. Multiple representations of the data can be made and the set of spatial views saved as a template
which can be loaded to display the layers for the same or similar spreadsheet files.
PREREQUISITES
When using Map Intelligence with Microsoft Excel, there are 4 major parts to the system. In order to configure
the MI Client, the following components must be installed:
The MI Client – This appears as a drop-down menu on the Excel menu bar, which interacts with Microsoft Excel
to manipulate your data and sends mapping requests to the Map Intelligence server.
For instructions on how to install the MI Client – Excel refer to the Map Intelligence Excel Client Installation
Guide (see Appendix D: Map Intelligence Manuals and Guides).
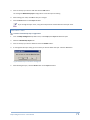
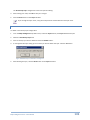
After installation, ensure the Map Intelligence.xla file is listed in the Excel Add-Ins list. Click the Office
button > Excel Options > Add-Ins
If the Map Intelligence.xla file does not appear in the list then from the Manage: drop-down list
ensure Excel Add-ins is selected, then click the Go… button.
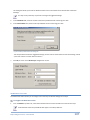
The Add-Ins dialog window will open, click the Browse… button and navigate to the MI Client
installation directory, select the Map Intelligence.xla file click OK, then click OK to close the Add-Ins
dialog box.
The Map Intelligence Server –This is a web application that exists somewhere on the network and waits for map
requests from the MI Client and dynamically builds spatial applications as a result of these map requests.
Ensure the Map Intelligence Server is available on the network (For instructions on how to install and configure
the Map Server refer to the Map Intelligence Server Installation Guide (see Appendix D: Map Intelligence
Manuals and Guides on page 137).
The Map Provider Server – This is the server that produces the displayed map images. The map provider server
is invisible to the end user. The installation of the map provider server is beyond the scope of this manual.
Microsoft Excel needs to be installed on the machine that will be used in configuring and viewing analysis layers.
The installation of Microsoft Excel is beyond the scope of this manual.
The Map Intelligence Excel Client will not work if it does not have access to a machine which has
Microsoft Excel installed on it.
For best results when displaying the MI Viewer, it is recommended that you have Microsoft Internet
Explorer Version 8.0 or 9.0 installed.
Map Intelligence Client – User Manual
11
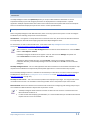
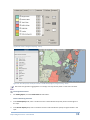
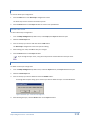
STARTING THE MI CLIE NT
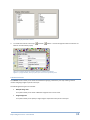
Once the MI Client has been installed and the Map Intelligence.xla file has been added to the Excel Add-Ins, each
time you open Excel, the MI Client will appear as a drop-down menu on the Excel Add-Ins Tab.
Figure 6 Excel worksheet showing the MI Client drop-down menu.
Each worksheet can form the data for one or more Map Intelligence layers. The current version of the MI Client
requires that all Map Intelligence layers must come from the same Workbook (.xls / .xlsx) file. If your data is in
multiple Workbooks you will need to combine these into multiple worksheets in a single Workbook.
Important: Each column must have a column heading.
MAP INTELLIGENCE CLIENT HELP
The MI Client Help can be found by selecting Help from the Map Intelligence drop-down menu.
Map Intelligence Client – User Manual
12
LOADING A TEMPLATE
The MI Client allows Layer Designers to save configuration settings and layer definitions as a template file
(*.tem).
Layer Designers should see Creating Applications.
.
Loading a template into the MI Client allows both Layer Designers and End Users with access to the Excel
Workbook, or a similar one containing the same worksheets and columns, to display the map and layer
definitions immediately. Templates can be loaded locally or from a remote server.
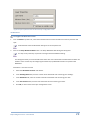
LOADING A LOCAL TEMPLATE
To load a local template
1.
From the Map Intelligence drop-down menu, Select Load Template, the Load Template screen will open.
2.
Click the Load locally radio button, then click the Browse button.
A file browser window will open.
3.
Browse to where the template is located, select the file, then click Open.
The file name and location will appear in the Path name field.
4.
Click the OK button to load the template.
If any worksheets were renamed after the saving of the template, you will be prompted to enter
the new worksheet name.
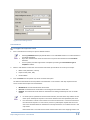
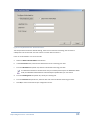
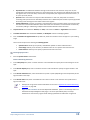
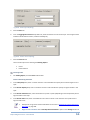
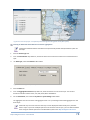
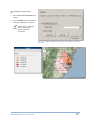
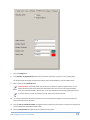
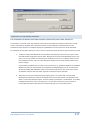
LOADING A TEMPLATE FROM A REMOTE SERVER
To load a template from a remote server
1.
From the Map Intelligence drop-down menu, Select Load Template, the Load Template dialog box will
open.
2.
Click the Load from remote server radio button.
3.
In the Server Address field enter the server address where the template is located.
4.
Click the Refresh List button.
If prompted, enter your User Name and Password.
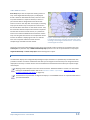
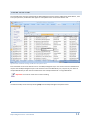
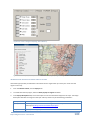
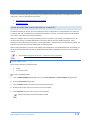
A list of templates will appear in the window. The list shows the name of the template followed by a
description of the template.
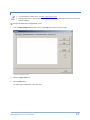
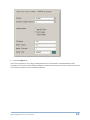
Map Intelligence Client – User Manual
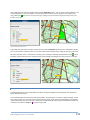
13
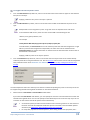
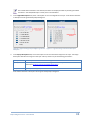
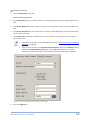
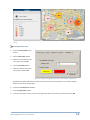
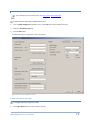
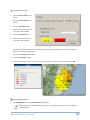
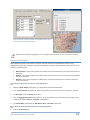
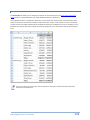
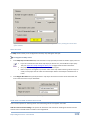
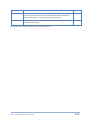
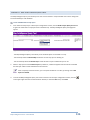
Figure 7 Load Template dialog box.
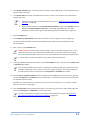
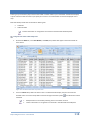
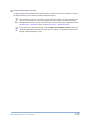
5.
Select the template to be loaded and click the OK button.
If any worksheets were renamed after the saving of the template, you will be prompted to enter
the new worksheet name.
The templates listed in the Load Template dialog box are based on criteria set by the Layer
Designer who saved the template. For example this list shows all available templates that are
associated with Excel Workbooks that contain the word “food” in the file name. If no templates
match the criteria the dialog box will be empty. Not all templates shown will necessarily be
associated with the Excel Workbook you are using. You should consult the Layer Designer who
saved the template if you are unsure of which template to use. For further information on
template matching criteria. See Creating Applications, Completing the Workbook File Names to
Match.
Map Intelligence Client – User Manual
14
ACCESSING THE MI VIEWER
The MI Client launches a MI Viewer that displays points and relationships on a map based on layers configured
by the designer. When viewing the map, you can analyze your data using the controls available from the MI
Viewer.
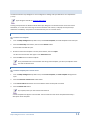
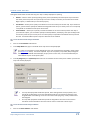
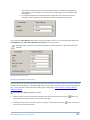
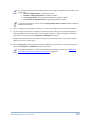
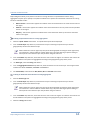
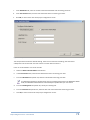
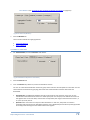
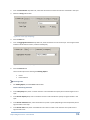
SELECTING YOUR PREFERRED BROWSER
The Map Intelligence Client allows End Users to select their preferred browser.
To select your preferred browser
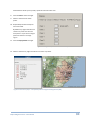
1.
From the Map Intelligence drop-down menu, select Global Settings. The Global Settings configuration
screen will appear.
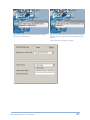
2.
From the Preferences, Browser section, click a radio button to select your system’s default browser.
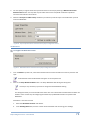
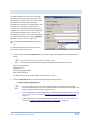
Figure 8 Preferences Section.
Selecting Embedded will display the MI Viewer in an embedded browser in a new worksheet
in your Excel Workbook.
If you wish the MI Viewer to fill the visible area of your Excel worksheet click the Fill sheet
checkbox.
End Users only have to select their preferred browser once, Map Intelligence will then
remember this setting for all future sessions.
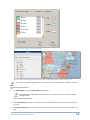
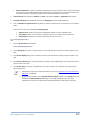
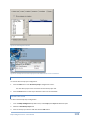
LAUNCHING THE MI VIEWER
To open the MI Viewer
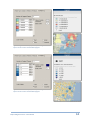
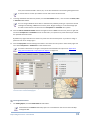
1.
To view the map, from the Map Intelligence drop-down menu, select
Show Map or click the Show Map button on the Integeo / Custom
toolbar.
The MI Viewer will appear either in a browser or in an
embedded browser in a separate worksheet in your Excel
Map Intelligence Client – User Manual
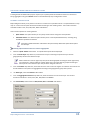
Figure 9: Show Map button
15
Workbook.
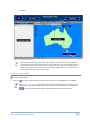
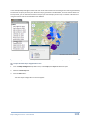
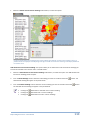
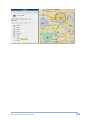
Figure 10 The Default MI Viewer
Map Intelligence does not verify that the layer properties set in the MI Client are valid when a
new request is made. Instead, it will report errors as it finds them. E.g. if an invalid built-in layer
has been specified for an Area Group Layer, and the layer has not been made visible, the MI
Viewer will not report the error when you click the Map Intelligence button. The problem will
only be reported when the map is made visible.
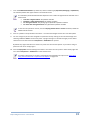
CLOSING THE MI VIEWER
To close the MI Viewer
1.
Click the
in the upper right hand corner of the browser window, or from the File menu, click Close.
The MI Viewer User Manual, contains further information on the Analytical Tools and features of
the MI Viewer, alternatively the MI Viewer Help can be accessed by clicking on the Help button
on the Top Panel of the MI Viewer and selecting Help from the drop-down list.
Map Intelligence Client – User Manual
16
MI CLIENT CONFIGURATION
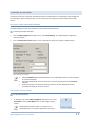
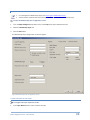
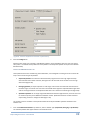
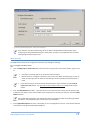
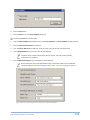
GLOBAL SETTINGS
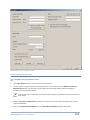
The Global Settings configuration screen allows you to configure the settings for your Map Intelligence Server as
well as the properties of the underlying map to be used for your analysis.
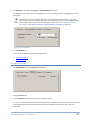
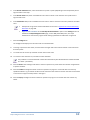
To open the Global Settings screen
1.
From the Map Intelligence drop-down menu, select Global Settings. The Global Settings configuration
screen will appear.
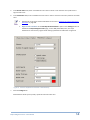
Figure 11 Global Settings configuration screen.
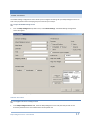
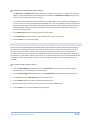
SERVER SETTINGS
To configure the Server Settings section
1.
In the Map Intelligence Server field, enter the Map Intelligence server and port that you wish to use.
Previously entered servers are available from the drop-down list.
Map Intelligence Client – User Manual
17
2.
From the Map Name drop-down list, select the map that you want to use to display your analysis layers on.
The Map Name drop-down list contains all the maps that have been added during the Map
Intelligence server configuration. Consult your Map Intelligence Server Administrator if the map
you wish to use is not available in the drop-down list.
3.
From the Delimiter drop-down list, select a character to act as a separator for your data as it is sent to the
Map Intelligence Server.
The delimiter character act as a separators for your data as they are sent to the Map Intelligence
Server. You must select a character that does not exist within your data to avoid errors. The
default character is ÿ.
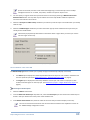
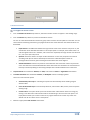
4.
In the Title field, enter the title that you want to appear on the Top Panel of the MI Viewer (Figure 12). This
field is optional.
5.
In the Logo field, enter the file name of the image that you want to appear on the Top Panel of the MI
Viewer (Figure 12). This field is optional.
The specified image file must be located in the Images folder of the Map Intelligence directory
on the server machine.
The recommended size for the image is 70 x 70 pixels. Larger images may cover some
elements or change the format of the MI Viewer.
Figure 12. An example MI Viewer Top Panel showing the Title “Fast Food Franchise Analysis” and Integeo/Burger Logo.
As of Map Intelligence Server Version 3.2.2, Map Intelligence allows organizations to create custom MI Viewer
User Interfaces that can be used instead of the standard Map Intelligence MI Viewer. Examples of this could be
to use Google Maps, Open Layers or even map layers from Excel over the existing in-house spatial applications
being used by organizations. If more than one viewer is registered with your Map Intelligence server, then you
can choose which viewer to use for this Excel Workbook from the Mapping Viewer drop down.
6.
From the Mapping Viewer drop-down list, select the name of the Custom MI Viewer to be used.
IMPORTANT NOTE: This feature is only available when using a Map Intelligence Server version
3.2.2 or above.
Map Intelligence Client – User Manual
18
Figure 13 Server Settings section.
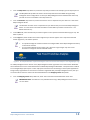
PREFERENCES
To configure the Preferences section
1.
Click a radio button to select your system’s default browser.
Selecting Embedded will display the MI Viewer in an embedded browser in a new worksheet in
your Excel Workbook.
If you wish the MI Viewer to fill the visible area of your Excel worksheet click the Fill sheet
checkbox.
You can specify a browser type within a template by selecting the Save Browser Type in
Template checkbox.
2.
Select a radio button to select the unit of measurement that you would like to use for your analysis.
3.
Metric units (kilometers, meters)
Imperial units (miles, feet)
Nautical Miles
From the Extent Lock drop-down list, select an extent lock option.
The Extent Lock determines the map extent to be used when a user makes a new map request from the
client. The lock extent options are listed below:
Most Recent: The last viewed extent will be used.
No Lock: The extent will be calculated on a bounding box around the visible data.
Disabled: The extent lock will be based on the Extent Lock setting selected by the user in the MI
Viewer.
If a center point is specified in the Center Point Section, the view of the map adheres to this
center point. Subsequent requests in the session adhere to the lock specified by the client.
If an extent lock is not set in the client then a zoom and centre set in a client are honored in
the initial client request on a user session, but for any subsequent requests the zoom and
centre are calculated based on the data from the request if there is no extent lock set in the
map viewer.
If the extent lock is not under client control and the extent lock in the mapping viewer is set
Map Intelligence Client – User Manual
19
to snapshot then it honors the snapshot setting for all subsequent client requests on that
user’s session.
4.
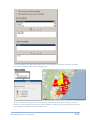
In the Map View Width field enter in pixels the width of the Map View.
5.
In the Map View Height field enter in pixels the height of the Map View.
The Map View Width and Height settings override the default settings set by the Server
Administrator.
Figure 14. MI Viewer showing the Map View highlighted in green.
Figure 15 Preferences section.
Map Intelligence Client – User Manual
20
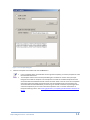
CENTER POINT SECTION
Setting the Center Point controls the way your map is initially displayed on opening.
Default – selects a center point by plotting all the points specified by the visible point layers and takes
the center point of all points. If no point layers are set as visible, the Center point is taken from visible
Region layers (i.e. Relationship or Area Group Layers).
Coordinates – allows you to specify a coordinate to set as the center point for the map. If you select this
option, you will need to specify the latitude and longitude values for your center point. You must specify
a map width or the default center point will be used.
Street Address – allows you to specify a valid street address to set as the center point for the map. If
you select this option, you will need to specify the street/address, suburb/city, state post code/zip code
and country values for your center point. You must specify a map width or the default center point will
be used. The Street Address option requires a Geocoder to be installed.
To set the Center Point using Coordinates
1.
Click on the Coordinates radio button.
2.
In the Map Width field, type in the width of the map to be initially displayed.
This value is in kilometers or miles depending on the unit of measurement selected in Units section
(see Preferences above). This field is optional. If you do not specify a map width, Map Intelligence
will apply a default width that will display all your points. In this case, it is recommended that you
select Default as your center point option.
3.
In the X (Longitude) and Y (Latitude) fields enter the co-ordinates for the center point at which you wish the
map to be initially displayed.
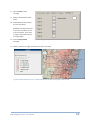
Figure 16. Center Point and Display section showing Coordinates radio button selected.
For maps with projected coordinate systems, when setting Center Point properties, the Y
coordinate (or Northing) is set in the latitude field and the X coordinate (or Easting) in the
longitude field. These settings are in the units of the underlying map, usually meters rather
than degrees.
For maps with projected coordinate systems the longitude is set to the column of the X
coordinate and the latitude is set to the column of the Y coordinate in Point layers.
To set the Center Point using an address
1.
Click on the Street Address radio button.
Map Intelligence Client – User Manual
21
2.
In the Map Width field, type in the width of the map to be initially displayed.
This value is in kilometers or miles depending on the unit of measurement selected in Units
section (see Preferences above). This field is optional. If you do not specify a map width, Map
Intelligence will apply a default width that will display all your points. In this case, it is
recommended that you select Default as your center point option.
3.
In the Street, City State, Post / ZIP and Country fields, enter the address details for the center point at
which you wish the map to be initially displayed.
Figure 17. Center Point and Display section showing Street Address radio button selected.
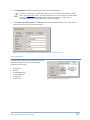
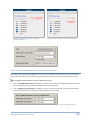
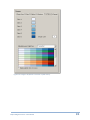
STYLES SECTION
The Styles section allows you to configure the look and
feel of the MI Viewer. The color of the following
elements can be changed:
Background
Buttons
Header Background
Panel Background
Header Text
Button Text
Map Intelligence Client – User Manual
Figure 18. Default Display / Styles section.
22
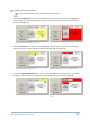
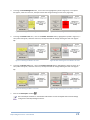
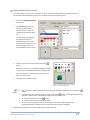
To change the color of each element
In the examples below the color red was selected for each element.
1.
To change the Background color (i.e. the area behind the maps and panels), click on the area highlighted in
yellow in Figure 19, a color picker will appear, select the new color, the Style Preview will change showing
the new color (Figure 20).
Figure 19. Selecting the Background color.
2.
To change the Buttons color, click on the area highlighted in yellow in Figure 21, a color picker will appear,
select the new color, the Style Preview will change showing the new color (Figure 22).
Figure 21. Selecting the Buttons color.
3.
Figure 20. After selecting red as the Background color.
Figure 22. After selecting red as the Buttons color.
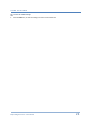
To change the Header Background color, click on the area highlighted in yellow in Figure 23, a color picker
will appear, select the new color, the Style Preview will change showing the new color (Figure 24).
Figure 23. Selecting the Header Background color.
Map Intelligence Client – User Manual
Figure 24. After selecting red as the Header Background
color.
23
4.
To change the Panel Background color, click on the area highlighted in yellow in Figure 25, a color picker
will appear, select the new color, the Style Preview will change showing the new color (Figure 26).
Figure 25. Selecting the Panel Background color.
5.
To change the Header Text color, click on the Header Text Color button, highlighted in yellow in Figure 27, a
color picker will appear, select the new color, the Style Preview will change showing the new color (Figure
28).
Figure 27. Selecting the Header Text color.
6.
Figure 28. After selecting red as the Header Text color.
To change the Button Text color, click on the Button Text Color button, highlighted in yellow in Figure 29, a
color picker will appear, select the new color, the Style Preview will change showing the new color (Figure
30).
Figure 29. Selecting the Button Text color.
7.
Figure 26. After selecting red as the Panel Background color.
Click on the Send Styles checkbox
Figure 30. After selecting red as the Button Text color.
.
If the Send Styles checkbox is unchecked the MI Viewer will use the Default Look and Feel settings
configured on the Map Intelligence Server.
Map Intelligence Client – User Manual
24
SAVING THE SETTINGS
To save the Global Settings
1.
Click the OK button, to save the settings and return to the worksheet.
Map Intelligence Client – User Manual
25
MAP INTELLIGENCE LAYERS
OVERVIEW
Maps are made up of layers. Map features such as roads, parks or traffic lights are held on different layers. Each
map is composed of one or more layers that are superimposed to give the final map look and feel.
Layers that reside as part of the mapping environment are referred to as built-in layers. Layers created
dynamically from external data sources are known as Map Intelligence layers.
There are currently four Map Intelligence layer types:
Point Layers
Radius Relationship Layers
Region Relationship Layers
Area Group Layers
If your data is in a pivot form you can create multiple Area Group Layers using the Pivot Layer Configuration
Screen – see Configure Pivot Layers on page 104.
See Layer Types for a full description of Map Intelligence layers. The MI Client comes with configuration screens
that allow you to create your Map Intelligence layers.
These configuration frames are not accessible from the MI Client Viewer version.
Map Intelligence Client – User Manual
26
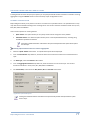
CONFIGURE POINT LAYERS
For a description of Point layers, see Layer Types, Point Layers.
Example Screenshots. The Example screenshots show points representing the location of Fast Food
outlets in Sydney.
To open the Point Layer Configuration screen
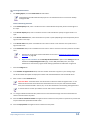
1.
From the Map Intelligence drop-down menu, select Layers, the Layers screen will open.
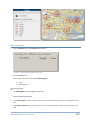
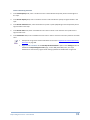
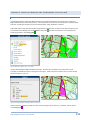
Figure 31 The Layers screen.
2.
Select the Point Layers tab.
3.
Click the Add button.
The Point Layer configuration screen will open.
Map Intelligence Client – User Manual
27
Figure 32 Point Layer configuration Screen
LAYER PROPERTIES SECTION
To configure the Layer Properties section
1.
In the Layer Name field, enter a title for the layer.
Spaces can be used, but must not be used at the beginning or end of the layer name. For Map
Intelligence Servers 3.1 or below, only letters, numbers and spaces may be used.
2.
You can specify a range in which the layer will be visible on the map by entering a Minimum Zoom and
Maximum Zoom value. The layer will only be visible if the current map width is within the specified
minimum and maximum zoom values.
3.
Select the Set layer as visible in map checkbox if you wish this particular layer to be visible when you initially
view the map.
Map Intelligence Client – User Manual
28
Figure 33 Layer Properties Section of the Point Layer configuration screen.
WORKSHEET
To configure the Worksheet section
1.
From the Name drop-down list, select the worksheet which contains the data to be used as points for this
layer.
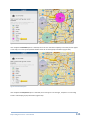
All worksheets within the Workbook will appear in the drop-down list.
2.
Click on the Setup Worksheet Data button. The Setup Worksheet Data dialog box will appear.
This step is only necessary if you wish to change the standard default setting.
This dialog box allows you to tell the MI Client which cells on the worksheet constitute data and which are
headers. There are two ways of configuring the worksheet, by Worksheet Location or by Data in the
Worksheet.
WORKSHEET LOCATION OPTION
a.
Select the Worksheet Location radio button.
b.
In the Headings Row field, enter the number of the worksheet row containing your headings.
c.
In the Data Row field, enter the number of the first worksheet row containing your data.
d.
In the First Column field, enter the first worksheet column containing your data.
e.
Click OK, to return to the Point Layer configuration screen.
Map Intelligence Client – User Manual
29
Figure 34. Setup Worksheet Data - Worksheet location.
The example above shows the default settings, the first row contains the headings, the second and
subsequent rows contain data. The first column to contain data is Column A.
DATA IN THE WORKSHEET LOCATION OPTION
a.
Select the Data in the Worksheet radio button.
b.
In the First Column field, enter the first worksheet column containing your data.
c.
From the Worksheet drop-down list, select the worksheet containing your data.
If a different worksheet is selected to the one you selected previously for the Worksheet Name
field, the Worksheet Name field will automatically be updated with your new choice.
d.
From the Headings Row drop-down list, select your heading row.
e.
From the Data Row drop-down list, select the first row of the worksheet containing your data.
f.
Click OK, to return to the Point Layer configuration screen.
Map Intelligence Client – User Manual
30
Figure 35. Setup Worksheet Data - Data in the Worksheet.
If you intend to use Advanced Filtering, select the Data in the Worksheet Location option when
configuring the Setup Worksheet Data, this option does not require any adjustment to the location
settings if Advanced Filtering is used.
POINT PROPERTIES SECTION
Figure 36 Point Properties Section of the Point Layer configuration screen.
Map Intelligence Client – User Manual
31
To configure the Point Properties section
1.
From the Label Column drop-down list, select a column that contains the values to appear on the labels for
each point in the layer.
Applying a label for each point in the layer is optional.
2.
From the URL Column drop-down, select a column that contains URLs associated with the points in the
layer.
Multiple URLs can be assigned to a point using semi-colons to separate names and values.
In the worksheet URL column; enter the name and the URL in the following format
<Name>;<Url>;(space)<Name>;<Url>
For example:
“Pitney Bowes Web Site;http://www.pb.com; Report;report.pdf”
From MI Viewer, the Active Points tool can be used for points that have been assigned to a single
URL. If a point has been assigned to multiple URLs, the active links can be viewed from the
Information Panel. For further information on the Active Points and Information sections refer to
the MI Viewer User Manual.
Applying a URL for points in the layer is optional.
3.
From the ID Column drop-down list, select a column that contains unique values to be used to identify
individual points when using the Selection Tool. See the Selection section of this manual and the Foreground
Tools, Selection section of the MI Viewer User Manual (see Appendix D: Map Intelligence Manuals and
Guides).
Figure 37 Label, URL and ID Column section.
The Point Properties section also allows you to select the method for plotting the points on the map. Points can
be mapped using latitude and longitude coordinates or valid street addresses.
1.
Select either the Coordinates or Street Address radio button.
If you select the Coordinates radio button, you must specify the columns in the worksheet that contain the
latitude and longitude values. You can also specify the Coordinate System to use for the layer if you do not
intend to use the inherent coordinate system of the selected map.
A coordinate system provides a frame of reference for measuring locations on the surface of
the earth. A full list of acceptable coordinate systems is available in the Coordinate Systems
document (see Appendix D: Map Intelligence Manuals and Guides).
For maps with projected coordinate systems, when setting Center Point properties, the Y
Map Intelligence Client – User Manual
32
coordinate (or Northing) is set in the latitude field and the X coordinate (or Easting) in the
longitude field. These settings are in the units of the underlying map, usually meters rather
than degrees.
For maps with projected coordinate systems the longitude is set to the column of the X
coordinate and the latitude is set to the column of the Y coordinate in Point layers.
Figure 38 Coordinates option.
If you select the Street Address radio button, you must specify the columns in your worksheet that contain the
Street/Address, City, State, Post / Zip Code and Country values for each point.
The Street Address option will only work if a geocoder has been installed, or a geocoded map layer is
available.
Figure 39 Street Address option.
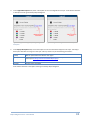
DISPLAY INFORMATION SECTION
Data columns can be sent to the MI Viewer to provide more information about each point. The values contained
in these columns will appear in a popup window when you move your cursor over a point on the map (see Figure
41). You are also able to set themes for the data columns selected (see Themes Section, Creating a Multiple
Image Icon theme)
To configure the Display Information section
1.
Select the data columns that you want to display from the left hand list box and click the
selected data columns will appear in the list box on the right.
2.
To deselect a data column, select the column in the right hand list box and click the
will return to the left hand list box.
Map Intelligence Client – User Manual
button. The
button. The column
33
Figure 40 Display Information section.
3.
To reorder the columns use the up
listed in the Information popup.
and down
buttons. This will change the order the columns are
Figure 41 . Example of how the columns selected in “Display Information”
appear in a popup window, when you place your cursor over a particular point.
THEMES SECTION
The Themes section allows you to select the method for applying a theme for your layer. Setting a theme
involves assigning images to points in the layer.
The following theme types are available:
Multiple Image Icon
This option allows you to select a different image for each column value.
Single Image Icon
This option allows you to specify a single image to represent all the points in the layer.
Map Intelligence Client – User Manual
34
Creating a Multiple Image Icon Theme
This option allows you to specify an image for values in columns available from the specified column from
the worksheet. Map Intelligence allows you to configure themes for multiple columns.
1.
Click on the Multiple Image Icon
radio button.
2.
The Column drop-down list
contains all selected data
columns. Select a column to
configure from the drop-down
list.
The top left list box displays a
list of all values from the
selected column. The list box
underneath this displays a list of
available images that can be
associated with a column value.
Figure 42. Multiple Image Icon theme option
3.
Select a column value and an image and click the
button.
Placing your cursor over an image will display the actual
image size in the Preview box, below the image list box.
The specified theme condition will be displayed in the
right hand side list box.
4.
Configure all other desired values.
Figure 43. Image Preview box, showing
actual size of image selected.
5.
You can remove a theme condition by selecting the condition from the list box and clicking the
button.
To select all the data columns, select an image and click the
button. The image selected will be
assigned to the first value and following image to the second value, etc.
To remove all selections click the
button.
To reorder the list use the up and down arrows.
You do not need to assign an icon for every single column value. Map Intelligence will
automatically assign a default icon for all values that have not been configured.
Repeat the steps above if you want to assign themes to other columns.
Map Intelligence Client – User Manual
35
6.
From the Default drop-down list, select the theme that you want to be displayed when the MI Viewer is
accessed for the first time.
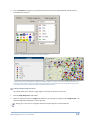
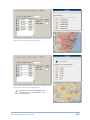
Figure 44. Completed Multiple Image Icon theme configuration.
Figure 45 Point Layer showing Map and Legend for Multiple Image Icon theme. We can see each fast food franchise is
represented by a colored circle, color-coded by food type category, for example red circles for Burger outlets, blue for
Pizza outlets. Each point is labeled according to the Name of the franchise.
Creating a Single Image Icon theme
This option allows you to specify a single image to represent all the points in the layer.
1.
Click the Single Image Icon radio button.
2.
Select an image from either the Image drop-down list or by selecting an image from the Image list box. The
selected image will be displayed in the top right box.
Placing your cursor over an image will display the actual image size in the Preview box.
Map Intelligence Client – User Manual
36
Figure 46 Single Image Icon theme.
Figure 47 Point Layer showing Map and Legend for a Single Image Icon theme. In this example the location of Fast Food
Outlets are displayed as red houses.
POINT LAYER ORDER
The order the point layers appear in the legend and on the map can be arranged using the Up
and Down
arrow buttons on the Point Layer tab. The first layer listed will be the first point layer on the legend and sit in
front of the point layers listed below. Ordering the point layers is useful if large point icons are obscuring smaller
ones below.
SAVING A LAYER
To save the Point Layer configuration
1.
Click the OK button on the Point Layer configuration screen.
The Point Layer name is listed on the Point Layer tab.
Map Intelligence Client – User Manual
37
2.
Click the Done button on the Layers window to return to the worksheet.
EDITING A LAYER
To edit a Point Layer configuration
1.
From the Map Intelligence drop-down menu, select Layers, the Layers window will open
2.
Select the Point Layers tab.
3.
Click on the layer you want to edit and click the Edit button. The configured Point Layer configuration screen
will open for editing.
4.
After making your edits, click OK to save your changes.
5.
Click the Done button on the Layers window.
If you change the layer name, a copy of the layer will be created with the new layer name.
DELETING A LAYER
To delete a Point layer configuration
1.
From the Map Intelligence drop-down menu select Layers, the Layers window will open.
2.
Select the Point Layers tab.
3.
Click on the layer you want to delete and click the Delete button.
4.
A message box will open asking you to confirm you wish to delete the layer. Click the Yes button.
Figure 48 Delete layer confirmation message box
Map Intelligence will not allow the deletion of a point layer if the point layer is used by a
relationship layer.
5.
After deleting the layer, click the Done button on the Layers window.
Map Intelligence Client – User Manual
38
CONFIGURE RELATIONSHIP LAYERS
For a description of Relationship layers, see Layer Types, Relationship Layers
You will need to create at least one Point Layer before you can create a Relationship Layer.
To open the Relationship Layer configuration screen
1.
From the Map Intelligence drop-down menu, select Layers, the Layers window will open.
2.
Select the Relationship Layer tab.
3.
Click the Add button.
The Relationship Layer configuration screen will appear.
Figure 49 Relationship Layer configuration screen.
LAYER PROPERTIES SECTION
To configure the Layer Properties section
1.
In the Layer Name text box, enter a title for the layer.
Map Intelligence Client – User Manual
39
Spaces can be used, but must not be used at the beginning or end of the layer name. For Map
Intelligence Servers 3.1 or below, only letters, numbers and spaces may be used.
2.
You can specify a range in which the layer will be visible on the map by entering a Minimum Zoom and
Maximum Zoom value. The layer will only be visible if the current map width is within the specified
minimum and maximum zoom values.
3.
Select the Set layer as visible in map checkbox if you wish this particular layer to be visible when you initially
view the map.
4.
Select the Enable Popups checkbox if you wish information popups to be enabled for the layer when you
initially access the MI Viewer.
Information popup boxes provide further information about a region when you move your mouse
over the region on the map.
Figure 50 Layer Properties section of the Relationship Layer configuration screen.
RELATIONSHIP TYPE SECTION
The Relationship Type section allows you to specify the type of relationship to display on the map.
The Radius option displays the relationship between two Point layers as color-coded or hatched circles
around a particular point (see Relationship Layers – Radius Relationship Layers on page 9).
The Region option displays the relationship between a Point layer and a built-in map layer as colorcoded or hatched regions on the map layer (See Relationship Layers – Region Relationship Layers on
page 9).
Selecting the Radius Option
1.
Select the Radius radio button.
2.
From the Reference Point Layer drop-down list, select the Point Layer you want to base the relationship on.
Points in this layer become the center point of the shaded circles.
3.
In the Radius Around Point field, enter the radius of the circle that you want to display on the map.
The unit of measurement will be the unit of measurement selected in the Preferences section of
the Global Settings configuration screen.
Map Intelligence Client – User Manual
40
4.
In the Legend Description field, enter a description to use in the legend for this layer. If this field is left blank
a description will be generated by Map Intelligence.
Figure 51. Legend showing a Map Intelligence generated
description.
5.
Figure 52. Legend showing a customized description.
In the Popup Description field, enter a description to use for Information Popups for this layer. The Popup
Description describes each region of the layer and may contain any of the following parameters:
${label}
${value}
Will be replaced with the label for the region.
Will be replaced with the value for the region determined by the column selected in the
theme (see Creating Themes for Relationship Layers).
Example
${value} items in ${label}
If this field is left blank a description will be generated by Map Intelligence.
Map Intelligence Client – User Manual
41
Figure 53. Information popup displaying a Map Intelligence
generated Popup description.
Figure 54. Customized Popup description. In this example the
following description was entered into the Popup Description
text box.
There are ${value} competitors within 3 km of this ${label}
Property
Figure 55 Relationship Type configuration for Radius option.
Selecting the Region Option
1.
From the Map Layer to Color Code drop-down list, select the built-in map layer that you want to shade.
2.
Only layers containing regions can be used as reference layers.
Built-in layers are arranged in a particular order on the map. When selecting a built-in layer to
shade, all map layers that sit under the selected layer will be covered by the selected color or
hatch.
From the Label Column drop-down list, select the column in the map layer that contains the values to be
used as labels for the region. If you wish the labels to be visible when you initially view the map, select the
Show Labels checkbox.
Map Intelligence Client – User Manual
42
If the Show Labels checkbox is not selected, End Users can display the labels by selecting the Labels
checkbox in the Show/Hide Layers control panel in the MI Viewer.
3.
In the Legend Description field, enter a description to use in the legend for this layer. If this field is left blank
a description will be generated by Map Intelligence.
Figure 56. Legend showing a Map Intelligence generated
description.
4.
Figure 57. Legend showing a customized description
In the Popup Description field, enter a description to use for Information Popups for this layer. The Popup
Description describes each region of the layer and may contain any of the following parameters:
${label}
${value}
Will be replaced with the label for the region.
Will be replaced with the value for the region determined by the column selected in the
theme (see Creating Themes for Relationship Layers).
Example
${value} items in ${label}
If this field is left blank a description will be generated by Map Intelligence.
Map Intelligence Client – User Manual
43
Figure 58. Information popup displaying a Map Intelligence
generated Popup description.
Figure 59. Customized Popup description. In this example the
following description was entered into the Popup Description
text box.
Total Fast Food sales in ${label} is ${value}
Figure 60 Relationship Type configuration for Region option.
Map Intelligence Client – User Manual
44
CREATING THEMES FOR RELATIONSHIP LAYERS
Creating themes for Relationship Layers requires you to specify threshold conditions based on a Numeric or
String aggregation using the Themes section on the Relationship Layer configuration screen.
NUMERIC AGGREGATION
Map Intelligence allows you to perform a function on values from a specified column. The specified built-in map
layer or a circle around a point will then be shaded according to the resulting values. The numeric functions
available include: Count, Sum, Min, Max, Mean and Median.
There are two options for creating themes:
Quick Theme: This option allows you to quickly create a theme using basic color palettes.
Advanced Theme: This advanced option allows you to create sophisticated themes, including using
ColorBrewer palettes and hatches.
Clicking the Advanced Theme radio button will permanently disable the Quick Theme option
for this layer.
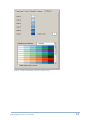
Creating a Quick Theme based on a numeric aggregation
1.
Select the Quick Theme radio button. The Quick Theme panel will be displayed.
2.
From the Point Layer drop down list, select the Point Layer containing the points that you want to
geographically relate to the reference layer.
When related to a built-in region layer the points will be grouped according to which regions they
are contained in. When related to another Point Layer, the points will be grouped according to
which points in the reference layer they all within the given radius of.
3.
From the Column drop down list, select the column to use to color the regions. The data for this column will
be extracted from the points and aggregated according to the geographical group of the points.
4.
For Data Type, select the Numeric radio button.
5.
From the Aggregation Function drop-down list, select the function to use for the layer. The numeric
functions available are: Count, Sum, Min, Max, Mean and Median.
6.
For Color Palette, Select either the Red, Green, Blue or Assorted radio button.
Figure 61. Quick Theme panel.
Map Intelligence Client – User Manual
45
Clicking the Advanced Theme radio button will permanently disable the Quick Theme option for
this layer.
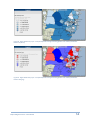
Figure 62. Region Relationship Layer – Example Map View and Legend showing Quick Theme (Green option).
Creating an Advanced Theme based on a numeric aggregation
1.
Select the Advanced Theme radio button. The Advanced Theme panel will be displayed.
2.
Click the Theme Type tab.
3.
From the Point Layer drop down list, select the Point Layer containing the points that you want to
geographically relate to the map layer.
When related to a built-in region layer the points will be grouped according to which regions they
are contained in. When related to another Point Layer, the points will be grouped according to
which points in the reference layer they all within the given radius of.
4.
From the Column drop down list, select the column to use to color the regions. The data for this column will
be extracted from the points and aggregated according to the geographical group of the points.
5.
For Data Type, select the Numeric radio button.
Figure 63. Theme Type Tab (Numeric).
6.
Click the Data tab.
7.
From the Aggregation Function drop-down list, select the function to use for the layer. The numeric
functions available include: Count, Sum, Min, Max, Mean and Median.
Map Intelligence Client – User Manual
46
8.
For Calculation, click either the By Value or By Percentage radio button.
The aggregates can be used as the raw aggregate value or as a percentage of the total aggregate over the
Point Layer.
Note that only one color and one hatch layer can be displayed simultaneously for a particular
built-in-layer. If you have multiple layers that use the same built-in layer, you can switch between
these using the Themes option from the MI Viewer (refer to the Map Intelligence MI Viewer
User Manual – see Appendix D: Map Intelligence Manuals and Guides on page 137.)
Figure 64. Data Tab (Numeric).
9.
Click the Method tab.
There are two methods for applying advanced themes:
Automatic Method
Manual Method
AUTOMATIC METHOD
1.
For Theme Method, click the Automatic radio button.
Figure 65. Method Tab (Numeric- Automatic).
2.
Click the Features tab.
3.
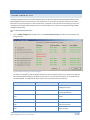
From the Scheme drop-down list, select a classification scheme.
You can use a standard classification scheme to group similar values to look for patterns in the data. You can
choose from three schemes for grouping data values into classes based on how the data values are
distributed.
Map Intelligence Client – User Manual
47
Equal Interval: The difference between the high and low values is the same for every class. So, the
classification of the data will be based on a set of equal splits. For example, if the lowest value is 0 and
the highest value is 10 in the data, and 5 classes are requested, the range of each class will be 0 to 2, 2
to 4, 4 to 6, 6 to 8, 8 to 10.
Quantile: Each class contains an equal number of features. In this case, the points are sorted in
ascending order (for the chosen data field) and each class is filled with (total number of points)/(number
of classes) points starting from the lowest value to the highest.
Standard Deviation: Features are placed in classes based on how much their values vary from the mean.
First the mean and standard deviation of the data values are calculated. The class breaks are found by
successively adding or subtracting multiples of the standard deviation from the mean.
4.
If Equal Interval was selected for Scheme, for Scale, click either the Linear or Logarithmic radio button.
5.
If Standard Deviation was selected for Scheme, for Multiplier enter the multiplying factor.
6.
From the Number of Legend Classes drop-down list, select the number of colors to appear in your shading
range.
There are three options for selecting the Shading Option:
Specific Colors: Allows you to specify a ColorBrewer palette or select individual colors.
Color Range: Allows you to choose a pre-defined color set or a specific start and end color.
Hatch Patterns: Allows you to specify a particular hatch for each class.
Selecting Specific Colors
1.
Click the Specific Colors radio button.
Features Rendering Attributes
2.
In the Fill Opacity field, enter a number from 0 to 1 that indicates the opacity of the colored regions in the
layer.
3.
In the Border Opacity field, enter a number from 0 to 1 that indicates the opacity of region borders in the
layer.
4.
In the Border Thickness field, enter the thickness in points or pixels (depending on the GIS provider) of the
region borders in the layer.
5.
In the Border Color field, enter a hexadecimal color value or select a color from the color picker for the
region border color.
Examples of using various Feature Attributes can be seen in Appendix A: Features Rendering
Attributes on page 128.
Region border attributes: If the Use Map Border Attributes option in the Settings section of
the MI Server Map Intelligence Tools page, is set to Yes (the default) then, the map's
attributes are used and any region border settings specified in the MI Client are ignored.
Map Intelligence Client – User Manual
48
Figure 66. Features Tab (Numeric- Automatic – Specific Colors).
6.
Click the Configure tab.
Specific Colors allows you to specify a ColorBrewer palette or select individual colors for each class from a
color picker. The default color palette is the first palette in the Sequential palette series (see Color Brewer
Palettes below).
USING COLORBREWER PALETTES
These palettes have been created using the ColorBrewer, a tool designed to create good color schemes for
maps. There are three types of palettes:
Sequential palettes are suited to ordered data that progress from low to high. Lightness steps
dominate the look of these schemes, with light colors for low data values to dark colors for high
data values (Figure 68).
Diverging palettes put equal emphasis on mid-range critical values and extremes at both ends of
the data range. The critical class or break in the middle of the legend is emphasized with light colors
and low and high extremes are emphasized with dark colors that have contrasting hues (Figure 69).
Qualitative palettes do not imply magnitude differences between legend classes, and hues are used
to create the primary visual differences between classes. Qualitative schemes are best suited to
representing nominal or categorical data (Figure 70).
The number of colors available in each palette is determined by the Number of Classes selected on the
Features Tab.
7.
From the ColorBrewer Palette drop down list, select a Palette Type (Sequential, Diverging or Qualitative).
The available palettes will appear below in the Preview list box.
Map Intelligence Client – User Manual
49
The availability of ColorBrewer Palettes depends on the number of Legend Classes selected on the
Features tab.
Less than 2 Legend Classes: No palettes available.
Between 3 and 9 Legend Classes: All palettes available.
For 10 Legend Classes: Only Diverging and Qualitative palettes available.
For more than 10 Legend Classes: Only Qualitative palettes available.
To see the color palette in reverse, click the Display palette colors in reverse checkbox, below the
Palette Preview list box.
8.
Click on a palette in the preview box to select it. The colored rectangles next to each class will update.
9.
You can change any of the colors assigned to a particular Class by clicking on the colored rectangle and
selecting a different color from the color picker. By right clicking on a colored rectangle you are able to
select from the context menu the Transparent or Unshaded color options.
By default any region that does not contain any values are set to be transparent. If you wish to assign a
particular color for an empty region.
10. Click the Empty Color colored rectangle and select a color from the color picker or alternatively right click
and select Transparent or Unshaded from the context menu.
For further information on using the Transparent and Unshaded color options see Appendix B:
Using the Unshaded and Transparent Color Options on page 132.
Map Intelligence Client – User Manual
50
Figure 67. Configure Tab (Numeric- Automatic – Specific Colors).
Map Intelligence Client – User Manual
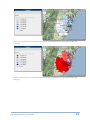
51
Figure 68. Region Relationship Layer – Example Map View and Legend showing Specific Color Theme (ColorBrewer
Palette: Sequential).
Figure 69. Region Relationship Layer – Example Map View and Legend showing Specific Color Theme (ColorBrewer
Palette: Diverging).
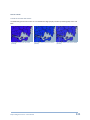
Map Intelligence Client – User Manual
52
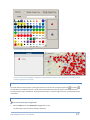
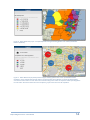
Figure 70. Region Relationship Layer – Example Map View and Legend showing Specific Color Theme (ColorBrewer
Palette: Qualitative).
Figure 71. Radius Relationship Layer Map View and Legend showing Specific Color Theme (ColorBrewer Palette:
Qualitative). In this example potential new sites for Fast Food outlets “Vacant Outlets” are shown as black buildings,
around each ‘vacant outlet’ is a 3 km radius color coded according to the number of competitor outlets operating within
the 3 km radius. Red circles indicate 20 or less competitors, purple circles more than 56 competitors.
Map Intelligence Client – User Manual
53
Selecting Color Range
1.
Click the Color Range radio button.
Features Rendering Attributes
2.
In the Fill Opacity field, enter a number from 0 to 1 that indicates the opacity of the colored regions in the
layer.
3.
In the Border Opacity field, enter a number from 0 to 1 that indicates the opacity of region borders in the
layer.
4.
In the Border Thickness field, enter the thickness in points or pixels (depending on the GIS provider) of the
region borders in the layer.
5.
In the Border Color field, enter a hexadecimal color value or select a color from the color picker for the
region border color.
Examples of using various Feature Attributes can be seen in Appendix A: Features Rendering
Attributes on page 128.
Region border attributes: If the Use Map Border Attributes option in the Settings section of
the MI Server Map Intelligence Tools page, is set to Yes (the default) then, the map's
attributes are used and any region border settings specified in the MI Client are ignored.
Figure 72. Features Tab (Numeric- Automatic – Color Range).
6.
Click the Configure tab.
Map Intelligence Client – User Manual
54
There are two options for color range, Pre-defined Color Set or Custom Colors. Pre-defined Colors shades
according to color schemes built into Map Intelligence. Custom Colors allows you to choose a start color and
end color and have a spectrum of colors between these two.
Selecting Pre-defined Colors
1.
Click the Pre-defined Color Set
radio button.
2.
From the Shade Color drop-down
list, select a pre-defined color
scheme.
When using a pre-defined
color scheme, Empty
regions are always
transparent.
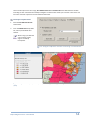
Figure 73. Configure Tab (Numeric- Automatic –Color Range – Pre-defined Color
Set).
Figure 74. Region Relationship Layer – Example Map View and Legend showing Color Range - Pre-defined Color set
(Red).
Map Intelligence Client – User Manual
55
Figure 75. Radius Relationship Layer – Example Map View and Legend showing Color Range - Pre-defined Color set
(Red).
Selecting Custom Colors
1.
Click the Custom Colors radio
button.
2.
Click the Start Color button.
3.
Select the start color from the
color picker and click OK.
4.
Click the End Color button.
5.
Select the end color from the
color picker and click OK.
Figure 76. Configure Tab (Numeric- Automatic –Color Range – Color Colors).
By default any region that does not contain any values are set to be transparent. If you wish to assign a
particular color for an empty region
6.
Uncheck the Transparent checkbox.
7.
Click the Empty Color button.
8.
From the color picker, select a color for any region that does not contain any values and click the OK.
Map Intelligence Client – User Manual
56
Figure 77. Region Relationship Layer – Example Map View and Legend showing Color Range – Custom Colors (Yellow to
Red).
Figure 78. Radius Relationship Layer – Example Map View and Legend showing Color Range – Custom Colors (Yellow to
Red).
Selecting Hatch Patterns
1.
Click the Hatch Patterns radio button.
Features Rendering Attributes
2.
In the Hatch Opacity field, enter a number from 0 to 1 that indicates the opacity of the colored regions in
the layer.
3.
In the Border Opacity field, enter a number from 0 to 1 that indicates the opacity of region borders in the
layer.
4.
In the Border Thickness field, enter the thickness in points or pixels (depending on the GIS provider) of the
region borders in the layer.
Map Intelligence Client – User Manual
57
5.
In the Border Color field, enter a hexadecimal color value or select a color from the color picker for the
region border color.
6.
In the Hatch Color field, enter a hexadecimal color value or select a color from the color picker for the hatch
color.
Examples of using various Feature Attributes can be seen in Appendix A: Features Rendering
Attributes on page 128.
Region border attributes: If the Use Map Border Attributes option in the Settings section of
the MI Server Map Intelligence Tools page, is set to Yes (the default) then, the map's
attributes are used and any region border settings specified in the MI Client are ignored.
Figure 79. Features Tab (Numeric- Automatic – Hatch Patterns).
7.
Click the Configure tab.
Hatch Patterns allows you to specify a particular hatch for each class.
Map Intelligence Client – User Manual
58
8.
Click the Class 1 hatch
rectangle.
9.
Select a hatch from the hatch
picker.
10. Repeat Steps the above steps
for each class listed.
By default any region that does
not contain any values are set
to be transparent. If you wish
to assign a particular hatch for
an empty region.
11. Click the Empty Hatch
rectangle.
Figure 80. Configure Tab (Numeric- Automatic – Hatch).
12. Select a hatch for any region that does not contain any values.
Figure 81. Region Relationship Layer – Example Map View and Legend showing Hatch Patterns (Red).
Map Intelligence Client – User Manual
59
Figure 82. Radius Relationship Layer – Example Map View and Legend showing Hatch Patterns (Red).
MANUAL METHOD
1.
From the Method tab, click the Manual radio button.
Figure 83. Theme: Method Tab (Numeric- Manual).
2.
Click the Features tab.
There are two options for selecting the Shading Option:
Colors
Hatch Patterns
Selecting Colors
1.
For Shading Option, click the Colors radio button.
Features Rendering Attributes
2.
In the Fill Opacity field, enter a number from 0 to 1 that indicates the opacity of the colored regions in the
layer.
3.
In the Border Opacity field, enter a number from 0 to 1 that indicates the opacity of region borders in the
layer.
Map Intelligence Client – User Manual
60
4.
In the Border Thickness field, enter the thickness in points or pixels (depending on the GIS provider) of the
region borders in the layer.
5.
In the Border Color field, enter a hexadecimal color value or select a color from the color picker for the
region border color.
Examples of using various Feature Attributes can be seen in Appendix A: Features Rendering
Attributes on page 128.
Region border attributes: If the Use Map Border Attributes option in the Settings section of
the MI Server Map Intelligence Tools page, is set to Yes (the default) then, the map's
attributes are used and any region border settings specified in the MI Client are ignored.
6.
Click the Configure tab.
7.
In the Number of Legend Classes field, enter the number of colors to appear in your shading range.
The list box below will update to display the default Red color palette and associated fields to enter
threshold values.
8.
Enter a value in each Threshold field.
Important Note: Threshold values must be sorted in order from lowest to highest value. i.e. the
lowest threshold value should be the first threshold value in the list; the next lowest threshold
value, the second threshold in the list, etc; to the final threshold in the list being the highest value.
To reorder the list use the up and down arrows next to each Threshold value.
9.
To change the default the Red color palette, from the Color Palette section, click on either the Green, Blue
or Assorted radio buttons.
You can change individual colors within a selected color palette by clicking on a particular colored
rectangle and selecting a color from the color picker. By right clicking on a colored rectangle you
are able to select from the context menu the Transparent or Unshaded color options.
10. Click the Values Outside Threshold colored rectangle and select a color from the color picker or right click
and select Transparent or Unshaded from the context menu, to represent any values that may be outside
the specified threshold values.
By default any region that does not contain any values are set to be transparent. If you wish to assign a
particular color for an empty region.
11. Click the Empty Color colored rectangle and select a color from the color picker or alternatively right click
and select Transparent or Unshaded from the context menu.
For further information on using the Transparent and Unshaded color options see Appendix B:
Using the Unshaded and Transparent Color Options on page 132.
Map Intelligence Client – User Manual
61
Figure 84 Region Relationship layer: Example of using Manual Colors
option and the results in the MI Viewer/Legend.
Figure 85 Radius Relationship layer: Example of using Manual Color
option and the results in the MI Viewer/Legend.
Map Intelligence Client – User Manual
62
Selecting Hatch Patterns
1.
For Shading Option, click the Hatch Patterns radio button.
Hatch Patterns for Radius Relationship layers are not available for the current version of Map
Intelligence IMS.
Features Rendering Attributes
2.
In the Hatch Opacity field, enter a number from 0 to 1 that indicates the opacity of the colored regions in
the layer.
3.
In the Border Opacity field, enter a number from 0 to 1 that indicates the opacity of region borders in a
layer.
4.
In the Border Thickness field, enter the thickness in points or pixels (depending on the GIS provider) of the
region borders in the layer.
5.
In the Border Color field, enter a hexadecimal color value or select a color from the color picker for the
region border color.
6.
In the Hatch Color field, enter a hexadecimal color value or select a color from the color picker for the hatch
color.
Examples of using various Feature Attributes can be seen in Appendix A: Features Rendering
Attributes on page 128.
Region border attributes: If the Use Map Border Attributes option in the Settings section of
the MI Server Map Intelligence Tools page, is set to Yes (the default) then, the map's
attributes are used and any region border settings specified in the MI Client are ignored.
7.
Click the Configure tab.
8.
In the Number of Legend Classes field, enter the number of hatches to appear in your shading range.
The list box below will update to display the hatches and associated fields to enter threshold values.
9.
Enter a value in each Threshold field.
Important Note: Threshold values must be sorted in order from lowest to highest value. i.e. the
lowest threshold value should be the first threshold value in the list; the next lowest threshold
value, the second threshold in the list, etc; to the final threshold in the list being the highest value.
To reorder the list use the up and down arrows next to each Threshold value.
10. To change individual threshold hatch patterns click on the hatched rectangle next to the threshold and
select a new hatch from the picker.
11. Click the Values Outside Threshold rectangle and select a hatch from the picker to represent any values that
may be outside the specified threshold values.
12. Click the Empty Hatch rectangle and select a hatch from the picker.
Map Intelligence Client – User Manual
63
Figure 86 Region Relationship layer: Example of using Manual Hatch
option and the results in the MI Viewer/Legend.
Figure 87 Radius Relationship layer: Example of using Manual Hatch
option and the results in the MI Viewer/Legend.
Null values are ignored on aggregations so
an empty area may contain points or rows
with null values.
Map Intelligence Client – User Manual
64
STRING AGGREGATION
Map Intelligence allows you to perform a function on string values from a specified fact column. String
aggregations require you to specify a color/hatch condition for a specific value instead of a threshold. The string
functions available include:
Most Common – this function applies the condition if the nominated value is the most common value in
the region.
Uniform – this function applies the condition if the nominated value is the only value from the specified
column in the region.
Majority – this function applies the condition if the nominated value makes up more than half of the
values in the region.
Creating a Quick Theme based on a string aggregation
1.
Select the Quick Theme radio button. The Quick Theme panel will be displayed.
2.
From the Point Layer drop down list, select the Point Layer containing the points that you want to
geographically relate to the reference layer.
When related to a built-in region layer the points will be grouped according to which regions they
are contained in. When related to another Point Layer, the points will be grouped according to
which points in the reference layer they all within the given radius of.
3.
From the Column drop down list, select the column to use to color the regions. The data for this column will
be extracted from the points and aggregated according to the geographical group of the points.
4.
For Data Type, select the String radio button.
5.
From the Aggregation Function drop-down list, select the function to use for the layer. The string functions
available are: MOST COMMON, UNIFORM and MAJORITY.
6.
For Color Palette, select either the Red, Green, Blue or Assorted radio button.
Creating an Advanced Theme based on a String Aggregation
1.
Click the Theme Type tab.
2.
From the Point Layer drop down list, select the Point Layer containing the points that you want to
geographically relate to the reference layer.
When related to a built-in region layer the points will be grouped according to which regions they
are contained in. When related to another Point Layer, the points will be grouped according to
which points in the reference layer they all within the give radius of.
3.
From the Column drop down list, select the column to use to color the regions. The data for this column will
be extracted from the points and aggregated according to the geographical group of the points.
4.
Select the String radio button.
Map Intelligence Client – User Manual
65
Figure 88. Theme Type Tab (String).
5.
Click the Data tab.
6.
From the Aggregation Function drop-down list, select the function to use for the layer. The string functions
available include: Most Common, Uniform and Majority.
Figure 89. Theme: Data Tab (String).
7.
Click the Features tab.
There are two options for selecting the Shading Option:
Colors
Hatch Patterns
Selecting Colors
1.
For Shading Option, click the Colors radio button.
Features Rendering Attributes
2.
In the Fill Opacity field, enter a number from 0 to 1 that indicates the opacity of the colored regions in the
layer.
3.
In the Border Opacity field, enter a number from 0 to 1 that indicates the opacity of region borders in the
layer.
4.
In the Border Thickness field, enter the thickness in points or pixels (depending on the GIS provider) of the
region borders in the layer.
5.
In the Border Color field, enter a hexadecimal color value or select a color from the color picker for the
region border color.
Examples of using various Feature Attributes can be seen in Appendix A: Features Rendering
Attributes on page 128.
Region border attributes: If the Use Map Border Attributes option in the Settings section of
Map Intelligence Client – User Manual
66
the MI Server Map Intelligence Tools page, is set to Yes (the default) then, the map's
attributes are used and any region border settings specified in the MI Client are ignored.
6.
Click the Configure tab. The Configure tab displays a list of values and an associated color.
The standard default palette used is Assorted.
7.
To select a different standard palette, from the Color Palette section, click either the Red, Green or Blue
radio buttons.
8.
To change a particular value color, click the colored rectangle next to the value and select a new color from
the color picker or alternatively right click and select Transparent or Unshaded from the context menu.
9.
To reorder the list use the up and down arrows next to each value.
10. To remove a value from the list, uncheck the value checkbox.
Any conditions not associated with a color will automatically be colored with the color selected for
‘Other’ (see below).
11. Click the Other Values rectangle and select a color from the color picker or alternatively right click and
select Transparent or Unshaded from the context menu, to represent any values that have not been
assigned with a specific color.
12. Click the Conflict Values rectangle and select a color from the color picker or alternatively right click and
select Transparent or Unshaded from the context menu, to represent any region or circle that does not
meet any specified condition. E.g. A Conflict condition will be returned if the ‘Uniform’ function has been set
and there is more than one type of value present in the region.
13. Click the Empty Values rectangle and select a color from the color picker or alternatively right click and
select Transparent or Unshaded from the context menu, to represent any region or circle that does not
contain any values.
For further information on using the Transparent and Unshaded color options see Appendix B:
Using the Unshaded and Transparent Color Options on page 132.
Map Intelligence Client – User Manual
67
Figure 90. Theme: Configure Tab (String - Colors).
Figure 91. Region Relationship layer: Example of results in the MI Viewer/Legend, using the String – Colors.
Null values are ignored on aggregations so an empty area may contain points or rows with null values.
Selecting Hatch Patterns
1.
For Shading Option, click the Hatch Patterns radio button.
Hatch Patterns for Radius Relationship layers are not available for the current version of Map
Intelligence IMS.
Features Rendering Attributes
2.
In the Hatch Opacity field, enter a number from 0 to 1 that indicates the opacity of the colored regions in
the layer.
3.
In the Border Opacity field, enter a number from 0 to 1 that indicates the opacity of region borders in the
layer.
Map Intelligence Client – User Manual
68
4.
In the Border Thickness field, enter the thickness in points or pixels (depending on the GIS provider) of the
region borders in the layer.
5.
In the Border Color field, enter a hexadecimal color value or select a color from the color picker for the
region border color.
6.
In the Hatch Color field, enter a hexadecimal color value or select a color from the color picker for the hatch
color.
7.
Examples of using various Feature Attributes can be seen in Appendix A: Features Rendering
Attributes on page 128.
Region border attributes: If the Use Map Border Attributes option in the Settings section of
the MI Server Map Intelligence Tools page, is set to Yes (the default) then, the map's
attributes are used and any region border settings specified in the MI Client are ignored.
Click the Configure tab.
The Configure tab displays a list of values and an associated hatch.
8.
To change a particular value hatch, click the hatch rectangle next to the value and select a new hatch from
the hatch picker.
9.
To reorder the list use the up and down arrows next to each value.
10. To remove a value from the list, uncheck the value checkbox.
Any conditions not associated with a hatch will automatically be hatched with the hatched selected
for ‘Other’ (see below).
11. Click the Other hatch rectangle and select a hatch to represent any values that have not been assigned with
a specific condition.
12. Click the Conflict rectangle and select a hatch to represent any region or circle that does not meet any
specified condition. E.g. A Conflict condition will be returned if the ‘Uniform’ function has been set and there
is more than one type of value present in the region.
13. Click the Empty rectangle and select a hatch to represent any region or circle that does not contain any
values.
Map Intelligence Client – User Manual
69
Figure 92. Theme: Configure Tab (String – Hatch Patterns).
Figure 93. Region Relationship layer: Example of results in the MI Viewer/Legend, using the String – Hatch Patterns.
SAVING A LAYER
To save the Relationship layer configuration
1.
Click the OK button on the Relationship Layer configuration screen.
The Relationship Layer name is listed on the Relationship Layer tab.
2.
Click the Done button on the Layers window to return to the worksheet.
EDITING A LAYER
To edit a Relationship Layer configuration
1.
From the Map Intelligence drop-down menu, select Layers, the Layers window will open.
2.
Select the Relationship Layers tab.
Map Intelligence Client – User Manual
70
3.
Click on the layer you want to edit and click the Edit button.
The configured Relationship Layer configuration screen will open for editing.
4.
After making your edits, click OK to save your changes.
5.
Click the Done button on the Layers window.
If you change the layer name, a copy of the layer will be created with the new layer name.
DELETING A LAYER
To delete a Relationship layer configuration
1.
From the Map Intelligence drop-down menu, select Layers, the Layers window will open.
2.
Select the Relationship Layers tab.
3.
Click on the layer you want to delete and click the Delete button.
4.
A message box will open asking you to confirm you wish to delete the layer. Click the Yes button.
Figure 94 Delete layer confirmation message box.
5.
After deleting the layer, click the Done button on the Layers window.
Map Intelligence Client – User Manual
71
CONFIGURE AREA GROUP LAYER
For a description of Area Group layers, see Layer Types, Area Group Layer.
To open the Area Group Layer configuration screen
1.
From the Map Intelligence drop-down menu, select Layers, the Layers window will open.
2.
Select the Area Group Layer tab.
3.
Click the Add button.
The Area Group Layer configuration screen will appear.
Figure 95 Area Group configuration screen
LAYER PROPERTIES SECTION
To configure the Layer Properties section
1.
In the Layer Name text box, enter a title for the layer.
Map Intelligence Client – User Manual
72
2.
You can specify a range in which the layer will be visible on the map by entering a Minimum Zoom and
Maximum Zoom value. The layer will only be visible if the current map width is within the specified
minimum and maximum zoom values.
3.
Select the Set layer as visible in map checkbox if you wish this particular layer to be visible when you first
access the MI Viewer.
Figure 96. Layer Properties Section of the Area Group Layer configuration screen.
WORKSHEET
To configure the Worksheet section
Figure 97 . Worksheet Section of the Area Group Layer Configuration Screen.
1.
From the Name drop-down list, select the worksheet which contains the data to be used as points for this
layer.
All worksheets within the Workbook will appear in the drop-down list.
2.
Click on the Setup Worksheet Data button. The Setup Worksheet Data dialog box will appear.
This step is only necessary if you wish to change the standard default setting.
This dialog box allows you to tell the MI Client which cells on the worksheet constitute data and which are
headers. There are two ways of configuring the worksheet, by Worksheet Location or by Data in the
Worksheet.
WORKSHEET LOCATION OPTION
a.
Select the Worksheet Location radio button.
b.
In the Headings Row field, enter the number of the worksheet row containing your headings.
Map Intelligence Client – User Manual
73
c.
In the Data Row field, enter the number of the first worksheet row containing your data.
d.
In the First Column field, enter the first worksheet column containing your data.
e.
Click OK, to return to the Area Group Layer configuration screen.
Figure 98. Setup Worksheet Data - Worksheet location.
The example above shows the default settings, the first row contains the headings, the second and
subsequent rows contain data. The first column to contain data is Column A.
DATA IN THE WORKSHEET LOCATION OPTION
a.
Select the Data in the Worksheet radio button.
b.
In the First Column field, enter the first worksheet column containing your data.
c.
From the Worksheet drop-down list, select the worksheet containing your data.
If a different worksheet is selected to the one you selected previously for the Worksheet Name
field, the Worksheet Name field will automatically be updated with your new choice.
d.
From the Headings Row drop-down list, select your heading row.
e.
From the Data Row drop-down list, select the first row of the worksheet containing your data.
f.
Click OK, to return to the Area Group Layer configuration screen.
Map Intelligence Client – User Manual
74
Figure 99. Setup Worksheet Data - Data in the Worksheet.
If you intend to use Advanced Filtering, select the Data in the Worksheet Location option when
configuring the Setup Worksheet Data, this option does not require any adjustment to the location
settings if Advanced Filtering is used.
MAP SECTION
The Map section allows you to configure the necessary map settings for the layer.
To configure the Map section
1.
From the Map Layer to Color Code field, enter the built-in map layer that you want to shade or apply a color
to.
2.
Only layers containing regions can be used as reference layers.
Built-in layers are arranged in a particular order on the map. When selecting a built-in layer to
shade, all map layers that sit under the selected layer will be covered by the selected color or
hatch.
If you wish to find out more information about the built-in layers available, click the Built-in
Layer Query Tool button - see Appendix C: Map Intelligence Query Tool page 136 for further
details.
From the Label Column drop-down, select the column in the map layer that contains the values to be used
as labels for the regions. If you wish the labels to be visible when you initially view the map, select the Show
Labels checkbox.
If the Show Labels checkbox is not selected, End Users can display the labels by selecting the Labels
checkbox in the Show/Hide Layers control panel in the MI Viewer.
3.
In the Legend Description field, enter a description to use in the legend for this layer. If this field is left blank
a description will be generated by Map Intelligence.
Map Intelligence Client – User Manual
75
Figure 100. Legend showing a Map Intelligence
generated description.
Figure 101. Legend showing a customized description
Figure 102 Map section of the Area Group Layer configuration screen.
DATA COLUMN COMMON TO MAP AND WORKSHEET SECTION
Area Group Layers require a union between a column in your worksheet and a column in the built-in map layer
that you want to shade. You need matching values from these two columns for the Area Group Layer to work.
To configure the Data Column to map and Worksheet section
1.
From the Worksheet Join Column drop-down list, select a column from your worksheet that contains values
that will match the ones specified in the Map Layer Join Column (below).
2.
From the Map Layer Join Column drop-down list, select a column from the built in map layer that contains
values that match the ones specified in the Worksheet Join Column (above).
Figure 103 Data Column Common to Map and Worksheet Section of the Area Group Layer Configuration Screen.
Map Intelligence Client – User Manual
76
CREATING THEMES FOR AREA GROUP LAYERS
Creating themes for Area Group Layers requires you to specify threshold conditions based on a Numeric or String
aggregation using the Themes section on the Area Group Layer configuration screen.
NUMERIC AGGREGATION
Map Intelligence allows you to perform a function on values from a specified column. The specified built-in map
layer will then be shaded according to the resulting values. The numeric functions available include: Count, Sum,
Min, Max, Mean and Median.
There are two options for creating themes:
Quick Theme: This option allows you to quickly create a theme using basic color palettes.
Advanced Theme: This advanced option allows you to create sophisticated themes, including using
ColorBrewer palettes and hatches.
Clicking the Advanced Theme radio button will permanently disable the Quick Theme option
for this layer.
Creating a Quick Theme based on a numeric aggregation
1.
Select the Quick Theme radio button. The Quick Theme panel will be displayed.
2.
From the Fact Column drop down list, select the column that contains the values to be measured for this
layer.
3.
For Data Type, select the Numeric radio button.
4.
From the Aggregation Function drop-down list, select the function to use for the layer. The numeric
functions available are: Count, Sum, Min, Max, Mean and Median.
5.
For Color Palette, select either the Red, Green, Blue or Assorted radio button.
Figure 104. Quick Theme panel.
Clicking the Advanced Theme radio button will permanently disable the Quick Theme option
for this layer.
Map Intelligence Client – User Manual
77
Figure 105. Area Group Layer – Example Map View and Legend showing Quick Theme (Blue option).
Creating an Advanced Theme based on a numeric aggregation
Clicking the Advanced Theme radio button will permanently disable the Quick Theme option for
this layer.
1.
Click the Theme Type tab.
2.
From the Fact Column drop down list, select the column that contains the values to be measured for this
layer.
3.
For Data Type, select the Numeric radio button.
Figure 106. Theme Type Tab (Numeric).
4.
Click the Data tab.
5.
From the Aggregation Function drop-down list, select the function to use for the layer. The numeric
functions available include: Count, Sum, Min, Max, Mean and Median.
6.
For the Calculation, click either the by Value or by Percentage radio button.
The aggregates can be used as the raw aggregate value or as a percentage of the total aggregate over the
Point Layer.
Note that only one color and one hatch layer can be displayed simultaneously for a particular
built-in-layer. If you have multiple layers that use the same built-in layer, you can switch between
these using the Themes option from the MI Viewer (refer to the Map Intelligence MI Viewer
Map Intelligence Client – User Manual
78
User Manual – (see Appendix D: Map Intelligence Manuals and Guides on page 137).
Figure 107. Data Tab (Numeric).
7.
Click the Method tab.
There are two methods for applying themes:
Automatic Method
Manual Method
AUTOMATIC METHOD
1.
For Theme Method, click the Automatic radio button.
Figure 108. Method Tab (Numeric- Automatic).
2.
Click the Features tab.
3.
From the Scheme drop-down list, select a classification scheme.
You can use a standard classification scheme to group similar values to look for patterns in the data. You can
choose from three schemes for grouping data values into classes based on how the data values are
distributed.
Equal Interval: The difference between the high and low values is the same for every class. So, the
classification of the data will be based on a set of equal splits. For example, if the lowest value is 0 and
the highest value is 10 in the data, and 5 classes are requested, the range of each class will be 0 to 2, 2
to 4, 4 to 6, 6 to 8, 8 to 10.
Quantile: Each class contains an equal number of features. In this case, the points are sorted in
ascending order (for the chosen data field) and each class is filled with (total number of points)/(number
of classes) points starting from the lowest value to the highest.
Map Intelligence Client – User Manual
79
Standard Deviation: Features are placed in classes based on how much their values vary from the mean.
First the mean and standard deviation of the data values are calculated. The class breaks are found by
successively adding or subtracting multiples of the standard deviation from the mean.
4.
If Equal Interval was selected for Scheme, for Scale, click either the Linear or Logarithmic radio button.
5.
If Standard Deviation was selected for Scheme, for Multiplier enter the multiplying factor.
6.
From the Number of Legend Classes drop-down list, select the number of colors to appear in your shading
range.
There are three options for selecting the Shading Option:
Specific Colors: Allows you to specify a ColorBrewer palette or select individual colors.
Color Range: Allows you to choose a pre-defined color set or a specific start and end color.
Hatch Patterns: Allows you to specify a particular hatch for each class.
Selecting Specific Colors
1.
Click the Specific Colors radio button.
Features Rendering Attributes
2.
In the Fill Opacity field, enter a number from 0 to 1 that indicates the opacity of the colored regions in the
layer.
3.
In the Border Opacity field, enter a number from 0 to 1 that indicates the opacity of region borders in the
layer.
4.
In the Border Thickness field, enter the thickness in points or pixels (depending on the GIS provider) of the
region borders in the layer.
5.
In the Border Color field, enter a hexadecimal color value or select a color from the color picker for the
region border color.
Examples of using various Feature Attributes can be seen in Appendix A: Features Rendering
Attributes on page 128.
Region border attributes: If the Use Map Border Attributes option in the Settings section of
the MI Server Map Intelligence Tools page, is set to Yes (the default) then, the map's
attributes are used and any region border settings specified in the MI Client are ignored.
Map Intelligence Client – User Manual
80
Figure 109. Features Tab (Numeric- Automatic – Specific Colors).
6.
Click the Configure tab.
Specific Colors allows you to specify a ColorBrewer palette or select individual colors for each class from a
color picker. The default color palette is the first palette in the Sequential palette series (see Color Brewer
Palettes below).
USING COLORBREWER PALETTES
These palettes have been created using the ColorBrewer, a tool designed to create good color schemes for
maps. There are three types of palettes:
Sequential palettes are suited to ordered data that progress from low to high. Lightness steps
dominate the look of these schemes, with light colors for low data values to dark colors for high
data values (Figure 111).
Diverging palettes put equal emphasis on mid-range critical values and extremes at both ends of
the data range. The critical class or break in the middle of the legend is emphasized with light colors
and low and high extremes are emphasized with dark colors that have contrasting hues (Figure
112).
Qualitative palettes do not imply magnitude differences between legend classes, and hues are used
to create the primary visual differences between classes. Qualitative schemes are best suited to
representing nominal or categorical data (Figure 113).
The number of colors available in each palette is determined by the Number of Classes selected on the
Features Tab.
Map Intelligence Client – User Manual
81
7.
From the ColorBrewer Palette drop down box, select a Palette Type (Sequential, Diverging or Qualitative).
The available palettes will appear below in the Preview list box.
The availability of ColorBrewer Palettes depends on the number of Legend Classes selected on the
Features tab.
Less than 2 Legend Classes: No palettes available.
Between 3 and 9 Legend Classes: All palettes available.
For 10 Legend Classes: Only Diverging and Qualitative palettes available.
For more than 10 Legend Classes: Only Qualitative palettes available.
To see the color palette in reverse, click the Display palette colors in reverse checkbox, below the
Palette Preview list box.
8.
Click on a palette in the preview box to select it. The colored rectangles next to each class will update.
9.
You can change any of the colors assigned to a particular Class by clicking on the colored rectangle and
selecting a different color from the color picker. By right clicking on a colored rectangle you are able to
select from the context menu the Transparent or Unshaded color options.
By default any region that does not contain any values are set to be transparent. If you wish to assign a
particular color for an empty region.
10. Click the Empty Color colored rectangle and select a color from the color picker or alternatively right click
and select Transparent or Unshaded from the context menu.
For further information on using the Transparent and Unshaded color options see Appendix B:
Using the Unshaded and Transparent Color Options on page 132.
Map Intelligence Client – User Manual
82
Figure 110. Configure Tab (Numeric- Automatic – Specific Colors).
Map Intelligence Client – User Manual
83
Figure 111. Area Group Layer – Example Map View and Legend showing Specific Color Theme (ColorBrewer Palette:
Sequential).
Figure 112. Area Group Layer – Example Map View and Legend showing Specific Color Theme (ColorBrewer Palette:
Diverging).
Map Intelligence Client – User Manual
84
Figure 113. Area Group Layer – Example Map View and Legend showing Specific Color Theme (ColorBrewer Palette:
Qualitative).
Selecting Color Range
1.
Click the Color Range radio button.
Features Rendering Attributes
2.
In the Fill Opacity field, enter a number from 0 to 1 that indicates the opacity of the colored regions in the
layer.
3.
In the Border Opacity field, enter a number from 0 to 1 that indicates the opacity of region borders in the
layer.
4.
In the Border Thickness field, enter the thickness in points or pixels (depending on the GIS provider) of the
region borders in the layer.
5.
In the Border Color field, enter a hexadecimal color value or select a color from the color picker for the
region border color.
Examples of using various Feature Attributes can be seen in Appendix A: Features Rendering
Attributes on page 128.
Region border attributes: If the Use Map Border Attributes option in the Settings section of
the MI Server Map Intelligence Tools page, is set to Yes (the default) then, the map's
attributes are used and any region border settings specified in the MI Client are ignored.
Map Intelligence Client – User Manual
85
Figure 114. Features Tab (Numeric- Automatic – Color Range).
6.
Click the Configure tab.
There are two options for color range, Pre-defined Color Set or Custom Colors. Pre-defined Colors shades
according to color schemes built into Map Intelligence. Custom Colors allows you to choose a start color and end
color and have a spectrum of colors between these two.
Map Intelligence Client – User Manual
86
Selecting Pre-defined Colors
1.
Click the Pre-defined Color Set radio
button.
2.
From the Shade Color drop-down list,
select a pre-defined color scheme.
When using a pre-defined
color scheme, Empty
regions are always
transparent.
Figure 115. Configure Tab (Numeric- Automatic –Color Range – Pre-defined
Color Set).
Figure 116. Area Group Layer – Example Map View and Legend showing Color Range - Pre-defined Color set (Red).
Map Intelligence Client – User Manual
87
Selecting Custom Colors
1.
Click the Custom Colors radio
button.
2.
Click the Custom Colors radio
button.
3.
Click the Start Color button.
4.
Select the start color from the
color picker and click OK.
5.
Click the End Color button.
6.
Select the end color from the
color picker and click OK.
Figure 117. Configure Tab (Numeric- Automatic –Color Range – Color Colors).
By default any region that does not contain any values are set to be transparent. If you wish to assign a
particular color for an empty region
7.
Uncheck the Transparent checkbox.
8.
Click the Empty Color button.
9.
From the color picker, select a color for any region that does not contain any values and click the OK.
Figure 118. Area Group Layer – Example Map View and Legend showing Color Range – Custom Colors (Yellow to Red).
Selecting Hatch Patterns
1.
For Shading Option, click the Hatch Patterns radio button.
Hatch Patterns for Radius Relationship layers are not available for the current version of Map
Intelligence IMS.
Map Intelligence Client – User Manual
88
Features Rendering Attributes
2.
In the Hatch Opacity field, enter a number from 0 to 1 that indicates the opacity of the colored regions in
the layer.
3.
In the Border Opacity field, enter a number from 0 to 1 that indicates the opacity of region borders in the
layer.
4.
In the Border Thickness field, enter the thickness in points or pixels (depending on the GIS provider) of the
region borders in the layer.
5.
In the Border Color field, enter a hexadecimal color value or select a color from the color picker for the
region border color.
6.
In the Hatch Color field, enter a hexadecimal color value or select a color from the color picker for the hatch
color.
Examples of using various Feature Attributes can be seen in Appendix A: Features Rendering
Attributes on page 128.
Region border attributes: If the Use Map Border Attributes option in the Settings section of
the MI Server Map Intelligence Tools page, is set to Yes (the default) then, the map's
attributes are used and any region border settings specified in the MI Client are ignored.
Figure 119. Features Tab (Numeric- Automatic – Hatch Patterns).
7.
Click the Configure tab.
Map Intelligence Client – User Manual
89
Hatch Patterns allows you to specify a particular hatch for each class.
8.
Click the Class 1 hatch rectangle.
9.
Select a hatch from the hatch
picker.
10. Repeat Steps the above steps for
each class listed.
By default any region that does not
contain any values are set to be
transparent. If you wish to assign a
particular hatch for an empty
region
11. Click the Empty Hatch rectangle.
Figure 120. Configure Tab (Numeric- Automatic – Hatch).
12. Select a hatch for any region that does not contain any values.
Figure 121. Area Group Layer – Example Map View and Legend showing Hatches (Red).
Map Intelligence Client – User Manual
90
MANUAL METHOD
1.
From the Method tab, click the Manual radio button.
Figure 122. Theme: Method Tab (Numeric- Manual).
2.
Click the Features tab.
Selecting Colors
1.
For Shading Option, click the Colors radio button.
Features Rendering Attributes
2.
In the Fill Opacity field, enter a number from 0 to 1 that indicates the opacity of the colored regions in the
layer.
3.
In the Border Opacity field, enter a number from 0 to 1 that indicates the opacity of region borders in the
layer.
4.
In the Border Thickness field, enter the thickness in points or pixels (depending on the GIS provider) of the
region borders in the layer.
5.
In the Border Color field, enter a hexadecimal color value or select a color from the color picker for the
region border color.
Examples of using various Feature Attributes can be seen in Appendix A: Features Rendering
Attributes on page 128.
Region border attributes: If the Use Map Border Attributes option in the Settings section of
the MI Server Map Intelligence Tools page, is set to Yes (the default) then, the map's
attributes are used and any region border settings specified in the MI Client are ignored.
6.
Click the Configure tab.
7.
In the Number of Legend Classes field, enter the number of colors to appear in your shading range.
The list box below will update to display the default Red color palette and associated fields to enter
threshold values.
8.
Enter a value in each Threshold field.
Important Note: Threshold values must be sorted in order from lowest to highest value. i.e. the
lowest threshold value should be the first threshold value in the list; the next lowest threshold
Map Intelligence Client – User Manual
91
value, the second threshold in the list, etc; to the final threshold in the list being the highest value.
To reorder the list use the up and down arrows next to each Threshold value.
9.
To change the default the Red color palette, from the Color Palette section, click on either the Green, Blue
or Assorted radio buttons.
You can change individual colors within a selected color palette by clicking on a particular colored
rectangle and selecting a color from the color picker. By right clicking on a colored rectangle you
are able to select from the context menu the Transparent or Unshaded color options.
10. Click the Values Outside Threshold colored rectangle and select a color from the color picker or right click
and select Transparent or Unshaded from the context menu, to represent any values that may be outside
the specified threshold values.
By default any region that does not contain any values are set to be transparent. If you wish to assign a
particular color for an empty region
11. Click the Empty Color colored rectangle and select a color from the color picker or alternatively right click
and select Transparent or Unshaded from the context menu.
For further information on using the Transparent and Unshaded color options see Appendix B:
Using the Unshaded and Transparent Color Options on page 132.
Figure 123 Area Group layer: Example of using Manual Colors option
and the results in the MI Viewer/Legend.
Selecting Hatch Patterns
1.
For Shading Option, click the Hatch Patterns radio button.
Hatch Patterns for Radius Relationship layers are not available for the current version of Map
Intelligence IMS.
Map Intelligence Client – User Manual
92
Features Rendering Attributes
2.
In the Hatch Opacity field, enter a number from 0 to 1 that indicates the opacity of the colored regions in
the layer.
3.
In the Border Opacity field, enter a number from 0 to 1 that indicates the opacity of region borders in the
layer.
4.
In the Border Thickness field, enter the thickness in points or pixels (depending on the GIS provider) of the
region borders in the layer.
5.
In the Border Color field, enter a hexadecimal color value or select a color from the color picker for the
region border color.
6.
In the Hatch Color field, enter a hexadecimal color value or select a color from the color picker for the hatch
color.
Examples of using various Feature Attributes can be seen in Appendix A: Features Rendering
Attributes on page 128.
Region border attributes: If the Use Map Border Attributes option in the Settings section of
the MI Server Map Intelligence Tools page, is set to Yes (the default) then, the map's
attributes are used and any region border settings specified in the MI Client are ignored.
Map Intelligence Client – User Manual
93
Figure 124. Features Tab (Numeric- Manual – Hatch Patterns).
7.
Click the Configure tab.
8.
In the Number of Legend Classes field, enter the number of hatches to appear in your shading range.
The list box below will update to display the hatches and associated fields to enter threshold values.
9.
Enter a value in each Threshold field.
Important Note: Threshold values must be sorted in order from lowest to highest value. i.e. the
lowest threshold value should be the first threshold value in the list; the next lowest threshold
value, the second threshold in the list, etc; to the final threshold in the list being the highest value.
To reorder the list use the up and down arrows next to each Threshold value.
10. To change individual threshold hatch patterns click on the hatched rectangle next to the threshold and
select a new hatch from the picker.
11. Click the Values Outside Threshold rectangle and select a hatch from the picker to represent any values that
may be outside the specified threshold values.
12. Click the Empty Hatch rectangle and select a hatch from the picker.
Map Intelligence Client – User Manual
94
Figure 125 Area Group layer: Example of using Manual Hatch option
and the results in the MI Viewer/Legend.
Null values are ignored on aggregations so an empty area may contain points or rows with null values.
STRING AGGREGATION
Map Intelligence allows you to perform a function on string values from a specified fact column. String
aggregations require you to specify a color/hatch condition for a specific value instead of a threshold. The string
functions available include:
Most Common – this function applies the condition if the nominated value is the most common value in
the region.
Uniform – this function applies the condition if the nominated value is the only value from the specified
column in the region.
Majority – this function applies the condition if the nominated value makes up more than half of the
values in the region.
Creating a Quick Theme based on a string aggregation
1.
Select the Quick Theme radio button. The Quick Theme panel will be displayed.
2.
From the Fact Column drop-down list, select the column that contains the values to measured in the layer.
3.
For Data Type, select the String radio button.
4.
From the Aggregation Function drop-down list, select the function to use for the layer. The string functions
available are: MOST COMMON, UNIFORM and MAJORITY.
5.
For Color Palette, select either the Red, Green, Blue or Assorted radio button.
Creating an Advanced Theme based on a String Aggregation
1.
Click the Theme Type tab.
Map Intelligence Client – User Manual
95
2.
From the Fact Column drop-down list, select the column that contains the values to measured in the layer.
3.
Select the String radio button.
Figure 126. Theme Type Tab (String).
4.
Click the Data tab.
5.
From the Aggregation Function drop-down list, select the function to use for the layer. The string functions
available include: Most Common, Uniform and Majority.
Figure 127. Theme: Data Tab (String).
6.
Click the Features tab.
There are two options for selecting the Shading Option:
Colors
Hatch Patterns
Selecting Colors
1.
For Shading Option, click the Colors radio button.
Features Rendering Attributes
2.
In the Fill Opacity field, enter a number from 0 to 1 that indicates the opacity of the colored regions in the
layer.
3.
In the Border Opacity field, enter a number from 0 to 1 that indicates the opacity of region borders in the
layer.
4.
In the Border Thickness field, enter the thickness in points or pixels (depending on the GIS provider) of the
region borders in the layer.
5.
In the Border Color field, enter a hexadecimal color value or select a color from the color picker for the
region border color.
Map Intelligence Client – User Manual
96
6.
Examples of using various Feature Attributes can be seen in Appendix A: Features Rendering
Attributes on page 128.
Region border attributes: If the Use Map Border Attributes option in the Settings section of
the MI Server Map Intelligence Tools page, is set to Yes (the default) then, the map's
attributes are used and any region border settings specified in the MI Client are ignored.
Click the Configure tab. The Configure tab displays a list of values and an associated color.
The standard default palette used is Assorted.
7.
To select a different standard palette, from the Color Palette section, click either the Red, Green or Blue
radio buttons.
8.
To change a particular value color, click the colored rectangle next to the value and select a new color from
the color picker or alternatively right click and select Transparent or Unshaded from the context menu.
9.
To reorder the list use the up and down arrows next to each value.
10. To remove a value from the list, uncheck the value checkbox.
Any conditions not associated with a color will automatically be colored with the color selected for
‘Other’ (see below).
11. Click the Other Values rectangle and select a color from the color picker or alternatively right click and
select Transparent or Unshaded from the context menu, to represent any values that have not been
assigned with a specific color.
12. Click the Conflict Values rectangle and select a color from the color picker or alternatively right click and
select Transparent or Unshaded from the context menu, to represent any region or circle that does not
meet any specified condition. E.g. A Conflict condition will be returned if the ‘Uniform’ function has been set
and there is more than one type of value present in the region.
13. Click the Empty Values rectangle and select a color from the color picker or alternatively right click and
select Transparent or Unshaded from the context menu, to represent any region or circle that does not
contain any values.
For further information on using the Transparent and Unshaded color options see Appendix B:
Using the Unshaded and Transparent Color Options on page 132.
Map Intelligence Client – User Manual
97
Figure 128. Theme: Configure Tab (String - Colors).
Figure 129. Area Group layer: Example of results in the MI Viewer/Legend, using the String – Colors.
Null values are ignored on aggregations so an empty area may contain points or rows with null values.
Selecting Hatch Patterns
1.
For Shading Option, click the Hatch Patterns radio button.
Features Rendering Attributes
2.
In the Hatch Opacity field, enter a number from 0 to 1 that indicates the opacity of the colored regions in
the layer.
3.
In the Border Opacity field, enter a number from 0 to 1 that indicates the opacity of region borders in the
layer.
Map Intelligence Client – User Manual
98
4.
In the Border Thickness field, enter the thickness in points or pixels (depending on the GIS provider) of the
region borders in the layer.
5.
In the Border Color field, enter a hexadecimal color value or select a color from the color picker for the
region border color.
6.
In the Hatch Color field, enter a hexadecimal color value or select a color from the color picker for the hatch
color.
7.
Examples of using various Feature Attributes can be seen in Appendix A: Features Rendering
Attributes on page 128.
Region border attributes: If the Use Map Border Attributes option in the Settings section of
the MI Server Map Intelligence Tools page, is set to Yes (the default) then, the map's
attributes are used and any region border settings specified in the MI Client are ignored.
Click the Configure tab.
The Configure tab displays a list of values and an associated hatch.
8.
To change a particular value hatch, click the hatch rectangle next to the value and select a new hatch from
the hatch picker.
9.
To reorder the list use the up and down arrows next to each value.
10. To remove a value from the list, uncheck the value checkbox.
Any conditions not associated with a hatch will automatically be hatched with the hatched selected
for ‘Other’ (see below).
11. Click the Other hatch rectangle and select a hatch to represent any values that have not been assigned with
a specific condition.
12. Click the Conflict rectangle and select a hatch to represent any region or circle that does not meet any
specified condition. E.g. A Conflict condition will be returned if the ‘Uniform’ function has been set and there
is more than one type of value present in the region.
13. Click the Empty rectangle and select a hatch to represent any region or circle that does not contain any
values.
Map Intelligence Client – User Manual
99
Figure 130. Theme: Configure Tab (String – Hatch Patterns).
Figure 131. Area Group layer: Example of results in the MI Viewer/Legend, using the String – Hatch Patterns.
INFORMATION POPUPS ON AREA GROUP LAYERS
Information popup boxes provide further information about a region when you move your mouse over the
region on the map.
1.
From the Themes section, click the Popups tab.
2.
To enable Information popups, select the Show popups on regions checkbox.
3.
In the Popup Description field, enter a description to use for Information Popups for this layer. The Popup
Description describes each region of the layer and may contain any of the following parameters:
${label}
${value}
Will be replaced with the label for the region.
Will be replaced with the value for the region determined by the column selected in the
theme (see Creating Themes for Relationship Layers).
Example
${value} items in ${label}
Map Intelligence Client – User Manual
100
If this field is left blank a description will be generated by Map Intelligence.
Figure 132. Information popup displaying a Map Intelligence
generated Popup description
Figure 133. Customized Popup description. In this example
the following description was entered into the Popup
Description text box.
Total Annual Salary in ${label} is ${value}
The Popups tab shows a list of data columns, these columns can be specified as display columns to be included as
additional information in the Information pop-up box. Each column has an associated aggregation function.
To configure data columns
1.
Select a data column from the list on the left.
Below the data column list, is a drop-down list, displaying a aggregation functions.
2.
Select an Aggregation Function and click the
the right.
3.
Repeat steps 1 and 2 to add further data columns.
button. The selected data column will appear in the box on
You can remove a data column by selecting the data column in the right-hand list box and clicking
the
button.
To select all the data columns, click the
To remove all data columns from the right-hand list, click the
button.
button.
The examples shown in Figure 134 and Figure 135, show the result of adding the two additional data columns,
showing Total Population for the LGA and the number of people in the LGA for a target age range (15 to 19 year
olds).
Map Intelligence Client – User Manual
101
Figure 134. Selecting data columns.
Figure 135. Example of Information Popup box with additional data column information.
SAVING THE LAYER
To save the Area Group layer configuration.
1.
Click the OK button on the Area Group Layer configuration screen.
The Area Group Layer name is listed on the Area Group Layer tab.
2.
Click the Done button on the Layers window to return to the worksheet.
EDITING THE LAYER
To edit an Area Group Layer configuration
1.
From the Map Intelligence drop-down menu, select Layers, the Layers window will open
2.
Select the Area Group Layers tab.
3.
Click on the layer you want to edit and click the Edit button.
Map Intelligence Client – User Manual
102
The Area Group Layer configuration screen will open for editing.
4.
After making your edits, click OK to save your changes.
5.
Click the Done button on the Layers window.
If you change the layer name, a copy of the layer will be created with the new layer name.
DELETING THE LAYER
To delete a Area Group layer configuration.
1.
From the Map Intelligence drop-down menu, select the Layers button, the Layers window will open.
2.
Select the Area Group Layers tab.
3.
Click on the layer you want to delete and click the Delete button.
4.
A message box will open asking you to confirm you wish to delete the layer. Click the Yes button.
Figure 136 Delete layer confirmation message box
5.
After deleting the layer, click the Done button on the Layers window.
Map Intelligence Client – User Manual
103
CONFIGURE PIVOT LAYERS
The Pivot Layer tab allows you to configure a collection of Area Group layers (see Layer Types, Area Group
Layer) based on a worksheet within your Excel Workbook which is in pivot form.
The image below shows a worksheet in pivot form, column A lists the names of the Local Government Areas
(LGA), column B lists the franchise companies within each area, column C and column D are the revenue fact
columns for the years 2009 and 2010. Once the MI Client Pivot Layer configuration screen is complete you can
generate Area Group Layers with multiple themes describing each row in column B for the Local Government
Area.
Figure 137 Example worksheet in pivot form
There can only be a maximum of 3 columns pivoted on the right or vertical axis of the data and a
maximum of 3 header rows.
Map Intelligence Client – User Manual
104
In this example Map Intelligence will theme each Local Government Area according to the revenue generated by
the franchise company for each year. When the map is generated in the MI Viewer, from the Themes button on
the Top Panel, you can select the franchise and year you wish to display on the map. For further information on
using the Themes refer to the MI Viewer User Manual.
Figure 138 Selecting from Themes Oscars by 2010 shades the LGA’s according to the revenue generated by Oscar Restaurants.
To open the Pivot Layer configuration screen
1.
From the Map Intelligence drop-down menu, select Layers, the Layers window will open.
2.
Select the Pivot Layer tab.
3.
Click the Add button.
The Pivot Layer configuration screen will appear.
Map Intelligence Client – User Manual
105
Figure 139 Pivot Layer configuration screen
LAYER PROPERTIES SECTION
To configure the Layer Properties section
1.
In the Layer Name text box, enter the name for the Pivot Layer.
2.
You can specify a range in which the layer will be visible on the map by entering a Minimum Zoom and
Maximum Zoom value. The layer will only be visible if the current map width is within the specified
minimum and maximum zoom values.
The layer will only be visible if the current map width is within the specified minimum and maximum
zoom values.
3.
Select the Set layer as visible in map checkbox if you wish this particular layer to be visible when you first
access the MI Viewer.
4.
Click on the Setup Worksheet Data button. The Setup Worksheet Data dialog box will appear.
Map Intelligence Client – User Manual
106
This dialog box allows you to tell the MI Client which cells on the worksheet constitute data rather than
headings.
This step is only necessary if you wish to change the suggested settings.
5.
In the First Row field, enter the number of the first spreadsheet row containing your data.
6.
In the First Column field, enter the first spreadsheet column containing your data.
Figure 140 Setup Worksheet Data dialog box
The example above shows the suggested settings, the first row to contain data and not the headings, is Row
2, the first column to contain data is Column C.
7.
Click OK, to return to the Pivot Layer configuration screen.
Figure 141 Layer Properties Section of the Pivot Layer configuration screen.
WORKSHEET SECTION
The Worksheet section allows you to configure the necessary worksheet settings for the layer.
To configure the Worksheet section
1.
From the Name drop-down list, select the worksheet which contains the data to be used for this layer.
All worksheets within the spreadsheet will appear in the drop-down list.
Map Intelligence Client – User Manual
107
Figure 142 Worksheet Section of the Pivot Layer configuration screen.
THEMES SECTION
To configure the Themes section
1.
From the Number of Classes drop-down list, select the number of colors to appear in the shading range.
2.
From the Scheme drop-down list, select a classification scheme.
You can use a standard classification scheme to group similar values to look for patterns in the data. You can
choose from the following schemes for grouping data values into classes based on how the data values are
distributed.
Equal Interval: The difference between the high and low values is the same for every class. So, the
classification of the data will be based on a set of equal splits. For example, if the lowest value is 0
and the highest value is 10 in the data, and 5 classes are requested, the range of each class will be 0
to 2, 2 to 4, 4 to 6, 6 to 8, 8 to 10.
Quantile: Each class contains an equal number of features. In this case, the points are sorted in
ascending order (for the chosen data field) and each class is filled with (total number of
points)/(number of classes) points starting from the lowest value to the highest.
Standard Deviation: Features are placed in classes based on how much their values vary from the
mean. First the mean and standard deviation of the data values are calculated. The class breaks are
found by successively adding or subtracting multiples of the standard deviation from the mean.
3.
If Equal Interval was selected for Scheme, for Scale, click either the Linear or Logarithmic radio button.
4.
If Standard Deviation was selected for Scheme, for Multiplier enter the multiplying factor.
There are 3 Color Scheme options
5.
Automatically Color Layers…: Selecting this option will automatically set the shading range to
shades of blue.
Color All Generated Layers: From the drop-down list, select either a Blue, Green, Red or Grayscale
shading range.
Custom Colors: This option allows you to set the Start Color and End Color of the color range, by
clicking on the Start Color and End Color buttons and selecting a color from the color picker. The
Empty button allows you to select a color for any region that does not contain any values. The
default color for all custom colors is transparent.
Select the appropriate Color Scheme radio button.
Map Intelligence Client – User Manual
108
Figure 143 Themes and Color Schemes section of the Pivot Layer configuration screen, showing the Custom Colors
option selected.
MAP SECTION
The Map section allows you to configure the necessary map settings for the layer.
To Configure the Map section
1.
In the Map Layer to Color Code field, enter the built-in map layer that you want to shade or apply a color to.
2.
If you do not know the name of the map layer you wish to use, click the Built-in Layer Query
Tool, see Appendix C: Map Intelligence Query Tool on page 136 for further information.
Only layers containing regions can be used as reference layers.
Built-in layers are arranged in a particular order on the map. When selecting a built-in layer to
shade, all map layers that sit under the selected layer will be covered by the selected color or
hatch.
In the Region ID Column field, specify the built-in map layer column that contains values that match the
ones in the first column of your worksheet.
Figure 144 Map Section of the Pivot Layer configuration screen.
ROW AND COLUMN HEADING SELECTION
There are two options for selecting which row and heading columns will appear as themes
Add all row and column headings: This option will add all the row and column headings as themes from the
Themes menu in the MI Viewer as shown in the image below.
Map Intelligence Client – User Manual
109
1.
Select the Add all row and column headings radio button, to select this option.
Figure 145 Theme Select menu displaying the results of selecting the ‘Add all row and column headings’ option, all
possible themes are displayed. The Map Image and Legend shows the results when selecting ‘Little Italy by 2009 ‘from
the Themes menu.
Add selected row and column headings: This option allows you to select which rows and column headings you
want to be available in the Themes menu. in the MI Viewer.
1.
Select the Add selected row and column headings radio button, to select this option. The Add selected row
and column headings panel will open.
2.
From the Row Headings section select the row heading you want to include and click the
selected row heading will appear in the panel below.
3.
From the Column Headings section select the column heading you want to include and click the
The selected column heading will appear in the panel below.
Clicking the
will deselect a selected row or column heading
Clicking the
will add all row or column headings.
Clicking the
will deselect all row or column headings
Map Intelligence Client – User Manual
button. The
button.
110
Figure 146 Add Selected row and column headings panel. In this example the row headings ‘Joey’s Diner’ and ‘Myles
Ices’ have been selected and for the column headings ‘2010’.
Figure 147 Themes menu displaying the results of selecting the ‘Add selected row and column headings’ option, the
themes Joey’s Diner and Myles Ices for the year 2010 are displayed. The Map Image and Legend shows the results when
selecting ‘Myles Ices by 2010 ‘from the Theme Select menu.
Map Intelligence Client – User Manual
111
SAVING THE LAYER
To save the Pivot layer configuration.
1.
Click the OK button on the Pivot Layer configuration screen.
The Pivot Layer name is listed on the Pivot Layer tab.
2.
Click the Done button on the Layers window to return to the spreadsheet.
EDITING THE LAYER
To edit an Pivot Layer configuration.
1.
From the Map Intelligence drop-down menu, select Layers, the Layers window will open.
2.
Select the Pivot Layers tab.
3.
Click on the layer you want to edit and click the Edit button.
The Pivot Layer configuration screen will open for editing.
4.
After making your edits, click OK to save your changes.
5.
Click the Done button on the Layers window.
If you change the layer name, a copy of the layer will be created with the new layer name.
DELETING THE LAYER
To delete a Pivot layer configuration.
1.
From the Map Intelligence drop-down menu, select the Layers button, the Layers window will open.
2.
Select the Pivot Layers tab.
3.
Click on the layer you want to delete and click the Delete button.
A message box will open asking you to confirm you wish to delete the layer. Click the Yes button.
Figure 148 Delete layer confirmation message box
4.
After deleting the layer, click the Done button on the Layers window.
Map Intelligence Client – User Manual
112
SELECTION
CONFIGURING LAYERS FOR SELECTION
The Selection tool allows users to select
points from the map and bring them back to
the worksheet as filters.
The ID Column in the Points Properties
section of the Point Layer Configuration
screen is used to specify the specific column
from the Point Layer that will be available for
selection.
To configure layers for selection
1.
From the Id Column drop-down list,
select a column that contains unique
values to be used to identify individual
points when using the Selection tool.
Figure 149 Point Layer Configuration screen – Point Properties section ID Column
MAKING A SELECTION FROM THE MAP
For information on how to make a selection from the map, refer to the Foreground Tools, Selection section of the
MI Viewer User Manual, found on the Map Intelligence Server CD.
In the current version of the MI Client only points are available for selection.
ACCESSING SELECTIONS
To access your selections from the worksheet.
1.
From the Map Intelligence drop-down menu, select Selection. The worksheet will focus on your selected
points.
To clear all selections
2.
From the Map Intelligence drop-down menu, select Clear Selection.
If Selection is used a new column named MapIntelligenceSelectionCol is added to the Excel worksheet.
Map Intelligence Client – User Manual
113
CREATING APPLICATIONS
As well as interactively defining and creating maps, the MI Excel Client allows you to create applications for other
users to use. There are two mechanisms for this.
Saving Settings and Configurations as a Template
Publishing Sessions
SAVING SETTINGS AND CONFIGURATIONS AS A TEMPLATE
The MI Client allows you to save your server settings and layer configurations as a template file. This allows you
or another user who has the MI Client to reload the worksheet or a similar one containing the same worksheets
and columns and to display the maps immediately.
When you configure maps for a specific Workbook, you can save these map settings and configurations to be
reused on the same or compatible Workbooks in the future without having to redefine the layers. These
templates can be loaded locally from disk or can be published to a remote server to be automatically loaded, the
End User only has to press the Show Map button to display the map.
When creating templates you save the map settings and configurations, not the Workbook data. On loading, you
recombine the template with the same or updated Workbook data. A Workbook could have many templates if
desired.
See also Map Intelligence Client Excel - Overview, Loading a template.
SAVING TEMPLATES
There are two options for saving templates.
Locally
To a remote server
To save a template locally
1.
From the Map Intelligence drop-down menu, select Save Template, the Save Template dialog will open.
2.
Click the Save Locally radio button.
3.
Click the Browse button, the Select a file name window will open.
4.
Browse to the location where you wish to save your template.
5.
In the File name text box, enter a name for your template.
MI Client templates have the file extension .tem
Map Intelligence Client – User Manual
114
Figure 150 The Save Template Locally Section of the Save Template dialog box.
6.
Click the Save button.
7.
Click the OK button on the Save Template dialog box.
To save a template to a remote server
1.
From the Map Intelligence drop-down menu, select Save Template, the Save Template window will open.
2.
Click the Save to Remote Server radio button.
3.
From the Server Address drop-down list, select the server you wish to save your template to.
4.
In the Template Name field, enter the name for the template.
Template names must be alphanumeric with no spaces. They may contain periods,
underscores and hyphens).
5.
In the Template Description, enter a description of the template.
Both the template name and template description will appear listed in the Load Remote
Template dialog box (see Map Intelligence Client Excel - Overview, Loading a template).
Figure 151 Save to remote server section of the Save Template Dialog Box.
Map Intelligence Client – User Manual
115
Completing the Workbook File Names to Match
The Match Type and Match Text fields allows the Layer Designer to associate the template with a defined
pattern in the spreadsheet file name. When loading a template the Load Remote Template dialog box will
only list those templates that match this criteria.
For example, if the template is to be associated with Excel Workbooks named “Burger Sales Daily Report xxxx-xxxx”, where xx-xx-xxxx is the date format ‘Month-Day-Year’, then the template should be saved with the
Match Type ‘Starts with’ and the Match Text ‘Burger Sales Daily Report’. When loading a template the Load
Remote Template dialog box will only list templates on the server where the match criteria matches the
currently open spreadsheet.
1.
In the Match Type field select a match type from the drop-down.
2.
In the Match Text field enter the text in the spreadsheet file name to be matched.
3.
Click the OK button to save the template.
PUBLISHING SESSIONS
When you press the Map Intelligence Show Map button, Map Intelligence creates a new map request based on
the current map configuration and data. This is then sent to the server to create a new map session. You have
the option to save this request, so that it can be executed by anybody at a later time. The saved request or
launchfile contains the map configuration and workbook data from the time the Show Map button was pressed.
The launchfile is independent of Excel and can be run as a link from a web page. You cannot however update the
data for the request. If you wanted to display a map for updated data, then you would need to publish a new
launchfile.
To publish a Map Intelligence Session
1.
From the Map Intelligence drop-down menu, select Show Map, to display the map, thereby sending a
request to the server and creating a current launchfile.
2.
From the Map Intelligence drop-down menu, select Publish Session, the Publish Session dialog will open.
3.
The file default name is launchfile.html, you can rename the file.
4.
Click the Browse button, the Select a file name window will open.
5.
Browse to the location where you wish to save the file and click the Save button.
6.
Click the OK button to close the Publish Session dialog box.
Map Intelligence Client – User Manual
116
Figure 152 Publish Session dialog box
TEMPLATES V PUBLISHING SESSIONS
THE DIFFERENCE BETWEEN PUBLISHING SESSIONS (LAUNCHFILES) AND USING TEMPLATES
A launchfile is a snapshot of the map and data at the time the launchfile was created; the End User is unable
create a map based on updated data. A template, however can be loaded for an updated version of the
workbook and the map that is created will display the updated data from the new version of the workbook.
For example if you wanted to allow your users to have an interactive map of all sales for the last week, you could
a.
Produce a weekly Sales Workbook. Each workbook should have the same format, only the actual
sales data would change from week to week. Because the structure of the Workbook remains the
same, you can map enable one instance of the workbook, save this as a template and then re-use
that template to create maps over each subsequent weekly version of the workbook without any
further changes.
If each weekly spreadsheet has a similar (or the same) name, e.g. SalesData-Feb2012.xls, SalesDataMar2012.xls, then you could publish the template to the Map Intelligence server to match Excel
workbooks starting with SalesData and the users would simply have to open their version of the
spreadsheet and press the map button to get the interactive map for that week.
b.
Alternatively, using the Publish Session (launchfile) option, you could create a map enabled
Workbook each week (you could use a template to do this) and then publish a launchfile for each
week as a self contained map request . End users would not need Excel , the Workbook or the Map
Intelligence Excel Client, they can simply click on a link to the launchfile from your web site to
interact with the map for that week. Each week would have its one launchfile and link.
Map Intelligence Client – User Manual
117
USING FILTERS
Filtering is a quick and easy way to find and work with a subset of data in your worksheet. A filtered list displays
only the rows that meet the criteria you specify for a column. Your filtered data can then be displayed on the
map.
Microsoft Excel provides two commands for filtering lists:
AutoFilter
Advanced Filter
Further information on using filters can be found in the Microsoft Excel Help files.
Using the Auto Filter in Microsoft Excel
1.
On the Excel Data tab, in the Sort & Filter, click Filter, drop-downs will appear next to the header of
each column.
Figure 153 Worksheet with filter drop-down lists.
2.
From the column drop-down list select a value. The worksheet will display only the rows with the
selected value. The column drop-down arrow will change to the filter symbol
is filtered.
to indicate the column
Multiple filters can be used by selecting values in the other columns.
Further information on using filters can be found in the Microsoft Excel Help files.
Map Intelligence Client – User Manual
118
Using the Advanced Filter Command
The Microsoft Excel Advanced Filter command is beyond the scope of this manual. Instructions on how to
use Advanced Filtering can be found in the Microsoft Excel Help files.
Advanced Filtering requires a worksheet to have at least three blank rows about the data to be
used as a criteria range. This may require adjustment to the settings in the Setup Worksheet
Data (Worksheet Location option) in the Point Layer and Area Group Layer configuration screens.
See Point Layers - Worksheet section and Area Group Layers – Worksheet section.
If you intend to use Advanced Filtering, select the Data in the Worksheet Location option when
configuring Setup Worksheet Data, this option does not require any adjustment to the location
settings if Advanced Filtering is used.
Map Intelligence Client – User Manual
119
ADVANCED TOPICS
CLEARING TEMPORARY FILES
The Map Intelligence Excel Client creates temporary files on your hard disk to cache data downloaded from the
Map Intelligence Server and to store your user preferences. In some cases, for example, where file corruption
takes place, it may be necessary to clean up these files. In general you do not need to do anything, but you may
be asked by your support desk to delete some or all of these files if your system has trouble executing the Map
Intelligence Excel Client.
To view temporary files status
1.
From the Map Intelligence drop-down menu, select Clear Temporary Files, the Clear Local Temporary Files
dialog will open.
Figure 154 Clear Temporary Local Files dialog box.
The Clear Local Temporary Files dialog box shows the location of temporary files, a list of the local temporary
files created by Map Intelligence, whether the file exists or not, the File Access Status, size and date the file
was last modified. The table below shows further information about each of these files.
Description
File Name
Notes
Last File Request
Launchfile.html
The last request sent to the Map
Intelligence Server.
Global Settings User Preferences
MIxlConfig.dat
The last configuration entered
into Global Settings.
Server color names temporary
store
colours.dat
List of all named colors on the
server.
Server color files temporary store
colourfiles.dat
List of color files on the server.
Server color palette temporary
store
tmpCols.dat
Color values for the last server
color file accessed.
Map Layer columns temporary
store
columns.dat
List of columns for the last map
layer accessed.
Map Intelligence Client – User Manual
120
Description
File Name
Notes
Server symbols temporary store
symb.dat
List of symbols available on the
server.
Server images temporary
images.dat
List of images available on the
server.
Map Intelligence Server history
servers.dat
List of Map Intelligence servers
that have been accessed.
If you do need to delete some of these files, they can all be regenerated as part of normal program execution.
Two files that you should be more careful about deleting are
Global User Preferences: This file contains your last used settings for Global Settings. If you delete this
file, you will need to update your Global Settings the next time you wish to generate a map. A new
global preferences file will then be generated for you (see Global Settings: Server Settings section on
page17).
Map Intelligence Server History: This file contains the names of all Map Intelligence Servers that you
have used to date. If you delete this file, all the names of servers, except the last server used, will be
deleted. You will need to re-enter the servers in the Map Intelligence Server field on the Global Settings
configuration screen. An example of when you might want to delete your server history is if your
organization changes the URL for the Map Intelligence Server and you do not wish to see it in your
server drop down in the future.
To delete a temporary file
1.
Select the checkbox next to the file you wish to delete.
2.
Click the Delete Files button. The file will be deleted and the dialog box will show “File does not exist”.
Map Intelligence Client – User Manual
121
AUTO PILOT MODE
The Auto Pilot Mode (APM) controls some of the Map Intelligence Tools depending on the document being
manipulated by the Client. For example, based on the name of a business intelligence document, a Layer
Designer can control:
what plugins must be excluded;
what plugins must be deactivated, and
what plugins must be activated and how.
An excluded plugin will not even appear in the list of plugins usually visible when the user clicks the
Tools menu button in the Map Intelligence MI Viewer.
Auto Pilot mode requires some programming and access to the Map Intelligence server.
Further Information relating to Auto Pilot Mode can be found in the Auto Pilot Mode in Map Intelligence
Technical Note found on the Map Intelligence Client CD.
Map Intelligence Client – User Manual
122
INDEPENDENT MAPS AND LEGENDS
This section explains how to extract components of the Map Intelligence GUI and display them separately within
a MI Client and retrieve printed images based on print templates.
MAPS
Independent maps can be retrieved as images and they are also implemented as tags that can be embedded in
jsp’s. They can also be invoked directly from an HTML request. Using the tag method, the map can be requested
as an image only, or it can be interactive.
IMAGES
The following parameters are available:
Parameter Name
Value
Required
userid
The id of the user that defines the users session
Yes
w
Determines the width of the map in pixels.
No
h
Determines the width of the map in pixels.
No
If the width and height are not specified then the size of the map will be the size from the current user
session.
The client retrieves a legend by contacting the MI server directly. The following url will retrieve a legend:
http://[machine-name]:[pot-number]/mapIntelligence/resizeableMapServlet
Example
To request a map with width 400 and height 400, the following url would be used:
<img src="http://[machine-name]:[portnumber]/mapIntelligence/resizeableMapServlet?userid=123456&w=400&h=400"
alt="map">
where the machine-name and port-number are those of the Map Intelligence server
TAGS
The tag creates a map image based on the main map image but scaled to the required size (usually smaller).
Attributes can be set for a border and an action to be applied when the image is clicked on. If no height is given
then the scale is based on the width of the map image and vice versa, based on the aspect ration of the main
map settings.
The following parameters are available:
Parameter Name
Value
Required
userid
The id of the user that defines the users session
Yes
map-image-width
The width in pixels of the map. NOTE that the width will be coerced to
the aspect ratio of the main map if it turns out that the suggested width
is greater than the width derived from the scaling of the main map
No
Map Intelligence Client – User Manual
123
maintaining its aspect ratio. The default value is the width of the main
map.
map-image-height
The height in pixels of the map. NOTE that the height will be coerced to
the aspect ratio of the main map if it turns out that the suggested height
is greater than the height derived from the scaling of the main map
maintaining its aspect ratio. The default value is the height of the main
map.
No
map-image-notclickable
Set to “true” if you do not want the map image to be interactive. The
default value is “false”, i.e. interactive. As an interactive map it will use
the last foreground tool selected, or the zoom to marquee navigation
setting.
No
map-image-border
You can set a border around the map as a number of pixels. The default
value is “0” or no border.
No
Here is an example in an iframe:
<html>
<head>
<meta http-equiv="Content-Type" content="text/html; charset=utf-8">
</head>
<body onload="javascript:document.forms0.submit(); document.forms1.submit();
return true">
<iframe name="mapImage" width=400 height=300 frameborder=0></iframe>
<form action="http://localhost:11090/mapIntelligence/componentServlet"
method="post" target="mapImage">
<input type="hidden" name="frontendComponent" value="map-image-component"/>
<input name="userid" type="hidden" value="5294334027507255954526495945">
<input name="map-image-width" type="hidden" value="320">
<input name="map-image-height" type="hidden" value="240">
<input name="map-image-not-clickable" type="hidden" value="true">
<input name="map-image-border" type="hidden" value="2">
</form>
</body>
</html>
Only the width or the height need be set but if both are set then the image is scaled based on a
minimum of the scales resulting from the width and height to the original Map Intelligence viewer
width and height. The aspect ratio of the original image is preserved.
LEGEND
Previously the image was a jsp that generated html to render the legend in the browser. It is now returned by a
servlet as an image. The servlet is named /mapIntelligence/getLegendImage and has the following parameters
available:
Parameter Name
Value
Required
userid
The id of the user that defines the users session
Yes
size
Determines the look and feel of the legend. If none is specified, the look and
feel with an id of 1 is used. See Look and Feel below for more information.
No
The clients retrieve a legend by contacting the MI server directly. The following url will retrieve a legend:
http://[machine-name]:[pot-number]/mapIntelligence/getLegendImage
Map Intelligence Client – User Manual
124
Example
To request a legend using the look and feel set of 2, the following url would be used:
<img src="http://[machine-name]:[portnumber]/mapIntelligence/getLegendImage?userid=123456&size=2" alt="legend">
where the machine-name and port-number are those of the Map Intelligence server
LOOK AND FEEL
To obtain the desired look and feel of the independent legend refer to the Technical Note: Legend Customization
.– (see Appendix D: Map Intelligence Manuals and Guides on page 137).
PRINTED IMAGES
The results of printing with a print template can be returned as an image. For details on what print templates are
and creating them, see the technical note on Creating a Print Template.
The following parameters are available:
Parameter Name
Value
Required
userid
The id of the user that defines the users session
Yes
template
The name of the print template to use.
No
p_
Custom parameters defined in the template can be passed by prefixing their
parameter names with _p
No
The client retrieves a legend by contacting the MI server directly. The following url will retrieve a legend:
http://[machine-name]:[pot-number]/mapIntelligence/printImageServlet
Example
To request the default print template image and pass the custom parameters w and h, the following url would be
used:
<img src="http://[machine-name]:[portnumber]/mapIntelligence/printImageServlet?userid=123456&template=default&p_w
=400&p_h=400" alt="print">
where the machine-name and port-number are those of the Map Intelligence server.
GETTING A PRINT TEMPLATE IMAGE FROM A FULL REQUEST
You can retrieve the print template image by adding the following parameters to the normal mapIntelligence
request:
The following parameters are available:
Parameter Name
Value
Required
image
Use a value of 'true' to return a print template image
Yes
template
The name of the print template to use.
No
Map Intelligence Client – User Manual
125
p_renderer
The image renderer to be used. Currently there is only one available.
No
p_wait
The time for the server to wait before rendering the html as an image. This
exists to ensure that the html has completely loaded before rendering it. If
the returned image is not complete, try increasing this value.
No
p_
Custom parameters defined in the template can be passed by prefixing their
parameter names with p_
No
These parameters should be included in the standard request file
Map Intelligence Client – User Manual
126
MI VIEWERS
As of Map Intelligence Server Version 3.2.2, Map
Intelligence allows organizations to create custom
MI Viewer User Interfaces that can be used instead
of the standard Map Intelligence MI Viewer.
Examples of this could be to use Google Maps, Open
Layers or even map layers from Excel over the
existing in-house spatial applications being used by
organizations. If more than one viewer is registered
with your Map Intelligence server, then you can
choose which viewer to use for this Excel Workbook
from the Global Settings, Server Settings, Mapping
Viewer drop down as shown in Figure 155.
To populate the Mapping Viewer drop-down
list
To populate the Mapping Viewer drop-down list
Server Administrators will need to:
1.
Figure 155. Mapping Viewer drop-down list.
Create a text file named customGUIS.txt which generates a lookup of Display Name to Technical Name as
below:
The Technical Name is the exact name as it appears in the
…\tomcat\webapps\mapIntelligence\WEB-INF\templates\wms\application directory.
Google Earth:networklink
MI Default viewer:
MI MING:ming
Google Maps:googleapidemo
Open Layers:openlayers
The Display Name and the Technical Name are separated by a colon ‘:’.
2.
Save the customGUIS.txt file to the following Map Intelligence Server directory
…\tomcat\webapps\mapIntelligence
You can also type the technical name of the GUI directly into the Mapping Viewer field.
These two methods allow sites to have 'published' GUIs that End Users see and 'hidden' GUIs
that you need to know the technical name for to use.
Further information on creating custom GUI’s can be found in the Technical Note : Web Map
Service (WMS) implementation (see Appendix D: Map Intelligence Manuals and Guides on
page 137).
Further Information on using the MING Viewer can be found in the MI Viewer MING Quick
Guide (see Appendix D: Map Intelligence Manuals and Guides on page 137).
Map Intelligence Client – User Manual
127
APPENDICES
APPENDIX A: FEATURES RENDERING ATTRIBUTES
FILL OPACITY
OPACITY OF COLORED CIRCULAR REGIONS IN RADIUS LAYERS
A number from 0 to 1 that indicates the opacity of all colored circular regions in radius relationship layers.
Figure 156. Opacity set to 1
Figure 157. Opacity set to 0.5
Figure 158.Opacity set to 0.2
OPACITY OF COLORED REGIONS
A number from 0 to 1 that indicates the opacity of all colored region layers.
Figure 159. Opacity set to 1
Figure 160. Opacity set to 0.5
Figure 161.Opacity set to 0.2
OPACITY OF HATCHES ON LAYERS
A number from 0 to 1 that indicates the opacity of all hatched layers.
Figure 162. Opacity set to 1
Figure 163. Opacity set to 0.7
Map Intelligence Client – User Manual
Figure 164. Opacity set to 0.5
128
BORDER OPACITY
OPACITY OF CIRCULAR REGION BORDERS IN RADIUS RELATIONSHIP LAYER
A number from 0 to 1 that indicates the opacity of all the circular region borders in a radius relationship layer.
Figure 165. Border opacity set to 1
Figure 166. Border opacity set to 0.5
Figure 167. Border opacity set to 0.2
OPACITY OF REGION BORDERS
A number from 0 to 1 that indicates the opacity of all region borders.
Figure 168. Border opacity set to 1
Figure 169. Border opacity set to 0.5
Figure 170. Border opacity set to 0.2
BORDER COLOR
COLOR OF CIRCULAR REGION BORDERS IN RADIUS RELATIONSHIP LAYER
The RGB setting for the border color as a six hexadecimal digit (3 byte) number representing Red, Green and
Blue.
Figure 171. Border color set to Red
(FF0000)
Figure 172. Border color set to
Orange (#FF8000)
Map Intelligence Client – User Manual
Figure 173. Border color set to Purple
(#800080)
129
COLOR OF REGION BORDERS
The RGB setting for the border color as a six hexadecimal digit (3 byte) number representing Red, Green and
Blue.
Figure 174. Border color set to Blue
(#0000FF)
Figure 175. Border color set to Green
(00FF00)
Figure 176. Border color set to White
(FFFFFF)
BORDER THICKNESS
THICKNESS OF CIRCULAR REGION BORDERS IN RADIUS RELATIONSHIP LAYER
The thickness in points or pixels (depending on the GIS provider) of the circular region borders as a positive
integer.
Figure 177. Border thickness set to 5
Figure 178. Border thickness set to 3
Figure 179. Border thickness set to 1
THICKNESS OF REGION BORDERS
The thickness in points or pixels (depending on the GIS provider) of the region borders.
Figure 180. Border thickness set to 5
Figure 181. Border thickness set to 3
Figure 182. Border thickness set to 1
USE MAP BORDER ATTRIBUTES
If the Use Map Border Attributes option in the Settings section of the MI Server Map Intelligence Tools page,
is set to Yes (the default) then, the map's attributes are used and any region border settings specified in the MI
Client are ignored.
Map Intelligence Client – User Manual
130
HATCH COLOR
COLOR OF HATCHES ON LAYERS
The RGB setting for the hatch color has a six hexadecimal digit (3 byte) number representing Red, Green and
Blue.
Figure 183. hatch color set to Red
(FF0000)
Map Intelligence Client – User Manual
Figure 184. Hatch color set to Green
(00FF00)
Figure 185. Hatch color set to Yellow
(FFFF00)
131
APPENDIX B: USING THE UNSHADED AND TRANSPARENT COLOR OPTIONS
REGION RELATIONSHIP AND AREA GROUP LAYERS
The following example shows the differences when using the Unshaded and Transparent color options for
Region Relationship and Area Group Layers. The example uses crime data to color-code parks in Sydney, NSW,
Australia, according to the type of crime committed either Theft, Vandalism or Assault.
Figure 186 shows a map of Central Sydney using the built-in Map Layers as shown in the Internal Legend. We
can see that the underlying layer for Australia is pale green , the areas of interest to us are Sydney parks
shown by the built-in layer nsw_parks .
Figure 186 Built-in Map Layer – nsw parks
Using a Map Intelligence Region Relationship Layer, we have color-coded the nsw_parks built-in layer
according to the Most Common crime type for each park. Theft is the most common crime in parks colored
yellow, Vandalism= cyan, etc.
Figure 187 Map Intelligence Region Relationship Layer
Where a park has an equal number of crimes of the same type, this is shown as a “Conflict” and the park is
colored Magenta .
Map Intelligence Client – User Manual
132
Figure 188 shows the result for Conflict if we used the Unshaded option. You can see the parks that were once
colored magenta are now unshaded, i.e. for these particular parks you see the original color-coding of the
nsw_parks layer . Note that the other parks having no conflict crimes are still colored coded according to their most
common crime type.
Figure 188 Unshaded option.
Figure 189 shows the same example, however this time the Transparent option has been selected for Conflict.
You can see that the “Conflict” parks are not color-coded and the original color-coding for the nsw_parks layer
for these particular parks is transparent, resulting in you seeing the underling Australia built-in layer . Note
the other parks that do not have a conflict are still colored coded according to the most common crime type.
Figure 189 Transparent option.
RADIUS RELATIONSHIP LAYERS
The following example outlines the differences when using the Unshaded and Transparent color options for
Radius Relationship Layers.
In this example potential new sites for Fast Food outlets ‘Vacant Outlets’ are shown as black buildings, around
each ‘vacant outlet’ is a 3 km radius color-coded according to the most common Food Category of competitor
outlets operating within the 3 km radius. Green circles indicate Burger outlets, grey circles Chicken outlets, etc.
“Conflicts” are shown as Magenta as seen in Figure 190.
Map Intelligence Client – User Manual
133
Figure 190 Radius Relationship Layer
If for Conflict the Unshaded option is selected, the circles are removed completely so that they do not appear
on the map, nor can they be exported. Hidden circles do not have popup information (Figure 191).
Figure 191 Unshaded Option
If for Conflict the Transparent option is selected, the circles appear ‘see-through’, except for a surrounding
border. It will display popup information (Figure 192)..
Map Intelligence Client – User Manual
134
Figure 192 Transparent option.
Map Intelligence Client – User Manual
135
APPENDIX C: MAP INTELLIGENCE QUERY TOOL
The Map Intelligence Query Tool allows you to view a list of all built-in maps available on the server along with
the associated layers and attributes.
To list available built-in map layers
1.
From the Area Group Layer or Pivot layer configuration screens, click the Built-in Layer Query tool button
to get a list of the built-in map layers for the selected map. The Map Intelligence Query Tool page will
appear.
Figure 193 The Map Intelligence Query Tool
The Map Intelligence Query Tool allows you to see what layers are available in a map.
The first drop-down list Choose Map: shows the current map you are working on.
The second drop-down list Choose Layer: shows all built-in layers available for you to use.
2.
Select a map layer from the Choose Layer drop-down list, a table will appear with the columns available
for that layer and the values available from that column.
Once a map layer has been chosen, you can export the data to a csv file, by clicking on the Get
layer as a CSV file.
3.
To close the Map Intelligence Query Tool screen and return to the layer configuration screen, click the
in the upper right hand corner of the browser window, or from the File menu, click Close.
Map Intelligence Client – User Manual
136
APPENDIX D: MAP INTELLIGENCE MANUALS AND GUIDES
Product documentation for Spectrum Spatial for Business Intelligence, including Map Intelligence SP and the
clients are located here:
support.pb.com/spectrum
All documentation can be found under the Solution Guides section of the Product Documentation.
Map Intelligence Client – User Manual
137
GLOSSARY
Area Group Layer
Area Group layers correspond to existing areas on a map. The displayed theme is based on data attribute
values, no spatial calculation is required. Instead, a column in your business data is designated to have values
that match a column in the map data. For example, an existing map layer of suburbs may correspond to a data
column for suburbs where the values are the suburb names. Then, for transaction data that represents
customer complaints and that also contains a suburb column, it is possible to make a cross-reference between
the transaction and the map area using the suburb name. An example that would use this correlation is
displaying a theme on a suburb's area on the map that reflects the most common complaint type received from
that suburb.
Built-in Layer
A built-in layer is defined by the map on the mapping server rather than the Map Intelligence Client. These
layers may contain all types of feature such as lines, points and regions e.g. cities, rivers and parks.
Coordinate Systems
A coordinate system provides a frame of reference for measuring locations on the surface of the earth. A full
list of acceptable coordinate systems is available in the Coordinate Systems document.
Data Columns
Data Columns are columns in a spreadsheet that are sent to the Map Intelligence Server and have their values
available in the MI Viewer. Data column values are displayed in the map data screen and popups that appear
when you move your mouse over a point in the map. Fact Point Layer
Hatching
Hatching is overlaying a pattern on top of a polygon allowing it to be distinguished visually rather than by using
color.
Icons
Icons are used to visually represent points on a map. Icons can be symbols (image files) selected by the user or
colored shapes.
Layers
A layer is a set of spatial features displayed on a map. Objects in a layer are usually grouped logically e.g. capital
cities or parks. Each feature in a layer has the same set of data attributes, so a layer is in many ways like a
relation (table) in a relational database.
Map Intelligence Excel Client
The Map Intelligence Excel Client allows configuration of Map Intelligence layers and has the ability to launch
and interact with the MI Viewer.
Map Intelligence Excel Client Viewer
The Map Intelligence Excel Client Viewer is a streamlined version of the standard client and only allows users to
load predefined templates and view maps. The MI Client Viewer does not allow any configuration of Map
Intelligence.
Map Intelligence Layer
A Map Intelligence Layer is a layer defined in the Map Intelligence Client. These layers display data as
geographic features on a map.
Map Intelligence Client – User Manual
138
Map Intelligence Server
The Map Intelligence Server is the engine that takes requests from the Map Intelligence Client and MI Viewer
and responds by displaying maps and associated information.
MI Viewer
The MI Viewer displays the layers configured by the Layer Designer on the specified map. The MI Viewer is
launched in a browser and provides controls that allow the end user to manipulate the map to return the
desired analysis.
Pivot Layer
Pivot Layers allow you to configure a collection of Area Group layers based on a worksheet within your Excel
spreadsheet which is in pivot form.
Point
A point is a geographic feature with a single pair of coordinates. These are used to represent objects or events
e.g. house or accident locations.
Point Layer
Point layers are map layers where data is represented on the map as discrete point images or symbols. For
example: a particular layer might represent the location of stores as push-pin icons and another layer could
represent accidents as colored dots, where the color (theme) represents the severity of the accident. Typically,
the rows in a table of data belong to a business concept such as people or address details, where each column
is an attribute of that concept. Thus each row in your business data can be represented as an individual point in
a point layer. In Map Intelligence, point layers form the foundation for relationship layers.
Radius Relationship Layer
Radius relationship layers are circular regions with themes around certain points of interest that show
information about other points that fall within that circular region. These layers are generated by Map
Intelligence. They are based on calculations made by Map Intelligence on the specified data values as specified
by the Layer Designer. For example: different colored circles indicate the average house price within half a
kilometer of a proposed waste plant. Another example is where different colored circles indicate the number of
burglaries that have occurred within a five-mile distance of houses belonging to known burglars. In the current
version of Map Intelligence, the circle center points (eg: houses belonging to known burglars) and the data
being analyzed (burglaries), must be point layers.
Region Relationship Layer
A Region Relationship layer corresponds to a map area of any shape that is solely geographical in its definition
and not generated by Map Intelligence. Examples would be suburbs, zip codes, local government areas or
police precincts. Region Relationship layers can be given themes according to specified data rules associated
with the points that fall within that region. An example of such a theme could be color-coding precincts
according to the number of crimes that have taken place within their boundaries, or applying different hatches
to suburbs based on the total value of house sales that have occurred in each one. Map Intelligence works out
in which region a point (eg: a sale or accident) physically belongs by doing a spatial calculation.
Relationship Layer: (See: Radius Relationship Layer and Regional Relationship Layer).
Theme
A theme can be described as a representation of map features according to different associated values.
Map Intelligence Client – User Manual
139