1
2
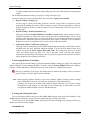
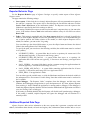
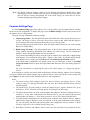
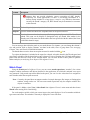
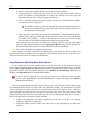
Copyright Notice
Copyright Notice
AQtrace, as described in this online help system, is licensed under the software license agreement
distributed with the product. The software may be used or copied only in accordance with the terms of its
license.
© 2011 SmartBear Software. All rights reserved.
No part of this help can be reproduced, stored in any retrieval system, copied or modified, transmitted in
any form or by any means electronic or mechanical, including photocopying and recording for purposes
others than personal purchaser's use.
All SmartBear product names are trademarks or registered trademarks of SmartBear Software. All other
trademarks, service marks and trade names mentioned in this Help system or elsewhere in the AQtrace
software package are the property of their respective owners.
smartbear.com
AQtrace by SmartBear Software
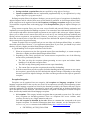
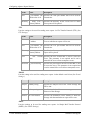
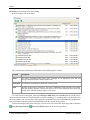
Table of Contents
3
Table of Contents
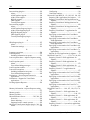
INTRODUCTION ............................................................................................................ 9
Introducing AQtrace ....................................................................................................... 9
System Requirements ................................................................................................... 11
Supported Applications................................................................................................. 12
Traced Exceptions ......................................................................................................... 13
Technical Support and Resources ................................................................................. 14
Sample Applications ..................................................................................................... 15
GETTING STARTED TUTORIAL ............................................................................. 18
Basic Concepts .............................................................................................................. 18
AQtrace Components, Terms and Concepts ......................................................................................19
How AQtrace Works for End Users ..................................................................................................22
Getting Started - Important Notes on the Tutorial ........................................................ 23
Getting Started: Lesson 1 - Analyzing Error Reports ................................................... 26
Specifying AQtrace Viewer's Settings ...............................................................................................26
Analyzing Sample Report ..................................................................................................................29
Getting Started: Lesson 2 - Applying AQtrace Reporter.............................................. 37
Setting Version Number ....................................................................................................................37
Generating Debug Information ..........................................................................................................38
Compiling Application.......................................................................................................................41
Copying AQtrace Reporter Libraries .................................................................................................42
Applying AQtrace Reporter to Your Application ..............................................................................42
Running Sample Application and Generating Error Reports.............................................................50
Getting Started: Lesson 3 - Using Server-Side Components........................................ 54
Preparing Application for AQtrace - Key Points ...............................................................................54
Adding Modules to Build Storage .....................................................................................................56
Organizing Report Storages ...............................................................................................................59
Configuring Server-Side Components ...............................................................................................59
Configuring AQtrace Viewer .............................................................................................................63
Running Sample Application and Generating Error Reports.............................................................65
Getting Started - What's Next? ..................................................................................... 66
©2011 SmartBear Software
smartbear.com/support
4
Table of Contents
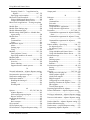
USING AQTRACE ........................................................................................................ 67
AQtrace Utilities ........................................................................................................... 67
About Persistent Report Storage ................................................................................... 68
Testing AQtrace ............................................................................................................ 69
Using AQtrace With Visual Basic Applications .......................................................... 70
Using AQtrace With .NET Applications ...................................................................... 71
Using AQtrace With .NET Applications - Overview ........................................................................71
Creating aqReporterInterop Assembly ..............................................................................................74
Initializing AQtrace Reporter in .NET Applications .........................................................................74
Deploying .NET Applications ...........................................................................................................78
Using AQtrace Reporter in .NET Applications .................................................................................79
Using AQtrace With Non-Interactive Processes .......................................................... 80
Transferring Data .......................................................................................................... 82
Transfer Protocols' Settings ...............................................................................................................82
Transferring Data - Basic Concepts ...................................................................................................87
Transfer Protocols' Requirements ......................................................................................................88
Selecting Transfer Protocol................................................................................................................99
Using Multiple Protocols .................................................................................................................101
PREPARING APPLICATIONS FOR AQTRACE .................................................. 103
Compiling Applications With Debug Information ..................................................... 103
Native-Code Compilers ...................................................................................................................104
.NET Compilers ...............................................................................................................................172
Setting Build Number ................................................................................................. 194
Setting Build Number for Microsoft Visual C++ Applications .......................................................195
Setting Build Number for Microsoft Visual Basic 2005, 2008 and 2010 Applications...................196
Setting Build Number for Microsoft Visual Basic 7.x Applications ...............................................198
Setting Build Number for Microsoft Visual Basic 6.0 Applications ...............................................198
Setting Build Number for Microsoft Visual C# 2005, 2008 and 2010 Applications .......................199
Setting Build Number for Microsoft Visual C# 7.x Applications ...................................................200
Setting Build Number for Delphi 2005 - 2007, 2009 - 2010 and XE Win32 Applications .............201
Setting Build Number for Delphi 2005, 2006, 2007 and 2009 for .NET Applications ...................202
Setting Build Number for Borland Delphi Applications..................................................................203
Setting Build Number for C++Builder 2006, 2007, 2009, 2010 and XE Applications ...................204
Setting Build Number for Borland C++Builder Applications .........................................................205
ORGANIZING BUILD STORAGE ........................................................................... 207
smartbear.com
AQtrace by SmartBear Software
Table of Contents
5
Organizing Build Storage - Basic Concepts ............................................................... 207
AQtrace Module Store ................................................................................................ 211
AQtrace Module Store - User Interface ...........................................................................................211
Using AQtrace Module Store...........................................................................................................214
AQtrace Module Store - Command Line .........................................................................................217
AQtrace Module Store Agent ..................................................................................... 219
AQtrace Module Store Agent - Overview .......................................................................................219
Using AQtrace Module Store Agent ................................................................................................219
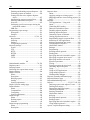
AQTRACE REPORTER............................................................................................. 222
Using AQtrace Reporter - Basic Concepts ................................................................. 222
Distributing AQtrace Reporter Libraries .................................................................... 226
Working Under a Debugger ........................................................................................ 228
Specifying Exceptions to Be Traced ........................................................................... 228
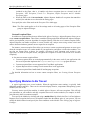
Specifying Modules to Be Traced .............................................................................. 233
Specifying Data to Be Included in Reports ................................................................ 235
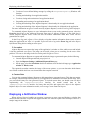
Displaying a Notification Window ............................................................................. 237
Controlling DLL Loading ........................................................................................... 240
Including Debug Messages Into Error Reports .......................................................... 242
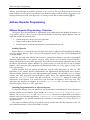
AQtrace Reporter Programming ................................................................................. 243
AQtrace Reporter Programming - Overview ...................................................................................243
SDK Files.........................................................................................................................................245
Getting Reference to AQtrace Reporter ...........................................................................................247
Creating Custom Exception Filters ..................................................................................................255
Enabling and Disabling AQtrace Reporter ......................................................................................256
Generating Error Reports on Demand .............................................................................................258
Performing Specific Actions Upon Closing the Notification Window............................................259
Inserting Custom Data Into Reports ................................................................................................260
AQtrace Packager ....................................................................................................... 263
Using AQtrace Packager With Native Applications ........................................................................263
Using AQtrace Packager With .NET Applications ..........................................................................266
AQtrace Packager Command Line ..................................................................................................269
AQtrace Packager Exit Codes ..........................................................................................................269
AQtrace Packager Settings Pages ............................................................................... 270
Module Information Page ................................................................................................................271
Reporter Assembly Information Page ..............................................................................................271
Sending Page....................................................................................................................................272
©2011 SmartBear Software
smartbear.com/support
6
Table of Contents
Product Information Page ................................................................................................................272
Reporter Behavior Page ...................................................................................................................273
Additional Reported Data Page .......................................................................................................273
Exception Filter Mode Page.............................................................................................................277
OS Exceptions Page .........................................................................................................................277
.NET Exceptions Page .....................................................................................................................278
Visual C++ Exceptions Page ...........................................................................................................278
Delphi Exceptions Page ...................................................................................................................279
C++Builder Exceptions Page ...........................................................................................................279
Module Filter Settings Page .............................................................................................................280
Notification Settings Page................................................................................................................281
Control DLL Loading Page .............................................................................................................283
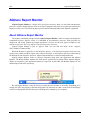
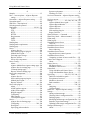
AQTRACE REPORT MONITOR ............................................................................. 286
About AQtrace Report Monitor .................................................................................. 286
AQtrace Report Monitor Window .............................................................................. 287
Configuring AQtrace Report Monitor ........................................................................ 288
AQtrace Report Monitor Command Line ................................................................... 294
SERVER-SIDE COMPONENTS ............................................................................... 296
Report Collector .......................................................................................................... 296
Report Collector - Description .........................................................................................................296
Report Relaying ...............................................................................................................................297
AQtrace Service .......................................................................................................... 299
AQtrace Service - Description .........................................................................................................299
Configuring AQtrace Service ..........................................................................................................300
AQtrace Server Config ............................................................................................... 301
Common Settings Page ....................................................................................................................302
Report Collector Settings Page ........................................................................................................303
AQtrace Service Settings Page ........................................................................................................304
AQtrace Module Store Agent Settings Page ....................................................................................304
Issue-Tracking Plug-Ins .............................................................................................. 305
Bugzilla Support Plug-In .................................................................................................................306
Microsoft Team System Support Plug-In ........................................................................................306
JIRA Support Plug-In ......................................................................................................................307
ALMComplete Support Plug-In ......................................................................................................308
AutomatedQA AQdevTeam Support Plug-In ..................................................................................309
Report to Issue Utility ................................................................................................. 310
smartbear.com
AQtrace by SmartBear Software
Table of Contents
7
Mapping Products to Issue-Tracking Projects .................................................................................310
Applying Settings to Existing Reports .............................................................................................312
Report to Issue Utility - Pages .........................................................................................................312
Report Storage Programming ..................................................................................... 319
Report Storage Programming - Basics .............................................................................................319
AQTRACE VIEWER .................................................................................................. 327
AQtrace Viewer - User Interface ................................................................................ 327
Analyzing Error Reports With AQtrace Viewer ........................................................ 328
Specifying Path to Modules ........................................................................................ 337
Panels .......................................................................................................................... 339
Additional Information Panel ..........................................................................................................340
Call Stack Panel ...............................................................................................................................345
Code Viewer Panel ..........................................................................................................................347
Disassembly Panel ...........................................................................................................................350
Event Log Panel ...............................................................................................................................352
Last Exceptions Panel ......................................................................................................................356
Memory Panel ..................................................................................................................................357
Modules Panel..................................................................................................................................359
Output Panel ....................................................................................................................................360
Registers Panel .................................................................................................................................361
Screenshot Panel ..............................................................................................................................361
Storage View Panel ..........................................................................................................................363
Threads Panel ...................................................................................................................................365
Watch Panel .....................................................................................................................................366
Miscellaneous ............................................................................................................. 370
AQtrace Viewer Command Line .....................................................................................................370
Installing Extensions ........................................................................................................................370
Checking for Updates ......................................................................................................................371
SOURCE SERVER SUPPORT .................................................................................. 372
About Source Server Support ..................................................................................... 372
Using SmartBear Source Server ................................................................................. 374
Using SmartBear Source Server - Overview ...................................................................................374
Source Indexing for SmartBear Source Server ................................................................................376
Using Source Control Systems Supported by SmartBear Source Server ........................................377
Comparing Versions of Source Code Files ......................................................................................381
Using Microsoft Source Server................................................................................... 382
©2011 SmartBear Software
smartbear.com/support
8
Table of Contents
Using Microsoft Source Server - Overview.....................................................................................382
Source Indexing for Microsoft Source Server .................................................................................384
Using Source Control Systems Supported by Microsoft Source Server ..........................................385
INDEX ........................................................................................................................... 392
smartbear.com
AQtrace by SmartBear Software
Introducing AQtrace
9
Introduction
Introducing AQtrace
AQtrace is an error reporting and resolution system that provides an easy way for software developers to
find the cause of an error that occurs in their applications running on end-user computers. AQtrace includes
special modules and components that trace the application execution, generate a detailed report about the
application’s and CPU’s state when an error occurs, and then sends this report to the developer. The AQtrace
package also includes a special application to perform in-depth analysis of the received error reports.
Why use AQtrace?
Software products become more and more complex. A modern application may include dozens and even
hundreds of dynamically linked libraries, third-party component packages and special modules for
interacting with drivers and services running on the operating system. Since the number of modules is large
and they are supplied by different vendors, it may be rather difficult to find the cause of an error or exception
when it occurs.
The situation becomes more complicated if an error occurs on an end-user’s computer, because in this
case, the developer cannot debug the application. End-users report symptoms of the problem and these
symptoms may have different potential causes, so, quite often the information provided by end-users is not
enough to find the cause of the error. To determine the cause, programmers resort to a trial-and-error
procedure, which is time-consuming and inefficient.
To simplify the search and understand what is going wrong, developers use special error reports that are
generated when an exception occurs. These reports include memory dumps, information about modules,
threads, call stacks and the contents of CPU registers when an exception occurs. Having the reports in hand,
developers can find the cause of an error much faster.
It would be nice if an application could generate error reports when exceptions occur and send these
reports to you. This will help you resolve customers’ problems faster and improve the quality of your
products. This is what AQtrace does. It is a ready-made error reporting and processing system that includes
all of the modules and components needed to generate, process and analyze error reports’ information.
AQtrace provides a special component that is integrated into your application and monitors the
application execution. When an exception occurs, the component performs the following actions:
●
Automatically generates an error report.
●
Automatically displays a notification window on screen.
●
Automatically sends the report and user comments to your server.
The report is sent to the server that receives this report, performs the initial processing and saves it to a
centralized storage for further analysis. The developers can then retrieve the report from the storage,
investigate the problem and fix it. AQtrace also includes special server-side plug-ins that create work items
on the base of the received error reports and save these items to issue-tracking systems like Visual Studio
Team System, Bugzilla, ALMComplete or JIRA. So, you can be sure that no error report will be lost or
forgotten.
© 2011 SmartBear Software
smartbear.com/support
10
Introduction
Features
●
AQtrace saves the time and energy needed to add the report generating functionality to your
products and to implement the desired reporting and error processing policies. AQtrace includes
special features for tracing application execution, generating error reports, sending theses reports
to developers, receiving the reports and analyzing them.
Without AQtrace you have to write code that will perform these actions. No need to say that
writing this code requires specific knowledge and programming experience. With AQtrace things
become much easier. It helps developers resolve customers’ problems faster and improve the
quality of your products.
●
AQtrace is a well-organized automated approach to reporting and fixing bugs. This makes the
business process clearer and gives your company benefits relative to competitors.
●
AQtrace can be easily integrated into the bug resolution system adopted in your company. It
includes special plug-ins that store the received error reports to issue-tracking systems like Visual
Studio Team System, Bugzilla, ALMComplete or JIRA. You can also create custom plug-ins that
will support the desired issue-tracking products. All of these features free you from manually
adding bug reports to the issue-tracking database and guarantee that reports will not be forgotten.
●
AQtrace supports a wide range of modern compilers including C#, Visual Basic .NET, J# and
other .NET tools, Visual C++, Visual Basic, Delphi, C++Builder and Intel C++. It can also be used
in 64-bit applications.
●
AQtrace can trace any exceptions that occur in your application whether they are raised within tryexcept blocks or outside of them. AQtrace can detect both hardware and software specific
exceptions, that is, it can trace exceptions generated by the CPU (like division by zero) as well as
exceptions defined in your applications with the help of special exception classes.
●
AQtrace supports filters that let you specify the exceptions to be traced and the modules that will
be traced for exceptions. This feature lets you automatically exclude errors that occur in third-party
packages and that cannot be changed by you.
●
AQtrace includes special features for filtering duplicated error reports. So, you do not have to
analyze the same reports over and over again.
●
AQtrace offers a rich set of settings that specify information to be included into the generated
reports. For instance, information about the operating system, service packs and .NET Framework
versions, information about the processes, hard-disk space and memory, and so on. You can also
include custom information, such as the internal state of your applications’ subsystems or internal
applications’ flags.
●
You can use AQtrace as a watchdog to prevent the injection of certain DLLs into the address space
of your process.
Detailed Information on Using AQtrace
In order to implement the error reporting policy with AQtrace, you should perform a number of actions:
●
Change your application’s build settings to build your modules with debug information and
version information.
●
Organize and maintain the storage of debug information for different builds.
●
Add the AQtrace Reporter initialization code to your application.
●
Install AQtrace’s Server-Side components and tune their functionality.
For detailed information on how to perform these steps, see the topics of the Using AQtrace section. For
a step-by-step tutorial, see Getting Started Tutorial.
smartbear.com
AQtrace by SmartBear Software
System Requirements
11
System Requirements
The AQtrace package includes several components, and each of them has its own requirements.
AQtrace Reporter and AQtrace Report Monitor
These components must meet the following system requirements:
●
Intel Pentium III 800 MHz or higher.
●
Microsoft Windows 7 (both 32-bit and 64-bit editions), Windows Server 2008 (both 32-bit and 64bit editions), Microsoft Windows Vista (both 32-bit and 64-bit editions), Windows Server 2003
(both 32-bit and 64-bit editions), Windows XP (both 32-bit and 64-bit editions), Windows 2000 or
Windows NT 4.0 with Service Pack 6 or later.
Note: AQtrace cannot be installed on Microsoft Windows NT. However, AQtrace Reporter
applied to a user application and AQtrace Report Monitor can work on Microsoft
Windows NT. That is, the Reporter and Report Monitor can trace exceptions, generate
and send error reports while working on this operating system.
●
2 MB hard-disk space.
AQtrace Server-Side Components
The following requirements concern Report Collector, AQtrace Service, issue-tracking plug-ins, AQtrace
Module Store Agent and AQtrace Server Config:
●
Intel Pentium III 800 MHz or higher.
●
Microsoft Windows 7 (both 32-bit and 64-bit editions), Windows Server 2008 (both 32-bit and 64bit editions), Microsoft Windows Vista (both 32-bit and 64-bit editions), Windows Server 2003
(both 32-bit and 64-bit editions), Windows XP (both 32-bit and 64-bit editions) or Windows 2000.
●
Microsoft Internet Information Services ver. 5.0 - 7.5.
●
Microsoft Internet Explorer 6.0 or later.
Memory: 512 MB of RAM.
●
Notes:
● To install AQtrace Server-Side Components, administrator permissions are needed.
●
To install the Report Collector (.asp page) component, the installation program must be running
under a user account that has administrator privileges in Internet Information Services (IIS).
●
To install the Microsoft Visual Studio Team System Support component, you must have Microsoft
Visual Studio 2005 or 2008 with Team Explorer. If both are installed, Visual Studio 2008 Team
Explorer will be used.
AQtrace Viewer, AQtrace Packager and AQtrace Module Store
These utilities must match the following requirements:
●
Intel Pentium III 800 MHz or higher.
●
Microsoft Windows 7 (both 32-bit and 64-bit editions), Windows Server 2008 (both 32-bit and 64bit editions), Microsoft Windows Vista (both 32-bit and 64-bit editions), Windows Server 2003
(both 32-bit and 64-bit editions), Windows XP (both 32-bit and 64-bit editions) or Windows 2000.
●
Microsoft Internet Explorer 6.0 or later.
© 2011 SmartBear Software
smartbear.com/support
12
Introduction
●
Memory: 512 MB of RAM.
●
50 MB hard-disk space.
●
800 × 600 or higher resolution monitor.
●
Mouse or other pointing device.
Additional Requirements
Microsoft Source Server Support
To use Microsoft Source Server with AQtrace Viewer, you must have the following software installed on
your computer:
• Microsoft Debugging Tools for Windows.
• Perl 5.6 or later.
Additionally, Automated Build Studio 5 or later is recommended to automate source indexing of your
applications.
SmartBear Source Server Support
To use SmartBear Source Server with AQtrace Viewer, Automated Build Studio 6 or later is required to
perform source indexing of your applications.
Supported Applications
AQtrace supports any .NET, Win32 or Win64 application that can use AQtrace Reporter and that has
debug information in a supported format.
.NET (Managed) Applications
The AQtrace Reporter functionality that is used by .NET code is implemented in a special assembly, and
can be used in any .NET application, including those created with the following development tools:
●
●
Microsoft Visual C# 7.x, 2005, 2008 and 2010
Microsoft Visual Basic .NET 7.x, 2005, 2008 and 2010
●
Microsoft Visual C++ 7.x, 2005, 2008 and 2010 (managed code)
●
Microsoft Visual J# 7.x, 2005
●
●
CodeGear Delphi 2007 and 2009 for .NET
Borland Delphi 2005 and 2006 for .NET
●
Borland C#Builder
Native (Unmanaged) Applications
The AQtrace Reporter functionality that is used by unmanaged Win32 and Win64 applications is
implemented in a special dynamic link library, and can be used in any application that supports loading of
DLLs and working with interfaces.
As for debug information, currently AQtrace supports the following formats:
●
PDB
●
Sym
smartbear.com
AQtrace by SmartBear Software
Traced Exceptions
●
TDS
●
TD32
13
These two conditions are met in applications created with the most popular modern compilers. AQtrace
supports applications created with the following development tools:
●
Microsoft Visual C++ ver. 6, 7.x, 2005, 2008 and 2010 (unmanaged code)
●
●
Microsoft Visual Basic ver. 6
Embarcadero Delphi 2010 and XE
●
CodeGear Delphi 2007 and 2009 for Win32
●
Borland Delphi 2005 and 2006 for Win32
●
●
Borland Delphi ver. 3 – 7
Embarcadero C++Builder 2010 and XE
●
CodeGear C++Builder 2007 and 2009
●
Borland C++Builder 2006
●
Borland C++Builder ver. 3 - 6
●
Intel C++ ver. 7
Other applications that meet the above-mentioned conditions are also supported by AQtrace.
Java
Java applications are not currently supported.
Traced Exceptions
The AQtrace component that monitors your application execution and traces exceptions is called
AQtrace Reporter. It can detect any exceptions that occur in your application. It intercepts exceptions on a
low level and can handle them regardless of whether they are included in the try-catch blocks or not.
You can command AQtrace Reporter to only handle specific types of exceptions (for instance, only
division by zero) and ignore other exceptions. You do this by defining the exception filter. For detailed
information about the filter and traced exceptions, see Specifying Exceptions to Be Traced.
You can disable the Reporter temporarily, so the Reporter will handle those exceptions that occur when
it is enabled and skip those exceptions that occur when it is disabled. This way, the exceptions will be
processed in a way that is defined in your code (for instance, these exceptions can be handled with the trycatch statements). For information on disabling and enabling the Reporter, see Enabling and Disabling
AQtrace Reporter.
There are some exception that AQtrace Reporter always ignores. These are exceptions that are raised by
the following Windows API functions during their work:
●
IsBadCodePtr
●
●
IsBadHugeReadPtr
IsBadHugeWritePtr
●
IsBadReadPtr
●
IsBadStringPtrA
●
IsBadStringPtrW
© 2011 SmartBear Software
smartbear.com/support
14
Introduction
●
IsBadWritePtr
AQtrace Reporter traces these exceptions, but neither generates error reports, nor processes them, since
these exceptions are part of normal function execution, and they do not mean the function performs an
erroneous action. In other words, these exceptions are always ignored regardless of the exception filters you
use.
Technical Support and Resources
If you have questions, problems or just need help with AQtrace, you can either contact our support team
or try to search for the needed information using the help resources located on our web site (forums, blogs,
technical papers).
To submit your question to the support team
1. Select Help | Contact Support Team from AQtrace Viewer’s main menu. This will invoke the
Contact Support Team dialog.
2. (Optional) In the dialog, select the Attach system information to my support request check box
if you want AQtrace to collect some system information and attach it to your request. To preview
the collected system information and make a decision whether you want to send it to our support
team, click the View the system information file contents link at the bottom of the dialog. This
will invoke the System Information dialog, in which you can preview the information to be
attached to the request.
If you do not want to attach this information to your request, clear the check box. However, we
recommend that you attach this information since it can help our support team solve your problem
quicker.
3. Click the Continue button in the Contact Support Team dialog. AQtrace Viewer will load the web
page with the Contact Support Form from our web site to your web browser:
http://smartbear.com/support/message/?prod=AQtrace
Fill in the required fields in this web form. Note that your contact information, the product name
and version are specified automatically in the appropriate fields when you proceed to this web
page from the Contact Support Team dialog. You only need to describe your problem in the
appropriate fields.
4. Click Submit in the Contact Support Form to submit the request.
The support team will answer you via e-mail and all further communication will be made via e-mail.
However, to start the conversation, please use the Contact Support Team dialog in AQtrace Viewer and the
Contact Support Form on our web site.
For information on our support policies, please visit our web site http://smartbear.com/support.
More support resources
You can also ask questions, search for answers, exchange comments and suggestions on our forums:
http://smartbear.com/forums
You can find answers to your question in the list of the frequently asked questions which is
available at:
http://smartbear.com/support/faq/?product=AQtrace
smartbear.com
AQtrace by SmartBear Software
Sample Applications
15
Learn more about using AQtrace from technical papers and blogs published at:
http://smartbear.com/support/articles
http://blog.smartbear.com
Make sure you regularly visit the SmartBear Web site:
http://smartbear.com
Sample Applications
The AQtrace package includes a number of sample applications and configuration projects that
demonstrate how you can use AQtrace. The samples are copied to your computer if you select the “Analyze
received error reports” or “Prepare your modules for AQtrace” option on the Select AQtrace Components
page of the AQtrace installation wizard. The samples include Visual C++, Visual C#, Visual Basic 6 and
Delphi applications.
On Windows 7, Windows Vista and Windows Server 2008, AQtrace samples are located in the
<Users>\Public\Documents\AQtrace Files\Samples\ folder. On other operating systems, the
samples reside in the <Documents and Settings>\All Users\Documents\AQtrace Files\Samples\
folder. Hereinafter, the folder containing samples will be denoted as <AQtrace Samples>.
Few notes:
●
All samples include source code files and compiled modules of sample applications which you can
use if for some reason you cannot compile the source files. You can find the source code files in
the <AQtrace Samples>\Sources folder, and the compiled modules reside in the <AQtrace
Samples>\CompiledSamples folder.
●
The compiled modules were processed with AQtrace Packager, that is, they already have AQtrace
Reporter applied to them. Also, the folders with the sample executables already include the
aqReporter.dll and DbgHelp.dll modules that implement the Reporter’s functionality. So, you can
launch these samples as they are. You can use them to generate error reports and explore the
reports.
●
All samples include the AQtrace Packager projects that were used to apply AQtrace Reporter to
the compiled modules. You can find these projects in the folders with the source code files.
Visual C++ Sample
The Visual C++ sample demonstrates how you can use AQtrace with applications created with Visual
C++ 6, 7.x, 2005, 2008 and 2010. You can find the source code files of the sample in the following folder
and its subfolders:
●
<AQtrace Samples>\Sources\CPP
The sample contains the 32- and 64-bit versions of the sample executable and the sample dynamic link
library. You can find the compiled modules in the following folders:
●
<AQtrace Samples>\CompiledSamples\CPP\x86 - Contains the compiled modules of the 32-bit
Visual C++ sample application and the 32-bit versions of the aqReporter.dll and DbgHlp.dll
libraries.
●
<AQtrace Samples>\CompiledSamples\CPP\x64 - Contains the compiled modules of the 64-bit
© 2011 SmartBear Software
smartbear.com/support
16
Introduction
Visual C++ sample application and the 64-bit versions of the aqReporter.dll and DbgHlp.dll
libraries.
The <AQtrace Samples>\Sources\CPP folder contains the Samples.sln solution file that is used to
compile the sample modules.
Other sample files are organized into a number of subfolders:
●
AQtracePackagerProject - Contains two configuration project files that let you apply AQtrace
Reporter to the 32- or 64-bit sample application. You use these configuration projects with the
AQtrace Packager utility.
●
Bmp - Contains images used by the sample applications.
●
●
Common - Contains the source files that are common for the sample executable and sample DLL.
SampleApp - Contains the source files of the sample executable.
●
SampleDll - Contains the source files of the sample DLL.
Visual C# Sample
The Visual C# sample demonstrates how you can use AQtrace with applications created with Visual C#
7.x, 2005, 2008 and 2010. You can find the source code files of the sample in the following folder and its
subfolders:
●
<AQtrace Samples>\Sources\C#
The sample contains the sample executable and the sample dynamic link library. You can find the
compiled modules in the following folder:
●
<AQtrace Samples>\CompiledSamples\C# - Contains the compiled modules of the Visual C#
sample application, the 32-bit versions of the aqReporter.dll and DbgHlp.dll libraries, and the
aqReporterInterop.dll helper assembly that was generated by AQtrace Packager in order for the
.NET sample application to be able to use AQtrace Reporter (for more information on this
assembly, see Using AQtrace With .NET Applications - Overview).
The <AQtrace Samples>\Sources\C# folder contains the Samples.sln solution file that is used to compile
the sample modules.
Other sample files are organized into the following subfolders:
●
AQtracePackagerProject - Contains the configuration project file that lets you apply AQtrace
Reporter to the sample Visual C# application. You use this configuration project with the AQtrace
Packager utility.
●
SampleApp - Contains the source files of the sample executable.
●
SampleDll - Contains the source files of the sample DLL.
Delphi Sample
The Delphi sample demonstrates how you can use AQtrace with applications created with Delphi 7,
2006, 2007, 2009, 2010 and XE. You can find the source code files of the sample in the following folder and
its subfolders:
●
<AQtrace Samples>\Sources\Delphi
The sample contains the sample executable and the sample dynamic link library. You can find the
compiled modules in the following folder:
●
<AQtrace Samples>\CompiledSamples\Delphi - Contains the compiled modules of the Delphi
sample application and the 32-bit versions of the aqReporter.dll and DbgHlp.dll libraries.
The <AQtrace Samples>\Sources\Delphi folder contains the Samples.bpg project group file that is used
smartbear.com
AQtrace by SmartBear Software
Sample Applications
17
to compile the sample modules.
Other sample files are organized into the following subfolders:
●
AQtracePackagerProject - Contains the configuration project file that lets you apply AQtrace
Reporter to the sample Delphi application. You use this configuration project with the AQtrace
Packager utility.
●
Common - Contains the files that are common for the sample executable and sample DLL.
●
SampleApp - Contains the source files of the sample executable.
●
SampleDll - Contains the source files of the sample DLL.
Visual Basic 6 Sample
The Visual Basic sample demonstrates how you can use AQtrace with Visual Basic 6 applications. You
can find the source code files of the sample in the following folder:
●
<AQtrace Samples>\Sources\VB6
The sample contains the compiled sample executable that resides in the following folder:
●
<AQtrace Samples>\CompiledSamples\VB6 - Contains the compiled SampleApp.exe sample
executable and the 32-bit versions of the aqReporter.dll and DbgHlp.dll libraries.
The <AQtrace Samples>\Sources\VB6 folder contains the source files that are organized into the
following subfolders:
●
AQtracePackagerProject - Contains the configuration project file that lets you apply AQtrace
Reporter to the sample Visual Basic 6 application. You use this configuration project with the
AQtrace Packager utility.
●
SampleApp - Contains the source files of the sample executable.
© 2011 SmartBear Software
smartbear.com/support
18
Getting Started Tutorial
Getting Started Tutorial
This section comprises of three tutorials each describing different aspects of using AQtrace. The section
contains the following topics:
Basic Concepts
●
AQtrace Components, Terms and Concepts
●
How AQtrace Works for End Users
Getting Started - Important Notes on the Tutorial
Getting Started: Lesson 1 - Analyzing Error Reports
●
●
Specifying AQtrace Viewer's Settings
Analyzing Sample Report
Getting Started: Lesson 2 - Applying AQtrace Reporter
●
●
Setting Version Number
Generating Debug Information
●
Compiling Application
●
Applying AQtrace Reporter to Your Application
●
Running Sample Application and Generating Error Reports
Getting Started: Lesson 3 - Using Build Storage and Server-Side Components
●
Preparing Application for AQtrace - Key Points
●
Adding Modules to Build Storage
●
●
Organizing Report Storages
Configuring Server-Side Components
●
Configuring AQtrace Viewer
●
Running Sample Application and Generating Error Reports
Getting Started - What's Next?
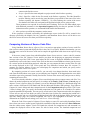
Basic Concepts
AQtrace is a set of libraries and components that automatically generate error reports and transfer them
to developers for processing and analysis. It includes a specific component that is built into your application
and monitors the application execution. When an exception occurs, the component automatically generates
an error report and sends it to the server that receives the report and saves it for further processing and
analysis. Topis of this section provide a brief overview of AQtrace components and explain how they work.
AQtrace Components
How AQtrace Works for End Users
smartbear.com
AQtrace by SmartBear Software
Basic Concepts
19
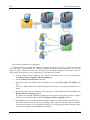
AQtrace Components, Terms and Concepts
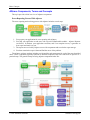
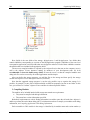
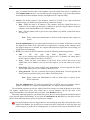
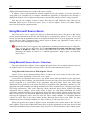
This topic provides a brief overview of AQtrace components:
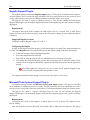
Error-Reporting Process With AQtrace
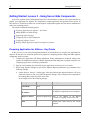
The error-reporting and resolving process with AQtrace includes several steps:
1. You prepare your application for error reporting with AQtrace.
2. You ship your application to end users with a special redistributable module - AQtrace Reporter
(see below). It monitors your application execution, and if an exception occurs, it generates an
error report and sends it to you.
3. The reports are received by AQtrace server-side components and saved to the report storage.
4. You then examine the report’s data and find the cause of the problem.
The AQtrace software package includes special modules and components for each of the steps described
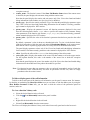
above. These components typically function on different computers and solve tasks that are specific to a
particular step. The general concept of using AQtrace components looks like:
© 2011 SmartBear Software
smartbear.com/support
20
Getting Started Tutorial
Below is a detailed description of AQtrace components and libraries.
AQtrace Reporter
AQtrace Reporter is a subsystem that traces exceptions, generates error reports and sends them to your
server. The AQtrace Reporter functionality is implemented by special dynamic link library - aqReporter.dll and a number of helper DLLs. All of these libraries are redistributable and you must ship them along with
your application. The number of helper DLLs to be used depends on your application type. For complete
information on this, see Distributing AQtrace Reporter Libraries.
When your application starts, it loads the aqReporter library and initializes AQtrace Reporter. After that,
the Reporter starts monitoring the application execution. If an exception occurs, it displays a notification
window, generates an error report and sends this report to you.
AQtrace Reporter may send reports via one or several transfer protocols. For more information on this,
see Transferring Reports.
You can use AQtrace Reporter’s program interface in the Reporter and perform specific tasks like
enabling or disabling the reporting functionality, including, but not limited to, adding custom data into
reports or generating reports on demand. For more information about this, see AQtrace Reporter
Programming.
AQtrace Report Monitor
AQtrace Report Monitor is a special redistributable utility that runs as a service on end-user computers
and sends reports to your server. It should be used only with those applications for which AQtrace Reporter
cannot display a notification window and send generated error reports. A typical example of such an
application is an executable running as a service. Using AQtrace Report Monitor solves the problem with
transferring reports to your server. See AQtrace Report Monitor for complete information.
AQtrace Packager
AQtrace Packager is a utility that is used for configuring AQtrace Reporter settings and applying them
to your executables. With AQtrace Packager you can tune almost any aspect of AQtrace Reporter’s
functionality. You can specify -●
The type of exceptions to be traced or to be ignored.
●
The modules whose code will be traced for exceptions.
●
Information that will be included in the reports (OS data, information on free memory and disk
space).
●
●
The text to be displayed in the notification window.
The address to which reports will be sent and the protocol that will be used for the transfer.
●
And so on.
For complete information on working with the Reporter, see the AQtrace Reporter description.
Report Collector, AQtrace Service, Initial and Persistent Storages
Error reports are sent to the server that receives and processes them. Report Collector is an .asp page that
functions on the server side and receives the error reports that are sent via HTTP and HTTPS protocols.
Report Collector saves these reports to a temporary folder. If the Report Collector’s settings specify it should
relay reports to another URL, the Collector sends the received reports to another URL (see Report Relaying).
If the Collector’s settings specify it should store reports, the Collector saves the report to a folder called
initial storage folder.
smartbear.com
AQtrace by SmartBear Software
Basic Concepts
21
AQtrace Service is another server-side component of AQtrace. It runs as a service and monitors the
initial storage folder. Once a new report arrives, AQtrace Service performs the initial processing of this
report and then moves it to a persistent storage folder. After this, you can analyze the report or process it in
any other way.
Notes:
●
Report Collector is used only for those reports that are sent via the HTTP and HTTPS protocols. If
AQtrace Reporter uses other protocols, you should configure its settings in such a way that the
Reporter sends reports directly to the initial storage folder.
●
You can specify the initial storage folder and persistent storage folder during the AQtrace
installation or you can do this any time later by using the AQtrace Server Config utility.
●
The initial and persistent storage folders may reside on the server computer or in any other place in
your local network. That is, you can use network paths to specify them.
●
It is recommended that you share the persistent storage folder so that other developers and the
plug-ins can work with the report files.
Issue-Tracking Plug-Ins
The AQtrace software package includes a number of issue-tracking plug-ins that work on the server
side. These plug-ins automatically append work items to issue-tracking systems like Visual Studio Team
System, Bugzilla, ALMComplete or JIRA on the base of the received error reports. AQtrace also includes a
special utility that lets you configure the plug-ins, settings and implement the desired bug-processing
scheme. For more information, see Issue-Tracking Plug-Ins.
AQtrace Viewer
AQtrace Viewer is a special utility that is included into the AQtrace package and is used for analyzing
error reports. It allows you to view and explore call stacks and disassembly code and view data included into
the report. For detailed information on how to work with the Viewer, see AQtrace Viewer description.
In order for AQtrace Viewer to be able to parse the call stack data, it must have access to binary code
and debug information of modules that are mentioned in the error report and to their source codes.
SmartBear and Microsoft Source Servers
Source servers are needed when you are analyzing received error reports with AQtrace Viewer. The
source servers help you see the exact version of a source unit that was used to compile the application’s build
in which an exception occurred.
AQtrace supports two source servers: Microsoft Source Server and SmartBear Source Server. The
Microsoft Source Server support is needed only when you are analyzing error reports. The SmartBear Source
Server modules are used on both report analysis and application preparation steps.
Build Storage, AQtrace Module Store and AQtrace Module Store Agent
AQtrace Service and AQtrace Viewer analyze call stack data that were saved to an error report by
AQtrace Reporter. In order for these tools to be able to parse the call stack data, they must have access to
binary code and debug information of modules mentioned in the report.
The binary code and debug information are not included in the report. You should store them somewhere
and specify their location by using the Viewer’s and Service’s settings.
End-users can work with different versions of your application and most likely you will receive error
reports generated for different versions. So, you should store binary modules and debug information for all
© 2011 SmartBear Software
smartbear.com/support
22
Getting Started Tutorial
versions of your application that were shipped to end-users. That is, you should create build storage for the
modules of your applications. In order for AQtrace Viewer and Service to be able to parse the reports, you
should specify the path to the build storage.
AQtrace Viewer and Service are typically installed on different workstations and most likely they will be
installed on other computers like the computer where the build storage resides. So, you should share the
build storage’s folder for network access in order for AQtrace Viewer and Service to be able to connect to
it.
For more information on creating and maintaining build storages, see Organizing Build Storage.
Server-Side Components
In the AQtrace documentation we use the term server-side components. It unites AQtrace components
and modules that function on the server side: Report Collector, AQtrace Service, issue-tracking plug-ins and
AQtrace Module Store Agent. The latter is included in this group because build storages typically reside on
servers.
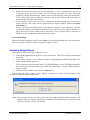
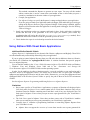
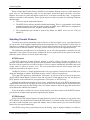
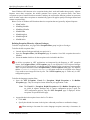
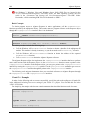
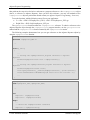
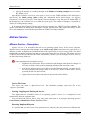
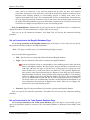
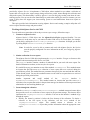
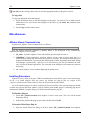
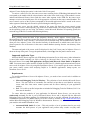
How AQtrace Works for End Users
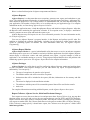
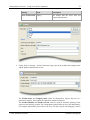
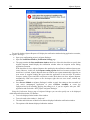
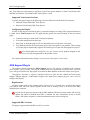
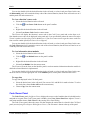
AQtrace is completely transparent for end-users. Typically, they don’t even know that your application
uses AQtrace. They run your application and work with it as usual. However, if an exception occurs during
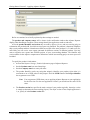
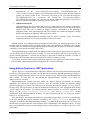
the run, they see a notification window on screen:
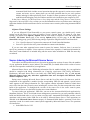
This window informs the user about the problem and suggests that the user sends an error report to the
application developer (that is, to you). If the user presses Send, the generated error report is sent.
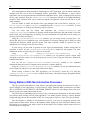
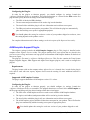
By selecting or clearing the check boxes in the notification window, the end-user can also control further
actions. For instance, if the I would like to specify my contact info... check box is selected, then after
pressing the Send button, AQtrace displays the User Info dialog where the end-user can enter their name, e-
smartbear.com
AQtrace by SmartBear Software
Getting Started - Important Notes on the Tutorial
23
mail and an additional description of the problem:
After the notification window is closed, the application may be closed or restarted (according to the
window’s check boxes) and the end-user can continue to work with your application.
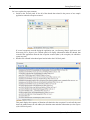
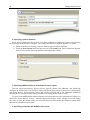
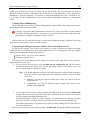
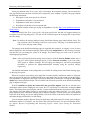
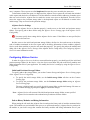
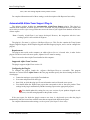
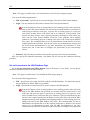
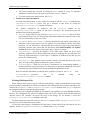
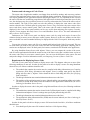
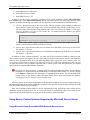
Getting Started - Important Notes on the Tutorial
To demonstrate the main features of the error reporting system we will skip a number of operations and
assume some alleviations from the real-world situation. Namely:
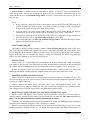
●
The tutorial needs that you install all the AQtrace components and that they are installed on the
same computer.
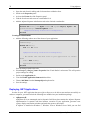
To install all the components, select all the three check boxes during AQtrace installation:
© 2011 SmartBear Software
smartbear.com/support
24
Getting Started Tutorial
The situation when all AQtrace components are installed on the same computer is contrary to realworld situation when, as a matter of fact, different AQtrace components work on different
machines:
●
AQtrace Reporter is shipped along with your application and functions on end-users’
computers.
●
Report Collector and AQtrace Service work on your server that receives error reports and
performs the initial processing of these reports. In general, the Collector and Service may work
on different computers.
●
Finally, AQtrace Viewer runs on developers’ workstations.
Using several computers can be difficult in the initial stage when you have just started using the
product. That is why we will assume that all AQtrace components are installed on the same
computer.
●
The computer, on which you install AQtrace, must have Internet Information Services (IIS)
installed. We will use HTTP protocol to transfer error reports from the sample application to
server-side components. In order for the Report Collector to function properly, IIS is required.
We assume that you use default Report Collector settings. That is:
URL: /AQtrace/bugreport.asp
Port: 80
●
In our explanations we will use a Visual C++ sample application that is shipped with AQtrace. All
AQtrace sample applications raise different types of exceptions that may occur in your
applications. Working with other sample applications is similar, so you can apply the same logic to
any of the sample applications.
You can find AQtrace samples in the <Users>\Public\Documents\AQtrace Files\Samples folder
on Windows 7, Windows Vista and Windows Server 2008 and in the <Documents and
smartbear.com
AQtrace by SmartBear Software
Getting Started - Important Notes on the Tutorial
25
Settings>\All Users\Documents\AQtrace Files\Samples folder on other operating systems. See
Sample Applications.
●
The pre-compiled samples shipped with AQtrace already have the error-reporting functionality
embedded into them. However, your applications should be processed in a special manner to
provide this functionality. That is why in this tutorial we will repeat the sequence of preparing the
application for AQtrace over the sample once again.
●
AQtrace is able to deal with both native-code (non-.NET) and managed (.NET) applications. Most
of the techniques are similar for both types of applications, yet certain aspects differ (especially the
phase of applying AQtrace Reporter). The Visual C++ sample application that we will use during
the tutorial is a native code application, so the tutorial descriptions are relate to native-code
applications. To learn how to process managed applications, see Using AQtrace Packager With
.NET Applications topic.
●
When specifying a source code path, we assume that there is only one version of the application’s
source files.
However, in general, each application version that was shipped to the end users has their own set
of sources. It is evident that to analyze the error report generated by some particular version (say,
version 1.2) the developer should observe the synchronous version of source files (not those of
version 1.0 or 1.5).
Typically, different versions of source files are maintained using especial source control systems.
AQtrace supports the most popular source control systems: Visual SourceSafe, Perforce,
Subversion, CVS. So you can configure AQtrace Viewer so that it automatically obtains the
sources synchronous to the examined error report. Read Source Server Support for detailed
information.
© 2011 SmartBear Software
smartbear.com/support
26
Getting Started Tutorial
Getting Started: Lesson 1 - Analyzing Error Reports
The main purpose of AQtrace is to obtain the error report and to find out the reason of that error quickly.
We will start working with AQtrace by exploring a sample error report with the AQtrace Viewer utility. This
utility is your workspace for examining an error report’s data and searching for the cause of an error.
Before an error report gets to your computer and can be explored with AQtrace Viewer, the report is
generated on the end-user’s computer, transmitted to your server, processed there and saved to a report
storage. We will explain all these operations a bit later, in the third part of this tutorial: Getting Started:
Lesson 3 - Using Build Storage and Server-Side Components. Right now we would like to show you how
you search for the cause of exceptions with AQtrace Viewer, because this utility that will be used more
frequently and by more users than any other component of the AQtrace package.
In order for AQtrace Viewer to be able to parse the report’s data, it must have access to the binary code
and debug information of your application’s modules. So, before analyzing the report, you should verify
whether the Viewer’s settings specify the path to the binary modules and debug information file. The
following topics describe the settings that you need to specify and explain how you can analyze error reports
with AQtrace Viewer.
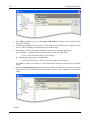
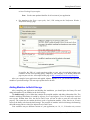
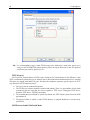
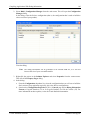
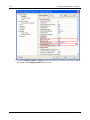
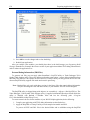
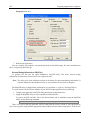
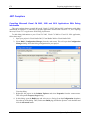
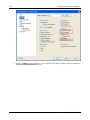
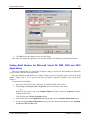
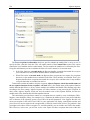
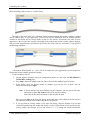
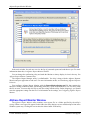
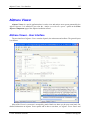
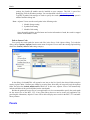
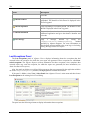
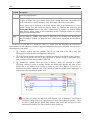
Specifying AQtrace Viewer's Settings
To provide the developer with more detailed information about the occurred exception, the AQtrace
Viewer need access to binary code, debug information and source code of the module or modules for which
error reports are generated. You specify the folders, in which the Viewer will look for the modules, debug
information and source code, in the Options dialog of AQtrace Viewer. Let’s modify these settings in order
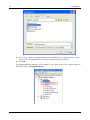
for the Viewer to be able to parse the data of our sample report:
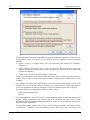
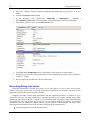
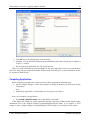
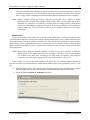
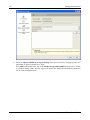
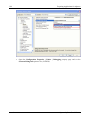
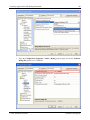
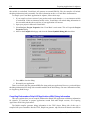
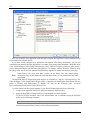
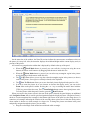
1. Open the Options Dialog
●
Launch AQtrace Viewer (the file name is <AQtrace>\Bin\AQtraceViewer.exe).
●
Select Options | Options from the main menu of AQtrace Viewer. This will invoke the Options
dialog. Use this dialog to configure AQtrace Viewer.
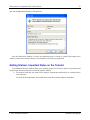
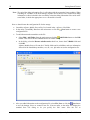
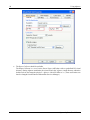
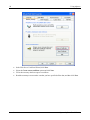
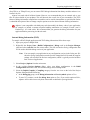
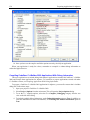
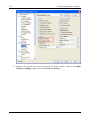
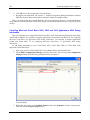
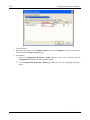
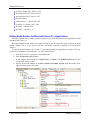
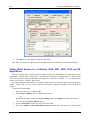
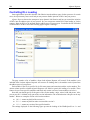
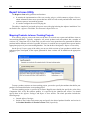
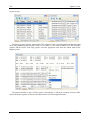
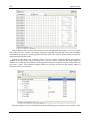
2. Specify path to binary modules and their debug information
●
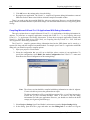
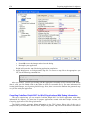
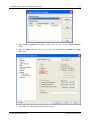
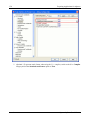
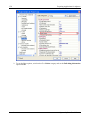
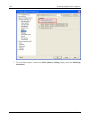
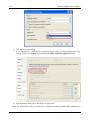
Select the General | Symbols category from the tree view on the left of the Options dialog. This
will display the Symbols Options page on the right of the dialog:
smartbear.com
AQtrace by SmartBear Software
Getting Started: Lesson 1 - Analyzing Error Reports
27
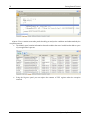
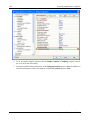
This page contains three setting that define the module locations: Module Storage, Modules Path and
Symbols Path. They complement one another. For more information on them, see AQtrace Viewer Specifying Path to Modules.
In general case, it is recommended to organize a build storage and specify the build storage
configuration file to the Module Storage setting as a primary source of modules location. However, in this
sample we use only one version of the application, and therefore will not create build storage. Instead we
specify the full path to the binary and debug information files to the Modules Path list. To do this:
●
Press Add to append a new row to the Modules Path list. A new empty row will be added.
●
Click within the in-place editor and press the ellipses button. This will display the standard Browse
for Folder dialog.
●
In the dialog, choose the folder that contains the binary files of your application. In our case, this is
<AQtrace Samples>\CompiledSamples\CPP\x86. This folder contains the binary modules of a 32bit Visual C++ sample application.
●
Click OK to return back to the Options dialog.
The settings of the Symbols Options group are critical for AQtrace Viewer. Without them it will not
be able to parse the call stack data.
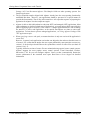
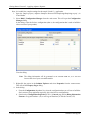
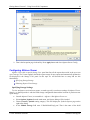
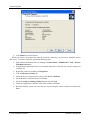
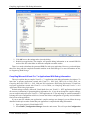
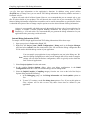
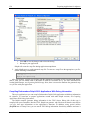
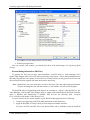
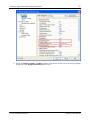
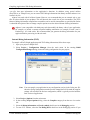
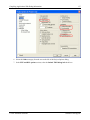
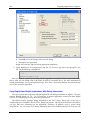
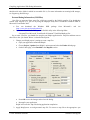
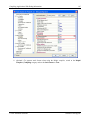
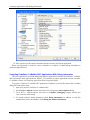
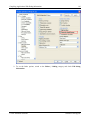
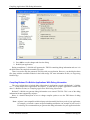
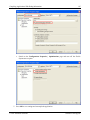
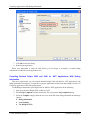
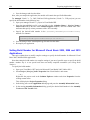
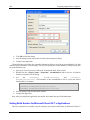
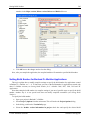
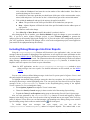
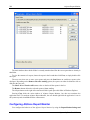
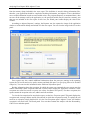
3. Specify path to the source files of your application
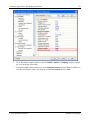
●
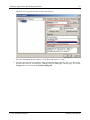
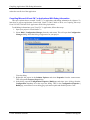
Choose the General | Source Code category in the Options dialog. This will activate the Source
Code page on the right of the dialog.
© 2011 SmartBear Software
smartbear.com/support
28
Getting Started Tutorial
●
Press Add to append a new row to the Source Code Paths list. AQtrace Viewer will add a new
empty row to the list.
●
Click within the Path cell of the new row. Then click the ellipsis button that is displayed within
this cell. This will display the standard Browse for Folder dialog.
●
In the dialog, select the folder that contains the source files of our sample application:
■ On Windows 7, Windows Vista or Windows Server 2008, select this folder:
<Users>\Public\Documents\AQtrace Files\Samples
■
On other operating systems, select this folder:
<Documents and Settings>\All Users\Documents\AQtrace Files\Samples
Press OK to confirm your choice. You will return back to the Source Code page of the Options
dialog.
●
Select the Include subdirectories check box for the added row. When this check box is selected,
then AQtrace Viewer will automatically search for the source files in subfolders of the specified
folder.
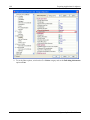
Notes:
smartbear.com
AQtrace by SmartBear Software
Getting Started: Lesson 1 - Analyzing Error Reports
29
●
Besides the path to the source files of your application, it is also recommended to specify the
search paths for the source files of MFC, VCL or any other library that was used to create your
application. Having this information, AQtrace Viewer is able to display source code for the MFC,
VCL or other library routines. Otherwise, the source code for these routines will not be shown in
the Disassembly and Code Viewer panels.
●
In this tutorial, we have only one version of application and consequently only one version of
source code files. That is why we have specified only one AQtrace Samples folder in the Source
Code Paths list.
However, generally the end-users have several different versions of your application. Therefore
you should be able to access different versions of source code files as well. A typical solution is to
apply some kind of source control system. Read Source Server Support topic to learn how to
obtain the sources synchronous to the examined error report.
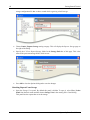
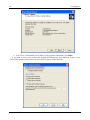
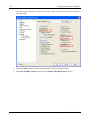
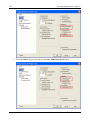
4. Save the settings
When all the needed settings are specified, press OK to close the Options dialog and to save the changes.
Now we are ready to explore a sample error report in AQtrace Viewer.
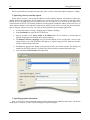
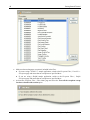
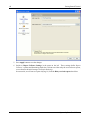
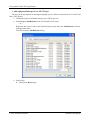
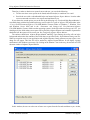
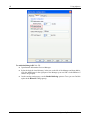
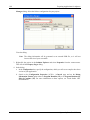
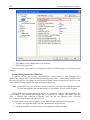
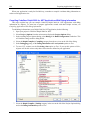
Analyzing Sample Report
Let’s explore a sample error report in AQtrace Viewer:
●
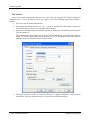
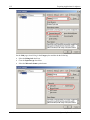
Choose File | Open from the AQtrace Viewer’s main menu. This will invoke the standard Open
File dialog.
●
In the dialog, navigate to the <AQtrace Samples>\CompiledSamples\CPP\x86\Log folder. This
folder contains sample report files.
The file names have the following format: cf-YYYYMMDDhhmmss, where YYYYMMDD stands for
the creation date of the error report (year, month, day) and hhmmss - for the creation time (hour,
minute, second).
●
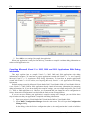
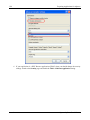
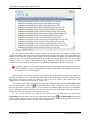
Select the earliest available report and press Open button.
Upon loading the report, AQtrace Viewer displays a message box with a brief description of the
exception for which the report was generated:
Note: This message box may state that a report does not contain information about exceptions. This
happens if the error report was generated “on demand” rather than when an exception occurred.
See Generating Error Reports on Demand.
© 2011 SmartBear Software
smartbear.com/support
30
Getting Started Tutorial
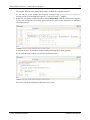
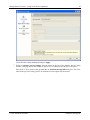
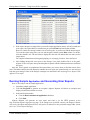
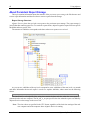
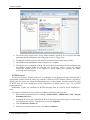
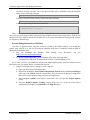
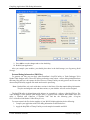
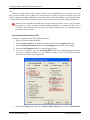
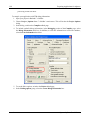
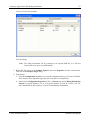
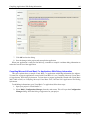
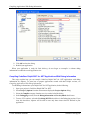
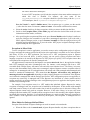
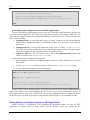
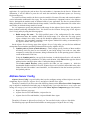
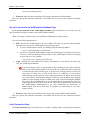
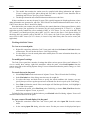
Let’s now explore the report contents:
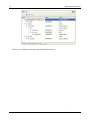
●
Switch to the Threads panel. It lists all of the threads that existed in the process of our sample
application when the exception occurred.
If several exceptions occurred during the application run, (see Running Sample Application and
Generating Error Reports), the Threads panel will display information about the threads that
existed in the application when the last exception occurred (that is, the exception, for which the
report was sent).
●
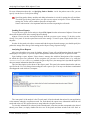
Double-click a thread in the thread panel and switch to the Call Stack panel:
This panel displays the sequence of function calls that led to the exception. For each call the panel
shows the module name, the call address, the function name and other information (see description
of the Call Stack panel).
smartbear.com
AQtrace by SmartBear Software
Getting Started: Lesson 1 - Analyzing Error Reports
31
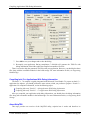
The topmost function in the panel is the function, in which the exception occurred.
As you can see, in our example the exception occurred in the CreateIntDivideByZero
function (at line 43 of the SampleExcepts file, if you use Visual C++ sample).
●
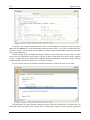
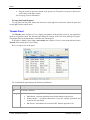
Right-click the topmost routine and choose Go to Disassembly from the context menu. AQtrace
Viewer will activate the Disassembly panel and set the cursor to the instruction, at which the
exception occurred:
As you can observe, the exception occurred while performing the division operation.
If you scroll the binary code up, you will see the function’s title:
The source code is also displayed in the Code Viewer panel:
© 2011 SmartBear Software
smartbear.com/support
32
Getting Started Tutorial
AQtrace Viewer contains some other panels that help you analyze the conditions and understand why the
exception occurred:
●
The Modules panel contains information about the modules that were loaded into the address space
of your application’s process.
●
Using the Registers panel you can explore the contents of CPU registers when the exception
occurred.
smartbear.com
AQtrace by SmartBear Software
Getting Started: Lesson 1 - Analyzing Error Reports
33
●
With the Memory 1, Memory 2 and Memory 3 panels you can explore memory contents.
●
The Screenshot panel displays the image of the application’s window or the image of the desktop
when the exception occurred. (To specify if the image is included in the report or not, use the
Screenshot setting on the Additional Reported Data page of AQtrace Packager).
●
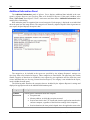
The Additional Information panel provides information about the memory, hard-disk space,
© 2011 SmartBear Software
smartbear.com/support
34
Getting Started Tutorial
processes running in the operating system, display devices and network configuration.
●
The Output panel contains brief description of the exception (the same description that is displayed
when a report is opened). The panel also shows information that the end-user specified in the User
Info dialog when sending the error report to you. This information may help you understand what
happened wrong on the end-user’s side.
●
The Last Exceptions panel lists the exceptions that occurred before the exception, for which the
error report was generated. These exceptions were traced by AQtrace Reporter, but the end-user
has not sent the error reports for them (that is, the user selected the Don't terminate the
application check box in the notification window and pressed Don't Send).
smartbear.com
AQtrace by SmartBear Software
Getting Started: Lesson 1 - Analyzing Error Reports
35
To determine why an exception occurred, double-click it in the Last Exceptions panel and then
explore the contents of the Call Stack and Disassembly panels (for these exceptions the report
contains only the Call Stack data).
●
The Event Log panel displays the log that contains information on events of certain types raised in
the application before the exception occurred. For instance, from this log you can find out when
threads were created, suspended, resumed or terminated, when application modules were loaded or
unloaded, when AQtrace Reporter’s functionality was temporarily disabled and enabled for the
entire application or for certain threads, and so on.
●
The Watch panel allows creating “watches” for complex variables (structures and objects) declared
in the application and exploring the values assigned to these variables before the exception
occurred.
© 2011 SmartBear Software
smartbear.com/support
36
Getting Started Tutorial
You have now finished the first part of the Getting Started tutorial.
smartbear.com
AQtrace by SmartBear Software
Getting Started: Lesson 2 - Applying AQtrace Reporter
37
Getting Started: Lesson 2 - Applying AQtrace Reporter
This part of the tutorial provides step-by-step instructions of how to prepare your application for
AQtrace. The way you do this depends on the application type and your development tool. In this tutorial we
work with a native-code Visual C++ sample that is compiled with Microsoft Visual Studio. We will get an
EXE module that is able to trace exceptions with AQtrace and generate and send error reports.
The section includes the following topics:
Setting Version Number
Generating Debug Information
Compiling the Application
Copying the AQtrace Reporter Libraries
Applying AQtrace Reporter to Your Application
Running Sample Application and Generating Error Reports
Note: AQtrace sample executables and DLLs were compiled with debug information and have version
numbers specified. You can use these compiled modules if for some reasons you cannot compile
the source files.
Setting Version Number
End-users may work with different versions of your application, so you may receive error reports that
were generated for different versions. The version information included in your modules help the AQtrace
Service and AQtrace Viewer determine the application version for an error report and parse the call stack
data correctly.
You can specify version information before or after compiling your application:
●
To specify the version information before compiling your application, you should either modify
your project settings, or change resource files. For more information on how to do this, see your
development tool’s documentation.The following section describes how you can set version info in
the most popular development tools:
Setting Build Number
●
To specify version information after your application is compiled, you use special tools that can
modify version information of binary modules. An example of such a tool is Automated Build
Studio.
In this tutorial we will set the version number by modifying the project of our Visual C++ sample
application. You can find the step-by-step instructions below.
Note: The compiled sample applications that are shipped with AQtrace already have the version
information specified. So, if you use a compiled sample, you can switch to the next topic.
© 2011 SmartBear Software
smartbear.com/support
38
Getting Started Tutorial
●
Open the <AQtrace Samples>\Sources\CPP\SampleApp\SampleApp.vcproj project in Visual
Studio.
●
Activate the Resource View window.
●
In the Resource View, double-click SampleApp | SampleApp.rc | Version
VS_VERSION_INFO node. This will open the version information’s editor in Visual Studio.
●
In the editor, specify 1.0.0.1 in the FileVersion field:
●
Select File | Save SampleApp.rc from Visual Studio’s main menu to save the changes.
●
Similarly, you can set the version information for the SampleDll project that is part of AQtrace’s
Visual C++ sample.
●
Do not compile any modules now. We will do this later.
|
Generating Debug Information
The debug information is needed for AQtrace Service and AQtrace Viewer to parse received error
reports. The Service and Viewer use debug information to determine the functions’ locations in the
application’s binary code and to unwind the call stack.
Compilers can either include debug information into the compiled executable, or generate it as an
external file. The way the debug information is generated depends on the compiler settings. Since debug
information is not used on end-users’ computers, it is recommended that you generate debug information into
an external file. This will decrease the overall size of your modules shipped to end-users. For detailed
information on how to modify the compiler settings, see your compiler’s documentation. The topics of the
following section explain how you can do this in the most popular development tools:
Compiling Applications With Debug Information
smartbear.com
AQtrace by SmartBear Software
Getting Started: Lesson 2 - Applying AQtrace Reporter
39
Now, let’s modify the compiler settings for the sample Visual C++ application.
1. Open the sample project (<AQtrace Samples>\Sources\CPP\SampleApp\SampleApp.vcproj ) in
Visual Studio.
2. Select Build | Configuration Manager from the main menu. This will open the Configuration
Manager dialog.
In the dialog, select the Release configuration (that is, the configuration that is used to build the
release version of your product):
Close the dialog.
Note: The debug information will be generated as an external PDB file, so it will not
increase the size of your executable module.
3. Right-click the project in the Solution Explorer and select Properties from the context menu.
This will call the Property Pages dialog.
4. In the dialog:
a. From the Configuration dropdown list, select the configuration that you will use to build the
final version of your application (typically, this is the Release configuration).
b. Switch to the Configuration Properties | C/C++ | General page and set Debug Information
Format to Program Database (/Zi) or to Program Database for Edit & Continue (/ZI).
© 2011 SmartBear Software
smartbear.com/support
40
Getting Started Tutorial
c. Open the Configuration Properties | Linker | Debugging property page and set the
Generate Debug Info option to Yes (/DEBUG).
smartbear.com
AQtrace by SmartBear Software
Getting Started: Lesson 2 - Applying AQtrace Reporter
41
5. Click OK to save the settings and to close the dialog.
6. Similarly, you can generate information for the SampleDll project that is already part of AQtrace’s
Visual C++ sample.
7. Do not compile the application now. We will do this later.
There is no need to distribute the generated PDB files with your application. However, you should place
these files along with the compiled executable modules in the build storage. For more information on this,
see Organizing Build Storage.
Compiling Application
Before compiling your application, make sure that you have completed the following steps:
●
Set the compiler settings to enable the generation of debug information (see Generating Debug
Information).
-- and --
●
Modified the application’s version number (see Setting Version Number).
Now you can compile your application:
●
Select Build | Rebuild Solution from Visual Studio’s main menu.
Visual Studio will compile the sample application and place the binary modules along with the debug
information files in the <AQtrace Samples>\CompiledSamples\CPP\x86 folder, if you compile a 32-bit
sample, or in the <AQtrace Samples>\CompiledSamples\CPP\x64 folder, if you compile a 64-bit sample.
© 2011 SmartBear Software
smartbear.com/support
42
Getting Started Tutorial
Copying AQtrace Reporter Libraries
After you compiled your application, you need to copy some libraries to the folder in which the
application is located. This step is optional for AQtrace sample applications (see below), but is mandatory
and important for your applications:
After you compiled your application, copy the aqReporter.dll library to the folder, in which your
executable resides. You can find this library in the following folder:
●
<AQtrace SDK>\Modules\x86 - for 32-bit applications
●
<AQtrace SDK>\Modules\x64 - for 64-bit applications
This library contains the implementation of AQtrace Reporter. It must be shipped along with your
application and the application should be able to load this library at startup. So, when building the
installation for your application, do not forget to include this DLL into your installation package. The
installation wizard should add it to the folder, from which your application will be able to load it. The easiest
way to achieve this is to place the DLL in the folder where the application is located. See Distributing
AQtrace Reporter Libraries.
If you use a sample application from the AQtrace package, then there is no need to copy the library,
because the AQtrace installation wizard has already added it to the appropriate folder.
If your application runs on Window 98, NT or Windows 2000, then in addition to the aqReporter
library you should also distribute dbghelp.dll along with your application. You can find this library in the
<AQtrace>\SDK\Modules\x86 folder. See Distributing AQtrace Reporter Libraries.
For .NET users: If you work with a managed code application, then you should also generate the
aqReporterInterop.dll library and distribute it along with the two libraries mentioned above. See Deploying
.NET Applications.
Applying AQtrace Reporter to Your Application
After you set the version number and compiled your application with debug information, you should
apply AQtrace Reporter to your module. To do this, use the AQtrace Packager utility that is part of the
AQtrace installation. It can process both native code and managed code applications. This utility is copied to
your computer if you select the Prepare your applications for AQtrace check box during AQtrace
installation (see Getting Started - Important Notes on the Tutorial).
Using AQtrace Packager you can specify various settings of AQtrace Reporter, for instance, you can
define -●
The product identifier.
●
The addressee where the error reports will be sent and the transfer protocol(s) to be used.
●
The exceptions to be traced and the modules in which the exceptions to be traced.
●
The data to be collected and included into the generated error reports.
●
The data to be displayed in the notification window.
●
And other settings.
For some settings you can use default values. For some other you must specify values in order for
AQtrace Reporter to function properly. For complete information on setting AQtrace Reporter’s options, see
Using AQtrace Packager With Native Applications and Using AQtrace Packager With .NET Applications.
smartbear.com
AQtrace by SmartBear Software
Getting Started: Lesson 2 - Applying AQtrace Reporter
43
Note: The compiled sample applications that are shipped with AQtrace have already been processed
with AQtrace Packager, that is, they have AQtrace Reporter applied to them. The samples
include the AQtrace Packager projects that were used to process the compiled sample modules
(see Sample Applications). So, if you use these applications to go through the Getting Started
tutorial, then you can skip this topic and switch to the next one.
Let’s now specify settings and apply AQtrace Reporter to our sample application. This process typically
includes the following steps:
1. Specifying the module to be processed.
2. Specifying product information.
3. Specifying the mode of sending the error reports and transfer protocol settings.
4. Specifying reporter behavior.
5. Specifying additional data to be included in error reports.
6. Specifying the exceptions and modules to be traced.
7. Specifying the notification window settings.
8. Processing the module.
Note: Before we proceed, we would like to explain which modules to be processed by AQtrace
Packager:
Modern applications typically include several modules: the main executable, a number of helper
dynamic link libraries, services, ActiveX modules and so on. Quite often, there is no need to
process all the modules with AQtrace Packager. You do this only for executables that are
included in your product. When an executable is loaded in memory, it will initialize AQtrace
Reporter so that the Reporter will handle exceptions that occur in the process created for the
executable. The Reporter will also detect and handle exceptions that occur in the DLLs that are
loaded by the executable, so, there is no need to process these DLLs with AQtrace Packager.
However, if your DLL will be used by the application that does not contain AQtrace Reporter
then you should process this DLL with the Packager. Else, the Reporter will not handle the
exceptions that occur during execution of the DLL’s routines.
1. Specifying the module to be processed
●
Launch AQtrace Packager (the file name is <AQtrace>\Bin\AQtracePackager.exe).
●
Select File | New | Native Project from the main menu of AQtrace Packager to create a new
configuration project (the settings pages of AQtrace Packager are disabled until you create a new
or open an existing project).
●
Activate the Module | Module Information page.
●
In the page:
■
Click the ellipsis button of the File Name box. This will invoke the standard Open File dialog.
■
In the dialog, choose the executable that we compiled in the previous step (<AQtrace
Samples>\CompiledSamples\CPP\x86\SampleApp.exe) and press Open. AQtrace Packager
will display the fully-qualified name of the executable in the File Name box and will display
the file properties in the Module Information page.
© 2011 SmartBear Software
smartbear.com/support
44
Getting Started Tutorial
We have specified the executable for processing. Now we have to deal with AQtrace Reporter’s settings.
2. Specifying where to send the reports
Using AQtrace Reporter you specify the address to which AQtrace Reporter will send error reports, the
transfer protocol and parameters for the sending (see Transferring Reports for details.) In this part of the
tutorial we will not send the reports anywhere, but in the next part we will. We will use the Hyper-Text
Transfer Protocol (HTTP). The transfer parameters for this protocol include the address of the web server, to
which AQtrace Reporter will send error reports and on which reports will be received and processed by the
special .asp page, (Report Collector). Let’s specify these parameters for our sample application:
●
Activate the Reporter Settings | Sending page of AQtrace Packager.
●
In the Send mode list select the HTTP check box.
●
Specify localhost in the Server name or IP address box. (In our tutorial we assume that all
AQtrace components are installed on the same computer.)
●
The Report Collector (.asp page) box specifies the address of the .asp page that receives error
reports on the server side. By default, this address is \AQtrace\bugreport.asp. Make sure that the
edit box contains this default value.
●
The Port box specifies the number of the port that will be used for the transfer. The default port
number for the HTTP protocol is 80. Make sure the Port text box contains this default value.
●
Leave the User and Password fields unspecified.
3. Specifying product information
Now we will specify the product and company names and the product identifier and version. You do this
on the Reporter Settings | Product Information page of AQtrace Packager:
smartbear.com
AQtrace by SmartBear Software
Getting Started: Lesson 2 - Applying AQtrace Reporter
45
Before we continue, let us briefly explain why these settings are needed.
The product and company names will be shown in the notification window that AQtrace Reporter
displays when handling an exception. These settings identify the application vendor to end-users.
As for the product identifier and version, they are used by AQtrace Service and issue-tracking plug-ins
to determine the product build, for which an error report was generated. The problem is that most companies
ship several products and have clients that use different versions of the same product (1.0, 2.0 and so on). So,
most likely you will receive error reports generated for different versions of different products. You may
want to organize error reports into different projects of your issue-tracking database. The identifier and
version number let the AQtrace components to determine to which issue-tracking project an error report will
be added.
To specify the product’s information:
●
●
Activate the Reporter Settings | Product Information page of AQtrace Reporter.
Into the Product name box enter SampleApp.
●
Into the Company name box enter your name.
●
The product identifier can be any string that uniquely identifies your product. Quite often it is
convenient to use a GUID value for this purpose. Press the GUID button of the Project identifier
box to generate a new GUID.
Note: You can generate GUID when you are applying AQtrace Reporter to your application
for the first time. For the next application versions, you should use the same GUID
value.
●
The Product version box specifies the major version of your product (typically, the major version
is enough to determine the issue-tracking project). The major version of our sample application is
1, so, specify 1 in the Product version box.
© 2011 SmartBear Software
smartbear.com/support
46
Getting Started Tutorial
4. Specifying reporter behavior
When AQtrace Report generates an error report, then in addition to sending this report it may also keep
the report copy on the end-user’s computer. Let’s enable this behavior of AQtrace Reporter. To do this:
●
Switch to the Reporter Settings | Reporter Behavior page of AQtrace Packager.
●
Select the Store reports check box and enter Log in the Folder field. This will make the Reporter
store the error reports in the Log subfolder of the application’s folder.
5. Specifying additional data to be included in error reports
The error reports generated by AQtrace Reporter typically contain some additional data which help
developers to find the cause of an exception faster: information about processes and services, about printing
and display devices, about operating system and security privileges and so on. Additional information
increases the size of report files but it may invaluable in searching for the reason of a bug.
To specify what additional data AQtrace Reporter will collect and save to the generated error reports, use
check boxes on the Reporter Settings | Additional Reported Data page. In this example we will not change
any values, so leave the settings as they are. In real life projects you can modify the settings to control which
data will be included into error reports.
6. Specifying exceptions and modules to be traced
smartbear.com
AQtrace by SmartBear Software
Getting Started: Lesson 2 - Applying AQtrace Reporter
47
Using AQtrace Reporter settings, you can specify the exceptions, which the Reporter will trace, and the
modules, whose execution the Reporter will trace. You do this by defining the exception filter and the
module filter. AQtrace Reporter will generate error reports only for those exceptions that match both the
exception and module filters. For more information on this, see Specifying Exceptions to Be Traced and
Specifying Modules to Be Traced.
Let’s now specify the filter settings.
Exception Filter
To pinpoint the exceptions to be traced, use the setting pages of the Exception Filter section. These
pages specify the exceptions to be traced. All the exceptions are divided into two large groups: OS
exceptions and language exceptions. OS exceptions are generated as system level (access violation, division
by zero and so on). They are specified by their code. Language exceptions are those that are generated by
application code. They are specified by their class names like Exception in Delphi. See Specifying
Exceptions to Be Traced for complete information on the exception types.
The pages of the Exception Filter section contain settings that let you specify both OS and language
exceptions to be processed. Currently, AQtrace can handle language exceptions that occur in .NET, Visual
C++, Delphi and C++Builder applications. Visual Basic language exceptions are not supported.
The exception filter can work in normal or inverted mode. In normal mode, AQtrace Reporter traces only
those exceptions that are selected in the settings pages. When inverted mode is active, AQtrace Reporter
traces only those exceptions that are not selected on the pages.
In our case we will not create a list of the exceptions to be traced. We will trace all the exceptions. To do
this:
●
Activate the Exception Filter | OS Exceptions page of AQtrace Packager.
●
Make sure that the check boxes of the Active column. You can do this by pressing Unselect All.
© 2011 SmartBear Software
smartbear.com/support
48
Getting Started Tutorial
●
●
Make sure that no language exception is included in the filter:
■
If you are using a Visual C++ sample application, switch to the Exception Filter | Visual C++
Exceptions page and ensure that no exceptions are specified there.
■
If you are using a Delphi sample application, switch to the Exception Filter | Delphi
Exceptions page and ensure that no exceptions are specified there.
Activate the Exception Filter | Filter Mode page and select the Trace all the exceptions except
for those selected in this section option.
smartbear.com
AQtrace by SmartBear Software
Getting Started: Lesson 2 - Applying AQtrace Reporter
49
This will command AQtrace Reporter to use the exception filter in inverted mode, that is, this will
command the Reporter to trace the exceptions that are not included in the filter. In our case the
filter is empty, so this command will mean that AQtrace Reporter should trace all the exceptions.
Note: AQtrace samples include the AQtrace Packager projects that can be applied to sample
applications. The exception filter settings of these projects differ from the settings that we have
described. Our settings let you catch any exception, while the sample projects’ settings define
the list of OS and language exceptions to be traced. However, this difference will not affect the
result. In both cases you will be able to catch all of the exceptions that occur in the sample
applications.
Module Filter
To specify the modules to be traced, you create and use the module filter. It defines the modules whose
execution AQtrace Reporter will trace for exceptions. When normal mode is active, AQtrace Reporter traces
the exceptions that occur in the modules included in the filter and all other exceptions are ignored. When
inverted mode is active, AQtrace Reporter traces exceptions that occur in any other modules except for those
that are included in the filter. Of course, in both cases the Reporter traces only those exceptions that match
the exception filter.
Note: When AQtrace Reporter determines whether to ignore or process an exception, it checks the
module names of two topmost functions in the exception’s call stack. If any of these modules
was included in the filter, then according to the filter mode, the Reporter either skips the
exception or generates an error report for it. See Specifying Modules to Be Traced.
In our example, we will not specify the modules to be traced. We will command AQtrace Reporter to
trace the execution of all modules that are loaded into the address space of our application’s process. To do
this:
●
Open the Module Filter | Filter Settings page. This page contains the list of modules to be included
into the module filter and the check box and two radio buttons that define the filter mode.
●
Select the Trace exceptions in all modules check box.
© 2011 SmartBear Software
smartbear.com/support
50
Getting Started Tutorial
7. Specifying notification window settings
You can specify the text to be displayed in the notification window that AQtrace Reporter shows when
an exception occurs:
●
Open the Notification Window | Notification Settings page.
●
Make sure the Show notification window check box is selected. This will command AQtrace
Reporter to display the notification window when an exception is detected. If the check box is
clear, AQtrace Reporter sends the generated error report without notification. Also, note that if the
Postpone sending reports option is active (it becomes available only when Show notification
window is inactive), AQtrace Reporter does not send the error report automatically without
displaying the notification window. It suggests sending the report next time the user runs the
application.
●
Using other controls of the page you can specify text to be displayed within the notification
window. We will not change this text in our example, so leave the default value in all the controls.
In real life projects, you will have to enter a value for the Error reports policy link, URL setting.
It specifies the web page, on which end-users can ready about the error reporting policy adopted in
your company.
8. Processing the module
To apply AQtrace Reporter to our sample executable, click Process Module on the AQtrace Packager’s
toolbar. This is an important step. Without it, the changes will not be applied to your executable.
Note: Before applying AQtrace Reporter to your module, AQtrace Packager creates a backup copy of
the module. So that you can restore the original copy of our module from it.
Currently, you can process a module with AQtrace Packager only once. If you need to re-apply
the Reporter to your module, then you can either apply it to the backup copy of the module or
recompile the module.
Tip: Alternatively, you can process the module from the command-line. This ability is helpful when
you use various tools that automate software builds. See AQtrace Packager Command Line for
more information.
We have specified AQtrace Reporter’s settings and applied them to our sample execution. Now we may
close AQtrace Packager. Before closing you can save the configuration project to a file. To do this, select
File | Save or File | Save As from the Packager’s main menu and specify the desired file name in the ensuing
Save File dialog.
Running Sample Application and Generating Error Reports
We have prepared the sample application for AQtace:
●
We compiled the application with debug information and set the version number (see Generating
Debug Information and Setting Version Number).
●
We copied the AQtrace Reporter libraries to the folder in which the application is located (see
Copying AQtrace Reporter Libraries).
smartbear.com
AQtrace by SmartBear Software
Getting Started: Lesson 2 - Applying AQtrace Reporter
●
51
We processed the application’s executable with AQtrace Packager (see Applying AQtrace
Reporter to Your Application).
Now we are ready to run our sample application and see how AQtrace Reporter generates error reports.
●
Start our sample application. Wait until the application’s window appears on screen.
The application’s main form contains three buttons that raise exceptions and a number of controls
that let you specify various aspects of the exception functions.
The buttons that raise exceptions reside at the bottom of the application’s window:
The OS and Language buttons raise the OS and language exceptions correspondingly. AQtrace
Reporter catches these exceptions, generates error reports and displays notification windows.
The Visual Basic sample application does not contain the OS and Language buttons, because
AQtrace Reporter does not catch language exceptions in VB applications. Instead of these buttons,
the VB sample has two other buttons that raise different OS exceptions.
The Fatal button is used to demonstrate how to generate an error report on demand. Its event
handler does not raise any exception. It gets program access to AQtrace Reporter and commands it
to generate an error report. This report contains all of the information that would be included in it,
if an exception occurred (see Generating Error Reports on Demand).
Let’s now play with the application, raise exceptions and see how AQtrace Reporter handles them.
●
In the main window of the sample application, switch to the Exceptions tab, select the Int Divide
By Zero type in the OS Exceptions group.
●
Press the OS button. If you use the Visual Basic sample just press the Int Divide By Zero button.
The sample application will execute a division by zero and an exception will occur. AQtrace
Reporter will trace this exception, generate an error report and display the notification window on
screen.
© 2011 SmartBear Software
smartbear.com/support
52
Getting Started Tutorial
●
In the window:
●
Clear the Don't terminate the application and Restart application check boxes.
●
Select the local path of the generated error report with the mouse, right-click it and choose
Copy. This will copy the path of the most recent report to the clipboard. It will afterwards be
used to open the report in AQtrace Viewer.
●
Press Don't Send.
smartbear.com
AQtrace by SmartBear Software
Getting Started: Lesson 2 - Applying AQtrace Reporter
53
Since we have cleared the “Don't terminate the application” option then the sample application
will be closed automatically.
That is it. We have simulated an abnormal behavior of the application and raised an exception. This
exception was intercepted by AQtrace Reporter and the corresponding error report has been created.
After we generated an error report, we can open and explore it in AQtrace Viewer. You can read more
about this in the previous part of the tutorial. Don’t forget to specify path to binary module in AQtrace
Viewer settings.
© 2011 SmartBear Software
smartbear.com/support
54
Getting Started Tutorial
Getting Started: Lesson 3 - Using Server-Side Components
In previous sections of the Getting Started tutorial we described how to analyze error reports and how to
prepare your application for AQtrace. We launched our sample application and generated error reports. In
this section we would like to show how to bind AQtrace components together and use them to automate the
entire error-reporting process.
The section contains the following topics:
Preparing Application for AQtrace - Key Points
Adding Modules to Build Storage
Organizing Report Storages
Configuring Server-Side Components
Configuring AQtrace Viewer
Running Sample Application and Generating Error Reports
Preparing Application for AQtrace - Key Points
In the previous section of the Getting Started tutorial we described how to compile your application for
AQtrace. In this topic we would like point out key aspects of compiling and the settings that make AQtrace
components work as a whole.
1. Compile your application with debug information. Debug information is needed to analyze error
reports. For information on how to compile applications with debug info in popular compilers, see
Compiling Applications with Debug Information.
2. Specify version number for each build of your application. See Setting Version Number.
3. When using AQtrace Packager to specify the AQtrace Reporter parameters, pay attention to the
following settings:
●
On the Reporter Settings | Sending page, select the protocol that AQtrace Reporter will use to
send error reports to your server and the protocol settings. These settings must corresponds to
the settings that you specify on the server side.
In our sample we use the following settings:
Setting
Value
Send mode
HTTP
Server name or
localhost
IP address
smartbear.com
Description
We specify use value because we installed
all AQtrace components on one computer.
Report Collector
\AQtrace\bugreport.asp This is the address of the Report
Collector’s .asp page on the server side.
Port
80
Default port value used by the HTTP
protocol.
AQtrace by SmartBear Software
Getting Started: Lesson 3 - Using Server-Side Components
Setting
Value
User and Password (empty)
●
55
Description
We assume that the server does not
require authentication.
On the Reporter Settings | Product Information page specify the product and company name
and the product identifier and version:
The Product name and Company name values are displayed by AQtrace Reporter in a
notification window. They identify the application vendor to end-users.
The Product identifier and Product version values are used for automatic posting of error
reports to issue-tracking systems. The Getting Started tutorial does not cover this functionality.
For complete information, please refer to the Issue-Tracking Plug-Ins and Mapping Products
© 2011 SmartBear Software
smartbear.com/support
56
Getting Started Tutorial
to Issue-Tracking Projects topics.
Note: Use the same product identifier for all versions of your application.
●
Pay attention to the Error report policy link | URL setting on the Notification Window |
Notification Settings page:
It specifies the URL of a web page that resides on your web site and that informs your
customers on the error-reporting policy adopted by your company. You should publish this
page on your web site. An example of this page is http://smartbear.com/error-reports-policy/.
After you compiled your application and applied AQtrace Reporter to it, you should add application
modules to your build storage. The next topic explains how to do this.
Adding Modules to Build Storage
After compiling your application and building the installation, you should place the binary files and
debug information of your modules in the build storage.
The build storage is just a folder that contains the compiled modules and debug information files. The
modules and debug information is needed by AQtrace Service and AQtrace Viewer to analyze the received
error reports. Without these files, the Service and Viewer will not be able to parse the call stack data
properly. The reports do not contain the binary code of application modules, so the Service (or Viewer)
retrieves the binary code from the build storage. The presence of modules in the build storage and knowing
the build storage path are critical for AQtrace Service and Viewer.
Your customers may use different versions of your application (ver. 1.0, 1.1, 2.10 and so on), so most
smartbear.com
AQtrace by SmartBear Software
Getting Started: Lesson 3 - Using Server-Side Components
57
likely you will receive error reports that were generated for different versions. The storage must contain
the modules for all versions that are shipped to end users.
Also, you should place all the modules that are included in the installation, to the build storage. For
instance, if your application uses a DLL, add both the executable and the DLL.
To search for a module in the build storage, AQtrace Service and AQtrace Viewer use the module’s file
name (file name and extension) and the version number.
You use the AQtrace Module Store utility to create a configuration file that contains information about
the file names, the modules’ versions and their location in the storage (see below). You can then specify the
file’s name and path to AQtrace Service and AQtrace Viewer and they use the information included in the
file to find the needed module.
Let’s create the build storage and the configuration file for our sample application:
●
Launch Windows Explorer.
●
Create a new C:\Builds folder.
●
Open this folder in the Windows Explorer.
●
Create a new ver. 1.0.0 subfolder in this folder.
●
Copy compiled binary modules and debug information files to the C:\Builds\ver. 1.0.0 folder. For
instance, for our sample Visual C++ application, copy the SampleApp.exe, SampleApp.pdb,
SampleDll.dll and SampleDll.pdb files. They reside in the <Users>\Public\Documents\AQtrace
Files\Samples\CompiledSamples\CPP\x86 folder on Windows 7, Windows Vista and Windows
Server 2008 and in <Documents and Settings>\All Users\Documents\AQtrace
Files\Samples\CompiledSamples\CPP\x86 on other operating systems.
© 2011 SmartBear Software
smartbear.com/support
58
Getting Started Tutorial
Note: We copied the debug information files (*.pdb) along with the appropriate binary modules. When
searching for a module in the build storage, AQtrace Service and Viewer assumes that debug
information is either included in the executables or that the debug information files reside in the
same folder, in which the appropriate .exe or .dll module is located.
Now we should create the configuration file for the storage:
● Launch the AQtrace Module Store utility. It is located in the <AQtrace>\Bin folder.
●
In the utility, select File | New from the main menu or click the
configuration file.
●
To add information about modules to the file:
New button to create a new
●
Select Edit | Add Folder from the main menu or click the
Add Folder button on the Edit
toolbar. This will invoke the standard Browse for Folder dialog.
●
In the dialog, select the Recurse subdirectories check box, choose the C:\Builds folder and
click OK.
AQtrace Module Store will scan the C:\Builds folder and its subfolders and save information
about all of the found binary modules (.exe, dll, .ocx, .bpl and so on) to the configuration file.
●
After you added information to the configuration file, select File | Save or click the
Save button
to save the changes. Since we created a new file, it has no name, so the utility will display the
standard Save File dialog to let you specify the file’s name. Save the file as
smartbear.com
AQtrace by SmartBear Software
Getting Started: Lesson 3 - Using Server-Side Components
●
59
C:\Builds\BuildConfig.xml.
Close AQtrace Module Store utility.
Note: Keep in mind that in real-world situations you should update the build storage and configuration
file for each build shipped to end-users. Otherwise, AQtrace Service and Viewer will not be able
to parse the received error reports.
To automate the updating you can use AQtrace Module Store Agent. It monitors the build
storage and updates the configuration file upon changes.
Organizing Report Storages
AQtrace server-side components processes error reports in two steps:
1. The reports are received by Reporter Collector and saved to some folder that serves for temporary
storage. This folder is called initial storage.
2. Then, AQtrace Service checks the reports’s data and moves the reports to another folder where
they are stored permanently. This folder is called persistent storage.
Let’s create the folders for report storages:
●
Launch Windows Explorer or any other file manager.
●
Create the following folders for the initial and persistent storages:
Initial storage: C:\Error Reports\Initial
Persistent storage: C:\Error Reports\Storage
In the next topic we will specify these folders in the Report Collector and AQtrace Service settings.
Configuring Server-Side Components
You can specify the settings of server-side components either during the AQtrace installation by using
special pages of the installation wizard, or you can do this later by using the AQtrace Server Config utility. In
our tutorial, we have already installed server-side components, but have not configured and used them
before. Let’s configure them now.
1. Launch the AQtrace Server Config utility (you can find it in the <AQtrace>\Bin folder).
2. Choose Common Settings from the menu on the left of the AQtrace Server Config window.
3. In the Initial storage folder field specify C:\Error Reports\Initial as initial storage path. The
Report Collector will store received error reports to this folder.
4. Press the ellipsis button on the right of the Build storage file name field and choose the
C:\Build\BuildConfig.xml build storage configuration file that we have created earlier.
© 2011 SmartBear Software
smartbear.com/support
60
Getting Started Tutorial
5. Press Apply button to save the changes.
6. Switch to Report Collector Settings in the menu on the left. These settings define Report
Collector’s options and functioning mode (the Collector can either relay the received error reports,
or save them to the initial storage. See Report Relaying).
In our tutorial, we will not use report relaying. So, clear the Relay received reports check box:
smartbear.com
AQtrace by SmartBear Software
Getting Started: Lesson 3 - Using Server-Side Components
61
Leave the other settings unchanged and press Apply.
7. Switch to AQtrace Service Settings from the menu on the left of the AQtrace Server Config
window. This page defines the settings of AQtrace Service that processes the received reports.
Specify the C:\Error Reports\Storage path into its Persistent storage folder edit box. This is the
name of the persistent storage folder, in which the received reports will be located.
© 2011 SmartBear Software
smartbear.com/support
62
Getting Started Tutorial
8. Switch to AQtrace Module Store Agent Settings in the menu on the left. This page specifies the
parameters of AQtrace Module Store Agent.
Press Add button to add a new item to the Module storage folder path list, and specify C:\Builds
as a module storage folder. Now the Agent will monitor this folder and automatically update the
file list in the configuration file.
smartbear.com
AQtrace by SmartBear Software
Getting Started: Lesson 3 - Using Server-Side Components
63
9. That is the last option page in the utility. Press Apply button and close AQtrace Server Config.
Configuring AQtrace Viewer
AQtrace Viewer has a special Storage View panel that lists all the reports that reside in the persistent
report storage. The Viewer regularly checks the report storage for new reports and automatically updates the
list displayed in the Storage View panel. In this topic we will describe how to setup and use this
functionality:
Specifying Storage Settings
Obtaining Reports From Storage
Specifying Storage Settings
To view and process received error reports, we need to specify several more settings of AQtrace Viewer.
Namely, we should provide it with the build storage configuration data and the location of persistent error
report storage.
●
Launch AQtrace Viewer, its executable is <AQtrace>\Bin\AQtraceViewer.exe.
●
Select Options | Options from the main menu. An Options dialog will be invoked.
●
Choose General | Symbols setting category. This will display the Symbols Options page on the
right of the dialog.
●
In the Module Storage field enter C:\Builds\BuildConfig.xml. That is the name of the build
© 2011 SmartBear Software
smartbear.com/support
64
Getting Started Tutorial
storage configuration file that we have created while organizing a build storage.
●
Choose Panels | Reports Storage setting category. This will display the Reports Storage page on
the right of the dialog.
●
Specify the C:\Error Reports\Storage folder In the Storage Path box of this page. This is the
name of the persistent storage folder, which we use.
●
Press OK to close the Options dialog and to save the changes.
Obtaining Reports From Storage
●
Open the Storage View panel. By default this panel is hidden. To open it, select View | Select
Panel from the main menu and then choose Storage View in the ensuing Select Panel dialog.
This panel lists the reports that are in the storage:
smartbear.com
AQtrace by SmartBear Software
Getting Started: Lesson 3 - Using Server-Side Components
●
65
If the report storage was empty before you run the sample application, then it will only contain one
error report - the report that was created when you pressed Send in the notification window.
However, usually, the storage contains a lot of error reports, so you have to find the desired report.
To locate the report in the panel, you can sort the panel contents on the Date column. To do this,
click the column’s title. The arrow that is displayed in the title will indicate the sort order (see the
image above).
For complete information on sorting and grouping, see Arranging Columns, Lines and Panels.
●
After finding the desired error report in the Storage View panel, double-click it in the panel.
AQtrace Viewer will parse the report and update its panels with the information that was read from
the report.
Once the Viewer panels are populated with reported data, you can use them to find the reason of the
error. The further analysis does not depend on whether the error report was opened locally or it was retrieved
from the report storage. Some of the analysis techniques are described in the Analyzing Error Reports With
AQtrace Viewer topic.
Running Sample Application and Generating Error Reports
Now we are ready to run our sample application:
● Launch the sample application.
●
Click OS Exception to generate an exception. AQtrace Reporter will detect an exception and
display a notification window on screen.
●
In the notification window:
■
Clear the Don't terminate the application check box.
■
Click Send.
AQtrace Reporter will generate an error report and send it via the HTTP protocol to the
http://localhost/AQtrace/bugreport.asp page. If all settings were specified correctly, the Report Collector
will receive the report and AQtrace Service will process it and move to the persistent storage folder (in our
case it is C:\Error Reports\Storage).
© 2011 SmartBear Software
smartbear.com/support
66
Getting Started Tutorial
You can then launch AQtrace Viewer and then either open the report as a file from this folder, or load
the report with the Storage View panel.
Getting Started - What's Next?
You have just finished the Getting Started Tutorial. The Getting Started tutorial described the general
structure of AQtrace components, explained how to apply AQtrace to your application, receive error reports
from it and analyze these reports. Note, however, that the tutorial does not highlight all of the aspects of
using the product. For instance, it does not demonstrate how to tune the issue-tracking server-side plug-ins,
or how to retrieve different versions of source files from the source control systems.
To get more information about using AQtrace components and modules, see the topics and subsections
of the following section:
Using AQtrace
If you have questions about AQtrace or need help with the product, send a message to SmartBear’s
Support Team. You can also find answers to your questions on our web site or AQtrace forum. The
following topic provides information about additional resources and support services provided by SmartBear
Software:
Technical Support and Resources
smartbear.com
AQtrace by SmartBear Software
AQtrace Utilities
67
Using AQtrace
AQtrace Utilities
The AQtrace package includes several utilities, that when used, allow you to customize settings of the
AQtrace components. All of these utilities are important and you should use them to provide the appropriate
functionality for all of the AQtrace components. You can launch these utilities from the operating system’s
Start menu after AQtrace is installed:
AQtrace Viewer
AQtrace Viewer is used to view and analyze the received error reports.
AQtrace Packager
You use AQtrace Packager to apply AQtrace Reporter to your modules and specify various aspects of
AQtrace Reporter’s functionality. For example, you can -●
Specify the server, port and .asp page to which reports will be sent.
●
Specify data to be included into generated error reports.
●
Specify the exceptions and modules to be traced.
●
Specify the contents of the notification window.
And much more.
●
AQtrace Module Store
AQtrace Module Store is used to create configuration files that contain information about the file names,
versions and paths to binary modules of your products and their debug information files. This data is needed
by AQtrace Viewer and AQtrace Service to parse the call stacks of the received error reports.
Report to Issue
The Report to Issue utility implements the issue-tracking plug-ins that provide support for issue-tracking
systems. It is also used to modify the plug-ins’ settings and specify the issue-tracking project to which a
report should be added.
AQtrace Server Config
You use the AQtrace Server Config utility to modify settings of the following server-side components:
●
Report Collector - The application that receives error reports.
●
AQtrace Service - The service that performs the initial processing and saves the received reports to
the persistent storage.
●
AQtrace Module Store Agent - The service that automatically updates the configuration files
created with the AQtrace Module Store.
© 2011 SmartBear Software
smartbear.com/support
68
Using AQtrace
About Persistent Report Storage
This topic contains information about the structure of the persistent report storage, the files that are used
to store report information and describes how to remove reports from the storage.
Report Storage Structure
AQtrace Service places the received error reports to the persistent report storage. The report storage is
just a folder that contains report files. To search for reports faster, AQtrace organizes report files into specific
subfolders and uses specific files.
The structure of subfolders corresponds to the dates when error reports were received:
As you can see, subfolders of the top level correspond to years; subfolders of the next levels - to months
and dates. Information about each report is saved to a separate subfolder, whose name has the following
format:
cf-DateTimePart_hh_mm_ss_ms
The DateTimePart corresponds to the string that contain the date and time when the error report was
generated on the end-user computer. The hh_mm_ss_ms part specifies the time when the report was added by
AQtrace Service to the storage on the server side.
Note: The time values are specified in the UTC format, regardless of the local time settings of the enduser computer and of the computer where AQtrace Service is running.
smartbear.com
AQtrace by SmartBear Software
Testing AQtrace
69
The persistent storage folder contains the storage.dat file. The file has an .xml format and stores
information about the location of error reports in the storage.
Also, the persistent storage folder contains
the duplicatestorage.dat file that stores information about duplicated error reports.
Error Report Files
Information about each error report is stored into several files. All of these files have the same name of
the format bugDateTimePart, but have file extensions that are different:
File
Description
.dmp
The “main” file of the error report. Contains the error report data (memory dump, information
about threads, CPU registers, modules and so on.)
.dmpx Contains information that the user specified in the User Info dialog when sending an error
report.
.desc
Contains a text description of the error report. This description includes the report’s file name,
exception’s code and address, call stack data in the text form and other information.
.info
Contains helper information about report transferring.
Removing Reports from the Storage
Error reports are added to the persistent storage by AQtrace Service. Currently, AQtrace does not offer
special features for removing the reports from the storage. That is, we recommend that you store all of the
received error reports.
If you want to delete some old reports (for instance, to clean up disk space), you can remove these
reports’ files. For example, you can delete the folder that contains the reports that were received over two
years ago.
However, it is not recommended to remove the reports, because AQtrace Service will not be able to
detect duplicated reports in this case. If you need to start a new storage, specify the name of a new storage
folder in the Persistent storage folder setting of AQtrace Service. You can do this on the AQtrace Service
Settings page of the AQtrace Server Config utility.
Testing AQtrace
Before releasing your application, you may need to check whether all of the AQtrace components
function properly. To do this, you perform the following steps:
1. Install all the AQtrace components on the desired computer(s) and modify their settings in the
appropriate way.
2. Prepare your application for AQtrace:
●
Modify the compiler settings so that the application is compiled with debug information and
has the version information specified.
●
Add special code that will generate error reports. The easiest way to do this is to obtain a
reference
to
the
AQtrace
Reporter
program
object
and
call
its
ShowFatalErrorWithMessage method (see Generating Error Reports on Demand).
© 2011 SmartBear Software
smartbear.com/support
70
Using AQtrace
This method commands the Reporter to generate an error report. You may call this method
within a routine that is used as a menu item event handler or that is called when you press a
certain key combination in the main window of your application.
●
Compile your application.
●
Use AQtrace Packager to specify the Reporter’s settings and apply them to your application.
If you are going to launch your application under a debugger, then enable the Ignore debugger
setting on the Reporter Behavior page of AQtrace Packager. If this setting is disabled, AQtrace
Reporter will not function when the application is running under a debugger. See also Working
Under a Debugger.
3. Install your application on the test computer and launch it there. In the application, perform the
actions that will lead to the generation of an error report (for instance, press certain key
combination that will lead to the call of the ShowFatalErrorWithMessage method). Press
Send in the notification window to send the generated report to the server.
4. Check whether the report is received and processed in the desired manner.
Using AQtrace With Visual Basic Applications
Additional Redistributable Module
AQtrace Reporter is implemented by two dynamic link libraries: aqReporter and dbghelp. These DLLs
are redistributable and you should ship them along with your application.
If you are going to control AQtrace Reporter from your VB code, then in addition to these two libraries,
you should also redistribute the aqtSupportVB.dll module. It contains functions that provide program
access to AQtrace Reporter.
You can find this module in the <Users>\Public\Documents\AQtrace Files\SDK\VB folder on Windows
7, Windows Vista and Windows Server 2008 and in the <Documents and Settings>\All
Users\Documents\AQtrace Files\SDK\VB folder on other operating systems.
In order for the module to be able to function properly, it must be available to your application and it
must have access to the aqReporter library. The easiest way to achieve this is to place your executable,
aqReporter and aqtSupportVB libraries into the same folder. Alternatively, you can place aqReporter.dll and
aqtSupportVB.dll in the Windows\System32 folder or specify the path to them in the PATH environment
variable.
See also AQtrace Reporter Programming and Getting Reference to AQtrace Reporter.
Limitations
●
Due to some specifics of Visual Basic 6 applications, a sequence of function calls displayed in the
Call Stack panel of AQtrace Viewer cannot contain calls to Visual Basic functions. Only calls to
functions located in modules containing non-Visual Basic code (if any) are displayed in the Call
Stack panel of AQtrace Viewer when you open an error report generated for your Visual Basic 6
application.
●
The Code Viewer panel of AQtrace Viewer does not show source code of Visual Basic 6 modules
when you are analyzing an error report generated for your Visual Basic 6 application.
●
Currently, there is a number of programming limitations on controlling AQtrace Reporter from
your Visual Basic 6 code:
■
AQtrace does not support the insertion of custom data into the error reports generated for
smartbear.com
AQtrace by SmartBear Software
Using AQtrace With .NET Applications
71
Visual Basic applications.
●
■
AQtrace does not support performing of specific actions upon closing the notification window
in Visual Basic applications.
■
AQtrace does not support custom exception filters in Visual Basic applications.
■
AQtrace does not support setting names for threads created in Visual Basic applications. In
Delphi, C++Builder, Visual C++ and .NET applications you can do it by using the
SetThreadName method.
■
AQtrace does not allow loading an error report programmatically from a dump file and
displaying its contents in Visual Basic applications. In Delphi, C++Builder, Visual C++ and
.NET applications you can do it by using the ShowReportContents method.
■
AQtrace does not support saving programmatically additional information about a Visual
Basic application and the end-user computer, on which this application is running, in a
separate dump file. In Delphi, C++Builder, Visual C++ and .NET applications you can do it by
using the SaveAddInfoAsDump method.
■
AQtrace does not allow adding user messages to the event log included in an error report in
Visual Basic applications. In Delphi, C++Builder, VisualC++ and .NET applications you can
do this by using the AddMessageToLog method.
■
Also, to disable and enable the AQtrace Reporter functionality for a thread, use the
LockForThread and UnlockForThread methods, rather than Lock and Unlock. See
Enabling and Disabling AQtrace Reporter.
AQtrace Reporter does not catch language exceptions in Visual Basic 6 applications. Only OS
exceptions are supported.
Tracing Multithreaded Applications
Visual Basic does not include built-in means to create multithreaded applications. But you can create a
new thread by calling the Windows API CreateThread function from your code.
However, the error handling statements (like On Error Go To) will not work in this thread and if an
exception occurs, the application terminates. AQtrace Reporter will catch these exceptions, generate error
reports for them and display the notification window. However, after this the application will be terminated.
This will happen even though the end-user selects the Don't terminate the application check box in the
notification window.
The fact is that when AQtrace Reporter closes the window and this check box is selected, the Reporter
“forwards” the exception to the exception handling function (or code) that is used by your application. When
there is a new thread in a Visual Basic application, AQtrace Reporter will not be able to forward the
exception and the application will close. The application will close even if the end-user selects the “Don't
terminate…” check box in the notification window.
Using AQtrace With .NET Applications
Using AQtrace With .NET Applications - Overview
You can use AQtrace to trace exceptions in your .NET applications and to find the cause of their
occurrence. This topic provides an overview of using AQtrace utilities with .NET applications and contains
links to more detailed descriptions.
© 2011 SmartBear Software
smartbear.com/support
72
Using AQtrace
Supported Applications
You can use AQtrace with .NET applications compiled for .NET Framework version 1.0, 1.1, 2.0, 3.0 or
3.5.
AQtrace can work with any .NET application, regardless of the compiler that was used to build this
application. It supports all the existing .NET compilers:
●
Microsoft Visual C# 7.x, 2005 and 2008
●
●
Microsoft Visual Basic .NET 7.x, 2005 and 2008
Microsoft Visual C++ 7.x, 2005 and 2008 (managed code)
●
Microsoft Visual J# 7.x, 2005
●
CodeGear Delphi 2007 and 2009 for .NET
●
Borland Delphi 2005 and 2006 for .NET
Borland C#Builder
●
Basic Concepts
The way in which AQtrace components work with .NET and native (unmanaged) modules are very
similar:
1. AQtrace Reporter monitors the application execution and generates and sends error reports when
an exception occurs.
2. The server-side components receive the reports and save them to a persistent report storage.
3. AQtrace Viewer helps you analyze the reports and find the cause of the problem.
These operations are common for both .NET and unmanaged modules. However, the way AQtrace
Reporter is applied to managed modules and the way you compile these modules for AQtrace differ from the
way you prepare unmanaged modules for AQtrace.
Applying AQtrace Reporter to Managed Modules
The difference in support for native and .NET applications is the way in which AQtrace Reporter is
applied to unmanaged modules and to .NET assemblies. To apply the Reporter to a native module, you
simply process this module with AQtrace Packager. The Packager adds special code to the module that loads
the aqReporter dynamic link library and enables the Reporter functionality when the unmanaged module is
loaded to memory. This code also contains initializing data that configures the Reporter and the notification
window.
As for .NET modules, you should write special code that will initialize AQtrace Reporter. To do this,
you create a special assembly, aqReporterInterop.dll, that serves as a bridge between your assembly and
the aqReporter dynamic link library. This assembly provides program interfaces and a special class that help
you to initialize the Reporter’s functionality for managed applications and to control its behavior at run time.
aqReporterInterop.dll also contains AQtrace Reporter's configuration that specifies what exceptions should
be traced, the information to be included in error reports, the address to which the reports will be sent, and so
on.
So, to create AQtrace Reporter and use it with .NET applications, you should perform the following
operations:
1. Create the aqReporterInterop assembly.
You create the aqReporterInterop assembly with the AQtrace Packager utility. For detailed
information on this, see Creating the aqReporterInterop Assembly.
2. Include the aqReporterInterop assembly in your .NET project and write code that will initialize the
smartbear.com
AQtrace by SmartBear Software
Using AQtrace With .NET Applications
73
Reporter functionality by using aqReporterInterop.
For more information about this, see Initializing AQtrace Reporter in .NET Applications.
Compiling .NET Applications for AQtrace
In order for AQtrace components to be able to work with your .NET applications and process error
reports correctly, you need to compile these applications in a special way:
●
Compile your application with the aqReporterInterop assembly.
In order for AQtrace Reporter to be able to monitor execution of your application, you must create
an aqReporterInterop assembly, include it in your .NET project and then compile your project (see
above).
●
Compile your application with debug information to be able to use source servers.
To parse error reports, AQtrace Viewer and server-side components do not need specific debug
information. They use metadata that are included in .NET assemblies by default. However, if you
want to use source servers, you should compile your .NET modules with debug information. See
Compiling Applications With Debug Information for detailed information on compiler settings.
●
Specify version information for assemblies to be compiled.
You need to modify the compiler settings so that they specify version information for each build of
your application. See Setting Build Number for details.
Which Exceptions AQtrace Can Catch
AQtrace Reporter can catch and handle any exception that occurs in managed code. Normally, it does
not generate error reports for all the exceptions. It displays the notification window and generates reports
only for those exceptions that you specified in your AQtrace Packager .NET project or that meet the
conditions defined in custom exception filters in your code.
Unlike AQtrace Packager native projects, .NET projects allow you to specify only .NET exception class
names as the exceptions to be handled by the Reporter. You cannot specify OS exceptions for .NET
modules. However, when an OS exception, which is generated at the system level, occurs, it is mapped to the
corresponding .NET exception class and the Reporter handles it as a .NET exception. For instance, when an
EXCEPTION_INT_DIVIDE_BY_ZERO exception occurs as a result of integer division by zero in your
managed code, AQtrace Reporter interprets and handles it as a DivideByZeroException .NET
exception. For more information on this, see Specifying Exceptions to Be Traced.
Note that if AQtrace Reporter is initialized in managed code and the settings specified in an AQtrace
Packager .NET project are applied to the Reporter, only those exceptions that are raised in a .NET (managed)
module of the application can be handled by the Reporter. If you use mixed code in your .NET application
(that is, if you use both managed and unmanaged code) and the Reporter is initialized in managed code, then
exceptions that occur in native (unmanaged) code cannot be traced. Similarly, if you apply AQtrace Reporter
to a native module and this module calls functions from a .NET assembly with managed code, then the
Reporter can trace exceptions only in unmanaged code of the native module, and all the exceptions raised in
managed code are ignored. See the Specifying Exceptions to Be Traced help topic for more information.
Deploying .NET Applications
In order for your .NET application to be monitored successfully by AQtrace Reporter on end-user
computers, you must include aqReporter.dll and aqReporterInterop.dll in the installation package and ship
them to users along with the application. These modules must be accessible to your .NET executable that
will be monitored by the Reporter. So, aqReporter.dll and aqReporterInterop.dll should be placed in the
folder in which the executable is located. For more information on deploying .NET applications that use
© 2011 SmartBear Software
smartbear.com/support
74
Using AQtrace
AQtrace Reporter, see Deploying .NET Applications.
Creating aqReporterInterop Assembly
The aqReporterInterop assembly contains code that enables the AQtrace Reporter functionality in
managed applications and allows you to control the Reporter at run time. The assembly serves as a bridge
between your managed modules and the unmanaged aqReporter dynamic link library that implements the
Reporter functionality. The assembly also contains the Reporter settings specified with AQtrace Packager.
These settings specify which exceptions should be traced, to what server error reports will be sent and what
transfer protocol will be used for that, what information should be displayed in the notification window, and
so on.
You create the aqReporterInterop assembly with AQtrace Packager:
1. Launch AQtrace Packager.
2. Select File | New | .NET Project from the menu or use the Create .NET Project command from
AQtrace Packager’s Start Page. This will create a new AQtrace Packager project for .NET
applications.
3. Switch to the Reporter Assembly | Reporter Assembly Information page.
4. In the Output folder box, specify the folder in which the aqReporterInterop assembly will be
created.
Note: You can specify only the output folder.
aqReporterInterop.dll, it cannot be changed.
The
file
name
is
always
5. To generate an assembly, AQtrace Packager uses the ilasm.exe utility that is part of Microsoft
.NET Framework. AQtrace Packager finds this utility automatically on your hard drives. If you
have several versions of .NET Framework installed, then, by default, AQtrace Packager will use
the ilasm.exe utility of the earliest version found. You may want to use ilasm of a specific .NET
Framework version. In this case, specify the path to the ilasm.exe utility and the utility's
command-line arguments in the ilasm location and ilasm parameters edit boxes.
6. Use the other pages of AQtrace Packager to specify the desired settings of AQtrace Reporter. For
instance, on the Reporter Settings | Sending page, you can specify the protocol(s) that will be used
to send error reports to the developer team and the destination addresses. On the Exception Filter |
.NET Exceptions page, you can specify class names of specific .NET exceptions that you want to
trace or exclude from tracing. On the Reporter Settings | Additional Reported Data page, you can
specify what additional information will be included into error reports (for example, information
about the operating system, hardware, running processes, software installed on the computer, and
so on). Use the Notification Window | Notification Settings page to specify data and controls to be
displayed in the notification window when an error occurs.
7. After you set all the desired values, press Generate Assembly on the toolbar. AQtrace Packager
will generate the aqReporterInterop assembly. It will be stored to the folder that you specified on
the Reporter Assembly Information page.
Initializing AQtrace Reporter in .NET Applications
To use AQtrace Reporter with your .NET application, you should add the aqReporterInterop assembly to
your project and then write code that will initialize AQtrace Reporter.
smartbear.com
AQtrace by SmartBear Software
Using AQtrace With .NET Applications
75
1. Add aqReporterInterop to Your .NET Project
The way you do this depends on the program language you use. Below are instructions for C# and Visual
Basic .NET projects:
●
Launch Microsoft Visual Studio and open your .NET project in it.
●
Select Project | Add Reference from Visual Studio’s main menu.
-- or -Right-click the project’s node in the Solution Explorer panel and select Add Reference from the
ensuing context menu.
This will invoke the Add Reference dialog:
●
In the dialog:
■
Switch to the Browse page.
© 2011 SmartBear Software
smartbear.com/support
76
Using AQtrace
■
On the page, choose the aqReporterInterop.dll assembly that you generated with AQtrace
Packager for your application (see Creating the aqReporterInterop Assembly).
■
Click OK.
The aqReporterInterop assembly will be added to your project and will be shown under the
References node in the Solution Explorer:
smartbear.com
AQtrace by SmartBear Software
Using AQtrace With .NET Applications
VB.NET
projects:
77
By default, the References node is hidden in the Solution Explorer panel for
Visual Basic .NET projects. To display it, select Project | Show All Files
from Visual Studio’s main menu.
2. Add AQtrace Reporter Initialization Code
In order for AQtrace Reporter to be able to monitor execution of your application and handle exceptions,
you must call the aqReporterInterop.Initializer.InitReporter() method in your code.
This method enables AQtrace Reporter and initializes it using the settings stored in the aqReporterInterop
assembly and specified with AQtrace Packager.
Generally speaking, you can add an initialization call to the InitReporter method to any place of
your code. However, AQtrace Reporter will trace exceptions only after it is initialized. To trace exceptions
during the whole application run, it is recommended to initialize AQtrace Reporter at the beginning of the
application run, for instance, within the Main routine. The way in which you call the method depends on the
project type. Below are instructions for C# and VB.NET projects.
Note: The aqReporterInterop.dll assembly must be accessible to your executable. It must be in the
folder in which the executable is located, or it must be in the Global Assembly Cache (GAC).
The aqReporterInterop assembly serves as a bridge between your application and the
aqReporter.dll library that contains the AQtrace Reporter implementation. The aqReporter
dynamic link library must be accessible to the assembly. The easiest way to achieve this is to
place them in the same folder.
C# Projects
●
Open the source file that contains the Main routine. Typically, in C# projects, it is Program.cs.
●
Insert a call to the the aqReporterInterop.Initializer.InitReporter() method
into the Main function. To handle exceptions during the whole application run, add this call as the
first statement of the Main function:
[C#]
static void Main()
{
aqReporterInterop.Initializer.InitReporter();
// <- Add this line
Application.EnableVisualStyles();
Application.SetCompatibleTextRenderingDefault(false);
Application.Run(new Form1());
}
Visual Basic .NET Projects
If your VB.NET application is a Windows Forms application, it may have no Main routine. In this case,
you can either create the Main procedure or initialize AQtrace Reporter within the OnLoad event handler of
the application’s main form.
Using the OnLoad Event Handler
© 2011 SmartBear Software
smartbear.com/support
78
Using AQtrace
●
Open the main form for editing and click somewhere within the form.
●
Switch to the Properties panel.
●
Activate the Events tab of the Properties panel.
●
Find the Load event and create an event handler for it.
●
Add the AQtrace Reporter initialization code to the OnLoad event handler:
[Visual Basic .NET]
Private Sub Form1_Load(ByVal sender As System.Object, ByVal e As
System.EventArgs) Handles MyBase.Load
aqReporterInterop.Initializer.InitReporter()
End Sub
Creating the Main Routine
● Add the following code to one of the classes of your application:
[Visual Basic .NET]
<STAThread()> _
Shared Sub Main()
Dim frm1 As Form1
aqReporterInterop.Initializer.InitReporter()
' We assume that the main form of your application is called
Form1
frm1 = New Form1()
Application.Run(frm1)
End Sub
Save the changes made to the code.
●
Select Project | <Project_Name> Properties from Visual Studio’s main menu. This will open the
project settings for editing.
●
Switch to the Application tab.
●
Clear the Enable application framework check box.
●
Choose Sub Main from the Startup object drop-down list.
●
Save the settings.
Deploying .NET Applications
In order for your .NET application that uses AQtrace Reporter to be able to start and run successfully on
end-user computers, you must include the following two modules into your installation package:
●
aqReporter.dll
aqReporter.dll is an unmanaged (native) dynamic link library that contains the AQtrace Reporter
implementation. It contains code that monitors execution of your application, generates error
reports, displays notification windows and sends the reports to developers.
If AQtrace is installed on Windows 7, Windows Vista or Windows Server 2008, you can find
smartbear.com
AQtrace by SmartBear Software
Using AQtrace With .NET Applications
79
aqReporter.dll in the <Users>\Public\Documents\AQtrace Files\SDK\Modules\x86 or
<Users>\Public\Documents\AQtrace Files\SDK\Modules\x64 folder. On other Windows operating
systems, the library resides in the <Documents and Settings>\All Users\Documents\AQtrace
Files\SDK\Modules\x86 or <Documents and Settings>\All Users\Documents\AQtrace
Files\SDK\Modules\x64 folder. The \x86 and \x64 folders contain the appropriate versions of the
library for x86 and x64 Windows operating systems, respectively.
●
aqReporterInterop.dll
aqReporterInterop.dll is an assembly that serves as a bridge between your managed code and the
unmanaged aqReporter library. The assembly contains a declaration of a special class and program
interfaces that allow you to connect to AQtrace Reporter, implemented in the unmanaged
aqReporter library, from within managed code. The assembly also contains the Reporter’s settings
and the information to be displayed in the notification window.
You create the aqReporterInterop assembly with the AQtrace Packager utility. For detailed
information about this, see Creating the aqReporterInterop Assembly.
Methods defined in the aqReporterInterop assembly are called from your managed application. So, this
assembly must be accessible to your executable (or DLL) after your application is installed on the computer.
To achieve this, the installation program should install the assembly into the folder, in which the executable
is installed, or to the Global Assembly Cache (GAC).
The aqReporterInterop assembly loads the aqReporter library and calls the functions that are defined in
it, so the library must be accessible to the assembly. To search for the library and load it, the assembly uses
typical searching approaches: it searches for the library in the folder in which the assembly is located, in
system folders and in the folders that are specified by the PATH environment variable.
To avoid any confusion, make sure the installation program of your application installs all three modules
-- your executable, aqReporterInterop.dll and aqReporter.dll -- into the same folder.
Using AQtrace Reporter in .NET Applications
AQtrace Reporter is implemented in the aqReporter dynamic link library that contains unmanaged code.
In order for .NET applications to be able to use the Reporter functionality, the aqReporterInterop assembly is
generated by AQtrace Packager and then it is used as a bridge between .NET assemblies and the aqReporter
native module. To learn how you can generate the aqReporterInterop assembly, see Creating the
aqReporterInterop Assembly.
aqReporterInterop.dll contains code that enables the AQtrace Reporter functionality for managed
applications and controls the Reporter at run time. Also, this assembly includes the Reporter settings
specified with AQtrace Packager (for information on specifying the Reporter settings, see Using AQtrace
Packager With .NET Applications). In order for the Reporter to monitor your .NET application, these settings
must be applied to the Reporter. To load and initialize AQtrace Reporter in your .NET application, you
should use the aqReporterInterop.Initializer class and its InitReporter method
implemented in the aqReporterInterop assembly. For more information on this, see Initializing AQtrace
Reporter in .NET Applications.
After the Reporter was loaded and initialized in your managed application, you can use its functionality
at run time through the program interfaces provided by the aqReporterInterop namespace. This
namespace is declared in the aqReporterInterop assembly. To control the Reporter from your .NET code, you
should obtain a program reference to the Reporter object implemented in the aqReporter library. To learn
how you can obtain this reference in your managed code, see Getting Reference to AQtrace Reporter in .NET
Applications.
© 2011 SmartBear Software
smartbear.com/support
80
Using AQtrace
After the Reporter has been prepared for monitoring your .NET application, you can control it from your
managed code like you do this in unmanaged (native) applications. The difference is that in native
applications you use a program interfaces defined in the aqReporter library, while in managed code you must
use the same interfaces from the aqReporterInterop namespace declared in the aqReporterInterop
assembly. These interfaces allow you to control the Reporter and perform various actions with it in your
.NET assemblies.
You can disable or enable the Reporter from your managed code at run time by using the Lock,
Unlock, GlobalLock and GlobalUnlock methods from the IaqReporterIntf interface. To learn
how you can do this, see Enabling and Disabling AQtrace Reporter.
You can create and use objects that implement the IaqReporterCallback and
IaqReporterCallback2 interfaces to generate custom textual and binary data and include it into error
reports while your .NET application is running. For more information on custom data in error reports, see
Inserting Custom Data Into Reports.
Using the IaqCustomExceptionFilter interface, you can create custom exception filters - the
objects that allow you to implement your own algorithm of exception filtering and to define for what
exceptions the Reporter should generate reports, and what exceptions should be ignored. For more
information, see Creating Custom Exception Filters.
In some cases, you may want to generate an error report programmatically, without waiting until an
exception is raised. Use the ShowFatalErrorWithMessage method for this purpose. For more
information on this, see Generating Error Reports on Demand.
Using
the
IaqReporterCallback.OnCloseReporter
or
IaqReporterCallback2.OnCloseReporter2 method, you can perform specific actions upon
closing the notification window. See Performing Specific Actions Upon Closing the Notification Window for
a detailed description.
You can call the IaqReporterIntf2.SaveAddInfoAsDump method to save additional
information about the end-user's computer and its system as a separate dump file.
Using the IaqReporterIntf2.ShowReportContents method, you can load information from
an error report file and preview it in the Report Information dialog.
When creating a thread in your .NET application, you can specify a name for it by using the
IaqReporterIntf2.SetThreadName method. Such names can help developers distinguish threads
when analyzing error reports.
Using AQtrace With Non-Interactive Processes
This topic provides information on using AQtrace with applications running in non-interactive mode. A
typical example of such applications is services that are mostly launched under non-interactive accounts,
such as SYSTEM, LOCAL SERVICE, NETWORK SERVICE and so on. According to their name, noninteractive processes cannot interact with the user.
The initial steps of embedding AQtrace Reporter into a non-interactive application are the same as those
you perform when working with any other application. You launch AQtrace Packager, specify Reporter
settings and apply them to the executable or DLL. See Using AQtrace Reporter - Basic Concepts for details.
Once the Reporter is attached to a non-interactive process, it can react to exceptions, generate error
reports and save them to disk. However, the Reporter neither displays the error notification window (since
this implies a user response), nor sends a report to the developer (since sending a report requires the user's
consent, which was not given).
smartbear.com
AQtrace by SmartBear Software
Using AQtrace With Non-Interactive Processes
81
Therefore, in order to obtain error reports from an end-user, you can do the following:
●
Tell the user where error reports can be found, and ask him (her) to send them via e-mail.
●
Provide the user with a redistributable helper tool named AQtrace Report Monitor. It works under
a user account and can retrieve error reports and send them to you.
If you choose the second option, you can do this in the following way: You should ship Report Monitor’s
executable along with the ReportMonitorSettings.xml file (this file is part of AQtrace SDK and resides in the
<Users>\Public\Documents\AQtrace Files\SDK\Modules\Common folder on Windows 7, Windows Vista
and Windows Server 2008 and in the <Documents and Settings>\All Users\Documents\AQtrace
Files\SDK\Modules\Common folder on other operating systems.) In the ReportMonitorSettings.xml file, you
should specify the folder where error reports will be placed by AQtrace Reporter and a number of parameters
that define how the reports will be sent to you. See Configuring AQtrace Report Monitor.
The end-user should start AQtrace Report Monitor manually. Upon starting, the utility will run in the
background and monitor the contents of the folder that you specified in the ReportMonitorSettings.xml file.
When an exception occurs in your application and AQtrace Reporter silently generates an error report, a new
dump file will appear. This new file will be tracked by AQtrace Report Monitor. It will display a popup
notification in the Windows system tray. By clicking on the Monitor’s icon in the tray, the end-user will call
the main window of AQtrace Report Monitor.
In this window, the user can select one of more error reports from the list and send them to you. At that,
© 2011 SmartBear Software
smartbear.com/support
82
Using AQtrace
the user will not be bothered by technical details of the sending procedure, as the Monitor will read this data
from the ReportMonitorSettings.xml file you provided. After sending the report(s), the user may exit the
Monitor or leave it running in the background.
Transferring Data
Transfer Protocols' Settings
AQtrace Reporter allows you to use several supported transfer protocols for sending error reports. To use
each of these protocols, you should specify some special settings.
To receive the reports via different transfer protocols, the server computer should comply with the
requirements listed in the Transfer Protocols' Requirements topic.
HTTPS Settings
AQtrace Reporter supports several transfer protocols that can be used for sending error reports. By
default, AQtrace Packager offers the HTTP protocol (Hypertext Transfer Protocol) for transmitting error
reports. And there is also another alternative for this default transfer protocol - HTTPS (Secure Hypertext
Transfer Protocol). This is a combination of the HTTP protocol with an encrypted SSL (Secured Sockets
Layer) or TLS (Transport Layer Security) connection.
When you choose the HTTPS protocol for transmitting error reports, your application on the end-user
computer, similarly to the case of using the HTTP protocol, generates a report and sends it to the web server
where this error report will be received and processed by the special .asp page. The settings needed for the
use of the HTTPS protocol are very similar to the ones used for the HTTP protocol.
To make your application send error reports via the HTTPS protocol, make sure that the HTTPS send
mode is selected in the appropriate drop-down list on the Sending page of AQtrace Packager. After selecting
the HTTPS protocol for sending error reports you should specify the other necessary settings on the Sending
page. The page contains the following edit boxes if you select the HTTPS protocol:
●
Server name or IP address - Specifies the domain name or IP address of the web server, on
which the Report Collector is running and to which error reports will be sent.
Do not specify the protocol part of the server’s URL, that is, do not enter the https://
prefix:
www.mycompany.com
https://www.mycompany.com
<-- Correct
<-- Incorrect
By default, the AQtrace installation program runs the Report Collector on the local IIS server and
specifies the localhost value for the Server name or IP address setting.
●
Report collector (.asp page) - Specifies the name and path of the .asp page that will receive error
reports. The page’s path includes the virtual directory (or directories) that contains the page and
should be relative to the server’s root directory.
smartbear.com
AQtrace by SmartBear Software
Transferring Data
83
By default, the AQtrace installation program creates virtual directory with the .asp page on the
local IIS server and specifies the following location for the Report Collector (.asp page) setting:
/AQtrace/bugreport.asp
AQtrace is the virtual folder that is used by default, and bugreport.asp is the page’s default name.
●
Port Number - Specifies the TCP port that will be used for transmitting. Default value is 443. The
end-user computer must allow your application to send data via the HTTPS protocol and the
specified port.
●
User - Specifies the user account that is used to access the Report Collector’s server and virtual
directory. This parameter is not required and it can be omitted if the specified virtual directory on
the server allows anonymous access.
●
Password - Specifies the password for the user account that is used to access the Report
Collector’s server and virtual directory. This parameter is not required and it can be omitted if the
specified virtual directory on the server allows anonymous access.
If you specify the settings described above and apply them to your application by using AQtrace
Packager, the application will automatically send generated error reports to the specified web server.
HTTP Settings
AQtrace Reporter supports several transfer protocols that can be used for sending error reports. You
should select the protocol that will be used by your application for sending reports on the Sending page of
AQtrace Packager. By default, the Packager offers the HTTP protocol (Hypertext Transfer Protocol).
If you choose the HTTP protocol for transmitting error reports, your application on the end-user
computer generates a report and sends it via the HTTP protocol to the web server where this error report will
be received and processed by the special .asp page.
To make your application send error reports via the HTTP protocol, make sure that the HTTP send
mode is selected in the appropriate drop-down list on the Sending page of AQtrace Packager. After selecting
the HTTP protocol for sending error reports you should specify the other necessary settings on the Sending
page. The page contains the following edit boxes if you select the HTTP protocol:
●
Server name or IP address - Specifies the domain name or IP address of the web server, on
which the Report Collector is running and to which error reports will be sent.
Do not specify the protocol part of the server’s URL, that is, do not enter the http://
prefix:
www.mycompany.com
<-- Correct
http://www.mycompany.com
<-- Incorrect
By default, the AQtrace installation program runs the Report Collector on the local IIS server and
specifies the localhost value for the Server name or IP address setting.
●
Report collector (.asp page) - Specifies the name and path of the .asp page that will receive error
reports. The page’s path includes the virtual directory (or directories) that contains the page and
should be relative to the server’s root directory.
By default, the AQtrace installation program creates virtual directory with the .asp page on the
local IIS server and specifies the following location for the Report Collector (.asp page) setting:
© 2011 SmartBear Software
smartbear.com/support
84
Using AQtrace
/AQtrace/bugreport.asp
AQtrace is the virtual folder that is used by default, and bugreport.asp is the page’s default name.
●
Port Number - Specifies the TCP port that will be used for transmitting. Default value is 80. The
end-user computer must allow your application to send data via the HTTP protocol and the
specified port.
●
User - Specifies the user account that is used to access the Report Collector’s server and virtual
directory. This parameter is not required and it can be omitted if the specified virtual directory on
the server allows anonymous access.
●
Password - Specifies the password for the user account that is used to access the Report
Collector’s server and virtual directory. This parameter is not required and it can be omitted if the
specified virtual directory on the server allows anonymous access.
If you specify the settings described above and apply them to your application by using AQtrace
Packager, the application will automatically send generated error reports to the specified web server.
E-mail Settings
AQtrace Reporter can send error reports via an e-mail client that is used as the default client in the
system. This is not a specific transfer protocol like others provided by AQtrace. It is just a way to send error
reports that uses the default e-mail client. In this case, the application generates an error report and launches
the default e-mail client (for instance, Outlook Express) that will send an e-mail message with the attached
error report. Using this method users send error reports manually and can control the sending process: they
can change some parameters of the e-mail message and e-mail client settings before the error report will be
sent or they can cancel sending process at all.
To make your application be capable of sending error reports via the default e-mail client, you should
specify the EMail send mode on the Sending page of AQtrace Packager. After selecting the Email send
mode you should specify some additional settings on this page of AQtrace Packager. When you select EMail
from the Send mode drop-down list, the following edit boxes appear on the Sending page:
●
Address - Specifies the destination e-mail address to which the message with the attached error
report will be sent.
●
Subject - Specifies the Subject field of the e-mail message that will be sent. It can be an arbitrary
string, but it should be informative (for instance, “The MyAplication’s error report”).
●
Message - Specifies the body of the e-mail message. This is the main text of the message. You can
type an arbitrary text for this parameter that could be informative and useful for the further error
report analysis or you can leave this field empty.
If you specify these and the other necessary settings in AQtrace Packager and apply them to your
application, it runs the default e-mail client on the end-user computer when a traced exception occurs during
the application’s execution. The Address, Subject and Message fields of a new e-mail message generated by
AQtrace Reporter are already filled with the appropriate values that have been specified on the Sending page
of AQtrace Reporter.
TFTP Settings
AQtrace Reporter can send error reports via several transfer protocols. One of them is TFTP (Trivial File
Transfer Protocol). Using this protocol, the Reporter can send generated error reports to a remote directory
on a TFTP server.
smartbear.com
AQtrace by SmartBear Software
Transferring Data
85
To make your application be capable of sending error reports via the TFTP protocol, you should specify
the TFTP send mode on the Sending page of AQtrace Packager. After selecting the TFTP protocol as the
send mode you should specify the other necessary parameters on the Sending page of AQtrace Packager.
This protocol is a very basic form of the FTP protocol. So, the settings needed for the use of TFTP are
similar to the ones used for the FTP protocol. The Sending page contains the following settings for the TFTP
send mode:
●
Server name or IP address - Specifies the domain name or IP address of the server, to which
error reports will be sent.
Do not specify the protocol part of the server’s URL, that is, do not enter the tftp://
prefix:
www.mycompany.com
<-- Correct
tftp://www.mycompany.com
<-- Incorrect
By default, the localhost value is specified for the Server name or IP address setting.
●
Port Number - Specifies the port that will be used for transmitting error reports to the TFTP
server. By default, it is UDP port number 69. The end-user computer must allow your application
to send data via the TFTP protocol and the specified port. Note that the TFTP protocol uses UDP
unlike the FTP protocol that utilizes TCP.
●
Remote Directory - Specifies the directory on the TFTP server, to which error reports will be
placed. The path to this remote directory should be relative to the server’s root directory.
When you specify the settings described above and apply them to your application by using AQtrace
Packager, the application will send generated error reports to the specified directory on the TFTP server.
The reports received via TFTP cannot be automatically processed by AQtrace Service. Read Using
Multiple Protocols for details.
SMTP Settings
AQtrace Reporter can send error reports via several transfer protocols. One of them is SMTP (Simple
Mail Transfer Protocol). Using this protocol, the Reporter can send generated error reports with e-mail
messages. In contrast to EMail send mode, usage of the SMTP protocol allows your application to send
message directly to mail server without use of a mail client.
To make your application be capable of sending error reports via the SMTP protocol, you should specify
the SMTP send mode on the Sending page of AQtrace Packager. After selecting the SMTP protocol as the
send mode you should specify the necessary settings on the Sending page of AQtrace Packager:
●
Address - Specifies the destination e-mail address to which the message with the attached error
report will be sent.
●
Subject - Specifies the Subject field of the e-mail message that will be sent. It can be an arbitrary
string, but it should be informative.
●
Message - Specifies the body of the e-mail message. This is the main text of the message. You can
type an arbitrary text for this parameter that could be informative and useful for the further error
report analysis or you can leave this field empty.
© 2011 SmartBear Software
smartbear.com/support
86
Using AQtrace
●
From - Specifies the From field of the e-mail message. This setting is used to identify the sender
of the message.
●
Host - Specifies the domain name or IP address of the outgoing SMTP server from which the email message should be sent. For example, it might look like this:
smtp.mycompany.com
●
Port Number - Specifies the TCP port number that will be used for the SMTP protocol
transmitting. By default, port number 25 is designated for SMTP and this value is specified in the
Port Number box on the Sending page. The end-user computer must allow your application to send
data via the SMTP protocol and the specified port.
●
User - Specifies the name of the user registered on the specified SMTP server and from whose
account (mail box) the Reporter will send messages with error reports. This name is the prefix of
the e-mail address used for sending messages, it is the first part before @ symbol in the full e-mail
address. For instance:
[email protected]
<-- e-mail address
jsmith
<-- user name
Note that the User setting can be omitted if the specified SMTP server does not require
authentication and you want to use anonymous access to the server.
●
Password - Specifies the password of the e-mail account that was specified for the User setting.
This setting can also be omitted if the server does not require authentication.
If you specify the described above settings on the Sending page of AQtrace Packager and apply them to
your application, it will automatically send generated error reports to the specified e-mail address via the
specified SMTP server’s account without use of e-mail clients on the end-user computer.
FTP Settings
AQtrace Reporter can send error reports via several transfer protocols. One of them is FTP (File Transfer
Protocol). Using this protocol, the Reporter can send generated error reports to a remote directory on some
FTP server.
To make your application be capable of sending error reports via the FTP protocol, you should specify
the FTP send mode on the Sending page of AQtrace Packager. After selecting the FTP protocol as the send
mode you should specify the other necessary parameters on the Sending page of AQtrace Packager. This
page contains the following settings for the FTP send mode:
●
Server name or IP address - Specifies the domain name or IP address of the FTP server, to which
error reports will be sent.
Do not specify the protocol part of the server’s URL, that is, do not enter the ftp://
prefix:
www.mycompany.com
<-- Correct
ftp://www.mycompany.com
<-- Incorrect
By default, the localhost value is specified for the Server name or IP address setting.
●
Port Number - Specifies the port that will be used for transmitting error reports to the FTP server.
By default, it is TCP port number 21. The end-user computer must allow your application to send
smartbear.com
AQtrace by SmartBear Software
Transferring Data
87
data via the FTP protocol and the specified port.
●
Remote Directory - Specifies the directory on the FTP server, to which error reports will be
placed. The path to this remote directory should be relative to the server’s root directory. If no
directory is specified, error reports are placed in the root directory of the FTP server.
●
User - Specifies the user account that is used to access the server. This parameter is not required
and it can be omitted if the server allows anonymous access.
●
Password - Specifies the password for the user account that is used to access the server. This
parameter is not required and it can be omitted if the server allows anonymous access.
If you specify the settings described above and apply them to your application by using AQtrace
Packager, the application will send generated error reports to the specified directory on the FTP server.
Transferring Data - Basic Concepts
AQtrace Reporter generates error reports when any traced exception occurs and then sends them to the
server where all the reports are collected. The Reporter supports several transfer protocols that can be used
for sending reports to the server:
●
HTTP
●
HTTPS
●
FTP
●
TFTP
SMTP
●
Different protocols use different kinds of servers for report collecting and provide different modes of
report transmitting with various special features. Your application can send error reports within e-mail
messages, via HTTP (HTTPS) to the web server on which the reports will be processed by the Report
Collector, via FTP (TFTP) to the file server where all the reports will be collected. Moreover, AQtrace
Reporter can try over several sending modes in a turn. That is, if the Reporter fails to send the report using
the first of the chosen sending modes, then it tries another sending mode and so forth.
AQtrace Reporter contains all the necessary functionality to send the generated reports to the server.
There is no need to create any special code for this. All you have to do is to specify which of the sending
modes to apply and the parameters for the selected modes. You do this on the Sending page of AQtrace
Packager.
The most important transferring mode in AQtrace is the error reports sending via the HTTP/HTTPS
protocols. This is a default send mode used by AQtrace Packager. In this case, the error reports sending,
receiving and processing on the server side is fully-automated. The Reporter generates error reports and
sends them to the server. On the server side, the reports are received by the Report Collector. The Report
Collector is a simple application made of an .asp page that saves the reports to the initial storage folder or
relays them to another server (see the Report Collector description).
By default, the port number used for the HTTP protocol is 80. The .asp page (Report Collector) is
specified by its virtual folder and the name. By default, the page’s name is /AQtrace/bugreport.asp. You can
change it as your needs dictate (see HTTP Settings).
In order for the reports to be reported successfully via HTTP/HTTPS, the following two conditions
should met:
●
The end-user computer must allow your application to send data via this protocol and
port specified on the Sending page of AQtrace Packager. This condition is also relevant
© 2011 SmartBear Software
smartbear.com/support
88
Using AQtrace
to other transfer protocols.
●
As AQtrace Reporter sends data directly to the web server via HTTP/HTTPS, the server
computer must be on and the Internet Information Services (IIS) must be running on it at
the moment of the sending (in order for the .asp page can receive the report).
Note that the .asp page (Report Collector) can either save the reports to the storage on the server or relay
them to another server. For more information on this, see Report Relaying.
There is a known problem of sending reports via HTTP: the reports cannot be sent to the
http://localhost/AQtrace/bugreport.asp page if VMWare is installed on your computer. In other words, they
cannot be sent to the page that resides on the computer that has VMWare installed.
If you want to use another transfer mode instead of the default HTTP protocol, the Selecting Transfer
Protocol topic will help you to choose the appropriate protocol.
Transfer Protocols' Requirements
AQtrace can use several transfer protocols to deliver an error report from the end-user to the developer.
This topic lists the requirements of each transfer protocol and describes how to configure the error reports’
server in order to receive the reports via different transfer protocols.
HTTP Protocol
The Hypertext Transfer Protocol is a primary mean of sending and receiving reports. It provides a full
automation (such as report relaying, or searching for duplicated reports) of the sending and receiving
processes. To receive the reports via HTTP the following conditions should comply:
smartbear.com
AQtrace by SmartBear Software
Transferring Data
89
●
The server must be connected to Internet: either directly or via gateway computer if DMZ1
security zones are applied.
●
The Internet Information Services ver. 5.0 - 7.5 must be installed. The HTTP protocol requires the
World Wide Web Service component to be installed and be running.
●
The protocol communication port should be opened. By default, the HTTP transfer protocol uses
the TCP port number 80 and HTTPS transfer protocol uses SSL port number 443.
The communication port numbers are set or changed via Internet Information Services Manager.
To invoke it open the Control Panel, choose Administrative Tools and then Internet
Information Services. In the Manager right-click the desired web site and choose Properties
from the context menu. In the ensuing Properties dialog, switch to the Web Site tabbed page:
1
DMZ zone is a short name for demilitarized zone (also known as demarcation zone or
perimeter network). To defend local networks from outside attacks, some organizations
separate the servers that work with global networks from the local network. Employees do not
connect to global servers directly from a local network. They do this through a special gateway.
So, only the gateway computer can exchange data with an “external” server.
© 2011 SmartBear Software
smartbear.com/support
90
Using AQtrace
●
The Report Collector should be available.
The Report Collector is a set of Active Server Pages (ASP) that reside at predefined IIS virtual
directory. During AQtrace installation, the wizard creates the \AQtrace virtual directory within the
default web site and maps the physical <AQtrace>\Bin\ASP folder to it. (These associations can
latter be changed from the Internet Information Services Manager.)
smartbear.com
AQtrace by SmartBear Software
Transferring Data
●
91
Buffering must be enabled for the virtual directory, in which the Report Collector resides.
To enable buffering in IIS 5.0 - 6.0:
■
Open Internet Information Services Manager.
■
Right-click the desired virtual directory (by default it is the \AQtrace virtual directory) and
select Properties from the popup menu.
■
In the ensuing Properties dialog, switch to the Virtual Directory tabbed page and click
Configuration.
■
In the ensuing dialog, switch to the Options tabbed page and select the Enable buffering
check box, then click OK.
© 2011 SmartBear Software
smartbear.com/support
92
Using AQtrace
To enable buffering in IIS 7.0 - 7.5:
■ Open Internet Information Services Manager.
■
Select the desired virtual directory in the tree on the left of the Manager and then doubleclick the ASP feature in the right part of the Manager (you can find it in the IIS area if
features are grouped).
■
On the ensuing settings page, set the Enable Buffering option to True (you can find this
option in the Behavior settings group).
smartbear.com
AQtrace by SmartBear Software
Transferring Data
93
●
The initial storage and persistent storage folders should be specified. You can specify the folder
paths either during installation or later using AQtrace Server Config utility.
●
The Report Collector must have read and write permissions for the initial storage folder.
●
The VMWare tool should not be installed on the server computer.
●
The AQtrace Service should be running. The service does not start unless the initial and persistent
and modules storage folders are specified. See Configuring AQtrace Service for detailed
instructions. AQtrace Service is not required to receive reports, yet it performs the further
processing of received reports.
HTTPS Protocol
The Secure Hypertext Transfer Protocol is a combination of the Hypertext Transfer Protocol and a
cryptographic protocol based on public key certificates. When an HTTPS transfer protocol is applied by
AQtrace, the error reports are encrypted and transmitted over a secure channel. Since this protocol is based
on HTTP, then the server should meet all the requirements of HTTP protocol. See a list of HTTP
requirements above.
Additionally a public key certificate for HTTPS messaging must be issued to and be installed on a
server.
To request a certificate from your Certificate Authority, perform the following steps:
●
Open Internet Information Services Manager (Control Panel | Administrative Tools | Internet
Information Services).
●
Expand the Web sites node, right-click the Web site for which you want to request a certificate (the
site containing the \AQtrace virtual directory), and click Properties.
●
Click the Directory Security tab.
●
In the Secure communications section, click Server Certificate.
© 2011 SmartBear Software
smartbear.com/support
94
Using AQtrace
●
In the Web Server Certificate Wizard, click Next.
●
Select the Create a new certificate option and click Next.
●
Fill in the necessary details to request a certificate.
Read the summary screen to make sure that you have specified all the data, and then click Next.
●
smartbear.com
AQtrace by SmartBear Software
Transferring Data
●
95
Click Finish to close the Wizard.
When you receive your response file from the Certificate Authority, you will need to install this on the
Web server. To install a certificate, perform the following steps:
●
Open Internet Information Services Manager (Control Panel | Administrative Tools | Internet
Information Services).
●
Expand Internet Information Services (if needed) and browse to the Web site you have requested a
certificate for.
●
●
Right-click on the site and then click Properties.
Click the Directory Security tab.
●
Under the Secure communications section, click Server Certificate.
●
On the Web Site Certificate Wizard, click Next.
●
Select the Assign an existing certificate option and click Next.
●
Choose the appropriate certificate within a list, and then click Next.
●
Read the summary screen to be sure that you are processing the correct certificate, and then click
Next.
© 2011 SmartBear Software
smartbear.com/support
96
Using AQtrace
●
You will see a confirmation screen. When you have read this information, click Finish
If you want to receive error reports only through HTTPS protocol, then enable the Require secure
channel (SSL) property for the entire web site or for the \AQtrace virtual directory:
smartbear.com
AQtrace by SmartBear Software
Transferring Data
97
FTP Protocol
As the error reports are physically stored as one or more files, you can apply File Transfer Protocol to
transmit them to a server. In order to receive the reports via FTP the following requirements should be
fulfilled:
●
The server must be connected to Internet.
●
The Internet Information Services ver. 5.0 - 7.5 must be installed. The FTP protocol requires the
File Transfer Protocol Service to be installed and be running.
●
The protocol communication port should be opened. By default, the FTP transfer protocol uses the
TCP port number 21.
The communication port numbers are set on the FTP Site tabbed page of the FTP Site Properties
dialog. To call the dialog right-click the desired FTP site in the Internet Information Services
Manager and choose Properties from the context menu.
●
The physical folder to which a virtual FTP directory is mapped should have read and write
permissions. The access permissions are set via the Directory Properties dialog:
© 2011 SmartBear Software
smartbear.com/support
98
Using AQtrace
Tip: It is recommended to map a virtual FTP directory to the folder that is used as the initial report
storage in the HTTP/HTTPS transfer protocol. Thus, the reports delivered via the FTP protocol
will also be processed by AQtrace Service.
TFTP Protocol
The Trivial File Transfer Protocol (TFTP) is quite similar to File Transfer Protocol. The difference is that
TFTP is maintained by third-party server software (not by Microsoft Internet Information Services), and that
UDP ports are applied rather than TCP ports. Therefore the conditions required to get the reports via TFTP
vary from those of FTP transfer protocol:
●
The server must be connected to Internet.
●
The TFTP Server software should be installed and running. There is a great number of tools (both
commercial and free ones) that are used to organize a TFTP server: WinAgents TFTP Server,
Innerdive TFTP Server, TFTPD32 and others.
●
The communication port should be opened. By default, the TFTP transfer protocol uses the UDP
port number 69.
●
The physical folder to which a virtual TFTP directory is mapped should have read and write
permissions.
SMTP Protocol and E-Mail Send Mode
smartbear.com
AQtrace by SmartBear Software
Transferring Data
99
When a Simple Mail Transfer Protocol (SMTP) is used AQtrace Reporter creates an e-mail, attaches the
report files to it and automatically sends it to the developers. When the E-Mail send mode is used, the
Reporter also creates an e-mail and attaches report files to it, but does not send the e-mail - it suggests the
end-user to send the e-mail manually. Thus to get the reports via those two modes, the following conditions
should comply:
●
The server must be connected to Internet.
●
The SMTP Server software should be installed and running. There is a great number of tools (both
commercial and free ones) that are used to organize an SMTP server: SMTP Service component of
Internet Information Services, Sendmail, Postfix and others.
●
The communication port should be opened. By default, the SMTP server uses the TCP port
number 25.
Selecting Transfer Protocol
To transmit error reports generated by AQtrace Reporter to the error reports’ server, your application can
use one or more of the supported transfer protocols and send modes. See Using Multiple Protocols topic to
learn how to combine several transfer protocols. Each of these protocols has its own specific features that
could be useful in different situations. This topic provides a brief overview of the supported protocols.
The information provided below can be helpful for you to select the appropriate send modes for your
application’s error reports. To learn how to configure the server in order to receive the reports via the chosen
protocol(s) see the Transfer Protocols' Requirements topic.
HTTP Protocol
The HTTP (Hypertext Transfer Protocol) protocol is used by AQtrace Packager by default. It is a
principal send mode in AQtrace that provides a full automation of the sending and receiving processes. On
the server side, the reports are received by the Report Collector and are automatically allocated in the initial
storage folder or relayed to another server. The received and placed into the initial storage folder error
reports are processed by the AQtrace Service.
The Report Collector is a simple application made of an .asp page that is deployed on the local IIS server
during the installation of AQtrace. By default, the page’s name is /AQtrace/bugreport.asp.
To use the HTTP protocol as send mode for error reports, all you have to do is to specify the port to be
used for HTTP and the Report Collector’s server and .asp page. For information on how you can specify the
HTTP protocol as the send mode for your application’s error reports, see HTTP Settings.
Although the maximum automation of error reports’ transmitting, the use of the HTTP protocol has one
imperfection: in order for the .asp page can receive a report, the server computer must be on and IIS must be
running on it at the moment of the sending. Also, error reports cannot be sent to the page that resides on the
server that has the VMWare tool installed.
If you do not have a reliable web server or do not want for some other reasons to use the HTTP protocol,
you can use one of other transfer protocols supported by the Reporter.
HTTPS Protocol
Using of the HTTPS (Secure Hypertext Transfer Protocol) protocol by the Reporter is very similar to the
HTTP protocol. The only difference is that the HTTPS protocol is a secured version of the HTTP protocol. If
you want to send encrypted error reports and enhance safety of data transfer, you can select the HTTPS
protocol for error reports transferring.
The HTTPS settings, that you should specify on the Sending page of AQtrace Packager, are similar to
© 2011 SmartBear Software
smartbear.com/support
100
Using AQtrace
the settings needed for the use of the HTTP protocol.
E-mail Send Mode
It is not a transfer protocol like the others, it is just a way to send error reports that uses the default e-mail
client installed on the end-user computer. When AQtrace Reporter generates an error report, it launches the
default e-mail client (for instance, Microsoft Outlook Express) and creates an e-mail message with the
attached error report. The required fields (like Address, Subject) of this message are filled by the Reporter
with the values that have been specified in the E-mail settings on the Sending page of AQtrace Packager. All
the user has to do is to send manually this message to the target mail box.
This send mode can be useful if you want to give the users of your application the capability of
controlling the error report’s sending. For instance, users can change some fields of the generated message
like the Address field. The sending of the created message can also be cancelled at all by the user. So, this
send mode provides more control of the sending of error reports. But at the same time, it is maximum manual
process, because users have to send manually messages with error reports from the default e-mail client and
the received messages have to be collected from the target mail box manually, too.
SMTP Protocol
Using of the SMTP (Simple Mail Transfer Protocol) protocol by the Reporter is similar to the E-mail
send mode (see above). In this case, the Reporter also generates an e-mail message and sends it to the target
mail box. But the message is sent automatically, directly via the specified SMTP server. For information on
how you can specify the SMTP protocol as the send mode for your application’s error reports, see SMTP
Settings.
The main disadvantage of this send mode is the necessity of manual collecting of error reports from the
mail box intended for error reports.
FTP Protocol
The FTP (File Transfer Protocol) protocol allows AQtrace Reporter to send error reports to a remote
directory on the FTP server. This makes possible to collect all the error reports in one directory on the server.
The transferring process is also automatic unlike the E-mail send mode (see above). If you do not have a
reliable HTTP server or do not want to use any of the send modes described above for some reasons, you can
use an FTP server for collecting of error reports and transfer them by using the FTP protocol.
To know how you can specify the FTP protocol as the send mode for your application’s error reports and
what settings you should specify, see FTP Settings.
TFTP Protocol
The TFTP (Trivial File Transfer Protocol) protocol is a very basic form of FTP. It has no authentication
or encryption mechanisms unlike the FTP protocol, so, its security level is low. TFTP requires a very small
amount of memory and is used to transfer small amounts of data. Unlike FTP, this protocol utilizes the UDP
transport protocol.
The TFTP settings that you should specify to use this protocol for error reports’ transferring are similar
to the settings of the FTP protocol. The main difference is that you do not specify the user’s name and
password for the TFTP server.
The reports received via TFTP cannot be automatically processed by AQtrace Service. Read Using
Multiple Protocols for details.
smartbear.com
AQtrace by SmartBear Software
Transferring Data
101
Using Multiple Protocols
This topic describes how to organize the processing of error reports received via different transmitting
protocols. Different sending modes demand different conditions from a server - a number of communication
ports to be opened; certain software components to be installed and be running, and so forth. Yet it is quite
possible to configure the server so that it will receive the reports from every of the available sending modes.
Read the Transfer Protocols' Requirements to learn the detailed list of conditions for each of the protocols.
The full sequence of processing of error reports includes the following stages:
1. Receiving error reports.
2. Placing the reports to initial storage.
3. Searching for duplicated reports and marking them.
4. Moving the reports from initial to persistent folder.
Unfortunately, not all of available transmitting modes can perform all these steps automatically. The
further sections describe the abilities of each of the available modes.
HTTP and HTTPS Sending Modes
These sending modes provide full automation of receiving and processing reports. The incoming reports
are received by Report Collector which can either relay them to another server or transfer them to initial
storage. While placing the reports to initial storage, the Collector creates a new folder (having the GUID-like
name) and moves the report files to it. The folder creation event is a trigger for another AQtrace component AQtrace Service. It scans the newly created folder for applicable files (those having the *.dmp and *.dmpx
extensions). If such files do reside in the folder, then the Service examines whether the report describes a
new error case or it duplicates some known error case. After that the Service moves the report to persistent
folder.
As you can see, processing of reports received via HTTP and HTTPS does not require any human
intervention. Therefore we recommend to use these two modes as principal ways of transmitting error
reports, especially if you expect massive feedback from your application’s end-users.
FTP Sending Mode
In this mode, reports are transferred like any other files and are stored to the Root folder or to its
subfolder. Which folder should be treated as the Root folder is defined by the FTP server software. The
exact location where reports will be stored is specified by the Remote Directory setting - if the setting is
empty, then the reports are saved to the Root folder, otherwise, the reports are stored to a subfolder with the
specified name.
To automate processing of reports received via this protocol, you should specify the path to the initial
storage folder in the Remote Directory setting. In this case, for each report a separate folder will be created
in the initial storage folder and thus the reports received through FTP will also be processed by AQtrace
Service.
TFTP Sending Mode
This mode is much alike FTP mode, yet the processing of reports received via TFTP cannot be fully
automated. This is because the TFTP servers are unable to create subfolders within their root folder and,
consequently, AQtrace Service will not notice the reports received via TFTP (since it tracks folder changes
but not file changes).
To impel AQtrace Service to process the reports received via TFTP you should perform the following
© 2011 SmartBear Software
smartbear.com/support
102
Using AQtrace
actions manually:
● Create an empty temporary folder at an arbitrary location
●
Move reports to this folder
●
Copy or move the folder to initial storage folder
SMTP and E-Mail Sending Modes
These modes provide the least degree of automation. We recommend to use these modes only if you
expect a minimal amount of responses.
In these modes the error reports are received as e-mail file attachments. You can open the report file(s)
directly from the e-mail client, or save the file(s) to an arbitrary external folder. Opening the files directly
frees you from organizing initial and persistent storage folders at the expense of poor structure. When saving
the report file(s) to a folder, you can specify the path to a subfolder within the initial storage folder and thus
yield the further processing of the report by AQtrace Service.
smartbear.com
AQtrace by SmartBear Software
Compiling Applications With Debug Information
103
Preparing Applications for AQtrace
Compiling Applications With Debug Information
Each error report contains information about the binary code that contains the exception. In order for
AQtrace Service and AQtrace Viewer to be able to trace this code, the application must be compiled with
debug information. The debug information tells the Service and Viewer where a function starts and ends in
memory, how many bytes the function’s code occupies, where each routine is located in the executable’s
memory and so on. Having the debug information, these utilities are able to determine the functions and
source code lines, to which binary instructions belong, parse the call stacks and perform other analysis
actions.
AQtrace supports the following formats of debug information:
●
PDB - This format is used by Microsoft and some other compilers.
●
TD32 - This format is used by Borland and CodeGear Delphi compilers.
●
TDS - This format is used by Borland C++Builder compiler and by Borland and CodeGear Delphi
compilers (with some preprocessing).
●
SYM - This format is used by Borland and CodeGear Delphi compilers.
Debug information can be compiled into executable modules, or it can be generated as a separate file.
AQtrace can work with both types of debug information. However, when you build release versions of your
products, it is recommended to generate debug information in separate files to decrease the overall size of
your binary modules.
There is no need to ship debug information files along with your application’s modules. However, these
files are needed for analysis of the received error reports, so they must reside in build storage and be
accessible for AQtrace Service and AQtrace Viewer (see Organizing Build Storage).
To include debug information into your executable, you should specify certain compiler settings. Which
settings to be changed depend on the compiler you use. For detailed information, please see documentation
on your development tool. The following topics explain how to modify the settings for most popular
compilers:
Native-code compilers:
Microsoft Visual C++ 2005, 2008 and 2010
Microsoft Visual C++ 7.x
Microsoft Visual C++ 6.0
Microsoft Visual Basic 6.0
Embarcadero Delphi XE
Embarcadero Delphi 2010
CodeGear Delphi 2009 for Win32
© 2011 SmartBear Software
smartbear.com/support
104
Preparing Applications for AQtrace
CodeGear Delphi 2007 for Win32
Borland Delphi 2005 and 2006 for Win32
Borland Delphi 3 - 7
Embarcadero C++Builder XE
Embarcadero C++Builder 2010
CodeGear C++Builder 2009
CodeGear C++Builder 2007
Borland C++Builder 2006
Borland C++Builder 3 - 6
Intel C++
.NET compilers:
Microsoft Visual C# 2005, 2008 and 2010
Microsoft Visual C# 7.x
Microsoft Visual C++ 2005, 2008 and 2010
Microsoft Visual C++ 7.x
Microsoft Visual Basic 2005, 2008 and 2010
Microsoft Visual Basic 7.x
CodeGear Delphi 2009 for .NET
CodeGear Delphi 2007 for .NET
Borland Delphi 2005 and 2006 for .NET
Native-Code Compilers
Compiling Microsoft Visual C++ 2005, 2008 and 2010 Applications With Debug
Information
This topic explains how to compile Visual C++ 2005, 2008 and 2010 applications with debug
information for AQtrace. To learn how to prepare applications created with Visual C++ 7.x, see Compiling
Microsoft Visual C++ 7.x Applications With Debug Information. To learn how to prepare applications
created with Visual C++ 6.0 or earlier, see Compiling Microsoft Visual C++ 6.0 Applications With Debug
Information.
Default settings created by Microsoft Visual Studio 2005, Visual Studio 2008 or Visual Studio 2010 for
a new Visual C++ 2005, 2008 or 2010 application already contain all necessary information for generating
debug information. So, if you do not change the compiler settings, you can compile and profile your Visual
C++ 2005, 2008 or 2010 application as is. However, we recommend that you change the active configuration
to Release because this configuration is used to build the final version of an application.
If you are not sure whether your application’s compiler settings were changed, you can follow these
steps to make sure that your application is compiled with debug information:
1. Open your project in Visual Studio 2005, Visual Studio 2008 or Visual Studio 2010.
smartbear.com
AQtrace by SmartBear Software
Compiling Applications With Debug Information
105
2. Select Build | Configuration Manager from the main menu. This will open the Configuration
Manager dialog.
In the dialog, select the Release configuration (that is, the configuration that is used to build the
release version of your product):
Close the dialog.
Note: The debug information will be generated as an external PDB file, so it will not
increase the size of your executable module.
3. Right-click the project in the Solution Explorer and select Properties from the context menu.
This will call the Property Pages dialog.
4. In the dialog:
a. From the Configuration dropdown list, select the configuration that you will use to build the
final version of your application (typically, this is the Release configuration).
b. Switch to the Configuration Properties | C/C++ | General page and set Debug Information
Format to Program Database (/Zi) or to Program Database for Edit & Continue (/ZI). For
more information on these options, review the Visual Studio documentation.
© 2011 SmartBear Software
smartbear.com/support
106
Preparing Applications for AQtrace
c. Open the Configuration Properties | Linker | Debugging property page and set the
Generate Debug Info option to Yes (/DEBUG).
smartbear.com
AQtrace by SmartBear Software
Compiling Applications With Debug Information
107
5. Click OK to save the settings and to close the dialog.
6. Rebuild your application. The compiler will generate debug information as an external PDB file
and save this file to the folder in which the compiled executable resides.
There is no need to distribute the generated PDB files with your application. However, you should place
these files along with the compiled executable modules in the build storage. For more information on this,
see Organizing Build Storage.
Compiling Microsoft Visual C++ 7.x Applications With Debug Information
This topic explains how to compile Visual C++ 7.x applications with debug information for AQtrace. To
learn how to prepare applications created with Visual C++ 2005 (8.0), 2008 (9.0) or 2010 (10.0), see
Compiling Microsoft Visual C++ 2005, 2008 and 2010 Applications With Debug Information. To learn how
to prepare applications created with Visual C++ 6.0 or earlier, see Compiling Microsoft Visual C++ 6.0
Applications With Debug Information.
Default settings created by Microsoft Visual Studio for a new Visual C++ .NET application already hold
all necessary information for generating debug information. So, if you do not change the compiler settings,
you can compile and profile your Visual C++ .NET application as is. The only thing we would recommend is
to change the active configuration to Release, because the Release configuration is typically used to build the
final version of the application.
If you are not sure whether your application’s compiler settings were changed, you can follow the steps
described in this topic to make certain that your application is compiled with debug information:
1. Open your project in Visual Studio .NET.
2. Select Build | Configuration Manager from the main menu. This will open the Configuration
© 2011 SmartBear Software
smartbear.com/support
108
Preparing Applications for AQtrace
Manager dialog. Select the Release configuration for your project:
Close the dialog.
Note: The debug information will be generated as an external PDB file, so it will not
increase the size of your executable.
3. Right-click the project in the Solution Explorer and select Properties from the context menu.
This will call the Property Pages dialog.
4. In the dialog,
a. In the Configuration box, specify the configuration, which you will use to compile the release
version of your application.
b. Switch to the Configuration Properties | C/C++ | General page and set the Debug
Information Format option either to Program Database (/Zi) or to Program Database for
Edit & Continue (/ZI). For more information on these options, see Visual Studio .NET
documentation.
smartbear.com
AQtrace by SmartBear Software
Compiling Applications With Debug Information
109
c. Open the Configuration Properties | Linker | Debug property page and set the Generate
Debug Info option to Yes (/DEBUG).
© 2011 SmartBear Software
smartbear.com/support
110
Preparing Applications for AQtrace
5. Click OK to save the settings and to close the dialog.
6. Recompile your application. The Visual C++ compiler will generate debug information as external
PDB files and save them to the folder in which the compiled executable resides.
There is no need to ship the compiled PDB files with your application. However, you should add them
along with the executable modules to your build storage. For more information on this, see Organizing Build
Storage.
Compiling Microsoft Visual C++ 6.0 Applications With Debug Information
This topic explains how to compile Microsoft Visual C++ 6.0 applications with debug information for
AQtrace. To learn how to compiler applications created with Visual C++ 7.x, see Compiling Microsoft
Visual C++ 7.x Applications With Debug Information. To learn how to prepare applications created with
Visual C++ 2005 (8.0), 2008 (9.0) or 2010 (10.0), see Compiling Microsoft Visual C++ 2005, 2008 and
2010 Applications With Debug Information.
The Visual C++ compiler generates debug information that has the PDB format and is stored as a
separate file along with the compiled executable module. To compile your Visual C++ application with PDB
debug info, you should set specific compiler options:
1. Open your project in Visual Studio.
2. Select the configuration that you will use to build the release version of your application. To
specify the configuration, select Build | Set Active Configuration from Visual C++’s menu and
then choose the desired configuration in the ensuing dialog:
Note: The release version should be compiled with debug information in order for AQtrace
Viewer to be able to process the generated error report.
The debug information will be compiled into separate files, so it will not increase the
overall size of your executable modules. There is no need to ship the debug
information files with your application. However, you should save them to the build
storage (see Organizing Build Storage).
3. Select Project | Settings from Visual Studio’s main menu to open the Project Settings dialog.
4. In the dialog, open the C/C++ page and make sure that Debug Info is set either to Program
smartbear.com
AQtrace by SmartBear Software
Compiling Applications With Debug Information
111
Database or to Program Database for Edit and Continue:
For more information on these options, review Microsoft Visual C++ Help.
5. You have set your project to generate debug information when compiling. Now, you must ensure
that the linker saves it. From Project | Settings select the Link page. On this page, first set the
Category to General, then check Generate debug info:
© 2011 SmartBear Software
smartbear.com/support
112
Preparing Applications for AQtrace
On the Link page, select Debug in the Category box and then do the following:
●
●
Select the Debug info check box.
Clear the Separate type check box.
●
Select the Microsoft format option button.
smartbear.com
AQtrace by SmartBear Software
Compiling Applications With Debug Information
113
6. The last step is to set how the linker will save the debug information. The debug information
should be saved as an external PDB file (the PDB format). To set linker options:
●
Switch to the Link page of the Project Settings dialog:
●
Set the Category to Customize.
●
Check Use program database.
●
Enter the PDB file name you want in the Program database name edit field.
7. Rebuild your application. The compiler will generate debug information as an external PDB file
and save this file to the folder, in which the compiled executable resides.
There is no need to ship the generated PDB files along with your application. However, you should place
the debug information files along with executable modules in the build storage. For more information on this,
see Organizing Build Storage.
Compiling Microsoft Visual Basic 6.0 Applications With Debug Information
This topic explains how to compile Microsoft Visual Basic 6.0 applications with debug information for
AQtrace. To learn how to prepare applications created with Visual Basic .NET, see Compiling Microsoft
Visual Basic 7.x Applications With Debug Information and Compiling Microsoft Visual Basic 2005 and 2008
Applications With Debug Information.
Visual Basic may include debug information in the executable file, or add debug info to an external PDB
file. AQtrace can work with both types of debug information. However, if you compile a release version of
your product, it is recommended to generate debug information as an external file. This will decrease the
overall size of your executable.
To specify the way in which debug information will be generated, use the Link environment variable. If
© 2011 SmartBear Software
smartbear.com/support
114
Preparing Applications for AQtrace
this variable is not defined, Visual Basic will generate an external PDB file. Else, the compiler will include
the debug information in the executable. For more information on this, see Visual Basic documentation.
To compile your Visual Basic application for AQtrace, follow these steps:
1. If you compile a release version of your product, make certain that the Link environment variable
is not defined. If this environment variable exists, Visual Basic will embed debug information in
the executable and thus the overall size of your application will increase.
2. Open your project in Microsoft Visual Basic.
3. Select Project | Project Properties from Visual Basic’s main menu. This will open the Project
Properties dialog.
4. Move to the Compile tabbed page and select the Create Symbolic Debug Info check box:
5. Press OK to close the dialog.
6. Recompile your application.
There is no need to ship the generated PDB files along with your application. However, you should place
the debug information files along with executable modules in the build storage. For more information on this,
see Organizing Build Storage.
Compiling Embarcadero Delphi XE Applications With Debug Information
This topic explains how you can compile Embarcadero Delphi XE applications with debug information
for AQtrace. To learn how to prepare applications created with other Delphi versions, see Compiling
Applications With Debug Information.
The Delphi compiler generates debug information in the TD32 format. Debug info of this type is
compiled into your executables. Besides TD32, Delphi can generate .map files that can then be converted to
smartbear.com
AQtrace by SmartBear Software
Compiling Applications With Debug Information
115
.sym files that store information on the application’s functions. In addition, using special utilities
(StripTDS.exe or TDstrp32.exe) you can extract TD32 debug information from binary modules and store it
to external .tds files.
AQtrace can work with all of these formats. However, we recommend that you use external .tds or .sym
files for release builds of your products. This will decrease the overall size of your executables. The TD32
format of debug information compiled into executables can be used for intermediate or special builds. Below
is a detailed description of how to change compiler options to use the desired format of debug information.
AQtrace is not compatible with third-party tools that modify the binary code of your application, for
example, to include a custom exception handling mechanism. An example of such a tool is
EurekaLog v. 4.5.4 and earlier. We recommend that you generate the debug information for your
application before processing it with such tools.
Internal Debug Information (TD32)
To compile a Win32 Delphi application with TD32 debug information, follow these steps:
1. Open your project in Embarcadero Delphi XE.
2. Right-click the Project_Name | Build Configurations | Debug node in the Project Manager
panel and select Activate from the context menu. This will activate the Debug configuration that
will be used to build the debug version of your application.
You can compile your application in any configuration, not just in the Debug one. We
chose the Debug configuration to make sure the changes that will be made to compiler
Note:
settings will not affect the Release configuration, which is typically used to build the
final version of applications.
3. Select Project | Options from the main menu.
4. In the resulting Project Options dialog, select your debug configuration in the Build
Configuration combo box. This will load the settings used for debug builds.
5. Select the Delphi Compiler | Compiling category from the tree view on the left of the Project
Options dialog and do the following:
a. In the Debugging group, set the Debug information and Local symbols options to
True.
b. To trace VCL routines, set the Use debug .dcus option to True. If you set this option to
False, AQtrace will be able to trace only those classes that are defined in your
application.
© 2011 SmartBear Software
smartbear.com/support
116
Preparing Applications for AQtrace
6. Select the Delphi Compiler | Linking category from the tree on the left of the Project Options
dialog and set the Debug information option to True:
smartbear.com
AQtrace by SmartBear Software
Compiling Applications With Debug Information
117
7. Press OK to save the changes and to close the dialog.
8. Rebuild your application.
After you compile your modules, you should place them in the build storage (see Organizing Build
Storage).
External Debug Information (TDS Files)
To generate debug information for your Delphi XE application as an external .tds file, you can just
perform the same actions needed for compiling Delphi XE applications with internal TD32 debug
information (see above) and change one additional project option before compiling the application: On the
Delphi Compiler | Linking page of the Project Options dialog, set the Place debug information in separate
TDS file option to True.
© 2011 SmartBear Software
smartbear.com/support
118
Preparing Applications for AQtrace
After you recompile your application with this option enabled, the application’s debug information will
be generated as an external .tds file.
If you have already compiled your application with internal TD32 debug information, you can also
extract debug information from the application’s executable file by using either SmartBear’s StripTDS utility
or the Turbo Debugger 32-bit Symbol Table Stripper utility. These two utilities perform the same actions remove debug information from the binary files and save it to separate .tds files. However, TDstrp32 utility
can only process one file at a time whereas StripTDS utility supports file masks and recursive processing.
Note:
Both utilities only work with those sections in the binary files that contain debug
information. They do not change the code and data sections, so your modules will still work
as designed.
The StripTDS utility is shipped along with AQtrace, its executable is <AQtrace>\Bin\StripTDS.exe. The
Turbo Debugger 32-bit Symbol Table Stripper utility is supplied with Embarcadero RAD Studio XE (the
utility is installed with Embarcadero C++Builder XE and has the following path: <Program
Files>\Embarcadero\RAD Studio\8.0\bin\TDstrp32.exe).
To create external .tds files for the modules of your Win32 Delphi application, do the following:
1.
2.
Compile your application with TD32 debug information as described above.
Apply the StripTDS or TDstrp32 utility to each compiled executable and DLL.
To process all EXE and DLL files in the desired folder and its subfolders using the StripTDS
utility, use the following command:
StripTDS.exe -r -w C:\MyApp\*.exe;C:\MyApp\*.dll
To do this using the TDstrp32 utility, run the following command:
smartbear.com
AQtrace by SmartBear Software
Compiling Applications With Debug Information
119
for /r "C:\MyApp" %f in (*.exe *.dll) do TDstrp32.exe -s "%~ff"
or this one if processing is done from a batch file:
for /r "C:\MyApp" %%f in (*.exe *.dll) do (
TDstrp32.exe -s "%%~ff"
)
There is no need to ship the generated .tds files along with the release version of your application to
users. Just copy them along with the appropriate binary modules into the build storage (that is, each .tds file
should reside in the folder in which its executable file is). For more information on creating build storages,
see Organizing Build Storage.
External Debug Information (SYM Files)
.Sym files are generated from .map files, which are created by the Delphi compiler. You should then
convert each .map file to a .sym file by using the MapSym utility that is included in Windows SDK or
Microsoft Visual Studio 2005:
•
You can download the Windows
(http://www.microsoft.com/downloads).
•
If you have Visual Studio 2005, you can find this utility in the following folder:
<Program Files>\Microsoft Visual Studio 8\Common7\Tools\Bin\MapSym.Exe
SDK
package
from
Microsoft’s
web
site
So, to create .sym files, you should first compile your Delphi application for .map files and then convert
these files to the .sym format. Below is a detailed description:
1. Change your Delphi project’s settings to create .map files:
a. Open your project in Delphi XE.
b. Right-click the Project_Name | Build Configurations | Release node in the Project
Manager panel and select Activate from the context menu. This will activate the Release
configuration that will be used to build the debug version of your application.
c. Select Project | Options from Delphi’s main menu. This will open the Project Options
dialog.
d. Select the Delphi Compiler | Linking category in the tree view on the left of the Project
Options dialog, and then select Detailed for the Map file option:
© 2011 SmartBear Software
smartbear.com/support
120
Preparing Applications for AQtrace
e. Press OK to save the changes and to close the dialog.
f.
Recompile your application.
Delphi will create the .map files during application compilation.
2. Apply MapSym.exe to each generated .map file. To convert a .map file to the appropriate .sym file,
use the following command line:
MapSym.exe -o MyFile.sym MyFile.map
-- or -MapSym.exe MyFile.map
After you create a .sym file, put it along with the appropriate executable or DLL into the build storage
(that is, each .sym file should reside in the folder in which its executable file is). For more information on
creating build storages, see Organizing Build Storage. Note, there is no need to distribute the generated .map
or .sym files with your application.
Compiling Embarcadero Delphi 2010 Applications With Debug Information
This topic explains how you can compile Embarcadero Delphi 2010 applications with debug information
for AQtrace. To learn how to prepare applications created with other Delphi versions, see Compiling
Applications With Debug Information.
The Delphi compiler generates debug information in the TD32 format. Debug info of this type is
compiled into your executables. Besides TD32, Delphi can generate .map files that can then be converted to
.sym files that store information on the application’s functions. In addition, using special utilities
(StripTDS.exe or TDstrp32.exe) you can extract TD32 debug information from binary modules and store it
smartbear.com
AQtrace by SmartBear Software
Compiling Applications With Debug Information
121
to external .tds files.
AQtrace can work with all of these formats. However, we recommend that you use external .tds or .sym
files for release builds of your products. This will decrease the overall size of your executables. The TD32
format of debug information compiled into executables can be used for intermediate or special builds. Below
is a detailed description of how to change compiler options to use the desired format of debug information.
AQtrace is not compatible with third-party tools that modify the binary code of your application, for
example, to include a custom exception handling mechanism. An example of such a tool is
EurekaLog v. 4.5.4 and earlier. We recommend that you generate the debug information for your
application before processing it with such tools.
Internal Debug Information (TD32)
To compile a Win32 Delphi application with TD32 debug information, follow these steps:
1. Open your project in Embarcadero Delphi XE.
2. Right-click the Project_Name | Build Configurations | Debug node in the Project Manager
panel and select Activate from the context menu. This will activate the Debug configuration that
will be used to build the debug version of your application.
You can compile your application in any configuration, not just in the Debug one. We
chose the Debug configuration to make sure the changes that will be made to compiler
Note:
settings will not affect the Release configuration, which is typically used to build the
final version of applications.
3. Select Project | Options from the main menu.
4. In the resulting Project Options dialog, select your debug configuration in the Build
Configuration combo box. This will load the settings used for debug builds.
5. Select the Delphi Compiler | Compiling category from the tree view on the left of the Project
Options dialog and do the following:
a. In the Debugging group, set the Debug information and Local symbols options to
True.
b. To trace VCL routines, set the Use debug .dcus option to True. If you set this option to
False, AQtrace will be able to trace only those classes that are defined in your
application.
© 2011 SmartBear Software
smartbear.com/support
122
Preparing Applications for AQtrace
6. Select the Delphi Compiler | Linking category from the tree on the left of the Project Options
dialog and set the Debug information option to True:
smartbear.com
AQtrace by SmartBear Software
Compiling Applications With Debug Information
123
7. Press OK to save the changes and to close the dialog.
8. Rebuild your application.
After you compile your modules, you should place them in the build storage (see Organizing Build
Storage).
External Debug Information (TDS Files)
To generate .tds files you can apply either SmartBear’s StripTDS utility or Turbo Debugger 32-bit
Symbol Table Stripper utility. These two utilities perform the same actions - remove debug information from
the binary files and save it to separate .tds files. However, TDstrp32 utility can only process one file at a time
whereas StripTDS utility supports file masks and recursive processing.
Note: Both utilities only work with those sections in the binary files that contain debug information.
They do not change the code and data sections, so your modules will still work as designed.
The StripTDS utility is shipped along with AQtrace, its executable is <AQtrace>\Bin\StripTDS.exe. The
Turbo Debugger 32-bit Symbol Table Stripper utility is supplied with Embarcadero RAD Studio 2010 (the
utility is installed with Embarcadero C++Builder 2010 and has the following path: <Program
Files>\CodeGear\RAD Studio\7.0\Bin\TDstrp32.exe).
To create external .tds files for the modules of your Win32 Delphi application, do the following:
1. Compile your application with TD32 debug information as described above.
2. Apply the StripTDS or TDstrp32 utility to each compiled executable and DLL.
To process all EXE and DLL files in the desired folder and its subfolders using the StripTDS
© 2011 SmartBear Software
smartbear.com/support
124
Preparing Applications for AQtrace
utility, use the following command:
StripTDS.exe -r -w C:\MyApp\*.exe;C:\MyApp\*.dll
To do this using the TDstrp32 utility, run the following command:
for /r "C:\MyApp" %f in (*.exe *.dll) do TDstrp32.exe -s "%~ff"
or this one if processing is done from a batch file:
for /r "C:\MyApp" %%f in (*.exe *.dll) do (
TDstrp32.exe -s "%%~ff"
)
There is no need to ship the generated .tds files along with the release version of your application to
users. Just copy them along with the appropriate binary modules into the build storage (that is, each .tds file
should reside in the folder in which its executable file is). For more information on creating build storages,
see Organizing Build Storage.
External Debug Information (SYM Files)
.Sym files are generated from .map files, which are created by the Delphi compiler. You should then
convert each .map file to a .sym file by using the MapSym utility that is included in Windows SDK or
Microsoft Visual Studio 2005:
•
You can download the Windows
(http://www.microsoft.com/downloads).
•
If you have Visual Studio 2005, you can find this utility in the following folder:
<Program Files>\Microsoft Visual Studio 8\Common7\Tools\Bin\MapSym.Exe
SDK
package
from
Microsoft’s
web
site
So, to create .sym files, you should first compile your Delphi application for .map files and then convert
these files to the .sym format. Below is a detailed description:
1. Change your Delphi project’s settings to create .map files:
a. Open your project in Delphi 2010.
b. Right-click the Project_Name | Build Configurations | Release node in the Project
Manager panel and select Activate from the context menu. This will activate the Release
configuration that will be used to build the debug version of your application.
c. Select Project | Options from Delphi’s main menu. This will open the Project Options
dialog.
d. Select the Delphi Compiler | Linking category in the tree view on the left of the Project
Options dialog, and then select Detailed for the Map file option:
smartbear.com
AQtrace by SmartBear Software
Compiling Applications With Debug Information
125
e. Press OK to save the changes and to close the dialog.
f. Recompile your application.
Delphi will create the .map files during application compilation.
2. Apply MapSym.exe to each generated .map file. To convert a .map file to the appropriate .sym file,
use the following command line:
MapSym.exe -o MyFile.sym MyFile.map
-- or -MapSym.exe MyFile.map
After you create a .sym file, put it along with the appropriate executable or DLL into the build storage
(that is, each .sym file should reside in the folder in which its executable file is). For more information on
creating build storages, see Organizing Build Storage. Note, there is no need to distribute the generated .map
or .sym files with your application.
Compiling CodeGear Delphi 2009 for Win32 Applications With Debug Information
This topic explains how you can compile CodeGear Delphi 2009 for Win32 applications with debug
information for AQtrace. To learn how to prepare applications created with other Delphi versions, see
Compiling Applications With Debug Information.
The Delphi compiler generates debug information in the TD32 format. Debug info of this type is
compiled into your executables. Besides TD32, Delphi can generate .map files that can then be converted to
.sym files that store information on the application’s functions. In addition, using special utilities
© 2011 SmartBear Software
smartbear.com/support
126
Preparing Applications for AQtrace
(StripTDS.exe or TDstrp32.exe) you can extract TD32 debug information from binary modules and store it to
external .tds files.
AQtrace can work with all of these formats. However, we recommend that you use external .tds or .sym
files for release builds of your products. This will decrease the overall size of your executables. The TD32
format of debug information compiled into executables can be used for intermediate or special builds. Below
is a detailed description of how to change compiler options to use the desired format of debug information.
AQtrace is not compatible with third-party tools that modify the binary code of your application,
for example, to include a custom exception handling mechanism. An example of such a tool is
EurekaLog v. 4.5.4 and earlier. We recommend that you generate the debug information for your
application before processing it with such tools.
Internal Debug Information (TD32)
To compile a Win32 Delphi application with TD32 debug information, follow these steps:
1. Open your project in Delphi 2009.
2. Right-click the Project_Name | Build Configurations | Debug node in the Project Manager
panel and select Activate from the context menu. This will activate the Debug configuration that
will be used to build the debug version of your application.
Note: You can compile your application in any configuration, not just in the Debug one. We
chose the Debug configuration to make sure the changes that will be made to compiler
settings will not affect the Release configuration, which is typically used to build the
final version of applications.
3. Select Project | Options from the main menu.
4. In the resulting Project Options dialog, select your debug configuration in the Build
Configuration combo box. This will load the settings used for debug builds.
5. Select the Delphi Compiler | Compiling category from the tree view on the left of the Project
Options dialog and do the following:
●
In the Debugging group, set the Debug information and Local symbols options to True.
●
To trace VCL routines, set the Use debug .dcus option to True. If you set this option to False,
AQtrace will be able to trace only those classes that are defined in your application.
smartbear.com
AQtrace by SmartBear Software
Compiling Applications With Debug Information
127
6. Select the Delphi Compiler | Linking category from the tree on the left of the Project Options
dialog and set the Debug information option to True:
© 2011 SmartBear Software
smartbear.com/support
128
Preparing Applications for AQtrace
7. Press OK to save the changes and to close the dialog.
8. Rebuild your application.
After you compile your modules, you should place them in the build storage (see Organizing Build
Storage).
External Debug Information (TDS Files)
To generate .tds files you can apply either SmartBear’s StripTDS utility or Turbo Debugger 32-bit
Symbol Table Stripper utility. These two utilities perform the same actions - remove debug information from
the binary files and save it to separate .tds files. However, TDstrp32 utility can only process one file at a time
whereas StripTDS utility supports file masks and recursive processing.
Note: Both utilities only work with those sections in the binary files that contain debug information.
They do not change the code and data sections, so your modules will still work as designed.
The StripTDS utility is shipped along with AQtrace, its executable is <AQtrace>\Bin\StripTDS.exe. The
Turbo Debugger 32-bit Symbol Table Stripper utility is supplied with CodeGear RAD Studio 2009 (the
utility is installed with CodeGear C++Builder 2009 and has the following path: <Program
Files>\CodeGear\RAD Studio\6.0\Bin\TDstrp32.exe).
To create external .tds files for the modules of your Win32 Delphi application, do the following:
1. Compile your application with TD32 debug information as described above.
2. Apply the StripTDS or TDstrp32 utility to each compiled executable and DLL.
smartbear.com
AQtrace by SmartBear Software
Compiling Applications With Debug Information
129
To process all EXE and DLL files in the desired folder and its subfolders using the StripTDS
utility, use the following command:
StripTDS.exe -r -w C:\MyApp\*.exe;C:\MyApp\*.dll
To do this using the TDstrp32 utility, run the following command:
for /r "C:\MyApp" %f in (*.exe *.dll) do TDstrp32.exe -s "%~ff"
or this one if processing is done from a batch file:
for /r "C:\MyApp" %%f in (*.exe *.dll) do (
TDstrp32.exe -s "%%~ff"
)
There is no need to ship the generated .tds files along with the release version of your application to
users. Just copy them along with the appropriate binary modules into the build storage (that is, each .tds file
should reside in the folder in which its executable file is). For more information on creating build storages,
see Organizing Build Storage.
External Debug Information (SYM Files)
.Sym files are generated from .map files, which are created by the Delphi compiler. You should then
convert each .map file to a .sym file by using the MapSym utility that is included in Windows SDK or
Microsoft Visual Studio 2005:
●
You can download the Windows
(http://www.microsoft.com/downloads).
●
If you have Visual Studio 2005, you can find this utility in the following folder:
SDK
package
from
Microsoft’s
web
site
<Program Files>\Microsoft Visual Studio 8\Common7\Tools\Bin\MapSym.Exe
So, to create .sym files, you should first compile your Delphi application for .map files and then convert
these files to the .sym format. Below is a detailed description:
1. Change your Delphi project’s settings to create .map files:
a. Open your Win32 project in Delphi 2009.
b. Right-click the Project_Name | Build Configurations | Release node in the Project Manager
panel and select Activate from the context menu. This will activate the Release configuration
that will be used to build the debug version of your application.
c. Select Project | Options from Delphi’s main menu. This will open the Project Options
dialog.
d. Select the Delphi Compiler | Linking category in the tree view on the left of the Project
Options dialog, and then select Detailed for the Map file option:
© 2011 SmartBear Software
smartbear.com/support
130
Preparing Applications for AQtrace
e. Press OK to save the changes and to close the dialog.
f.
Recompile your application.
Delphi will create the .map files during application compilation.
2. Apply MapSym.exe to each generated .map file. To convert a .map file to the appropriate .sym
file, use the following command line:
MapSym.exe -o MyFile.sym MyFile.map
-- or -MapSym.exe MyFile.map
After you create a .sym file, put it along with the appropriate executable or DLL into the build storage
(that is, each .sym file should reside in the folder in which its executable file is). For more information on
creating build storages, see Organizing Build Storage. Note, there is no need to distribute the generated .map
or .sym files with your application.
Compiling CodeGear Delphi 2007 for Win32 Applications With Debug Information
This topic explains how you can compile CodeGear Delphi 2007 for Win32 applications with debug
information for AQtrace. To learn how to prepare applications created with other Delphi versions, see
Compiling Applications With Debug Information.
The Delphi compiler generates debug information in the TD32 format. Debug info of this type is
compiled into your executables. Besides TD32, Delphi can generate .map files that can then be converted to
smartbear.com
AQtrace by SmartBear Software
Compiling Applications With Debug Information
131
.sym files that store information on the application’s functions. In addition, using special utilities
(StripTDS.exe or TDstrp32.exe) you can extract TD32 debug information from binary modules and store it to
external .tds files.
AQtrace can work with all of these formats. However, we recommend that you use external .tds or .sym
files for release builds of your products. This will decrease the overall size of your executables. The TD32
format of debug information compiled into executables can be used for intermediate or special builds. Below
is a detailed description of how to change compiler options to use the desired format of debug information.
AQtrace is not compatible with third-party tools that modify the binary code of your application,
for example, to include a custom exception handling mechanism. An example of such a tool is
EurekaLog v. 4.5.4 and earlier. We recommend that you generate the debug information for your
application before processing it with such tools.
Internal Debug Information (TD32)
To compile a Win32 Delphi application with TD32 debug information, follow these steps:
1. Open your project in Delphi 2007.
2. Select Project | Configuration Manager from the main menu. In the ensuing Build
Configuration Manager dialog, choose the Debug configuration for your project:
Note: You can compile your application in any configuration, not just in the Debug one. We
chose the Debug configuration to make sure the changes that will be made to compiler
settings will not affect the Release configuration, which is typically used to build the
final version of applications.
3. Select Project | Options from the main menu.
4. In the resulting Project Options dialog, select the Compiler category from the tree view on the
left.
5. Select the Debug information and Local symbols check boxes in the Debugging section.
6. To trace VCL routines, select the Use Debug DCUs check box in the Debugging section. If you
© 2011 SmartBear Software
smartbear.com/support
132
Preparing Applications for AQtrace
leave this option unchecked, AQtrace will be able to trace only those classes that are defined in
your application.
7. Select the Linker category from the tree on the left of the Project Options dialog.
8. In the EXE and DLL options section, select the Include TD32 debug info check box:
smartbear.com
AQtrace by SmartBear Software
Compiling Applications With Debug Information
133
9. Press OK to save the changes and to close the dialog.
10. Rebuild your application.
After you compile your modules, you should place them in the build storage (see Organizing Build
Storage).
External Debug Information (TDS Files)
To generate .tds files you can apply either SmartBear’s StripTDS utility or Turbo Debugger 32-bit
Symbol Table Stripper utility. These two utilities perform the same actions - remove debug information from
the binary files and save it to separate .tds files. However, TDstrp32 utility can only process one file at a time
whereas StripTDS utility supports file masks and recursive processing.
Note: Both utilities only work with those sections in the binary files that contain debug information.
They do not change the code and data sections, so your modules will still work as designed.
The StripTDS utility is shipped along with AQtrace, its executable is <AQtrace>\Bin\StripTDS.exe. The
Turbo Debugger 32-bit Symbol Table Stripper utility is supplied with CodeGear RAD Studio 2007 (the
utility is installed with CodeGear C++Builder 2007 and has the following path: <Program
Files>\CodeGear\RAD Studio\5.0\Bin\TDstrp32.exe).
To create external .tds files for the modules of your Win32 Delphi application, do the following:
1. Compile your application with TD32 debug information as described above.
2. Apply the StripTDS or TDstrp32 utility to each compiled executable and DLL.
© 2011 SmartBear Software
smartbear.com/support
134
Preparing Applications for AQtrace
To process all EXE and DLL files in the desired folder and its subfolders using the StripTDS
utility, use the following command:
StripTDS.exe -r -w C:\MyApp\*.exe;C:\MyApp\*.dll
To do this using the TDstrp32 utility, run the following command:
for /r "C:\MyApp" %f in (*.exe *.dll) do TDstrp32.exe -s "%~ff"
or this one if processing is done from a batch file:
for /r "C:\MyApp" %%f in (*.exe *.dll) do (
TDstrp32.exe -s "%%~ff"
)
There is no need to ship the generated .tds files along with the release version of your application to
users. Just copy them along with the appropriate binary modules into the build storage (that is, each .tds file
should reside in the folder in which its executable file is). For more information on creating build storages,
see Organizing Build Storage.
External Debug Information (SYM Files)
.Sym files are generated from .map files, which are created by the Delphi compiler. You should then
convert each .map file to a .sym file by using the MapSym utility that is included in Windows SDK or
Microsoft Visual Studio 2005:
●
You can download the Windows
(http://www.microsoft.com/downloads).
●
If you have Visual Studio 2005, you can find this utility in the following folder:
SDK
package
from
Microsoft’s
web
site
<Program Files>\Microsoft Visual Studio 8\Common7\Tools\Bin\MapSym.Exe
So, to create .sym files, you should first compile your Delphi application for .map files and then convert
these files to the .sym format. Below is a detailed description:
1. Change your Delphi project’s settings to create .map files:
a. Open your Win32 project in Delphi 2007.
b. Select Project | Configuration Manager from the main menu. In the ensuing Build
Configuration Manager dialog, choose the configuration that you will use to build the release
version of your application:
smartbear.com
AQtrace by SmartBear Software
Compiling Applications With Debug Information
135
c. Select Project | Options from Delphi’s main menu. This will open the Project Options
dialog.
d. Select the Linker category in the tree view on the left, and then select Detailed in the Map
file section:
e. Press OK to save the changes and to close the dialog.
© 2011 SmartBear Software
smartbear.com/support
136
Preparing Applications for AQtrace
f.
Recompile your application.
Delphi will create the .map files during application compilation.
2. Apply MapSym.exe to each generated .map file. To convert a .map file to the appropriate .sym
file, use the following command line:
MapSym.exe -o MyFile.sym MyFile.map
-- or -MapSym.exe MyFile.map
After you create a .sym file, put it along with the appropriate executable or DLL into the build storage
(that is, each .sym file should reside in the folder in which its executable file is). For more information on
creating build storages, see Organizing Build Storage. Note, there is no need to distribute the generated .map
or .sym files with your application.
Compiling Borland Delphi 2005 and 2006 for Win32 Applications With Debug
Information
This topic explains how you can compile a Delphi application with debug information for AQtrace. The
topic concerns applications created in Borland Delphi 2005 and 2006 for Win32. To learn how to prepare
applications created with other Delphi versions, see Compiling Applications With Debug Information.
The Delphi compiler generates debug information in the TD32 format. Debug info of this type is
compiled into your executables. Besides TD32, Delphi can generate .map files that can then be converted to
.sym files that store information on the application’s functions. In addition, using special utilities
(StripTDS.exe or TDstrp32.exe) you can extract TD32 debug information from binary modules and store it to
external .tds files.
AQtrace can work with all of these formats. However, we recommend that you use external .tds or .sym
files for release builds of your products. This will decrease the overall size of your executables. The TD32
format of debug information compiled into executables can be used for intermediate or special builds. Below
is a detailed description of how to change compiler options to use the desired format of debug information.
AQtrace is not compatible with third-party tools that modify the binary code of your application,
for example, to include a custom exception handling mechanism. An example of such a tool is
EurekaLog. We recommend that you generate the debug information for your application before
processing it with such tools.
Internal Debug Information (TD32)
To compile your Win32 Delphi application with TD32 debug information:
1. Open your project in Borland Delphi IDE.
2. Select Project | Options from the main menu.
3. In the resulting Project Options dialog, select the Compiler category from the tree view on the
left.
4. Select the Debug information and Local symbols check boxes in the Debugging section.
5. To trace VCL routines, select the Use Debug DCUs check box in the Debugging section. If you
leave this option unchecked, AQtrace will be able to trace only those classes that are defined in
your application.
smartbear.com
AQtrace by SmartBear Software
Compiling Applications With Debug Information
137
6. Select the Linker category from the tree on the left of the Project Options dialog.
7. In the EXE and DLL options section, select the Include TD32 debug info check box:
© 2011 SmartBear Software
smartbear.com/support
138
Preparing Applications for AQtrace
8. Press OK to save the changes and to close the dialog.
9. Rebuild your application.
After you compile your modules, you should place them in the build storage (see Organizing Build
Storage). Remember to recompile the release version of your application without TD32 debug information in
order to reduce the application size.
External Debug Information (TDS Files)
To generate .tds files you can apply either SmartBear’s StripTDS utility or Turbo Debugger 32-bit
Symbol Table Stripper utility. These two utilities perform the same actions - remove debug information from
the binary files and save it to separate .tds files. However, TDstrp32 utility can only process one file at a time
whereas StripTDS utility supports file masks and recursive processing.
Note: Both utilities only work with those sections in the binary files that contain debug information.
They do not change the code and data sections, so your modules will still work as designed.
The StripTDS utility is shipped along with AQtrace, its executable is <AQtrace>\Bin\StripTDS.exe. The
Turbo Debugger 32-bit Symbol Table Stripper utility is supplied with Borland Developer Studio 2006 (the
utility is installed with Borland C++Builder 2006 and has the following path: <Program
Files>\Borland\BDS\4.0\Bin\TDstrp32.exe).
To create external .tds files for the modules of your Win32 Delphi application, do the following:
1. Compile your application with TD32 debug information as described above.
2. Apply the StripTDS or TDstrp32 utility to each compiled executable and DLL.
To process all EXE and DLL files in the desired folder and its subfolders using the StripTDS
smartbear.com
AQtrace by SmartBear Software
Compiling Applications With Debug Information
139
utility, use the following command:
StripTDS.exe -r -w C:\MyApp\*.exe;C:\MyApp\*.dll
To do this using the TDstrp32 utility, run the following command:
for /r "C:\MyApp" %f in (*.exe *.dll) do TDstrp32.exe -s "%~ff"
or this one if processing is done from a batch file:
for /r "C:\MyApp" %%f in (*.exe *.dll) do (
TDstrp32.exe -s "%%~ff"
)
There is no need to ship the generated .tds files along with the release version of your application to
users. Just copy them along with the appropriate binary modules into the build storage (that is, each .tds file
should reside in the folder in which its executable file is). For more information on creating build storages,
see Organizing Build Storage.
External Debug Information (SYM Files)
.Sym files are generated from .map files, which are created by the Delphi compiler. You should then
convert each .map file to a .sym file by using the MapSym utility that is included in Windows SDK or
Microsoft Visual Studio 2005:
●
You can download the Windows
(http://www.microsoft.com/downloads).
●
If you have Visual Studio 2005, you can find this utility in the following folder:
<Program Files>\Microsoft Visual Studio 8\Common7\Tools\Bin\MapSym.Exe
SDK
package
from
Microsoft’s
web
site
So, to create .sym files, you should first compile your Delphi application for .map files and then convert
these files to the .sym format. Below is a detailed description:
1. Change your Delphi project’s settings to create .map files:
a. Open your project in Borland Delphi IDE.
b. Select Project | Options from Delphi’s main menu. This will open the Project Options
dialog.
c. Select the Linker category in the tree view on the left, and then select Detailed in the Map
file section:
© 2011 SmartBear Software
smartbear.com/support
140
Preparing Applications for AQtrace
d. Press OK to save the changes and to close the dialog.
e. Recompile your application.
Delphi will create the .map files during application compilation.
2. Apply MapSym.exe to each generated .map file. To convert a .map file to the appropriate .sym
file, use the following command line:
MapSym.exe -o MyFile.sym MyFile.map
-- or -MapSym.exe MyFile.map
After you create a .sym file, put it along with the appropriate executable or DLL into the build storage
(that is, each .sym file should reside in the folder in which its executable file is). For more information on
creating build storages, see Organizing Build Storage. Note, there is no need to distribute the generated .map
or .sym files with your application.
Compiling Borland Delphi Applications With Debug Information
This topic explains how to generate a Delphi application with debug information for AQtrace. The topic
concerns Borland Delphi ver. 3.0 - 7.0. To learn how to prepare applications created with other Delphi
versions, see Compiling Applications With Debug Information.
The Delphi compiler generates debug information in the TD32 format. Debug info of this type is
compiled into your executables. Besides TD32, Delphi can generate .map files that can then be converted to
.sym files that store information on the application’s functions. In addition, using a special utility
(StripTDS.exe) you can extract TD32 debug information from binary modules and store it to external .tds
smartbear.com
AQtrace by SmartBear Software
Compiling Applications With Debug Information
141
files.
AQtrace can work with all of these formats. However, we recommend that you use external .tds or .sym
files for release builds of your products. This will decrease the overall size of your executables. The TD32
format of debug information compiled into executables can be used for intermediate or special builds. Below
is a detailed description of how to change compiler options to use the desired format of debug information.
AQtrace is not compatible with third-party tools that modify the binary code of your application,
for example, to include a custom exception handling mechanism. An example of such a tool is
EurekaLog. We recommend that you generate the debug information for your application before
processing it with such tools.
Internal Debug Information (TD32)
To compile an application with TD32 debug information:
1. Open your project in Borland Delphi.
2. Choose Project | Options from Delphi’s main menu and select the Compiler tabbed page.
3. Select the Debug information check box in the Debugging section of the Compiler page.
4. Select the Local Symbols check box in the Debugging section.
5. To trace VCL functions, select the Use Debug DCUs check box in the Debugging section (this
check box is available in Delphi 5 or later). Otherwise, AQtrace will be able to profile only those
classes that are defined in your application.
6. Switch to the Linker tabbed page. In the EXE and DLL options section, select the Include TD32
© 2011 SmartBear Software
smartbear.com/support
142
Preparing Applications for AQtrace
debug info check box:
7. Rebuild your application.
After you compile your modules, you should place them in the build storage. For more information on
this, see Organizing Build Storage.
External Debug Information (TDS Files)
To generate .tds files you can apply SmartBear’s StripTDS utility. This utility removes debug
information from the binary files and saves it to separate .tds files.
Note: The utility only works with those sections in the binary files that contain debug information. It
does not change the code and data sections, so your modules will still work as designed.
The StripTDS utility is shipped along with AQtrace, its executable is <AQtrace>\Bin\StripTDS.exe.
To create external .tds files for the modules of your Win32 Delphi application, do the following:
1. Compile your application with TD32 debug information as described above.
2. Apply the StripTDS utility to each compiled executable and DLL.
To process all EXE and DLL files in the desired folder and its subfolders using the StripTDS
utility, use the following command:
StripTDS.exe -r -w C:\MyApp\*.exe;C:\MyApp\*.dll
There is no need to ship the generated .tds files along with the release version of your application to
users. Just copy them along with the appropriate binary modules into the build storage (that is, each .tds file
smartbear.com
AQtrace by SmartBear Software
Compiling Applications With Debug Information
143
should reside in the folder in which its executable file is). For more information on creating build storages,
see Organizing Build Storage.
External Debug Information (SYM Files)
.Sym files are generated from .map files, which are created by the Delphi compiler. You should then
convert each .map file to a .sym file by using the MapSym utility that is included in Windows SDK or
Microsoft Visual Studio 2005:
●
You can download the Windows
(http://www.microsoft.com/downloads).
●
If you have Visual Studio 2005, you can find this utility in the following folder:
SDK
package
from
Microsoft’s
web
site
<Program Files>\Microsoft Visual Studio 8\Common7\Tools\Bin\MapSym.Exe
So, to create .sym files, you should first compile your Delphi application for .map files and then convert
these files to the .sym format. Below is a detailed description:
1. Change your Delphi project’s settings to create .map files:
●
Open your application in Borland Delphi.
●
Choose Project | Options from Delphi’s main menu and select the Linker tabbed page.
●
On the Linker page, select Detailed in the Map file section.
●
Press OK to save the changes and to close the dialog.
●
Recompile your application.
Delphi will create the .map files during application compilation.
2. Apply MapSym.exe to each generated .map file. To convert a .map file to the appropriate .sym
© 2011 SmartBear Software
smartbear.com/support
144
Preparing Applications for AQtrace
file, use the following command line:
MapSym.exe -o MyFile.sym MyFile.map
-- or -MapSym.exe MyFile.map
After you create a .sym file, put it along with the appropriate executable or DLL into the build storage
(that is, each .sym file should reside in the folder in which its executable file is). For more information on
creating build storages, see Organizing Build Storage.
Compiling Embarcadero C++Builder XE Applications With Debug Information
This topic explains how to include debug information in applications created with Embarcadero
C++Builder XE and compile these applications for AQtrace. To learn how to prepare applications created
with other C++Builder versions, see Compiling Applications With Debug Information.
To prepare an Embarcadero C++Builder XE application for AQtrace, you must first ensure that it
includes debug info. Follow these steps:
1. Open your project in Embarcadero C++Builder XE.
2. Select Project | Options from the main menu. This will open the Project Options dialog.
3. To set the C++ compiler options, select the C++ Compiler | Debugging category from the tree
view on the left of the dialog.
4. To include symbolic debug information, set the Debug information option to True. In addition, to
refer this information to source line numbers, set the Debug line number information option to
True.
smartbear.com
AQtrace by SmartBear Software
Compiling Applications With Debug Information
145
5. (Optional.) To generate stack frames when using the C++ compiler, switch to the C++ Compiler
category and set the Standard stack frames option to True.
© 2011 SmartBear Software
smartbear.com/support
146
Preparing Applications for AQtrace
6. To set the Delphi compiler options, select the Delphi Compiler | Compiling category from the
tree view on the left of the dialog.
7. To include symbolic debug information, set the Debug information option to True. In addition, to
refer this information to source line numbers, set the Local symbols option to True.
smartbear.com
AQtrace by SmartBear Software
Compiling Applications With Debug Information
147
8. (Optional.) To generate stack frames when using the Delphi compiler, switch to the Delphi
Compiler | Compiling category and set the Stack frames to True.
© 2011 SmartBear Software
smartbear.com/support
148
Preparing Applications for AQtrace
9. To set the linker options, switch to the C++ Linker category and set the Full debug information
option to True.
smartbear.com
AQtrace by SmartBear Software
Compiling Applications With Debug Information
149
10. Once you have set the compiler and linker options correctly, rebuild your application.
When your application is ready for release, remember to recompile it without debug information to
reduce the application size.
Compiling Embarcadero C++Builder 2010 Applications With Debug Information
This topic explains how to include debug information in applications created with Embarcadero
C++Builder 2010 and compile these applications for AQtrace. To learn how to prepare applications created
with other C++Builder versions, see Compiling Applications With Debug Information.
To prepare an Embarcadero C++Builder 2010 application for AQtrace, you must first ensure that it
includes debug info. Follow these steps:
1. Open your project in Embarcadero C++Builder 2010.
2. Select Project | Options from the main menu. This will open the Project Options dialog.
3. To set the C++ compiler options, select the C++ Compiler | Debugging category from the tree
view on the left of the dialog.
4. To include symbolic debug information, set the Debug information option to True. In addition, to
refer this information to source line numbers, set the Debug line number information option to
True.
© 2011 SmartBear Software
smartbear.com/support
150
Preparing Applications for AQtrace
5. (Optional.) To generate stack frames when using the C++ compiler, switch to the C++ Compiler
category and set the Standard stack frames option to True.
smartbear.com
AQtrace by SmartBear Software
Compiling Applications With Debug Information
151
6. To set the Delphi compiler options, select the Delphi Compiler | Compiling category from the
tree view on the left of the dialog.
7. To include symbolic debug information, set the Debug information option to True. In addition, to
refer this information to source line numbers, set the Local symbols option to True.
© 2011 SmartBear Software
smartbear.com/support
152
Preparing Applications for AQtrace
8. (Optional.) To generate stack frames when using the Delphi compiler, switch to the Delphi
Compiler | Compiling category and set the Stack frames to True.
smartbear.com
AQtrace by SmartBear Software
Compiling Applications With Debug Information
153
9. To set the linker options, switch to the C++ Linker category and set the Full debug information
option to True.
© 2011 SmartBear Software
smartbear.com/support
154
Preparing Applications for AQtrace
10. Once you have set the compiler and linker options correctly, rebuild your application.
When your application is ready for release, remember to recompile it without debug information to
reduce the application size.
Compiling CodeGear C++Builder 2009 Applications With Debug Information
This topic explains how to include debug information in applications created with CodeGear C++Builder
2009 and compile these applications for AQtrace. To learn how to prepare applications created with other
C++Builder versions, see Compiling Applications With Debug Information.
To prepare a CodeGear C++Builder 2009 application for AQtrace, you must first ensure that it includes
debug info. Follow these steps:
1. Open your project in CodeGear C++Builder 2009.
2. Select Project | Options from the main menu. This will open the Project Options dialog.
3. To set the C++ compiler options, select the C++ Compiler | Debugging category from the tree
view on the left of the dialog.
4. To include symbolic debug information, set the Debug information option to True. In addition, to
refer this information to source line numbers, set the Debug line number information option to
True.
smartbear.com
AQtrace by SmartBear Software
Compiling Applications With Debug Information
155
5. (Optional.) To generate stack frames when using the C++ compiler, switch to the C++ Compiler
category and set the Standard stack frames option to True.
© 2011 SmartBear Software
smartbear.com/support
156
Preparing Applications for AQtrace
6. To set the Delphi compiler options, select the Delphi Compiler | Compiling category from the
tree view on the left of the dialog.
7. To include symbolic debug information, set the Debug information option to True. In addition, to
refer this information to source line numbers, set the Local symbols option to True.
smartbear.com
AQtrace by SmartBear Software
Compiling Applications With Debug Information
157
8. (Optional.) To generate stack frames when using the Delphi compiler, switch to the Delphi
Compiler | Compiling category and set the Stack frames to True.
© 2011 SmartBear Software
smartbear.com/support
158
Preparing Applications for AQtrace
9. To set the linker options, switch to the C++ Linker category and set the Full debug information
option to True.
smartbear.com
AQtrace by SmartBear Software
Compiling Applications With Debug Information
159
10. Once you have set the compiler and linker options correctly, rebuild your application.
When your application is ready for release, remember to recompile it without debug information to
reduce the application size.
Compiling CodeGear C++Builder 2007 Applications With Debug Information
This topic explains how to include debug information in applications created with CodeGear C++Builder
2007 and compile these applications for AQtrace. To learn how to prepare applications created with other
C++Builder versions, see Compiling Applications With Debug Information.
To prepare a CodeGear C++Builder 2007 application for AQtrace, you must first ensure that it includes
debug info. Follow these steps:
1. Open your project in CodeGear C++Builder 2007.
2. Select Project | Options from the main menu. This will open the Project Options dialog.
3. To set the C++ compiler options, select the C++ Compiler | Debugging category from the tree
view on the left of the dialog.
4. To include symbolic debug information, check Debug information. In addition, to refer this
information to source line numbers, check Debug line number information.
© 2011 SmartBear Software
smartbear.com/support
160
Preparing Applications for AQtrace
5. (Optional.) To generate stack frames when using the C++ compiler, switch to the C++ Compiler |
General Compilation category and check Standard stack frames.
smartbear.com
AQtrace by SmartBear Software
Compiling Applications With Debug Information
161
6. To set the Delphi compiler options, select the Delphi Compiler | Compiling category from the
tree view on the left of the dialog.
7. To include symbolic debug information, check Debug information in the Delphi Compiler |
Compiling category. In addition, to refer this information to source line numbers, check Local
debug symbols.
© 2011 SmartBear Software
smartbear.com/support
162
Preparing Applications for AQtrace
8. (Optional.) To generate stack frames when using the Delphi compiler, switch to the Delphi
Compiler | Compiling category and check Generate stack frames.
smartbear.com
AQtrace by SmartBear Software
Compiling Applications With Debug Information
163
9. To set the linker options, switch to the Linker | Linking category and check Full debug
information.
© 2011 SmartBear Software
smartbear.com/support
164
Preparing Applications for AQtrace
10. Once you have set the compiler and linker options correctly, rebuild your application.
When your application is ready for release, remember to recompile it without debug information to
reduce the application size.
Compiling Borland C++Builder 2006 Applications With Debug Information
This topic explains how to include debug information in applications created with Borland C++Builder
2006 and compile these applications for AQtrace. To learn how to prepare applications created with other
C++Builder versions, see Compiling Applications With Debug Information.
Borland C++Builder can generate debug information as an external .TDS file. This is one of the debug
information formats supported by AQtrace.
Below is a detailed description of how to change compiler options to use the TDS format of debug
information.
Note: AQtrace is not compatible with third-party tools that modify the binary code of your application,
for example, to include a custom exception handling mechanism. An example of such a tool is
EurekaLog. We recommend that you generate the debug information for your application before
processing it with such tools.
To compile your C++Builder 2006 application with TDS debug information, follow these steps:
smartbear.com
AQtrace by SmartBear Software
Compiling Applications With Debug Information
165
1. Open your project in Borland C++Builder 2006.
2. Select Project | Options from the main menu. This will open the Project Options dialog.
3. To set the C++ compiler options, select the C++ Compiler (bcc32) | Debugging category from
the tree view on the left of the dialog.
4. To include symbolic debug information, check Source debugging. In addition, to refer this
information to source line numbers, check Debug line numbers:
5. To set the Pascal compiler options, select the Pascal Compiler (DCC32) | Debugging category
from the tree view on the left of the dialog.
6. To include symbolic debug information, check Debug information. In addition, to refer this
information to source line numbers, check Local symbol information:
© 2011 SmartBear Software
smartbear.com/support
166
Preparing Applications for AQtrace
7. To set the linker options, switch to the Linker (ilink32) | Linking category and select Full debug
information:
smartbear.com
AQtrace by SmartBear Software
Compiling Applications With Debug Information
167
8. Press OK to save the changes and close the dialog.
9. Rebuild your application.
During compilation, C++Builder will generate the .TDS file containing debug information and save it in
the folder where the compiled executable will reside.
There is no need to ship the generated .TDS files with your application. However, you should place these
files along with the executable modules in the build storage. For more information on this, see Organizing
Build Storage.
Compiling Borland C++Builder Applications With Debug Information
This topic explains how to include debug information in applications created with Borland C++Builder
ver. 3 - 6 and compile these applications for AQtrace. To learn how to prepare applications created with
other C++Builder versions, see Compiling Applications With Debug Information.
Borland C++Builder can generate debug information as an external .TDS file. This is one of the debug
information formats supported by AQtrace.
Below is a detailed description of how to change compiler options to use the TDS format of debug
information.
Note: AQtrace is not compatible with third-party tools that modify the binary code of your application,
for example, to include a custom exception handling mechanism. An example of such a tool is
EurekaLog. We recommend that you generate the debug information for your application before
© 2011 SmartBear Software
smartbear.com/support
168
Preparing Applications for AQtrace
processing it with such tools.
To compile your application with TDS debug information:
1. Open your project in Borland C++Builder.
2. Choose Project | Options from C++Builder’s main menu. This will invoke the Project Options
dialog.
3. In the dialog, switch to the Compiler tabbed page.
4. To include symbolic debug information, in the Debugging section of the Compiler page, select
the Debug information check box. In addition, to refer this information to source line numbers,
select the Line Information check box.
5. To set the linker options, switch to the Linker tabbed page.
6. In the Linking options group, select the Create Debug Information box.
smartbear.com
AQtrace by SmartBear Software
Compiling Applications With Debug Information
169
7. Press OK to save your changes and to close the dialog.
8. Recompile your application. During compilation C++Builder will generate the .TDS file with
debug information in the folder where the compiled executable will reside.
There is no need to ship the generated .TDS files with your application. However, you should place these
files along with the executable modules in the build storage. For more information on this, see Organizing
Build Storage.
Compiling Intel C++ Applications With Debug Information
The Intel C++ 7.0 compiler is tightly integrated with Microsoft Visual Studio. To prepare an Intel C++
application for AQtrace, you should perform the same actions, which you perform to prepare a Visual C++
application. For complete information, review the following topics:
Compiling Microsoft Visual C++ 6.0 Applications With Debug Information
Compiling Microsoft Visual C++ 7.x Applications With Debug Information
After you compiled your application with debug information, you should place the debug information
files along with executable modules in the build storage. For more information on this, see Organizing Build
Storage.
About StripTDS
This topic provides an overview of the StripTDS utility, explains how it works and describes its
© 2011 SmartBear Software
smartbear.com/support
170
Preparing Applications for AQtrace
command line and exit codes.
StripTDS - Overview
StripTDS is a simple command-line utility that strips TD32 debug information from executables and
libraries created with the Delphi compiler and saves it in separate TDS files. Thus, it enables you to create
release builds of Delphi applications with external debug information. The utility is shipped with
AQtrace and can be found in the <AQtrace>\Bin folder.
The Delphi compiler uses the TD32 format of debug information, which is compiled directly in the
executable modules and libraries. This makes the resulting executable significantly (up to several megabytes)
larger in size than those without embedded debbug information. The StripTDS utility overrides this
inconvenience. It lets you strip debug information from compiled modules and save it to external TDS files.
In this way, you can create release builds of Delphi applications with debug information kept in separate
files.
We recommend that you run the StripTDS utility as a part of the application’s build process. For
example, if you use CodeGear Delphi 2007 or 2009, you could invoke StripTDS from the post-build event of
your project. If you use an automated build tool such as Automated Build Studio, you could run StripTDS
right after the build step that performs the application’s compilation.
The .tds files generated by StripTDS must reside in the same folders as the application’s binary files.
However, there is no need to distribute them with your application. Yet, you should copy both the binary
files and .tds files to the build storage.
How StripTDS Modifies Binary Modules
Likewise AQtrace Packager, the StripTDS utility also modifies binary modules. StripTDS changes
binary modules by removing debug information from them, it does not change binary code. Let’s see how
this is done.
Each executable module - EXE, DLL or any other binary module (PE file in Windows terminology) consists of sections. The sections contain various information and are used for various purposes. Some of the
sections contain binary code generated by the compiler, this code is executed when the section is loaded in
memory. Some other sections contain data (like string constants or integer values) that are used by the binary
code. One more section type holds helper information and is used for helper purposes.
Delphi compiler generates debug information in TD32 format and stores it to special sections within the
resulting PE file. Delphi places debug information into the sections that are located at the end of the file.
StripTDS reads debug information from these sections and saves it into a separate .tds file. Then it removes
the debug information sections from the PE module and corrects the module’s headers so that they contain
the appropriate info. That is, StripTDS only works with sections that store debug info. It does not touch the
code and data sections, so your application will work the way it was programmed.
StripTDS Command Line
The command line of the StripTDS utility is as follows:
StripTDS.exe [-r] [-w] module [TDS_file]
module
The name of the compiled module that contains TD32 debug information to be stripped off. If you
need to process several modules, use wildcards (* and ?) to specify a mask. For example, the *.exe
mask matches all EXE files. To match all files, use the * mask.
TDS_file
This argument is only used if module holds a single file name. It specifies the name of the TDS file
smartbear.com
AQtrace by SmartBear Software
Compiling Applications With Debug Information
171
to which the extracted debug information should be saved. The destination folder for the TDS file
must exist on the disk.
If you do not specify this parameter, the debug information will be saved to a file with the same
name as module but with the .tds extension.
This argument is ignored if module specifies a file mask or the –r argument is used.
You can specify both absolute file paths (starting with the drive letter) and paths that are relative to
the current working folder (not necessarily the StripTDS folder). Using absolute paths is
recommended.
If a file path includes spaces, it must be enclosed in quotes, for example, "C:\My App\MyApp.exe".
-r (or /r)
If this argument is specified, StripTDS will process the files specified by the module argument as
well as the appropriate files in all subfolders of the folder that contains the module file(s).
-w (or /w)
If this argument is specified, StripTDS will overwrite existing TDS file(s).
Here are some examples of running the StripTDS utility:
•
The following command removes the debug information from the C:\MyApp\MyApp.exe file and
saves it to the TDS file of the same name. If the TDS file already exists, it is overwritten:
"C:\Program Files\SmartBear\AQtrace\Bin\StripTDS.exe" /w
C:\MyApp\MyApp.exe
•
The following command removes the debug information from the C:\MyApp\MyApp.exe file and
saves it to the C:\DebugInfo\MyApp\MyApp.tds file. If the TDS file already exists, it is left
unchanged:
"C:\Program Files\SmartBear\AQtrace\Bin\StripTDS.exe"
C:\MyApp\MyApp.exe C:\DebugInfo\MyApp\MyApp.tds
•
The following command removes the debug information from all EXE and DLL files in the
C:\MyApp folder and all its subfolders and saves it to the TDS files of the same name in the
appropriate folders. Existing TDS files are overwritten:
"C:\Program Files\SmartBear\AQtrace\Bin\StripTDS.exe" /r /w
C:\MyApp\*.exe;C:\MyApp\*.dll
StripTDS Exit Codes
StripTDS uses the following exit codes:
Code
Description
0
The debug information was stripped off successfully.
Nonzero
An error occurred during debug information extraction. For example, the specified module
does not contain TD32 debug information or contains invalid or unknown debug information.
© 2011 SmartBear Software
smartbear.com/support
172
Preparing Applications for AQtrace
.NET Compilers
Compiling Microsoft Visual C# 2005, 2008 and 2010 Applications With Debug
Information
This topic explains how to compile Microsoft Visual C# 2005б 2008 and 2010 applications with debug
information for AQtrace. To learn how to prepare applications created with Visual C# 7.x, see Compiling
Microsoft Visual C# 7.x Applications With Debug Information.
To add debug information to your Visual C# 2005, Visual C# 2008 or Visual C# 2010 application,
follow these steps:
1. Open your project in Visual Studio 2005, Visual Studio 2008 or Visual Studio 2010.
2. Select Build | Configuration Manager from the main menu. This will open the Configuration
Manager dialog. Select the Debug configuration for your project:
Close the dialog.
3. Right-click the project in the Solution Explorer and select Properties from the context menu.
This will open the Property Pages dialog.
4. In this dialog, open the Build page and select Active (Debug) from the Configuration dropdown
list at the top of the dialog. Then, on the same Build page, disable the Optimize code checkbox and
click the Advanced button.
smartbear.com
AQtrace by SmartBear Software
Compiling Applications With Debug Information
173
5. In the resulting Advanced Build Settings dialog, select either full or pdb-only in the Debug Info
dropdown list box.
© 2011 SmartBear Software
smartbear.com/support
174
Preparing Applications for AQtrace
6. Click OK to close the dialog.
7. If your application is a WPF Browser application (XBAP), then you should change the security
settings: switch to the Security page and enable the This is a full trust application setting:
8. Save the changes in the project. Recompile the application.
When your application is ready for final delivery, remember to compile it without debug information to
smartbear.com
AQtrace by SmartBear Software
Compiling Applications With Debug Information
175
reduce the overall size of the application.
Compiling Microsoft Visual C# 7.x Applications With Debug Information
This topic explains how to compile Visual C# 7.x applications with debug information for AQtrace. To
learn how to prepare applications created with Visual C# 2005, 2008 or 2010, see Compiling Microsoft
Visual C# 2005, 2008 and 2010 Applications With Debug Information.
To add debug information to your Visual C# 7.x application, follow these steps:
1. Open your project in Visual Studio 7.x.
2. Select Build | Configuration Manager from the main menu. This will open the Configuration
Manager dialog. Select the Debug configuration for your project:
Close the dialog.
3. Right-click the project in the Solution Explorer and select Properties from the context menu.
This will open the Property Pages dialog.
4. In the dialog, open the Configuration Properties | Build page and select Active (Debug) from the
Configuration dropdown list at the top of the dialog. Then, in the Configuration Properties |
Build page, turn on the Generate debugging information option and disable Optimize Code.
© 2011 SmartBear Software
smartbear.com/support
176
Preparing Applications for AQtrace
5. Press OK to save settings. Recompile the application.
When your application is ready for final delivery, remember to compile it without debug information to
reduce overall application size.
Compiling Microsoft Visual C++ 2005, 2008 and 2010 Applications With Debug
Information
This topic explains how to compile Visual C++ 2005, 2008 and 2010 applications with debug
information for AQtrace. To learn how to prepare applications created with Visual C++ 7.x, see Compiling
Microsoft Visual C++ 7.x Applications With Debug Information. To learn how to prepare applications
created with Visual C++ 6.0 or earlier, see Compiling Microsoft Visual C++ 6.0 Applications With Debug
Information.
Default settings created by Microsoft Visual Studio 2005, Visual Studio 2008 or Visual Studio 2010 for
a new Visual C++ 2005, 2008 or 2010 application already contain all necessary information for generating
debug information. So, if you do not change the compiler settings, you can compile and profile your Visual
C++ 2005 or 2008 application as is. However, we recommend that you change the active configuration to
Release because this configuration is used to build the final version of an application.
If you are not sure whether your application’s compiler settings were changed, you can follow these
steps to make sure that your application is compiled with debug information:
1. Open your project in Visual Studio 2005 Visual Studio 2008 or Visual Studio 2010.
2. Select Build | Configuration Manager from the main menu. This will open the Configuration
Manager dialog.
In the dialog, select the Release configuration (that is, the configuration that is used to build the
smartbear.com
AQtrace by SmartBear Software
Compiling Applications With Debug Information
177
release version of your product):
Close the dialog.
Note: The debug information will be generated as an external PDB file, so it will not
increase the size of your executable module.
3. Right-click the project in the Solution Explorer and select Properties from the context menu.
This will call the Property Pages dialog.
4. In the dialog:
a. From the Configuration dropdown list, select the configuration that you will use to build the
final version of your application (typically, this is the Release configuration).
b. Switch to the Configuration Properties | C/C++ | General page and set Debug Information
Format to Program Database (/Zi) or to Program Database for Edit & Continue (/ZI). For
more information on these options, review the Visual Studio documentation.
© 2011 SmartBear Software
smartbear.com/support
178
Preparing Applications for AQtrace
c. Open the Configuration Properties | Linker | Debugging property page and set the
Generate Debug Info option to Yes (/DEBUG).
smartbear.com
AQtrace by SmartBear Software
Compiling Applications With Debug Information
179
5. Click OK to save the settings and to close the dialog.
6. Rebuild your application. The compiler will generate debug information as an external PDB file
and save this file to the folder in which the compiled executable resides.
There is no need to distribute the generated PDB files with your application. However, you should place
these files along with the compiled executable modules in the build storage. For more information on this,
see Organizing Build Storage.
Compiling Microsoft Visual C++ 7.x Applications With Debug Information
This topic explains how to compile Visual C++ 7.x applications with debug information for AQtrace. To
learn how to prepare applications created with Visual C++ 2005 (8.0), 2008 (9.0) or 2010 (10.0), see
Compiling Microsoft Visual C++ 2005, 2008 and 2010 Applications With Debug Information. To learn how
to prepare applications created with Visual C++ 6.0 or earlier, see Compiling Microsoft Visual C++ 6.0
Applications With Debug Information.
Default settings created by Microsoft Visual Studio for a new Visual C++ .NET application already hold
all necessary information for generating debug information. So, if you do not change the compiler settings,
you can compile and profile your Visual C++ .NET application as is. The only thing we would recommend is
to change the active configuration to Release, because the Release configuration is typically used to build the
final version of the application.
If you are not sure whether your application’s compiler settings were changed, you can follow the steps
described in this topic to make certain that your application is compiled with debug information:
1. Open your project in Visual Studio .NET.
2. Select Build | Configuration Manager from the main menu. This will open the Configuration
© 2011 SmartBear Software
smartbear.com/support
180
Preparing Applications for AQtrace
Manager dialog. Select the Release configuration for your project:
Close the dialog.
Note: The debug information will be generated as an external PDB file, so it will not
increase the size of your executable.
3. Right-click the project in the Solution Explorer and select Properties from the context menu.
This will call the Property Pages dialog.
4. In the dialog,
a. In the Configuration box, specify the configuration, which you will use to compile the release
version of your application.
b. Switch to the Configuration Properties | C/C++ | General page and set the Debug
Information Format option either to Program Database (/Zi) or to Program Database for
Edit & Continue (/ZI). For more information on these options, see Visual Studio .NET
documentation.
smartbear.com
AQtrace by SmartBear Software
Compiling Applications With Debug Information
181
c. Open the Configuration Properties | Linker | Debug property page and set the Generate
Debug Info option to Yes (/DEBUG).
© 2011 SmartBear Software
smartbear.com/support
182
Preparing Applications for AQtrace
5. Click OK to save the settings and to close the dialog.
6. Recompile your application. The Visual C++ compiler will generate debug information as external
PDB files and save them to the folder in which the compiled executable resides.
There is no need to ship the compiled PDB files with your application. However, you should add them
along with the executable modules to your build storage. For more information on this, see Organizing Build
Storage.
Compiling Microsoft Visual Basic 2005, 2008 and 2010 Applications With Debug
Information
This topic explains how to compile Microsoft Visual Basic 2005, 2008 and 2010 applications with debug
information for AQtrace. To learn how to prepare applications created with Visual Basic 6.0, see Compiling
Microsoft Visual Basic 6.0 Applications With Debug Information. To learn how to prepare applications
created with Visual Basic 7.x, see Compiling Microsoft Visual Basic 7.x Applications With Debug
Information.
To add debug information to your Visual Basic 2005, Visual Basic 2008 or Visual Basic 2010
application, follow these steps:
1. Open your project in Visual Studio 2005, Visual Studio 2008 or Visual Studio 2010.
2. Select Build | Configuration Manager from the main menu. This will open the Configuration
Manager dialog. Select the Debug configuration for your project:
Close the dialog.
3. Right-click the project in the Solution Explorer and select Properties from the context menu.
This will open the Property Pages dialog.
smartbear.com
AQtrace by SmartBear Software
Compiling Applications With Debug Information
183
4. In the dialog, open the Build page and select Active (Debug) from the Configuration dropdown
list at the top of the dialog. Then on the same Build page, click the Advanced Compile Options
button.
5. In the resulting Advanced Build Settings dialog, select either Full or pdb-only in the Generate
debug info dropdown list box and clear the Enable optimizations checkbox.
© 2011 SmartBear Software
smartbear.com/support
184
Preparing Applications for AQtrace
6. If your application is a WPF Browser application (XBAP), then you should change the security
settings: switch to the Security page and enable the This is a full trust application setting:
smartbear.com
AQtrace by SmartBear Software
Compiling Applications With Debug Information
185
7. Click OK to close the dialog.
8. Save the changes in the project and recompile the application.
When your application is ready for final delivery, remember to compile it without debug information to
reduce the overall size of the application.
Compiling Microsoft Visual Basic 7.x Applications With Debug Information
This topic explains how to compile Visual Basic 7.x applications with debug information for AQtrace.
To learn how to prepare applications created with Visual Basic 6.0, see Compiling Microsoft Visual Basic
6.0 Applications With Debug Information. To learn how to prepare applications created with Visual Basic
2005, 2008 or 2010, see Compiling Microsoft Visual Basic 2005, 2008 and 2010 Applications With Debug
Information.
To add debug information to your Visual Basic 7.x application, follow these steps:
1. Open your project in Visual Studio 7.x.
2. Select Build | Configuration Manager from the main menu. This will open the Configuration
Manager dialog. Select the Debug configuration for your project:
© 2011 SmartBear Software
smartbear.com/support
186
Preparing Applications for AQtrace
Close the dialog.
3. Right-click the project in the Solution Explorer and select Properties from the context menu.
This will open the Property Pages dialog.
4. In the dialog,
a. Open the Configuration Properties | Build page and select Active (Debug) from the
Configuration dropdown list at the top of the dialog.
b. In the Configuration Properties | Build page enable the Generate debugging information
option.
smartbear.com
AQtrace by SmartBear Software
Compiling Applications With Debug Information
187
c. Switch to the Configuration Properties | Optimizations page and turn off the Enable
Optimizations option.
5. Press OK to save settings and recompile the application.
© 2011 SmartBear Software
smartbear.com/support
188
Preparing Applications for AQtrace
When your application is ready for final delivery, remember to compile it without debug information to
reduce overall application size.
Compiling CodeGear Delphi 2009 for .NET Applications With Debug Information
This topic explains how you can compile CodeGear Delphi 2009 for .NET applications with debug
information for AQtrace. To learn how to prepare applications created with other Delphi versions, see
Compiling Applications With Debug Information.
To add debug information to your Delphi 2009 for .NET application, do the following:
1. Open your project in CodeGear Delphi 2009 for .NET.
2. Select Project | Options from the main menu to display the Project Options dialog.
3. In the resulting Project Options dialog, select Debug in the Build Configuration combo box. This
will load the settings used for debug builds.
4. Select the Delphi Compiler | Compiling category from the tree view on the left of the dialog.
5. In the Debugging group, set the Debug information and Local symbols options to True.
6. To trace VCL routines, set the Use debug .dcus option to True. If you set this option to False,
AQtrace will be able to trace only those classes that are defined in your application.
7. Select the Delphi Compiler | Linking category in the tree on the left of the Project Options dialog
and set the Debug information option to True:
smartbear.com
AQtrace by SmartBear Software
Compiling Applications With Debug Information
189
8. Click OK to close the dialog.
9. Rebuild your application.
When your application is ready for final delivery, do not forget to recompile it without debug
information to reduce the overall application size.
Compiling CodeGear Delphi 2007 for .NET Applications With Debug Information
This topic explains how you can compile CodeGear Delphi 2007 for .NET applications with debug
information for AQtrace. To learn how to prepare applications created with other Delphi versions, see
Compiling Applications With Debug Information.
To add debug information to your Delphi 2007 for .NET application, do the following:
1. Open your project in CodeGear Delphi 2007 for .NET.
2. Select Project | Options from the main menu to display the Project Options dialog.
3. Select the Compiler category from the tree view on the left of the dialog.
4. In the Debugging section, select the Debug information and Local symbols check boxes.
5. To trace VCL routines, select the Use debug DCUILs check box in the Debugging section. If you
clear this check box, AQtrace will be able to trace only those classes that are defined in your
application.
© 2011 SmartBear Software
smartbear.com/support
190
Preparing Applications for AQtrace
6. Select the Linker category in the tree view on the left of the Project Options dialog and enable the
Generate .PDB debug info file option:
smartbear.com
AQtrace by SmartBear Software
Compiling Applications With Debug Information
191
7. Click OK to close the dialog.
8. Rebuild your application.
When your application is ready for final delivery, do not forget to recompile it without debug
information to reduce the overall application size.
Compiling Borland Delphi 2005 and 2006 for .NET Applications With Debug
Information
This topic explains how you can compile Borland Delphi 2005 and 2006 for .NET applications with
debug information for AQtrace. To learn how to prepare applications created with other Delphi versions, see
Compiling Applications With Debug Information.
To add debug information to your Delphi 2005 or 2006 for .NET application, do the following:
1. Open your project in Delphi 2005 or 2006 for .NET.
2. Select Project | Options from the main menu. This will open the Project Options dialog.
3. Select the Compiler category from the tree view on the left of the dialog and enable the following
options:
■
■
Debug information
Local Symbols
■
Use Debug DCUILs
© 2011 SmartBear Software
smartbear.com/support
192
Preparing Applications for AQtrace
4. Select the Linker category and enable the Generate .PDB debug info file option:
smartbear.com
AQtrace by SmartBear Software
Compiling Applications With Debug Information
193
5. Click OK to close the dialog. Recompile your application.
When your application is ready for final delivery, do not forget to compile it without debug information
to reduce the overall application size.
© 2011 SmartBear Software
smartbear.com/support
194
Preparing Applications for AQtrace
Setting Build Number
Error reports contain information on modules and stacks of function calls. In order for AQtrace Viewer,
AQtrace Service or other report analyzers to be able to parse call stack data, they must have access to the
module’s debug information and binary code. To provide this data, you place the compiled modules and
debug info file to a build storage and specify the storage path in the AQtrace Viewer’s and Service’s
settings.
The report contains the modules’ file names and build numbers. When parsing a report, AQtrace Viewer
(or Service) uses the file name and build number to search for an appropriate module in the build storage.
Once the module is found, the Viewer (Service) loads it to memory and used to parse the report. The build
number is important as it lets the Viewer (or Service) to distinguish modules that have the same name, but
are used by different versions of your application.
The build number is part of version information that is defined in resource files included in executable
modules. The build number includes four digits separated by periods, for instance:
Version: 3.12.138.0
The first two numbers are the major and minor versions. The third number is the build version and the
fourth number is called a private part. It is used by software developers for various reasons. In our example,
the major version is 3, the minor version - 12, the build part is 138 and the private part is 0.
You can specify a build number in two following ways:
●
You can use special tools that modify data within compiled executables.
●
You can use the means provided by your compiler, that is, you can modify compiler settings,
resources or source files before building your modules.
An example of a tool that can modify version information within a compiled executable is Automated
Build Studio. It is a build and release management system by SmartBear Software. It helps you automate all
the steps of building an application: from getting source files from a source code control to uploading
compiled installation packages to a web site or recording them on a CD. Automated Build Studio includes a
special operation that lets you easily specify the desired build number for all the executable modules and
libraries that reside in a folder.
If you do not have a special tool, then you can specify the desired build number by using the means
offered by your compiler. The way you do this depends on the compiler: for some compilers you modify the
compiler settings, for other compilers you modify source files or resources. For detailed information on
setting the build number, see documentation on your development tool. The following topics explain how to
specify build numbers for the most popular compilers:
Microsoft Visual C++ 6.0, 7.x, 2005, 2008 and 2010
Microsoft Visual Basic 2005, 2008 and 2010
Microsoft Visual Basic 7.x
Microsoft Visual Basic 6.0
Microsoft Visual C# 2005, 2008 and 2010
Microsoft Visual C# 7.x
Embarcadero Delphi 2010, XE
CodeGear Delphi 2007, 2009 for Win32
smartbear.com
AQtrace by SmartBear Software
Setting Build Number
195
CodeGear Delphi 2007, 2009 for .NET
Borland Delphi 2005, 2006 for Win32
Borland Delphi 2005, 2006 for .NET
Borland Delphi 3 - 7
Embarcadero C++Builder 2010, XE
CodeGear C++Builder 2007, 2009
Borland C++Builder 2006
Borland C++Builder 3 - 6
Setting Build Number for Microsoft Visual C++ Applications
This topic explains how to modify compiler settings to specify the build number for applications created
with Microsoft Visual C++.
Note that setting the build number via compiler settings is just one of possible ways to specify the build
number. Another way is to use special tools that can modify compiled executables (see Setting Build
Number).
To specify the build number for a Visual C++ you should modify the application’s resources. The way
you do this is common for Visual Studio 6, 7.x, 2005, 2008 and 2010:
●
Open your Visual C++ project in Visual Studio IDE.
●
Open the Resource View window.
●
In the window, double-click the <resource file> | Version | VS_VERSION_INFO node. This
will open the resource editor.
●
Specify the desired numbers in the File Version and Product Version fields that reside in the
upper and lower parts of the editor:
© 2011 SmartBear Software
smartbear.com/support
196
Preparing Applications for AQtrace
●
Save the changes and close the editor.
Now, after you compile the application, the module will contain the specified build number.
For managed Visual C++ 7.x, 2005, 2008 and 2010 applications (Visual C++ CLR projects) you can
specify the build number in the following way:
● Open your managed Visual C++ project in Visual Studio IDE.
●
Open the AssemblyInfo.cpp file (you can find it in the <Solution_Name> | <Project_Name> |
Source Files node of the tree in the Solution Explorer window). This file contains some .NET
attributes that specify various parameters of the .NET assembly.
●
Specify the desired build number in the [assembly:AssemblyVersionAttribute]
attribute. For instance:
[Visual C++]
[assembly:AssemblyVersionAttribute("1.20.375.0")];
●
Save the changes in the AssemblyInfo.cpp file and close the editor.
●
Recompile your application.
Setting Build Number for Microsoft Visual Basic 2005, 2008 and 2010
Applications
This topic explains how to modify compiler settings to specify the build number for Microsoft Visual
Basic 2005, 2008 and 2010 applications.
Note that setting the build number via compiler settings is just one of possible ways to specify the build
number. Another way is to use special tools that can modify compiled executables (see Setting Build
Number).
To specify the build number:
●
Open your Visual Basic .NET project in Microsoft Visual Studio 2005, 2008 or 2010.
●
Select Project | <Project_Name> Properties from Visual Studio’s main menu.
-- or -Right-click the project node in the Solution Explorer window and select Properties from the
ensuing context menu.
●
●
This will display the Project Properties dialog.
In the dialog, move to the Application tabbed page and press the Assembly Information button.
In the ensuing Assembly Information dialog, specify the desired build number in the Assembly
Version and File Version fields:
smartbear.com
AQtrace by SmartBear Software
Setting Build Number
●
●
Click OK to close the dialog.
Save the changes in the project and close the Project Properties dialog.
●
Compile your application.
197
The build number specified in the Assembly Information dialog is stored in the AssemblyInfo.vb file that
contains various parameters of the assembly. You can also specify the version number by editing directly this
file in the following way:
●
Open your Visual Basic .NET project in Microsoft Visual Studio 2005, 2008 or 2010.
●
Select the project in the Solution Explorer window and select Project | Show All Files from the
main menu. This is necessary to display AssemblyInfo.vb in the Solution Explorer, because by
default this file is hidden.
●
Double-click the <Project_Name> | My Project | AssemblyInfo.vb node in the tree of Solution
Explorer to open the file for editing.
●
Use
the
<Assembly:
AssemblyVersion>
and
<Assembly:
AssemblyFileVersion> .NET attributes in the AssemblyInfo.vb file to specify the desired
build number. For instance:
[Visual Basic]
<Assembly: AssemblyVersion("1.12.127.0")>
<Assembly: AssemblyFileVersion("1.12.127.0")>
●
Save the changes and close the editor window.
●
Compile the application.
Now, after you compile the application, the module will contain the specified build number.
© 2011 SmartBear Software
smartbear.com/support
198
Preparing Applications for AQtrace
Setting Build Number for Microsoft Visual Basic 7.x Applications
This topic explains how to modify compiler settings to specify the build number for applications created
in Microsoft Visual Basic 7.x.
Note that setting the build number via compiler settings is just one of the possible ways to specify the
build number. Another way is to use special tools that can modify compiled executables (see Setting Build
Number).
To specify the build number:
●
Open your Visual Basic .NET project in Microsoft Visual Studio 7.x.
●
Double-click the <Solution_Name> | <Project_Name> | AssemblyInfo.vb node in the Solution
Explorer window. This will display the AssemblyInfo.vb file that contains various parameters of
the assembly to be compiled.
●
In the AssemblyInfo.vb file, use the <Assembly: AssemblyVersion> .NET attribute to
specify the desired build number. For instance:
[Visual Basic]
<Assembly: AssemblyVersion("1.20.375.0")>
●
Save the changes in the AssemblyInfo.vb file and close the editor.
●
Compile your Visual Basic .NET application.
Now, after you compile the application, the module will contain the specified build number.
Setting Build Number for Microsoft Visual Basic 6.0 Applications
This topic explains how to modify compiler settings to specify the build number for applications created
in Microsoft Visual Basic 6.
Note that setting the build number via compiler settings is just one of possible ways to specify the build
number. Another way is to use special tools that can modify compiled executables (see Setting Build
Number).
To specify the build number:
●
Open your project in Visual Basic IDE.
●
Select Project | <Your_Project_Name> Properties from the main menu. This will invoke the
Project Properties dialog.
●
In the dialog, switch to the Make tabbed page.
●
Specify the desired numbers in the Major, Minor and Revision edit boxes of the Version
number section:
smartbear.com
AQtrace by SmartBear Software
Setting Build Number
●
199
Click OK to save the changes and to close the dialog.
Now, after you compile the application, the compiled module will contain the specified build number.
Setting Build Number for Microsoft Visual C# 2005, 2008 and 2010
Applications
This topic explains how you can modify compiler settings to specify the build number for Microsoft
Visual C# 2005, 2008 and 2010 applications.
Note that setting the build number via compiler settings is just one of possible ways to specify the build
number. Another way is to use special tools that can modify compiled executables (see Setting Build
Number).
To specify the build number:
●
Open your Visual C# project in Microsoft Visual Studio 2005, 2008 or 2010.
●
Select Project | <Project_Name> Properties from Visual Studio’s main menu.
-- or -Right-click the project node in the Solution Explorer window and select Properties from the
ensuing context menu.
This will display the Project Properties dialog.
●
In the dialog, move to the Application tabbed page and press the Assembly Information button.
●
In the ensuing Assembly Information dialog, specify the desired build number in the Assembly
Version and File Version fields:
© 2011 SmartBear Software
smartbear.com/support
200
Preparing Applications for AQtrace
●
●
Click OK to close the dialog.
Save the changes in the project and close the Project Properties dialog.
●
Compile your application.
The build number specified in the Assembly Information dialog is stored in the AssemblyInfo.cs file that
contains various parameters of the assembly. You can also specify the version number by editing directly this
file in the following way:
●
Open your Visual C# project in Microsoft Visual Studio 2005, 2008 or 2010.
●
Double-click the <Project_Name> | Properties | AssemblyInfo.cs node in the tree of Solution
Explorer to open the file for editing.
●
Use
the
[assembly:
AssemblyVersion]
and
[assembly:
AssemblyFileVersion] .NET attributes in the AssemblyInfo.cs file to specify the desired
build number. For instance:
[C#]
[assembly: AssemblyVersion("1.12.127.0")]
[assembly: AssemblyFileVersion("1.12.127.0")]
●
Save the changes and close the editor window.
●
Compile the application.
Now, after you compile the application, the module will contain the specified build number.
Setting Build Number for Microsoft Visual C# 7.x Applications
This topic explains how to modify compiler settings to specify the build number for Microsoft Visual C#
smartbear.com
AQtrace by SmartBear Software
Setting Build Number
201
7.x applications.
Note that setting the build number via compiler settings is just one of the possible ways to specify the
build number. Another way is to use special tools that can modify compiled executables (see Setting Build
Number).
To specify the build number:
●
Open your Visual C# project in Microsoft Visual Studio 7.x.
●
Double-click the <Solution_Name> | <Project_Name> | AssemblyInfo.cs node in the Solution
Explorer window. This will open the AssemblyInfo.cs file that contains various parameters of the
assembly to be compiled.
●
In the AssemblyInfo.cs file, use the [assembly: AssemblyVersion] .NET attribute to
specify the desired build number. For instance:
[C#]
[assembly: AssemblyVersion("1.20.375.0")]
●
Save the changes in the AssemblyInfo.cs file and close the editor.
●
Compile your Visual C# application.
Now, after you compile the application, the assembly will contain the specified build number.
Setting Build Number for Delphi 2005 - 2007, 2009 - 2010 and XE Win32
Applications
This topic explains how to modify compiler settings to specify the build number for applications created
in Borland Delphi 2005 and 2006 for Win32, in CodeGear Delphi 2007 and 2009 for Win32 and in
Embarcadero Delphi 2010 and XE. To learn how to set the build number for applications created in Borland
Delphi v. 3 - 7, see Setting Build Number for Borland Delphi Applications. For information about build
number settings in Delphi 2005, 2006, 2007 and 2009 for .NET, see Setting Build Number for Delphi 2005,
2006, 2007 and 2009 .NET Applications.
Note that setting the build number via compiler settings is just one of possible ways to specify the build
number. Another way is to use special tools that can modify compiled executables (see Setting Build
Number).
To specify the build number:
●
Open your Delphi for Win32 project in Delphi IDE.
●
Select Project | Options from Delphi’s main menu.
-- or --
●
●
Right-click the project node in the Project Manager and select Options from the context menu.
This will open the Project Options dialog.
Select Version Info from the tree on the left of the dialog.
Select the Include version information in project check box and specify the desired build
numbers in the Major version, Minor version, Release and Build edit boxes:
© 2011 SmartBear Software
smartbear.com/support
202
Preparing Applications for AQtrace
●
Click OK to save the changes and to close the dialog.
Now, after you compile the application, the module will contain the specified build number.
Setting Build Number for Delphi 2005, 2006, 2007 and 2009 for .NET
Applications
This topic explains how to modify compiler settings to specify the build number for applications created
in Borland Delphi 2005 and 2006 for .NET and CodeGear Delphi 2007 and 2009 for .NET. To learn how to
set the build number for applications created in Borland Delphi v. 3 - 7, see Setting Build Number for
Borland Delphi Applications. For information about build number settings in Delphi 2005 – 2007, 2009 –
2010 and XE for Win32, see Setting Build Number for Delphi 2005 – 2007, 2009 – 2010 and XE Win32
Applications.
Note that setting the build number via compiler settings is just one of the possible ways to specify the
build number. Another way is to use special tools that can modify compiled executables (see Setting Build
Number).
To specify the build number:
●
Open your Delphi for .NET project in Delphi IDE.
●
Right-click the project node in the Project Manager and select View Source from the context
menu. This will open the .dpr file with the project settings for editing.
●
In the project file, use the [assembly: AssemblyVersion] .NET attribute to specify the
smartbear.com
AQtrace by SmartBear Software
Setting Build Number
203
desired build number. For instance:
[Delphi]
[assembly: AssemblyVersion('1.12.127.0')]
●
●
Save the changes in the project file and close the editor.
Compile your application.
Now, after you compile the application, the module will contain the specified build number.
Setting Build Number for Borland Delphi Applications
This topic explains how to modify compiler settings to specify the build number for applications created
in Borland Delphi ver. 3 - 7. To learn how you can set the build number for applications created in Delphi
2005 – 2007, 2009 – 2010 and XE, see Setting Build Number for Delphi 2005 – 2007, 2009 - 2010 and XE
Win32 Applications.
Note that setting the build number via compiler settings is just one of possible ways to specify the build
number. Another way is to use special tools that can modify compiled executables (see Setting Build
Number).
To specify the build number:
●
Open your project in Borland Delphi.
●
Select Project | Options from the main menu. This will invoke the Project Options dialog.
In the dialog, switch to the Version Info page.
●
●
Select the Include version information in project check box and specify the desired build
numbers in the Major version, Minor version, Release and Build edit boxes:
© 2011 SmartBear Software
smartbear.com/support
204
Preparing Applications for AQtrace
●
Click OK to save the changes and to close the dialog.
Now, after you compile the application, the compiled module will contain the specified build number.
Setting Build Number for C++Builder 2006, 2007, 2009, 2010 and XE
Applications
This topic explains how to modify compiler settings to specify the build number for applications created
in Borland C++Builder 2006, in CodeGear C++Builder 2007 and 2009, or in Embarcadero C++Builder 2010
or XE. To learn how to set the build number for applications created in C++Builder v. 3-6, see Setting Build
Number for Borland C++Builder Applications.
Note that setting the build number via compiler settings is just one of possible ways to specify the build
number. Another way is to use special tools that can modify compiled executables (see Setting Build
Number).
To specify the build number:
●
Open your project in C++Builder IDE.
●
Select Project | Options from C++Builder main menu.
-- or --
●
Right-click the project node in the Project Manager and select Options from the context menu.
This will open the Project Options dialog.
Select Version Info from the tree on the left of the dialog.
●
Select the Include version information in project check box and specify the desired build
smartbear.com
AQtrace by SmartBear Software
Setting Build Number
205
numbers in the Major version, Minor version, Release and Build edit boxes:
●
Click OK to save the changes and to close the dialog.
Now, after you compile the application, the compiled module will contain the specified build number.
Setting Build Number for Borland C++Builder Applications
This topic explains how to modify compiler settings to specify the build number for applications created
in Borland C++ Builder ver. 3 - 6. To learn how you can set the build number for applications created with
other C++Builder versions, see Setting Build Number for C++Builder 2006, 2007, 2009, 2010 and XE
Applications.
Note that setting the build number via compiler settings is just one of possible ways to specify the build
number. Another way is to use special tools that can modify compiled executables (see Setting Build
Number).
To specify the build number:
●
Open your project in Borland C++Builder.
●
Select Project | Options from the main menu. This will invoke the Project Options dialog.
●
In the dialog, switch to the Version Info page.
●
Select the Include version information in project check box and specify the desired build
© 2011 SmartBear Software
smartbear.com/support
206
Preparing Applications for AQtrace
numbers in the Major version, Minor version, Release and Build edit boxes:
●
Click OK to save the changes and to close the dialog.
Now, after you compile the application, the compiled module will contain the specified build number.
smartbear.com
AQtrace by SmartBear Software
Organizing Build Storage - Basic Concepts
207
Organizing Build Storage
Organizing Build Storage - Basic Concepts
Error reports contain information on call stacks for each thread that existed in the traced application. The
call stack data contains information about functions’ addresses and the modules that contain these functions.
In order for AQtrace Viewer and AQtrace Service to be able to parse the call stacks, they need access to the
binary code and debug information of the modules that are mentioned in the report.
Typically, end-users work with different versions of your application. For instance, some users can work
with version 1.8 while some others use the version 2.0 or 2.1. So, most likely you will receive error reports
that were generated for various versions of your application. In order for AQtrace Viewer and Service to be
able to parse these reports, you should provide access to the binary code and debug information for the
modules that belong to different versions of your application.
You do this by creating a build storage that contains modules and debug information files for each
version of your application that is shipped to end-users. When parsing reports, AQtrace Viewer and Service
search for the needed modules in the storage and use them to parse call stack data. If a module or debug
information is not found, the call stack will not be parsed. So, specifying correct paths to the build storage is
critical for the functioning of the Viewer and Service. For detailed information on specifying the path, see
below.
To create a storage, you should perform the following operations:
1. Define the storage structure
2. Compile your modules with debug information and specify version information for them
3. Place the files to the build storage
4. Specify the build storage location for AQtrace Viewer and AQtrace Service
The following sections explain how to perform these tasks. In the end, we will also describe key points to
which you should pay attention when creating the build storage.
1. Defining the Storage Structure
A build storage is just a folder (or folders) that contains executable modules and debug info files. Since
end-users can work with several versions of your application, the build storage must contain binary modules
and debug info files for each version of your application that were shipped to end-users. So, it is
recommended to organize the stored files into subfolders each of which will contain files that correspond to
this or that version. A subfolder name can match a build number. You can use, for example, the following
folder structure:
© 2011 SmartBear Software
smartbear.com/support
208
Organizing Build Storage
Here, Builds is the root folder of the storage. MyApplication 1 and MyApplication 2 are folders that
contain subfolders corresponding to versions of the MyApplication program. Subfolders of the next level
correspond to application versions (builds) that were shipped to end-users. Each of these subfolders contains
the modules that were included in the appropriate build.
The access to compiled modules is required by the AQtrace Service that runs on the computer (server)
and by the AQtrace Viewer instances running by members of your development team. So, it is
recommended to share the build storage folder for network access, so that the compiled modules and
debug info files can be accessed by all needed applications and developers.
After you define the storage structure, you add the files to the storage and then specify the storage
location for AQtrace Viewer and AQtrace Service (see below).
Note that the suggested storage structure is not the only possible way to organize the storage. It is
possible, for example, to store files of different builds on different computers, but not in one folder. In this
case, you will have to “inform” AQtrace Viewer and Service about all possible folders.
2. Compiling Modules
The modules to be included into the build storage must match two requirements:
●
●
They must be compiled with debug information.
They must have version information specified.
Both these requirements are critical. Debug information is needed to parse the call stack data. AQtrace is
unable to perform this task without debug info. For information on how to compile your modules with debug
information, see Compiling Applications With Debug Information.
Each executable or DLL module in the storage is identified by its module name and version number (a
smartbear.com
AQtrace by SmartBear Software
Organizing Build Storage - Basic Concepts
209
module name includes the file name and extension, but not the path). The version number lets AQtrace
distinguish different versions of the module that is included in several application versions. Without this
information it would be impossible, for instance, to distinguish MyHelper.DLL that is included in ver.
1.10.123 and 1.20.234. For information on how to specify the version number for modules, see Setting Build
Number.
3. Placing Files to Build Storage
The build storage is just a folder (or folders) and placing files and modules to the storage means no more
than moving the files to the desired folder.
Compilers can generate debug information as external files, or they can include it in the compiled
executables. If debug information is generated as an external file, this file must reside in the same
storage folder, in which the appropriate module is located.
After you add new files to the build storage, you may need to update the settings of AQtrace Viewer and
AQtrace Service so that they are able to find the new files.
4. Specifying the Storage Location for AQtrace Viewer and AQtrace Service
In order for the AQtrace Viewer and Service utilities to be able to find binary modules and debug
information files, you should specify the storage location for them. The following topics provide complete
information on changing the settings of these utilities:
AQtrace Viewer - Specifying Path to Modules
Configuring AQtrace Service
The AQtrace Viewer and AQtrace Service settings are similar to each other. They let you specify the
storage location in several ways:
●
You can specify the location by using the build storage configuration file. The file contains
information about module names, their versions and module location in the storage. You create
this file with the AQtrace Module Store utility.
Note: You should update the contents of the configuration file so that it holds information
about each version of your application that is shipped to end-users. This can be done
in two ways:
●
●
Manually - by using the AQtrace Module Store utility you used to create the
configuration file.
●
Automatically - by using the dedicated AQtrace Module Store Agent service
running in the background.
You can specify the location of binary modules and debug info file by using the symbols path
settings. These settings specify the folders and URLs, in which the Viewer and Service will search
for binary modules and debug information files.
If the desired module is found on a remote computer, it is downloaded to the computer, on which
the Viewer or Service is running, and then the Viewer (or Service) uses the downloaded copy.
The symbols path settings are typically uses to specify location of debug info files (these files are
also called symbol files).
AQtrace Viewer also has one more type of settings - modules path - that specify additional search paths.
© 2011 SmartBear Software
smartbear.com/support
210
Organizing Build Storage
You can use these additional settings to specify the search paths, which you typically do not use.
The Viewer and Service use the storage location settings in the following order:
1. Module storage file
2. Symbols path
3. Modules path (AQtrace Viewer only)
Once the desired module is found, the search is stopped.
5. Key Points
●
The build storage is used to store modules and debug information for each release of your
application.
●
Files added to the storage must be compiled with debug information. Also, you must specify
version information for binary modules.
●
The storage must contain compiled modules along with debug information files. If debug info is
generated as an external file, this file should reside in the folder where the compiled module is.
●
It is recommended to share the storage folder, so that AQtrace Service and all the developers of
your team have access to the same compiled modules and debug info files.
●
Each module in the storage is identified by its file name and version information. File paths are not
used.
●
You specify the storage location for AQtrace Viewer on the Symbols page of its Options dialog.
You specify the storage location for AQtrace Service during AQtrace installation or later, by using
the AQtrace Server Config utility.
●
After you release a new version, you should add the compiled modules and debug info files to it.
You should also update the storage configuration file (if you use it) or those settings of AQtrace
Viewer and AQtrace Service that specify the build storage location.
smartbear.com
AQtrace by SmartBear Software
AQtrace Module Store
211
AQtrace Module Store
The AQtrace Module Store utility is used to create and maintain build storage configuration files that
describe the contents of the build storage. These files contain information about the names, versions and
paths of executable modules added to the build storage. The configuration files are used by AQtrace Viewer
and AQtrace Service to parse received error reports. When parsing a report, AQtrace Viewer and Service use
this file to find information for a module that is met in the report. Using this information, they read debug
info for the module and unwind the call stacks.
You can find the AQtrace Module Store utility in the <AQtrace>\Bin folder. The file name is
AQtraceModuleStore.exe.
AQtrace Module Store can function as a visual tool or as a command-line utility.
To maintain the configuration file, you can also use the AQtrace Module Store Agent. It is a service that
automatically updates build storage configuration files.
AQtrace Module Store - User Interface
The AQtrace Module Store utility is intended to create, view and modify the contents of the build storage
configuration files. These files contain information about binary modules that are added to the build storage.
This topic describes the user interface of the utility. For information on using the utility, see Using AQtrace
Module Store.
The most part of the utility’s window is occupied by the tree-like list that displays the contents of the
configuration file that is being edited. The file name is displayed above the list. You open, modify, save and
close configuration files by using toolbar buttons or items of the utility’s menu (see below).
The list contains two columns: Path\Name and Version that display correspondingly the module’s path
and file name and its version number. The data in the list is not editable. AQtrace Module Store
automatically fills the column values when you add new modules to the configuration file (see Using
AQtrace Module Store).
By default, the tree’s nodes are grouped by the path (see the image below). That is, the tree represents
the structure of the build storage in the file system context: leaf nodes represent binary modules that are
added to the build storage, all other nodes represent the folders that make up the full paths to the modules:
© 2011 SmartBear Software
smartbear.com/support
212
Organizing Build Storage
Also, you can group the data by the name:
●
On the View menu, select Group by Name.
●
-- or -Right-click within the tree area and select Group by Name on the ensuing context menu.
To change the grouping to the default mode (by the path), click Group by Name once again.
smartbear.com
AQtrace by SmartBear Software
AQtrace Module Store
213
Grouping is just one of the features that you may customize the data appearance in the tree list. You can
change the column layout as your needs dictate:
●
You may change the column’s width by dragging the column’s border.
●
You can sort data on the Path\Name column (or the Name\Path column, its name depends on the
grouping mode) by clicking the column’s header. To change the sorting order, click the header
again. See Sorting.
The menus and toolbars of AQtrace Module Store are similar to menus and toolbars of Microsoft Visual
Studio or other Microsoft products. And you can customize them in a similar way:
●
You can hide or show toolbar or menu items by clicking the drop-down button at the bottom-right
corner of a toolbar or a menu, clicking Add or Remove Buttons and selecting the desired items
from the ensuing menu:
© 2011 SmartBear Software
smartbear.com/support
214
Organizing Build Storage
●
You can hide and display toolbars by right-clicking the toolbar area and checking or unchecking
the toolbar name in the ensuing context menu.
For complete information on working with menus and toolbars, see Toolbar Customization.
For information on how to use the menu and toolbar items to work with configuration files, see Using
AQtrace Module Store.
Using AQtrace Module Store
AQtrace Module Store is used to create and modify configuration files that contain information about
binary modules added to the build storage. This topic explains how you can do this via the utilities UI. But
note that you also use AQtrace Module Store as a command-line utility. For more information about this, see
AQtrace Module Store - Command Line.
To modify a configuration files, perform three steps:
●
Open an existing or create a new file in AQtrace Module Store.
●
Use items of the Edit menu or of the Edit toolbar to perform the desired actions.
●
Save the changes and close the file.
1. Create or Open a File
To create a new configuration file, select File | New from the main menu of AQtrace Module Store or
click the
New button.
To open an existing file, choose File | Open or click the
Open button and then select the desired file
in the ensuing standard Open File dialog (configuration files have an .xml extension).
After you opened the file, the utility will display the file’s name and contents in the window. To modify
the file’s content use items of the Edit menu (see below).
2. Change the File
To modify the build storage configuration files, use items of the Edit menu or Edit toolbar. These items
smartbear.com
AQtrace by SmartBear Software
AQtrace Module Store
215
let you perform the following actions:
● Add information about modules to the file
●
Merge two configuration files
●
Check links and remove information about non-existent modules
●
Remove data from the file
To add information about modules to the file
The build storage configuration files are used by AQtrace Service and AQtrace Viewer to obtain access
to binary modules and their debug information and use them to parse the call stack data that are included into
received error reports. The files contain information about the module’s location. You should update the file
configuration file (or files) for each new major or minor version of your product that you ship to end-users. If
the configuration file does not contain information for this version, AQtrace Server and Viewer will not be
able to parse error reports that will be generated for this version.
To add information about modules to the file:
●
Place your binary modules and their debug information files to the build storage.
●
Open your configuration file for editing.
●
Select Edit | Add Folder from the main menu of AQtrace Module Store or click the
Folder button on the Edit toolbar. This will invoke the standard Browse for Folder dialog.
●
In the dialog, choose the folder that contains your modules and press OK.
Add
AQtrace Module Store will scan all of the binary modules found in the folder and add information
about these modules to the configuration file.
Notes:
●
If you want AQtrace Module Store to scan the specified folder with all of its subfolders, select the
Recurse subdirectories check box in the Browse for Folder dialog. If you want to process files
that are located only in a certain folder without recursive scanning, clear this check box.
●
You cannot add individual modules to the configuration file. You may add only folders.
●
Before adding information about a module to the configuration file, the utility checks whether the
file already contains a reference to the module that has the same name and version number (all
four parts of the version number are checked). If the configuration file already contains the
reference, a reference to the new module is not added even though the module paths differ.
For instance, if you add a module C:\Storage\Ver. 1.3\MyHelperModule.dll to the configuration
file and this configuration file already contains a reference to the module C:\Storage\Ver.
1.2\MyHelperModule.dll, and both modules have the same version number (for instance, 1.0.0.0),
the module C:\Storage\Ver. 1.3\MyHelperModule.dll will not be added to the configuration file.
●
Instead of updating the configuration file manually, you can set up the AQtrace Module Store
Agent to perform automatically update it. Read Using AQtrace Module Store Agent for instructions
on how to do that.
To merge configuration files
To merge two configuration files:
●
Open one of the files for editing in AQtrace Module Store.
●
Select Edit | Merge from the main menu of the utility or click the
toolbar. This will invoke the standard Open File dialog.
●
Choose the other configuration file in the dialog and press Open.
© 2011 SmartBear Software
Merge button on the Edit
smartbear.com/support
216
Organizing Build Storage
The AQtrace Module Store utility will combine the contents of two files and display the results in
its window.
The resultant file will contain information from both configuration files. Note, however, that when
merging the configuration files, AQtrace Module Store checks the modules’ names and versions. For
instance, if the files refer to two modules that have the same name and version information, but reside in
different folders, only link to one of these modules will be added (the links that exists in the currently open
configuration file).
For instance, if your configuration file contains information about the module C:\Storage\Ver.
1.0\MyHelperModule.dll and you merge this configuration file with another file that refers to the module
C:\Storage\Ver. 1.10\MyModule.dll, and both the modules have the same version number (for instance,
1.0.0.0), the module C:\Storage\Ver. 1.10\MyModule.dll will not be added to the resultant configuration file.
To check links to modules
Build storage is just a folder or folders that contain binary modules and debug information files. The
configuration files contain links to the binary modules. If you delete a module from the storage folder, the
configuration file will still contain a link to this module. These links increases the size of the configuration
file and increases the report analysis time. To clean up the links to non-existent files:
●
Open your configuration file in the AQtrace Module Store utility.
●
Select Edit | Check Links from the main menu or click the
Check Links button on the Edit
toolbar.
AQtrace Module Store will iterate through all the links and remove the links to non-existent files.
To delete information about modules
You may want to delete information about some binary modules from the configuration file. To do this:
●
Open your configuration file in the AQtrace Module Store utility.
●
In the main window of the utility choose the row that contains the desired folder name.
●
Select Edit | Delete Folder from the main menu or click the
toolbar.
Delete Folder button on the Edit
AQtrace Module Store will remove information about all of the modules that are located in the
selected folder and its subfolders from the configuration file.
Notes:
●
You cannot delete individual files. You may remove only folders.
●
To remove all the links from the configuration file, select Edit | Clear from the utilities main
menu or click the
Clear button on the Edit toolbar.
3. Save the Changes and Close File
To save the changes made to the configuration file, select File | Save from the main menu or click the
Save button.
To save the file under another name, choose File | Save As and then specify the new file name in the
ensuing Save File dialog.
To close the file, select File | Close. If the file has unsaved changes, AQtrace Module Store will ask
whether you want to save them.
smartbear.com
AQtrace by SmartBear Software
AQtrace Module Store
217
AQtrace Module Store - Command Line
You can use AQtrace Module Store as a command-line utility. Using this functionality you can update
the build configuration files automatically from .bat files or various automated build tools like Automated
Build Studio.
The utility uses the following command-line arguments:
AQtraceModuleStore.exe [config_file[(-a:folder_name[-r])| m:config_file2| -cl] ]
Here braces means a group of parameters, square brackets means optional parameters and vertical pipes
means “OR”.
config_file
The fully-qualified name of the file, to which AQtrace Module Store will store information about
module names, versions and file paths. The resultant file has the XML format. If the file does not
exist, the utility will create it.
-a:folder_name [-r]
Append information about binary modules to the configuration file.
folder_name specifies the folder, in which the utility will search for binary modules. AQtrace
Module Store will analyze all the EXE, DLL and other executable files in this folder and save
information about the file names and versions to the configuration file. If the folder name contains
spaces, enclose it in quotes.
If the -r argument is used, the utility searches for binary modules in the specified folder and its
subfolders. Else, the utility does not search in the subfolders.
-m:config_file2
Merge configuration files. AQtrace Module Store will merge the configuration file that is specified
by the config_file argument with other configuration file, which is specified by the config_file2
argument. If the file name contains spaces, enclose it in quotes.
-cl
Check links in the configuration file. If this argument is used, AQtrace Module Store will analyze
the file contents and remove the links to those binary modules that do not exist.
The examples below demonstrate how to use the utility:
AQtraceModuleStore.exe C:\MyBuildsConfig.xml -a:"C:\MyBuilds\My App
1\1.0.123.2" -r
AQtraceModuleStore.exe C:\MyBuildsConfig.xml m:C:\MyBuilds2\ConfigFile2.xml
AQtraceModuleStore.exe C:\MyBuildsConfig.xml -cl
Notes:
●
If config_file is only used and other arguments are skipped, the AQtrace Module Store utility
opens the specified configuration file for editing and displays the utility’ window on screen.
If any other argument is added to config_file, then AQtrace Module Store does not display its
window on screen and works as a command-line utility.
●
If the processing was successful, the utility exits with code 0. If an error occurs, the exit code is 1.
●
After you create the configuration file, you can specify the file location for AQtrace Viewer and
AQtrace Service. You specify the file location for AQtrace Viewer by using the Viewer’s Modules
© 2011 SmartBear Software
smartbear.com/support
218
Organizing Build Storage
Storage setting in the Symbols Options dialog. To specify the file for AQtrace Service, use the
Build storage file name setting on the AQtrace Service Settings page of the AQtrace Server Config
utility. For more information, see AQtrace Viewer - Specifying Path to Modules and Configuring
AQtrace Service.
smartbear.com
AQtrace by SmartBear Software
AQtrace Module Store Agent
219
AQtrace Module Store Agent
AQtrace Module Store Agent - Overview
AQtrace Module Store Agent is a server-side utility that automatically updates the build storage
configuration file. The Agent operates as follows:
It runs as a service on the server computer and regularly monitors one or more folders that make up a
build storage (that is, the folders that contain binary modules and debug information for each version of
your application shipped to end-users). The Agent traces the creation of a new binary or debug info file in
those folders, and then appends a new item to the build storage configuration file. Upon deleting a binary or
debug info file, the Agent removes the corresponding item from the configuration file. Thus, there is no need
to edit the configuration file manually (yet this still can be done with the AQtrace Module Store utility).
To learn how to set up automatic updating, read the Using AQtrace Module Store Agent topic.
Service File Name
The service's file name is AQtraceModuleStoreAgent.exe. The installation program copies this file to the
<AQtrace>\Bin folder.
Starting, Stopping and Pausing the Service
The AQtraceModuleStoreAgent executable works as the operating system’s service. It is configured to
start automatically when the computer starts.
You can control the Module Store Agent, that is, to stop, start, pause and resume it, by using the
operating system’s Control Panel | Administrative Tools | Services window.
Module Store Agent Settings
In order for Module Store Agent to function properly, you need to define which folders it should monitor
and what configuration file it should update. These settings are specified on the Module Store Agent Settings
page of the AQtrace Server Config utility.
You must specify these settings before Module Store Agent starts. If neither the configuration file nor the
build folders are specified, the Agent does not start.
Note: Module Store Agent must have read permissions for the build storage folders and read-write
permission for the build storage configuration file.
Using AQtrace Module Store Agent
AQtrace Module Store Agent is a server-side service used to maintain build storage configuration files.
These configuration files contain information about binary modules added to the build storage. The
configuration files are created with the AQtrace Module Store utility and can be modified using the same
utility. However, it is more convenient to set up the Module Store Agent in order to update the configuration
file automatically.
© 2011 SmartBear Software
smartbear.com/support
220
Organizing Build Storage
To set up automatic updating of configuration files, you need to do the following:
●
Register the AQtrace Module Store Agent as a service on the server.
●
(Optionally) Create a new build storage configuration file with AQtrace Module Store.
●
Configure AQtrace Module Store Agent.
The sections below describe these steps in details.
1. Registering AQtrace Module Store Agent as a service.
To register the Module Store Agent as a service, you simply need to launch its executable on the server.
The Agent’s executable is located in the <AQtrace>\Bin folder. After the first launch, AQtrace Module Store
Agent will appear in the list of the operating system’s services (Control Panel | Administrative Tools |
Services). The Agent will now start automatically (however, if the input parameters are specified, the Agent
will stop itself.).
2. Creating a build storage configuration file
A build storage configuration file lists all binary and debug info files included in the build storage. The
purpose of the Module Store Agent is to ensure that the configuration file contains the most recent list of
files.
Build storage configuration files are created via the AQtrace Module Storeutility. If you have already
created such a file, then you may skip this step and proceed to the next one.
To create a new configuration file:
1. Launch the AQtrace Module Store utility that resides in the <AQtrace>\Bin folder.
2. Select File | New from the main menu of AQtrace Module Store or click the
New button.
You may add information about module storage folders to the configuration file (see Using
AQtrace Module Store), yet it is not necessary, because the required information will be appended
automatically later.
3. Select File | Save from the main menu or click the
Save button. Specify the location and name
of the newly created file in the ensuing Save File dialog.
4. Close the AQtrace Module Store utility.
3. Configuring AQtrace Module Store Agent parameters
The parameters of the Agent are set via another utility - AQtrace Server Config. It also resides in the
<AQtrace>\Bin folder.
1. Launch the AQtrace Server Config tool and switch to the Module Store Agent Settings page.
2. In the Build storage file name field, specify the path to the build storage configuration file to be
processed by the Agent.
3. In the Module storage folder path list, specify the folders that contain binary and debug info files
for your builds. The changes made to these folders will be monitored by the Agent. The chosen
folders are processed recursively, that is, if the given folder contains some subfolders, they will be
monitored as well.
4. Besides, you can specify the update frequency in the Update interval field. It defines how often
the Agent will check the listed folders for changes and update the configuration file. The default
value for this field is 0, which means that the changes are reflected immediately.
5. Press Apply to pass the parameters to the Agent.
smartbear.com
AQtrace by SmartBear Software
AQtrace Module Store Agent
221
Note: The Module Store Agent must have read permissions for the build storage folders and read-write
permission for the build storage configuration file.
After AQtrace Module Store Agent gets the above-mentioned parameters, it will run as a service in the
background and keep track of changes in the build storage.
Note: The Agent gains exclusive access to the specified configuration file, therefore the attempts to
modify the same configuration file manually (using the AQtrace Module Store utility) will fail
unless the Agent is stopped.
© 2011 SmartBear Software
smartbear.com/support
222
AQtrace Reporter
AQtrace Reporter
Using AQtrace Reporter - Basic Concepts
The AQtrace installation package includes the AQtrace Reporter, which is a special component that is
used in your applications. The Reporter traces the execution flow of your application and, if an exception
occurs, it generates detailed error reports, displays a notification window and sends the report to the AQtrace
server. AQtrace also provides a program interface to AQtrace Reporter, so you can control the Reporter’s
settings and modify various aspects of its behavior during your application run.
This topic describes how you can initialize and use the AQtrace Reporter in your applications.
Applying AQtrace Reporter to Native Applications
AQtrace Reporter includes a lot of settings that let you customize various aspects of the Reporter’s
behavior and specify the data to be included in the generated error report. To specify the Reporter’s settings
and apply them to your native (unmanaged) application, use the AQtrace Packager utility. This utility is
included into the AQtrace installation package. By default it is installed in the <AQtrace>\Bin folder.
To process your unmanaged module:
1. Launch AQtrace Packager and select File | New | Native Project from its main menu or select
Create Native Project from the Packager’s Start Page to create a new native project.
2. Select Module | Module Information from the list of settings pages on the left of the Packager’s
window.
3. In the File Name edit box of the Module Information page, specify the name of your module (for
information on what modules to be processed, see below).
4. Specify the desired settings on other pages of AQtrace Packager. For more information, see
AQtrace Packager Settings Pages.
The following settings are important. Make sure they have correct values:
●
Settings of the Reporter Settings | Sending page. These settings specify the transfer protocol(s)
and destination server(s) that will be used for sending the generated error reports.
●
The Product identifier and Product version settings on the Reporter Settings | Product
Information page. These settings specify the identifier of your application and the version
number to be included into the generated reports. These values will be used to determine the
product version, for which the reports will be generated.
5. After you specify the path and name of your executable in the Module Information page and
define the Reporter settings, press Process Module on AQtrace Packager’s toolbar. This way you
command the Packager to apply the settings to your executable.
It is important that you press Process Module. If you skip this step, the settings will be
saved to your AQtrace Packager project, but will not be applied to your executable.
For more information on using AQtrace Packager, see Using AQtrace Packager With Native
smartbear.com
AQtrace by SmartBear Software
Using AQtrace Reporter - Basic Concepts
223
Applications.
Applying AQtrace Reporter to .NET Applications
In order for .NET applications to interact with AQtrace Reporter, AQtrace Packager generates the
aqReporterInterop.dll assembly and does not add automatically special code to your executable that loads the
aqReporter dynamic link library and enables the Reporter functionality. You should write the code that will
initialize AQtrace Reporter by yourself. To initialize the Reporter implemented in the aqReporter unmanaged
library from your managed .NET code, you should use the program interfaces provided by the
aqReporterInterop assembly. In addition, the generated aqReporterInterop assembly also contains the data
that you specified in the Packager’s .NET project for configuring AQtrace Reporter. For more information
about how you can initialize the Reporter in .NET applications by using aqReporterInterop, see Initializing
AQtrace Reporter in .NET Applications.
To generate the aqReporterInterop assembly:
1. Launch AQtrace Packager and select File | New | .NET Project from its main menu or select
Create .NET Project from the Packager’s Start Page to create a new .NET project.
2. Select Reporter Assembly | Reporter Assembly Information from the list of settings pages on
the left of the Packager’s window.
3. In the Output Folder edit box of the Reporter Assembly Information page, specify the path to the
folder where the aqReporterInterop assembly will be placed. If you leave this edit box empty,
AQtrace Packager generates the assembly and places it to the folder in which the AQtrace
Packager configuration project is located.
AQtrace Packager uses the ilasm utility to compile the assembly, so, you need this utility
to be installed on your computer. The ilasm utility is a part of Microsoft .NET
Framework and is installed along with this platform.
4. Specify the desired settings on other pages of AQtrace Packager. For more information, see
AQtrace Packager Settings Pages.
The following settings are important. Make sure they have correct values:
●
Settings of the Reporter Settings | Sending page. These settings specify the transfer protocol(s)
and destination server(s) that will be used for sending the generated error reports.
●
The Product identifier and Product version settings on the Reporter Settings | Product
Information page. These settings specify the identifier of your application and the version
number to be included into the generated reports. These values will be used to determine the
product version, for which the reports will be generated.
5. After you specify the path to the folder, in which the aqReporterInterop assembly should be
generated, and define the Reporter settings, press Generate Assembly on AQtrace Packager’s
toolbar. This way you command the Packager to generate the assembly applying the specified
settings to it.
It is important that you press Generate Assembly. If you skip this step, the settings will
be saved to your AQtrace Packager project, but the assembly will not be generated and
the settings will not be applied to it.
For more information
aqReporterInterop Assembly.
© 2011 SmartBear Software
on
generating
the
aqReporterInterop
assembly,
see
Creating
the
smartbear.com/support
224
AQtrace Reporter
Defining Which Modules to Process
In order for AQtrace Reporter to be able to monitor the execution of all of your code, it should be loaded
to all processes, in which your modules are executed. It is possible for the process to contain two or more
modules that contain the Reporter. That is, your EXE that contains AQtrace Reporter may load one or more
DLLs that also contain the Reporter. But usually there is no need to apply the Reporter to all of the modules
of your product:
●
A typical product consists of an EXE (which acts as a main module) and a number of helper DLLs.
There is no need to add AQtrace to all of these modules. Usually, you can just apply it to the main
EXE. It will load AQtrace Reporter in memory, so the Reporter will monitor the execution of the
EXE and the DLLs loaded by the EXE.
●
If your product includes several EXEs, then apply AQtrace Reporter to each EXE. This way
AQtrace Reporter will trace the execution of all of your modules.
●
If your product is a DLL or OCX module, then apply AQtrace Reporter to this module. If the
executable that will load this DLL or OCX does not contain the Reporter, your module will “load”
the Reporter into the process.
Distributing AQtrace Reporter Modules
AQtrace Reporter monitors your application’s execution on end-user computers. That is, you must ship it
along with your application to these computers.
AQtrace Reporter is implemented by a number of redistributable modules. Depending on your
application type and the operating system on which it will work, you need to include one or more of these
modules into the installation package of your application. For complete information on the redistributable
modules and recommended installation folder, see Distributing AQtrace Reporter Libraries.
Using AQtrace Reporter
AQtrace Reporter includes a lot of settings that allow you to tune almost any aspect of the Reporter’s
behavior. You specify these settings with AQtrace Packager and then apply them to your module or generate
the aqReporterInterop.dll assembly using these settings for .NET applications. That is, you specify the
settings at design time, before the application is executed.
AQtrace Reporter provides a program interface, so your application may connect to the Reporter and
modify its behavior during the application execution, at run time.
Design Time
The following actions are performed at design time with the AQtrace Reporter Packager:
Action
Description
To specify the
exceptions to be
traced...
Use the pages of the Exception Filter group in AQtrace Packager. See
Specifying Exceptions to Be Traced.
To specify the modules Use the Module Filter Settings page of AQtrace Packager. See Specifying
to be traced...
Modules to Be Traced.
To include specific
To specify which information to be included in reports, enable certain settings
information in the error on the Additional Reported Data page of the AQtrace Packager. See
report...
Specifying Data to Be Included in Reports.You can also include custom data
smartbear.com
AQtrace by SmartBear Software
Using AQtrace Reporter - Basic Concepts
Action
225
Description
in generated reports. This requires that you create specific code that will work
with the Reporter through its programming interface (see below).
To specify whether
AQtrace Reporter will
display a notification
window...
Use the Show notification window setting on the Notification Settings page of
AQtrace Packager. See Displaying a Notification Window.
To specify the data to
be displayed in the
notification window...
Use the settings displayed on the Notification Settings page of AQtrace
Packager. See Displaying a Notification Window.
To prevent loading of
certain DLLs...
Use the settings displayed on the Control DLL Loading page of AQtrace
Packager. See Controlling DLL Loading.
Run Time
The following actions are performed at run time by using AQtrace Reporter’s programming interface:
Action
Description
To disable and enable the Use the Lock (or LockForThread), Unlock (or UnlockForThread),
Reporter...
GlobalLock and GlobalUnlock methods. See Enabling and Disabling
AQtrace Reporter.
To include custom
information in reports...
For inserting textual custom data, create an object that implements the
IaqReporterCallback interface and register this object in the
IaqReporterIntf object with the AddCallback method. Add code
that generates custom textual information to the OnGenerateReport
method of the IaqReporterCallback object. See Custom Textual Data
in Reports for a detailed description.
For inserting binary custom files, you should create an object that
implements the IaqReporterCallback2 interface and register this
object in the IaqReporterIntf2 object with the AddCallback2
method. Add code that generates custom binary data to the
OnGenerateReport2 method of the IaqReporterCallback2
object. You can also use the OnGenerateReportWithFile2 method of
the IaqReporterCallback2 object to add external files to reports. For
more information, see Custom Binary Data in Reports.
This functionality is not supported for Visual Basic applications.
To create a custom
exception filter...
© 2011 SmartBear Software
Create an object that implements the IaqCustomExceptionFilter
interface and register this object in the IaqReporterIntf2 object with
the AddCustomExceptionFilter method. Add code that handles SEH
exceptions
to
the
CheckSEHException
method
of
the
IaqCustomExceptionFilter object and code that handles CLR
smartbear.com/support
226
AQtrace Reporter
Action
Description
exceptions to the CheckDotNetException method of this object,
respectively. See Creating Custom Exception Filters for a detailed
description.
This functionality is not supported in Visual Basic applications.
To generate a report
programmatically...
Use the ShowFatalErrorWithMessage method. See Generating Error
Reports on Demand.
In Visual Basic applications, use the ShowFatalErrorWithMessage
method of the IaqReporterIntf class.
To perform specific
actions upon closing the
notification window...
Create an object that implements the IaqReporterCallback interface
and register this object in the IaqReporterIntf object with the
AddCallback method. Add code that performs specific actions to the
OnCloseReporter method of the IaqReporterCallback object.
Also, to perform specific actions upon closing the notification window, you
can
use
the
OnCloseReporter2
method
of
the
IaqReporterCallback2 object that can be registered in the
IaqReporterIntf2 object by using its AddCallback2 method. See
Performing Specific Actions Upon Closing the Notification Window for a
detailed description.
This functionality is not supported for Visual Basic applications.
To
save
additional Use
the
SaveAdditionalInfoAsDump
method
information in a separate IaqReporterIntf2 interface.
dump file...
This functionality is not supported in Visual Basic applications.
of
the
To load an error report Use the ShowReportContents method of the IaqReporterIntf2
from a dump file and interface. The method invokes the Report Information dialog to display the
display its contents...
error report information in it.
This functionality is not supported in Visual Basic applications.
To set a name for a Use the SetThreadName method of the IaqReporterIntf2 interface.
thread...
The specified name of the thread is displayed in the Threads panel of
AQtrace Viewer when an error report is opened with this tool.
This functionality is not supported in Visual Basic applications.
Distributing AQtrace Reporter Libraries
The functionality of AQtrace Reporter is implemented by a number of modules. All of them are
redistributable. You must ship them along with your application to end-user computers. This topic explains
which modules you should distribute.
AQtrace Reporter Modules
Depending your application’s type and its requirements to end-user computers, you may need to
smartbear.com
AQtrace by SmartBear Software
Distributing AQtrace Reporter Libraries
227
distribute one or more of AQtrace Reporter modules:
●
AQtrace Reporter engine: The core module of AQtrace Reporter is aqReporter.dll. You can find
it in the <AQtrace SDK>\Modules folder. If your module is 32-bit, then use 32-bit version of
aqReporter.dll; if your module is 64-bit, use 64-bit version.
You should always ship this module along with your application to end users.
●
Windows 2000 and earlier operating systems: If AQtrace Reporter will work on Windows 2000
or an earlier operating system, then in addition to aqReporter.dll you also distribute the
DbgHelp.dll module from the <AQtrace SDK>\Modules\x86 folder (see below). This library is
needed to generate error reports.
●
.NET applications: if you are going to use AQtrace Reporter with your .NET application, you
should generate the aqReporterInterop.dll assembly with the use of AQtrace Packager and
distribute this assembly along with aqReporter.dll and your application. The assembly serves as a
bridge between your .NET modules and the native (unmanaged) aqReporter dynamic link library.
To learn how you can generate the aqReporterInterop assembly, see Creating the
aqReporterInterop Assembly.
●
Visual Basic applications: if you are going to control AQtrace Reporter from your VB code, then
you should distribute the aqtSupportVB.dll module along with the aqReporter and (if needed)
DbgHelp libraries. This module provides program access to AQtrace Reporter from VB
applications. You can find it in the <AQtrace SDK>\VB folder (see below).
●
Non-interactive applications (like services): if you are going to use AQtrace Reporter with a
non-interactive application, for example, a service, then you must also ship the AQtrace Reporter
Monitor files with it in addition to other AQtrace Reporter modules. You must ship the Report
Monitor’ executable (AQtraceReportModule.exe) and settings file (ReportMonitorSettings.xml).
You can find both in the <AQtrace SDK>\Modules\Common folder (see below).
Note: It is important that you modify the settings file and specify the appropriate values in it
before distributing this file to end users. You can use the SDK version of this file as a
termplate for your settings file. For more information on the settings, see Configuring
AQtrace Report Monitor.
Module Location
The AQtrace Reporter modules are part of AQtrace SDK. To install them on your computer, choose the
“Prepare your modules for AQtrace” option on the Select AQtrace Components page of the AQtrace
installation wizard. The SDK files are copied to the following folders:
●
On Windows 7, Windows Vista and Windows Server 2008:
●
<Users>\Public\Documents\AQtrace Files\SDK
On Windows XP, Windows Server 2003 or Windows 2000:
<Documents and Settings>\All Users\Documents\AQtrace Files\SDK
The SDK folder contains the following subfolders for 32- and 64-bit AQtrace modules:
●
<SDK>\Modules\x86 - 32-bit version of the modules
●
<SDK>\Modules\x64 - 64-bit version of the modules
The AQtrace Report Monitor executable and a template of the Report Monitor’s settings file can be
found in the <SDK>\Modules\Common folder.
© 2011 SmartBear Software
smartbear.com/support
228
AQtrace Reporter
Installation Folder
The installation package of your product must include AQtrace Reporter modules and the installation
wizard must copy them to the end-users computer to the folder, from which your application will be able to
load them during the run.
It is recommended to install AQtrace Reporter’s modules into the folder of your application’s
executable. This is the easiest way to make the modules available to your executable. This approach will
also help you avoid possible compatibility problems in case that later versions of your application use a later
version of AQtrace.
If you ship several AQtrace Reporter libraries, then they must be able to load each other. The easiest way
to match this requirement is to place these modules into the same folder. Alternatively, you can place the
libraries into the Windows\System32 folder or add their paths to the PATH environment variable. But we
recommend that you install all AQtrace Reporter modules and your executable into the same folder for
the higher reliability.
Working Under a Debugger
AQtrace Reporter contains special code that intercepts exceptions when they occur and handles them in
an appropriate manner. Since the Reporter intercepts exceptions, the debugger does not get notifications
about them. This makes AQtrace Reporter incompatible with debuggers.
To avoid problems during Reporter initialization, the Reporter checks whether the application is running
under a debugger, and if it is found, by default, the Reporter disables itself and remains disabled until the
application execution is over. Attempts to enable the Reporter by calling the Unlock or GlobalUnlock
methods have no effect.
You can change this default behavior by enabling the Ignore debugger Reporter setting. If this setting is
used, AQtrace Reporter will not be disabled when the application is running under a debugger:
●
●
Launch AQtrace Packager and load your project in it.
Open the Reporter Settings | Reporter Behavior page.
●
Select the Ignore debugger check box of the page.
●
Press Process Module on the AQtrace Packager’s toolbar to apply the changes to the executable
of your native (unmanaged) application, if you work with a native AQtrace Packager project, or
press Generate Assembly to create the aqReporterInterop.dll assembly applying the changes to it,
if you work with a .NET project.
Specifying Exceptions to Be Traced
AQtrace Reporter monitors the application execution and, if an exception occurs, it generates an error
report, displays a notification window and sends the report to the server. You can specify the type of
exceptions for which the Reporter will generate and send reports. You do this by defining exception filters.
If you set an exception filter, AQtrace Reporter will handle only those exceptions that match the filter
condition. Other exceptions will be handled in the way defined in your application. The following sections
provide a complete description of which exceptions are traced and how to define an exception filter.
About Exception Filters
To specify exceptions to be handled by AQtrace Reporter, you define exception filters. AQtrace Reporter
provides two types of exception filters:
smartbear.com
AQtrace by SmartBear Software
Specifying Exceptions to Be Traced
229
●
Packager-defined exception filters that are specified by using AQtrace Packager.
●
Custom exception filters that are implemented programmatically in your applications by using
AQtrace Reporter’s program interfaces.
Defining exception filters with AQtrace Packager, you can specify types of exceptions to be handled by
AQtrace Reporter and for which of them error reports should be generated. As for Packager-defined filters,
all the exceptions can be organized into the OS exceptions and language exceptions categories (see below).
You can define exception filters on the setting pages of the Exception Filter group in AQtrace Packager (see
below).
Using custom exception filters, you can create a more flexible and powerful filtering mechanism and
implement your own algorithm for handling exceptions. You can analyze more information which is relevant
to an exception and make a decision whether to generate an error report in this or that case. AQtrace Reporter
allows you to define several custom filters that can work one by one checking different conditions and
filtering various exceptions in your application. However, in most cases, you can use just Packager-defined
filters that are much easier to create and use. Exception filters defined with AQtrace Packager allow you to
achieve most goals of exception filtering.
Custom exception filters are optional and you can use either only Packager-defined filters, or combine
them with custom filters. However, if you implement custom filters in your code, you should keep in mind
that they will have a higher precedence than Packager-defined filters.
A typical handling of an exception with filters looks like this:
1. When an exception occurs, the first registered custom filter starts handling it, as custom exception
filters have a higher precedence than Packager-defined filters.
2. Depending on the criteria specified in the current custom exception filter, one of the following
actions can be performed by the filter:
●
The filter can skip the exception without generating an error report and without further
handling of it by the other exception filters.
●
The filter can stop filtering and generate an error report immediately.
●
The current filter can pass the exception to the next filter for handling.
3. If all the custom filters pass the exception for further handling and do not generate an error report,
the exception is processed by the filter defined with AQtrace Packager. Depending on the settings
that were specified in AQtrace Packager, this filter can either generate an error report or ignore the
exception.
Exception Categories
Exceptions can be organized into two categories: OS exceptions and language exceptions. OS and
language exceptions differ in the way they are raised. OS exceptions are raised by certain operating system
functions, while language exceptions are raised by the functions provided by the libraries that were used to
create the application. This division of exceptions is logical and is applied only to Packager-defined filters
due to the specifics of their definition. This classification of exceptions is meaningless for custom exception
filters, because they handle both OS and language exceptions.
●
OS exceptions - This category includes exceptions that are generated at system level. The codes of
these exceptions are hardware-generated. These are exceptions like access violation, stack
overflow, division by zero, illegal instruction and so on.
Each OS exception is identified by its code. Below are constants that correspond to the most
frequent exceptions. For detailed information about these constants, see the description of the
EXCEPTION_RECORD structure in the MSDN Library (http://msdn.microsoft.com):
●
EXCEPTION_ACCESS_VIOLATION
© 2011 SmartBear Software
smartbear.com/support
230
AQtrace Reporter
●
EXCEPTION_ARRAY_BOUNDS_EXCEEDED
●
EXCEPTION_BREAKPOINT
●
EXCEPTION_DATATYPE_MISALIGNMENT
●
EXCEPTION_FLT_DENORMAL_OPERAND
●
EXCEPTION_FLT_DIVIDE_BY_ZERO
●
EXCEPTION_FLT_INEXACT_RESULT
●
EXCEPTION_FLT_INVALID_OPERATION
●
EXCEPTION_FLT_OVERFLOW
●
EXCEPTION_FLT_STACK_CHECK
●
EXCEPTION_FLT_UNDERFLOW
●
EXCEPTION_ILLEGAL_INSTRUCTION
●
EXCEPTION_IN_PAGE_ERROR
●
EXCEPTION_INT_DIVIDE_BY_ZERO
●
EXCEPTION_INT_OVERFLOW
●
●
EXCEPTION_INVALID_DISPOSITION
EXCEPTION_NONCONTINUABLE_EXCEPTION
●
EXCEPTION_PRIV_INSTRUCTION
●
EXCEPTION_SINGLE_STEP
●
EXCEPTION_STACK_OVERFLOW
By default, AQtrace Reporter handles all of these exceptions. You can add new exceptions to or
remove existing exceptions from the list in the OS Exceptions page of AQtrace Packager.
The OS exceptions category is meaningful only for native applications. When a system
exception occurs in a .NET (managed) application, it is mapped to the corresponding
.NET exception class and the Reporter handles it as a .NET exception. For instance,
when an EXCEPTION_INT_DIVIDE_BY_ZERO exception occurs as a result of
integer division by zero in your managed code, AQtrace Reporter interprets and handles
it as a System.DivideByZeroException .NET exception.
●
Language exceptions - This category includes software-generated exceptions. These are
exceptions defined in your application and in third-party libraries and components that are used by
your code. They are identified by class name. For instance, in Delphi you can define an
EMyCustomException class that is inherited from the TException class (which is a base
class for exceptions in the VCL library). You can then raise EMyCustomException from your
code whenever it is needed.AQtrace is able to detect these exceptions and handle them by
generating reports and sending them to the server.
Note: AQtrace supports language exceptions in Visual C++, Delphi, C++Builder and .NET
applications.
Exceptions That are Excluded Automatically
smartbear.com
AQtrace by SmartBear Software
Specifying Exceptions to Be Traced
231
Some Windows API functions raise exceptions during their work and handle them properly. AQtrace
Reporter traces these exceptions, but neither generates error reports, nor processes them, since these
exceptions are part of normal function execution, and they do not mean the function performs an erroneous
action. In other words, these exceptions are automatically ignored. It applies equally to Packager-defined and
custom exception filters.
Below is a list of Windows API functions that raise exceptions that are ignored by AQtrace Reporter:
●
IsBadCodePtr
●
IsBadHugeReadPtr
●
IsBadHugeWritePtr
●
●
IsBadReadPtr
IsBadStringPtrA
●
IsBadStringPtrW
●
IsBadWritePtr
Defining Exception Filters by AQtrace Packager
To define exception filters, use pages of the Exception Filter group in AQtrace Packager.
To define the OS exceptions filter:
●
Launch AQtrace Packager and load your project in it.
●
Open the Exception Filter | OS Exceptions page. It contains a list of OS exceptions that can be
handled.
●
Select the Active check box for the exceptions to be included in the filter.
As all the exceptions in .NET applications are interpreted by the Reporter as .NET exception
classes, the Exception Filter | OS Exceptions page is not displayed in .NET AQtrace Packager
projects. For .NET applications, you should specify the desired system exceptions as corresponding
.NET exception class names on the Exception Filter | .NET Exceptions setting page. For instance,
add the System.DivideByZeroException class name to the list of exceptions to be filtered
if you want to trace integer divizion by zero. The .NET Exceptions page is visible only in .NET
configuration projects.
To define the language exception filter:
●
Open the .NET Exceptions, Visual C++ Exceptions, Delphi Exceptions or C++Builder
Exceptions page. They list exception classes defined in your application’s code.
Note: The Visual C++ Exceptions, Delphi Exceptions and C++Builder Exceptions pages
are visible in AQtrace Packager only if a native configuration project is open. For
.NET configuration projects, only the .NET Exceptions page is displayed. All the
exceptions are specified on this page.
●
Append the desired exception class to the list. To do this:
●
●
Click Add.
Specify the desired class name in the in-place editor and press Enter to confirm the change.
When entering a class name for a native language exception, enter only a class name, do
© 2011 SmartBear Software
smartbear.com/support
232
AQtrace Reporter
not enter a unit name or namespace.
In case of .NET exceptions, specify both the exception's class name and the namespace in
which this class is declared. For instance, the class name of the
DivideByZeroException exception should be specified along with the System
.NET namespace, that is: System.DivideByZeroException.
Note for Visual C++ and C++Builder users: if the exception type is a pointer, use the asterisk
(*) after the class name. For instance, char and char * are treated as different class names.
●
Select the Active check box for those exceptions, which you want to include into the filter.
●
Switch to the Exception Filter | Filter Mode page and select the desired filter mode (for more
information on filter modes, see below).
●
After specifying the exception and filter mode, press Process Module on the Packager’s toolbar to
apply the settings to the executable of your native (unmanaged) application, if you work with a
native AQtrace Packager project, or press Generate Assembly to create the aqReporterInterop.dll
assembly applying the settings to it, if you work with a .NET project in AQtrace Packager and use
AQtrace with your .NET application.
Exceptions in Mixed Code
To trace exceptions in a native application, you need to create a native configuration project in AQtrace
Packager and apply the settings specified in the project to the application’s executable or to a native dynamic
link library. In case of a .NET application, you need to use a .NET configuration project in AQtrace
Packager. As it has been said above, in native projects you can specify system exceptions and native
language exceptions to be traced by the Reporter. In .NET projects you specify .NET exception classes that
correspond to the exceptions to be traced in managed code.
An application to be monitored by the Reporter can contain mixed code, that is, the application includes
both .NET (managed) and native (unmanaged) code. For instance, some managed code from a .NET
executable loads a helper library with native code and calls some function from it. The library, in its turn,
may use code from another library, either native or managed. AQtrace Reporter can trace exceptions either in
managed or in unmanaged code of such applications with mixed code. Both managed and unmanaged code
cannot be monitored simultaneously. This means that the Reporter will monitor only managed or
unmanaged code in one application depending on where AQtrace Reporter was initialized. If the Reporter
was initialized in managed code and the settings specified in a .NET configuration project were applied to it,
exceptions are traced only in managed code. If the Reporter was initialized in a native module and the
settings specified in an AQtrace Packager native configuration project were applied to the Reporter, then it
monitors only unmanaged code.
For example, if an exception occurs in a .NET module that initialized AQtrace Reporter for tracing
exceptions in managed code, the exception can be handled by the Reporter. If this module with managed
code loads a native library to call some routine from it and an exception occurs in this native library, then
AQtrace Reporter cannot catch such an exception. However, if this native library, in its turn, calls some
managed code from another .NET assembly and an exception occurs in this assembly, then AQtrace Reporter
can handle this exception. Similarly, if you applied the Reporter to a native module, then only exceptions in
native modules of the application can be traced by the Reporter, and exceptions in managed code are
ignored.
Filter Modes for Packager-Defined Filters
Exception filters defined in AQtrace Packager can work in normal or inverted mode:
●
When the filters work in normal mode, AQtrace Reporter handles only those exceptions that are
smartbear.com
AQtrace by SmartBear Software
Specifying Modules to Be Traced
233
included in the filters, that is, it handles only those exceptions that are selected in the OS
Exceptions, .NET Exceptions, Visual C++ Exceptions, Delphi Exceptions and C++Builder
Exceptions pages.
●
When the filters work in inverted mode, AQtrace Reporter handles all exceptions that match the
module filter and that are not selected in the setting pages.
You specify the active filter mode on the Exception Filter Mode page.
Note: The filter mode applies to all of the settings made on all setting pages of the Exception Filter
group in AQtrace Packager.
Custom Exception Filters
In addition to exception filters that are defined with AQtrace Packager, AQtrace Reporter allows you to
create custom exception filters. These filters extend the filtering mechanism defined with AQtrace Packager
and let you implement your own algorithm of exception filtering. With the use of custom exception filters,
AQtrace Reporter can handle exceptions in a more flexible way, analyze errors using various criteria and
make a decision whether to generate an error report for an exception.
For instance, custom exception filters allow you to trace a certain exception and generate an error report
when the exception occurs in a certain module of your application, and ignore it in the other modules. You
can also use custom filters to detect, for example, execution of some important code section in your
application, in which an exception occurs, and ignore the exception to let the code section to be executed
completely.
A few notes on custom exception filters:
●
Custom exception filters are created programmatically in the source code of your application with
the use of objects that implement the IaqCustomExceptionFilter program interface.
●
Custom exception filters are not supported for Visual Basic applications.
●
AQtrace Reporter allows creating several custom filters in one application.
●
Custom exception filters handle both OS and language exceptions.
For detailed information on how to create custom exception filters, see Creating Custom Exception
Filters.
Specifying Modules to Be Traced
A typical application uses several modules. When the application starts running, it typically loads
additional modules and DLLs. These can be various third-party libraries, components and operating system
modules (like user32.dll).
You may want to specify the modules, in which AQtrace Reporter will trace exceptions. This will help
you concentrate on your modules and skip exceptions that occur in other modules (for example, in thirdparty libraries) which you cannot recompile.
You specify the modules by defining and using a module filter. By default, the filter is off and AQtrace
Reporter traces exceptions that occur in all modules loaded into the address space of your process. You can
modify the default behavior and specify the filter conditions on the Module Filter Settings page of AQtrace
Packager:
© 2011 SmartBear Software
smartbear.com/support
234
AQtrace Reporter
The Trace exceptions in all modules check box specifies whether the module filter is active or not. To
specify the filter, clear this check box. This will enable controls of the Custom Filter section. This section
contains the list of modules and two radio buttons. The list contains the modules to be affected by the filter.
Using this radio buttons you can set whether the filter will work in normal, or in inverted mode:
●
If the filter functions in normal mode, the Reporter handles exceptions that match the exception
filters and that occur only in those modules that are included in the filter.
●
When filter works in inverted mode, the Reporter does not generate error reports for exceptions
that occur in the modules that are included in the filter. These modules are excluded. That is, the
Reporter handles those exceptions that match the exception filters and that occur in any modules
except for those that are included into the list.
To determine whether to handle or skip the exception, AQtrace Reporter checks the module names of
the two topmost functions in the exception’s call stack (that is, the module name of the topmost function
and the function that follows it). If any of these modules was added to the Module Filter Settings page, then
according to the filter settings, AQtrace Reporter will either continue or stop processing the exception. In
other words, AQtrace Reporter checks not only the module name of the topmost function, but also the
module name of the function that called the topmost function.
This functionality provides better control over exceptions that are caused by errors in third-party DLLs.
Suppose, some third-party library, for example LibA, is loaded to the address space of your process and then
calls a function of the operating system’s user32.dll with invalid parameters. Now suppose that this call
causes an exception in the code of user32.dll. So, your application will display a notification window and
you will receive an error report for the exception that is caused by invalid code of LibA. The problem is that
you might not be able to fix this exception. To avoid the problem, you can include user32.dll in the module
filter. However, in this case, you will not receive error reports for those exceptions that occur within this
smartbear.com
AQtrace by SmartBear Software
Specifying Data to Be Included in Reports
235
DLL and that are caused by invalid function calls made from your code. Since AQtrace Reporter checks the
module names of the two topmost call stack entries, you can add the LibA library to the filter and thus ignore
undesirable exceptions.
To define the module filter:
●
Launch AQtace Packager, load your project in it and open the Module Filter | Filter Settings
page.
●
By default, the Trace exceptions in all modules check box is selected. Clear this check box to
define specific filter conditions. This will enable the Custom Filter section.
●
To append a module to the list, press Add. This will call the standard Open File dialog.
●
In the dialog, select the desired module (you can use Ctrl- or Shift- click for multiselection) and
press Open.
If you do not have the desired module on your computer, you can type the module’s name in the
File Name edit box of the dialog.
Note: When entering the module name, specify only the file name and extension. Do not
specify the path.
●
After adding the module, select the desired filter mode using the radio buttons of the Custom
Filter section (for more information on filter modes, see above).
●
Press Process Module on AQtrace Packager’s toolbar to apply the changes to your executable if
you work with a native AQtrace Packager project. For a .NET project, press Generate Assembly
to create the aqReporterInterop.dll assembly and apply the specified filter settings to it.
Specifying Data to Be Included in Reports
Error reports generated by AQtrace Reporter contain six portions of data:
1. Information that relates to the exception for which the report is generated (information about the
modules loaded by the application, information about the application’s threads, the values of CPU
registers, call stack and memory data).
2. (Optionally) Additional information about processes, services, memory, hard disk space, OS and
its components, network interface card, display and printing devices, installed programs, and
process privileges.
3. (Optionally) Information about exceptions that occurred earlier (that is, before the given exception
occurred). These exceptions are called last-raised exceptions.
4. (Optionally) Information about events raised during the application run before the error occurred.
5. (Optionally) Screenshot of the application’s window or the whole screen.
6. (Optionally) Any custom data (textual or binary) like internal flags, the state of the application’s
subsystems or even various binary files.
Only the first item is always included in error reports. The other items are optional. You can command
AQtrace Reporter to include them by using the AQtrace Packager utility or by programming the Reporter.
The following sections provide a detailed explanation.
1. Information that relates to the exception for which the report was generated
© 2011 SmartBear Software
smartbear.com/support
236
AQtrace Reporter
Each error report contains information that relates to the exception for which the report was generated.
This information includes the following parts:
●
Information about the application’s threads.
●
A list of modules that were loaded to the address space of your application’s process.
●
Information about the stack of function calls for each thread.
●
Information about CPU registers’ values for each thread.
Memory dump of your application.
●
The described data is always included in the error reports. The other data is optional. It is included in
reports according to the Reporter’s settings.
2. Additional information about processes, memory, OS, installed programs and devices
In addition to the information about threads, modules, CPU registers and call stacks that are always
included in error reports, the reports may also contain information about processes, memory, the operating
system, installed programs and hardware used on the end-user’s computer.
To command AQtrace Reporter to include this additional information in reports, you use the settings that
reside on the Additional Reported Data page of the AQtrace Packager utility:
●
●
Launch AQtrace Packager and load your project in it.
Open the Reporter Settings | Additional Reported Data page.
●
Use the check boxes on this page to specify additional data that you would like the Reporter to
include in the generated reports.
For detailed information on the settings that reside on this page, see the page description.
3. Information about last-raised exceptions
AQtrace Reporter can collect information about last-raised exceptions and add this information into the
generated reports. This additional information may help you find the cause of the exception for which the
report was generated.
To command AQtrace Reporter to save information about last-raised exceptions to generated reports,
select the Last exceptions data check box on the Additional Reported Data page of AQtrace Packager. If the
check box is cleared, reports will only contain information about those exceptions for which these reports
were generated.
On the Additional Reported Data page of AQtrace Packager you can also specify the number of last
exceptions to be included into the reports and the amount of stack data that will be saved for each exception.
The more this value is, the more entries the call stacks will contain, but the larger the report files will be.
AQtrace Viewer displays the list of recently-raised exceptions in the Last Exceptions panel. When you
select an exception in this panel, the Viewer displays the exception’s call stack in the Call Stack panel. You
can then analyze the call stack and application code using other panels of the Viewer (see Analyzing Error
Reports With AQtrace Viewer).
4. Information about events
AQtrace Reporter can trace events of certain types during the application run, collect information about
these events and include it into the generated reports. For each event, AQtrace reporter logs its type, the
identifier of the thread in which the event occurred, the time of raising and some specific details dependent
on the event’s type. The following events are traced by the Reporter when it monitors the application:
●
Raising of an exception.
smartbear.com
AQtrace by SmartBear Software
Displaying a Notification Window
●
237
●
Creation of a user-defined debug message by calling the OutputDebugString Windows API
function.
Loading and unloading of an application module.
●
Creation, closing and termination of an application thread.
●
●
Suspending and resuming of an application thread.
Locking and unlocking of the AQtrace Reporter’s functionality for one application thread.
●
Locking and unlocking of the AQtrace Reporter’s functionality for all threads in the application.
For more information on types of events traced by AQtrace Reporter, see the Event Log Panel help topic.
To command AQtrace Reporter to save information about events to the generated reports, select the
Event log check box on the Additional Reported Data page of AQtrace Packager. If the check box is
cleared, AQtrace Reporter traces events but does not include information about these events into the
generated error reports.
In the Event Log panel, AQtrace Viewer displays a log that contains information about events occurred
during the application run. Also, it is possible to preview such a log on the Event Log tab in the Report
Information dialog before sending an error report.
5. Screenshot
AQtrace Reporter can capture the image of the application’s window or of the whole screen and include
it into the generated error report. The image can be useful, when you are searching for the cause of the
problem. You can see this image in the Screenshot panel of AQtrace Viewer.
To command AQtrace Reporter to capture and include the image to generated reports, do the following:
●
Launch AQtrace Packager and load you project in it.
●
Open the Reporter Settings | Additional Reported Data page.
●
On the page, select the Screenshot check box and then select the desired image type: Application
window or Whole screen.
The captured screenshot contains the image of the mouse pointer, so you can determine which button
was clicked or which check box was selected when the exception occurred.
6. Custom Data
You can also command AQtrace Reporter to add custom data to generated reports. This data can contain,
for example, information about subsystems of your application or information on certain internal flags. Also,
you can include binary files into generated reports. To include custom data, you should create an object
implementing the IaqReporterCallback interface for custom textual data or the
IaqReporterCallback2 interface for binary data and files and register this object in the AQtrace
Reporter object. For more information on this, see Inserting Custom Data Into Reports.
Displaying a Notification Window
When AQtrace Reporter handles an exception, it generates an error report and displays a window that
notifies the user about the exception and suggests that the user sends the report to the developers. Below is a
sample image of the window:
© 2011 SmartBear Software
smartbear.com/support
238
AQtrace Reporter
To specify whether AQtrace Reporter will display the notification window during application execution,
use AQtrace Packager:
●
Open your configuration project in AQtrace Packager.
●
Open the Notification Window | Notification Settings page.
●
The page contains the Show notification window check box. Select this check box to specify that
AQtrace Reporter should display the notification window when an exception occurs during
application execution.
If the check box is clear, AQtrace Reporter does not display the notification window when an error
occurs. However, in this case, the Postpone sending reports check box becomes available. If this
check box is selected, AQtrace Reporter does not send an error report automatically right after an
error occurs. It suggests sending the report when the application is run next time. If both the
Postpone sending reports and Show notification window check boxes are clear, AQtrace Reporter
automatically sends error reports to the developers right after an error occurs, without any
notification.
●
Press Process Module on AQtrace Packager’s toolbar to apply the settings to the executable of
your native (unmanaged) application or press Generate Assembly to create the
aqReporterInterop.dll assembly applying the settings to it, if you use AQtrace with your .NET
application and work with a .NET project in AQtrace Packager.
Using the Notification Settings page of AQtrace Packager you can also specify text to be displayed
within the notification window. For instance:
●
Text to be displayed in the header of the window.
●
Text to be used as the window’s “body text”.
●
The titles and initial state of check boxes that are displayed within the notification window.
●
The captions of the buttons displayed within the window.
smartbear.com
AQtrace by SmartBear Software
Displaying a Notification Window
239
Please pay attention to the Error reports policy link settings. By using these settings, you can specify the
web page that describes the data collection policy adopted by your company. Typically, this page contains
the following information:
●
Description of why error reports are collected.
●
Explanation of how data is sent and stored.
●
Explanation of what data is collected.
●
Description of who has access to reported data.
You can find an example of this type of page on SmartBear’s web site: http://www.smartbear.com/errorreports-policy.
The Text setting of the Error reports policy link group specifies the text that will suggest end-users to
read about your error-reporting policy. This text will be a link that opens the web page that is specified by
the URL setting.
Note: By default, the settings displayed on the Notification Settings page contain default values. The
only exclusion is the URL setting of the Error reports policy link group. You should specify the
URL of your web page in this setting.
The settings on the Notification Settings page are organized into categories. A category is a set of values
that are displayed in the Notification Settings window under the Configuration box. By selecting a category
from this box you can change the values of all settings. This feature helps you create a set of values for
multi-language applications.
Note: After specifying the desired settings, do not forget to click the Process Module toolbar item, if
you use a native AQtrace Packager project, or press Generate Assembly, if you work with a
.NET project in AQtrace Packager. This will apply your changes to your native (unmanaged)
executable or generate the aqReporterInterop.dll assembly using the specified settings,
respectively.
For detailed information on the settings that are available for editing on the Notification Settings page,
see the page description.
When an exception occurs during your application execution and the notification window is displayed,
users can preview the data to be included into the error report before they decide to send it to the developers.
This information is displayed in the Report Information dialog that is shown after clicking the View report
details link in the notification window. The text of this link can also be specified on the Notification Settings
page of AQtrace Packager.
If the I would like to specify my contact info and get on-line support check box is selected in the
notification window before sending an error report, the User Info dialog is invoked after clicking the Send
button. This dialog allows specifying the end-user’s contact information and the description of the problem.
Note that the User Info dialog can also be customized by using the settings from the “User Info” dialog
group displayed on the Notification Settings page of AQtrace Packager. You can specify text to be displayed
as the title of the dialog, text for the dialog’s header, text for the labels of edit boxes and for the captions of
the buttons displayed within the User Info dialog.
You can attach to AQtrace Reporter from your application and perform specific actions upon closing the
notification window. For example, you can release some allocated resources. For more information on this,
see AQtrace Reporter Programming and Performing Specific Actions Upon Closing the Notification
Window.
© 2011 SmartBear Software
smartbear.com/support
240
AQtrace Reporter
Controlling DLL Loading
Some applications inject their dynamic link libraries into the address space of other processes. In certain
cases, the injection may cause errors and you may want to disable injection of DLLs into your process.
AQtrace Reporter detects the attempts to inject dynamic link libraries and lets you control the injection
of DLLs into the address space of your process. So, you can prevent certain DLLs from loading or, on the
contrary, allow the DLLs to be injected into the address space of your process. You define the list of blocked
or allowed DLLs on the Control DLL Loading page of AQtrace Packager:
The page contains a list of modules, whose load AQtrace Reporter will control. If the module is not
included in the list then AQtrace Reporter will not trace its loading, that is, the module can be injected into
the address space of your process.
Each module in the list is specified by its file name (name and extension) and the version number. The
Action column specifies whether AQtrace Reporter will forbid or permit the loading of a module. These
features let you create specific conditions and block only certain versions of some modules (see below).
Note that you should specify all the parts of the version number: major, minor, build and private. Also,
you can use the * wildcard in any part of the version information. The wildcard means “this part can be any
number”. Below are examples of some valid version numbers:
■
1.0.*.* - means any build of the version 1.0.
■
2.*.*.* - means any build or minor version of the version 2.
■
*.*.*.* - means any version of the specified module.
The settings displayed on the following figure prevent the loading of the WinHelper.dll ver. 1.x and
smartbear.com
AQtrace by SmartBear Software
Controlling DLL Loading
241
allow the loading of the version 2.0.1 of this library:
The order of the items in the list is important. When AQtrace Reporter detects that a module is loaded
into the address space of your application, it retrieves the version information from the module and then
searches for the module and its version number in the list. The search is performed in the order of items
appearance in the list. Once the item that corresponds to the module and version is found, AQtrace Reporter
stops to search and performs the action that is specified by the Action value. So, for instance, if you specified
the following conditions --
-- the module WinHelper.dll ver. 1.0.47 will not be loaded into your application’s process despite the
fact that the second condition permits the loading.
To add a module to the list:
●
Launch AQtrace Packager, load your configuration project in it and open the Miscellaneous |
Control DLL Loading page.
●
Press Add to add a new module to the list. This will invoke the standard Open File dialog.
●
In the dialog, select the desired module or modules (you can use Ctrl- or Shift- click for
multiselection) and press Open.
Note: If you do not have the desired module on your computer, you can enter its file name
and extension in the File Name edit box of the Open File dialog.
Enter only the file name and extension. Do not enter the path.
After you press Open in the Open File dialog, the module name will be added to the list (only the
file name and extension will be added, the path will be ignored).
●
If you specified an existing module in the Open File dialog, AQtrace Packager will read this
version information from the module and display it in the Version column. If you specified a nonexisting module, the Packager will use the version *.*.*.*. To change the version information,
© 2011 SmartBear Software
smartbear.com/support
242
AQtrace Reporter
click within the Version cell and enter the version number of the added module. Press Enter to
confirm the change or Esc to cancel it.
We would like to note once again that you should enter all the parts of the version number: major,
minor, build and private. You can also use the * wildcard in any part of the version information.
●
Click within the Action cell and specify the action to be applied to the DLL:
■
Allow - The specified version of the specified DLL can be loaded into your process.
■
Deny - AQtrace Reporter will block the load of the specified module into the address space of
your process.
Press Enter to confirm the change.
●
Press Move Up or Move Down to modify the module’s position in the list.
After changing the list of modules, press Process Module to apply the changes to your executable or
DLL, if you use a native AQtrace Packager project, or press Generate Assembly to generate the
aqReporterInterop.dll assembly applying the changes to it, if you work with a .NET configuration project for
your .NET application. Otherwise, the changes will be saved to the configuration project, but not applied to
your module or the aqReporterInterop.dll assembly.
Including Debug Messages Into Error Reports
Using the OutputDebugString Windows API function in your application’s code, you can insert
messages, that can be useful for debugging of the application, in error reports (for more information on this
function, see the MSDN Library). This function generates an event that is interpreted by AQtrace Reporter as
an exception with the 0x40010006 code. The information about this exception along with the user-defined
debug message, specified as the parameter of the OutputDebugString function, is included by the
Reporter in the error report as last-raised exception information.
Note: In .NET applications, use the System.Diagnostics.Debugger.Log method to insert
debug messages into error reports. For detailed information on this method, see the MSDN
Library.
You can view such user-defined debug messages in the Last Exceptions panel of AQtrace Viewer. And
this can be helpful for analyzing error reports.
To highlight user-defined debug messages among the other last exceptions, the Last Exceptions panel
can display them using a certain highlighting color. You can specify the color that will be used to display
messages of the OutputDebugString function in the OutputDebugString setting of the AQtrace
Viewer’s options. To view or change this setting:
● Select Options | Options from AQtrace Viewer’s main menu.
●
Choose the Panels | General category in the tree on the left of the ensuing Options dialog.
●
Expand the Colors | Last Exceptions setting group on the ensuing General Panels Options page.
Also, an event generated by the OutputDebugString function is traced and logged by AQtrace
Reporter as the Debug String event. You can see the event log, included into an error report, in the Event Log
panel of AQtrace Viewer where you can find messages corresponding to the Debug String events with the
specified debug strings. Such events are marked with the
icon in the panel.
To include helper user messages into error reports, you can also call the
IaqReporterIntf2.AddMessageToLog method of AQtrace Reporter. This method adds a user
smartbear.com
AQtrace by SmartBear Software
AQtrace Reporter Programming
243
message, passed through the method’s parameter, to an event log. The log is displayed in the Event Log
panel of AQtrace Viewer and you can find there user-defined messages when you analyze error reports. User
messages are displayed in the event log as the User Message events and are marked with the
icon.
AQtrace Reporter Programming
AQtrace Reporter Programming - Overview
The AQtrace Reporter functionality is implemented by the aqReporter.dll and dbghelp.dll modules (see
Using AQtrace Reporter - Basic Concepts). The whole procedure of controlling AQtrace Reporter from your
application includes the following steps:
●
●
Load the Reporter’s libraries into your application.
Connect to the AQtrace Reporter object.
●
Call the Reporter’s methods and properties to perform the desired action.
Loading Libraries
AQtrace Reporter is implemented in two dynamic link libraries: aqReporter.dll and dbghelp.dll modules
(see Using AQtrace Reporter - Basic Concepts). The aqReporter library is the “main” library and dbghelp.dll
is a helper module.
The code that loads these libraries into memory is generated and added to your native (unmanaged)
application automatically by the AQtrace Packager utility, which is used to specify AQtrace Reporter’s
settings and apply them to your native application. This code is executed when the application starts. It loads
the libraries and initializes AQtrace Reporter. So, you do not have to write any lines of code to load the
Reporter’s DLLs into your native application (for detailed information, see Using AQtrace Packager With
Native Applications).
AQtrace Packager does not generate and add such code for .NET applications. In order for .NET
applications to use AQtrace Reporter implemented in the aqReporter.dll and dbghelp.dll native libraries,
AQtrace Packager generates the specific aqReporterInterop.dll assembly. This assembly serves as a bridge
between your .NET application and the Reporter’s native DLLs. The aqReporterInterop.dll assembly
contains the Initializer helper class that provides the InitReporter method for loading and
initialization of the Reporter. You should write code that loads the Reporter’s DLLs into your .NET
application and initializes the Reporter by using the Initializer class. For more information, see
Initializing AQtrace Reporter in .NET Applications.
Obtaining Program Interface to AQtrace Reporter
To control the Reporter from your application, you should connect to the aqReporter library and obtain a
program reference to the Reporter object through the IaqReporterIntf or IaqReporterIntf2
interface. The IaqReporterIntf and IaqReporterIntf2 interfaces are implemented by the AQtrace
Reporter object (in Visual Basic applications, IaqReporterIntf is a class that provides program access
to AQtrace Reporter). For detailed information on connecting to the Reporter, see Getting Reference to
AQtrace Reporter.
The AQtrace installation package also includes special modules that make the connection easier. For
more information on them, see the section SDK Files below.
© 2011 SmartBear Software
smartbear.com/support
244
AQtrace Reporter
Calling AQtrace Reporter’s Methods
After you obtain a program reference to the AQtrace Reporter object, you call the object’s methods to
perform the desired actions. The following table briefly describes which methods you can use to perform this
or that task:
Action
Description
To disable or enable
AQtrace Reporter...
Use the GlobalLock, GlobalUnlock, Lock and Unlock, methods
(in Visual Basic applications you use LockForThread and
UnlockForThread rather than Lock and Unlock). See Enabling and
Disabling AQtrace Reporter.
To include custom
textual information in
reports...
Create an object that implements the IaqReporterCallback interface
and register this object in the IaqReporterIntf object with the
AddCallback method. Add code that generates custom textual
information
to
the
OnGenerateReport
method
of
the
IaqReporterCallback object. See Custom Textual Data in Reports for
a detailed description.This functionality is not supported in Visual Basic
applications.
To include custom
binary data in reports...
Create an object that implements the IaqReporterCallback2 interface
and register this object in the IaqReporterIntf2 object with the
AddCallback2 method. Add code that generates custom binary data to
the OnGenerateReport2 method of the IaqReporterCallback2
object or use the OnGenerateReportWithFile2 method of this object
to include external files to reports. See Custom Binary Data in Reports for a
detailed description.
This functionality is not supported in Visual Basic applications.
To create a custom
exception filter...
Create an object that implements the IaqCustomExceptionFilter
interface and register this object in the IaqReporterIntf2 object with
the AddCustomExceptionFilter method. Add code that handles SEH
exceptions
to
the
CheckSEHException
method
of
the
IaqCustomExceptionFilter object and code that handles CLR
exceptions to the CheckDotNetException method of this object,
respectively. See Creating Custom Exception Filters for a detailed
description.
This functionality is not supported in Visual Basic applications.
To generate a report
programmatically...
Use
the
ShowFatalErrorWithMessage
method
of
the
IaqReporterIntf2 interface. See Generating Error Reports on
Demand.
In Visual Basic applications, use the ShowFatalErrorWithMessage
method of the IaqReporterIntf class.
To perform specific
actions upon closing the
notification window...
smartbear.com
Create an object that implements the IaqReporterCallback interface
and register this object in the IaqReporterIntf object with the
AddCallback method. Also, you can create an object that implements the
AQtrace by SmartBear Software
AQtrace Reporter Programming
Action
245
Description
IaqReporterCallback2 interface and register this object in the
IaqReporterIntf2 object with the AddCallback2 method. Add code
that performs specific actions to the OnCloseReporter method of the
IaqReporterCallback object or to the OnCloseReporter2 method
of the IaqReporterCallback2 object, respectively. See Performing
Specific Actions Upon Closing the Notification Window for a detailed
description.
This functionality is not supported in Visual Basic applications.
To
save
additional Use
the
SaveAdditionalInfoAsDump
method
information in a separate IaqReporterIntf2 interface.
dump file...
This functionality is not supported in Visual Basic applications.
of
the
To load an error report Use the ShowReportContents method of the IaqReporterIntf2
from a dump file and interface. The method invokes the Report Information dialog to display the
display its contents...
error report information in it.
This functionality is not supported in Visual Basic applications.
To set a name for a Use the SetThreadName method of the IaqReporterIntf2 interface.
thread...
The specified name of the thread is displayed in the Threads panel of
AQtrace Viewer when an error report is opened with this tool.
This functionality is not supported in Visual Basic applications.
SDK Files
The AQtrace package includes specific source files that simplify the work with AQtrace Reporter from
application code. You can find these files in the <Users>\Public\Documents\AQtrace Files\SDK folder on
Windows 7, Windows Vista and Windows Server 2008 and in the <Documents and Settings>\All
Users\Documents\AQtrace Files\SDK folder on other operating systems. The files are copied to your
computer if you selected the “Prepare your modules for AQtrace” option on the Select AQtrace
Components page of the AQtrace installation wizard.
These files contain the declarations of AQtrace Reporter’s interfaces and source code of the
aqReporterDLL function, that lets you easily get a program reference to AQtrace Reporter in native
applications, and the code of the CaqReporterIntf class, that helps to initialize the Reporter and to
obtain a reference to it in Visual C# applications (see Getting Reference to AQtrace Reporter).
For description of the files that are included in AQtrace SDK, see SDK Files.
SDK Files
The AQtrace package includes specific files that simplify the work with AQtrace Reporter from
application code. These files contain declarations of AQtrace interfaces, methods and properties. They also
contain the code of the aqReporterDLL function, that lets you easily obtain a program reference to
AQtrace Reporter in native applications, and the source code of the CaqReporterIntf class, that helps to
initialize the Reporter and to get a program reference to it in Visual C# applications (see Getting Reference to
AQtrace Reporter).
© 2011 SmartBear Software
smartbear.com/support
246
AQtrace Reporter
The SDK files are copied to your computer if you select the “Prepare your modules for AQtrace” option
on the Select AQtrace Components page of the AQtrace installation wizard.
On Windows 7, Windows Vista and Windows Server 2008, SDK files are located in the
<Users>\Public\Documents\AQtrace Files\SDK\ folder. On other operating systems, the files
reside in the <Documents and Settings>\All Users\Documents\AQtrace Files\SDK\ folder.
Hereinafter, the folder containing SDK files will be denoted as <SDK>.
The SDK files are organized into the following folders:
●
<SDK>\Interfaces - IDL files
●
<SDK>\CPP - C++ files
●
<SDK>\C# - Visual C# files
●
●
<SDK>\Delphi - Delphi units
<SDK>\VB - Visual Basic 6 files
●
<SDK>\Modules - AQtrace Reporter libraries
IDL Files
The <SDK>\Interfaces folder contains the following IDL file:
●
aqReporter.idl
This file contains IDL declarations of AQtrace Reporter interfaces.
C++ Files
AQtrace SDK includes the following C++ files:
●
aqReporter.h - Contains C++ definitions of AQtrace Reporter’s interfaces.
●
aqReporter_EXP.h - Contains the declaration of the aqReporterDLL function.
●
aqReporter_EXP.cpp - Contains source code of the aqReporterDLL function and a helper class.
You can find these files in the <SDK>\CPP folder.
Visual C# Files
AQtrace SDK includes the following C# file:
●
aqReporter_EXP.cs - Contains source code of the CaqReporterIntf helper class.
You can find this file in the <SDK>\C# folder.
Delphi Files
AQtrace SDK includes the following Delphi units:
●
aqReporter_TLB.pas - Contains Delphi definitions of AQtrace Reporter’s interfaces.
●
aqReporter_EXP.pas - Contains source code of the aqReporterDLL function.
You can find these files in the <SDK>\Delphi folder.
Visual Basic 6 Files
AQtrace SDK includes the following files that let you control AQtrace Reporter from your Visual Basic
6 application:
smartbear.com
AQtrace by SmartBear Software
AQtrace Reporter Programming
247
●
aqReporter_EXP.bas - Contains the source code of the aqReporterDLL function.
●
IaqReporterIntf.cls - Contains the source code of a helper class that provides program access to
AQtrace Reporter.
●
aqtSupportVB.dll - Special module that provides program access to AQtrace Reporter.
This module is redistributable and you must ship it along with your application. See Distributing
AQtrace Reporter Libraries.
You can find these files in the <SDK>\VB folder.
Modules
The <SDK>\Modules folder contains the dynamic link libraries that implement the AQtrace Reporter
functionality:
●
aqReporter.dll and
●
dbghelp.dll
There are 32- and 64-bit versions of these modules. You can find them in the following subfolders:
●
●
<SDK>\Modules\x86
<SDK>\Modules\x64
The <SDK>\Modules\Common subfolder holds the AQtrace Report Monitor utility. This utility monitors
the predefined folder where error reports are placed. When a new dump file appears in this folder, the Report
Monitor displays a notification in the Windows system tray and suggests the user sends the error report to the
developer. The utility is useful when there is a need to process errors that occur in processes running under
non-interactive user accounts. Read Using AQtrace With Non-Interactive Processes for details.
Getting Reference to AQtrace Reporter
AQtrace Reporter is implemented in the aqReporter.dll module. The Reporter object implements the
IaqReporterIntf and IaqReporterIntf2 program interfaces. Using these interfaces, you can
control the Reporter’s behavior and perform various specific actions at run time. To control the Reporter
from your code, you need to obtain a program reference to it.
The way you get a reference to the Reporter object depends on whether you develop a native
(unmanaged) or .NET application. The following topics describe how you can obtain a program reference to
AQtrace Reporter through the IaqReporterIntf and IaqReporterIntf2 interfaces in native and
.NET applications.
Getting Reference to AQtrace Reporter in Native Applications
AQtrace Reporter is implemented in the aqReporter.dll module. For native (unmanaged) applications,
the code that loads this module into your application and that initializes AQtrace Reporter is added to your
executable automatically by the AQtrace Packager utility.
The way you obtain a reference to AQtrace Reporter from your code depends on the development tool
that was used to create your application.
To simplify the process of getting the reference, you can use helper code from the AQtrace SDK files
(see below).
© 2011 SmartBear Software
smartbear.com/support
248
AQtrace Reporter
On Windows 7, Windows Vista and Windows Server 2008, SDK files are located in the
<Users>\Public\Documents\AQtrace Files\SDK\ folder. On other operating systems, the files
reside in the <Documents and Settings>\All Users\Documents\AQtrace Files\SDK\ folder.
Hereinafter, a folder containing SDK files will be denoted as <SDK>.
Basic Concepts
To obtain program access to AQtrace Reporter in native applications, call the GetModuleIntf
function exported by the aqReporter library. This routine returns a program reference to the Reporter object
through the IaqReporterIntf interface. Here is its declaration:
[C++]
HRESULT __stdcall GetModuleIntf(IaqReporterIntf**);
[Delphi]
function GetModuleIntf(out Intf: IUnknown): HResult; stdcall;
The whole procedure includes the following steps:
●
Call the Windows API GetModuleHandle function to obtain a handler of the aqReporter.dll
module. This module is already in memory, so you do not need to call LoadLibrary to load it.
●
Call the Windows API GetProcAddress function to obtain the address of the exported
GetModuleIntf function.
●
Call GetModuleIntf to obtain the AQtrace Reporter reference.
The AQtrace Reporter object also implements the IaqReporterIntf2 interface that lets to perform
some useful actions with the Reporter object. As the GetModuleIntf function returns a pointer to the
IaqReporterIntf interface on the Reporter object, you can get a pointer to the IaqReporterIntf2
interface by casting the IaqReporterIntf pointer. Use the QueryInterface method to get access to
the IaqReporterIntf2 interface through the pointer to the IaqReporterIntf interface.
The following code snippets demonstrate how you can obtain references to AQtrace Reporter through
the IaqReporterIntf and IaqReporterIntf2 interfaces:
Visual C++ Example
In order for the following code to execute successfully, specify the path to the aqReporter.h header file
in the Additional Including Directories setting of your Visual C++ project. You can find this file in the
<SDK>\CPP folder.
For simplicity, the sample code does not contain statements that check the function results for errors.
[Visual C++]
#include <aqReporter.h>
...
typedef HRESULT (__stdcall *GETINTFPROC)(IaqReporterIntf**);
IaqReporterIntf* GetReporter()
smartbear.com
AQtrace by SmartBear Software
AQtrace Reporter Programming
249
{
CComPtr<IaqReporterIntf> intf;
HMODULE libHandle;
GETINTFPROC GetModuleIntfProc;
// Obtain the library's handle
libHandle = LoadLibrary(L"aqReporter.dll");
// Get function address
GetModuleIntfProc = (GETINTFPROC)GetProcAddress(libHandle,
"GetModuleIntf");
// Obtain the reference
HRESULT hr = GetModuleIntfProc(&intf);
// Return the result
return intf;
}
IaqReporterIntf2* GetReporter2()
{
CComPtr<IaqReporterIntf> intf;
CComPtr<IaqReporterIntf2> intf2;
// Obtain the pointer to the IaqReporterIntf interface
intf = GetReporter();
// Obtain the pointer to the IaqReporterIntf2 interface
HRESULT hr = intf->QueryInterface(__uuidof(IaqReporterIntf2),
(void**)&intf2);
// Return the result
return intf2;
}
Delphi Example
In order for the following code to execute successfully, add the aqReporter_TLB.pas unit to your Delphi
project. You can find this unit in the <SDK>\Delphi folder.
For simplicity, the sample code does not contain statements that check the function results for errors.
[Delphi]
uses aqReporter_TLB;
© 2011 SmartBear Software
smartbear.com/support
250
AQtrace Reporter
...
function GetReporter : IaqReporterIntf;
...
type
GetModuleIntfType = function(out Intf: IUnknown): HResult; stdcall;
var
LibHandle : DWORD;
Intf : IUnknown;
GetModuleIntfProc : GetModuleIntfType;
begin
// Obtain the library's handle
LibHandle := GetModuleHandle('aqReporter.dll');
// Get procedure address
GetModuleIntfProc := GetProcAddress(LibHandle, 'GetModuleIntf');
// Obtain the reference
GetModuleIntfProc(Intf);
// Return the result
Result := Intf as IaqReporterIntf;
end;
...
function GetReporter2 : IaqReporterIntf2;
var
Intf : IaqReporterIntf;
Intf2 : IUnknown;
begin
// Obtain the IaqReporterIntf reference
Intf := GetReporter();
// Obtain the IaqReporterIntf2 reference
Intf.QueryInterface(IaqReporterIntf2, Intf2);
// Return the result
Result := Intf2 as IaqReporterIntf2;
end;
Using SDK Files for Visual C++ and Delphi Applications
The AQtrace SDK files include special code that simplifies the process of getting the reference to
AQtrace Reporter. These files contain the declaration and source code of the aqReporterDLL function
smartbear.com
AQtrace by SmartBear Software
AQtrace Reporter Programming
251
that performs the steps described above and returns a program reference to the IaqReportIntf object
(that is, a reference to AQtrace Reporter). Once you have this reference, you may call methods of the
IaqReportIntf object to perform the desired actions (see AQtrace Reporter Programming - Overview).
To use the functions, add the following source files to your application:
●
C++ files: <SDK>\CPP\aqReporter_EXP.h, <SDK>\CPP\aqReporter_EXP.cpp
●
Delphi files: <SDK>\Delphi\aqReporter_EXP.pas
The aqReporterDLL function returns the IaqReportIntf reference. To obtain a reference to the
AQtrace Reporter object through the IaqReportIntf2 program interface, use the QueryInterface
method and the IaqReportIntf reference returned by the aqReporterDLL routine.
The following examples demonstrate how you can get references to the AQtrace Reporter object by
using the aqReporterDLL function:
[Visual C++]
#include <aqReporter_EXP.h>
...
void my_func()
{
...
// Getting the IaqReporterIntf program interface to AQtrace
Reporter
CComPtr<IaqReporterIntf> intf = aqReporterDLL();
...
// Getting the IaqReporterIntf2 program interface to AQtrace
Reporter
CComPtr<IaqReporterIntf2> intf2;
intf->QueryInterface(__uuidoff(IaqReporterIntf2), (void**)&intf2);
intf2->ShowFatalErrorWithMessage("A fatal error has occured...");
...
}
[Delphi]
uses aqReporter_TLB, aqReporter_EXP;
...
var
Reporter : IaqReporterIntf;
Reporter2 : IaqReporterIntf2;
begin
...
// Obtain the IaqReporterIntf reference
Reporter := aqReporterDll();
© 2011 SmartBear Software
smartbear.com/support
252
AQtrace Reporter
...
// Obtain the IaqReporterIntf2 reference
Reporter.QueryInterface(IaqReporterIntf2, Reporter2);
Reporter2.ShowFatalErrorWithMessage('A fatal error has occured...');
...
end;
Controlling AQtrace Reporter from Visual Basic Applications
The way you obtain an AQtrace Reporter reference in your Visual Basic application differs from the way
you do this in other applications. For Visual Basic applications you must use the AQtrace SDK files. You
only work with AQtrace Reporter by using the functionality provided by these files. You can find these files
in the <SDK>\VB folder:
●
aqtSupportVB.dll - A helper DLL that serves as a “bridge” between your VB code and AQtrace
Reporter DLLs. aqtSupport.VB.dll is a redistributable module. You must ship it along with your
application.
●
IaqReporterIntf.cls - The file that contains the source code of a helper IaqReporterIntf
class. This class contains methods that let you control AQtrace Reporter from your code. In other
words, these methods provide a program interface to AQtrace Reporter.
●
aqReporter_EXP.bas - This file contains source code of the aqReporterDLL function that
returns a reference to the IaqReporterIntf class.
The general procedure includes the following steps:
●
Add the aqReporter_EXP.bas and IaqReporterIntf.cls from the <SDK>\VB folder to your Visual
Basic folder.
●
Call the aqReporterDLL routine to obtain a reference to the IaqReporterIntf object.
●
Use the methods of this object to control the Reporter.
[Visual Basic]
Dim Reporter As IaqReporterIntf
...
Set Reporter = aqReporterDLL()
...
' Call methods to control AQtrace Reporter
Reporter.ShowFatalErrorWithMessage("A fatal error has occured...")
...
In order for this code to function properly, your application must be able to load the aqtSupportVB.dll
and this DLL must be able to load aqReporter.dll. The easiest way to meet this requirement is to place all
three modules into the same folder. Alternatively, you can place aqtSupportVB.dll and aqReporter.dll into
the Windows\System32 folder or specify the location of these libraries in the PATH environment variable.
Getting Reference to AQtrace Reporter in .NET Applications
AQtrace Reporter is implemented in the aqReporter.dll unmanaged module. In order for .NET
applications to operate with this native library and the Reporter object, you should use the
smartbear.com
AQtrace by SmartBear Software
AQtrace Reporter Programming
253
aqReporterInterop.dll assembly. This assembly is generated by AQtrace Packager for .NET applications and
is used as a “bridge” between .NET modules and the aqReporter.dll native library. Furthermore, AQtrace
Packager does not add to your .NET modules the code that loads and initializes the Reporter. To initialize the
Reporter in a .NET application, you should write initialization code by yourself (use the InitReporter
method of the Initializer class declared in the aqReporterInterop.dll assembly). For more information
on this, see Initializing AQtrace Reporter in .NET Applications.
The Initializer class is used also for getting references to the Reporter in .NET applications. To
simplify the process of getting the reference in Visual C# applications, you can also use helper code from the
AQtrace SDK files (see below).
On Windows 7, Windows Vista and Windows Server 2008, SDK files are located in the
<Users>\Public\Documents\AQtrace Files\SDK\ folder. On other operating systems, the files
reside in the <Documents and Settings>\All Users\Documents\AQtrace Files\SDK\ folder.
Hereinafter, a folder containing SDK files will be denoted as <SDK>.
Basic Concepts
To obtain program access to AQtrace Reporter in .NET applications, call the GetModuleIntf method
of the Initializer class implemented in the aqReporterInterop.dll assembly. This routine returns a
program reference to the Reporter object through the IaqReporterIntf interface. Here is its declaration:
[C#]
public static extern HRESULT GetModuleIntf(out
aqReporterInterop.IaqReporterIntf intf);
GetModuleIntf is declared as a static method of the Initializer class, so, you do not have to
create an Initializer object to call this method and obtain a reference to the Reporter. Note that the
Initializer class is declared in the aqReporterInterop namespace. Keep in mind this when you
use this class.
To be able to use the Initializer class and program interfaces declared in the aqReporterInterop.dll
assembly, you should add a reference to the assembly in your .NET project.
The AQtrace Reporter object also implements the IaqReporterIntf2 interface that lets to perform
some useful actions with the Reporter object. As the GetModuleIntf method returns the
IaqReporterIntf reference, you can get the IaqReporterIntf2 reference to the Reporter object by
casting the IaqReporterIntf one. In Visual C# code, for instance, use the as conversion operator to
cast the IaqReporterIntf interface reference to the IaqReporterIntf2 one.
The following code snippet demonstrates how you can obtain references to AQtrace Reporter through
the IaqReporterIntf and IaqReporterIntf2 interfaces in Visual C#.
In order for the following code to execute successfully, add a reference to the aqReporterInterop.dll
assembly to your Visual C# project. You create this assembly with AQtrace Packager.
For simplicity, the sample code does not contain statements that check the function results for errors.
[C#]
using aqReporterInterop;
...
public IaqReporterIntf GetReporter()
© 2011 SmartBear Software
smartbear.com/support
254
AQtrace Reporter
{
IaqReporterIntf intf;
//Obtain the reference
Initializer.GetModuleIntf(out intf);
//return the result
return intf;
}
public IaqReporterIntf2 GetReporter2()
{
IaqReporterIntf intf;
IaqReporterIntf2 intf2;
//Obtain the IaqReporterIntf reference
intf = GetReporter();
//Convert the reference to the IaqReporterIntf2 type
intf2 = intf as IaqReporterIntf2;
//return the result
return intf2;
}
Using SDK Files for Visual C# Applications
The AQtrace SDK includes the CaqReporterIntf helper class that simplifies the process of getting
the reference to AQtrace Reporter in Visual C# applications. The <SDK>\C#\aqReporter_EXP.cs file
contains the source code of this class. To obtain a program reference to the IaqReportIntf object (that
is, a reference to AQtrace Reporter), you can use the GetModuleIntf method of the
CaqReporterIntf class. This method and class are declared as static, so, there is no need to create an
instance of this class to call the method and obtain the IaqReporterIntf reference. Once you have this
reference, you may call methods of the IaqReportIntf interface to perform the desired actions (see
AQtrace Reporter Programming - Overview). If you need a reference to the Reporter through the
IaqReporterIntf2 interface, you can cast the obtained IaqReporterIntf interface reference to the
IaqReporterIntf2 type using the as operator.
Also, the CaqReporterIntf class provides the Initialize method that initializes the Reporter
object.
To be able to use the CaqReporterIntf class
<SDK>\C#\aqReporter_EXP.cs source file to your Visual C# project.
and
its
methods,
add
the
The following example demonstrates how you can get references to the AQtrace Reporter object by
using the GetModuleIntf method of the CaqReporterIntf helper class.
smartbear.com
AQtrace by SmartBear Software
AQtrace Reporter Programming
255
Note that the CaqReporterIntf class is declared in the aqReporter namespace. Specify this
namespace at the beginning of your code with the using C# directive to shorten your code.
[C#]
using aqReporterInterop;
using aqReporter;
...
void my_proc()
{
...
// Getting the IaqReporterIntf program reference to AQtrace Reporter
IaqReporterIntf intf = CaqReporterIntf.GetModuleIntf();
...
// Getting the IaqReporterIntf2 program reference to AQtrace
Reporter
IaqReporterIntf2 intf2 = intf as IaqReporterIntf2;
...
}
Creating Custom Exception Filters
Custom exception filters are created in addition to the exception filters defined with AQtrace Packager.
These filters let you programmatically implement your own algorithm of exception filtering. Using custom
exception filters, AQtrace Reporter can handle exceptions in a more flexible way.
To create a custom exception filter, you should create and use an object that implements the
IaqCustomExceptionFilter program interface.
Custom exception filters are not supported in Visual Basic applications.
To create a custom exception filter in your application, follow these steps:
1. Create an object that implements the IaqCustomExceptionFilter interface (this object will
be used as the custom exception filter).
2. Obtain a reference to the AQtrace Reporter object through the IaqReporterIntf2 interface
(for more information, see Getting Reference to AQtrace Reporter).
3. Register the created IaqCustomExceptionFilter object in the Reporter by calling the
AddCustomExceptionFilter method implemented in the IaqReporterIntf2 interface.
AddCustomExceptionFilter
returns
an
integer
that
identifies
the
IaqCustomExceptionFilter object. You can use this identifier to unregister the
IaqCustomExceptionFilter object later, when it is not needed anymore, by calling the
RemoveCustomExceptionFilter method implemented in the IaqReporterIntf2
interface.
© 2011 SmartBear Software
smartbear.com/support
256
AQtrace Reporter
4. Use the CheckSEHException or CheckDotNetException callback method to implement
the desired filtering algorithm for handling SEH and CLR exceptions, respectively. In the
CheckSEHException method, you should write code for handling native exceptions, and in the
CheckDotNetException method, you should define a filtering mechanism for .NET managed
exceptions. These callback methods of the registered IaqCustomExceptionFilter object
will be called by AQtrace Reporter when a native or .NET exception occurs. The information
about raised exceptions is passed to these methods through their parameters (see
CheckSEHException and CheckDotNetException). Use this information to analyze a
situation and make a decision whether to generate an error report for an exception or ignore it.
The AddCustomExceptionFilter method appends the IaqCustomExceptionFilter object
to the Reporter’s internal list of callback objects. If you want to use several custom exception filters, you can
create and register more than one IaqCustomExceptionFilter object in the Reporter’s internal list of
callbacks (one callback object for each custom filter).
When an exception occurs, the Reporter calls the appropriate method of the
IaqCustomExceptionFilter object that was registered first.This filter object handles the exception
and can generate an error report for it, skip it without generating any reports, or pass it for handling to the
next custom filter. The next filter object can pass the exception further, too, and so on. If the exception is
passed by the last custom exception filter, it is handled by the Packager-defined exception filter.
Enabling and Disabling AQtrace Reporter
This topic describes how you can enable or disable AQtrace Reporter and provides some important notes
on locking the functionality that is used by the Reporter.
Why Lock AQtrace Reporter
In some cases, you may want to disable AQtrace Reporter during the application run. For instance, you
may want to disable AQtrace Reporter, execute some code and then enable the Reporter. This may happen,
for instance, if your application executes some code that generates an exception, but you expect this
exception and handle it in an appropriate manner. So, to prevent handling the exception with AQtrace
Reporter, you may want to disable AQtrace Reporter before executing your specific code and enable the
Reporter after this code is executed.
How to Enable and Disable AQtrace Reporter
To disable AQtrace Reporter, use the Lock and GlobalLock methods of the IaqReporterIntf
object (in Visual Basic applications use the LockForThread method rather than Lock). For information
on how to obtain the object, see Getting Reference to AQtrace Reporter). Lock (or LockForThread)
disables the Reporter only for one thread. It is actually for the thread that calls the method. GlobalLock
disables the Reporter for all application threads.
To undo the lock (that is, to enable AQtrace Reporter), use the Unlock and GlobalUnlock methods
(in Visual Basic applications use the UnlockForThread method rather than Unlock). Unlock (or
UnlockForThread) works for the thread in which the method is called. GlobalUnlock works for all
application threads.
None of these methods uses parameters:
[Visual C++]
// Getting reference to AQtrace Reporter
smartbear.com
AQtrace by SmartBear Software
AQtrace Reporter Programming
257
CComPtr<IaqReporterIntf> Reporter = GetReporter();
// Disabling AQtrace Reporter
Reporter->Lock(); // or Reporter->GlobalLock()
try{
... // Execute some code here
}
finally
{
// Enabling AQtrace Reporter
Reporter->Unlock(); // or Reporter->GlobalUnlock()
}
[Delphi]
var
Reporter : IaqReporterIntf;
begin
// Getting reference to AQtrace Reporter
Reporter := GetReporter();
// Disabling AQtrace Reporter
Reporter.Lock(); // or Reporter.GlobalLock()
try
... // Execute some code here
finally
// Enabling AQtrace Reporter
Reporter.Unlock(); // or Reporter.GlobalUnlock()
end;
end;
© 2011 SmartBear Software
smartbear.com/support
258
AQtrace Reporter
[C#]
// Getting reference to AQtrace Reporter
IaqReporterIntf Reporter = GetReporter();
// Disabling AQtrace Reporter
Reporter.Lock(); // or Reporter.GlobalLock()
try{
... // Execute some code here
}
finally{
// Enabling AQtrace Reporter
Reporter.Unlock(); // or Reporter.GlobalUnlock()
}
How the Locking Mechanism Works
When disabling and enabling AQtrace Reporter, keep in mind the following specifics of the locking
mechanism:
●
Important note: The “global” and “local” locking methods are two independent filters. They use
different internal counters and do not interfere with each other. That is, a call to GlobalUnlock
does not cancel the “local” lock made for a thread by the Lock method, as well as the Unlock
method does not cancel the “global” lock made by GlobalLock. Both “global” and “local”
locking filters specify whether AQtrace Reporter is enabled or disabled for a certain thread. The
Reporter can monitor a thread only if the Reporter’s functionality is enabled both “globally” and
“locally” for this thread.
●
Each call to a locking method (that is, to GlobalLock, Lock or LockForThread) must have
an appropriate call to the unlocking method (that is, to GlobalUnlock, Unlock or
UnlockForThread). For example, if you call the Lock method three times, you must also call
Unlock three times. Otherwise, the Reporter will remain disabled for the thread, in which you
call these functions.
Generating Error Reports on Demand
Error reports contain information on loaded modules, threads, call stacks and values of CPU registers at
the moment when an exception occurred. This information helps developers find specific conditions of
application functioning. Suppose, one of your functions uses an integer parameter that should not normally
be 0. However, if your code detects that for some reason this parameter is 0, then your application may
command AQtrace Reporter to generate an error report and send this report to your development team. The
developers can then analyze this report and use information about CPU registers and call stacks to find the
cause of the problem.
smartbear.com
AQtrace by SmartBear Software
AQtrace Reporter Programming
259
To
command
AQtrace
Reporter
to
generate
an
error
report,
call
the
ShowFatalErrorWithMessage method of the IaqReporterIntf2 object. This object provides
program access to AQtrace Reporter. For information on how to obtain this object, see Getting Reference to
AQtrace Reporter.
The ShowFatalErrorWithMessage method initiates the normal handling procedure, that is, it
commands the Reporter to generate an error report and to display a notification window. This method
provides the ability to display an informative message in the notification window. The message is specified
as the method’s parameter.
You may want to include some specific information in the generated reports. To do this, you should
create an object implementing the IaqReporterCallback interface (if you want to include custom
textual data) or the IaqReporterCallback2 interface (if you want to add some custom binary data),
register this object in AQtrace Reporter and write code for the object’s OnGenerateReport method (or
for the OnGenerateReport2 method if the object implements the IaqReporterCallback2
interface). For a detailed description of these steps, see Inserting Custom Data Into Reports.
Performing Specific Actions Upon Closing the Notification Window
If the user clears the “Don’t terminate the application” check box and closes the notification window, the
application will be terminated. AQtrace Reporter gives your application the possibility to perform specific
actions upon closing the notification window. For instance, the application may release specific resources or
references.
This topic describes how you can handle the closing of a window, create an object implementing the
IaqReporterCallback interface and register this object in AQtrace Reporter.
The described functionality is not supported in Visual Basic applications.
To perform specific actions upon closing the notification window:
1. Create an object that implements the IaqReporterCallback interface.
2. Obtain a reference to the AQtrace Reporter object (for more information on this, see Getting
Reference to AQtrace Reporter).
3. Register the IaqReporterCallback object in the Reporter by calling the AddCallback
method of the AQtrace Reporter object (this method is provided by the IaqReporterIntf
interface).
The AddCallback method returns an integer number that identifies
IaqReporterCallback object. You can use this identifier to unregister the object.
the
After you register the IaqReporterCallback object, the Reporter will call the object’s
OnCloseReporter method when the notification window is closed.
4. When AQtrace Reporter is finalized or when additional information is not needed anymore,
unregister
the
IaqReporterCallback
object
by
calling
the
IaqReporterIntf.RemoveCallback method. This method has only one parameter that
specifies the object’s identifier that was returned by the AddCallback method.
The OnCloseReporter method of the IaqReporterCallback object is called after the
notification window is closed. You can use this method to perform specific actions upon closing the window.
The method has the following syntax:
© 2011 SmartBear Software
smartbear.com/support
260
AQtrace Reporter
[IDL]
HRESULT OnCloseReporter(VARIANT_BOOL Terminate);
The Terminate parameter specifies whether the application will be closed. You can use this parameter to
decide which actions the application should perform.
Note: To perform specific actions upon closing the notification window, you can also use the
OnCloseReporter2 method of the IaqReporterCallback2 interface. For this purpose,
you need to perform actions similar to those described above. The difference is that the
IaqReporterCallback2 interface is used, and the objects that implement this interface are
registered in the Reporter by calling the AddCallback2 method of the
IaqReporterIntf2 interface.
Inserting Custom Data Into Reports
Generated error reports contain information about threads, CPU registers, call stack and memory data.
You can also modify certain settings of AQtrace Reporter so that the reports include additional information
about the operating system, processes running in the operating system, services, installed programs, network,
display devices, printers, physical and virtual memory and hard-disk space (see Specifying Data to Be
Included in Reports).
You can also include custom data into reports if needed. For instance, you may want to include
information on your application’s subsystem or information about certain internal flags. Also, you may want
to include some binary files that can help to analyze bug reports.
The following topics describe how you can insert various custom data into generated error reports.
Custom Binary Data in Reports
You can add custom binary data into error reports, that is, AQtrace Reporter includes in a dump one or
more files with various binary data. For instance, you may need to send with a bug report some specific files
with custom data that may be useful for the report analysis and search for the reason of the exception. These
files are included in the dump file, but with AQtrace Viewer you can view their contents and save them as
separate files. The list of the included binary files is shown on the Binary Data tab of the Additional
Information panel in AQtrace Viewer.
The insertion of custom binary data into error reports like the insertion of textual custom data is possible
only with the use of the Reporter’s programming interfaces. You cannot specify custom data to be included
in reports by using the AQtrace Packager utility.
To include a custom binary file into the error report, you should create and use an object implementing
the IaqReporterCallback2 interface (see below).
The insertion of custom binary data by AQtrace Reporter is not supported for Visual Basic
applications.
To implement the IaqReporterCallback2 interface, follow these steps:
1. Create an object that implements the IaqReporterCallback2 interface.
2. Obtain a reference to the AQtrace Reporter object (for more information on this, see Getting
smartbear.com
AQtrace by SmartBear Software
AQtrace Reporter Programming
261
Reference to AQtrace Reporter).
3. Register the created IaqReporterCallback2 object in the Reporter by calling the
AddCallback2 method of the AQtrace Reporter object.
The AddCallback2 method returns an integer value that identifies
IaqReporterCallback2 object. You can use this identifier to unregister the object.
the
After you register the IaqReporterCallback2 object, AQtrace Reporter will call the
object’s
OnGenerateReport2 and OnGenerateReportWithFile2 methods on
generating reports, thus, giving you a possibility to insert custom binary data into the report.
4. When AQtrace Reporter is finalized or when additional information is not needed anymore,
unregister
the
IaqReporterCallback2
object
by
calling
the
IaqReporterIntf2.RemoveCallback2 method. This method has only one parameter that
specifies the identifier of the object to be removed. This is the identifier that was returned by the
AddCallback2 method.
The AddCallback2 method appends the IaqReporterCallback2 object to the Reporter’s
internal list of callback objects. The Reporter calls the OnGenerateReport2 and
OnGenerateReportWithFile2 methods of these objects when generating data to be included in the
report. In these methods, you can write some code, which will specify the data to be inserted into the report.
Note: Both the OnGenerateReport2 and OnGenerateReportWithFile2 methods insert
files in error reports. The difference between these methods is that the
OnGenerateReportWithFile2 method allows to insert an external file and you only need
to specify the file name for it. Also, this method allows to remove the external file after inserting
it, if you want. And the OnGenerateReport2 method allows to insert custom binary data
allocated in the memory. That is, using this method, your application can generate some binary
data in the memory, save it into the error report as binary file and send to the developers team.
You can also read and load the contents of some external file to the memory and then insert it in
the report by using the OnGenerateReport2 method, but using of the
OnGenerateReportWithFile2 method will be easier to do this. For more information, see
the description of the OnGenerateReport2 and OnGenerateReportWithFile2
methods.
If you want to include into the error report more than one binary file, you should add several
IaqReporterCallback2 objects to the Reporter’s internal list of callbacks (add one callback object for
one file to be inserted). When AQtrace Reporter is generating data for the report, it calls the
OnGenerateReport2 and OnGenerateReportWithFile2 methods for each of the registered
IaqReporterCallback2 objects. So, each execution of the OnGenerateReport2 or
OnGenerateReportWithFile2 methods includes one binary file into the error report.
Note that you can view easily the contents of the included binary files while analyzing the error report
with AQtrace Viewer. This utility displays the list of the included files on the Additional Information panel.
And when you double-click the desired file in the list, AQtrace Viewer launches the corresponding
application and opens the binary file with it (if the file’s type is registered in the system). Also, you can save
the attached file separately, as an external one (see Additional Information Panel for more information).
Custom Textual Data in Reports
© 2011 SmartBear Software
smartbear.com/support
262
AQtrace Reporter
In addition to general information included into reports (for instance, information about the operating
system, threads, processes, CPU registers, call stack, memory data and so on) you can also insert custom
textual data into error reports. For instance, you may want to include various textual information on your
application’s subsystem that can be helpful in bug report analysis. You can view the added custom data in
the Additional Information panel of AQtrace Viewer.
To include custom textual data into the error report, you should create and use an object implementing
the IaqReporterCallback interface (see below).
The insertion of custom data is not supported for Visual Basic applications.
To implement the IaqReporterCallback interface in your application, follow these steps:
1. Create an object that implements the IaqReporterCallback interface.
2. Obtain a reference to the AQtrace Reporter object (for more information on this, see Getting
Reference to AQtrace Reporter).
3. Register the created IaqReporterCallback object in the Reporter by calling the
AddCallback method of the AQtrace Reporter object.
The AddCallback method returns an integer value that identifies
IaqReporterCallback object. You can use this identifier to unregister the object.
the
After you register the IaqReporterCallback object, AQtrace Reporter will call the object’s
OnGenerateReport method on generating reports, thus, giving you a possibility to insert
custom data into the report.
4. When AQtrace Reporter is finalized or when additional
unregister
the
IaqReporterCallback
IaqReporterIntf.RemoveCallback method. This
specifies the identifier of the object to be removed. This is
AddCallback method.
information is not needed anymore,
object
by
calling
the
method has only one parameter that
the identifier that was returned by the
The AddCallback method appends the IaqReporterCallback object to the Reporter’s internal
list of callback objects. The Reporter calls the OnGenerateReport method of these objects when
generating data to be included in the report. You can write code for this method to specify the data to be
inserted into the report.
Custom textual data inserted with the OnGenerateReport method will be displayed in the
Additional Information panel of AQtrace Viewer. You can specify the category name for the inserted data.
For each category of custom data inserted into the report an individual tab will be created in the Additional
Information panel. The specified category name will be used as the caption of the corresponding tab
displayed in the Additional Information panel. The inserted textual data can have an arbitrary format.
You can include in reports more than one category of custom textual data. In that case you should use
several IaqReporterCallback object. Append so many callback objects to the Reporter as many
categories of custom textual data you want to insert into the error report.
AQtrace includes sample projects that demonstrate how you can create the IaqReporterCallback
objects and insert custom textual data into reports:
<AQtrace Samples>\Sources\CPP\SampleApp - source code files of Visual C++ sample
<AQtrace Samples>\Sources\C#\SampleApp - source code files of Visual C# sample
smartbear.com
AQtrace by SmartBear Software
AQtrace Packager
263
<AQtrace Samples>\Sources\Delphi\SampleApp - source code files of Delphi sample
AQtrace Packager
AQtrace Packager is a tool that is used to specify AQtrace Reporter settings and apply them to the
unmanaged module, whose execution the Reporter will monitor, or generate the aqReporterInterop.dll
assembly that will store these settings and serve as a bridge between the .NET application to be monitored
and the Reporter that is implemented in the unmanaged aqReporter.dll library. The settings you specify in
AQtrace Packager can be saved to a configuration project. AQtrace Packager provides two types of
configuration projects:
●
Native projects - allows you to specify the Reporter settings and apply them to a native
(unmanaged) module.
●
.NET projects - allows you to specify the Reporter settings and create the aqReporterInterop.dll
assembly using these settings.
The Reporter settings stored in the Packager project are then applied to other modules or to the same
module after it is built, for a native project, or can be used for generating other versions of the
aqReporterInterop assembly, if you use the .NET project.
AQtrace Packager is installed if you select the “Prepare your modules for AQtrace” option on the Select
AQtrace Components page of the AQtrace installation wizard. The utility’s file name is
<AQtrace>\Bin\AQtracePackager.exe.
The following topics provide detailed information on using AQtrace Packager.
Using AQtrace Packager With Native Applications
When you want to trace execution of your native (unmanaged) application with AQtrace Reporter, you
should use AQtrace Packager to specify the Reporter’s settings and apply them to the native executable.
Using AQtrace Reporter’s settings you can control various aspects of the Reporter’s behavior, specify
exceptions and modules to be traced and specify data to be included in error reports. All of the settings are
saved to a configuration project. For native applications, AQtrace Packager uses native configuration
projects. By opening a native project in the Packager, you can quickly load the desired settings and then
apply them to your unmanaged executable.
This topic provides information about using AQtrace Packager with native applications and creation of
native configuration projects. To learn how to work with .NET projects and apply the Reporter’s settings to
.NET applications, see Using AQtrace Packager With .NET Applications.
A typical work session of preparing a native application for further tracing includes the following steps:
1. Creating a new or opening an existing native project.
2. Specifying the native executable, to which AQtrace Reporter will be applied.
3. Defining the Reporter’s settings.
4. Processing the executable.
5. Saving and closing the project.
The following sections of this topic provide more information for each of these steps.
1. Creating or Opening a Native Project
© 2011 SmartBear Software
smartbear.com/support
264
AQtrace Reporter
The first step in using AQtrace Packager is creating (or opening) a project. Until the project is created (or
opened) the Packager displays only its Start Page. This page provides commands that allow to create a new
configuration project of one of the possible types (native or .NET), open an existing project or select one of
the recently opened projects from the list.
To create a new native project:
●
Select the Create Native Project command from the Packager’s Start Page.
-- or --
●
Select File | New | Native Project from the main menu.
To open a project that you created earlier:
●
Select the Open Existing Project command from the Packager’s Start Page and choose the
desired project file in the ensuing Open File dialog.
-- or --
●
Select File | Open from the main menu and then choose the desired project file in the ensuing
Open File dialog.
To open a recently used project file:
●
Select the desired file name from the Recent Projects list on the Packager’s Start Page.
-- or --
●
Use the File | Recent command from the main menu and select the desired file name from the
subsequent submenu.
2. Specifying the Executable
The native configuration project stores AQtrace Reporter’s settings and the name of the unmanaged
executable, to which the Reporter will be applied.
To specify the executable:
●
Activate the Module Information page by selecting Module | Module Information from the list
on the left of the Packager’s window.
●
Specify the fully-qualified name of the desired executable in the File Name box of the page. You
can either type the file name, or press the ellipsis button and choose the desired module in the
ensuing Open File dialog.
If the specified file exists, AQtrace Packager will display the file’s attributes and version information on
the Module Information page.
3. Specifying Reporter Settings
The Packager organizes the settings into a number of pages and lists the pages’ titles on the left of the
window. To modify settings, you select the desired item on the left and the Packager displays the appropriate
settings page on the right of the window.
AQtrace Reporter includes a lot of settings, which you can use to customize almost any aspect of
AQtrace Reporter’s behavior. For instance:
●
Using pages of the Exception Filter and Module Filter groups allows you to specify the
exceptions and modules to be traced by the Reporter.
●
By using the Notification Settings page you can define text to be displayed within the notification
window and specify whether the Reporter will display this window or not.
●
By using the Additional Reported Data page you can specify what extra information about the
smartbear.com
AQtrace by SmartBear Software
AQtrace Packager
265
exceptions and the end-user computer AQtrace Reporter will collect and include into the generated
reports.
For detailed information on settings, see AQtrace Packager Settings Pages.
For some settings you can leave default values, but some others require your attention:
●
Reporter Settings | Sending page
Use this page to specify the transfer protocol(s) and the settings that are required to use the
protocol(s) for sending error reports. These settings are critical. You must specify them in order for
AQtrace Reporter to be able to send the reports. For more information, see the description of the
Sending page.
●
Reporter Settings | Product Information page
This page contains the Product identifier and Product version settings, whose values are used to
indicate the product, for which error reports will be generated. AQtrace Reporter will save these
settings to each report it generates. Issue-tracking plug-ins use this string to determine the product
and version for which the report was generated. So, these values are helpful, if you use AQtrace
Reporter in several of your products or in several versions of the same product.
●
Notification Window | Notification Settings page
This page contains settings that specify whether AQtrace Reporter displays a notification window
and defines the text to be displayed within the window. You can leave the default values in all
settings, except for the Error reports policy link, URL. This setting does not have a default
value. You should specify the URL in it. This is the URL of the web page that contains
information corresponding to the displayed text. Typically, this page describes the data collection
policy adopted in your company to end-users.
4. Processing the Native Executable
After specifying the desired settings, you should command AQtrace Packager to “apply” the settings and
AQtrace Reporter to your unmanaged module. To do this, click the Process Module button on the AQtrace
Packager’s toolbar (this button is displayed only if you work with native configuration projects).
This step is important. If you skip it, the changes that you made to the settings will be saved to the
project, but they will not be applied to the executable.
Note: Before applying AQtrace Reporter to your native module, AQtrace Packager creates a backup
copy of the module so that you can restore the original copy of the module from it.
Currently, you can process a module with AQtrace Packager only once. If you need to re-apply
the Reporter to your module, you can apply it to the backup copy of the module or you can
recompile the module and then process it with the Packager.
5. Saving and Closing the Project
To save the changes made to the project, choose File | Save from the main menu of the Packager. Using
the File | Save As menu item you can save the configuration project under a new name.
To close the project, choose File | Close. If the project has unsaved changes, the Packager will ask you
whether you want to save the changes.
Command Line
© 2011 SmartBear Software
smartbear.com/support
266
AQtrace Reporter
AQtrace Packager can be used from the command line. This feature lets you launch the Packager with
various tools that automate software builds. For more information on the command-line arguments, see
AQtrace Packager Command Line.
Using AQtrace Packager With .NET Applications
When you want to trace execution of your .NET application with AQtrace Reporter, you should use
AQtrace Packager to specify the Reporter’s settings and generate the aqReporterInterop.dll assembly
applying these settings to it. This assembly is used as a bridge between a managed assembly of your .NET
application and the native aqReporter dynamic link library that implements the Reporter functionality. For
more information on the aqReporterInterop assembly, see Creating the aqReporterInterop Assembly.
Using AQtrace Reporter’s settings you can control various aspects of the Reporter’s behavior, specify
exceptions and modules to be traced and specify data to be included in error reports. All of the settings are
saved to a configuration project. For .NET applications, AQtrace Packager uses .NET configuration
projects. By opening a .NET project in the Packager, you can quickly load the desired settings and then
generate the aqReporterInterop assembly applying these settings to it. Then you can use the generated
assembly that contains the specified Reporter’s settings with your .NET application.
This topic provides information about using AQtrace Packager with .NET applications and creation of
.NET configuration projects. To learn how to work with native projects and apply the Reporter’s settings to
unmanaged applications, see Using AQtrace Packager With Native Applications.
A typical work session of preparing a .NET application for further tracing includes the following steps:
1. Creating a new or opening an existing .NET project.
2. Specifying the path to the folder, where the aqReporterInterop assembly should be created.
3. Defining the Reporter’s settings.
4. Generating the aqReporterInterop assembly.
5. Initializing the Reporter from the .NET application using the generated assembly.
6. Saving and closing the project.
The following sections of this topic provide more information for each of these steps.
1. Creating or Opening a .NET Project
The first step in using AQtrace Packager is creating (or opening) a project. Until the project is created (or
opened) the Packager displays only its Start Page. This page provides commands that allow to create a new
configuration project of one of the possible types (native or .NET), open an existing project or select one of
the recently opened projects from the list.
To create a new .NET project:
●
Select the Create .NET Project command from the Packager’s Start Page.
-- or --
●
Select File | New | .NET Project from the main menu.
To open a project that you created earlier:
●
Select the Open Existing Project command from the Packager’s Start Page and choose the
desired project file in the ensuing Open File dialog.
-- or --
●
Select File | Open from the main menu and then choose the desired project file in the ensuing
smartbear.com
AQtrace by SmartBear Software
AQtrace Packager
267
Open File dialog.
To open a recently used project file:
●
Select the desired file name from the Recent Projects list on the Packager’s Start Page.
-- or --
●
Use the File | Recent command from the main menu and select the desired file name from the
subsequent submenu.
2. Specifying the Path to the Folder, Where aqReporterInterop Should be Created
The .NET configuration project stores AQtrace Reporter’s settings and the path to the folder, where the
aqReporterInterop assembly should be generated.
To specify the path to the destination folder:
●
Activate the Reporter Assembly Information page by selecting Reporter Assembly | Reporter
Assembly Information from the list on the left of the Packager’s window.
●
Specify the fully-qualified path and name of the destination folder in the Output folder box on the
settings page. You can either type the path to the folder and its name, or press the ellipsis button
and choose the desired folder in the ensuing Browse for Folder dialog.
3. Specifying Reporter Settings
The Packager organizes the settings into a number of pages and lists the pages’ titles on the left of the
window. To modify settings, you select the desired item on the left and the Packager displays the appropriate
settings page on the right of the window.
AQtrace Reporter includes a lot of settings, which you can use to customize almost any aspect of
AQtrace Reporter’s behavior. For instance:
●
Using pages of the Exception Filter and Module Filter groups allows you to specify the
exceptions and modules to be traced by the Reporter.
●
By using the Notification Settings page you can define text to be displayed within the notification
window and specify whether the Reporter will display this window or not.
●
By using the Additional Reported Data page you can specify what extra information about the
exceptions and the end-user computer AQtrace Reporter will collect and include into the generated
reports.
For detailed information on settings, see AQtrace Packager Settings Pages.
For some settings you can leave default values, but some others require your attention:
●
Reporter Settings | Sending page
Use this page to specify the transfer protocol(s) and the settings that are required to use the
protocol(s) for sending error reports. These settings are critical. You must specify them in order for
AQtrace Reporter to be able to send the reports. For more information, see the description of the
Sending page.
●
Reporter Settings | Product Information page
This page contains the Product identifier and Product version settings, whose values are used to
indicate the product, for which error reports will be generated. AQtrace Reporter will save these
settings to each report it generates. Issue-tracking plug-ins use this string to determine the product
and version for which the report was generated. So, these values are helpful, if you use AQtrace
Reporter in several of your products or in several versions of the same product.
●
Notification Window | Notification Settings page
© 2011 SmartBear Software
smartbear.com/support
268
AQtrace Reporter
This page contains settings that specify whether AQtrace Reporter displays a notification window
and defines the text to be displayed within the window. You can leave the default values in all
settings, except for the Error reports policy link, URL. This setting does not have a default
value. You should specify the URL in it. This is the URL of the web page that contains
information corresponding to the displayed text. Typically, this page describes the data collection
policy adopted in your company to end-users.
4. Generating the aqReporterInterop Assembly
After specifying the desired settings, you should command AQtrace Packager to generate the
aqReporterInterop assembly “applying” the settings to it. To do this, click the Generate Assembly button on
the AQtrace Packager’s toolbar (this button is displayed only if you work with .NET configuration projects).
This step is important. If you skip it, the changes that you made to the settings will be saved to the
project, but the assembly storing these new Reporter’s settings will not be generated.
If the aqReporterInterop assembly already exists in the specified folder, AQtrace Packager displays the
appropriate informative message and suggests to replace the existed assembly with the generated one or
cancel the creation of the assembly.
5. Initializing AQtrace Reporter from the .NET Application
As opposed to native executables, .NET modules are not modified by AQtrace Packager. When the
Packager processes an unmanaged module, it injects special code that will initialize automatically AQtrace
Reporter. As for .NET modules, you should write the initialization code by yourself.
To initialize the Reporter from your .NET module, you use the InitReporter method of the
Initializer class implemented in the aqReporterInterop assembly. Note that you should add a reference
to the aqReporterInterop assembly to your .NET application’s project before using it. By calling the
InitReporter method, your application initializes the Reporter implemented in the aqReporter.dll library
and applies the specified settings to it. After initialization, you can use the program interfaces implemented
in the aqReporterInterop managed assembly to control the Reporter implemented in the aqReporter
unmanaged library (for more information on this, see Using AQtrace Reporter in .NET Applications).
Note that for the higher reliability we recommend you to place the aqReporterInterop.dll assembly to the
same folder where your .NET executable resides. For detailed information on AQtrace Reporter initialization
from .NET applications, see Initializing AQtrace Reporter in .NET Applications.
6. Saving and Closing the Project
To save the changes made to the project, choose File | Save from the main menu of the Packager. Using
the File | Save As menu item you can save the configuration project under a new name.
To close the project, choose File | Close. If the project has unsaved changes, the Packager will ask you
whether you want to save the changes.
Command Line
AQtrace Packager can be used from the command line. This feature lets you launch the Packager with
various tools that automate software builds. For more information on the command-line arguments, see
AQtrace Packager Command Line.
smartbear.com
AQtrace by SmartBear Software
AQtrace Packager
269
AQtrace Packager Command Line
AQtrace Packager uses the following command line:
AQtracePackager.exe
[Config_Project_File_Name[-p[-m:Module_File_Name]]]
The square brackets mean the argument is optional.
Below is the description of the command-line arguments that AQtrace Packager accepts:
●
Config_Project_File_Name - Specifies the path and name of the configuration file to be opened in
AQtrace Packager. If the file path or name contains spaces, enclose this parameter in quotes.
If the command line contains only the project file name and other command line arguments are
absent, then AQtrace Packager will load the specified project when starting.
●
-p - This argument is meaningful only if the Config_Project_File_Name is used. If a native
configuration project is specified, the p argument commands AQtrace Packager to apply the
settings specified by the project to the native executable that is also specified by the project. If a
.NET configuration project is specified, the p argument commands AQtrace Packager to create the
aqReporterInterop.dll assembly in the folder specified in the project and apply the settings from
the project to this assembly. Using the p argument has the same effect as pressing the Process
Module toolbar item in AQtrace Packager in case of a native project or the Generate Assembly
button in case of a .NET project (see the Using AQtrace Packager With Native Applications and
Using AQtrace Packager With .NET Applications topics).
Note: If the p argument is used, the Packager’s window is not displayed on screen. After the
processing is over, AQtrace Packager is closed automatically.
●
-m:Module_File_Name - This argument is meaningful only if the Config_Project_File_Name and
-p arguments are specified and Config_Project_File_Name is a file name of a native configuration
project to be processed by AQtrace Packager. For .NET configuration projects this argument is
ignored. The m argument “tells” the Packager that it should apply the project’s settings to the
native module that is specified by Module_File_Name, but not to the module that is specified by
the project.
Module_File_Name specifies the path and name of the desired module. If this path or name
contains one or more spaces, enclose this parameter in quotes.
Below are several examples of AQtrace Packager’s command line:
AQtracePackager.exe "C:\Work\My Projects\Proj1.aqtdc" -p -m:"C:\Work\My
Projects\My App.exe"
AQtracePackager.exe "C:\Work\My Projects\Proj2.aqtdc" -p
AQtracePackager.exe C:\Work\MyProj1.aqtdc
AQtrace Packager Exit Codes
AQtrace Packager can work in silent mode. The Packager provides the following exit codes, which
report on the processing results:
Exit
Code
Description
© 2011 SmartBear Software
smartbear.com/support
270
AQtrace Reporter
Exit
Code
Description
0
The specified unmanaged module has been processed successfully if a native project was
specified, or the aqReporterInterop.dll assembly has been generated successfully in case of a
.NET configuration project.
-1
Wrong number of arguments or invalid order of arguments.
-2
Invalid project name.
-3
Erroneous format of the module name specified in the -m command-line argument.
-4
The module specified by the -m command-line argument does not exist.
-5
Unable to open the AQtrace Packager project.
-6
The specified module has already been processed with AQtrace Packager.
-7
Other error.
Normally, these codes are of use when AQtrace Packager is launched from a batch file:
REM Clears the screen
CLS
@ECHO OFF
REM Runs AQtrace Packager
"C:\Program Files\SmartBear\AQtrace\Bin\AQtracePackager.exe"
"C:\Work\My Projects\Proj1.aqtc" -p -m:"C:\Work\My Projects\My App.exe"
REM Verifies exit code.
IF ERRORLEVEL 0 GOTO Success
IF NOT ERRORLEVEL 0 GOTO Errors
:Errors
ECHO An error occurred
GOTO End
:Success
ECHO No errors
GOTO End
:End
AQtrace Packager Settings Pages
smartbear.com
AQtrace by SmartBear Software
AQtrace Packager Settings Pages
271
Module Information Page
The Module Information page of AQtrace Packager is used to specify the binary module (executable,
dll, ocx and other) to which AQtrace Reporter will be applied. This settings page is displayed in the Packager
window only if you work with a native configuration project.
You specify the module, to which the Reporter should be applied, in the File Name edit box. You can
either type the fully-qualified file name in this box or press the ellipsis button and choose the desired file in
the subsequent Open File dialog.
After selecting the module, AQtrace Packager displays the following file properties on the page:
●
●
The size of the file (in kilobytes).
The date and time of the module’s creation.
●
The date and time of the last modification of the file.
●
The date and time when the module was accessed last time.
●
The version number of the module (including the major, minor, build and private parts).
The read-only file attribute.
●
If the specified file does not exist, the properties are not shown. To update information about the module,
within the File Name box.
click
Reporter Assembly Information Page
The Reporter Assembly Information page of AQtrace Packager is used to specify the parameters
needed for creation of the auxiliary aqReporterInterop.dll assembly. This settings page is displayed in the
Packager window only if you work with a .NET configuration project.
You can specify the following parameters on the Reporter Assembly Information page:
●
Output folder - Specifies the folder in which the aqReporterInterop.dll assembly will be
generated. This assembly is used as a bridge between .NET modules and the unmanaged
aqReporter.dll library that implements the Reporter. Using the aqReporterInterop assembly, you
can control the Reporter from your .NET assembly, generate and send error reports and perform
other operations provided by the Reporter. For more information on this assembly, see Using
AQtrace Reporter in .NET Applications.
You can either type the path to the output folder or click the ellipsis button in the box and choose
the destination folder in the ensuing Browse for Folder dialog. Note that the Output folder
parameter is optional and you can omit it. In this case, the aqReporterInterop.dll assembly will be
generated in the folder where the opened .NET configuration project resides.
●
ilasm location - Specifies the folder that contains the ilasm.exe utility. This tool is part of
Microsoft .NET Framework and it resides in the folder that contains other modules of Microsoft
.NET Framework. AQtrace Packager uses this utility to compile the aqReporterInterop.dll
assembly.
You can either type the path to the ilasm.exe utility or click the ellipsis button in the box and
choose the folder in the ensuing Browse for Folder dialog. Note that this parameter is optional and
can be omitted. If you do not specify the ilasm.exe location, AQtrace Packager tries to locate
automatically the folder with the utility.
If you have more than one version of Microsoft .NET Framework installed on your
computer and you do not specify the ilasm.exe location, AQtrace Packager uses the
© 2011 SmartBear Software
smartbear.com/support
272
AQtrace Reporter
ilasm.exe utility from the earliest version of Microsoft .NET Framework installed on the
computer. If you want to use a certain version of ilasm.exe, you should specify its
location in the ilasm location edit box.
●
ilasm parameters - Specifies additional command-line parameters to be passed to ilasm.exe. For
more information on possible command-line parameters of ilasm.exe, see MSDN Library (its online version is available at http://msdn.microsoft.com). Note that this setting is optional, too, and
you can omit command-line parameters if you do not need them.
Sending Page
Use the Sending page of AQtrace Packager to specify the desired send mode(s) and parameters which
will be used by AQtrace Reporter for transferring generated error reports to developers.
The page contains one permanent setting:
●
Send mode - Specifies one or more transfer protocols for sending error reports. AQtrace Reporter
supports several transfer protocols to transmit the error reports to developers. When several
protocols are selected, Reporter attempts to use the first protocol in the list, on failure it tries the
second and so on. To modify the order of sending modes use the Move Up and Move Down
buttons.
Each of these protocols require some settings needed for transferring the reports. As the supported send
modes require different settings, the set of edit boxes on the page which are designed for specifying of
transfer protocols’ settings are changeable and depend on the selected send mode. For more information on
these settings, see Transfer Protocols’ Settings.
For more information on the supported transfer protocols, see Selecting Transfer Protocol.
Product Information Page
Use the Product Information page of AQtrace Packager to specify information about your product.
AQtrace Reporter will include this information into the generated error reports.
The page contains the following edit boxes:
●
●
Product name - Name of the product, for which reports will be generated.
Company name - Your company’s name.
●
Product identifier - A string that will is an identifier of the product. This value is used by plug-ins
and utilities that work with error reports that reside in the report storage.
To specify the identifier, you can use a GUID. To generate a new guid, press the GUID button.
●
Product version - Specifies the version number of your product. AQtrace Service and server-side
components will use this number along with the product identifier to determine the product version
for which the report is generated.
The version number lets the server-side components to apply different rules to the reports that
were generated for different versions of the same project. For instance, you may save them to
different folders in your issue-tracking system.
Typically, you specify only the major version of your product in this field. In most cases, this is
quite enough for separating the reports’ flows. See also Mapping Products to Issue-Tracking
Projects.
smartbear.com
AQtrace by SmartBear Software
AQtrace Packager Settings Pages
273
Reporter Behavior Page
Use the Reporter Behavior page of AQtrace Packager to specify certain aspects of how AQtrace
Reporter works.
The page contains the following settings:
●
Store reports - If this check box is selected, AQtrace Reporter will save generated error reports on
the end-user’s computer. The reports will be stored despite the fact that the end-users click the
Send or Don’t Send button in the notification window. The Reporter saves the reports to the
folder that is specified by the Folder setting (see below).
If the setting is disabled, the reports are not saved on end-users’ computers, they are just sent to the
server, if the end-user chooses Send in the notification window or they are lost if the user selects
Don’t Send.
●
Folder - This setting is meaningful only if the Store reports check box is selected. It specifies the
folder, to which AQtrace Reporter will save the generated report files. It is recommended that you
use a relative path for this folder (relative to the module, to which AQtrace Reporter will be
added). For instance, you can use the ./Log string.
You can either type the desired folder name, or press the ellipsis button and choose the desired
folder in the ensuing Browse for Folder dialog.
To specify the path, you can also use the following variables (the variable name must be enclosed
in % symbols):
●
%CURRENT_USER% - A system folder that is used as a repository for current user’s files
and documents (typically, C:\Documents and Settings_name).
●
%CURRENT_USER_APP_DATA% - A system folder that serves as a repository for
application data of the current user (typically, C:\Documents and Settings_name\Application
Data).
●
%ALL_USERS% - A system folder that is used as a common storage for application data for
all users (typically, C:\Documents and Settings\All Users).
●
%ALL_USERS_APP_DATA% - A system folder containing application data for all users
(typically, C:\Documents and Settings\All Users\Application Data).
●
%APP_DIR% - Your application’s folder.
You can either type the variable name, or click the Var button and choose the desired variable in
the subsequent Select Environment Variable dialog. Note that variable name must be enclosed in
the % symbols.
●
Ignore debugger - The Reporter “hides” exceptions from the debugger, and this may cause
problems when debugging an application in your development tool. So, when AQtrace Reporter
starts working, it checks whether the application is running under a debugger. If the debugger is
found, then AQtrace Reporter disables itself and remains disabled until the application execution is
over (see Working Under a Debugger).
If the setting is disabled (default), then the Reporter will disable itself upon detecting a debugger.
If this setting is enabled, AQtrace Reporter will ignore the debugger and will function as it
normally would.
Additional Reported Data Page
AQtrace Reporter adds various information to the error reports that it generates: exception code and
address, information about threads, call stack and registry data, information about modules and so on (see
© 2011 SmartBear Software
smartbear.com/support
274
AQtrace Reporter
Specifying Data to Be Included in Reports). Some of this data is always included in error reports while some
of it is included if it is specified by the AQtrace Reporter settings. On the Additional Reported Data page
of the AQtrace Packager you can specify which additional data the AQtrace Reporter will append into the
generated error reports.
The page contains the following settings:
●
Last exceptions data - Specifies whether AQtrace Reporter will collect and report information
about exceptions, which occurred earlier in the run than the exception for which the given report
was generated. When analyzing error reports with AQtrace Viewer, you can see information about
these exceptions in the Viewer’s Last Exceptions panel.
AQtrace Reporter includes two more settings that specify how the Reporter collects information
about last exceptions:
●
●
Save ... last exceptions - Specifies the number of last exceptions, the information to be saved
to the report file. Default: 10. The greater this value, the more data the report file will contain.
●
Stack size - Specifies the amount of stack data (in bytes) that will be included into the report
for each exception. The more the stack size, the more entries the call stack will contain, but the
larger the report file will be. Default: 8192 bytes.
Processes information - Specifies whether AQtrace Reporter will collect and report information
about processes that existed in the operating system at the time the exception occurred. The
following information is collected for each process:
●
ID of the process
●
The fully-qualified name of the process’s executable
●
The name of the user who owns the process
AQtrace Viewer displays this information on the Processes tab in the Additional Information
panel.
●
Memory information - Specifies whether AQtrace Reporter will collect and report information
about the physical and virtual memory:
●
Memory load
●
●
Information on swap file size and its usage
Information about the total and free physical memory
●
Information about virtual memory
●
Information on the size of the page file and its usage
●
The number of user objects used by the application before the exception occurred
●
The number of GDI objects used by the application before the exception occurred
●
The number of handles used by the application before the exception occurred
●
Information about the amount of physical and virtual memory occupied by the
application before the exception occurred
AQtrace Viewer displays this information on the Memory tab in the Additional Information panel.
●
OS information - Specifies whether error reports will contain information about the operating
system and CPU(s):
smartbear.com
●
Operating system’s name
●
Service packs installed on the end-user’s computer
●
Operating system’s session identifier
●
Names of Windows, System32 and Temp folders
AQtrace by SmartBear Software
AQtrace Packager Settings Pages
275
●
Information about .NET Framework versions installed on the end-user’s computer
●
Information about CPU(s)
●
Name of the end-user’s computer
●
Information about the user account, under which the application was executed
●
Information about keyboard layouts and languages installed on the end-user’s computer
AQtrace Viewer displays this information in the Operating System tab in the Additional
Information panel.
●
Hard drives information - Specifies whether error reports will contain information on the total
and used hard-disk space. AQtrace Viewer displays this information on the Hard Drives tab in the
Additional Information panel.
●
Services information - Specifies whether AQtrace Reporter will collect information about
services that are registered in the operating system. For each service AQtrace Reporter will gather
the following data:
●
Service name (the name that identifies the service).
●
Service type: file system driver, driver, and so on. For information on the service type
constants, see description of the QUERY_SERVICE_CONFIG structure in the MSDN
library.
Current state of the service (running, paused, stopped and so on).
●
●
Control codes that service accepts and processes. For information on the service type
constants, see description of the SERVICE_STATUS structure in the MSDN library.
●
Start type (manual, auto, disabled and so on).
●
Error control (the action which is taken when the service fails to start). For information
on the service type constants, see description of the QUERY_SERVICE_CONFIG
structure in the MSDN library.
Fully-qualified name of the service’s executable module.
●
●
●
User account, under which the service is running.
Display name (the string that is displayed in the Services window of the Control Panel).
AQtrace Viewer displays this information on the Services tab in the Additional Information panel.
●
Network information - Specifies whether AQtrace Reporter will report information about the
network card and the network settings that are used on the end-user’s computer:
●
Host name
●
Domain name
●
DNS servers addresses
●
Information about network cards (name, driver, IP address and default gateway, subnet
mask and so on)
AQtrace Viewer will display this information on the Network tab in the Additional Information
panel.
Due to certain reasons, AQtrace Reporter cannot obtain this information on Windows NT
4.0 with Service Pack 6 or later. So, the information on the network will not be displayed
in AQtrace Viewer if the Reporter generates error reports on this operating system.
●
Privileges information - If this setting is active, the generated error reports will contain
© 2011 SmartBear Software
smartbear.com/support
276
AQtrace Reporter
information about privileges of the user account, under which your application is running when an
exception occurs. AQtrace Viewer displays this information on the Process Privileges tab in the
Additional Information panel.
●
Display devices information - Specifies whether AQtrace Reporter will collect and report
information about display devices (monitors) connected to the end-user’s computer:
●
Name and description
●
Color resolution
●
Width and height (in pixels)
●
Display orientation
●
Frequency and other settings
AQtrace Viewer displays this information on the Display Devices tab in the Additional
Information panel.
Due to certain reasons, AQtrace Reporter cannot obtain this information on Windows NT
4.0 with Service Pack 6 or later. So, the information about display devices will not be
displayed in AQtrace Viewer if the Reporter generates error reports on this operating
system.
●
Printers information - Specifies whether AQtrace Reporter will collect and report information
about printers into the error reports. This information includes:
●
The printer’s name and description
●
Port
●
Page size and orientation
●
Resolution (dots per inch)
●
Paper source and other settings
AQtrace Viewer displays this information on the Printers tab in the Additional Information panel.
●
Installed programs information - Specifies whether AQtrace Reporter will collect and report
information about programs and software updates installed on the end-user’s computer. For each
program this information includes:
●
Program name
●
Software publisher
●
Version number
AQtrace Viewer displays this information on the Installed Programs tab in the Additional
Information panel.
●
Event log - Specifies whether AQtrace Reporter will trace events that occur in the running
application and include information about these events into the generated error reports. For each
event, the collected information contains:
●
Event description (an event type and some other details specific for a certain event type). For
information on the supported event types, see Event Log Panel.
●
Identifier of the thread in which the event occurred.
●
Date and time of event’s occurrence.
This information is displayed in the Event Log panel of AQtrace Viewer. You can also preview
this information on the Event Log tab in the Report Information dialog that can be invoked from
smartbear.com
AQtrace by SmartBear Software
AQtrace Packager Settings Pages
277
the notification window before sending the report (this window is displayed when an error occurs
in the application).
●
Screenshot - Specifies whether AQtrace Reporter will capture the image of the application’s
window or the image of the whole screen and add this image to the report file. You can view this
image in the Screenshot panel of the AQtrace Viewer.
The captured screenshot contains the image of the mouse pointer, so you can determine which
button was clicked or which check box was selected when the exception occurred.
For complete information on the data that is included in error reports, see Specifying Data to Be Included
in Reports.
Exception Filter Mode Page
AQtrace Reporter detects any exception that occurs in your application, however, it generates error
reports for only those exceptions that you select using the Exception Filter pages of AQtrace Packager:
●
OS Exceptions
●
.NET Exceptions
●
Visual C++ Exceptions
●
Delphi Exceptions
C++Builder Exceptions
●
These pages define the exceptions to be included in the exceptions filter and by using the controls of the
Filter Mode page you can specify the desired filter mode:
●
Normal - In this mode, AQtrace reporter will generate error reports for those exceptions that are
selected in the pages of the Exception Filter section.
-- or --
●
Inverted - In this mode, AQtrace reporter will generate error reports for all exceptions except for
those that are selected in the Exception Filter pages.
For more information on tracing exceptions, see Specifying Exceptions to Be Traced.
OS Exceptions Page
On the OS Exceptions page of AQtrace Packager you can specify the OS exceptions that will be
included into the exception filter. Depending on its settings, AQtrace Reporter will trace only those
exceptions that included into the filter, or only those exceptions that are not included into the filter (see
Specifying Exceptions to Be Traced).
The page is visible only for native configuration projects.
The page contains the list of OS exceptions. By default, the list contains the most frequently used OS
exceptions. To include a new exception in the list:
1. Press Add. This will invoke the Add OS Exception dialog.
2. In the dialog, specify the exception’s code and description and press OK. The exception will be
added to the list.
3. Select the Active check box for the added exception to indicate that the exception should be added
© 2011 SmartBear Software
smartbear.com/support
278
AQtrace Reporter
to the exception filter. AQtrace Reporter will add only those exceptions to the filter whose Active
attribute is enabled.
To quickly select or clear the check boxes of all exceptions, press Select All or Unselect All.
To exclude an exception from the filter temporarily, simply clear the Active check box for this
exception.
To delete an exception from the list, choose this exception in the list and press Remove.
For more information on tracing exceptions with AQtrace, see Specifying Exceptions to Be Traced.
.NET Exceptions Page
On the .NET Exceptions page of the AQtrace Packager, you can specify which language exceptions,
defined in your .NET application, will be included into the exception filter. Depending on its settings,
AQtrace Reporter will trace only those exceptions that included into the filter, or only those exceptions that
are not included into the filter (see Specifying Exceptions to Be Traced).
The page is visible only for .NET configuration projects.
The page contains the list of exception classes. To add an exception class to the filter:
1. Press Add. This will display the Add .NET Exception dialog.
2. In the dialog, specify the desired class name and press OK. The exception class name will be
added to the list.
Note: When specifying the class, use only the class name, do not specify namespaces.
If the exception type is a pointer, use the asterisk (*) after the name. For instance, char
and char * are treated as different class names.
3. After the class name has been added to the list, select the Active check box for it. The Reporter
will include only those exceptions into the filter, whose Active attribute is enabled.
To exclude an exception from the filter temporarily, clear the Active check box for this exception.
To remove an exception from the list, choose it in the list and then click Remove.
For more information on tracing exceptions with AQtrace, see Specifying Exceptions to Be Traced.
Visual C++ Exceptions Page
On the Visual C++ Exceptions page of the AQtrace Packager, you can specify which language
exceptions, defined in your Visual C++ application, will be included into the exception filter. Depending on
its settings, AQtrace Reporter will trace only those exceptions that included into the filter, or only those
exceptions that are not included into the filter (see Specifying Exceptions to Be Traced).
The page is visible only for native configuration projects.
The page contains the list of exception classes. To add an exception class to the filter:
smartbear.com
AQtrace by SmartBear Software
AQtrace Packager Settings Pages
279
1. Press Add. This will display the Add Visual C++ Exception dialog.
2. In the dialog, specify the desired class name and press OK. The exception class name will be
added to the list.
Note: When specifying the class, use only the class name, do not specify namespaces.
If the exception type is a pointer, use the asterisk (*) after the name. For instance, char
and char * are treated as different class names.
3. After the class name has been added to the list, select the Active check box for it. The Reporter
will include only those exceptions into the filter, whose Active attribute is enabled.
To exclude an exception from the filter temporarily, clear the Active check box for this exception.
To remove an exception from the list, choose it in the list and then click Remove.
For more information on tracing exceptions with AQtrace, see Specifying Exceptions to Be Traced.
Delphi Exceptions Page
On the Delphi Exceptions page of AQtrace Packager, you can specify which language exceptions that
are defined in your Delphi application, will be included into the exception filter. Depending on its settings,
AQtrace Reporter will trace only those exceptions that are included in the filter, or only those exceptions that
are not included in the filter (see Specifying Exceptions to Be Traced).
The page is visible only for native configuration projects.
The page contains the list of exception classes. To add an exception class to the filter:
1. Press Add. This will invoke the Add Delphi Exception dialog.
2. In the dialog, specify the desired class name and press OK to confirm the input. The exception
class will be added to the list.
Note: When specifying the exception class name, only use the class name, do not specify
unit names.
3. Select the Active check box for the added class. Only the selected exceptions will be included into
the exception filter.
To exclude an exception from the filter temporarily, clear the Active check box for this exception.
To remove an exception from the list, choose it in the list and then click Remove.
For more information on tracing exceptions with AQtrace, see Specifying Exceptions to Be Traced.
C++Builder Exceptions Page
On the C++Builder Exceptions page of the AQtrace Packager, you can specify which language
exceptions, defined in your C++Builder application, will be included into the exception filter. Depending on
its settings, AQtrace Reporter will trace only those exceptions that included into the filter, or only those
© 2011 SmartBear Software
smartbear.com/support
280
AQtrace Reporter
exceptions that are not included into the filter (see Specifying Exceptions to Be Traced).
The page is visible only for native configuration projects.
The page contains the list of exception classes. To add an exception class to the filter:
1. Press Add. This will display the Add C++Builder Exception dialog.
2. In the dialog, specify the desired class name and press OK. The exception class name will be
added to the list.
Note: When specifying the class, use only the class name, do not specify namespaces or unit
names.
If the exception type is a pointer, use the asterisk (*) after the name. For instance, char
and char * are treated as different class names.
3. After the class name has been added to the list, select the Active check box for it. The Reporter
will include only those exceptions into the filter, whose Active attribute is enabled.
To exclude an exception from the filter temporarily, clear the Active check box for this exception.
To remove an exception from the list, choose it in the list and then click Remove.
For more information on tracing exceptions with AQtrace, see Specifying Exceptions to Be Traced.
Module Filter Settings Page
On the Module Filter Settings page of AQtrace Packager you can specify the modules, in which
AQtrace Reporter will trace exceptions, that is, you can define the module filter.
If the Trace exceptions in all modules check box is selected, the module filter is off and AQtrace
Reporter will trace exceptions in all modules that are loaded into the address space of your
application’s process. If the check box is clean, the modules to be traced are defined by the filter.
Using the two radio buttons in the Custom Filter section allows you to define the mode, in which the
filter functions:
●
Normal - In this mode, AQtrace Reporter will generate error reports only for those exceptions that
occur in the modules that are included into the list.
-- or --
●
Inverted - In this mode, AQtrace Reporter will generate error reports for exceptions that occur in
any modules except for those that are included in the list.
Below the radio buttons there is a list of the modules that will be affected by the filter.
Note: When AQtrace Reporter determines whether to handle or ignore the exception, it checks the
module names of two topmost functions in the exception’s call stack, that is, the module name
of the topmost function and the function that called it. If any of these modules was added to the
Module Filter Settings page, then according to the filter mode, the Reporter either skips or
processes the exception. For more information on this, see Specifying Modules to Be Traced.
smartbear.com
AQtrace by SmartBear Software
AQtrace Packager Settings Pages
281
To add a module to the list:
●
Press Add. This will invoke the standard Open File dialog.
●
In the dialog, choose the desired module and press Open. The module name will be added to the
list.
Note that only the module name is added. The path is ignored.
Note: If the desired module is not available, type its name and extension into the File name
box of the Open File dialog and press Open. The module name will be added to the
list.
Do not type the module’s path, enter only the file name and extension.
To delete a module from the list, select it in the list and then press Remove.
Notification Settings Page
AQtrace Reporter monitors your application’s execution on the end-user computer and if an exception
occurs, it generates an error report and displays a notification window informing the end-user about the
problem. On the Notification Settings page of AQtrace Packager you can specify whether the Reporter will
display the notification window and specify the data and controls to be displayed in the window.
The page contains the following settings:
●
Show notification window - Specifies whether AQtrace Reporter will display the notification
window when an exception occurs. If this setting is inactive, the Reporter will send error reports
without notifying end-users.
●
Postpone sending reports - This check box is available only if the Show notification window
setting is inactive, that is, the Postpone sending reports setting is meaningful only when error
reports are sent by the Reporter without displaying the notification window. If the check box is
selected, AQtrace Reporter does not send generated error reports automatically when an exception
occurs. Instead of sending error reports automatically without notifying the user, AQtrace Reporter
stores information about the generated report to the Registry and does not send it until the next
application run. When the user runs the application next time, AQtrace Reporter shows a message
box that informs that some error reports have not been sent to the developers and suggests that the
user sends these reports. If the user presses Yes in the message box, AQtrace Reporter sends all the
reports that have not been sent yet. Otherwise, if No is pressed, the reports are not sent and
AQtrace Reporter suggests sending them next time the user runs the application.
If both the Postpone sending reports and the Show notification window check boxes are clear,
AQtrace Reporter sends the generated error report automatically right after an error occurs,
without notifying the user.
Other settings specify text and data displayed within the notification window. The settings’ values are
stored into configurations. By selecting a configuration you can quickly modify the values of all the settings.
This feature lets you create and quickly change configurations that are specific to certain languages (English,
German, French and so on) or configurations that are specific to your products.
The Configuration box specifies the active configuration.
The following image illustrates which parts of the window various settings affect:
© 2011 SmartBear Software
smartbear.com/support
282
AQtrace Reporter
●
Header - Specifies the text to be shown in the header part of the window.
●
Body - Specifies the “body” part of the window’s text.
Note: In the Header, Body and any other setting, you can use the following placeholders:
● %PRODUCT_NAME% - The placeholder for the Product name value that is specified
on the Product Information page of AQtrace Packager.
●
●
%COMPANY_NAME%- The placeholder for the Company name value that is specified
on the Product Information page of AQtrace Packager.
●
%MODULE_NAME% - The placeholder for the module name, in which an exception
occurred.
Error reports policy link
Typically, this link opens a web page describing the error reporting policy adopted in your
company. This page may contain the following information:
■
Description of why error reports are collected.
■
Explanation of how data is sent and stored.
■
Explanation of what data is collected.
■
Description of who has access to reported data.
You can find an example of such a page at SmartBear's web site: http://www.smartbear.com/errorreports-policy.
■
Text - Specifies the text asking you to view information about the error-report policy. This
smartbear.com
AQtrace by SmartBear Software
AQtrace Packager Settings Pages
■
●
283
text will be displayed as a link that opens the web page specified by the URL setting.
URL - Specifies the URL of the page that is opened when the end-user clicks the link.
Report file storage text - Specifies the text that is displayed one line above the report file name in
the notification window.
Note: The report file name and this text is shown only if the Store report files setting of
AQtrace Reporter is enabled.
The following three groups are applied to the check boxes that are shown in the notification window:
●
"Contact Info" check box - This group contains settings applied to the I would like to specify my
contact info… check box.
●
"Don't Terminate Application" check box - This group contains settings applied to the Don't
terminate the application check box.
●
"Restart application" check box - This group contains settings applied to the Restart application
check box.
Each of these groups contain the following settings:
●
Text - Specifies the caption of the check box.
●
Checked - Specifies the initial state of the check box.
The following two groups are applied to the buttons that are shown at the bottom of the notification
window:
●
"Send" button - The button that “sends” generated reports to the server.
●
"Don't send" button - The button that closes the notification window without sending any
reports.
Both of these groups contain the Text setting that specifies the caption of the button. The default
captions of these buttons are Send and Don’t Send, respectively. If you do not specify this setting, the
corresponding button in the notification window will have the default caption. To specify the accelerator key
for the button, place the & symbol before the desired character. For instance, in this string &Send the
accelerator symbol is s. To use the & symbol in the caption, duplicate it (&&).
The following two groups are related to the Report Information dialog that displays information to be
included into the error report and sent to the developers:
●
"View report details" link - This group is applied to the link in the notification window that
opens the Report Information dialog. The group contains only the Text setting. It specifies the text
to be displayed as the link in the notification window. The default text for this link is View report
details, it will be displayed in the notification window if you do not specify this setting.
●
"Report Information" dialog - This group is applied to the Report Information dialog that is
displayed after clicking the View report details link in the notification window. The group
contains only the Header setting that specifies the text to be shown in the header of the dialog. By
default, the Report Information text is displayed in the header of the dialog. Note that you can
use the mentioned above placeholders (%PRODUCT_NAME%, %COMPANY_NAME% and
%MODULE_NAME%) to compose the desired text for the dialog’s header.
Control DLL Loading Page
AQtrace Reporter can be used to prevent loading of dynamic link libraries and other modules into the
© 2011 SmartBear Software
smartbear.com/support
284
AQtrace Reporter
address space of your application (see Controlling DLL Loading). On the Control DLL Loading page of
AQtrace Packager you can specify which modules can or should not be loaded into your process.
The list displays information about modules in the following columns:
Column Description
Name
Specifies the file name and extension of the module.
Version Specifies the version information of the module (see below).
Action
Specifies whether AQtrace Reporter will block or permit loading of the module.
To add a module to the list
●
Press Add. This will invoke the standard Open File dialog.
●
Select the desired module (or modules) in the dialog and press Open.
Note: If the desired module is not available and you cannot choose it in the dialog, type the
module’s name in the File name edit box and then press Open.
Only enter the module name and extension. Do not specify the path.
●
After pressing Open, the specified module will be added to the list of modules. If you specified an
existing module, the Packager will read version information from it and display it in the Version
column. If you specified the module that is unavailable to you, the Version column will contain the
mask *.*.*.*(see below for information about the masks).
To remove a module from the list
●
Choose the desired module or modules in the list (you can use Ctrl- or Shift-click for
multiselection).
●
Press Remove.
To set the version number
If you added an existing module to the list, then AQtrace Packager will read version information from
this module and display it in the Version column. If you specified the module that is not available to you, the
Version column will contain the string *.*.*.*.
To modify the version number:
●
Click the Version cell twice (not a double-click), or select the cell and press F2.
●
Type the desired version number.
●
Press Enter to confirm the change or Esc to cancel it.
Two notes:
●
When typing the version, you must specify all parts of the version number: major, minor, build and
private.
●
You can use the * wildcard in any part of the version information (this wildcard means that the
part corresponds to any number).
Below are examples of valid and invalid version numbers:
smartbear.com
AQtrace by SmartBear Software
AQtrace Packager Settings Pages
285
1.0.*.* - Valid. Means any build of the version 1.0.
2.*.*.* - Valid. Means any build or minor update of the version 2.
*.*.*.* - Valid. Means any version.
1.5
- Invalid. The build and private parts of the version info are not specified.
2.0.*
- Invalid. The fourth (private) part of the version info is not specified.
To change the action
●
Click the Action cell twice (not a double-click) or select the cell and press F2.
●
Choose the desired action (Allow or Deny) from the drop-down list.
●
Press Enter to confirm the change or Esc to cancel it.
To change the module’s order in the list
The order of the items in the list is important because it has effect on how AQtrace Reporter searches for
the module (see Controlling DLL Loading). To change the order:
●
Select the desired module in the list.
●
Press Move Up or Move Down to specify the desired position of the module among other items of
the list.
© 2011 SmartBear Software
smartbear.com/support
286
AQtrace Report Monitor
AQtrace Report Monitor
AQtrace Report Monitor is a helper utility for AQtrace Reporter when it is used with non-interactive
processes. AQtrace Report Monitor works on end-user computers and sends error reports generated by the
Reporter to your server. The following topics provide detailed information about this AQtrace component.
About AQtrace Report Monitor
The AQtrace installation package includes AQtrace Report Monitor, which is a helper tool designed to
complement AQtrace Reporter when it is embedded in non-interactive processes. Such processes are
designed to run locally without any human interference. Services are the most typical example of noninteractive processes. See Using AQtrace With Non-Interactive Processes.
AQtrace Report Monitor is part of AQtrace SDK. You can find this utility in the <AQtrace
SDK>\Modules\Common folder.
When the Reporter is applied to a non-interactive process, it can intercept exceptions and create error
reports, but it cannot send these reports to the software developer, as this requires some user actions that are
not allowed for non-interactive processes. AQtrace Report Monitor is used to accomplish this task.
AQtrace Report Monitor works on end-user computers along with your application and AQtrace
Reporter. The Report Monitor monitors the folder that is specified by its settings. When AQtrace Reporter
detects an exception in your application and stores a report file to this folder, the Monitor displays an icon
and descriptive hint in the system tray:
By clicking the Monitor’s icon, the end user invokes the main window of the utility. Depending on its
settings, the utility may display a Welcome dialog that will inform the user that a crash occurred and display
a link to a web page that describes the report collecting policy adopted by your company:
smartbear.com
AQtrace by SmartBear Software
AQtrace Report Monitor Window
287
In the main window, the end user can view the list of generated reports and send them to you. For more
information about this, see AQtrace Report Monitor Window.
You can change the notification policy and make the Monitor to always display its icon in the tray. See
AQtrace Report Monitor Command Line.
The AQtrace Report Manager utility is redistributable. You ship it along with the AQtrace Reporter
libraries and your application to end users. For more information on this, see Distributing AQtrace Reporter
Libraries.
You configure AQtrace Report Monitor with the ReportMonitorSettings.xml file that contains the
Monitor’s settings: monitored folder, transmitting protocol(s), report destination and so on. The utility loads
this file on start. You must ship this file to end users along with the utility. Before shipping it, you should
enter the appropriate settings into the file. For information on the settings, see Configuring AQtrace Report
Monitor.
AQtrace Report Monitor Window
The AQtrace Report Monitor utility monitors error reports file in a folder specified by the utility’s
settings. When a new report file appears in this folder, the utility displays an icon with descriptive hint in the
Windows system tray. Clicking the icon invokes the main window of the utility:
© 2011 SmartBear Software
smartbear.com/support
288
AQtrace Report Monitor
The main window shows which folder is currently monitored and lists the error reports that are already in
that folder.
To view the contents of a report, choose the report in the list and then click View, or simply double-click
the report.
The user can select one or more error reports and press the Send button to send these reports to the
developer. Depending on the Remove files after sending option, the reports can either be deleted or left on
disk after they are sent.
The Select All and Unselect All buttons select or deselect all the reports in the list.
The Remove button deletes the selected reports without sending.
The ellipses button on the right of the monitored folder’s path opens this folder in Windows Explorer.
Pressing Close hides the main window of AQtrace Report Monitor, but does not terminate the
application itself. To terminate AQtrace Report Monitor, the user should right-click the application’s icon in
the system tray and select Exit from the context menu.
Configuring AQtrace Report Monitor
You configure the behavior of the AQtrace Report Monitor by using the ReportMonitorSettings.xml
smartbear.com
AQtrace by SmartBear Software
Configuring AQtrace Report Monitor
289
file. The utility loads settings from this file on start. It searches for the file file in two predefined locations: in
the
folder
where
the
Report
Monitor’s
executable
is
located
and
in
the
%ALL_USERS_APP_DATA%\SmartBear\AQtrace\2.0\ folder. You can also specify a custom path to the
settings file with the /Settings command-line key. See AQtrace Report Monitor Command Line for
details.
It is important to specify parameters in the ReportMonitorSettings.xml file. This should be done by
software developers before the product is shipped to end users. Otherwise, AQtrace Report Monitor
will not function properly.
Here is a typical structure of the settings file:
[XML]
<AQtraceReportMonitor>
<Settings>
<Prp Name="ProductName" Value="MyProductName"/>
<Prp Name="MonitoredFolder"
Value="C:\Work\Projects\SmartService\Log\"/>
<Prp Name="RemoveAfterSending" Value="-1"/>
<Prp Name="ReportPolicyUrl"
Value="www.MyCompany.com/error_reports_policy.asp"/>
<Prp Name="ShowWelcomeDialog" Value="-1"/>
</Settings>
<Protocols>
<Protocol Name="HTTP">
<Prp Name="Server" Value="localhost"/>
<Prp Name="Port" Value="80"/>
<Prp Name="Page" Value="\AQtrace\bugreport.asp"/>
<Prp Name="User" Value=""/>
<Prp Name="Password" Value=""/>
</Protocol>
<Protocol Name="HTTPS">
<Prp Name="Server" Value="localhost"/>
<Prp Name="Port" Value="443"/>
<Prp Name="Page" Value="\AQtrace\bugreport.asp"/>
<Prp Name="User" Value=""/>
<Prp Name="Password" Value=""/>
</Protocol>
<Protocol Name="TFTP">
<Prp Name="Server" Value="localhost"/>
<Prp Name="Port" Value="69"/>
<Prp Name="Directory" Value="MyReports"/>
</Protocol>
<Protocol Name="FTP">
<Prp Name="Server" Value="localhost"/>
© 2011 SmartBear Software
smartbear.com/support
290
AQtrace Report Monitor
<Prp Name="Port" Value="21"/>
<Prp Name="Directory" Value="MyReports"/>
<Prp Name="User" Value=""/>
<Prp Name="Password" Value=""/>
</Protocol>
<Protocol Name="EMAIL">
<Prp Name="Subject" Value="Error report"/>
<Prp Name="Body" Value="Hi! Your application has crashed.
See the error report in the attachment."/>
<Prp Name="Address" Value="[email protected]"/>
</Protocol>
<Protocol Name="SMTP">
<Prp Name="Subject" Value="Error report"/>
<Prp Name="Body" Value="Hi! Your application has crashed.
See the error report in the attachment."/>
<Prp Name="Address" Value="[email protected]"/>
<Prp Name="From" Value="[email protected]"/>
<Prp Name="Server" Value="smtpserver"/>
<Prp Name="Port" Value="25"/>
<Prp Name="User" Value=""/>
<Prp Name="Password" Value=""/>
</Protocol>
</Protocols>
<Dumps>
<Prp Name="cf-20090422180507.dmp" Value="0"/>
<Prp Name="cf-20090423144423.dmp" Value="0"/>
<Prp Name="cf-20090506172928.dmp" Value="0"/>
</Dumps>
</AQtraceReportMonitor>
The root element of the description file is AQtraceReportMonitor. It serves as a package for the
other parameters and contains three sections: Settings, Protocols and Dumps. Each individual setting
is described by the Prp tag. It has the Name and Value attributes that hold the setting name and current
value respectively.
Now we will describe each element of the section.
●
Settings
This section contains general parameters for AQtrace Report Monitor.
smartbear.com
Name
Value
Description
ProductName
The name of your This name is displayed in the title of the dialog
AQtrace by SmartBear Software
Configuring AQtrace Report Monitor
Name
MonitoredFolder
291
Value
Description
product.
window that is shown in AQtrace Report
Monitor and in the hint that appear over the
Report Monitor’s icon in the system tray.
The full path to a Denotes the path to the folder that should be
folder.
monitored by the utility.
RemoveAfterSending Either 0 or -1.
ReportPolicyUrl
URL of the web Specifies the address of the web page that
page.
describes the concepts of the error-reporting
policy adopted by your company. This address
is used for the link that is shown in the
Welcome dialog of the utility.
ShowWelcomeDialog Either 0 or -1.
●
Specifies whether to retain error reports (0), or
to delete them (-1) after sending.
Specifies whether the utility displays the
Welcome dialog (-1) or not (0).
Protocols
This section describes the possible ways of sending reports to the developer. It contains from 1 to
6 Protocol subsections, each describing a separate transmission protocol to be used. The
protocol settings are analogous to the properties of the Packager’s Sending Page when the
appropriate protocol is selected. Read Transferring Reports for more information.
Note: The Report Monitor uses the transmission protocol settings defined in the
ReportMonitorSettings.xml file. It ignores the transmission protocol settings
embedded in the library or executable file by AQtrace Packager.
When more than one protocol are given, the Report Monitor tries to send reports using the first
protocol in the list, if it fails, then the utility tries to use the second protocol in the list and so on.
Thus, you can define several alternative ways of sending data.
HTTP
Lists the settings to be used for sending error reports via Hypertext Transfer Protocol (HTTP).
(See HTTP Settings.)
Name
Value
Server
A server name or an Specifies the domain name or IP address of the web
IP address.
server to which error reports will be sent.
Port
A port number. The Specifies the TCP port number that will be used for
default value is 80. transmission.
Page
A string with a page Specifies the name and path of the .asp page that will
address.
receive error reports.
© 2011 SmartBear Software
Description
smartbear.com/support
292
AQtrace Report Monitor
Name
Value
User
A user
name.
Description
account Specifies the user account that is used to access the
Report Collector’s server and virtual directory. This
parameter is not required and it can be omitted if the
specified virtual directory on the server allows
anonymous access.
Password A password string.
Specifies the password for the user account that is used
to access the Report Collector’s server and virtual
directory. This parameter is not required and it can be
omitted if the specified virtual directory on the server
allows anonymous access.
HTTPS
Lists the settings to be used for sending error reports via Secure Hypertext Transfer Protocol
(HTTPS). (See HTTPS Settings.)
Name
Value
Description
Server
A server name or an Specifies the domain name or IP address of the web
IP address.
server to which error reports will be sent.
Port
A port number. The Specifies the TCP port number that will be used for
default value is 443. transmission.
Page
A string with a page Specifies the name and path of the .asp page that will
address.
receive error reports.
User
A user
name.
account Specifies the user account that is used to access the
Report Collector’s server and virtual directory. This
parameter is not required and it can be omitted if the
specified virtual directory on the server allows
anonymous access.
Password A password string.
Specifies the password for the user account that is used
to access the Report Collector’s server and virtual
directory. This parameter is not required and it can be
omitted if the specified virtual directory on the server
allows anonymous access.
TFTP
Lists the settings to be used for sending error reports via Trivial File Transfer Protocol (TFTP).
(See TFTP Settings.)
smartbear.com
Name
Value
Description
Server
A server name or an Specifies the domain name or IP address of the TFTP
IP address.
server to which error reports will be sent.
AQtrace by SmartBear Software
Configuring AQtrace Report Monitor
293
Name
Value
Description
Port
A port number. The Specifies the UDP port number that will be used for
default value is 69. transmission.
Directory A string with a Specifies the directory on the TFTP server in which
error reports will be placed.
directory address.
FTP
Lists the settings to be used for sending error reports via File Transfer Protocol (FTP). (See
FTP Settings.)
Name
Value
Description
Server
A server name or an Specifies the domain name or IP address of the FTP
IP address.
server to which error reports will be sent.
Port
A port number. The Specifies the TCP port number that will be used for
default value is 21. transmission.
Directory A string with a Specifies the directory on the FTP server in which error
reports will be placed.
directory address.
User
A user
name.
account Specifies the user account that is used to access the
server. This parameter is not required and it can be
omitted if the server allows anonymous access.
Password A password string.
Specifies the password for the user account that is used
to access the server. This parameter is not required and
it can be omitted if the server allows anonymous access.
EMAIL
Lists the settings to be used for sending error reports via the default e-mail client. (See E-mail
Settings.)
Name
Value
Description
Subject Arbitrary string.
Specifies the Subject field of the e-mail message that
will be sent.
Body
Specifies the body of the e-mail message. This is the
main text of the message.
Arbitrary string.
Address An e-mail address.
Specifies the destination e-mail address to which the
message with the attached error report will be sent.
SMTP
Lists the settings to be used for sending error reports via Simple Mail Transfer Protocol
(SMTP). (See SMTP Settings.)
© 2011 SmartBear Software
smartbear.com/support
294
AQtrace Report Monitor
Name
Value
Description
Subject
Arbitrary string.
Specifies the Subject field of the e-mail message that
will be sent.
Body
Arbitrary string.
Specifies the body of the e-mail message. This is the
main text of the message.
Address
An e-mail address.
Specifies the destination e-mail address to which the
message with the attached error report will be sent.
From
An e-mail address.
Specifies the From field of the e-mail message.
Server
A server name or an Specifies the domain name or IP address of the outgoing
IP address.
SMTP server from which the e-mail message should be
sent.
Port
A port number. The Specifies the TCP port number that will be used for the
default value is 25. SMTP protocol transmission.
User
A user
name.
account Specifies the user account name on the specified SMTP
server. This name is the string before the @ symbol in
the full e-mail address.
Password A password string.
●
Specifies the e-mail account's password.
Dumps
This section lists the error reports that currently reside in the monitored folder. This section serves
for helper purposes. The Report Monitor creates and maintains this section automatically. It is not
recommended to modify it manually.
Thus, before shipping AQtrace Report Monitor and the ReportMonitorSettings.xml file to end users, the
developer should specify a value in the MonitoredFolder property and specify at least one transmission
protocol.
AQtrace Report Monitor Command Line
The executable file of AQtrace Report Monitor (AQtraceReportMonitor.exe) can accept two commandline arguments that affect its behavior on end-users’ machines:
AQtraceReportMonitor.exe [/AlwaysShowIcon] [/Settings Path]
Both arguments are optional. Here are their meanings:
/AlwaysShowIcon
Makes the Report Monitor display its icon in the system tray even in the idle state. By default, the
Monitor reveals its icon only when a new error report is created.
/Settings Path
smartbear.com
AQtrace by SmartBear Software
AQtrace Report Monitor Command Line
295
Commands the Report Monitor to read the initial settings from the specified file rather than from
the ReportMonitorSettings.xml file. The Path parameter specifies the fully-qualified name of the
desired file. For example:
AQtraceReportMonitor.exe
/Settings"C:\MySettings\MyReportMonitorSettings.xml"
© 2011 SmartBear Software
smartbear.com/support
296
Server-Side Components
Server-Side Components
Report Collector
Report Collector - Description
Report Collector is an AQtrace component that runs on the server and receives the error reports which
are generated by AQtrace Reporter and sent via HTTP or HTTPS transfer protocols. The Collector can then
either store received reports or re-send them to another server.
Report Collector is a simple application that consists of several .asp pages. One of these pages acts as the
“main” page: it contains code that receives reports and either saves or re-sends them. Other pages perform
helper tasks.
Report Collector is included into the AQtrace installation package. It is installed when you select the
“Receive error reports and manage the storage of your binary modules” installation type and check the
Report Collector (.asp page) item on the Select Server-Side Components page of the AQtrace installation
wizard. By default, the pages are installed to the <AQtrace>\Bin\ASP folder.
To install the pages, Internet Information Services (IIS) ver. 5.0 - 7.5 must be installed on the server
computer.
The name of the “main” page is bugreport.asp. During AQtrace installation you can specify the virtual
folder, to which the page will be installed. By default, the virtual folder is AQtrace. So, by default the
relative-to-server address of the Report Collector’s .asp page is -/AQtrace/bugreport.asp
You can change the page name as well as the virtual folder’s name any time later by using the dialogs of
Internet Information Services.
As we have said, Report Collector can process the received reports in one of the following ways:
● It can save reports to the initial storage for further processing and analysis.
●
It can relay reports to another URL. For more information on this, see Report Relaying.
You specify the Collector’s behavior and settings during the AQtrace installation. To modify them, you
can either re-install AQtrace or use the Report Collector Settings page of the AQtrace Server Config utility.
For detailed information on the settings, see description of the Report Collector Settings page.
The entire operation of receiving error reports includes the following steps:
1. The Collector receives report files and saves them to the TEMP subfolder of the folder specified
by the Collector’s Initial storage folder setting.
2. If the Relay received reports setting is disabled, the Collector creates a new subfolder having the
GUID-like name and moves the report files from TEMP folder to that folder. Afterwards that
smartbear.com
AQtrace by SmartBear Software
Report Collector
297
folder is processed by AQtrace Service.
3. If Relay received reports setting is enabled, the Collector forwards the report to the address
specified by the Relay to URL setting.
4. If the relaying fails, the Collector attempts to re-send the report. The number of attempts is
specified by the Number of sending attempts setting (by default, 10).
5. If all re-sending attempts failed, the report is moved to the TEMP\UnsentData subfolder.
The report will reside in this folder unless the Report Collector succeeds in forwarding any other
report to the server. In this case it attempts to re-send all the reports from this folder. On success,
the reports are moved to another server; on failure they remain in the TEMP\UnsentData folder.
Report Relaying
The Report Collector can either store error reports for processing and analysis, or it can relay them to
another URL. Report relaying is useful if the developers do not have access to the server that receives the
reports. This may happen, for instance, in organizations that use DMZ2 zones for security. In this case, endusers send error reports to an external server that exchanges data with the local network computer, which the
developers can access.
2
DMZ zone is a short name for demilitarized zone (also known as demarcation zone or perimeter
network). To defend local networks from outside attacks, some organizations separate the servers
that work with global networks from the local network. Employees do not connect to global servers
directly from a local network. They do this through a special gateway. So, only the gateway
computer can exchange data with an “external” server.
© 2011 SmartBear Software
smartbear.com/support
298
Server-Side Components
You can use any number of relaying pages.
The Report Collector shipped with AQtrace can function in both ways. That is, it can both store and
relay error reports. You can define the Collector’s behavior during the AQtrace installation. You can also
change the page’s behavior any time later. To do this, use the settings displayed on the Report Collector
Settings page of the AQtrace Server Config utility. To activate the relay mode:
●
Launch AQtrace Server Config (the file <AQtrace>\Bin\AQtraceServerConfig.exe) and activate
the Report Collector | Report Collector Settings page.
●
Select the Relay received reports check box.
●
Specify the name or IP address of the destination server in the Server name or IP address edit
box.
The server address should not contain the protocol name, that is, it should not contain the http://
prefix.
●
Specify the virtual directory and name of the .asp page, to which reports will be forwarded, in the
Report Collector (.asp page) edit box.
By default, the AQtrace installation program uses the /AQtrace/bugreport.asp name for Report
Collector, so you can enter this value into the Report Collector (.asp page) edit box.
●
In the Port box specify the port on the destination computer, to which the reports will be relayed.
By default, AQtrace uses the port 80 for sending reports. However, this port may be closed for
some security reasons. So, by using the Port edit box, you may specify the other port that is open
on the server computer for the incoming HTTP traffic.
smartbear.com
AQtrace by SmartBear Software
AQtrace Service
●
299
Specify the number of re-sending attempts in the Number of sending attempts box (see below).
By default, it is 10.
After Report Collector receives an error report, it saves it to the TEMP subfolder of the folder that is
specified by the Initial storage folder setting (for information about initial storage, see AQtrace
Components, Terms and Concepts). Then, Report Collector attempts to relay the report to another URL. If
the attempt fails, the Collector tries to re-send the report again. The number of attempts is specified by
Number of sending attempts setting.
If all attempts failed, Report Collector moves the error report in the TEMP\UnsentData subfolder. The
reports in this folder are stored unless the Report Collector forwards some other report successfully. In this
case it also attempts to re-send all the reports from the TEMP\UnsentData subfolder.
AQtrace Service
AQtrace Service - Description
AQtrace Service is an executable that runs as an operating system service on the server computer.
AQtrace Service monitors the folder changes in the initial storage folder and when a new report arrives, it
analyzes it, marks as duplicated (if needed) and moves the report to the persistent storage folder. The initial
storage folder is used to temporaly keep the received reports before they are sorted out. The reports received
via HTTP and HTTPS are stored to this folder automatically. Besides, you can configure the FTP server to
use the initial storage folder, too.
Some important notes on AQtrace service:
1. Emphasize the fact that the Service monitors folder changes rather than file changes. It
will react on folder events (creation, renaming and others) but not on file events.
2. In order for AQtrace Service to be able to start and function properly, you must specify
the initial and persistent storage paths in the Service’s folder. If these folders are not
specified, the Service does not start.
3. AQtrace Service must have read and write permissions for the folders.
Service File Name
The service file name is AQtraceService.exe. The installation program copies this file to the
<AQtrace>\Bin folder.
Starting, Stopping and Pausing the Service
The AQtraceService executable works as an operating system’s service. It is configured to start
automatically when the computer starts.
You can control the Service, that is, stop, start, pause and resume it, by using the operating system’s
Control Panel | Administrative Tools | Services window.
Detecting Duplicated Reports
It is possible that you will receive error reports that were caused by the same error but on different end-
© 2011 SmartBear Software
smartbear.com/support
300
Server-Side Components
users’ computers. These reports are called duplicated, because they were caused by the same error.
To determine whether the report is a duplicated one, AQtrace Service parses the call stack data included
in this reports and checks the call addresses. If all the addresses coincide with the addresses of another report
that was received earlier, AQtrace Service marks the recent error report as duplicated. Then the Service
moves the report to the persistent storage (that is, the duplicated reports are not deleted or remain in the
initial storage. They are moved to the persistent storage).
AQtrace Service Settings
In order for AQtrace Service to function properly, it needs access to the initial and persistent storage
folders. You specify path to these folders using the AQtrace Service Settings page of the AQtrace Server
Config utility.
You must specify these settings before AQtrace Service starts. If the folders are not specified, the
Service does not start.
Besides access to the initial and persistent storage folders, the Service also needs access to the binary
code of modules mentioned in the error report and to the debug information of these modules (AQtrace
Service needs these modules to parse the call stack data properly). You specify the path to the modules and
debug info in the AQtrace Service Settings of the AQtrace Server Config utility. See Configuring AQtrace
Service for more information on this.
Configuring AQtrace Service
In order for AQtrace Service to be able to start and function properly, you should specify the initial and
persistent storage folders for the Service. Also, the Service must know the path to the binary modules and
debug information files of your application. You modify the Service’s settings by using the AQtrace Server
Config utility.
Initial and Persistent Storage Folders
To specify paths to the storage folders, you use the Common Settings and AQtrace Service Settings pages
of the AQtrace Server Config utility:
●
To specify the initial storage folder, use the Initial storage folder edit box on the Common
Settings page.
●
To specify the persistent storage folder, use the Persistent storage folder setting on AQtrace
Service Settings page.
The page is disabled until you specify the initial storage folder and the build storage file name on
the Common Settings page and press Apply to commit the changes.
Note: AQtrace Service will not start if the initial and persistent storage folders are not specified.
AQtrace Service must have the read and write permissions for these folders.
Path to Binary Modules and Debug Information
When parsing the call stack data, AQtrace Service analyzes the binary code of modules mentioned in the
report. The modules are not included in the report, so to perform the analysis, AQtrace Service searches for
the module in your build storage that contains the binary modules and debug information files of your
smartbear.com
AQtrace by SmartBear Software
AQtrace Server Config
301
application. So, specifying the path to these files and modules is important for the Service. Without this
information, it will be unable to parse the call stack data and detect duplicated reports (see Detecting
Duplicated Reports).
To search for a binary module, the Service uses the module’s file name (file name and extension) and the
version information mentioned in the report. The version information is important because it lets AQtrace
Service distinguish the modules used in different builds of your application. The Service assumes that the
debug information is either included into the binary module, or that the debug information file resides in the
same folder, in which the binary module is located.
So, it is important to specify the path to the build storage for the AQtrace Service (that is, the path to the
binary modules and debug information files). You do this on the Common Settings page of the AQtrace
Server Config utility by using the following option:
●
Build storage file name - The fully-qualified name of the configuration file that contains
information about the modules added to the build storage. You create this file using special
AQtrace Module Store utility. Later, the file should be updated every time a new build is shipped
to end-users. You can update it manually via the AQtrace Module Store utility, or automaticaly via
the AQtrace Module Store Agent service.
On the AQtrace Service Settings page of the AQtrace Server Config utility, you can find two additional
settings that concern modules and debug information files used by AQtrace Service:
●
Symbols path and Cache symbols directory - These settings specify location of those modules
and debug info files that are not included in your build storage, but reside on some other
computers or on the Web (for instance, debug information files for the operating system’s libraries
reside on Microsoft’s Web site).
Using the Symbols path list you specify the locations, in which AQtrace Service will search for
the modules and debug information. To add a search location, click Add and then type the desired
address into the ensuing in-place editor. Confirm the change with Enter.
The Cache symbols directory setting specifies the folder on your computer, in which the
downloaded modules and files will reside. AQtrace Service will search for the module in the cache
folder first and if the module is not found there, it will download it from the locations specified in
the Symbols path list.
AQtrace Server Config
AQtrace Server Config is a special utility that is used to configure settings of three AQtrace server-side
components: Report Collector, AQtrace Service and AQtrace Module Store Agent.
The utility is installed if you select one of the following features on the Select Server-Side Components
page in AQtrace's installation wizard (this page is displayed only if you select the Receive error reports and
manage the storage of your binary modules option on the Select AQtrace Components page of the wizard):
●
Report Collector (.asp page)
●
AQtrace Service Files and Modules | AQtrace Service
●
AQtrace Service Files and Modules | AQtrace Module Store Agent
The utility’s file name is AQtraceServerConfig.exe. You can find it in the <AQtrace>\Bin folder.
The following topics provide detailed information on settings pages of AQtrace Server Config.
© 2011 SmartBear Software
smartbear.com/support
302
Server-Side Components
Note: The Report Collector Settings, AQtrace Service Settings and AQtrace Module Store Agent
Settings pages become available after you specify an existing folder in the Initial storage folder
edit box and an existing configuration file in the Build storage file name edit box on the
Common Settings page and apply the changes.
Common Settings Page
Use the Common Settings page of the AQtrace Server Config utility to specify settings that are common
for the server-side components. To display the page, select Common Settings from the menu on the left of
the AQtrace Server Config window.
Currently, the page contains the following settings:
●
Initial storage folder - The fully-qualified name of the folder that will be used as the initial report
storage. The Report Collector saves the received error reports to this folder and then AQtrace
Service analyzes these files and moves them to the persistent storage folder.
You can either type the desired folder or press the ellipsis button and choose one in the ensuing
Browse for Folder dialog.
●
Build storage file name - The fully-qualified name of the file that contains information about
binary modules and debug information files added to the build storage. The file contains the
modules’ names, fully-qualified paths and version numbers.
You generate and modify this file by using the AQtrace Module Store utility that is shipped along
with AQtrace. You can find the utility in the <AQtrace>\Bin folder. To call this utility directly
from AQtrace Server Config, press the Edit button in the Build storage file name edit box.
If the build storage configuration file already exists, you can either type its name in the Build
storage file name edit box or press the ellipsis button and choose the file in the ensuing Open File
dialog.
For more information on specifying the path to the build storage, see Configuring AQtrace
Service.
If the settings are invalid, you cannot switch to the Report Collector Settings, AQtrace Service Settings
or AQtrace Module Store Agent Settings page of AQtrace Server Config. Specify the correct settings and
press Apply to be able to specify other settings of the server-side components.
Notes:
●
The Initial storage folder setting is critical for Report Collector and AQtrace Service. If this
setting is empty or if the specified folder does not exist, the Collector and the Service will not
function properly.
●
The Build storage file name setting is critical for AQtrace Service, AQtrace Module Store Agent
and AQtrace Viewer. Therefore, you must specify an existing file in this setting.
●
The initial storage folder can reside on the computer where Report Collector or AQtrace Service is
installed, or on any other workstation in the network. That is, you can specify both local and
network paths (for instance, C:\Error Reports\Initial or \\Server\Error Reports\InitialFolder).
●
The build storage configuration file can reside on the computer where AQtrace Service, AQtrace
Module Store Agent or AQtrace Viewer are installed, or on any other workstation on the network.
So, you can specify both local and network paths to the configuration file (for instance, C:\Build
Storage\Config.xml or \\Server\Build Storage\Config.xml).
●
Both Report Collector and AQtrace Service must have the read and write permissions for the
smartbear.com
AQtrace by SmartBear Software
AQtrace Server Config
●
303
initial storage folder.
The initial storage folder cannot coincide with the persistent storage folder.
Report Collector Settings Page
Use the Report Collector Settings page of the AQtrace Server Config utility to view and modify
settings of AQtrace’s Report Collector server-side component that receives error reports. To display the
page, select Report Collector Settings from the menu on the left of the AQtrace Server Config window.
Note that the page is disabled until you specify an existing folder in the Initial storage folder setting on the
Common Settings page and apply your changes.
The Report Collector Settings page contains the following settings:
●
Initial storage folder - Denotes the fully-qualified path to the initial storage folder to maintain.
This path is specified on the Common Settings page of AQtrace Server Config. Report Collector
receives error reports and saves them to the initial storage folder, no matter whether the reports
will be stored or relayed (see below for more information on report relaying).
Report Collector needs read and write permissions for the initial storage folder.
●
Relay received reports - Report Collector can either store received error reports to the initial
storage folder or re-send them to another URL. If this setting is enabled, the Collector will relay
the received reports to the URL, specified by the following settings:
●
Server name or IP address - This setting is meaningful only if the Relay received reports
setting is enabled. It specifies the name or IP address of the server to which error reports will
be relayed.
Note: The specified value must not contain the protocol name, that is, it must not
contain the http:// prefix.
●
Report Collector (.asp page) - This setting is meaningful only if the Relay received reports
setting is enabled. It specifies the virtual directory and name of the .asp page, to which reports
will be forwarded. By default, the AQtrace installation program uses the following directory
and name:
/AQtrace/bugreport.asp
So, you can specify this string into the Report Collector (.asp page) field.
●
Port - This setting is meaningful only if the Relay received reports setting is enabled. It
specifies the port on the destination computer, to which reports will be relayed.
●
Number of sending attempts - This setting is used only if Report Collector functions in relay
mode. If the relay of a report fails, the Collector attempts to send the report once again. This
setting specifies the number of relaying attempts. Default: 10.
●
User name - This setting is meaningful only if the Relay received reports setting is enabled. It
specifies the user account that is used to access the server and virtual directory. This parameter
is not required and it can be omitted if the specified virtual directory on the server allows
anonymous access.
●
Password - This setting is used only if the Relay received reports setting is enabled. It
specifies the password for the user account that is used to access the server and virtual
directory. This parameter is not required and it can be omitted if the specified virtual directory
on the server allows anonymous access.
© 2011 SmartBear Software
smartbear.com/support
304
Server-Side Components
●
Log file name - Specifies the name of the file, to which Report Collector will save information
about the processed reports.
To save your changes, press Apply at the bottom of the AQtrace Server Config window.
AQtrace Service Settings Page
Use the AQtrace Service Settings page of the AQtrace Server Config utility to view and modify settings
of AQtrace Service (the AQtrace component that performs initial processing of received error reports).
To display the page, select AQtrace Service Settings from the menu on the left of AQtrace Server
Config’s window. Note that the page is disabled until you specify an existing folder in the Initial storage
folder and Build storage file name settings on the Common Settings page and apply the changes.
The AQtrace Service Settings page contains the following settings:
●
Initial storage folder - Denotes the fully-qualified path to the initial storage folder to maintain.
This path is specified on the Common Settings page of AQtrace Server Config. AQtrace Service
monitors the contents of the initial storage folder and when new reports, which are received by
Report Collector, arrive in the folder, AQtrace Service moves them to the persistent storage.
AQtrace Service needs read and write permissions for the initial storage folder.
●
Build storage file name - Denotes the fully-qualified name of the build storage configuration file
to maintain. This file name is specified on the Common Settings page of AQtrace Server Config.
The build storage configuration file contains information about binary modules and debug
information files added to the build storage, their paths and version numbers.
This setting should point to an existing build storage configuration file. To create such a file, use
the AQtrace Module Store utility.
●
Persistent storage folder - The fully-qualified name of the persistent storage folder.
Notes:
●
●
The persistent storage folder cannot coincide with the initial storage folder.
●
The persistent storage folder may reside on the computer where AQtrace Service is installed,
or on any other workstation on the network. That is, you can specify both local and networks
paths (for instance, C:\Error Reports\Storage or \\Server\Error Reports\Store).
●
AQtrace Service needs read and write permissions for the persistent storage folder.
●
It is recommended to share the persistent storage folder, so that your team members can access
the folder and analyze error reports on other workstations.
Symbols path and Cache symbols directory - Using the Symbols path setting you can specify
path to the binary modules and debug information files that cannot be found in the build storage.
These modules or files can be located on your computer or somewhere in local network or Web. In
the last case, AQtrace Service will download the modules to the folder specified by the Cache
symbols directory setting and then use the downloaded modules for work.
To save your changes, press Apply at the bottom of the AQtrace Server Config window.
AQtrace Module Store Agent Settings Page
Use the AQtrace Module Store Agent Settings page of the AQtrace Server Config utility to view and
modify settings of the AQtrace Module Store Agent. The AQtrace Module Store Agent is a service that
monitors adding and removing files to or from the build storage folder(s) and automatically updates the build
smartbear.com
AQtrace by SmartBear Software
Issue-Tracking Plug-Ins
305
storage configuration file.
To display the page, select AQtrace Module Store Agent Settings from the menu on the left of
AQtrace Server Config’s window.
The AQtrace Module Store Agent Settings page contains the following settings:
●
Build storage file name - Denotes the fully-qualified name of the build storage configuration file
to maintain. This file name is specified on the Common Settings page of AQtrace Server Config.
The build storage configuration file contains information about binary modules and debug
information files added to the build storage, their paths and version numbers.
This setting should point to an existing build storage configuration file. To create such a file, use
the AQtrace Module Store utility.
Note: The Agent gains exclusive access to the specified configuration file, therefore, the
attempts to modify the same configuration file manually (using the AQtrace Module
Store utility) will fail unless the Agent is stopped.
●
Module storage folder path list - Lists one or more folders to be monitored by the Agent. If the
specified folder contains subfolders, they are monitored as well.
When a new binary module or debug information file appears in a listed folder, the Agent
automatically appends a new item to the build storage configuration file. Likewise, when a binary
module or debug information file is deleted from a listed folder, the appropriate item is
automatically removed from the configuration file.
●
Update interval - Defines the time interval (in minutes) in which the Agent will check the
specified folders for changes. If the option is 0, the folders are being monitored permanently.
To save your changes, press Apply at the bottom of the AQtrace Server Config window.
Issue-Tracking Plug-Ins
About
The AQtrace installation package includes specific modules that add received error reports to issuetracking systems. Currently, AQtrace supports the following issue trackers:
●
●
Microsoft Visual Studio Team System
Mozilla Foundation Bugzilla
●
Atlassian JIRA
●
SmartBear ALMComplete
Note: AQtrace also supports the AQdevTeam issue-tracking system. AQdevTeam is no longer
developed by AutomatedQA. The integration with it is supported for backward compatibility.
How the Plug-Ins Work
The issue-tracking plug-ins work on the computer, on which AQtrace Service is running. The plug-ins
connect to the Service and request information about error reports that have been received over a period of
time. For each new report, the plug-ins automatically create a work item in the issue-tracking system, fill the
item’s fields and attach the report file to the item.
© 2011 SmartBear Software
smartbear.com/support
306
Server-Side Components
Bugzilla Support Plug-In
The AQtrace package includes the Bugzilla Support plug-in. This plug-in is installed on the computer,
on which AQtrace Service resides.The plug-in monitors new error reports that arrive to the persistent report
storage and creates new bug reports in a Bugzilla database on the base of these error reports.
The plug-in’s file name is <AQtrace>\Bin\Report2Issue.exe. This file also contains the Team System
Support, JIRA Support, ALMComplete Support and AQdevTeam Support plug-ins, and is used to configure
the plug-ins.
Requirements
The plug-in must reside on the computer, on which AQtrace Service is located. Also, in order for the
plug-in to be able to work with error reports, AQtrace Service must be running. No more additional software
is required.
Supported Bugzilla Versions
The plug-in supports Bugzilla version 3.0.3 and 3.1.3.
Configuring the Plug-In
In order for the plug-in to function properly, you should configure its settings. This program functions as
a wizard. Select Bugzilla on the first page and then specify the desired settings on the next wizard pages:
●
Connection settings to the desired Bugzilla database.
●
User name and password for the login.
●
Item fields, to which the plug-in will save information retrieved from the error report.
●
You should also define the Bugzilla projects that correspond to this or that your product. These
settings will let the plug-in automatically organize the incoming error reports into the appropriate
projects.
You should update this setting for every new version of your products shipped to endusers, since the setting depends on the product version.
For complete information on the settings, see description of the Report to Issue utility.
Microsoft Team System Support Plug-In
The AQtrace package includes the Microsoft Team System Support plug-in. This plug-in is installed
on the computer, on which AQtrace Service resides. The plug-in monitors new error reports that arrive to the
persistent report storage and creates new work items in a Team System database on the base of these reports.
The plug-in’s file name is <AQtrace>\Bin\Report2Issue.exe. This file also contains the Bugzilla
Support, JIRA Support, ALMComplete Support and AQdevTeam Support plug-ins, and is used to configure
the plug-ins.
Requirements
The plug-in must reside on the computer, on which AQtrace Service is located. The AQtrace Service
must be running.
Also, this computer must have Microsoft Visual Studio 2005 or 2008 with Team Explorer. The plug-in
smartbear.com
AQtrace by SmartBear Software
Issue-Tracking Plug-Ins
307
uses Team Explorer’s functionality to add items to the Team System database. If both Visual Studio 2005
and 2008 are installed, Visual Studio 2008 Team Explorer is used.
Supported Team System Versions
Currently, the plug-in supports the following versions of Microsoft Visual Studio Team System:
●
Microsoft Visual Studio 2005 Team System
●
Microsoft Visual Studio 2008 Team System
Configuring the Plug-In
In order for the plug-in to function properly, you should configure its settings. This program functions as
a wizard. Select Team System on the first page and then specify the desired settings on the next wizard
pages:
●
Connection settings to the desired Team System database.
●
User name and password for the login.
●
Item fields, to which the plug-in will save information retrieved from the error report.
●
You should also define the Team System projects that correspond to your products. These settings
will let the plug-in automatically organize the incoming error reports into the appropriate projects.
You should update this setting for every new version of your products shipped to endusers, since the setting depends on the product version.
For complete information on the settings, see description of the Report to Issue utility.
JIRA Support Plug-In
The AQtrace package includes the JIRA Support plug-in. This plug-in is installed on the computer
where AQtrace Service resides. The plug-in monitors new error reports that are placed in the persistent
report storage and creates new bug reports in an Atlassian JIRA database on the basis of these error reports.
The plug-in’s file name is <AQtrace>\Bin\Report2Issue.exe. This file also contains the Team System
Support, Bugzilla Support, ALMComplete Support and AQdevTeam Support plug-ins, and is used to
configure the plug-ins.
Requirements
The plug-in must reside on the computer where AQtrace Service is located. Also, in order for the plug-in
to be able to work with error reports, AQtrace Service must be running. There is no need to have JIRA
installed on this computer.
In order for the plug-in to interact with the JIRA database, JIRA must accept remote API calls. By
default, this option is disabled after JIRA is installed. For more information on how to enable
JIRA’s API remote acceptance, see the documentation on this issue-tracking tool.
Supported JIRA Versions
The plug-in supports Atlassian JIRA version 3.10 or later.
© 2011 SmartBear Software
smartbear.com/support
308
Server-Side Components
Configuring the Plug-In
In order for the plug-in to function properly, you should configure its settings. Launch the
<AQtrace>\Bin\Report2Issue.exe executable. This program functions as a wizard. Select JIRA on the first
page and then specify the desired settings on the other wizard pages:
●
The URL of the desired JIRA database.
●
The user name and password that will be used to log in to the database.
●
The item fields to which the plug-in will save information retrieved from error reports.
●
The JIRA projects that correspond to your product. This will allow the plug-in to automatically
place the incoming error reports in appropriate projects.
You should update this setting for each new version of your products shipped to end-users, since
this setting depends on the product version.
For complete information on all of these settings, see the description of the Report to Issue utility.
ALMComplete Support Plug-In
The AQtrace package includes the ALMComplete Support plug-in. This plug-in is installed on the
computer where AQtrace Service resides. The plug-in monitors new error reports that are placed in the
persistent report storage and creates new bug reports in a SmartBear ALMComplete database on the basis of
these error reports.
The plug-in’s file name is <AQtrace>\Bin\Report2Issue.exe. This file also contains the Team System
Support, Bugzilla Support, JIRA Support and AQdevTeam Support plug-ins, and is used to configure the
plug-ins.
Requirements
The plug-in must reside on the computer where AQtrace Service is located. Also, in order for the plug-in
to be able to work with error reports, AQtrace Service must be running. No more additional software is
required.
Supported ALMComplete Versions
The plug-in supports SmartBear ALMComplete version 9.5.1 or later.
Configuring the Plug-In
In order for the plug-in to function properly, you should configure its settings. Launch the
<AQtrace>\Bin\Report2Issue.exe executable. This program functions as a wizard. Select ALMComplete on
the first page and then specify the desired settings on the other wizard pages:
●
The URL of the ALMComplete web service used to work with the ALMComplete database.
●
The login (e-mail address) and password that will be used to log in to the database.
●
The item fields to which the plug-in will save information retrieved from error reports.
●
The ALMComplete projects and their folders that correspond to your product. This will allow the
plug-in to automatically add the incoming error reports to appropriate places.
You should update this setting for each new version of your products shipped to end-
smartbear.com
AQtrace by SmartBear Software
Issue-Tracking Plug-Ins
309
users, since this setting depends on the product version.
For complete information on all of these settings, see the description of the Report to Issue utility.
AutomatedQA AQdevTeam Support Plug-In
The AQtrace package includes the AutomatedQA AQdevTeam Support plug-in. This plug-in is
installed on the computer, on which AQtrace Service is located. The plug-in monitors new error reports that
arrive to the persistent report storage and creates new work items in your AQdevTeam database on the base
of these reports.
Note: Currently, AQdevTeam is no longer developed. However, the integration with this issuetracking system is still available for AQtrace.
The plug-in’s file name is <AQtrace>\Bin\Report2Issue.exe. This file also contains the Team System
Support, Bugzilla Support, ALMComplete Support and JIRA Support plug-ins, and is used to configure the
plug-ins.
Requirements
The plug-in must reside on the computer, on which AQtrace Service is located. Also, in order for the
plug-in to be able to work with error reports, AQtrace Service must be running.
There is no need to have AQdevTeam installed on this computer.
Supported AQdevTeam Versions
The plug-in supports AQdevTeam version 1.8.
Configuring the Plug-In
To configure the plug-in, launch the <AQtrace>\Bin\Report2Issue.exe executable. This program
functions as a wizard. Select AQdevTeam on the first page and then specify the desired settings on the next
wizard pages:
●
Connection settings to your AQdevTeam database.
●
User name and password for the login.
Item fields, to which the plug-in will store information retrieved from the error reports.
●
●
You should define the AQdevTeam project that corresponds to this or that your product. These
settings let the plug-in automatically add the incoming reports to the appropriate projects.
You should update this setting for every new version of your products shipped to endusers, since the setting depends on the product version.
If the error report, for which the plug-in creates a new item, is a duplicated report, then the plug-in
automatically links the created item with the items that correspond to the duplicated reports.
For complete information on the settings, see description of the Report to Issue utility.
© 2011 SmartBear Software
smartbear.com/support
310
Server-Side Components
Report to Issue Utility
The Report to Issue utility performs two functions:
●
It contains the implementation of the issue-tracking plug-ins, which connect to AQtrace Service,
obtain information about error reports that have been received recently and add work items based
on these reports to issue-tracking systems.
●
It is used to configure the server-side plug-ins.
The utility is installed if you install at least one server-side plug-in during the AQtrace installation. You
can find it in the <AQtrace>\Bin folder. The file name is Report2Issue.exe.
Mapping Products to Issue-Tracking Projects
Issue-tracking plug-ins create work items on the base of received error reports and add these items to
issue-tracking databases. Typically, companies sell several products and each product has a number of
versions (1.0, 2.0 and son on). So, most likely you will receive error reports that were generated for different
products and for different versions of a product. Of course, it would be nice to organize these reports into the
appropriate projects of your issue-tracking database. You can do this with AQtrace’s Report to Issue utility.
On the Specify Projects page of the utility you can set which versions of your products to which issuetracking projects correspond, so the reports generated for these versions will be added into the appropriate
project.
To map a product version to an issue-tracking project, you need to specify the attributes that define your
product’s version and define the issue-tracking project.
The issue-tracking project is specified by its name. Bugzilla users should also specify the value of the
Component field. As for the software product, it is specified by the identifier and version. You should
specify them in the AQtrace Packager and Report to Issue utilities. The whole procedure includes the
following steps:
●
Launch AQtrace Packager.
●
Switch to the Product Information page and specify the desired product identifier and version in
the Product identifier and Product version fields, respectively:
smartbear.com
AQtrace by SmartBear Software
Report to Issue Utility
311
The identifier lets you distinguish one your product from another. The product version value lets
you distinguish different versions of the same product from each other. Typically, it is
recommended to specify major version in this field, but you can also use minor version and even
build part (if you need to separate report flows for different minor versions or builds).
●
Specify other settings in your AQtrace Packager project and click the Process Module toolbar
item in case of a native project to apply the settings to your executable, or click the Generate
Assembly toolbar item in case of a .NET project to generate the aqReporterInterop.dll assembly.
●
●
Launch the Report to Issue utility.
Go through its pages until the Specify Projects page is activated.
●
On the page, click Add. This will invoke the Set Up Mapping dialog:
●
In the Product id and Product version edit boxes of the dialog, specify your product’s
identifier and version, respectively.
Note: You should use the same values that you specified in AQtrace Packager.
To specify the product identifier and version, you can use wildcards (? and *). Using this
feature, you can create and use the same mapping rule for different products or different
version of the same product.
●
In the Project name edit box specify the issue-tracking project, to which work items should be
added.
AQdevTeam users can specify top-level projects or child projects. If you specify a child
project, you should use the full path to it. To separate the project names in the path, use the
backslash character (\).
●
●
For Bugzilla users: Specify the value of the Component field.
For ALMComplete users: In the Folder edit box, specify the desired folder located in the specified
issue-tracking project to which work items should be added. If you want to add work items to the
root of the specified project, you must specify the (Project root folder) value in the edit box.
© 2011 SmartBear Software
smartbear.com/support
312
Server-Side Components
●
Specify other settings in the edit boxes of the Set Up Mapping dialog and close it (see the dialog
description for more information about this).
●
Click
Next on the Specify Projects page of the utility to go to the Final Step page, then, close
the utility’s window.
The values you specify in AQtrace Packager will be saved to the generated error reports. When an issuetracking plug-in analyzes received error reports it retrieves the product identifier and product version from
the error report. Then, the plug-in searches for the identifier and version number in the mapping settings list,
which you create in the Report to Issue utility. After the product and version is found, the plug-in obtains the
name of the appropriate issue-tracking project and then adds a new work item to this project.
Note: The search in the mapping settings list depends on the order of the settings in the list. The plugins search from the top of the list to its bottom. Once the sought-for setting is found, the search
is stopped.
Applying Settings to Existing Reports
Issue-tracking plug-ins process error reports according to the plug-ins’ settings you specified in the
Report to Issue utility. The plug-ins do not apply the settings immediately. They query the settings at certain
periods of time, so the specified settings will be applied only to the next “portion” of received reports.
However, you can apply the settings to those reports that have already been saved to the persistent report
storage. To do this:
●
Launch the Report to Issue utility.
●
Go through the settings pages to the Specify Projects page.
●
On the Specify Projects page, select the Process existing reports check box.
Now, after you press Next, the utility will process all the reports that have been added to the storage
using the new settings. The result of processing will be displayed on the Final Step page of the utility.
Report to Issue Utility - Pages
smartbear.com
AQtrace by SmartBear Software
Report to Issue Utility
313
Select Issue-Tracking System Page
The Select Issue-Tracking System page is the first page of the Report to Issue utility. On this page, you
can select the desired issue-tracking system and the connection that you want to configure. Note that the page
lists only those issue-tracking systems, for which you installed the appropriate support plug-in when
installing AQtrace. For instance, if you did not install the Microsoft Team System Support plug-in, you
cannot configure a connection to a Visual Studio Team System database.
Select the desired issue-tracking system and click Next to continue.
Set up Connection to the AQdevTeam Database Page
On the Set up connection to the AQdevTeam database page of the Report to Issue wizard you can
specify the parameters needed to connect to the AQdevTeam3 database. Once you specified the parameters,
click Next to test the connection.
Note: This page is available only if you install the AQdevTeam Support plug-in.
At the top of the page choose the connection type: DCOM, Sockets or HTTP. The page may display
additional connection settings depending on the selected connection type:
●
DCOM. The Distributed Component Object Model (DCOM) is a protocol that enables software
components to communicate directly through the network. If you chose the DCOM connection
3
AQdevTeam is an issue-tracking and project management system by AutomatedQA Corp.
AQdevTeam is no longer developed. However, the integration with this issue-tracking system is
still available for AQtrace.
© 2011 SmartBear Software
smartbear.com/support
314
Server-Side Components
type, you should enter the name of the computer, where the AQdevTeam Server is installed, into
the Computer name edit box. You can either type the computer name, or press the ellipsis button
and choose the desired computer from the ensuing Browse for Computer dialog.
●
Sockets. The Sockets protocol is the Windows interface to TCP/IP. If you chose the Sockets
connection type, you should specify the following connection settings:
●
Host - Either the name or IP address of the computer where the AQdevTeam Server is
installed. You can either type the name (or address) or press the ellipsis button to select the
computer via the standard Browse for Computer dialog.
●
Port - The port number used to gain access to the database. By default, AQdevTeam Server
uses port 211.
Note: Please contact your administrator to find out which computer name and port to
specify.
Note for administrators: If you want AQdevTeam Server to be available via Sockets, be sure that
the AQdevTeam Socket Server (the Scktsrvr.exe application) is running on the computer where
the AQdevTeam Server is installed. For complete information on AQdevTeam server settings, see
AQdevTeam documentation.
●
HTTP. If you chose the HTTP connection, specify the following connection parameters:
●
URL
The
web
page
that
holds
httpsrvr.dll;
for
instance,
http://server.company.com/scripts/httpsrvr.dll. (httpsrvr.dll is a dynamic link library that is
used to connect to AQdevTeam Server via HTTP).
●
Proxy - Either the name or IP address of the proxy server used to gain access to the
AQdevTeam Server database. You can leave this empty if you do not want to use a proxy
server.
●
Proxy login - The user’s name used for proxy authentication. You must populate this field if
you have specified a proxy server address in the Proxy field.
●
Proxy password - The user’s password used for proxy identification. You must populate this
field if you have specified a proxy server address in the Proxy field.
Note: Please contact your administrator to find out which values to specify for the
HTTP connection.
Note for administrators: To work with AQdevTeam via HTTP, the server computer must be
properly configured. For complete information on this, see AQdevTeam documentation.
The connection parameters specify the AQdevTeam Server instance, to which the Report to Issue utility
will connect. AQdevTeam Server may control one or several databases. Specify the name of the
AQdevTeam database, with which the utility will work, in the Database edit box.
Other than connection properties, you should also specify the user name and password needed to connect
to the selected AQdevTeam database. If you select the Authenticate by OS check box, the utility will use
the user name and password you specify to log into your computer.
In order for Report to Issue to map products to issue-tracking projects and to add work items to the
AQdevTeam database, the specified user account must have permissions to read field types and
work item types, to get the list of existing projects, to create new work items, to attach files to work
smartbear.com
AQtrace by SmartBear Software
Report to Issue Utility
315
items, and so on. Otherwise, if the specified AQdevTeam user does not have some required
permissions, the Report to Issue utility may work with the AQdevTeam database incorrectly (some
problems when mapping products to issue-tracking projects or adding work items to the
AQdevTeam database may occur). We recommend that you use an administrator account that has
all of the required permissions by default. If you do not want to use an administrator account, read
the AQdevTeam documentation to get more information on permissions of AQdevTeam users and
to learn how to configure user permissions in your issue-tracking system.
Note for administrators: Authentication by OS requires that the AQdevTeam Server is configured to
support this feature. For more information, see AQdevTeam documentation.
Once you set up all connection parameters, click Next. This will activate the connection checking
procedure.
Set up Connection to the Bugzilla Database Page
On the Set up connection to the Bugzilla database page of the Report to Issue utility you can specify
the parameters needed to connect to the Bugzilla database.
Note: This page is available only if you install the Bugzilla Support plug-in.
You can set the following parameters:
●
URL - Specifies the server name and folder of the desired Bugzilla database.
●
Login - The user name that will be used to connect to the Bugzilla database.
In order for Report to Issue to map products to issue-tracking projects and to add work
items to the Bugzilla database, the specified user account must have permissions to read
field types and work item types, to get the list of existing projects, to create new work
items, to attach files to work items, and so on. Otherwise, if the specified Bugzilla user
does not have some required permissions, the Report to Issue utility may work with the
Bugzilla database incorrectly (some problems when mapping products to issue-tracking
projects or adding work items to the Bugzilla database may occur). We recommend that
you use an administrator account that has all of the required permissions by default. If
you do not want to use an administrator account, read the Bugzilla documentation to get
more information on permissions of Bugzilla users and to learn how to configure user
permissions in your issue-tracking system.
●
Password - Specifies the password that will be used to connect to the Bugzilla database.
Once you specify the connection parameters, click Next. This will activate the connection checking
procedure.
Set up Connection to the Team System Database Page
On the Set up connection to the Team System database page of the Report to Issue utility, you can
specify the parameters needed to connect to the issue-tracking database of Microsoft Visual Studio Team
System.
© 2011 SmartBear Software
smartbear.com/support
316
Server-Side Components
Note: This page is available only if you install the Microsoft Team System Support plug-in.
You can set the following parameters:
●
URL or host name - Specifies the server name and page of the desired Team System database.
●
Login - The user name that will be used to connect to the Team System database.
In order for Report to Issue to map products to issue-tracking projects and to add work
items to the Team System database, the specified user account must have permissions to
read field types and work item types, to get the list of existing projects, to create new
work items, to attach files to work items, and so on. Otherwise, if the specified Team
System user does not have some required permissions, the Report to Issue utility may
work with the Team System database incorrectly (some problems when mapping
products to issue-tracking projects or adding work items to the Team System database
may occur). We recommend that you use an administrator account that has all of the
required permissions by default. If you do not want to use an administrator account, read
the Team System documentation to get more information on permissions of Team
System users and to learn how to configure user permissions in your issue-tracking
system.
●
Password - Specifies the password that will be used to connect to the Team System database.
Once you specify the connection parameters, click Next. This will activate the connection checking
procedure.
Set up Connection to the JIRA Database Page
On the Set up connection to the JIRA database page of the Report to Issue utility, you can specify
parameters needed to connect to the JIRA database.
Note: This page is available only if you installed the JIRA Support plug-in.
You can set the following parameters:
●
URL - Specifies the server name and folder of the desired JIRA database. You should also specify
the port number (by default, JIRA uses port 8080).
●
Login - Specifies the user name that will be used to connect to the JIRA database.
In order for Report to Issue to map products to issue-tracking projects and to add work
items to the JIRA database, the specified user account must have permissions to read
field types and work item types, to get the list of existing projects, to create new work
items, to attach files to work items, and so on. Otherwise, if the specified JIRA user does
not have some required permissions, the Report to Issue utility may work with the JIRA
database incorrectly (some problems when mapping products to issue-tracking projects or
adding work items to the JIRA database may occur). We recommend that you use an
administrator account that has all of the required permissions by default. If you do not
want to use an administrator account, read the JIRA documentation to get more
information on permissions of JIRA users and to learn how to configure user permissions
smartbear.com
AQtrace by SmartBear Software
Report to Issue Utility
317
in your issue-tracking system.
●
Password - Specifies the password that will be used to connect to the JIRA database.
After you specify the connection parameters, click Next. This will activate the connection checking
procedure.
Set up Connection to the ALMComplete Database Page
On the Set up connection to the ALMComplete database page of the Report to Issue utility, you can
specify parameters needed to connect to the ALMComplete database.
Note: This page is available only if you installed the ALMComplete Support plug-in.
You can set the following parameters:
●
URL - Specifies the ALMComplete web service address. The value you specify in this parameter
depends on how you use the ALMComplete issue-tracking system:
●
If you use ALMComplete as SaaS, you should specify the following address:
http://ws.softwareplanner.com/psWS.asmx
●
●
If you have a perpetual ALMComplete license and ALMComplete is deployed on your own
web server, then you should specify the address of the ALMComplete web service running
on your web server. For example:
http://[Your_Server_Name]/psws/psWS.asmx
Login - Specifies the e-mail address (for instance,
in to your ALMComplete database.
[email protected])
that will be used to log
In order for Report to Issue to map products to issue-tracking projects and to add work
items to the ALMComplete database, the specified user account must have permissions
to read field types and work item types, to get the list of existing projects, to create new
work items, to attach files to work items, and so on. Otherwise, if the specified
ALMComplete user does not have some required permissions, the Report to Issue utility
may work with the ALMComplete database incorrectly (some problems when mapping
products to issue-tracking projects or adding work items to the ALMComplete database
may occur). We recommend that you use an administrator account that has all of the
required permissions by default. If you do not want to use an administrator account, read
the ALMComplete documentation to get more information on permissions of
ALMComplete users and to learn how to configure user permissions in your issuetracking system.
●
Password - Specifies the password that will be used to log in to the ALMComplete database.
After you specify the connection parameters, click Next. This will activate the connection checking
procedure.
Verify Connection Page
The Verify connection page of the Report to Issue utility is displayed after you specify the connection
© 2011 SmartBear Software
smartbear.com/support
318
Server-Side Components
settings to the issue-tracking database. The utility displays this page to inform you that it checks the
connection settings and let you view the results of the check.
If the test passed successfully, the Next button is enabled. Click it to configure the settings.
If the test failed, click Back, check the connection parameters and then try to connect to the database
again.
Specify Projects Page
On the Specify Projects page of the Report to Issue utility, you can specify which issue-tracking projects
the AQtrace issue-tracking plug-ins will add work items to based on the received error reports. In other
words, you can map products to issue-tracking projects.
When modifying the mapping settings, you can also define the item type and field values to be used to
create work items.
The page contains a table that lists the mapping settings and the Process existing reports check box that
lets you apply the settings to received reports. If you select this check box and press Next, then the Report to
Issue utility will apply the mapping settings to the reports that have already been received and saved to the
persistent storage. The results will be displayed on the Final Step page of the Report to Issue utility.
The table displays the mapping settings between the product identifiers and versions that are specified in
reports, and issue-tracking projects. The table has the following columns:
Column
Description
Product Id
Specifies the identifier of your product. This is the same value that you specified in
the Product identifier edit box of the Product Information page of AQtrace
Packager.
Product Version Specifies your product’s version, for which the report was generated. This should be
the same value that you specified in the Product version edit box of the Product
Information page of AQtrace Packager.
Project
Specifies the issue-tracking project, to which work items will be added.
Component
This column is visible only when you set up settings for the Bugzilla database. It
specifies the value that will be assigned to the Component field of the bug report that
is added to the database.
To add a new row to the table
●
Press Add. This will invoke the Set Up Mapping dialog.
●
In the dialog, specify the desired product name, version, issue-tracking project, item type and field
values to be used to add work items. Press OK to save the settings.
To modify the mapping settings
●
Double-click the desired row in the table.
-- or --
●
Select the desired row in the table and press Edit.
smartbear.com
AQtrace by SmartBear Software
Report Storage Programming
319
This will invoke the Set Up Mapping dialog.
●
In the dialog, modify the values and press OK to save the changes.
To change the order of mapping settings
The order of mapping settings is important because the issue-tracking plug-ins search for the product and
version in the order of their appearance in the table (from top to bottom). Once the product and version is
found, the search is stopped.
To change the order:
●
Select the desired row in the table.
●
Press Move Up or Move Down to specify the desired position of the row in the table.
To delete the mapping settings
●
Select the desired row in the table.
●
Press Delete.
After mapping your product to the desired issue-tracking project, click Next to go to the Final Step page.
Then click Finish on this page to close the Report to Issue utility and to save the settings.
Final Step Page
The Final Step page is the last page of the Report to Issue utility. Its contents depends on the Process
existing reports check box that is located on the previous page, Specify Projects. If this check box is
selected, the utility applies the options, which you set on the Specify Projects page, to error reports that are
located in the persistent storage. The processing results are displayed on the Final Step page. If the check box
is clear, then the Final Step page does not display any results and simply informs you that the set up process
is over.
Press Finish to save the settings and close the Report to Issue utility.
Press Back to return to the previous pages and modify your settings.
Report Storage Programming
The persistent storage is a folder that contains report files. We also call it persistent storage folder.
You may want to create specific applications that would work with the persistent storage to perform some
specific tasks. For instance, you may want to create an application that would automatically create work
items in your issue-tracking system on the base of the received error reports.
Since the report storage is just a folder with subfolders and files, you may create an application that will
check the files in the folder and perform the desired operations. Another approach is to use the functionality
provided by AQtrace Service. The Service is a COM server, so you can connect to it, use its methods to
obtain a collection of reports that have been received over a specified period of time and process these
reports.
Report Storage Programming - Basics
To work with error reports that reside in the persistent report storage, you can use the functionality
© 2011 SmartBear Software
smartbear.com/support
320
Server-Side Components
provided by AQtrace Service. It implements a COM object, whose methods let you obtain a collection of
reports that were saved to the report storage during certain time period, iterate through this collection and
analyze the reports. This functionality is used by AQtrace’s issue-tracking plug-ins that create items in issuetracking systems. You can use the same functionality to perform the actions you need. For instance, you can
create a utility that will support your issue-tracking system or send notifications about new reports to
developers.
This topic provides basic information on using AQtrace Service and creating a sample utility that will
retrieve reports from the storage and process them.
Working with AQtrace Service via COM
To work with error reports that reside in the persistent report storage, follow these steps:
1. Connect to AQtrace Service.
AQtrace Service’s COM object uses the AQtraceService.Engine program identifier. You can
connect to it in the same way as you connect to other COM servers. In Visual Basic, for example,
you do this by calling the GetActiveObject or GetObject functions. In Delphi, you do this
by calling Delphi’s GetActiveOleObject function.
Note: In order for you to be able to connect and work with AQtrace Service, the Service
must be properly configured. For more information on this, see Configuring AQtrace
Service.
2. Obtain a collection of error reports.
The AQtrace Service COM object implements the IEngine interface. You get a reference to this
interface when connecting to the Service via COM.
The IEngine interface contains a number of methods that let you work with error reports. For
detailed information on them, see the interface description.
We would like to pay your attention to one of the methods - EnumReports. This method returns
an iterator that provides access to a collection of error reports that were received during the
specified time period. The method has two parameters that specify the start and end date and time
of the desired period. You use the resultant iterator to work with error reports that were received
during the specified period of time.
Another
important
and
useful
method
of
the
IEngine
interface
is
EnumNotProcessedReports. This method returns an iterator that provides access to a
collection of error reports that reside in the persistent storage, but that have not been processed and
submitted to an issue-tracking database yet.
3. Iterate through the collection.
Both the EnumReports and EnumNotProcessedReports methods return an iterator object
that provides access to a collection of error reports in the persistent storage. This iterator object
implements the IaqtReportsIterator interface. You can use the interface’s methods to go
through the reports:
●
Initially, the iterator’s position is before the first element of the collection. To obtain a
reference to the first report in the collection, call the Next method of the
IaqtReportsIterator object. This method returns a reference to the
IaqtReportInformation object that provides information about the appropriate error
report.
smartbear.com
AQtrace by SmartBear Software
Report Storage Programming
321
●
You iterate through the collection by calling the Next method in a loop. To determine
whether the iterator is on the last report or not, use the HasNext method.
●
To set the iterator to the initial position, call Reset.
4. Obtain error report information.
To obtain information about an error report, use properties and the GetValue method of the
IaqtReportInformation object. You get a reference to this object by calling the
IaqtReportsIterator.Next method (see above).
For detailed information on properties and the GetValue method of the
IaqtReportInformation object, see the object’s description. We would like to pay your
attention to the following properties:
●
Exists - AQtrace Service may return the IaqtReportIntformation objects for those
reports that no longer exist. Use this property to determine whether the report file exists or not.
For more information, see the next section.
●
ProductID and ProductVersion - Specifies the identifier and version of the product, for
which the report was generated. If you use AQtrace in several products, then by using these
properties you can determine to which product and version the report relates. Note that the
properties return the same values that you specified in the Product identifier and Product
version edit boxes on the Product Information page of AQtrace Packager.
●
DuplicatedID - Specifies the identifier of the other report, which the given report
duplicates (AQtrace Service detects duplicated reports by analyzing the call stack data. See
Detecting Duplicated Reports). If the report is a duplicate of another report, then you can
process it in a different way.
●
Description - This property returns text that contains call stack and other data in text
form. You can use this property to analyze the report’s call stack.
●
ProcessedMark - When an error report is submitted to an issue-tracking database, it
becomes marked as a processed report. Use this property to determine whether the error report
is marked as processed and has been already submitted to the database or not.
Note also that the information provided by these properties (except for the Exists
ProcessedMark
properties)
can
be
IaqtReportInformation.GetValue method.
obtained
using
and
the
Working With Report Files
When AQtrace Service places a report to the persistent storage, it adds a record about this report to the
persistent storage configuration file. The Service then uses this configuration file to operate with reports. For
instance, the EnumReports and FindReportInformationByID methods of the IEngine object use
the configuration data to return the appropriate results.
The report file can be deleted from hard disk. For instance, you can delete it by using Windows Explorer.
However, the configuration file will not be updated in this case. It will contain a record for the report and
AQtrace Service will “consider” the report still exists in the storage. So, for instance, a call to the
FindReportInformationByID method will not fail.
To check whether the report file exists, use the Exists property of the IaqtReportInformation
(this object is used to obtain error report’s data).
To clear the report storage’s configuration file and remove records about all the files that do not exist
anymore, call the PurgeNonExistingReports method of the IEngine object.
© 2011 SmartBear Software
smartbear.com/support
322
Server-Side Components
To remove records about error reports that were received within a certain time period and to completely
delete the appropriate report files from the disk (if needed), use the PurgeReports method of the
IEngine object. This method helps you remove too old error reports from the storage and reduce the
storage configuration file’s size.
Creating a Utility that Processes Reports
AQtrace includes several issue-tracking plug-ins that use the described functionality to save error reports
to issue-tracking systems like Visual Studio Team System, Bugzilla, JIRA or AQdevTeam4.
You may create a utility that will perform specific operations over error reports that reside in the
persistent report storage. This utility, for instance, can save error reports to the issue-tracking system that is
used in your company (that items are created on the base of error report’s information).
Below are general principles of the utility functioning:
●
The utility periodically requests AQtrace Service for reports that are stored in the persistent storage,
but have not been processed and submitted to an issue-tracking database yet. For this purpose, the
utility connects to AQtrace Service and calls the IEngine.EnumNotProcessedReports
method to obtain a collection of unprocessed error reports.
●
After the collection of error reports is obtained, the utility iterates through it and gets the needed
report information in the manner that was described above.
●
After the processing of the current error report is over, the utility marks this report as processed. For
4
AQdevTeam is an issue-tracking and project management system by AutomatedQA Corp.
AQdevTeam is no longer developed. However, the integration with this issue-tracking system is
still available for AQtrace.
smartbear.com
AQtrace by SmartBear Software
Report Storage Programming
323
this purpose, it obtains the report identifier by calling the IaqtReportInformation.Id
property and then passes it to the IEngine.SetProcessedMark method.
Samples
The following samples demonstrate how you can work with AQtrace Service via COM and process the
reports that were added to the persistent report storage. For simplicity, the sample function saves the
description data of each report to a text file.
[Visual Basic]
Sub TestAQtraceService()
Dim Service, Iterator, ReportInfo
Dim F, s, ID
' Attach to AQtrace Service
Set Service = GetObject(, "AQtraceService.Engine")
' Obtain a report collection
Set Iterator = Service.EnumNotProcessedReports()
' Process the collection
' Open the output file
Open "C:\Reports.txt" For Append Access Write Lock Write As #1
On Error GoTo Close_File
' Iterate through the report collection
While Iterator.HasNext()
' Obtain report information
Set ReportInfo = Iterator.Next()
' Check whether the report file exists
If ReportInfo.Exists Then
' Retrieve the report description
s = ReportInfo.Description + Chr(13) + Chr(10) + Chr(13) +
Chr(10) + Chr(13) + Chr(10)
' Save data to the file
Print #1, s
End If
' Mark the report as processed
ID = ReportInfo.ID
Service.SetProcessedMark(ID, True)
Wend
© 2011 SmartBear Software
smartbear.com/support
324
Server-Side Components
Close_File:
Close #1
End Sub
[Delphi]
uses ComObj;
...
procedure TestAQtraceService;
var
Service, Iterator, ReportInfo : Variant;
F : Text;
S, ID : string;
begin
// Attach to AQtrace Service
Service := GetActiveOleObject('AQtraceService.Engine');
// Obtain a report collection
Iterator := Service.EnumNotProcessedReports();
// Process the collection
// Open the output file
AssignFile(F, 'C:\Reports.txt');
if (FileExists('C:\Reports.txt')) then
Append(F)
else
Rewrite(F);
try
// Iterate through the report collection
while Iterator.HasNext do
begin
// Obtain report information
ReportInfo := Iterator.Next;
// Check whether the report file exists
if ReportInfo.Exists then
begin
// Retrieve the report description
s := ReportInfo.Description + #13#10#13#10;
// Save data to the file
smartbear.com
AQtrace by SmartBear Software
Report Storage Programming
325
WriteLn(F, s);
end;
// Mark the report as processed
ID := ReportInfo.ID;
Service.SetProcessedMark(ID, true);
end;
finally
// Close the file
CloseFile(F);
end;
end;
To work with AQtrace Service via COM in a C# application, add the AQtrace Service COM Object
reference to your C# project. To do this:
●
Select Project | Add Reference from Visual Studio’s main menu. This will invoke the Add
Reference dialog.
●
In the dialog, switch to the COM tabbed page.
●
In the page, find AQtraceService 1.0 Type Library and press OK. Visual Studio will close the
dialog and add the reference to your project.
[C#]
using System.IO;
using System.Runtime.InteropServices;
using AQtraceServiceLib; // This namespace is available after you append
// the AQtrace Service reference to your project
...
private void TestAQtraceService()
{
AQtraceServiceLib.IEngine Service;
AQtraceServiceLib.IaqtReportsIterator Iterator;
AQtraceServiceLib.IaqtReportInformation ReportInfo;
StreamWriter file;
string s, ID;
// Connect to AQtrace Service
Service = Marshal.GetActiveObject("AQtraceService.Engine") as
AQtraceServiceLib.IEngine;
// Obtain the collection of error reports
Iterator = Service.EnumNotProcessedReports();
// Open the output file
file = File.AppendText("C:\\Reports.txt");
try
© 2011 SmartBear Software
smartbear.com/support
326
Server-Side Components
{
// Iterate through the report collection
while (Iterator.HasNext())
{
// Obtain report information
ReportInfo = Iterator.Next();
// Check whether the report file exists
if(ReportInfo.Exists)
{
// Retrieve the report description
s = ReportInfo.Description + "\n\n";
// Save data to the file
file.WriteLine(s);
}
// Mark the report as processed
ID = ReportInfo.ID;
Service.SetProcessedMark(ID, true);
}
}
finally
{
// Close the file
file.Close();
}
}
smartbear.com
AQtrace by SmartBear Software
AQtrace Viewer - User Interface
327
AQtrace Viewer
AQtrace Viewer is a special application that is used to view and analyze error reports generated by the
AQtrace Reporter. It is installed if you select the “Analyze received error reports” option on the Select
AQtrace Components page of the AQtrace installation wizard.
AQtrace Viewer - User Interface
The user interface of AQtrace Viewer consists of panels, the main menu and toolbars. The general layout
is as follows:
Most of the Viewer’s screen area is occupied by panels. Panels are where you do your actual work. For
detailed information on AQtrace Viewer panels and on how to use them, see AQtrace Viewer Panels and
© 2011 SmartBear Software
smartbear.com/support
328
AQtrace Viewer
Analyzing Error Reports With AQtrace Viewer.
The size and layout of panels is not fixed. You can change panels’ size by dragging the separator
between them. However, the most important point about handling panels is how they can be moved around docking. Docking is our way of providing you with the most flexible workspace for the particular task you
are interested in. It means that the entire work area can be reconfigured as needed, even beyond what is
possible with toolbars (moving, hiding an so on). Docking of panels in AQtrace Viewer is similar to docking
windows in Microsoft Visual Studio or Borland Delphi. For more information, see Docking.
There are some common ways of arranging columns and lines in the panels. See Arranging Columns,
Lines and Panels. In the User Interface Options dialog you can view and change general UI settings of
AQtrace Viewer.
To save the current panel layout to a file, select View | Desktop | Save Docking to File from AQtrace
Viewer’s main menu (by default, these files have the .aqtDock extension). To load a panel layout from a file,
select View | Desktop | Load Docking from File. To restore the default panel layout, select View | Desktop
| Restore Default Docking. The Save Desktop As and Load Desktop items of the View | Desktop submenu
will save and load the panel layout along with the toolbar settings.
AQtrace Viewer’s interface receives commands in four ways:
●
●
Through menus.
Through popup menus (right-click, context-dependent).
●
Through toolbars.
●
Through keyboard shortcuts.
You can change the keyboard shortcuts with the Customize Keyboard dialog.
As in Microsoft Word or Excel, menus are a type of a toolbar, and both can be customized as needed.
You can also create your own toolbars. By default, toolbars are docked at the top of the AQtrace Viewer
window. You can easily dock them to any other edge by dragging them to the left, right or bottom edge of
the window. Some toolbars, for instance, Disassembly, Memory1, Memory2 and Memory3 can be docked to
the panels of the same name.
To remove buttons from or add them to the toolbars, you can either call the Toolbar Customization
window or use the Quick Customization feature. For more information about this, see Toolbars
Customization.
To save or load the current layout of toolbars and toolbar items, use the View | Toolbars | Save
Toolbars to File and View | Toolbars | Load Toolbars from File menu items. To restore the default toolbar
layout, select View | Toolbars | Restore Default Toolbars. To save and load the layout of panels, menus
and toolbars, use the View | Desktop | Save Desktop As and View | Desktop | Load Desktop menu items.
Analyzing Error Reports With AQtrace Viewer
AQtrace Viewer contains various panels that let you explore the data included in an error report and find
the cause of the exception. This topic describes how you can analyze reports with the AQtrace Viewer.
Requirements
In order for AQtrace Viewer to be able to parse error reports and display information included in them, it
needs access to binary code and debug information of the modules mentioned in the error report. To display
source code in the Disassembly and Code Viewer panels, AQtrace Viewer also needs access to the source
files of your application.
You specify the search paths for binary modules and debug information in the Symbols Options dialog.
smartbear.com
AQtrace by SmartBear Software
Analyzing Error Reports With AQtrace Viewer
329
For more information about this, see Specifying Path to Modules. As for the path to source files, you can
specify it in the Source Code Options dialog.
Specifying path to binary modules and debug information is critical for parsing the call stack data.
You must specify these paths before you open an error report in AQtrace Viewer. Without these
settings, the Viewer will be unable to parse the call stack data.
Source code location is less important and it has no effect on parsing the call stacks.
Loading Error Reports
To open an error report file for analysis, choose File | Open from the main menu of AQtrace Viewer and
then select the desired file in the ensuing Open File dialog.
AQtrace Viewer can also load reports directly from the persistent report storage. To do this, use the
Storage View panel. It lists the reports that reside in the storage. To load a report, simply double-click it in
the panel.
In order for the panel to be able to connect and load the reports from the storage, you should specify the
path to the storage in the Storage Path setting (see the Report Storage Options Dialog).
Analyzing Error Reports
After you selected the error report for loading, AQtrace Viewer will read information from the report file
and display it in its panels, so you can explore the report data and determine why the exception occurred.
Upon loading a report, AQtrace Viewer shows a message box with brief descriptions of the exception,
for which the report was generated. If the exception was generated on demand, (that is, by using the
ShowFatalErrorWithMessage method of AQtrace Reporter), the message box says that the report file
does not contain information about the exception.
This brief description is also shown in the Output panel. This panel also contains data that the end-user
specified in the User Info dialog when sending the error report to you. You may use this data to understand
what happened on the end-user’s computer.
The “start point” of the analysis is the Threads panel. It lists the threads that existed in your application
at the moment when the exception occurred. For each thread, the report stores information about the call
stacks and values of CPU registers that were actual when the exception occurred.
To view this information for a thread, in the Threads panel, select the row that corresponds to the desired
thread, press Enter (or simply double-click this row in the panel) and then switch to the Call Stack or
© 2011 SmartBear Software
smartbear.com/support
330
AQtrace Viewer
Registers panel.
The Registers panel displays values of the CPU registers for the selected thread. By default, the panel
shows only standard registers like EAX, EBX, ECX or ESP. To view values of MMX, FPU, SSE and SSE2
registers and the values of the Flag register, select the appropriate item from the context menu of the
Registers panel:
The topmost function in the Call Stack panel is the function, in which the exception occurred. Other
items indicate the sequence of function calls that led to the call of the topmost function:
smartbear.com
AQtrace by SmartBear Software
Analyzing Error Reports With AQtrace Viewer
331
For each function in the stack, the panel displays the module name, call address, function name,
parameters and their values, the offset of the instruction that called the next routine in the stack and the line
number of this instruction. AQtrace Viewer displays the function names, line numbers and information about
parameters only if it found debug information for the module that contains the function. The Viewer reads
function names, line numbers and information about parameters from debug information. If debug
information was not found, the function names, line numbers and parameters will not be displayed.
Currently, AQtrace Viewer cannot obtain and display information about function parameters for
.NET (managed) call stacks. Only parameters of functions from native (unmanaged) call stacks can
be displayed in the Call Stack panel.
To determine the call sequence, AQtrace Viewer checks the call stack data saved to the error reports and
analyzes the module’s binary code and debug information. When performing the analysis, AQtrace assumes
that function calls follow certain rules. However, some calls can be absent in the reported stack. This
happens due to certain specifics of functions’ binary code.
To view these calls, right-click somewhere within the Call Stack panel and select Show Dirty Stack
from the context menu, or press the
button on the panel’s toolbar. If this menu item is checked (or the
button on the toolbar is pressed), AQtrace Viewer will treat any address found in the stack as a call address.
This may help you find the missed calls. Note, however, that some of the calls shown in the “dirty” stack, are
not the calls. These are just addresses that reside in the stack.
To view a routine’s binary code, right-click this routine in the Call Stack panel and select Go to
Disassembly from the context menu, or select the routine and click the
Go to Disassembly button on the
panel’s toolbar. AQtrace Viewer will switch to the Disassembly panel and place the marker to the left of
the code at the call address that you selected in the Call Stack panel.
© 2011 SmartBear Software
smartbear.com/support
332
AQtrace Viewer
To quickly view assembler instructions that reside at a certain address in memory, specify the desired
address in the Address box of the Disassembly toolbar and press Enter. If you type a hexadecimal value,
enter the 0x prefix. You can either type the address, or drag it from the Disassembly or Memory panels and
drop it in the Address box.
The Disassembly panel can display both binary and source code. In the panel you can easily see which
binary code was generated for every source code line. In order for the panel to be able to do this, AQtrace
Viewer’s settings must specify path to binary modules and debug information in the Symbols Options dialog
and specify path to source files in the Source Code Options dialog.
To view only the source code (without assembler instructions), switch to the Code Viewer panel:
The panel shows the source file that contains the source code of the routine that is selected in the Call
Stack panel. When you double-click a routine in the Call Stack panel, AQtrace Viewer opens the appropriate
smartbear.com
AQtrace by SmartBear Software
Analyzing Error Reports With AQtrace Viewer
333
source file in the Code Viewer panel, scrolls to the source code of the selected routine and highlights the line
that contains a call to the upper routine (the number of this line is displayed in the Call Stack panel).
However, note that if you double-click the routine in the Call Stack panel, the Code Viewer panel will not
become active. You can also right-click the desired routine in the stack and select Go to Source Code from
the context menu, or select the routine and click the
Go to Source Code button on the panel’s toolbar. In
this case, the Code Viewer panel becomes active and displays the routine’s code, too.
To find the source file, Code Viewer uses the search paths specified in the Source Code Options dialog
or retrieves the appropriate version of the source file from a source control system by using a source server,
if you use such a server with AQtrace and the modules of your application were indexed for it (for more
information, see Source Server Support). Also, scrolling is performed only if the debug information contains
information about routine’s source lines. If the source file is not found or debug information does not contain
data about source lines, the Code Viewer panel will be empty. This happens typically for Delphi
applications, whose debug information was generated as .map files. These files do not contain information
about source code, so Code Viewer does not “know” which file to display.
If Code Viewer displays a source code file retrieved from a source control system by SmartBear Source
Server, you can compare the displayed version of the source code (that is, the version used for compilation of
the application build being analyzed) with the latest one stored in the source control system. To view
differences between the two file versions, right-click somewhere within Code Viewer and select Show
Difference from the context menu. For more information, see Comparing Versions of Source Code Files.
You can easily view information about the binary module that contains the routine selected in the Call
Stack panel. Right-click the desired routine in the stack and select Go to Module from the context menu, or
select the routine and click the
Go to Module button on the toolbar. AQtrace Viewer will switch to the
Modules panel that contains information about the binary modules of the application. The focus in the panel
will be set on the row that holds information about the module in which the selected routine is defined.
To view the memory data, use one or several Memory panels: Memory1, Memory2 and
Memory3.AQtrace Viewer also contains three toolbars -- Memory1, Memory2 and Memory3 -- that are
intended for working with the appropriate Memory panel. You can dock these toolbars either to the main
window of AQtrace Viewer, or to the appropriate Memory panel (see the image below).
To view the data stored at a certain address in memory, enter this address into the Address box of the
Memory toolbar and press Enter. You can either type the desired address or drag it from the Memory panels
or from the Disassembly panel. If you type the address in hexadecimal format, enter the 0x prefix before the
address:
© 2011 SmartBear Software
smartbear.com/support
334
AQtrace Viewer
AQtrace Reporter does not save all the memory used by the application to the reports. It saves only stack
data. AQtrace Viewer “restores” the memory contents by using the stack data and binary code of modules
mentioned in the report. So, specifying path to the binary code in the Symbols Options dialog is critical for
parsing and analyzing the reports.
AQtrace Viewer allows you to inspect values of various complex variables (objects and structures)
declared in the application. Using the Watch panel, you can view the values that had been assigned to
members of a certain object (or structure) in the application before the exception occurred. In this panel, you
can create a “watch” for the desired complex variable by specifying its data type and memory address at
which the variable was allocated:
Note that AQtrace Viewer needs definition of the specified data type to properly read a variable’s value
smartbear.com
AQtrace by SmartBear Software
Analyzing Error Reports With AQtrace Viewer
335
from the memory dump included in the error report. This definition is stored in debug information files,
therefore, your application should be compiled with debug information, and AQtrace Viewer should have
access to this information in order to read variable values. Also, AQtrace Reporter, as mentioned above, does
not save all the memory used by the application, so, the specified variable may be stored in a memory area
that was not included in the error report. In this case, the Watch panel cannot display the value of the
variable.
According to AQtrace Reporter’s settings, the Reporter can also capture the image of the application
window or of the whole desktop and include it in the error report. You can view the image in the Screenshot
panel:
Error reports may also contain additional information about the processes running in the operating
system, the OS version and service packs, memory and hard disk space (see Specifying Data to Be Included
in Reports). You can view this information in the Additional Information panel.
Besides information about the exception, for which the report was generated, the error report may also
contain information about exceptions that had occurred earlier during the application execution. These
exceptions are called last-raised exceptions (see About Last-Raised Exceptions). For these exceptions, the
reports contain the exception code, text, address and call stack data.
To view the last exceptions list saved to the report, use the Last Exceptions panel. This panel displays the
exception code, message, address and id of the thread, in which the exception occurred. To explore the call
stack for an exception, simply double-click it in the Last Exceptions panel. AQtrace Viewer will load the
exception’s call stack to the Call Stack panel. You can then continue the analysis with the Disassembly,
Code Viewer and other panels.
© 2011 SmartBear Software
smartbear.com/support
336
AQtrace Viewer
AQtrace Reporter can trace certain events that occur during the application run and log information
about these events. You can see various information logged for such events in the Event Log panel of
AQtrace Viewer when you analyse an error report:
For instance, from the log displayed in the panel you can see when various modules were loaded to and
unloaded from memory, when secondary threads were created, suspended and terminated, when exceptions
occurred, when the AQtrace Reporter’s functionality was locked and unlocked, and so on. For each event,
the log contains the UTC time of the event’s occurrence and the identifier of the thread in which the event
raised. Also, you can find various helpful information depending on event types. For more information, see
Event Log Panel.
smartbear.com
AQtrace by SmartBear Software
Specifying Path to Modules
337
Specifying Path to Modules
In order for AQtrace Viewer to be able to parse error reports, you should specify a path to the binary
modules and debug information files. This information is critical for the Viewer. Without it, it will be unable
to parse the call stack data saved to the report.
To view source code along with binary instructions in the Disassembly and Code Viewer panels, you also
need to specify the path to the source files. This topic explains how to specify the path to the binary modules,
debug information and source code.
Path to Binary Modules and Debug Information
You specify the path to the binary modules and debug information files in the Symbols Options dialog.
To invoke this dialog, select Options | Options from AQtrace Viewer’s main menu and in the ensuing
Options dialog choose the General | Symbols setting category:
As you can see, the dialog contains three setting groups: Module Storage, Modules Path and Symbols
Path. You can use all of these groups to specify the path to the binary modules and debug info files. AQtrace
Viewer uses all of these three groups to search for files, these settings work together and do not exclude each
other.
© 2011 SmartBear Software
smartbear.com/support
338
AQtrace Viewer
When specifying the search paths, keep in mind the following principles:
●
End-users can work with various versions (builds) of your application. For instance, some users
can work with version 2.0 while others still use the version 1.9. So, you may receive error reports
generated for different versions of your application.
To analyze error reports, you should be able to provide binary modules and debug information for
all application versions shipped to end-users. You do this by creating a build storage (see
Organizing Build Storage).
●
To search for a binary module, AQtrace Viewer uses the module’s name (file name + extension)
and the module’s version information mentioned in the report. The version information is
important because it lets the Viewer distinguish the modules used in the different builds of your
application.
●
AQtrace assumes that the debug information is either included into the binary module, or that the
debug information file resides in the same folder, in which the binary module is located (see
AQtrace Viewer - Retrieving Debug Information).
The Symbols Options dialog offers three ways to specify the search paths:
●
Module Storage
This setting specifies the name of the file that contains information about the module names,
versions and path to the module’s file in the build storage. When searching for a module, AQtrace
Viewer parses this file and retrieves information about the needed binary module.
You create this file with the AQtrace Module Store utility that resides in the <AQtrace>\Bin
folder. The setting should specify the fully-qualified name of this file.
Note that you should update the file every time you ship a new version to end-users. Otherwise,
the file will not contain information for the new versions of modules and the report analysis will
fail.
The file can be updated either manually or automatically. For information on updating the file
manually and on how to work with AQtrace Module Store, see the Using AQtrace Module Store
topic. For information on updating the file automatically, see the Using AQtrace Module Store
Agent topic.
●
Modules Path
The Modules Path box lists the folders, in which AQtrace Viewer will search for binary modules
and debug information files. You can see these folders as additional search paths to the paths
specified by the Module Storage file. For instance, you can use the Modules Path settings to enable
certain search paths which you do not normally use.
To add a path to the Modules path list, click Add and then specify the desired folder using the inplace editor. Confirm the input by pressing Enter. The Add button will remain disabled if the list
Modules Path contains at least one empty row.
Note that AQtrace Viewer will only search for the modules in the specified folders, subfolders will
not be included in the search. Also, the Viewer will use only those search paths that are checked in
the list.
●
Symbols Path
The Symbols Path box specifies the folders and URLs in which AQtrace Viewer will search for
binary modules and debug info files. If the Viewer found a file on a URL, it will download it to the
folder specified by the Cache symbols directory setting and will use the downloaded file copy for
parsing the reports.
In order for AQtrace Viewer to be able to use the search paths specified by the Symbols Path
smartbear.com
AQtrace by SmartBear Software
Panels
339
settings, the SymSrv.dll module must be installed on your computer. This DLL is part of the
Debugging Tools for Windows package. You can download it from Microsoft’s web site.
Typically, Symbols Path settings are used to specify the search paths for the operating system’s
modules and their debug info.
Note: AQtrace Viewer uses the search paths in the following order:
1. Module Storage setting
2. Symbols Path setting
3. Modules Path setting
Once the module with the specified name and version information is found, the search is stopped
and the found module is used.
Path to Source Code
You specify the search paths for source code files in the Source Code Options dialog. To invoke the
dialog, choose Options | Options from the main menu of AQtrace Viewer and in the ensuing Options dialog
choose the General | Source Code settings category:
In the dialog, click Add. This will append a new item to the list. Specify the desired folder using the
ensuing in-place editor. Confirm your change by pressing Enter. Note that you can specify only the topmost
folder and select the Include subdirectories check box. In this case, AQtrace Viewer will automatically
include subfolders of the specified folder into the search paths.
Besides the path to the source files of your application it is also recommended to specify the search paths
for the source files of the MFC, VCL or any other library that was used to create your application. By
providing this information, AQtrace Viewer will be able to display source code for the MFC, VCL and other
library routines.
Panels
© 2011 SmartBear Software
smartbear.com/support
340
AQtrace Viewer
Additional Information Panel
The Additional Information panel of AQtrace Viewer displays additional data included in the error
report by AQtrace Reporter (see Specifying Data to Be Included in Reports). If the panel is hidden, select
View | Select Panel from AQtrace Viewer’s main menu and then choose Additional Information in the
ensuing Select Panel dialog.
Data within the panel are organized into several categories. Each category is displayed on an individual
tab in the panel (see the image below). The categories are formed by AQtrace Reporter when it generates an
error report, the panel displays the report’s data.
The categories to be included in the report are specified by the AQtrace Reporter’s settings (see
Specifying Data to Be Included in Reports). These categories are listed below. The panel may also contain
custom categories of data that are included in error reports by your application and for which the panel
creates individual tabs (see Inserting Custom Data Into Reports). If a category is not included in the report,
its tab is hidden from the panel.
The following table describes the categories that are included by the AQtrace Reporter’s settings and
displayed on appropriate tabs in the Additional Information panel:
Category
Description
Common
Information
Contains general information about the exception:
smartbear.com
●
Exception code
●
Memory address, at which the exception occurred
●
Session start time in the UTC format (the time the application started on the
end-user computer, regardless of the local time settings of this computer)
●
Session duration (the time period elapsed since the application start to the
AQtrace by SmartBear Software
Panels
Category
341
Description
moment of report generation)
●
The exception’s number during application execution (this number helps you
determine whether other exceptions had occurred during the application run
before the given exception occurred)
●
Product name and version
Command line used to run the application
●
Operating
System
Memory
Contains information about the operating system, its components and CPU(s):
●
Operating system’s name
●
Service packs installed on the end-user’s computer
●
Operating system’s session identifier
●
Names of Windows, System32 and Temp folders
●
Information about .NET Framework versions installed on the end-user’s
computer
●
Information about CPU(s)
●
Name of the end-user’s computer
●
Information about the user account, under which the application was
executed
●
Information about keyboard layouts and languages installed on the enduser’s computer
Contains information about memory usage on the end-user’s computer:
●
Memory load
●
●
Information on swap file size and its usage
Information about the total and free physical memory
●
Information about virtual memory
●
Information on the size of the page file and its usage
●
The number of user objects used by the application before the exception
occurred
●
The number of GDI objects used by the application before the exception
occurred
●
The number of handles used by the application before the exception occurred
●
Information about the amount of physical and virtual memory occupied by
the application before the exception occurred
Hard Drives
Contains information about the hard drive(s) (logical drive letters, total and free space).
Processes
Lists the processes that were running in the operating system when the exception
occurred. The following information is displayed for each process:
●
ID of the process
●
The fully-qualified name of the process’s executable
© 2011 SmartBear Software
smartbear.com/support
342
AQtrace Viewer
Category
Description
●
Installed
Programs
Printers
Network
The name of the user who owns the process
Contains information about the programs and software updates installed on the enduser’s computer:
●
Program name
●
Software publisher
●
Version number
Contains information about the printing devices connected to the end-user’s computer:
●
The printer’s name and description
●
Port
●
●
Page size and orientation
Resolution (dots per inch)
●
Paper source and other settings
Contains information about the end-user computer’s address, domain, DNS servers and
other network settings and about network adapters installed on the computer.
Due to certain reasons, AQtrace Reporter cannot obtain this information on
the Windows NT operating system. So, the Network tab is not displayed in
the Additional Information panel if the report was generated by the Reporter
on Windows NT 4.0 with Service Pack 6 or later.
Services
Contains information about the services that were registered in the operating system
when an exception occurred:
●
Service name (the name that identifies the service).
●
Service type: file system driver, driver, and so on. For information on the
service type constants, see description of the QUERY_SERVICE_CONFIG
structure in the MSDN library.
Current state of the service (running, paused, stopped and so on).
●
Display
smartbear.com
●
Control codes that service accepts and processes. For information on the
service type constants, see description of the SERVICE_STATUS structure
in the MSDN library.
●
Start type (manual, auto, disabled and so on).
●
Error control (the action which is taken when the service fails to start). For
information on the service type constants, see description of the
QUERY_SERVICE_CONFIG structure in the MSDN library.
●
Fully-qualified name of the service’s executable module.
●
User account, under which the service is running.
●
Display name (the string that is displayed in the Services window of the
Control Panel).
Contains information about the monitor(s):
AQtrace by SmartBear Software
Panels
Category
Devices
343
Description
●
Name and description
●
Color resolution
●
Width and height (in pixels)
●
Display orientation
●
Frequency and other settings
Due to certain reasons, AQtrace Reporter cannot obtain this information on
the Windows NT operating system. So, the Display Devices tab is not
displayed in the Additional Information panel if the report was generated by
the Reporter on Windows NT 4.0 with Service Pack 6 or later.
Process
Privileges
Contains information about the security permissions of the user account, under which
your application was running.
For information about group flags, see the TOKEN_GROUPS structure description in
the MSDN library.
For information on constants that are used to specify privileges, see the Authorization
constants topic of the Platform SDK: Security section in the MSDN library.
If some custom binary files are included in the report, they are listed on the Binary Data tab that
becomes visible in the Additional Information panel (see the image below). You can see the name of each
included file and its size in bytes in the list on this tab. Also, to the left of each file name, there is a small
icon that corresponds to the type of the file (if this file type is registered in the system).
Most tabs in the Additional Information panel display data in a tabular form. All the tables on these tabs
allow filtering and auto-filtering the displayed data (for more information on this, see Filtering Data).
© 2011 SmartBear Software
smartbear.com/support
344
AQtrace Viewer
Custom textual data are displayed in a non-tabular form on the tabs created for such data.
To copy data
To copy data displayed in a non-tabular form on the Common Information, Operating System, Memory,
or Process Privileges tab or on a tab created for custom textual data in the Additional Information panel:
●
Select the desired data by dragging the mouse.
●
To select the whole text on the tab, choose Select All from the context menu.
Select Copy from the context menu.
To copy data from a table displayed on one of the Additional Information panel’s tabs (for instance, on
the Processes or Installed Programs tab):
●
Select the desired row in the table by left-clicking it.
To select several table rows, press and hold Ctrl and left-click the desired rows. To select all the
cells in the table, choose Select All from the context menu.
●
Select Copy from the context menu. Note that the whole row(s) will be copied.
To copy the contents of one cell, right-click the desired cell and select Copy cell under cursor
from the context menu.
To export data
To save textual data displayed in a non-tabular form on some tabs of the Additional Information panel
to an .xml file:
●
Right-click within the desired tab and select Save As from the context menu.
●
Specify the desired file name in the ensuing Save As dialog and click Save.
To save binary data of a report to any file:
●
On the Binary Data tab, right-click the desired file name and select Save As from the context
menu.
●
Specify the desired file name in the ensuing Save File As dialog and click Save.
To print data
You can print textual data displayed in a non-tabular form on some of the Additional Information panel’s
tabs.
●
Right-click within the desired tab and select Print from the context menu. This will invoke the
standard Print dialog.
●
In the dialog, specify the printer and various printing settings and then click Print.
To preview the data before printing, select Print Preview from the context menu.
To open a binary file
To open the desired file with the default application registered for the file’s type in the system:
●
On the Binary Data tab, right-click the desired file name and select Open from the context menu.
●
Also, you can just double-click the desired file name.
If you want to open the file with another application or if there is no default application for its type:
●
On the Binary Data tab, right-click the desired file name and select Open With from the context
menu.
smartbear.com
AQtrace by SmartBear Software
Panels
●
345
Choose the desired program in the ensuing Open With dialog and click OK.
Call Stack Panel
The Call Stack panel of AQtrace Viewer displays information about the sequence of function calls for
the thread that is selected in the Threads panel. If the panel is hidden, select View | Select Panel from
AQtrace Viewer’s main menu and then choose Call Stack in the ensuing Select Panel dialog.
Each row in the panel corresponds to a function call. The topmost row corresponds to the function in
which the exception occurred. Other rows indicate the stack of function calls that led to the call of the
topmost function.
AQtrace uses special algorithms to parse the call stack data and determine the sequence of function calls.
These algorithms analyze the stack data, function addresses in memory and other information. Nevertheless,
the resultant call sequence may miss some calls. This happens due to certain specifics of functions’ binary
code. In general, AQtrace is unaware of these specifics and can miss some calls when parsing the stack.
You may command AQtrace Viewer to determine these routines by checking the Show Dirty Stack item
from the context menu of the Call Stack panel. If this menu item is selected, AQtrace Viewer treats any
address on the stack as a function call address and adds the appropriate items to the calls stack.
In order for AQtrace Viewer to be able to parse error reports, you must specify the location of
binary modules and debug information files for the Viewer. Without this information, the Viewer
will be unable to parse the call stack data and the Call Stack panel will contain only the top-most
routine. For more information on how to specify the location, see Specifying Path to Modules.
Information about each function call has the following format:
module_name ! address routine_name([param_type param_name = param_value,
…]) Offset:offset Line:source_line_info
Currently, AQtrace Viewer cannot obtain information about routine parameters while parsing .NET
(managed) call stack data. So, parameters of .NET functions are not displayed in the panel.
For instance:
SampleApp.exe!0x004033FB SampleExcepts.obj::CreateAccessViolation(void*
arg0 = 0x00000000) Offset: 0x3B Line: 15
SampleApp.exe!0x0040F3C2 afxstate.obj::AfxGetModuleThreadState() Offset:
0xF Line: 465
SampleApp.exe!0x00405C84 winocc.obj::CWnd::IsDialogMessageW(tagMSG* arg0
= 0x001771D0) Offset: 0x2E Line: 197
SampleApp.exe!0x00407516 wincore.obj::CWnd::PreTranslateInput(tagMSG*
arg0 = 0x001771D0) Offset: 0x29 Line: 426
SampleApp.exe!0x0040891E wincore.obj::CWnd::RunModalLoop(unsigned long
arg0 = 0x00000004) Offset: 0xCA Line: 42
●
module_name - Specifies the file name and extension of the module that contains the function’s
code.
●
address - Specifies the address to which the application will return the execution flow after the
function call is over. For the topmost function this address specifies the address at which the
© 2011 SmartBear Software
smartbear.com/support
346
AQtrace Viewer
exception occurred.
●
routine_name - The function’s name. If the Show Full Routine Names item of the context menu
is checked, the panel displays the unit name along with the routine name.
Note that the panel displays the routine and unit names only if the Viewer has found and loaded
debug information for the module (see Specifying Path to Modules).
●
param_type - Specifies the routine parameter’s type. Note that the panel displays parameter types
only if the Viewer has found and loaded debug information for the module. Currently, parameter
types cannot be displayed for .NET routines.
●
param_name - Displays the parameter’s name. All function parameters displayed in the panel
have the following name format: argN, where N specifies the number of the parameter among
other parameters of the function (for instance, arg0, arg1, etc.). Note that currently, parameter
names cannot be displayed for .NET routines.
●
param_value - Specifies the value of the function’s parameter that has been passed to the called
routine.
By default, a parameter’s value is shown as a hexadecimal value. To view it in the decimal format,
right-click somewhere within the panel and uncheck Hexadecimal Display in the context menu.
Note that the values of pointer type parameters are always shown in the hexadecimal format.
The panel displays parameter values only if the Viewer has found and loaded debug information
for the module. Note that currently, parameter values cannot be displayed for .NET routines.
●
offset - Specifies the offset of the address from the beginning of the caller routine.
●
source_line_info - Displays the number of the source line that contains a call to the upper routine.
For the topmost function, this value is the number of the source line at which the exception
occurred.
Note that the panel displays the source line number only if the Viewer has found and loaded debug
information for the module and if the path to the module is specified.
Note: If a function has more than one parameter, they are enclosed in parenthesis and are listed after
the function’s name. Functions may also have no parameters. In this case, there are empty
parenthesis after the routine’s name.
To hide or display parts of the call information
To hide or show some parts of the function call information, use the panel’s context menu. For instance,
by checking or unchecking the Show Byte Offset item you can show or hide the address part; by using the
Show Routine Parameter Values item, you can show or hide the values of the parameters passed to
routines, and so on.
To view a function’s binary code
●
●
Select the desired function in the call stack.
Click the
-- or --
Go to Disassembly button on the panel’s toolbar.
●
Right-click the desired function in the call stack.
●
Select Go to Disassembly from the context menu.
The Viewer will display the function’s binary code in the Disassembly panel and set the focus on it.
smartbear.com
AQtrace by SmartBear Software
Panels
347
You can also double-click the desired function in the call stack, or select it and press Enter. In this case,
the Disassembly panel will contain the binary code of the selected function, but the focus will not be set on it
and the panel will not become active.
To view a function’s source code
●
●
Select the desired function in the call stack.
Click the
-- or --
Go to Source Code button on the panel’s toolbar.
●
Right-click the desired function in the call stack.
●
Select Go to Source Code from the context menu.
The Viewer will display the function’s source code in the Code Viewer panel and set the focus on it.
Note that the source code can be displayed in the panel only if you specified the path to the source files in the
Viewer’s options (see Specifying Path to Modules) or if you use a source server to get the source code files
from a source control system (see Source Server Support).
You can also double-click the desired function in the call stack, or select it and press Enter. In this case,
the Code Viewer panel will contain the source code of the selected function, but the focus will not be set on
it and the panel will not become active.
To view information about modules
●
Select the desired function in the call stack.
●
Click the
Go to Module button on the panel’s toolbar.
-- or -● Right-click the desired function in the call stack.
●
Select Go to Module from the context menu.
The Viewer will set the focus on the Modules panel's row that contains information about the module in
which the selected function is implemented.
You can also double-click the desired function in the call stack, or select it and press Enter. In this case,
the focus will be set on the appropriate row of the Modules panel, but the panel will not become active.
To copy data
To copy data displayed in the Call Stack panel:
●
Select the desired rows in the call stack (You can use Ctrl- and Shift- for multi-selection. To select
the whole data, choose Select All from the context menu.)
●
Choose Copy from the context menu.
Code Viewer Panel
The Code Viewer panel of AQtrace Viewer displays the source code of modules that is included into the
analyzed error report. If the Code Viewer panel is hidden, select View | Select Panel from AQtrace Viewer’s
main menu and then choose Code Viewer in the ensuing Select Panel dialog.
The Code Viewer panel shows the source file that contains the routine that is selected in the Call Stack
panel (see Analyzing Error Reports With AQtrace Viewer). The file name is shown at the top of the panel.
© 2011 SmartBear Software
smartbear.com/support
348
AQtrace Viewer
Features and Advantages of Code Viewer
The source code of application modules can change from one build to another, and users may purchase
versions of the application whose source code was different during compilation. When developers receive an
error report generated by the application and start analyzing this report, it is very important to take a look at
the source code that was used during compilation of the application version that generated the report. In this
case, the developers may face a problem, because it is not easy to determine the version of the source code of
certain modules. The Code Viewer panel can solve this problem. It displays the exact source code of the
routine selected in the Call Stack panel by using source servers. They can retrieve the exact version of the
source code from a source control system. That is, the source code file used to compile the module can be
displayed in the Code Viewer panel and this can be very useful when analyzing error reports. Currently,
AQtrace Viewer supports Microsoft Source Server and SmartBear Source Server. For more information on
this, see Source Server Support.
Furthermore, the Code Viewer panel can display source code by using local copies of source files
without referring to source servers and source control systems. However, in this case, another version of the
source code that was used for another build may be displayed in the Code Viewer panel, which may confuse
you.
You can also select the source code file to be opened and displayed in the Code Viewer panel. This can
be useful when you want to look into some source file that was used during application compiling, but its
routines are not displayed in the Call Stack panel (for instance, some header file included in the application).
By using SmartBear Source Server with AQtrace Viewer, you can compare the version of the source
code of certain application build with the actual version of the source code, that is with the latest version of
the source code stored in your source control system. You can view the difference in the source files and
analyze the changes. For more information on this, see Comparing Versions of Source Code Files.
Requirements for Displaying Source Code
The Code Viewer panel may be unable to display source code. This happens when one or more of the
following conditions are not met. In order for the panel to be able to display a source file using SmartBear
Source Server, all of these conditions should be met:
●
The module that contains the routine must be compiled with debug information (see Compiling
Applications With Debug Information) and AQtrace Viewer’s settings must specify the path to
debug info files, that is, AQtrace Viewer should be able to find debug info files (see Specifying
Path to Modules).
●
The debug information must contain information about source code lines.
●
The modules of the application must be source indexed and the corresponding aqIndex.aqiss index
file must be located in the folder where the modules of the application’s build reside (see Source
Indexing for SmartBear Source Server).
In order to display the source code in the panel using Microsoft Source Server, the following conditions
should be met:
●
The module that contains the routine selected in the Call Stack panel must be compiled with debug
information and AQtrace Viewer’s settings must specify the path to debug info files.
●
The debug information must contain information about source code lines.
●
The application's debug information files (.PDB) must be source indexed (see Source Indexing for
Microsoft Source Server).
In order for the panel to be able to display a source file located on the local drive, all of these conditions
should be met:
●
You should specify the source file location in the Source Code Options dialog.
smartbear.com
AQtrace by SmartBear Software
Panels
349
●
The module that contains the routine must be compiled with debug information and AQtrace
Viewer’s settings specify the path to debug info files, that is, AQtrace Viewer should be able to
find debug info files (see Specifying Path to Modules).
●
The debug information must contain information about source code lines.
If these conditions are not met, the panel is empty. This typically happens for Delphi applications, whose
debug information was generated as .map files. These files do not contain information about source code, so
Code Viewer does not “know” what file to display.
Note that besides your routines, the call stack may also contain functions of the program libraries, which
were used to create your application. For instance, the call stack generated for a Visual C++ or Delphi
application typically contains the calls to methods of MFC or VCL classes. To view code of the MFC and
VCL routines, you should specify the path to MFC (or VCL) source in the Source Code Options dialog. If
this dialog does not contain a path to the MFC (or VCL) source, the Code Viewer panel does not display
source files for MFC classes (or VCL classes, or classes of any other library that was used to create your
application).
Working with Code Viewer
To view or set search paths
●
Right-click somewhere within the Code Viewer panel and select Set Source Code Paths from the
context menu. This will invoke the Source Code Options dialog.
●
Use the dialog to view the search paths and to modify them. For more information about this, see
the dialog description.
To modify panel’s settings
The Code Viewer panel has a number of settings that define various aspects of the panel’s behavior. To
view or modify these settings, right-click somewhere within the panel, select Panel Options from the
context menu and use the ensuing Options dialog. For more information about the panel's settings, see Code
Viewer - Settings.
To search for text in the panel
●
Select Edit | Find from the main menu of AQtrace Viewer. This will invoke the Find dialog.
●
In the Find what box of the dialog, enter the text to be sought for.
●
Use other edit boxes and check boxes to specify the search conditions (for instance, you may
specify that you will use regular expressions or wildcards. See the description of the Find dialog).
●
Press Find to initiate the search. If the search engine will find the specified text, it will highlight it
in the Code Viewer panel.
●
To continue the search, select Find Next in the Find dialog, or choose Edit | Find Next from the
main menu of AQtrace Viewer, or press F3.
To find all of the occurrences for the desired text, press Find All in the Find dialog. AQtrace Viewer will
mark the found occurrences in the panel.
To open a source file and display it in the panel
●
Right-click somewhere within the Code Viewer panel and select Open File from the context
menu.
●
In the ensuing Open File dialog, select the source file that you want to be displayed and press
© 2011 SmartBear Software
smartbear.com/support
350
AQtrace Viewer
Open.
Displaying the difference in source code versions
This feature applies only to the source code that was retrieved from a source control system by using
SmartBear Source Server. AQtrace Viewer allows displaying the difference between the latest version of the
source code stored in your source control system and the version of the code that was used to compile the
build being analyzed. To compare the two versions of a source code file and display the difference between
them, AQtrace Viewer uses a third-party file comparison tool, which you specify in the Comparison tools
setting group on the Panels | Code Viewer | General page of AQtrace Viewer’s Options dialog. To display
the difference between two versions of the source code, do the following:
●
Right-click somewhere within the Code Viewer panel and select Show Difference from the
context menu. AQtrace Viewer will launch the selected third-party comparison tool and command
it to compare the two versions of the source code and display the difference between them.
To compare source files and display differences, you must specify the path to the needed comparison
tool’s executable file and its command-line arguments. See Code Viewer - General Settings for more
information on this.
Disassembly Panel
The Disassembly panel of the AQtrace Viewer displays binary and source code of modules included in
the application whose error report is being analyzed in the Viewer. If the Disassembly panel is hidden, select
View | Select Panel from AQtrace Viewer’s main menu and then choose Disassembly in the ensuing Select
Panel dialog.
The Disassembly panel shows the code of the routine selected in the Call Stack panel (see Analyzing
Error Reports With AQtrace Viewer).
In order for the Disassembly panel to be able to display the application’s code, it must have access
to the binary code of the modules included in the report. For information on how to specify the path
to the binary code, see AQtrace Viewer - Specifying Path to Modules.
Below is a sample view of the Disassembly panel:
smartbear.com
AQtrace by SmartBear Software
Panels
351
For each assembler instruction in native (unmanaged) modules, the panel displays the following
information:
●
The instruction’s starting address in memory.
●
The instruction’s data (code bytes) in memory (in hexadecimal format).
The assembler mnemonics for the instruction.
●
For each instruction in .NET assemblies, the panel displays the following information:
●
The instruction’s offset from the beginning of the routine’s code.
●
The instruction’s data (code bytes) in memory (in hexadecimal format).
The IL (intermediate language) instruction.
●
Using the Show Address and Show Code Bytes items of the panel’s context menu you can hide or show
instructions’ starting addresses and binary data. Assembler mnemonics or IL instructions cannot be hidden.
The number of code bytes displayed in a single line in the panel is specified by the Code bytes in line setting
in the Disassembly Options dialog.
Using the Show RVA item of the panel’s context menu, you can show or hide relative virtual addresses
(RVA) of assembler instructions in native (unmanaged) modules. The relative virtual address of an
instruction is equal to the instruction’s offset relative to the base address of the module in which the
instruction is located (that is, relative to the address where the module is loaded in memory). The full address
of each assembler instruction (this address is shown in the panel if the Show Address context menu item is
selected) is equal to the sum of the module’s base address and the instruction’s RVA. By default, the
Disassembly panel does not show RVAs of assembler instructions. To display them, you need to select the
Show RVA context menu item.
Note: The panel can show only RVAs of assembler instructions in native (unmanaged) modules. For
.NET assemblies, such addresses are not shown regardless of the state of the Show RVA context
menu item. Also, the panel does not show RVA values for those memory areas that do not
contain instructions from a module.
If the Viewer’s Source Code Options specify the path to source files of your modules, then the
Disassembly panel also shows source code lines (they are interlaced with assembler instructions). This
feature requires that the modules are compiled with debug information and the Viewer’s settings specify the
path to debug info files (see AQtrace Viewer - Specifying Path to Modules).
© 2011 SmartBear Software
smartbear.com/support
352
AQtrace Viewer
Besides the path to the source files of your application, it is also recommended that you specify the paths
to the source files of MFC, VCL or any other library that was used to create your applicaiton. If this
information is provided, the Disassembly panel is able to display the source code of MFC routines (or VCL
routines, or routines of other libraries).
Using the Show Source Code and Show Line Numbers items of the context menu you can hide or
show the source code or source line numbers.
The Disassembly panel uses specific markers to provide information about the code. For instance, these
markers indicate the beginning of a source file, or the code areas that, according to debug information, do not
belong to any routine (the no routine markers).You can hide or show these markers by using the Show
Bounds item of the context menu.
To view assembler code that resides at a certain address, enter this address into the Address box of the
Disassembly toolbar and press Enter. If you specify the address in the hexadecimal format, use the 0x prefix.
Note that you can either type the address, or drag it to the Address box from the Disassembly panel or from
one of the Memory panels. The dragged values are always treated as hexadecimal.
Besides, you can easily switch to the code that resides at a certain address if you right-click the address
value shown somewhere within the Disassembly panel and select Follow from the context menu. Also, you
can right-click the name of a CPU register with the needed address value or select an expression with the
CPU register name(s) somewhere within the assembler instructions in the panel and use the Follow context
menu command. The panel switches then to the address stored in the CPU register or obtained as a result of
evaluation of the selected expression (if any).
For each jump or call command in the binary code, the Disassembly panel shows a hyperlink that allows
you to go to the destination address in the code upon clicking this hyperlink. Such hyperlinks are shown in
parentheses next to the appropriate assembler mnemonics. The text of such a hyperlink is underlined and
contains the hexadecimal value of the destination address. Also, for call commands, the panel can show the
name of the called routine. Such a name is shown next to the hyperlink if the debug information containing
symbols with this name is available for AQtrace Viewer.
In addition to the Address box, the Disassembly toolbar contains the Show Hints button. If this button is
pressed, the Disassembly panel shows a hint with a value set to a certain CPU register when you hover the
mouse pointer over the name of this register somewhere within the assembler code shown in the panel. Also,
hints are shown in the Disassembly panel when you hover the mouse pointer over various numeric values
displayed in the panel (for instance, over code bytes, starting addresses of assembler instructions or over
some numeric values used in the code). However, for such numeric values, the hints just show the same
hexadecimal numeric values as those over which you hover the mouse pointer. By default, the panel does not
show any hints until you press the Show Hints button.
To copy data displayed in the panel to the clipboard, select the desired data by dragging the mouse and
then choose Copy from the context menu.
Event Log Panel
The Event Log panel of AQtrace Viewer displays information on events that occurred within the
application monitored by AQtrace Reporter before generating the error report. In this panel you can see
various information that can be helpful for analyzing an error report and for searching the reason of a bug.
For instance, from the log you can find out when various modules were loaded to and unloaded from
memory by the application, when secondary threads were created, suspended and terminated, when
exceptions occurred, when the AQtrace Reporter’s functionality was locked and unlocked, and so on. Also,
various helpful details are displayed in the panel for each of the supported event types.
If the panel is hidden, select View | Select Panel from AQtrace Viewer’s main menu and then choose
smartbear.com
AQtrace by SmartBear Software
Panels
353
Event Log in the ensuing Select Panel dialog.
Here is a sample view of the panel:
For each event the panel displays information in the following three columns:
Column
Description
Event
The event’s description (the event’s type, indicated by an appropriate icon and text
message, and some specific details on the event).
Thread ID The identifier of the thread in which the event occurred.
Time
The time of the event’s occurrence. The time is represented in the hh:mm:ss:ms format.
Note that AQtrace Reporter collects time values as UTC time, regardless of the local time
settings of the end-user computer where events occur.
To search for text in the panel, either select Find and Find Next from the Edit menu or use the Ctrl+F
shortcut (this will invoke the Find dialog that is used for searching). To switch quickly to the desired text in
the Event column, you can also simply start typing the text and the focus will be automatically set then to the
first record started with the typed text and displayed below the current cursor position.
To browse through events of the same type, you can select one event of the desired type and use then the
Go to Previous Event and
Go to Next Event buttons on the Event Log toolbar.
© 2011 SmartBear Software
smartbear.com/support
354
AQtrace Viewer
To copy information on the selected events to the clipboard, select Copy from the panel’s context menu
or from the Edit menu.
To export information selected in the panel to an .html, .xml or .txt file, select Save Selection from the
context menu. To export the whole event log, select
Save from the context menu. Note that when the
event log is exported to an .xml file, AQtrace Viewer creates also an .xsl file that defines how this
information in the .xml file should be transformed to display it in a more convenient form.
As the events monitored by AQtrace Reporter occur very frequently, the Event Log panel contains
usually a lot of information. To hide temporarily unnecessary information, you can filter it by choosing types
of events for which you want to see information. Select
Filter Panel from the panel’s context menu or
click the appropriate button on the Event Log toolbar. The Filter panel at the bottom of the Event Log panel
will be displayed then (see the image above). Click the Customize button to invoke the Message Filter
dialog in which you can specify event types to be displayed in the panel. The filter’s value is displayed to the
right of the check box in the Filter panel. The filter is active only if this check box is selected. If you want to
disable temporarily the filter, clear the check box.
In addition, you can filter events in the Event Log panel by the thread in which they were raised. For this
purpose, simply select the desired thread identifier in the Thread combo box that is displayed on the left of
the Filter panel. If the All Threads value is selected in this combo box, Event Log will display events for all
threads.
The supported types of events monitored by AQtrace Reporter and displayed in the Event Log table are
listed in the table below.
Event
aqReporter locked for all threads
Description
Logs locking of the AQtrace Reporter’s functionality for all
threads in the monitored application. Locking of AQtrace
Reporter
is
carried
out
by
calling
the
IaqReporterIntf.GlobalLock method. For more
information, see Enabling and Disabling AQtrace Reporter.
aqReporter unlocked for all threads Logs unlocking of the AQtrace Reporter’s functionality
when it is disabled for all threads in the monitored
application. Unlocking of AQtrace Reporter is carried out by
calling
the
IaqReporterIntf.GlobalUnlock
method. For more information, see Enabling and Disabling
AQtrace Reporter.
aqReporter locked for thread
Logs locking of the AQtrace Reporter’s functionality for
one thread in the monitored application. For such events, the
Event Log panel displays the identifier of the thread for
which the Reporter’s functionality has been locked. To
disable AQtrace Reporter for the current thread (for
instance, to execute some code that is not needed to be
monitored
by
AQtrace
Reporter),
the
IaqReporterIntf.Lock method is called. For more
information, see Enabling and Disabling AQtrace Reporter.
aqReporter unlocked for thread
Logs unlocking of the AQtrace Reporter’s functionality
when it is disabled for one thread in the monitored
application. For such events, the Event Log panel displays
smartbear.com
AQtrace by SmartBear Software
Panels
355
Event
Description
the identifier of the thread for which the Reporter’s
functionality has been unlocked. To enable AQtrace
Reporter
for
the
current
thread,
the
IaqReporterIntf.Unlock method is called. For more
information, see Enabling and Disabling AQtrace Reporter.
Debug string
Logs creation of a user-defined debug string by calling the
OutputDebugString Windows API function. The
debug string, passed through the function’s parameter, is
included into the error report and displayed then in the
Event Log panel as the Debug string event. Such debug
strings contain information that can be useful for analyzing
error reports. For more information on user-defined debug
messages, see Including Debug Messages Into Error
Reports.
Exception
Logs exceptions raised in the monitored application. For
each exception, the panel displays the exception code, the
name of the module and memory address, at which the
exception occurred.
You can also see information on exceptions, raised in the
application before generating the error report, in the Last
Exceptions panel. But this panel displays information only
for the certain number of last-raised exceptions, while the
Event Log panel contains information about all the
exceptions occurred during the application run before
generating the report. Note that information about the very
last exception, caused the application’s failure and
generating of the report, is not displayed neither in the Event
Log panel, nor in the Last Exceptions panel.
Module loaded
Logs the loading of a module (dll, external executable, etc.)
by the main application. For such an event the Event Log
panel displays the module’s name and path, the version of
the module, the base address in memory at which the
module was loaded and the size of the module (in bytes).
Module unloaded
Logs the release of a module by the main application. The
panel displays the name and path of the module and the base
address at which the module was loaded.
Thread created
Logs creation of a secondary thread in the monitored
application. The thread’s identifier, state (whether the thread
was suspended on creation or not) and address of the
thread’s stack top are displayed in the Event Log panel for
such an event.
Thread exit
Logs the normal closing of a secondary thread in the
monitored application and gives the thread’s identifier and
© 2011 SmartBear Software
smartbear.com/support
356
AQtrace Viewer
Event
Description
exit code.
Thread resumed
Logs resuming of a secondary thread that has been
suspended. The identifier of this thread is displayed in the
Event Log panel.
Thread suspended
Logs suspending of a secondary thread. The identifier of this
thread is displayed in the Event Log panel.
Thread terminated
Logs a forced termination of a secondary thread in the
monitored application and gives the thread’s identifier and
exit code.
User message
Logs
a
message
defined
by
calling
the
IaqReporterIntf2.AddMessageToLog
method
provided by AQtrace Reporter. For more information on
user-defined messages added to the event log, see Including
Debug Messages Into Error Reports.
Last Exceptions Panel
The Last Exceptions panel of AQtrace Viewer displays information about the exceptions that had
occurred before the exception for which the error report was generated. These exceptions are called lastraised exceptions. The AQtrace Reporter collects information for these exceptions, since exceptions that
occurred earlier may cause the exception, for which the report was generated (for more information, see
About Last-Raised Exceptions).
Also, the panel can display user-defined debug messages that were generated by the application with the
use of the OutputDebugString function, and highlight them with the desired color.
If the panel is hidden, select View | Select Panel from AQtrace Viewer’s main menu and then choose
Last Exceptions in the ensuing Select Panel dialog.
The panel uses the following columns to display information about exceptions:
smartbear.com
AQtrace by SmartBear Software
Panels
357
Column
Description
Address
Specifies the address, at which the exception occurred.
Code
Specifies the exception’s code.
Thread Id
The identifier of the thread, in which the exception occurred.
Message
The exception’s text.
Date & Time
Specifies the date and time when the exception occurred. Note that AQtrace Reporter
collects date and time values in the UTC format, regardless of the local time settings of
the end-user computer.
To explore the sequence of function calls that led to the exception, double-click the desired exception in
the panel. AQtrace Viewer displays the sequence of function calls in the Call Stack panel. You can then
choose the desired routine there and go to the Disassembly panel to view its code.
The currently analyzed exception is marked with the icon in the list.
Memory Panel
AQtrace Viewer includes three panels that display memory data. They are called Memory1, Memory2
and Memory3. You use this panel to explore the memory contents when an exception occurred.
To display the memory panels, choose View | Select Panel from the main menu of the AQtrace Viewer
and then choose the desired panel in the ensuing Select Panel dialog. Here is a sample view of the panel:
As you can see, the Memory panel displays memory addresses on the left. To the right of the addresses,
the panel displays the corresponding memory contents as numbers and text.
© 2011 SmartBear Software
smartbear.com/support
358
AQtrace Viewer
Note: An error report does not contain all the memory data from the process address space. It contains
only memory data that corresponds to the call stack data. AQtrace Viewer restores the memory
data by using this stack data and the binary code of modules mentioned in the report. It obtains
the binary code of these modules from the build storage (see Organizing Build Storage and
Specifying Path to Modules).
If the Viewer is unable to restore memory data at some addresses, it displays question marks
(??) and dots instead of displaying memory contents as numbers and text, respectively, in the
Memory panel.
AQtrace Viewer also has the Memory1, Memory2 and Memory3 toolbars that let you control the data
displayed in the appropriate panels. You can dock these toolbars to the toolbar area of AQtrace Viewer’s
main window, or you can dock these toolbars within the Memory panels. For instance, on the picture above
the Memory1 toolbar is docked to the top edge of the Memory1 panel.
The toolbars contain the following items:
●
The Address box (by default, it is the first item) specifies the start address from which the panel
displays memory data.
In this box, you can specify the needed address as a hexadecimal number starting with the 0x
prefix or as an expression that returns an address value. Such expressions can contain, for instance,
CPU register names or symbol names obtained from the application’s debug information:
ebp + 0x09
eax + esi - 0x02
GetDesktopName+0x1b
When calculating such expressions with CPU register names, AQtrace Viewer uses values that
were set for the corresponding registers at the moment when the procedure currently selected in the
Call Stack panel was called (you can view these register values in the Registers panel).
You can either type the needed address value or drag it from the Memory1, Memory2, Memory3
or Disassembly panels. The dragged values are often treated as hexadecimal values.
●
The
Reevaluate Automatically button allows updating the contents of the Memory panel
automatically when an expression with a CPU register name is specified in the Address box. Since
the values stored in CPU registers change upon calling different routines in the application, the
address values returned by such expressions with CPU register names can also change when you
select different routine calls in the Call Stack panel. Therefore, if the Reevaluate Automatically
button is pressed, the start address from which the Memory panel displays memory data is
automatically reevaluated and the contents of the panel is updated when you select different
routine calls in the Call Stack panel. Otherwise, if you do not press the button, address values are
not reevaluated and the contents of the panel are not automatically updated when you go through
the sequence of routine calls in the Call Stack panel. By default, address reevaluation is disabled.
To enable it, you need to press the Reevaluate Automatically button.
●
The Columns box (by default, it is the third item on the Memory toolbar) specifies the number of
columns in which the contents of memory data is organized when it is displayed as numbers in the
panel.
You can control the data representation format using the items of the panel’s context menu:
●
1-byte, 2-byte, 4-byte, 8-byte Integer - If one of these items is selected, the memory contents is
displayed as a sequence of integer values that occupy 1, 2, 4 or 8 bytes in memory.
●
32-byte and 64-byte Floating Point - If one of these items is selected, the memory contents is
smartbear.com
AQtrace by SmartBear Software
Panels
359
displayed as a sequence of 32- or 64-byte floating-point values.
●
Hexadecimal, Signed and Unsigned Display - If one of these items is selected, the data is shown
as hexadecimal numbers, or as decimal signed or unsigned numbers.
●
Big Endian - Specifies whether the data should be displayed as big endian values. The big endian
format means the higher byte of a machine word precedes the lower byte in memory. This is the
opposite of the little endian format that is used by Intel processors and that means the lower byte
precedes the higher byte.
●
No data - Specifies whether the panel displays memory data as numbers. If this menu item is
selected, the Memory panel displays memory data as text only.
The context menu also contains the ANSI Text and Unicode Text items that specify the format of the
text representing the memory contents on the right side of the panel. The No Text menu item specifies
whether the text is visible or not.
To copy memory data from the panel, drag the mouse pointer to mark the desired values, right-click
somewhere in the panel and then select Copy from the context menu.
Modules Panel
The Modules panel of the AQtrace Viewer displays information on modules that had been loaded by
your application when an exception occurred. If the panel is hidden, select View | Select Panel from
AQtrace Viewer’s main menu and then choose Modules in the ensuing Select Panel dialog.
For each module, the panel displays the following information:
Column
Description
Address
Specifies the range of addresses that the module occupied in memory.
Name
The file name and extension of the module.
Order
The order of module loading.
© 2011 SmartBear Software
smartbear.com/support
360
AQtrace Viewer
Column
Description
Path in Report
The fully-qualified name of the module on the end-user’s computer.
Path in Storage
The fully-qualified name of the module on the hard drive (that is, the path to the
module’s binary code, which AQtrace Viewer loaded to analyze the error report). If
AQtrace Viewer cannot find the module in the paths specified by the Symbols
Options dialog, the column is empty.
Symbol Status
Specifies whether AQtrace Viewer found and loaded debug information for the
module. The cells of this column may have one of three possible states:
●
Loaded - The debug symbols for the module were found and retrieved.
●
No symbols found - The debug symbols cannot be found.
●
Symbols were not loaded - The debug symbols were not loaded, though
the module’s debug information might be available.
See AQtrace Viewer - Retrieving Debug Information for details.
Timestamp
Specifies the date and time of the module’s creation.
Version
The version number of the module. This information is used to identify the module
in the build storage.
Output Panel
The Output panel of AQtrace Viewer displays the following information:
● Brief description of the exception, for which the error report was generated.
Note: If the report was generated on demand, (that is, by using the
ShowFatalErrorWithMessage method of AQtrace Reporter), then the panel
informs that the report file does not contain information about the exception.
●
Information (if any) that the end-user specified in the User Info dialog when sending the error
report.
●
Various additional data. For instance, if you open the .dmp file that was generated by some other
tool rather than AQtrace Reporter, the panel will contain the information, which AQtrace Viewer
is unable to display in other panels.
If the panel is hidden, select View | Select Panel from AQtrace Viewer’s main menu and then choose
Output in the ensuing Select Panel dialog.
To copy the data displayed in the panel:
●
Select the desired data by dragging the mouse.
To select the whole text in the panel, choose Select All from the context menu.
●
Select Copy from the context menu.
smartbear.com
AQtrace by SmartBear Software
Panels
361
Registers Panel
The Registers panel of AQtrace Viewer displays information on CPU registers’ values for the function
call that is selected in the Call Stack panel. If the panel is hidden, select View | Select Panel from AQtrace
Viewer’s main menu and then choose Registers in the ensuing Select Panel dialog.
The Registers panel displays the values of CPU registers only for calls to native (unmanaged) code
functions. If a .NET (managed) function call is selected in the Call Stack panel, no information is
displayed in the Registers panel.
The registers may contain integer and floating-point values. The panel displays integer values as
hexadecimal numbers, and floating-point values as a value in scientific format, for instance, ±1.2345×10⁻⁹.
The panel organizes the registers into the following groups:
Item
Description
CPU (default)
Standard CPU registers like EAX, EBX, ESP, EBP and others.
CPU segments The DS, ES, FS, GS, CS and SS registers.
Floating Point FPU registers (ST0 - ST7, CTRL, STAT and others).
MMX
Registers supported by processors that implement MMX instructions.
SSE
Registers supported by processors that implement the SSE instructions.
SSE2
Registers supported by processors that implement the SSE2 technology.
Flags
Values of the Flag register.
By default, the panel displays registers of the CPU group only. To view information on other registers,
right-click somewhere within the panel and select the appropriate group from the context menu.
To copy a register value, select it in the panel and then choose Copy from the context menu. You can
then paste this value into other panels. For instance, if a register contains a memory address, you can copy it
and then paste the copied value to the Address box on the Memory panel’s toolbar to view the data stored by
that address.
Screenshot Panel
The Screenshot panel of AQtrace Viewer displays an image of the application’s window. If the panel is
hidden, select View | Select Panel from AQtrace Viewer’s main menu and then choose Screenshot in the
ensuing Select Panel dialog.
© 2011 SmartBear Software
smartbear.com/support
362
AQtrace Viewer
On the status bar of the window, the X and Y sections indicate the current mouse coordinates relative to
the picture, 0,0 at top left. Also, the status bar displays the width and height and the current display scale (in
percent) of the picture.
All controls are grouped on the toolbar that is displayed by default at the top of the panel:
●
When the
Scroll Mode button is pressed, you can scroll the viewing area using the arrow
buttons, the mouse scroll button or by dragging with the mouse inside this area.
●
When the
Select Mode button is pressed, you can select any rectangular region in the picture
area by dragging with the mouse inside this area.
●
The
Copy button allows you to copy the selected rectangular region in the picture (see above)
or the whole picture, if no region is currently selected, to the clipboard.
●
The
●
In order to zoom the picture in or out (increase or decrease the display scale), you can use the
Zoom slider on the panel’s toolbar. Pressing the + or - key or scrolling the mouse wheel with the
CTRL key pressed does the same. The
Zoom Default button restores the original picture scale.
To fit the picture within the panel’s borders, press the Best Fit button.
Save To File button allows you to save the whole picture displayed in the panel to a file.
When you zoom in the picture so that it does not fit the panel’s bounds, the panel displays an additional
tool, Navigation Frame, that is used for quick navigation through the displayed picture. Navigation Frame is
shown as a semi-transparent blue rectangle in the bottom right corner of the panel (see the image above). It
contains a red rectangle indicating the location of the currently shown picture area within the whole picture
whose outline is shown as a white rectangle in a larger size. To change the picture area shown in the panel
and quickly navigate through the picture, you can either:
●
Drag the red rectangle to the needed area within the white rectangle.
smartbear.com
AQtrace by SmartBear Software
Panels
363
-- or --
●
Click the needed place within the white rectangle (the red rectangle will immediately move to that
area).
After that, the panel will change its contents and display the appropriate segment of the picture. Note that
when you zoom the picture in or out, the size of the red rectangle changes proportionally. When the display
scale is set so that the panel shows the whole picture, the panel hides Navigation Frame.
Storage View Panel
Using the Storage View panel of AQtrace Viewer you can view the report files that reside in the
persistent report storage and load these report files in AQtrace Viewer for analysis.
If the panel is hidden, select View | Select Panel from AQtrace Viewer’s main menu and then choose
Storage View in the ensuing Select Panel dialog.
Note: In order for the panel to be able to obtain access to the persistent report storage, you should
specify the path to the storage in the Storage path setting of AQtrace Viewer (this setting is
located on the Reports Storage Options dialog).
If the Storage path setting contains a valid folder path, then the Storage View panel displays recently
received error reports. The number of shown reports is specified by the Show last…reports setting (you can
change it in the Reports Storage Options dialog). If the setting is 0, the panel displays all of the reports that
reside in the storage.
AQtrace Viewer automatically updates the Storage View panel every 30 seconds and adds information
about recently received reports to it.
For each report, the panel displays the following information:
Column
Description
© 2011 SmartBear Software
smartbear.com/support
364
AQtrace Viewer
Column
Description
File Name
Name and extension of the report file.
Description
This column is editable. You can specify any text describing the report in it.
Date
The date and time of the file creation (that is, the date and time when the report was
added to the storage). The column displays date and time values in the UTC format,
regardless of the local time settings of the machine where error reports are processed
before they are added to the storage.
Path
The file’s path (includes the path of the storage folder).
Report Id
The error report’s identifier (an integer value that is assigned to the report by AQtrace
Service during the initial processing).
Duplicated
Report Id
If the error report is a duplicated one (see Detecting Duplicated Reports), this field
contains the identifier of the first report which was generated due to the same problem.
If the report is not duplicated, the field is empty.
Two notes about the Report Id and Duplicated Report Id columns:
●
These columns contain information only if AQtrace Service is running and the persistent
storage folder used by the service is the same as that whose reports are listed in the
Storage View panel (that is, if one and the same folder is specified in the Persistent
storage folder setting of AQtrace Service and in the Storage path setting of AQtrace
Viewer).
●
AQtrace Viewer receives information for these columns from AQtrace Service, so filling
in the columns may take some time after the Storage View panel is opened.
The size and location of the panel’s column are not limited. For instance, you can change the column’s
width by dragging the columns header or hide columns from the panel. For more information on this, see
Arranging Columns, Lines and Panels.
To open an error report for analysis
To load a report from the storage and open it for analysis in AQtrace Viewer, double-click the desired
report in the Storage View panel.
To find the desired report
To find the desired bug quickly, you can sort, group or filter the panel’s contents in the Date column:
●
To sort the panel’s contents, click the header of the Date column. The arrow that is drawn in the
header will indicate the sort order. See Sorting for more information.
●
To filter the panel’ content, click the down arrow button that is drawn in the header of the Date
column and then choose the desired date from the ensuing drop-down list (see Filtering Data).
●
To group the panel’s data:
●
Right-click somewhere within the panel and check Show Group Pane from the context menu.
This will display the group area at the top of the panel.
smartbear.com
AQtrace by SmartBear Software
Panels
365
●
Drag the header of the Date column to the group area. The panel will group its data by the
values shown in the Date column.
See Grouping for more information.
To copy data from the panel
To copy data from the panel, choose the desired row, then right-click somewhere within the panel and
select Copy from the context menu.
Threads Panel
The Threads panel of AQtrace Viewer displays information on threads that existed in your application
when an exception occurred. The Threads panel defines the contents of the Call Stack and Registers panels.
They display data for the thread that is selected in the Threads panel.
If the panel is hidden, select View | Select Panel from AQtrace Viewer’s main menu and then choose
Threads in the ensuing Select Panel dialog.
Here is a sample view of the panel:
For each thread the panel displays the following information:
Column
Description
ID
The thread’s identifier.
Category Specifies the thread’s category. The following variants are possible:
● Main thread - a primary thread that runs all other threads in the process.
●
Worker thread - a secondary thread that is used for auxiliary procedures and
created by the main thread.
●
RPC thread - a thread that was created for RPC (Remote procedure call).
© 2011 SmartBear Software
smartbear.com/support
366
AQtrace Viewer
Column
Description
AQtrace does not provide absolutely correct recognition of RPC threads
(especially for 64-bit applications). If there is not enough information in a
memory dump included in a bug report, it may be very difficult to determine
correctly the thread’s category. So, RPC threads may be determined as common
worker threads.
Priority
The thread’s priority (normal, critical and so on).
Suspend
Specifies whether the thread was suspended when an exception occurred.
Name
The thread’s name that has been specified using the IaqReporterIntf2.SetThreadName
method. This name can be helpful to distinguish easily one thread from another in the
Threads panel. If the name for the thread has not been specified with this method, the Name
field for this thread is empty.
You can arrange data within the panel as your needs dictate. For instance, you can change the column’s
size and position, hide or display columns, sort data in the table, filter or group them. See Arranging
Columns, Lines and Panels for detailed information.
The thread that was active when an exception occurred is marked with the icon.
To explore the data that is included in the report for a thread, select this thread in the Threads panel and
press Enter, or double-click the thread in the panel. AQtrace Viewer will update the Call Stack and Registers
panels with data that was saved for the selected thread. You can then switch to these panels to perform
further analysis (see Analyzing Error Reports With AQtrace Viewer).
Watch Panel
Using the Watch panel of AQtrace Viewer you can create watch expressions (“watches”) for various
complex variables (structures and objects) declared in the application, for which the analyzed error report
was generated. Using watch expressions added to the panel, you can view the values that were assigned to
such variables when the exception occurred.
Note: Currently, the panel does not support watches for simple data types like integer or floating-point
numbers, strings, and so on. You can create watch expressions only for complex variables like
objects or structures.
If the panel is hidden, select View | Select Panel from AQtrace Viewer’s main menu and then choose
Watch in the ensuing Select Panel dialog.
For each complex variable, which you want to inspect, the panel displays a list of its members with their
type names and values. The members’ hierarchy is displayed in a tree-like form.
smartbear.com
AQtrace by SmartBear Software
Panels
367
When viewing the tree of the complex variable being examined, you can expand and collapse the
contents of the object’s complex members (child objects and structures are displayed as expandable tree
items) by clicking the “+” or “-” button displayed to the left of such members. Also, to collapse information
of a complex variable (the whole watch or one of its complex members, if any), you can select one of its
members and click the
Collapse Parent button on the panel’s toolbar or use the appropriate command
from the panel’s context menu.
In order to create a watch expression for an object or structure and view its contents, you need to specify
the name of the variable’s type and the memory address where the desired variable was located at the
moment when the exception occurred. See below for detailed information on how to create a watch
expression for a variable.
AQtrace Viewer obtains values of variables, for which you create watches, from the memory dump
included in the analyzed error report. When the memory area with the specified address is found in the dump,
AQtrace Viewer tries to parse the memory area in accordance with the specified data type. Definitions of
data types used by the application are stored in debug information. Therefore, AQtrace Viewer needs the
application's debug information files in order to "know" the definition of the specified data type and to
properly parse the memory area where the variable was located.
Without debug information AQtrace Viewer cannot obtain variable values and display them in the
Watch panel. So, you must compile your application with debug information and make sure that
AQtrace Viewer has access to this debug information when you are analyzing an error report. For
information on how you can compile your application with debug information, see Compiling
Applications With Debug Information.
For each inspected variable and its members, the panel displays the following information in the table:
Column Description
Name
The name of a variable. The panel displays names only for members of the variable for which
the watch expression was created. In the row that corresponds to the whole watch, the Name
column holds the variable’s type name and memory address (see the To add a new watch
© 2011 SmartBear Software
smartbear.com/support
368
AQtrace Viewer
Column Description
expression section below).
Value
The value assigned to a variable before the exception occurred. Only rows that correspond to
variables of simple data types contain values in this column. Rows that correspond to the
whole watch and its complex members, if any, hold empty cells in the Value column.
Integer values can be displayed in the Value column either in the hexadecimal or in the
decimal format. You can switch the display format by checking and unchecking the
Hexadecimal Display option in the panel’s context menu (by default, it is checked and the
panel displays integer values in the hexadecimal format). Fractional numbers are always
displayed in the decimal format.
Type
The type name of a variable. Type names are displayed for all variables in the Watch panel,
both for complex variables, for which you have created watch expressions, and for all their
members.
To the left of each item in a watch tree, there is a helper icon that designates the kind of the
corresponding variable and makes it easier to apprehend information displayed in the panel. You can see the
following icons in the panel:
●
- Complex variables that have children. You can see such icons to the left of rows that
correspond to watches and their child structures and objects.
●
- Simple object members that do not have children and that are not pointers to other variables.
Such icons are displayed to the left of object properties or structure fields of simple data types,
such as integer, Boolean, string variables, and so on.
●
- Pointer-type variables. When an object or structure, which you specified in a watch
expression, contains a pointer to another variable, the Watch panel displays the value of this
pointer, that is, the address of the variable to which it points. Also, AQtrace Viewer tries to
dereference the pointer, obtain the value of the variable to which the pointer points, and display it
in the watch tree as a child of the pointer item:
If a pointer is invalid or the address to which it points is out of the memory area included
as a memory dump in the error report, AQtrace Viewer cannot obtain the variable’s value
by such a pointer and the Watch panel displays only names and data types of such
dereferenced variables. The Value column is empty in this case.
smartbear.com
AQtrace by SmartBear Software
Panels
369
Note also that if the panel shows the “Error: symbol … not found” error message in the Value column
after you specified the desired variable’s type name and address, this means that the definition of the
specified data type has not been found by AQtrace Viewer in the debug information files (or no debug
information has been found) or the specified address is out of the memory area included in the memory
dump. Make sure that you have specified the correct data type and address and that AQtrace Viewer has
access to the application's debug information files.
To add a new watch expression
To add a new watch expression to the table displayed in the Watch panel:
●
Click the Name cell of the empty row at the end of the table (this row is automatically appended to
the table after you create a new watch expression).
●
In the Name cell, specify the data type name and memory address of the variable whose value you
want to inspect and press ENTER. Use the following syntax:
(DataTypeName*) Address
You can specify the variable’s address in the hexadecimal or decimal format. When you type a
hexadecimal value, use the 0x prefix. For instance:
(TfmMain*) 0x12F520
Here, TfmMain is a class name and 0x12F520 is the memory address at which the examined
object was located.
Once you enter the type name and address, the Watch panel creates a new watch expression and tries to
obtain the value of the variable of the specified type from the specified address in memory.
If the complex variable, for which you are creating a watch, contains a pointer to another complex
variable as a child member (pointers are marked with the
icon in the Watch panel), you can easily create a
new watch for the variable to which the pointer points:
●
Select the row containing the desired pointer in the Watch panel.
●
Click the
Add Watch button on the panel’s toolbar (this button becomes available only when
you select a pointer in the Watch panel).
-- or -●
Right-click the row containing the desired pointer in the Watch panel.
●
Select
Add Watch from the panel’s context menu (this menu item becomes available only
when you select a pointer in the Watch panel).
A new watch expression corresponding to the variable to which the selected pointer points will be added
to the Watch panel.
To delete a watch expression
To delete a watch expression from the table displayed in the Watch panel:
●
Right-click the row containing the desired watch expression.
●
Select
Delete Watch from the context menu.
-- or -● Select the row containing the desired watch expression.
●
Click the
Delete Watch button on the Watch toolbar.
If you want to delete all the watches displayed in the panel, right-click somewhere in the panel and select
© 2011 SmartBear Software
smartbear.com/support
370
AQtrace Viewer
Clear All from the ensuing context menu or click the appropriate button on the panel’s toolbar.
To copy data
To copy data displayed in the Watch panel:
●
Select the desired row(s) in the table displayed in the panel. You can use Ctrl- or Shift-click for
multiselection. To select all the data displayed in the table, use the Select All command of the
context menu.
●
Select Copy from the context menu.
Miscellaneous
AQtrace Viewer Command Line
In general, the AQtrace Viewer command line is as follows:
AQtraceViewer.exe [file_name] [/SilentMode] [/ns]
Here the brackets mean the argument is optional. Below is the description of the command-line
arguments that AQtrace Viewer accepts:
●
file_name - Launches AQtrace Viewer and loads the specified report file into it.
●
/SilentMode - If this argument is specified, AQtrace Viewer works in silent mode, that is, it
neither displays dialogs, nor informs you about errors or warnings. The dialogs and messages to be
displayed are handled as if you pressed the default button in them. Information about these dialogs
and messages is posted to the <AQtrace Viewer>\Bin\Silent.log file (the file should not be readonly or locked by another application). The errors that occur during the test execution are posted to
the test log.
●
/ns - Opens AQtrace Viewer without displaying the splash screen.
Installing Extensions
AQtrace Viewer is built on an open, COM-based architecture, which allows you to write external plugins for it or install plug-ins from any source. By default, the plug-in files are copied to the
<AQtrace>\Bin\Extensions folder. However, they can be located in any other folder.
All of the installed plug-ins are shown in the Install Extensions dialog. Here you can temporary disable
or enable the plug-ins and check whether a plug-in conflicts with another plug-in. Conflicting plug-ins are
automatically disabled. Using the dialog, you can also install third-party plug-ins.
To Disable a Plug-In
●
Select File | Install Extension from AQtrace Viewer's main menu. This will call the Install
Extensions dialog.
●
In the dialog, uncheck the plug-ins you want to disable and click OK.
To Install a Third-Party Plug-In
●
Open the Install Extensions dialog (to do this, choose File | Install Extension from AQtrace
smartbear.com
AQtrace by SmartBear Software
Miscellaneous
●
●
371
Viewer's main menu).
Press Add in the dialog.
In the ensuing Open File dialog, select the plug-in file and click Open. AQtrace Viewer will add
the plug-in to the plug-in list.
Once the plug-in has been added, AQtrace Viewer will check whether this plug-in conflicts with
any other plug-in and whether a newer version of the same plug-in is already installed. If any of
these checks fail, the plug-in will be unchecked and will not be installed in AQtrace Viewer.
●
To complete the installation, click OK in the Install Extensions dialog. This will install the plug-in
in AQtrace Viewer.
If you do not need a third-party plug-in, you can disable it as described above.
Updating Menus and Toolbars
If a plug-in adds menu and toolbar items to AQtrace Viewer, you may need to make these items visible
by hand. You add these items to AQtrace Viewer’s menus and toolbars the same way you add other menu or
toolbar items: by adding the items from the Customize dialog. See Toolbar Customization.
If you disabled an AQtrace Viewer plug-in and then enabled it, you can quickly update the menus and
toolbars with the plug-in’s commands by selecting View | Toolbars | Restore Default Toolbar from
AQtrace Viewer’s main menu.
Checking for Updates
Every time you launch AQtrace, it sends requests to the www.automatedqa.com web site to see if a
newer version or a patch for the current version of the product is available. This feature allows you to be
aware of AQtrace updates without visiting our web site.
The requests sent to this web site do not contain personal information. They only include
information about the product version you own and registration information.
If a newer version is available, AQtrace displays a dialog box asking you to open a Web page where you
can read more about the update and download the newer version.
If there is a patch available, AQtrace displays a dialog box asking you to download and install the patch.
If you agree to install it, AQtrace will close itself, download new files and then install the patch.
If you already own the latest available version, AQtrace displays a message that informs you that no
updates were found.
To disable the check for updates at startup, check the Don't check at startup box in the displayed dialog
or disable the Check for updates at startup option in the Show Again Flags dialog.
You can also check for updates manually by selecting Help | Check for Updates from AQtrace’s main
menu.
© 2011 SmartBear Software
smartbear.com/support
372
Source Server Support
Source Server Support
AQtrace supports different kinds of source servers that allow retrieving the exact version of source files
from a source control system. The source code of application modules can change from one build to another,
so, it is important to look into the source code that was used for building certain version of the application.
Using a source server, AQtrace Viewer can extract the appropriate version of source code files from the
source control and display the source code in the Code Viewer panel when an error report is opened.
The topics of this section provide information on the source servers supported by AQtrace and describe
how to use them with AQtrace Viewer.
About Source Server Support
During the life cycle of an application, the source code of its modules can be changed from one version
to another, because the developers improve the application, fix bugs, add new features, etc. So, the end-users
may have application versions that have different source code. If an error occurs in the application on an enduser computer, AQtrace Reporter generates a dump report and sends it to the developers. When such a report
is opened in AQtrace Viewer, the source code of the routines listed in the Call Stack panel is normally
displayed in the Code Viewer panel of AQtrace Viewer (for the requirements needed to display the source
code, see Code Viewer Panel). It is very important for the developers to take a look at the source code that
corresponds to the application’s build in which the error occurred.
Development teams usually use different source control systems to track versions of source files (for
instance, Microsoft Visual SourceSafe, Perforce, Subversion, etc.). Such systems allow you to store all the
versions of the source code and track all the changes in it. To automatically retrieve the actual version of the
source files that were used to build the application, source servers are used. Source servers index the source
files that correspond to a specific version of the application, and define the appropriate version of the source
code files in the source control system. To index source code files, source servers use the application’s debug
information (for information on how to compile your application with debug information, see Compiling
Applications With Debug Information).
AQtrace provides support for source servers. This functionality helps you solve the problem mentioned
above. Using source servers, AQtrace Viewer can determine the version of the source code files of the
application’s build that generated the dump report and retrieve these files from the source control system.
This functionality allows determining the exact version of the source code, which is then displayed in the
Code Viewer panel of AQtrace Viewer. So, the developers can view the source code of the application while
analyzing the dump report and look into the code snippet where the error occurred. This makes it easier to
find the cause of the error in the application.
Supported Source Servers
Currently, AQtrace Viewer supports two types of source servers: Microsoft Source Server and
SmartBear Source Server. Microsoft Source Server is a tool that is part of Microsoft Debugging Tools for
Windows. It uses PDB debug information for source indexing, that is, this source server can be used only
with those applications that were developed with Microsoft Visual Studio and Delphi for .NET. For
more information on this tool, see Using Microsoft Source Server.
SmartBear Source Server is part of AQtrace that can be used by AQtrace Viewer for retrieving the exact
smartbear.com
AQtrace by SmartBear Software
About Source Server Support
373
versions of source code files from a source control system. This tool was developed by SmartBear Software
as an alternative to Microsoft Source Server. Unlike Microsoft Source Server, SmartBear Source Server
supports various debug information formats, so it can also be used with Delphi and C++Builder applications.
For more information on this tool, see Using SmartBear Source Server.
The supported source servers have a different priority in AQtrace Viewer for getting source code files
and displaying them in the Code Viewer panel. AQtrace Viewer searches for source files in the following
order:
1. First, AQtrace Viewer tries to use SmartBear Source Server that searches for source index
information needed for SmartBear Source Server. If the application’s modules have been indexed,
and SmartBear Source Server finds the needed index information files, it tries to extract the actual
version of the source files from the source control system using the index information.
2. If the modules have not been indexed for SmartBear Source Server, or the needed index
information cannot be found, or the sources cannot be retrieved from the source control database
for some reason, AQtrace Viewer commands Microsoft Source Server to search for source index
information in the corresponding .PDB debug info files that reside in the build storage (this does
not concern Delphi for Win32 and C++Builder applications). If Microsoft Source Server finds the
needed source index information, it tries to use it for retrieving the actual source code files from
the source control system.
3. Finally, if the source servers do not give positive results, AQtrace Viewer attempts to find the
source code files using the paths specified on the Source Code page on AQtrace Viewer's options.
Both Microsoft Source Server and SmartBear Source Server support various source control systems that
can store different versions of source code files. For more information on the supported source control
systems, see Using Source Control Systems Supported by Microsoft Source Server and Using Source Control
Systems Supported by SmartBear Source Server.
How AQtrace Viewer Works With Source Servers
To enable AQtrace Viewer to use a source server while analyzing your application’s dump reports, you
should prepare your application for this:
1. Compile your application with debug information (see Compiling Applications With Debug
Information).
2. Check in the source code files that correspond to the current build of your application to your
source control system.
3. Specify a label for the source files in your source control system so that it is easy to get the desired
version of the source code that corresponds to the build. Most source control systems support file
labeling.
4. To use source servers, your application must be source indexed. Source indexing is made to define
which version of the source files stored in the source control system corresponds to a certain build
of the application. Debug information of your application’s modules contains the list of the source
files that were used to build the application. So, this list is used to index the sources for a certain
build. Generally, binaries are source indexed during the build process. The labels that were
specified for the sources in the source control system are used for indexing. After the sources have
been indexed, it is possible to determine the actual sources stored in the source control that were
used to build the application. For more information on source indexing, see Source Indexing for
Microsoft Source Server and Source Indexing for SmartBear Source Server.
If your application is source indexed, AQtrace Viewer can use a source server to retrieve the sources that
were used to create a build. AQtrace Viewer gets the source code via a source server in the following way:
1. The user selects a routine in the Call Stack panel that displays a call stack for the dump report that
© 2011 SmartBear Software
smartbear.com/support
374
Source Server Support
is open in AQtrace Viewer. Note that AQtrace Viewer can parse error reports and display their call
stacks only if the application's binary modules and debug information files have been found.
2. Then AQtrace Viewer tries to find the source index information of the module in which the
selected routine is declared.
3. If the sources are indexed, AQtrace Viewer requests the appropriate version of the source code for
the selected routine (for information on the supported source servers and their priority for AQtrace
Viewer, see above).
4. Using the source index information, the source server tries to extract the needed version of the
source code file from the source control system and save it to a temporary folder on the hard drive.
5. If the source server retrieves the sources successfully, it displays the file with the code of the
selected routine in the Code Viewer panel. Otherwise, AQtrace Viewer tries to find the source file
in the local folders specified on the Source Code page of AQtrace Viewer options and displays this
file. Note that in this case, the displayed code of the routine may be inappropriate, because the
version of the file that was found in a local folder (not in the source control system) may differ
from the version that was used during the build compilation.
Using SmartBear Source Server
Using SmartBear Source Server - Overview
This topic provides information about SmartBear Source Server and describes how you can use this tool
with AQtrace Viewer to retrieve actual versions of source code files from the supported source control
systems and view proper versions of the source code while analyzing error reports.
Using SmartBear Source Server With AQtrace Viewer
SmartBear Source Server was developed by SmartBear Software as an alternative to Microsoft Source
Server. It is implemented in the aqAQASourceServer.dll library as part of AQtrace and is used to retrieve
appropriate versions of source files from a source control system and to display them in the Code Viewer
panel of AQtrace Viewer.
To be able to use the functionality of SmartBear Source Server while analyzing error reports in AQtrace
Viewer, you should source index the modules of your application. When source indexing is being made, the
versions of the source files stored in the source control repository are matched with your application’s builds.
SmartBear Source Server reads the contents of debug information files to get the list of the source files used
for compilation of the application’s modules, so, your application should be compiled with debug
information (see Compiling Applications With Debug Information). After source indexing is done,
SmartBear Source Server creates a special source index file (aqIndex.aqiss) that contains information about
your source control system, the list of the application’s modules and the list of appropriate source files in the
repository along with the versions of these files that correspond to the indexed build of the application. This
index file resides in the folder that contains the debug information files of your application’s build. The
information from the aqIndex.aqiss file is used by SmartBear Source Server for retrieving the appropriate
source code files from the source control system. To distinguish different versions of source files in the
source control repository and to get the desired version, SmartBear Source Server uses labels. For more
information on source indexing of modules, see Source Indexing for SmartBear Source Server.
If you open an error report in AQtrace Viewer and double-click a routine name in the Call Stack panel,
AQtrace Viewer will request the appropriate version of the source file that contains the declaration of the
smartbear.com
AQtrace by SmartBear Software
Using SmartBear Source Server
375
selected routine from SmartBear Source Server. If the source file is found in the source control system and is
retrieved from it, AQtrace Viewer displays the code of the corresponding routine in the Code Viewer panel.
Note that SmartBear Source Server has the highest priority for retrieving source code files from a source
control system. First, AQtrace Viewer tries to use SmartBear Source Server and then, if SmartBear Source
Server cannot get the needed version of a source file for some reason, it refers to Microsoft Source Server or
attempts to get a local copy of this source file.
To retrieve source files, SmartBear Source Server starts searching for the aqIndex.aqiss file in the folder
containing the application’s modules. If the module that contains the selected routine’s declaration is source
indexed, and SmartBear Source Server finds the source index file, SmartBear Source Server attempts to
retrieve the needed source file of the appropriate version from the source control system. The source control
version of the file that corresponds to the required build is stored in the aqIndex.aqiss file and is specified
during indexing.
If SmartBear Source Server gets the desired version of the source file from the source control system
successfully, it creates a local copy of the file on the hard disk in a temporary working folder (see below).
For each retrieved version of the source code files, SmartBear Source Server creates a subfolder with a name
that coincides with the appropriate label of the source files in the source control system. Note that the
hierarchy of subfolders to which the source code files are stored repeats the tree of directories in the source
control database (starting from the root directory of the database). The local copies of the files and the
created subfolders will not be deleted after you close AQtrace Viewer.
One of the advantages SmartBear Source Server has compared to Microsoft Source Server is the ability
to compare the retrieved version of a source file that was used for compilation of the corresponding build
with the latest version of this source file. So, SmartBear Source Server gets the latest version of the file from
the source control repository too. This file is also copied to the local working folder and placed in the Latest
subfolder. See Comparing Versions of Source Code Files for more information on this functionality.
You can see the name and path of the source code file, which is currently displayed in the Code Viewer
panel of AQtrace Viewer, at the top of this panel. To copy the path and name, select Copy from the panel's
context menu.
Supported Application Types
Unlike Microsoft Source Server, SmartBear Source Server does not add source index information to
debug information files and can use all the debug information types supported by AQtrace (see Source
Indexing for SmartBear Source Server). So, SmartBear Source Server can equally process Microsoft Visual
Studio, Delphi and C++Builder applications. This allows you to retrieve the exact versions of source code
files and display them in AQtrace Viewer while analyzing error reports generated for C++Builder and Delphi
applications.
Requirements
In order to use SmartBear Source Server with AQtrace Viewer, you need to have Automated Build Studio
ver.6. This tool developed by SmartBear Software is required for source indexing of applications’ modules.
Automated Build Studio provides several macro operations that allow you to index the modules of your
application for SmartBear Source Server. These operations let you index files so that they can be used with
all the supported source control systems. Note that to index source files for SmartBear Source Server, you
need to use only one tool - Automated Build Studio, while Microsoft Source Server requires additional tools
for indexing source files.
AQtrace Viewer Settings
AQtrace Viewer’s Options dialog contains the SmartBear Source Server page for SmartBear Source
Server. On this page, you can specify the following setting:
© 2011 SmartBear Software
smartbear.com/support
376
Source Server Support
●
Destination Folder - Specifies the local folder in which SmartBear Source Server should place
copies of source files upon retrieving them from a source control system. AQtrace Viewer loads
the copies of the files from this destination folder to display them in the Code Viewer panel. If you
do not specify this setting, SmartBear Source Server will place the copies in a temporary working
folder. On the Microsoft Windows XP operating system, SmartBear Source Server uses the
following default folder:
C:\Documents and Settings_name\Local
Settings\Temp\SmartBearSourceServer
To view or change the Destination Folder setting, select Options | Options from the main menu of
AQtrace Viewer and move to the General | SmartBear Source Server page in the ensuing Options dialog.
Source Indexing for SmartBear Source Server
To be able to use SmartBear Source Server for retrieving appropriate versions of source files from a
source control system, you should source index the modules of your application. This means that you should
define which version of source code files corresponds to each build of your application.
SmartBear Source Server needs debug information files to source index your application, so, your
application should be compiled with debug information (see Compiling Applications With Debug
Information).
During source indexing, SmartBear Source Server reads the list of the source files, which were used
during compilation of the application modules, from the corresponding debug information files and creates a
special source index file (aqIndex.aqiss). This file has the .xml format and contains information needed to
obtain these source files from a source control system, including connection parameters of the source control
system, the list of these source files and their version that corresponds to the current build of the application.
To distinguish versions of the source files in the source control system, SmartBear Source Server uses the
labels from the source control repository.
To source index a build of your application, you should use Automated Build Studio, which is another
tool developed by SmartBear Software. Automated Build Studio provides several operations that can be used
to source index your application’s modules for SmartBear Source Server. These operations are included in
the SmartBear & AutomatedQA Tools category of Automated Build Studio's operations. Each operation is
used for a certain source control system supported by SmartBear Source Server. So, you can use one of the
following operations:
●
AQtrace Index Modules for VSS
●
AQtrace Index Modules for Subversion
●
AQtrace Index Modules for Perforce
In order to use any of these operations, you must specify some required parameters. On the Indexing
Modules Details page of the Operation Properties dialog, you need to specify the following properties (to
display this dialog, double-click the operation in your Automated Build Studio macro):
●
Modules Directory - Specifies the folder (on a local hard drive) that holds the modules to be
indexed (the modules must contain debug information). For instance, C:\Symbols.
●
Sources Directory - Specifies the folder (on a local hard drive) that holds a local copy of the
source files. For instance, C:\Sources.
In addition to these common properties, you must specify the operation parameters needed to connect to
your source control system (for instance, the user name and password) and the label of the source files that
should be indexed. These parameters differ from one operation to another, depending on the type of the
source control system. See Using Source Control Systems Supported by SmartBear Source Server, for more
smartbear.com
AQtrace by SmartBear Software
Using SmartBear Source Server
377
information on how to use SmartBear Source Server with various supported source control systems and what
parameters you should specify for these Automated Build Studio operations.
After you specify all the required parameters of the operation needed for your source control system, run
the Automated Build Studio macro holding this operation. If the operation is executed successfully, the
aqIndex.aqiss file containing the source index information will be created in the folder where the
application’s modules reside.
Note that Automated Build Studio is used to automate building of applications and to perform various
operations during the build process. So, it is very convenient to automatically index every build of your
application during the build process by using one of the operations mentioned above.
Using Source Control Systems Supported by SmartBear Source Server
Using Microsoft Visual SourceSafe With SmartBear Source Server
If you use Microsoft Visual SourceSafe as a source control system for storing the source files of your
application, and you want to retrieve the actual version of these files while analyzing the application’s dump
reports, you should use the AQtrace Index Modules for VSS operation in Automated Build Studio to source
index the application’s modules. You can find this operation in the SmartBear & AutomatedQA Tools
operation category on the Operations panel of Automated Build Studio.
The most important thing you need to do to retrieve source code files from a source control system via
SmartBear Source Server is to source index the application's modules. You should index every build of your
application if you want to view the exact version of the source code in AQtrace Viewer. Otherwise, if you do
not index a build, AQtrace Viewer will get a local copy of the source files when it opens a dump generated
by this build, and this copy may not correspond to the version of the files that were used during compilation
of the build. This may confuse you when you are analyzing the report. To index a build of your application
for Microsoft Visual SourceSafe, do the following:
1. Compile your application with debug information (to learn how to do this, see Compiling
Applications With Debug Information).
2. Check in the source files of your application to the Visual SourceSafe database.
3. Specify a unique label for this version of the source files in your source control system (for
instance, you can specify the VERSION_1_10 label for the 1.10 build number of your application).
This label will be used to retrieve this version from Visual SourceSafe via SmartBear Source
Server.
4. In Automated Build Studio, create a new macro or open an existing one. Add the AQtrace Index
Modules for VSS operation to the macro (you can find it in the SmartBear & AutomatedQA
Tools operation category).
5. Double-click the operation in the macro. In the ensuing Operation Properties dialog, you should
specify the properties required for source indexing. Go to the Indexing Modules Details tabbed
page and specify the following options:
●
Modules Directory - Specifies the folder (on a local hard drive) that holds the modules to be
indexed (the modules must contain debug information). For instance, C:\Symbols.
●
Sources Directory - Specifies the folder (on a local hard drive) that holds a local copy of the
source files. For instance, C:\Sources.
Go to the VSS Options tabbed page and specify the following parameters:
© 2011 SmartBear Software
smartbear.com/support
378
Source Server Support
●
Database - Specifies the path to the Microsoft Visual SourceSafe database.
●
Login and Password - These parameters specify the user name and password used to connect
to the VSS database. If both parameters are omitted, the operation will use the login and
password of the user who is currently logged in to Windows.
●
Project - Specifies the name and path to a project stored in the Visual SourceSafe database.
For instance: $/Sources/CppProject.
The database directory specified by this path must correspond hierarchically to the
directory that contains the local copy of the sources that was specified in the Sources
Root parameter of the operation.
●
Label - Specifies a label for the files stored in the VSS database. This label should be used for
indexing, and it must be the label that you specified for the source files in the VSS database
(for instance, the VERSION_1_10 label). After indexing, the version of the source files that
have this label will correspond to the application build you are going to index.
These parameters are required for successful source indexing. There are also some other tabbed
pages with other operation parameters in the Operation Properties dialog, but they optional. For
more information on the operation, see Automated Build Studio's documentation.
6. After you have specified the parameters, run the macro.
If the operation is executed successfully, the aqIndex.aqiss source index file will be created in the
directory specified by the Modules Directory parameter, and SmartBear Source Server will be able to use
this file to retrieve the source files from your VSS database.
Using Subversion With SmartBear Source Server
If you use Subversion as a source control system to store the source files of your application, and you
want to retrieve the actual versions of these files while analyzing the application’s dump reports, you should
use the AQtrace Index Modules for Subversion operation of Automated Build Studio to source index the
application’s modules. You can find this operation in the SmartBear & AutomatedQA Tools operation
category on the Operations panel in Automated Build Studio.
In order to use this operation, you must specify the path to the Subversion client executable
(svn.exe) in the Tools dialog of Automated Build Studio. To display this dialog, select Options |
Tools from the main menu.
The most important thing that should be done to retrieve source code files from a source control system
via of SmartBear Source Server is to source index the application’s modules. You should index every build
of your application if you want to view the exact versions of the source code in AQtrace Viewer. Otherwise,
if you do not index a build, AQtrace Viewer will get a local copy of the source files when it opens a dump
report generated by this build, and this copy may not correspond to the version of the files that were used
during compilation of the build. This may confuse you when you are analyzing the dump report. To index a
build of your application for Subversion, do the following:
1. Compile your application with debug information (to learn how to do this, see Compiling
Applications With Debug Information).
2. Commit the changes you have made in the source files of your application to your Subversion
repository.
smartbear.com
AQtrace by SmartBear Software
Using SmartBear Source Server
379
3. In Automated Build Studio, create a new macro or open an existing one. Add the AQtrace Index
Modules for Subversion operation to the macro (you can find it in the SmartBear &
AutomatedQA Tools operation category).
4. Double-click the operation in the macro. In the ensuing Operation Properties dialog, you should
specify the properties required for source indexing. Go to the Indexing Modules Details tabbed
page and specify the following options:
●
Modules Directory - Specifies the folder (on a local hard drive) that holds the modules to be
indexed (the modules must contain debug information). For instance, C:\Symbols.
●
Sources Directory - Specifies the folder (on a local hard drive) that holds a local copy of the
source files. For instance, C:\Sources.
Go to the Subversion Options tabbed page and specify the following parameters:
●
User Name and Password - These parameters specify the user name and password used to
connect to the Subversion server. If your server allows anonymous access, you can omit these
parameters.
●
Working Copy - Specifies the path to the Subversion repository. The format of the path
depends on where your Subversion repository is located and what protocol is used to access it:
■
If you store the repository on your Apache-based Subversion server, you should use the
following path format:
http://svn_server/repository
If you use a secured protocol (with the SSL encryption), the path is specified like this:
https://svn_server/repository
■
If your repository is located on an Svnserve server, you access it via its custom svn
protocol (its default port number is 3690), and you should specify the path like the
following:
svn://svn_server:3690/repository
In addition, if you use a secure shell (SSH), you should use the following format:
svn+ssh://svn_server:3690/repository
■
If you use direct access to the repository located on a local or network drive, the path can
be specified like this:
file:///C:/svn_repository
Also, you can specify the path in the following way if you use a working copy of your
repository on a local drive:
C:\svn_repository
●
Revision - Specifies the revision of the files you want to index. If this parameter is omitted, the
operation indexes the head revision of the files, that is, the latest version of the files stored in
the repository.
In the AQtrace Index Modules for Subversion operation, you can use only
revision numbers to specify versions of the files located in the Subversion repository.
Revision keywords and revision dates are not allowed for this operation.
These parameters are required for successful source indexing. There are also other tabbed pages
with additional operation parameters in the Operation Properties dialog, but they are optional.
For more information on the operation, see Automated Build Studio's documentation.
© 2011 SmartBear Software
smartbear.com/support
380
Source Server Support
5. After you have specified the parameters, run the macro.
If the operation is executed successfully, the aqIndex.aqiss source index file will be created in the
directory specified by the Modules Directory parameter, and SmartBear Source Server will be able to use
this file to retrieve the source files from your Subversion repository.
Using Perforce With SmartBear Source Server
If you use Perforce as a source control system to store the source files of your application, and you want
to retrieve the actual versions of these files while analyzing the application’s dump reports, you should use
the AQtrace Index Modules for Perforce operation of Automated Build Studio to source index the
application’s modules. You can find this operation in the SmartBear & AutomatedQA Tools operation
category on the Operations panel in Automated Build Studio.
In order to use this operation, you must specify the path to the Perforce client executable (P4.exe) in
the Tools dialog of Automated Build Studio. To display this dialog, select Options | Tools from the
main menu.
The most important thing that should be done to retrieve source code files from a source control system
via of SmartBear Source Server is to source index the application’s modules. You should index every build
of your application if you want to view the exact versions of the source code in AQtrace Viewer. Otherwise,
if you do not index a build, AQtrace Viewer will get a local copy of the source files when it opens a dump
report generated by this build, and this copy may not correspond to the version of the files that were used
during compilation of the build. This may confuse you when you are analyzing the dump report. To index a
build of your application for Perforce, do the following:
1. Compile your application with debug information (to learn how to do this, see Compiling
Applications With Debug Information).
2. Check in the source files of your application to your Perforce database.
3. Specify a unique label for this version of the source files in your source control system (for
instance, you can specify the VERSION_1_10 label for the 1.10 build number of your application).
This label will be used to retrieve this version of the files from Perforce via SmartBear Source
Server.
4. In Automated Build Studio, create a new macro or open an existing one. Add the AQtrace Index
Modules for Perforce operation to the macro (you can find it in the SmartBear &
AutomatedQA Tools operation category).
5. Double-click the operation in the macro. In the ensuing Operation Properties dialog, you should
specify the properties required for source indexing. Go to the Indexing Modules Details tabbed
page and specify the following options:
●
Modules Directory - Specifies the folder (on a local hard drive) that holds the modules to be
indexed (the modules must contain debug information). For instance, C:\Symbols.
●
Sources Directory - Specifies the folder (on a local hard drive) that holds a local copy of
source files. For instance, C:\Sources.
Go to the Perforce Options tabbed page and specify the following parameters:
●
Host - The network name of the remote computer that hosts the target Perforce server.
●
Port - The port number used to connect to the Perforce server.
●
User Name and Password - These parameters specify the user name and password used to
smartbear.com
AQtrace by SmartBear Software
Using SmartBear Source Server
●
●
381
connect to the Perforce server.
Project - Specifies the name and path to a project stored in the Perforce repository.
Label - Specifies a label for the files stored in the Perforce repository. This label should be
used for indexing, and it must be the same label that you specified for the source files in the
Perforce repository (for instance, VERSION_1_10). After indexing, the version of the source
files that have this label will correspond to the application build you are going to index.
These parameters are required for successful source indexing. There are also other tabbed pages
with additional parameters in the Operation Properties dialog, but they are optional. For more
information on the operation, see Automated Build Studio's documentation.
6. After you have specified the parameters, run the macro.
If the operation is executed successfully, the aqIndex.aqiss source index file will be created in the
directory specified by the Modules Directory parameter, and SmartBear Source Server will be able to use
this file to retrieve the source files from your Perforce repository.
Comparing Versions of Source Code Files
Using SmartBear Source Server, AQtrace Viewer can retrieve appropriate versions of source code files
from a source control system and display the files in the Code Viewer panel. With this functionality, you can
view the exact version of the source code used to compile the application build whose error report is being
analyzed.
If the source control system from which SmartBear Source Server retrieves a source code file contains
later versions of the file, AQtrace Viewer notifies you about this displaying an appropriate informative
message at the top of the Code Viewer panel where the file’s name is displayed. SmartBear Source Server
automatically retrieves the latest version of the file from the source control database when it gets the source
file version used in the build being analyzed. After that, you can compare the latest version of the file with
the version displayed in the Code Viewer panel and view differences between these file versions. To
compare file versions, AQtrace Viewer uses a third-party file comparison tool which you specify on the
General page of the Code Viewer options.
By comparing versions of a source code file, you can easily view changes that have been made in the
code since the build whose error report you are analyzing was compiled. It can happen that the error which
caused the report to be generated is already fixed in later versions of the source code, and you can see this by
comparing the source files.
As we have already said above, AQtrace Viewer uses third-party tools to compare source code files. You
choose the needed comparison tool and specify its settings on the Panels | Code Viewer | General page of
AQtrace Viewer’s Options dialog. For instance, you can use Microsoft WinDiff (it is distributed along with
some versions of Microsoft Visual Studio and with the Microsoft Windows SDK package), Grig Software
Compare It!, Araxis Merge and other comparison tools. In the Comparison tools group on the Code Viewer
| General settings page, you specify the needed comparison tool, the path to its executable file and the
required command-line arguments. You can specify several tools in the Comparison tools table, but AQtrace
Viewer will use only one tool which you select in the table. Just click the row containing the needed tool’s
settings in the table (the row will become highlighted) and click OK in the Options dialog. Next time you
open this settings page, the selected comparison tool will be still highlighted in the table. For more
information on comparison tool settings, see Code Viewer - General Settings.
When the Code Viewer panel of AQtrace Viewer displays a source file retrieved by SmartBear Source
Server from your source control system, right-click somewhere within the code and select Show Difference
from the context menu. AQtrace Viewer will launch the selected file comparison tool and command it to
compare the displayed version of the source file with its latest version. The launched comparison tool
© 2011 SmartBear Software
smartbear.com/support
382
Source Server Support
displays differences between two versions of the source code file.
If AQtrace Viewer cannot launch the selected comparison tool (for example, if you have specified a
wrong path to its executable file or incorrect command-line arguments), an appropriate error message is
displayed by AQtrace Viewer. Make sure that you have specified the comparison tool’s settings correctly.
Note that you can compare versions of source files and view their differences only when you use
SmartBear Source Server. If Microsoft Source Server is used by AQtrace Viewer, you cannot compare
source files by using file comparison tools.
Using Microsoft Source Server
One of the source servers supported by AQtrace is Microsoft Source Server. The topics of this section
provide general information on this tool and explain how it is supported by AQtrace Viewer. Also, in this
section, you can find an explanation of how to use Microsoft Source Server to get an appropriate version of
source code files from a supported source control system to display your application’s source code in
AQtrace Viewer while analyzing error reports.
Microsoft Source Server supports only applications with debug information stored in .PDB files.
Thus, you can only use this source server with applications developed with Microsoft Visual
Studio or Delphi for .NET. To retrieve source code from your source control system while
analyzing your Delphi for Win32 or C++Builder applications’ dumps reports, use SmartBear
Source Server.
Using Microsoft Source Server - Overview
This topic explains how AQtrace Viewer supports Microsoft Source Server and describes how you can
use AQtrace Viewer to view actual versions of source code files while analyzing error reports.
Using Microsoft Source Server With AQtrace Viewer
AQtrace Viewer can use Microsoft Source Server to retrieve the exact version of source files from a
source control system and display it in the Code Viewer panel.
To be able to use Microsoft Source Server, you should source index the modules of your application.
When performing source indexing, you define which versions of the source files stored in the source control
system correspond to a certain build of the application. Microsoft Source Server uses .PDB debug
information files to get the list of the source files used for compilation of the application’s modules. So, your
application should be compiled with debug information (for more information, see Compiling Applications
With Debug Information). After source indexing is done, Microsoft Source Server modifies the debug
information files by adding a source index stream to them. So, each debug information file of the
application’s modules includes a list of appropriate source files along with the versions of these files in the
source control system. The information added to the debug info files is used by Microsoft Source Server for
retrieving the appropriate source code files from the source control database. To distinguish different
versions of source files in the source control system, Microsoft Source Server uses labels. For more
information on source indexing of modules, see Source Indexing for Microsoft Source Server.
When you open an error report in AQtrace Viewer and double-click a routine name in the Call Stack
panel, AQtrace Viewer refers to Microsoft Source Server to get the appropriate version of the source file that
contains the declaration of the selected routine. If the source file is retrieved from the source control system,
smartbear.com
AQtrace by SmartBear Software
Using Microsoft Source Server
383
AQtrace Viewer displays the routine’s code in the Code Viewer panel.
To retrieve a source file, first, the source server starts searching for the .PDB debug information file that
corresponds to the module with the selected routine and resides in the build storage. If the module is source
indexed and Microsoft Source Server finds the source index segment in the .PDB file, the source server
attempts to retrieve the needed source file of the appropriate version from the source control database. The
source control version of the file that corresponds to the needed application build is stored in the source
index segment of the debug info file and is specified during the indexing process.
If the source server gets the desired version of the source file from the source control system
successfully, it creates a local temporary copy of the file on the hard disk. The location of this copy depends
on the operating system you are using. For instance, on the Microsoft Windows XP operating system, the
retrieved copy of the file is saved to the following directory:
C:\Documents and Settings_name\Local Settings\Temp\{GUID}\src
Here, {GUID} means the name of the temporary directory, which AQtrace Viewer creates when
Microsoft Source Server retrieves source files for an open error report. A randomly generated GUID is used
as a unique name for such a directory. This directory will be deleted along with its subdirectories and files
when you close AQtrace Viewer. Note that the hierarchy of subdirectories to which source code files are
placed repeats the tree of directories in the source control database (starting from the root directory of the
database).
The name and path of the source code file displayed in the Code Viewer panel of AQtrace Viewer is
shown at the top of the panel. To copy the path and name, select Copy from the panel's context menu.
Supported Application Types
Microsoft Source Server supports only .PDB debug information files in which source index information
is stored after module indexing (see Source Indexing for Microsoft Source Server). Thus, you can use
Microsoft Source Server only with applications developed with Microsoft Visual Studio or Delphi for
.NET. You cannot source index modules of Delphi for Win32 and C++Builder applications and retrieve their
source code for AQtrace Viewer by using Microsoft Source Server. If you want to get the source code from
your source control system while analyzing Delphi or C++Builder applications’ dumps reports, use
SmartBear Source Server.
Requirements
To use Microsoft Source Server with AQtrace Viewer, you need to have several tools in addition to
AQtrace Viewer:
●
Microsoft Debugging Tools for Windows - This collection of tools includes Microsoft Source
Server. This tool consists of executable files and Perl scripts that are used both for retrieving
source code files from source control systems and for source indexing of your application
modules.
●
Perl - To be able to run Perl scripts that are included in Debugging Tools for Windows, Perl 5.6 or
later must be installed.
To source index the modules of your application for Microsoft Source Server, you can use the
ssindex.cmd command file that is part of Microsoft Source Server and is shipped with the Microsoft
Debugging Tools for Windows package. For information on how to use this command file and about its
command line parameters, see MSDN Library (its on-line version is available at http://msdn.microsoft.com)
and the Microsoft Debugging Tools for Windows documentation. However, it is a lot easier to source index
your modules with another SmartBear’s tool:
●
Automated Build Studio 5 or later - This tool provides a lot of operations that let you easily
automate the build process of your application and perform many routine everyday tasks.
© 2011 SmartBear Software
smartbear.com/support
384
Source Server Support
Automated Build Studio includes several operations that provide support for various source control
systems and source servers. Among them you can find operations that let you easily perform
module indexing for Microsoft Source Server. In order for these operations to work properly, you
need Microsoft Debugging Tools for Windows and Perl to be installed on your computer as well.
In the Source Indexing for Microsoft Source Server help topic and the Using Source Control Systems
Supported by Microsoft Source Serve section you can find information on how to perform source indexing of
application modules for Microsoft Source Server and various source control systems using Automated Build
Studio.
AQtrace Viewer Settings
If you use Microsoft Visual SourceSafe as your source control system, you should specify certain
settings on the MS Source Server page of AQtrace Viewer’s Options dialog. To change or view these
settings, you should select Options | Options from the main menu of AQtrace Viewer and switch to the
General | MS Source Server page in the ensuing Options dialog. On this page, in the MS Visual
SourceSafe setting group, specify the following settings required for using Microsoft Visual SourceSafe:
●
User - Specifies the user’s login used to connect to the Visual SourceSafe database.
●
Password - Specifies the user's password needed to connect to the database.
If you use some other supported source control system (for instance, Perforce), there is no need to
specify any parameters in AQtrace Viewer options to connect to the repository. Connection information for
other source control databases is included along with the source index information in .PDB files once they
are indexed.
Source Indexing for Microsoft Source Server
To be able to use Microsoft Source Server for retrieving appropriate versions of source files, the modules
of your application should be source indexed. This means that you should define which version of source
code files corresponds to each build of your application.
Microsoft Source Server uses .PDB debug information files for module indexing. So, your application
should be compiled with debug information (see Compiling Applications With Debug Information).
Furthermore, Microsoft Source Server can index only .PDB debug information files, so, you can use
Microsoft Source Server only with those applications that were developed with Microsoft Visual
Studio or Delphi for .NET.
During source indexing, Microsoft Source Server reads the list of the source files that were used for
compilation of the application’s modules from the corresponding .PDB file and appends a special source
index segment to this debug information file. This segment contains information needed to obtain these
source files from the source control system, including the versions of the files that correspond to the current
build of the application. To distinguish the versions of the source files in the source control system,
Microsoft Source Server uses the labels from the source control database.
To source index your application’s .PDB files, you can use the Automated Build Studio application by
SmartBear Software. This is a build and release management system that lets you easily automate software
builds and build-related tasks as well as routine everyday tasks. Automated Build Studio provides several
operations used to source index .PDB files to be used by Microsoft Source Server. These operations are
included in the Microsoft Source Server category of Automated Build Studio’s operations. Each of the
operations is used for a certain source control system supported by Microsoft Source Server. The operations
are listed below:
●
Index PDB Files for VSS
smartbear.com
AQtrace by SmartBear Software
Using Microsoft Source Server
●
Index PDB Files for Subversion
●
Index PDB Files for Perforce
●
Index PDB Files for CVS
385
In order to use any of these operations, you must specify certain parameters. On the Index PDB Files
For…Details page of the Operation Properties dialog, you need to specify the following properties of the
operation (to display this dialog, just double-click the operation in your Automated Build Studio macro):
●
INI File - Specifies the path to the srcsrv.ini file. This file contains various settings for Microsoft
Source Server. Usually, the sample srcsrv.ini file is installed along with Microsoft Source Server.
The file resides in the directory along with the other source server tools (for instance, <Debugging
Tools for Windows>\srcsrv\srcsrv.ini). In this file, you should specify the path to your source
control database. For example:
MYSERVER=machine.corp.company.com:1666
-- for Perforce
-- or -MYSERVER=\\sourceserver\sources
-- for Visual SourceSafe
Different source control systems require different path formats (see the sample srcsrv.ini file,
which is installed along with Microsoft Source Server).
●
Sources Root - Specifies the folder (on a local hard drive) that holds a local copy of source files.
For instance, C:\Sources.
●
Symbols Root - Specifies the folder (on a local hard drive) that holds the .PDB files to be indexed.
For instance, C:\Symbols.
In addition to these common properties, you must specify the parameters needed to connect to your
source control system (for instance, the user name and password) and the label of the files that should be
indexed. These parameters differ from each other depending on the type of the source control system. See
Using Source Control Systems Supported by Microsoft Source Server for more information on how you can
use Microsoft Source Server with the supported source control systems and what parameters you should
specify for these Automated Build Studio operations.
In order to use these operations, you must specify the path to the Microsoft Source Server Indexing
command file (ssindex.cmd) in the Tools dialog of Automated Build Studio. To open the dialog,
select Options | Tools from the main menu of Automated Build Studio. The ssindex.cmd utility
usually resides in the directory where Microsoft Source Server tools are installed (for instance,
<Debugging Tools for Windows>\srcsrv\ssindex.cmd).
After you specify all the required parameters of the operation needed for your source control system, run
the Automated Build Studio macro holding this operation. If the operation is executed successfully, the .PDB
files will contain source index information.
Note that Automated Build Studio is used to automatically build applications and perform various
operations during the build process. So, it is very convenient to automatically index every build of your
application during the build process by using one of the operations mentioned above.
Using Source Control Systems Supported by Microsoft Source Server
Using Microsoft Visual SourceSafe With Microsoft Source Server
© 2011 SmartBear Software
smartbear.com/support
386
Source Server Support
If you use Microsoft Visual SourceSafe as a source control system to store the source files of your
application and you want to retrieve the actual versions of source files while analyzing the application’s
dump reports, you should use the Index PDB Files for VSS operation in Automated Build Studio for source
indexing of .PDB files (see Using Microsoft Source Server - Overview). You can find this operation in the
Microsoft Source Server operation category on the Operations panel of Automated Build Studio.
In order to use this operation, you should specify the path to the Microsoft Source Server Indexing
command file (ssindex.cmd) in the Tools dialog of Automated Build Studio. To display this dialog,
select Options | Tools from the main menu.
The most important thing that should be done to retrieve source code files from the source control system
via Microsoft Source Server is to perform source indexing of .PDB files. You should index every build of
your application if you want to view the exact versions of the source code in AQtrace Viewer. Otherwise, if
you do not index a build, AQtrace Viewer will get a local copy of the source files when it opens a dump
report generated by this build, and this local copy may not correspond to the version of the files that were
used during compilation of the build. So, you may be confused when analyzing the report. To index a build
of your application for Microsoft Visual SourceSafe, do the following:
1. Compile your application with debug information (to learn how to do this, see Compiling
Applications With Debug Information).
2. Check in the source files of your application to the Visual SourceSafe database.
3. Specify a unique label for this version of the source files in the source control system (for instance,
you can specify the VERSION_1_10 label for the 1.10 build number of your application). This
label will be used to retrieve this version of the files from Visual SourceSafe via Microsoft Source
Server.
4. In Automated Build Studio, create a new macro or open an existing one. Add the Index PDB Files
for VSS operation to the macro (you can find it in the Microsoft Source Server operation
category).
5. Double-click the operation in the macro. In the ensuing Operation Properties dialog, you should
specify the properties required for source indexing. Go to the Index PDB Files for VSS Details
tabbed page and specify the following options:
●
INI File - Specifies the path to the srcsrv.ini file. This file contains various settings for
Microsoft Source Server. Usually, the sample srcsrv.ini file is installed along with Microsoft
Source Server. It resides in the directory containing the other source server tools (for instance,
<Debugging Tools for Windows>\srcsrv\srcsrv.ini). In this file you should specify the path to
your source control database. For example:
MYSERVER=\\sourceserver\sources
●
Sources Root - Specifies the folder (on a local hard drive) that holds a local copy of the source
files. For instance, C:\Sources.
●
Symbols Root - Specifies the folder (on a local hard drive) that holds the .PDB files to be
indexed. For instance, C:\Symbols.
Go to the VSS Options tabbed page and specify the following parameters:
●
Database - Specifies the path to the Microsoft Visual SourceSafe database.
●
Login and Password - These parameters specify the user name and password used to connect
to the VSS database. If both parameters are omitted, the operation will use the login and
password of the user who is currently logged in to Windows.
●
Project - The name and path to the project stored in the Visual SourceSafe database. For
smartbear.com
AQtrace by SmartBear Software
Using Microsoft Source Server
387
instance: $/Sources/CppProject.
The database directory specified by this path must correspond hierarchically to the
directory containing the local copy of the source files (you specified this directory in
the Sources Root parameter of the operation).
●
Label - Specifies the label of the files stored in the VSS database. This label should be used for
indexing, and it must be the same label that you specified for the source files in the VSS
database (for instance, the VERSION_1_10 label). After indexing, the version of the source
files that have this label will correspond to the build of the application that you are going to
index.
These parameters are required for successful source indexing. There are also some other tabbed
pages with other operation parameters in the Operation Properties dialog, but they are optional.
For more information on the operation, see Automated Build Studio's documentation.
6. After you have specified the parameters, run the macro.
If the operation is executed successfully, the .PDB files located in the directory specified by the Symbols
Root parameter will be source indexed and you will be able to use them with Microsoft Source Server to
retrieve the source files from your VSS database.
Using Subversion With Microsoft Source Server
If you use Subversion as a source control system to store the source files of your application and you
want to retrieve the actual versions of source files while analyzing the application’s dump reports, you
should use the Index PDB Files for Subversion operation in Automated Build Studio for source indexing of
.PDB files (see Using Microsoft Source Server - Overview). You can find this operation in the Microsoft
Source Server operation category on the Operations panel of Automated Build Studio.
In order to use this operation, you should specify the path to the Microsoft Source Server Indexing
command file (ssindex.cmd) and the path to the Subversion client executable (svn.exe) in the Tools
dialog of Automated Build Studio. To display this dialog, select Options | Tools from the main
menu.
The most important thing that should be done to retrieve source code files from the source control system
via Microsoft Source Server is to perform source indexing of .PDB files. You should index every build of
your application if you want to view the exact versions of the source code in AQtrace Viewer. Otherwise, if
you do not index a build, AQtrace Viewer will get a local copy of the source files when it opens a dump
report generated by this build, and this local copy may not correspond to the version of the files that were
used during compilation of the build. So, you may be confused when analyzing the report. To index a build
of your application for Subversion, do the following:
1. Compile your application with debug information (to learn how to do this, see Compiling
Applications With Debug Information).
2. Commit the changes you have made in the source files of your application to your Subversion
repository.
3. In Automated Build Studio, create a new macro or open an existing one. Add the Index PDB Files
for Subversion operation to the macro (you can find it in the Microsoft Source Server operation
category).
4. Double-click the operation in the macro. In the ensuing Operation Properties dialog, you should
© 2011 SmartBear Software
smartbear.com/support
388
Source Server Support
specify the properties required for source indexing. Go to the Index PDB Files for Subversion
Details tabbed page and specify the following options:
●
INI File - Specifies the path to the srcsrv.ini file. This file contains various settings for
Microsoft Source Server. Usually, the sample srcsrv.ini file is installed along with Microsoft
Source Server and resides in the directory containing the other source server tools (for
instance, <Debugging Tools for Windows>\srcsrv\srcsrv.ini).
●
Sources Root - Specifies the folder (on a local hard drive) that holds a local copy of the source
files. For instance, C:\Sources.
●
Symbols Root - Specifies the folder (on a local hard drive) that holds the .PDB files to be
indexed. For instance, C:\Symbols.
Go to the Subversion Options tabbed page and specify the following parameters:
●
User Name and Password - These parameters specify the user name and password used to
connect to the Subversion server. If your server allows anonymous access, you can omit these
parameters.
●
Revision - Specifies the revision of the files you want to index. If this parameter is omitted, the
operation indexes the head revision of the files, that is, the latest version of the files stored in
the repository.
In the Index PDB Files for Subversion operation, you can use only revision
numbers to specify file versions in the Subversion repository. Revision keywords and
revision dates are not allowed for this operation.
These parameters are required for successful source indexing. There are also some other tabbed
pages with other operation parameters in the Operation Properties dialog, but they are optional.
For more information on the operation, see Automated Build Studio's documentation.
5. After you have specified the parameters, run the macro.
If the operation is executed successfully, the .PDB files located in the directory specified by the Symbols
Root parameter will be source indexed, and you will be able to use them with Microsoft Source Server for
retrieving the source files from your Subversion repository.
Using Perforce With Microsoft Source Server
If you use Perforce as a source control system to store the source files of your application and you want
to retrieve the actual versions of source files while analyzing the application’s dump reports, you should use
the Index PDB Files for Perforce operation in Automated Build Studio for source indexing of .PDB files
(see Using Microsoft Source Server - Overview). You can find this operation in the Microsoft Source
Server operation category on the Operations panel of Automated Build Studio.
In order to use this operation, you should specify the path to the Microsoft Source Server Indexing
command file (ssindex.cmd) and the path to the Perforce client executable (P4.exe) in the Tools
dialog of Automated Build Studio. To display this dialog, select Options | Tools from the main
menu.
The most important thing that should be done to retrieve source code files from the source control system
via Microsoft Source Server is to perform source indexing of .PDB files. You should index every build of
your application if you want to view the exact versions of the source code in AQtrace Viewer. Otherwise, if
smartbear.com
AQtrace by SmartBear Software
Using Microsoft Source Server
389
you do not index a build, AQtrace Viewer will get a local copy of the source files when it opens a dump
report generated by this build, and this local copy may not correspond to the version of the files that were
used during compilation of the build. So, you may be confused when analyzing the report. To index a build
of your application for Perforce, do the following:
1. Compile your application with debug information (to learn how to do this, see Compiling
Applications With Debug Information).
2. Check in the source files of your application to your Perforce database.
3. Specify a unique label for this version of the source files in your source control system (for
instance, you can specify the VERSION_1_10 label for the 1.10 build number of your application).
This label will be used to retrieve this version of the files from Perforce via Microsoft Source
Server.
4. In Automated Build Studio, create a new macro or open an existing one. Add the Index PDB Files
for Perforce operation to the macro (you can find it in the Microsoft Source Server operation
category).
5. Double-click the operation in the macro. In the ensuing Operation Properties dialog, you should
specify the properties required for source indexing. Go to the Index PDB Files for Perforce
Details tabbed page and specify the following options:
●
INI File - Specifies the path to the srcsrv.ini file. This file contains various settings for
Microsoft Source Server. Usually, the sample srcsrv.ini file is installed along with Microsoft
Source Server and resides in the directory containing the other source server tools (for
instance, <Debugging Tools for Windows>\srcsrv\srcsrv.ini). In this file, you should specify
the network path to your Perforce version control server and the port number it uses (by
default, Perforce uses port 1666). For instance:
MYSERVER=machine.mycorp.mycompany.com:1666
●
Sources Root - Specifies the folder (on a local hard drive) that holds a local copy of the source
files. For instance, C:\Sources.
●
Symbols Root - Specifies the folder (on a local hard drive) that holds the .PDB files to be
indexed. For instance, C:\Symbols.
Go to the Perforce Options tabbed page and specify the following parameters:
●
Host - The network name of the remote computer that hosts the target Perforce server.
●
Port - The port number used to connect to the Perforce server (the default value is 1666).
●
User Name and Password - These parameters specify the user name and password used to
connect to the Perforce server.
●
Working Folder - Specifies the local folder that holds the local copies of the files stored in the
Perforce repository.
●
Label - Specifies the label of the files stored in the Perforce repository that should be used for
file indexing. It must be the same label that you specified for the source files in the Perforce
repository (for instance, the VERSION_1_10 label). After indexing, the version of the source
files that have this label in the repository will correspond to the build of the application that
you are going to index.
These parameters are required for successful source indexing. There are also some other tabbed
pages with other operation parameters in the Operation Properties dialog, but they are optional.
For more information on the operation, see Automated Build Studio's documentation.
6. After you have specified the parameters, run the macro.
If the operation is executed successfully, the .PDB files stored in the directory specified by the Symbols
© 2011 SmartBear Software
smartbear.com/support
390
Source Server Support
Root parameter will be source indexed, and you will be able to use them with Microsoft Source Server for
retrieving the source files from your Perforce repository.
Using CVS With Microsoft Source Server
If you use CVS as a source control system to store the source files of your application and you want to
retrieve the actual versions of source files while analyzing the application’s dump reports, you should use the
Index PDB Files for CVS operation in Automated Build Studio for source indexing of .PDB files (see Using
Microsoft Source Server - Overview). You can find this operation in the Microsoft Source Server operation
category on the Operations panel of Automated Build Studio.
In order to use this operation, you should specify the path to the Microsoft Source Server Indexing
command file (ssindex.cmd) and the path to the CVS client executable (cvs.exe) in the Tools dialog
of Automated Build Studio. To display this dialog, select Options | Tools from the main menu.
The most important thing that should be done to retrieve source code files from the source control system
via Microsoft Source Server is to perform source indexing of .PDB files. You should index every build of
your application if you want to view the exact versions of the source code in AQtrace Viewer. Otherwise, if
you do not index a build, AQtrace Viewer will get a local copy of the source files when it opens a dump
report generated by this build, and this local copy may not correspond to the version of the files that were
used during compilation of the build. So, you may be confused when analyzing the report. To index a build
of your application for CVS, do the following:
1. Compile your application with debug information (to learn how to do this, see Compiling
Applications With Debug Information).
2. Check in the source files of your application to the CVS repository.
3. Specify a unique tag (a label, in other words) for this version of the source files in your CVS
repository (for instance, you can specify the VERSION_1_10 tag for the 1.10 build number of your
application). This label will be used to retrieve this version of the source files from your CVS
repository via Microsoft Source Server.
4. In Automated Build Studio, create a new macro or open an existing one. Add the Index PDB Files
for CVS operation to the macro (you can find it in the Microsoft Source Server operation
category).
5. Double-click the operation in the macro to display the Operation Properties dialog. In this
dialog, you should specify the properties required for source indexing. Go to the Index PDB Files
for CVS Details tabbed page and specify the following options:
●
INI File - Specifies the path to the srcsrv.ini file. This file contains various settings for
Microsoft Source Server. Usually, the sample srcsrv.ini file is installed along with Microsoft
Source Server and resides in the directory containing the other source server tools (for
instance, <Debugging Tools for Windows>\srcsrv\srcsrv.ini). In this file, you should specify
an alias for your CVS repository. The alias will help you distinguish the repository among the
other folders on your network.
●
Sources Root - Specifies the folder (on a local hard drive) that holds a local copy of the source
files. For instance, C:\Sources.
●
Symbols Root - Specifies the folder (on a local hard drive) that holds the .PDB files to be
source indexed. For instance, C:\Symbols.
Go to the CVS Options tabbed page and specify the following parameters:
smartbear.com
AQtrace by SmartBear Software
Using Microsoft Source Server
391
●
CVS Command - Specifies the name of the client executable needed to send commands to the
CVS server. By default, it is the cvs.exe utility. If you use another utility for this purpose,
make sure it supports the same options as cvs.exe does. Otherwise, the operation will not work
correctly.
●
CVS Root - Specifies an alias for your CVS repository. The alias will help you identify the
repository on your network.
●
Label and Date - These properties specify the label (tag) or date of the files that correspond to
the build you are source indexing. These are alternative properties: you can use either the
Label or the Date property (not both). If you use the Label property, you should specify the
same tag that you specified for the source files in the CVS repository (for instance,
VERSION_1_10).
These parameters are required for successful source indexing. There are also some other tabbed
pages with other operation parameters in the Operation Properties dialog, but they are optional.
For more information on the operation, see Automated Build Studio's documentation.
6. After you have specified the parameters, run the macro.
If the operation is executed successfully, the .PDB files stored in the directory, which is specified by the
Symbols Root parameter, will be source indexed, and you will be able to use them with Microsoft Source
Server for retrieving the source files from your CVS repository.
© 2011 SmartBear Software
smartbear.com/support
392
Index
Index
.asp page ................................................... 296, 303
Description ................................................... 296
Relaying reports............................................ 297
Settings ......................................................... 303
.desc files ............................................................ 68
.dmp files ............................................................ 68
.dmpx files .......................................................... 68
.info files ............................................................. 68
.NET applications support .................................. 71
Basic concepts ................................................ 71
Creating the aqReporterInterop assembly ...... 74
Deploying .NET applications ......................... 78
Initializing AQtrace Reporter ......................... 74
Using the Reporter.......................................... 79
.NET Exceptions page ...................................... 278
A
Additional information on AQtrace .................... 14
Additional Information panel ........................... 340
Additional Reported Data page ........................ 273
ALMComplete Support plug-in........................ 308
About ............................................................ 308
Connection settings ...................................... 317
Analyzing reports with AQtrace Viewer .......... 328
Application window -- AQtrace Reporter setting
...................................................................... 273
Applying AQtrace Reporter.............................. 222
AQdevTeam Support plug-in ........................... 309
About ............................................................ 309
Configuring................................................... 310
Connection settings ...................................... 313
aqReporter.dll ........................................... 222, 226
aqReporterDLL function .......................... 245, 247
Description ................................................... 247
Source files ................................................... 245
aqReporterInterop assembly ............................... 71
About .............................................................. 71
Generating ...................................................... 74
AQtrace................................................................. 9
About ................................................................ 9
Checking for updates .................................... 371
Community site .............................................. 14
Components .................................................... 19
FAQ ................................................................ 14
smartbear.com
Forums ............................................................14
Getting started.................................................54
Getting started tutorial ....................................18
Getting support ...............................................14
Introducing........................................................9
Packager command line ................................269
Samples...........................................................15
Supported applications ...................................12
System requirements.......................................11
Technical support ...........................................14
Testing ............................................................69
Transferring data.............................................87
Using of ..........................................................67
Utilities ...........................................................67
AQtrace Module Store ......................................211
About ............................................................211
Command line...............................................217
Description of the main window...................211
User interface................................................211
Using.............................................................214
AQtrace Module Store Agent ...........................219
About ............................................................219
Settings .........................................................304
Using.............................................................219
AQtrace Module Store Agent Settings page .....304
AQtrace Packager .............................................263
About ............................................................263
Command line...............................................269
Exit codes .....................................................269
Settings pages ...............................................270
Using with .NET applications.......................266
Using with native applications......................263
AQtrace Report Monitor ................... 286, 288, 294
About ............................................................286
Command line...............................................294
Configuring...................................................288
Distributing ...................................................226
System requirements.......................................11
Window description ......................................287
AQtrace Reporter ..............................................222
.NET applications -- Using with .....................71
About ............................................................222
Basic concepts ..............................................222
Controlling DLL loading ..............................240
AQtrace by SmartBear Software
Using Microsoft Source Server
Data to be included in reports ....................... 235
Disabling AQtrace Reporter ......................... 256
Distributing ................................................... 226
Enabling AQtrace Reporter .......................... 256
Generating reports on demand...................... 258
Getting program reference to........................ 247
Implementing custom exception filters ........ 255
Initializing in .NET applications .................... 74
Inserting custom data into reports ................ 260
Locking AQtrace Reporter ........................... 256
Notification window ..................................... 237
Packager ....................................................... 263
Programming ................................................ 243
Selecting transfer protocol .............................. 99
Sending data ................................................... 87
Settings ......................................................... 270
Specifying data to be included in reports ..... 235
Specifying exceptions to be traced ............... 228
Specifying modules to be traced................... 233
System requirements ...................................... 11
Testing ............................................................ 69
Tracing exceptions in mixed code ................ 228
Unlocking AQtrace Reporter ........................ 256
Using ............................................................ 222
Using in .NET applications ............................ 79
Using multiple protocols .............................. 101
Working under debugger .............................. 228
AQtrace Server Config ..................................... 301
About ............................................................ 301
AQtrace Module Store Agent settings page . 304
AQtrace Service settings page ...................... 304
Common Settings page ................................. 302
Report Collector settings page ...................... 303
AQtrace server-side components ...................... 296
.asp page ....................................................... 296
AQtrace Service............................................ 299
Issue-tracking plug-ins ................................. 305
Module Store Agent ..................................... 219
Report Collector ........................................... 296
Sending mode requirements ........................... 88
AQtrace Service................................................ 299
About ............................................................ 299
Configuring........................................... 299, 300
Description ................................................... 299
Settings page................................................. 304
Specifying path to modules .......................... 300
System requirements ...................................... 11
Working via COM ........................................ 319
AQtrace Service Settings page ......................... 304
AQtrace Viewer ................................................ 327
About ............................................................ 327
© 2011 SmartBear Software
393
Analyzing reports with .................................328
Command line...............................................370
Panels ............................................................339
Specifying path to modules ..........................337
System requirements.......................................11
User interface................................................327
Working with ................................................328
aqtSupportVB.dll module ...........................70, 222
ASP page ..................................................296, 303
Description....................................................296
Relaying reports ............................................297
Settings .........................................................303
AutomatedQA AQdevTeam Support plug-in ...309
About ............................................................309
Configuring...................................................310
B
Basic (Visual Basic) ........... 70, 113, 185, 196, 198
Preparing Visual Basic 6 applications for
AQtrace .....................................................113
Preparing Visual Basic 7.x applications for
AQtrace .....................................................185
Specifying version number for Visual Basic
2005 applications ......................................196
Specifying version number for Visual Basic
2008 applications ......................................196
Specifying version number for Visual Basic
2010 applications ......................................196
Specifying version number for Visual Basic 6.0
applications ...............................................198
Specifying version number for Visual Basic 7.x
applications ...............................................198
Support for VB 6 applications in AQtrace .....70
Borland C++Builder ................. 164, 167, 204, 205
Preparing C++Builder 2006 applications for
AQtrace .....................................................164
Preparing C++Builder applications for AQtrace
..................................................................167
Specifying version number for C++Builder
2006 applications ......................................204
Specifying version number for C++Builder
applications ...............................................205
Borland Delphi ......... 136, 140, 191, 201, 202, 203
Building with external debug information ....169
Preparing Delphi 2005 for .NET applications
for AQtrace ...............................................191
Preparing Delphi 2005 for Win32 applications
for AQtrace ...............................................136
Preparing Delphi 2006 for .NET applications
for AQtrace ...............................................191
smartbear.com/support
394
Preparing Delphi 2006 for Win32 applications
for AQtrace ............................................... 136
Preparing Delphi applications for AQtrace .. 140
Specifying version number ........................... 203
Specifying version number for Delphi 2005 and
2006 .NET applications ............................ 202
Specifying version number for Delphi 2005 and
2006 Win32 applications .......................... 201
Bugzilla Support plug-in .................................. 306
About ............................................................ 306
Configuring................................................... 310
Connection settings ...................................... 315
Build number .................................................... 194
About specifying of ...................................... 194
C++Builder 2006 applications ...................... 204
C++Builder 2007 applications ...................... 204
C++Builder 2009 applications ...................... 204
C++Builder 2010 applications ...................... 204
C++Builder applications............................... 205
C++Builder XE applications ........................ 204
Delphi 2005 - 2007 and 2009 .NET applications
.................................................................. 202
Delphi 2005 – 2007, 2009, 2010 and XE Win32
applications ............................................... 201
Delphi applications ....................................... 203
Visual Basic 2005 applications..................... 196
Visual Basic 2008 applications..................... 196
Visual Basic 2010 applications..................... 196
Visual Basic 6.0 applications ....................... 198
Visual Basic 7.x applications ....................... 198
Visual C# 2005 applications ......................... 199
Visual C# 2008 applications ......................... 199
Visual C# 2010 applications ......................... 199
Visual C# 7.x applications ............................ 200
Visual C++ applications ............................... 195
Build storage..................................................... 207
About ............................................................ 207
Basic concepts .............................................. 207
Checking links in configuration files............ 214
Configuration files ........................................ 207
Modifying configuration files....................... 214
Updating configuration files ......................... 219
Build storage file name -- AQtrace Service setting
...................................................................... 304
Build storage file name -- Module Store Agent
setting ........................................................... 304
Build storage file name -- Setting ..................... 302
C
C# ............................................. 172, 175, 199, 200
smartbear.com
Index
Preparing Visual C# 2005 applications for
AQtrace .....................................................172
Preparing Visual C# 2008 applications for
AQtrace .....................................................172
Preparing Visual C# 2010 applications for
AQtrace .....................................................172
Preparing Visual C# 7.x applications for
AQtrace .....................................................175
Specifying version number for Visual C# 2005
applications ...............................................199
Specifying version number for Visual C# 2008
applications ...............................................199
Specifying version number for Visual C# 2010
applications ...............................................199
Specifying version number for Visual C# 7.x
applications ...............................................200
C++ .. 104, 107, 110, 144, 149, 154, 159, 164, 167,
169, 176, 179, 204, 205
Preapring Intel C++ applications for AQtrace
..................................................................169
Preparing Borland C++Builder 2006
applications for AQtrace ...........................164
Preparing Borland C++Builder applications for
AQtrace .....................................................167
Preparing CodeGear C++Builder 2007
applications for AQtrace ...........................159
Preparing CodeGear C++Builder 2009
applications for AQtrace ...........................154
Preparing Embarcadero C++Builder 2010
applications for AQtrace ...........................149
Preparing Embarcadero C++Builder XE
applications for AQtrace ...........................144
Preparing Visual C++ 2005 applications for
AQtrace .............................................104, 176
Preparing Visual C++ 2008 applications for
AQtrace .............................................104, 176
Preparing Visual C++ 2010 applications for
AQtrace .............................................104, 176
Preparing Visual C++ 6 (or earlier) applications
for AQtrace ...............................................110
Preparing Visual C++ 7.x applications for
AQtrace .............................................107, 179
Specifying version number for C++Builder
2006 applications ......................................204
Specifying version number for C++Builder
2007 applications ......................................204
Specifying version number for C++Builder
2009 applications ......................................204
Specifying version number for C++Builder
2010 applications ......................................204
AQtrace by SmartBear Software
Using Microsoft Source Server
Specifying version number for C++Builder
applications ............................................... 205
Specifying version number for C++Builder XE
applications ............................................... 204
C++ Exceptions page........................................ 278
C++Builder ...... 144, 149, 154, 159, 164, 167, 204,
205
Preparing C++Builder 2006 applications for
AQtrace..................................................... 164
Preparing C++Builder 2007 applications for
AQtrace..................................................... 159
Preparing C++Builder 2009 applications for
AQtrace..................................................... 154
Preparing C++Builder 2010 applications for
AQtrace..................................................... 149
Preparing C++Builder applications for AQtrace
.................................................................. 167
Preparing C++Builder XE applications for
AQtrace..................................................... 144
Specifying version number for C++Builder
2006 applications ...................................... 204
Specifying version number for C++Builder
2007 applications ...................................... 204
Specifying version number for C++Builder
2009 applications ...................................... 204
Specifying version number for C++Builder
2010 applications ...................................... 204
Specifying version number for C++Builder
applications ............................................... 205
Specifying version number for C++Builder XE
applications ............................................... 204
C++Builder Exceptions page ............................ 279
Cache symbol directory .................................... 304
AQtrace Service setting ................................ 304
Call Stack panel ................................................ 345
CaqReporterIntf class ............................... 245, 252
Description ................................................... 252
Source file..................................................... 245
Catch -- Tracing exceptions in try-catch blocks . 13
Checking for updates ........................................ 371
Code Viewer panel ........................................... 347
About ............................................................ 347
CodeGear C++Builder ...................... 154, 159, 204
Preparing C++Builder 2007 applications for
AQtrace..................................................... 159
Preparing C++Builder 2009 applications for
AQtrace..................................................... 154
Specifying version number for C++Builder
2007 applications ...................................... 204
Specifying version number for C++Builder
2009 applications ...................................... 204
© 2011 SmartBear Software
395
CodeGear Delphi ...... 125, 130, 188, 189, 201, 202
Building with external debug information ....169
Preparing Delphi 2007 applications for AQtrace
..................................................................130
Preparing Delphi 2007 for .NET applications
for AQtrace ...............................................189
Preparing Delphi 2009 applications for AQtrace
..................................................................125
Preparing Delphi 2009 for .NET applications
for AQtrace ...............................................188
Specifying version number for Delphi 2007 and
2009 .NET applications ............................202
Specifying version number for Delphi 2007 and
2009 Win32 applications ..........................201
Collector ...........................................................296
About ............................................................296
Description....................................................296
Relaying reports ............................................297
Settings .........................................................303
System requirements.......................................11
COM -- Working with report storage via COM
......................................................................319
About ............................................................319
Description....................................................319
Command line........................... 169, 269, 294, 370
AQtrace Module Store utility .......................217
AQtrace Packager .........................................269
AQtrace Report Monitor ...............................294
AQtrace Viewer ............................................370
Command line of the StripTDS utility..........169
Common Settings page .....................................302
Company name -- AQtrace Reporter setting ....272
Compiler settings ..... 104, 107, 110, 113, 114, 120,
125, 130, 136, 140, 144, 149, 154, 159, 164,
167, 169, 172, 175, 176, 179, 182, 185, 188,
189, 191
Borland C++Builder .....................................167
Borland C++Builder 2006 ............................164
Borland Delphi .............................................140
Borland Delphi 2005 for .NET .....................191
Borland Delphi 2005 for Win32 ...................136
Borland Delphi 2006 for .NET .....................191
Borland Delphi 2006 for Win32 ...................136
CodeGear C++Builder 2007 .........................159
CodeGear C++Builder 2009 .........................154
CodeGear Delphi 2007 .................................130
CodeGear Delphi 2007 for .NET ..................189
CodeGear Delphi 2009 .................................125
CodeGear Delphi 2009 for .NET ..................188
Embarcadero C++Builder 2010 ....................149
Embarcadero C++Builder XE ......................144
smartbear.com/support
396
Embarcadero Delphi 2010 ............................ 120
Embarcadero Delphi XE............................... 114
Intel C++....................................................... 169
Microsoft Visual Basic ................................. 113
Microsoft Visual Basic 2005 ........................ 182
Microsoft Visual Basic 2008 ........................ 182
Microsoft Visual Basic 2010 ........................ 182
Microsoft Visual Basic 7.x ........................... 185
Microsoft Visual C# 2005 ............................ 172
Microsoft Visual C# 2008 ............................ 172
Microsoft Visual C# 2010 ............................ 172
Microsoft Visual C# 7.x ............................... 175
Microsoft Visual C++ 2005 .................. 104, 176
Microsoft Visual C++ 2008 .................. 104, 176
Microsoft Visual C++ 2010 .................. 104, 176
Microsoft Visual C++ 6 or earlier ................ 110
Microsoft Visual C++ 7.x ..................... 107, 179
Configuration .NET projects (AQtrace Packager)
...................................................................... 266
Configuration files -- Build storage .......... 207, 211
Configuration native projects (AQtrace Packager)
...................................................................... 263
Configuring............................... 222, 300, 303, 304
AQtrace Module Store Agent ....................... 304
AQtrace Reporter.......................................... 222
AQtrace Service.................................... 300, 304
Report Collector ........................................... 303
Server-side plug-ins ...................................... 310
Control DLL Loading page (AQtrace Packager)
...................................................................... 283
Controlling DLL loading .................................. 240
Custom data -- Including into reports ............... 260
Binary data.................................................... 260
Textual data .................................................. 261
Custom exception filters ................................... 228
About ............................................................ 228
Implementing................................................ 255
CVS -- Using with Microsoft Source Server .... 390
Using with Microsoft Source Server ............ 390
D
Data to be included in reports ................... 235, 260
Custom binary data ....................................... 260
Custom textual data ...................................... 261
Data transferring ................................................. 87
Basic Concepts ............................................... 87
Report relaying ............................................. 297
dbghelp.dll ........................................................ 222
Debug information............................................ 103
Debug messages ............................................... 242
Debugger -- Working under ............................. 228
smartbear.com
Index
Deleting error reports from storage ....................68
Delphi ...... 114, 120, 125, 130, 136, 140, 188, 189,
191, 201, 202, 203
Building with external debug information ....169
Preparing Delphi 2005 for .NET applications
for AQtrace ...............................................191
Preparing Delphi 2005 for Win32 applications
for AQtrace ...............................................136
Preparing Delphi 2006 for .NET applications
for AQtrace ...............................................191
Preparing Delphi 2006 for Win32 applications
for AQtrace ...............................................136
Preparing Delphi 2007 applications for AQtrace
..................................................................130
Preparing Delphi 2007 for .NET applications
for AQtrace ...............................................189
Preparing Delphi 2009 applications for AQtrace
..................................................................125
Preparing Delphi 2009 for .NET applications
for AQtrace ...............................................188
Preparing Delphi 2010 applications for AQtrace
..................................................................120
Preparing Delphi applications for AQtrace ..140
Preparing Delphi XE applications for AQtrace
..................................................................114
Specifying version number for Delphi 2005 2007 and 2009 .NET applications ............202
Specifying version number for Delphi 2005 –
2007, 2009, 2010 and XE Win32
applications ...............................................201
Specifying version number for Delphi
applications ...............................................203
Delphi Exceptions page ....................................279
desc files .............................................................68
Dirty Stack -- About .........................................345
Disabling AQtrace Reporter .............................256
Disassembly panel ............................................350
Disassembly toolbar .........................................350
Display devices information -- AQtrace Reporter
setting............................................................273
Distributing AQtrace Reporter modules ...........226
DLLs -- Controlling the injection of .................240
dmp files .............................................................68
dmpx files ...........................................................68
Duplicated reports -- Determining ....................299
duplicatestorage.dat file ......................................68
E
Embarcadero C++Builder ................. 144, 149, 204
Preparing C++Builder 2010 applications for
AQtrace .....................................................149
AQtrace by SmartBear Software
Using Microsoft Source Server
Preparing C++Builder XE applications for
AQtrace..................................................... 144
Specifying version number for C++Builder
2010 applications ...................................... 204
Specifying version number for C++Builder XE
applications ............................................... 204
Embarcadero Delphi
Specifying version number for Delphi 2010 and
XE applications ........................................ 201
Embarcadero Delphi ......................... 114, 120, 201
Preparing Delphi 2010 applications for AQtrace
.................................................................. 120
Preparing Delphi XE applications for AQtrace
.................................................................. 114
Enabling AQtrace Reporter .............................. 256
Error reports...................................................... 235
Analyzing reports with AQtrace Viewer ...... 328
Data included in reports................................ 235
Deleting from storage ..................................... 68
Determining duplicated reports .................... 299
Relaying........................................................ 297
Selecting transfer protocol .............................. 99
Sending reports ............................................... 87
Specifying data to be included in reports ..... 235
Using multiple protocols .............................. 101
Event log -- AQtrace Reporter setting .............. 273
Event Log panel................................................ 352
Event Log toolbar ............................................. 352
Examples ............................................................ 15
Exception Filter Mode page ............................. 277
Exception filters................................................ 228
Exceptions ........................................................ 228
Exception filters............................................ 228
Ignored exceptions........................................ 228
Language exceptions .................................... 228
Last-raised exceptions .................................. 235
OS exceptions ............................................... 228
Traced exceptions ........................................... 13
Tracing exceptions in try-catch blocks ........... 13
Tracing in .NET applications ......................... 71
Tracing in mixed code .................................. 228
Types of exceptions ...................................... 228
Exit codes ................................................. 169, 269
AQtrace Packager ......................................... 269
StripTDS utility ............................................ 169
Extensions......................................................... 370
F
FAQ .................................................................... 14
Filter Mode page............................................... 277
Filter Settings page ........................................... 280
© 2011 SmartBear Software
397
Filters ........................................................228, 233
Custom exception filters ...............................228
Exception filters ............................................228
Inverting filters .....................................228, 233
Module filters ...............................................233
Folder -- AQtrace Reporter setting ...................273
Forums about AQtrace........................................14
Forwarding reports ...........................................297
Frequently asked questions .................................14
G
Generating reports on demand ..........................258
Getting program reference to AQtrace Reporter
......................................................................247
In .NET applications .....................................252
In native applications ....................................247
Getting Started tutorial .......................................18
Getting support ...................................................14
H
Hard drives information -- AQtrace Reporter
setting............................................................273
I
Ignore debugger setting ....................................273
Ignored exceptions ............................................228
Implementing custom exception filters ............255
info files ..............................................................68
Information on AQtrace......................................14
Information to be included in reports .......235, 260
Custom binary data .......................................260
Custom textual data ......................................261
Specifying .....................................................235
Initial storage ......................................................19
Initial storage folder -- AQtrace Service setting
......................................................................304
Injecting DLLs -- Controlling...........................240
Installed programs information -- AQtrace
Reporter setting.............................................273
Installing extensions .........................................370
Intel C++ -- Preparing Intel C++ applications for
AQtrace.........................................................169
Inverting filters .........................................228, 233
IsBadCodePtr ....................................................228
IsBadHugeReadPtr ...........................................228
IsBadHugeWritePtr ..........................................228
IsBadReadPtr ....................................................228
IsBadStringPtrA................................................228
IsBadStringPtrW...............................................228
IsBadWritePtr ...................................................228
smartbear.com/support
398
Issue-tracking plug-ins ..................................... 305
About ............................................................ 305
ALMComplete support ................................. 308
AQdevTeam support .................................... 309
Bugzilla support............................................ 306
JIRA support................................................. 307
Team System support ................................... 306
Issue-tracking support ...................................... 305
About ............................................................ 305
ALMComplete Support plug-in.................... 308
AQdevTeam Support plug-in ....................... 309
Bugzilla Support plug-in .............................. 306
JIRA Support plug-in ................................... 307
Team System Support plug-in ...................... 306
J
JIRA Support plug-in ....................................... 307
About ............................................................ 307
Connection settings ...................................... 316
L
Language exceptions ........................................ 228
Last exceptions ................................................. 235
Including information in reports ................... 235
Last exceptions data -- AQtrace Reporter setting
...................................................................... 273
Last Exceptions panel ....................................... 356
About ............................................................ 356
User-defined debug messages ...................... 242
Last Exceptions toolbar .................................... 356
Last-raised exceptions .............................. 235, 242
Including information in reports ................... 235
User-defined debug messages ...................... 242
Limitations -- Processing non-interactive
applications ..................................................... 80
Limitations -- Support for Visual Basic
applications ..................................................... 70
Locking AQtrace Reporter ............................... 256
M
Memory information - AQtrace Reporter setting
...................................................................... 273
Memory panels ................................................. 357
Memory toolbars .............................................. 357
Microsoft Source Server ................... 382, 384, 385
Overview ...................................................... 382
Source indexing ............................................ 384
Supported source control systems ................ 385
Microsoft Team System Support plug-in . 306, 310
About ............................................................ 306
smartbear.com
Index
Configuring...................................................310
Connection settings.......................................315
Microsoft Visual Basic70, 113, 182, 185, 196, 198
Preparing VB 6 applications for AQtrace .....113
Preparing Visual Basic 2005 applications for
AQtrace .....................................................182
Preparing Visual Basic 2008 applications for
AQtrace .....................................................182
Preparing Visual Basic 2010 applications for
AQtrace .....................................................182
Preparing Visual Basic 7.x applications for
AQtrace .....................................................185
Specifying version number for Visual Basic
2005 applications ......................................196
Specifying version number for Visual Basic
2008 applications ......................................196
Specifying version number for Visual Basic
2010 applications ......................................196
Specifying version number for Visual Basic 6.0
applications ...............................................198
Specifying version number for Visual Basic 7.x
applications ...............................................198
Support for VB 6 applications in AQtrace .....70
Microsoft Visual C# ................. 172, 175, 199, 200
Preparing Visual C# 2005 applications for
AQtrace .....................................................172
Preparing Visual C# 2008 applications for
AQtrace .....................................................172
Preparing Visual C# 2010 applications for
AQtrace .....................................................172
Preparing Visual C# 7.x applications for
AQtrace .....................................................175
Specifying version number for Visual C# 2005
applications ...............................................199
Specifying version number for Visual C# 2008
applications ...............................................199
Specifying version number for Visual C# 2010
applications ...............................................199
Specifying version number for Visual C# 7.x
applications ...............................................200
Microsoft Visual C++ ...... 104, 107, 110, 176, 179,
195
Preparing Visual C++ 2005 applications for
AQtrace .............................................104, 176
Preparing Visual C++ 2008 applications for
AQtrace .............................................104, 176
Preparing Visual C++ 2010 applications for
AQtrace .............................................104, 176
Preparing Visual C++ 6 (or earlier) applications
for AQtrace ...............................................110
AQtrace by SmartBear Software
Using Microsoft Source Server
Preparing Visual C++ 7.x applications for
AQtrace............................................. 107, 179
Specifying version number ........................... 195
Microsoft Visual SourceSafe .................... 377, 385
Using with Microsoft Source Server ............ 385
Using with SmartBear Source Server ........... 377
Mixed code in applications -- Tracing exceptions
...................................................................... 228
Module filter ..................................................... 233
Module Filter Settings page.............................. 280
Module Information page ................................. 271
Module storage folder path list -- Module Store
Agent setting................................................. 304
Module Store .................................................... 211
About ............................................................ 211
Command line .............................................. 217
Using ............................................................ 214
Module Store Agent ......................................... 219
About ............................................................ 219
Settings page................................................. 304
Using ............................................................ 219
Modules .................................................... 233, 359
Panel (AQtrace Viewer) ............................... 359
Specifying modules to be traced................... 233
Modules panel .................................................. 359
MS Source Server ............................. 382, 384, 385
Overview ...................................................... 382
Source indexing ............................................ 384
Supported source control systems ................ 385
N
Network information -- AQtrace Reporter setting
...................................................................... 273
Non-interactive processes support ...................... 80
Notification settings page ................................. 281
Notification window ................................. 237, 281
Handling the chosing of................................ 259
Settings ......................................................... 281
Working with ................................................ 237
O
Options ..................................... 263, 303, 304, 310
AQtrace Reporter.......................................... 263
Issue-tracking support plug-ins .................... 310
Report Collector ........................................... 303
Organizing build storage .................................. 207
About ............................................................ 207
Basic concepts .............................................. 207
OS exceptions ................................................... 228
OS Exceptions page .......................................... 277
OS information -- AQtrace Reporter setting .... 273
© 2011 SmartBear Software
399
Output panel .....................................................360
P
Packager............................................................263
About ............................................................263
Command line...............................................269
Exit codes .....................................................269
Settings pages ...............................................270
Using with .NET applications.......................266
Using with native applications......................263
Parameters ........................................ 217, 269, 370
Command-line arguments for AQtrace Module
Store ..........................................................217
Command-line arguments for AQtrace Viewer
..................................................................370
Command-line arguments for AQtracve
Packager....................................................269
Path to modules -- Specifying...................300, 337
for AQtrace Service ......................................300
for AQtrace Viewer ......................................337
Perforce.....................................................380, 388
Using with Microsoft Source Server ............388
Using with SmartBear Source Server ...........380
Persistent storage ........................................68, 319
About ..............................................................68
Deleting reports ..............................................68
Programming ................................................319
Structure..........................................................68
Persistent storage folder..............................68, 304
Setting ...........................................................304
Structure..........................................................68
Plug-ins ............................................. 305, 310, 370
About server-side plug-ins............................305
ALMComplete support .................................308
AQdevTeam support.....................................309
Bugzilla support............................................306
Configuring server-side plug-ins ..................310
Installing extensions in AQtrace Viewer ......370
JIRA support .................................................307
Team System support ...................................306
Preparing applications for AQtrace ..................103
Printers information -- AQtrace Reporter setting
......................................................................273
Privileges information -- AQtrace Reporter setting
......................................................................273
Processes information -- AQtrace Reporter setting
......................................................................273
Product identifier -- AQtrace Reporter setting .272
Product Information page .................................272
Product name -- AQtrace Reporter setting .......272
Programming AQtrace Reporter .......................243
smartbear.com/support
400
Enabling and disabling AQtrace Reporter .... 256
Generating reports on demand...................... 258
Getting reference to the AQtrace Reporter
object ........................................................ 247
Implementing custom exception filters ........ 255
Inserting custom data into reports ................ 260
Overview ...................................................... 243
Performing specific actions upon closing the
notification window .................................. 259
SDK files ...................................................... 245
Programming report storage ............................. 319
Description ................................................... 319
Samples ........................................................ 319
Protocols ............................................... 87, 99, 101
Requirements .................................................. 88
Selecting ......................................................... 99
Settings ........................................................... 82
Using multiple protocols .............................. 101
Protocols settings ................................................ 82
E-mail ............................................................. 84
FTP ................................................................. 86
HTTP .............................................................. 83
HTTPS ............................................................ 82
SMTP.............................................................. 85
TFTP ............................................................... 84
R
Redistributable modules ............................. 70, 222
Registers panel.................................................. 361
Relaying reports................................................ 297
Removing error reports from storage ................. 68
Report collector ................................................ 296
Report Collector
About ............................................................ 296
Description ................................................... 296
Relaying reports............................................ 297
Settings ......................................................... 303
System requirements ...................................... 11
Report Collector settings page .......................... 303
Report Monitor ................................................. 286
About ............................................................ 286
Command line .............................................. 294
Configuring................................................... 288
System requirements ...................................... 11
Report storage..................................................... 68
About .............................................................. 68
Deleting reports .............................................. 68
Structure ......................................................... 68
Report storage programming ............................ 319
About ............................................................ 319
Description ................................................... 319
smartbear.com
Index
Report to Issue ..................................................310
About ............................................................310
Applying settings to existing reports ............312
Mapping products to issue-tracking projects 310
Pages .............................................................312
Reporter ............................................................222
.NET applications -- Using with .....................71
About ............................................................222
Controlling DLL loading ..............................240
Data to be included in reports .......................235
Disabling AQtrace Reporter .........................256
Enabling AQtrace Reporter ..........................256
Generating reports on demand ......................258
Getting program reference to ........................247
Implementing custom exception filters ........255
Initializing in .NET applications.....................74
Inserting custom data into reports.................260
Locking AQtrace Reporter ...........................256
Notification window .....................................237
Packager........................................................263
Programming ................................................243
Selecting transfer protocol ..............................99
Sending data ...................................................87
Specifying data to be included in reports .....235
Specifying exceptions to be traced ...............228
Specifying modules to be traced ...................233
System requirements.......................................11
Testing ............................................................69
Tracing exceptions in mixed code ................228
Unlocking AQtrace Reporter ........................256
Using.............................................................222
Using in .NET applications.............................79
Using multiple protocols ..............................101
Working under debugger ..............................228
Reporter Assembly Information page ...............271
Reporter Behavior page ....................................273
ReportMonitorSettings.xml ..............................288
Reports ...................................... 235, 237, 258, 260
Analyzing reports with AQtrace Viewer ......328
Deleting from storage .....................................68
Determining duplicated reports ....................299
Generating on demand ..................................258
Inserting custom data ....................................260
Notification window .....................................237
Relaying ........................................................297
Selecting transfer protocol ..............................99
Sending reports ...............................................87
Specifying data to be included in reports .....235
Using multiple protocols ..............................101
reports - AQtrace Reporter setting....................273
AQtrace by SmartBear Software
Using Microsoft Source Server
S
Samples .............................................................. 15
Save ... last exceptions -- AQtrace Reporter
setting ........................................................... 273
Screenshot -- AQtrace Reporter setting ............ 273
Screenshot panel ............................................... 361
SDK files -- Description of............................... 245
Selecting transfer protocol .................................. 99
Send mode .......................................... 99, 101, 272
E-mail ............................................................. 84
FTP ................................................................. 86
HTTP .............................................................. 83
HTTPS ............................................................ 82
Requirements .................................................. 88
SMTP.............................................................. 85
TFTP ............................................................... 84
Sending data ....................................................... 87
Sending mode requirements ............................... 88
Sending page .................................................... 272
Server................................................................ 296
AQtrace Service............................................ 299
Issue-tracking support plug-ins .................... 305
Module Store Agent ..................................... 219
Persistent report storage ................................. 68
Report Collector ........................................... 296
Server-side components................................ 296
Server Config.................................................... 301
About ............................................................ 301
AQtrace Module Store Agent settings page . 304
AQtrace Service settings page ...................... 304
Common Settings page ................................. 302
Report Collector settings page ...................... 303
Server-side components.................................... 296
About ............................................................ 296
AQtrace Service............................................ 299
Issue-tracking support plug-ins .................... 305
Module Store Agent ..................................... 219
Report Collector ........................................... 296
Server-side plug-ins .................................. 305, 310
About ............................................................ 305
ALMComplete support ................................. 308
AQdevTeam support .................................... 309
Bugzilla support............................................ 306
Configuring................................................... 310
JIRA support................................................. 307
Team System support ................................... 306
Service ...................................................... 219, 299
AQtrace Service Settings page ..................... 304
Configuring........................................... 299, 300
Description ................................................... 299
Specifying path to modules .......................... 300
© 2011 SmartBear Software
401
System requirements.......................................11
Working via COM ........................................319
Services information -- AQtrace Reporter setting
......................................................................273
Services support..................................................80
Settings ............................. 263, 288, 303, 304, 310
AQtrace Module Store Agent .......................304
AQtrace Report Monitor ...............................288
AQtrace Reporter ..........................................263
AQtrace Service ............................................304
Issue-tracking plug-ins .................................310
Report Collector ...........................................303
Show Difference -- Command ..........................381
Show Dirty Stack -- Menu command ...............345
Silent mode .......................................................370
Silent.log file ....................................................370
SmartBear Source Server
Overview ......................................................374
SmartBear Source Server..................................374
SmartBear Source Server
Source indexing ............................................376
SmartBear Source Server
Supported source control systems ................377
SmartBear Source Server
Comparing versions of source code files ......381
Source Server Support ......................................372
About ............................................................372
Source Servers ..........................................374, 382
MS Source Server .........................................382
SmartBear Source Server..............................374
SourceSafe ................................................377, 385
Using with Microsoft Source Server ............385
Using with SmartBear Source Server ...........377
Specifying ......................... 228, 233, 235, 300, 337
Data to be included in reports .......................235
Exceptions to be traced .................................228
Modules to be traced.....................................233
Path to modules ....................................300, 337
Stack .........................................................328, 345
Analyzing......................................................328
Call Stack panel ............................................345
Stack size -- AQtrace Reporter setting .............273
Storage ................................................................68
About persistent storage .................................68
Checking links in configuration files ............214
Deleting reports ..............................................68
Modifying build storage configuration files .214
Structure of persistent storage ........................68
Updating build storage configuration files ...219
Storage (build storage)......................................207
About ............................................................207
smartbear.com/support
402
Basic concepts .............................................. 207
Storage (report storage) ........................ 19, 68, 319
About .............................................................. 68
Programming ................................................ 319
Programming -- Description ......................... 319
Structure ......................................................... 68
Storage View panel........................................... 363
storage.dat file .................................................... 68
Store reports -- AQtrace Reporter setting ......... 273
StripTDS ........................................................... 169
About ............................................................ 169
Exit codes ..................................................... 169
Subversion ................................................ 378, 387
Using with Microsoft Source Server ............ 387
Using with SmartBear Source Server ........... 378
Support ............................................................... 14
Additional information on AQtrace ................ 14
Technical support ........................................... 14
Supported applications ....................................... 12
Symbols .................................... 103, 300, 304, 337
AQtrace Service Settings page ..................... 304
Compiling applications with debug information
.................................................................. 103
Specifying path to debug information files . 300,
337
Symbols path -- AQtrace Service setting ......... 304
System requirements for AQtrace ...................... 11
T
Team System Support plug-in .................. 306, 310
About ............................................................ 306
Configuring................................................... 310
Connection settings ...................................... 315
Technical support ............................................... 14
Testing AQtrace.................................................. 69
Threads panel.................................................... 365
Traced exceptions ............................................... 13
Transfer protocols........................... 82, 88, 99, 101
Requirements .................................................. 88
Selecting ......................................................... 99
Settings ........................................................... 82
Using multiple protocols .............................. 101
Transfer protocols settings ................................. 82
E-mail ............................................................. 84
FTP ................................................................. 86
HTTP .............................................................. 83
HTTPS ............................................................ 82
SMTP.............................................................. 85
TFTP ............................................................... 84
Transferring data ........................................ 87, 297
Basic Concepts ............................................... 87
smartbear.com
Index
Report relaying .............................................297
Selecting protocol ...........................................99
Using multiple protocols ..............................101
Try-catch blocks -- Tracing exceptions in ..........13
U
Unlocking AQtrace Reporter ............................256
Update interval -- Module Store Agent setting.304
Updates -- Checking for....................................371
User messages...................................................242
User-defined debug messages...........................242
Using AQtrace Reporter ...................................222
Using multiple protocols ..................................101
V
VB............................... 70, 113, 182, 185, 196, 198
Preparing Visual Basic 2005 applications for
AQtrace .....................................................182
Preparing Visual Basic 2008 applications for
AQtrace .....................................................182
Preparing Visual Basic 2010 applications for
AQtrace .....................................................182
Preparing Visual Basic 6.0 applications for
AQtrace .....................................................113
Preparing Visual Basic 7.x applications for
AQtrace .....................................................185
Specifying version number for Visual Basic
2005 applications ......................................196
Specifying version number for Visual Basic
2008 applications ......................................196
Specifying version number for Visual Basic
2010 applications ......................................196
Specifying version number for Visual Basic 6.0
applications ...............................................198
Specifying version number for Visual Basic 7.x
applications ...............................................198
Support for VB 6 applications in AQtrace .....70
VC#...........................................................172, 175
Preparing Visual C# 2005 applications for
AQtrace .....................................................172
Preparing Visual C# 2008 applications for
AQtrace .....................................................172
Preparing Visual C# 2010 applications for
AQtrace .....................................................172
Preparing Visual C# 7.x applications for
AQtrace .....................................................175
VC++ ........................ 104, 107, 110, 176, 179, 195
Preparing Visual C++ 2005 applications for
AQtrace .............................................104, 176
Preparing Visual C++ 2008 applications for
AQtrace .............................................104, 176
AQtrace by SmartBear Software
Using Microsoft Source Server
Preparing Visual C++ 2010 applications for
AQtrace............................................. 104, 176
Preparing Visual C++ 6 (or earlier) applications
for AQtrace ............................................... 110
Preparing Visual C++ 7.x applications for
AQtrace............................................. 107, 179
Specifying version number ........................... 195
Version number ................................................ 194
About specifying of ...................................... 194
C++Builder 2006 applications ...................... 204
C++Builder 2007 applications ...................... 204
C++Builder 2009 applications ...................... 204
C++Builder 2010 applications ...................... 204
C++Builder applications............................... 205
C++Builder XE applications ........................ 204
Delphi 2005 - 2007 and 2009 .NET applications
.................................................................. 202
Delphi 2005 – 2007, 2009, 2010 and XE Win32
applications ............................................... 201
Delphi applications ....................................... 203
Visual Basic 2005 applications..................... 196
Visual Basic 2008 applications..................... 196
Visual Basic 2010 applications..................... 196
Visual Basic 6.0 applications ....................... 198
Visual Basic 7.x applications ....................... 198
Visual C# 2005 applications ......................... 199
Visual C# 2008 applications ......................... 199
Visual C# 2010 applications ......................... 199
Visual C# 7.x applications ............................ 200
Visual C++ applications ............................... 195
Viewer .............................................................. 327
Additional Information panel ....................... 340
Analyzing reports with ................................. 328
Call Stack panel ............................................ 345
Command line .............................................. 370
Disassembly panel ........................................ 350
Event Log panel............................................ 352
Last Exceptions panel ................................... 356
Memory panels ............................................. 357
Modules panel .............................................. 359
Panels............................................................ 339
Registers panel.............................................. 361
Screenshot panel ........................................... 361
Specifying path to modules .......................... 337
Storage View panel....................................... 363
System requirements ...................................... 11
Threads panel................................................ 365
User interface................................................ 327
Watch panel .................................................. 366
Working with ................................................ 328
Visual Basic ................ 70, 113, 182, 185, 196, 198
© 2011 SmartBear Software
403
Preparing VB 6 applications for AQtrace .....113
Preparing Visual Basic 2005 applications for
AQtrace .....................................................182
Preparing Visual Basic 2008 applications for
AQtrace .....................................................182
Preparing Visual Basic 2010 applications for
AQtrace .....................................................182
Preparing Visual Basic 7.x applications for
AQtrace .....................................................185
Specifying version number for Visual Basic
2005 applications ......................................196
Specifying version number for Visual Basic
2008 applications ......................................196
Specifying version number for Visual Basic
2010 applications ......................................196
Specifying version number for Visual Basic 6.0
applications ...............................................198
Specifying version number for Visual Basic 7.x
applications ...............................................198
Support for VB 6 applications in AQtrace .....70
Visual C# .................................. 172, 175, 199, 200
Preparing Visual C# 2005 applications for
AQtrace .....................................................172
Preparing Visual C# 2008 applications for
AQtrace .....................................................172
Preparing Visual C# 2010 applications for
AQtrace .....................................................172
Preparing Visual C# 7.x applications for
AQtrace .....................................................175
Specifying version number for Visual C# 2005
applications ...............................................199
Specifying version number for Visual C# 2008
applications ...............................................199
Specifying version number for Visual C# 2010
applications ...............................................199
Specifying version number for Visual C# 7.x
applications ...............................................200
Visual C++................ 104, 107, 110, 176, 179, 195
Preparing Visual C++ 2005 applications for
AQtrace .............................................104, 176
Preparing Visual C++ 2008 applications for
AQtrace .............................................104, 176
Preparing Visual C++ 2010 applications for
AQtrace .............................................104, 176
Preparing Visual C++ 6 (or earlier) applications
for AQtrace ...............................................110
Preparing Visual C++ 7.x applications for
AQtrace .............................................107, 179
Specifying version number ...........................195
Visual C++ Exceptions page ............................278
Visual SourceSafe.....................................377, 385
smartbear.com/support
404
Using with Microsoft Source Server ............ 385
Using with SmartBear Source Server ........... 377
VMWare - Problems with report transferring ... 87
W
Watch panel ...................................................... 366
smartbear.com
Index
Watch toolbar ...................................................366
Whole screen -- AQtrace Reporter setting........273
Working under debugger ..................................228
Working via COM (Programming report storage)
......................................................................319
AQtrace by SmartBear Software