1
CCLRC / Rutherford Appleton Laboratory
SSN/30.2
Particle Physics & Astronomy Research Council
Starlink Project
Starlink System Note 30.2
T. M. Gledhill
13th June 1996
SYSTUNE
Tools for SPARC/Solaris Performance Monitoring and Tuning
V0.4
Contents
1 Introduction
2
2 Installation and Removal
2.1 Installation . . . . . . . . . . . . . . . . . . . . . . . . . . . . . . . . . . . . . . .
2.2 Removal . . . . . . . . . . . . . . . . . . . . . . . . . . . . . . . . . . . . . . . . .
2
2
3
3 Using the Package
3.1 Statistics Tools . . . . . . . . . . . . . .
3.2 Monitor Tools . . . . . . . . . . . . . . .
3.2.1 Interactive Monitoring . . . . . .
3.2.2 Non-interactive Monitoring . . .
3.2.3 Starting Monitors at Boot Time
4
5
5
6
6
7
.
.
.
.
.
.
.
.
.
.
.
.
.
.
.
.
.
.
.
.
.
.
.
.
.
.
.
.
.
.
.
.
.
.
.
.
.
.
.
.
.
.
.
.
.
.
.
.
.
.
.
.
.
.
.
.
.
.
.
.
.
.
.
.
.
.
.
.
.
.
.
.
.
.
.
.
.
.
.
.
.
.
.
.
.
.
.
.
.
.
.
.
.
.
.
.
.
.
.
.
.
.
.
.
.
.
.
.
.
.
.
.
.
.
.
4 The SymbEL Language
7
5 The GUI extension
9
6 Further Information
9
A Changes since V0.3
9
B Future Releases
9
SSN/30.2
1
2
Introduction
This document follows on from SSN/26 which provides an introduction to performance and
tuning issues on SPARC/Solaris systems. Here we describe a package of tools designed to help
monitor performance on your system, implement some of the advice given in SSN/26 and provide
tuning tips.
In order to monitor performance and perform tuning operations, the Solaris system manager
traditionally has to rely on tools such as vmstat, iostat, sar and the like which are somewhat
limited in their scope and usefulness. Repeatedly running tools such as these and maybe using
perl or awk scripts to parse the results can lead to unacceptable overheads and even adversely
affect the performance data being recorded.
Using an interpreted language called SymbEL (Symbol Engine Language), developed by Richard
Pettit at Sun Microsystems, it is now possible to retrieve information directly from the SPARC
kernel and to construct home-made tools simply by writing a script. This places information
resources that were only previously available to the system C programmer at the disposal of
every system manager. A good number of tools have already been written1 , some of which are
sophisticated GUI based system monitors, and they form the basis of this package.
At the moment the package is essentially a wrap-around for the SPARC tuning rules and tools
package written by Adrian Cockcroft and Richard Pettit. The tools have been collected together
using a GUI front end which also provides access to documentation and online help. In the near
future, additional tools should become available (perhaps contributed by Starlink Managers)
which can be incorporated into the package.
Note that this package is only relevant to SPARC systems running Solaris 2.x. It
will not work on systems running SunOS 4.x (Solaris 1). In addition, some tools require the
Motif library which was only included with Solaris at version 2.4.
A detailed guide to the interpretation of results from the various tools in this package is beyond
the scope of this brief document – there are simply too many options to cover. The package is
provided as a toolkit to enable system managers to develop the performance monitoring utilities
that will be of most use to them.
The following sections describe the package installation, its use, and a little about how it works.
The document is intended only as an introduction and as a pointer to other sources of information.
2
Installation and Removal
The package installs under the /opt filesystem in /opt/RICHPse and currently requires ∼ 2MB
of disk space. In order to install the package, superuser privileges are required.2 Scripts are
provided to install and remove the package cleanly.
2.1
Installation
To install the package, proceed as follows:
1
The tools currently available are those distributed with the SymbEL package and have been written by
Richard Pettit and Adrian Cockcroft
2
Generally, superuser privileges are required to write to /opt and for pkgadd to execute properly
SSN/30.2
1. Obtain the tar file systune_v0.4.tar from the Starlink FTP server
contents into a temporary directory. . .
3
3
and expand the
# cd /temp-directory
# tar xvf systune_0.4.tar
. . . to create some files in systune_v0.4.
2. Move to the created directory and, as root, execute the install script.
# cd systune_v0.4
# ./install
Some informational messages will be displayed and you will be prompted to confirm installation under /opt/RICHPse. You will be given the option of installing the package
‘architecture neutral’. This just means that SE2.5 will work across platforms with different releases of Solaris. If you are only running one release (e.g., 2.5) then say ‘n’, otherwise
say ‘y’. You will also be asked whether you want to start some monitoring tools at boot
time by inserting start-up scripts in /etc/rc2.d. The recommendation is that you decline
this option until experience has been gained running the monitors from a regular user
account. The start-up scripts will still be inserted as templates in /etc/init.d. If you
want to enable them at a later date then uncomment the commented-out lines.
3. The installation procedure will leave behind a remove script to cleanly remove the installation. This should be kept.
After installation has completed, the software will be installed in the directory /opt/RICHPse.
The SysTune GUI can be started with the command:
> /opt/RICHPse/starlink/systune.se &
or by defining an alias to this command. The GUI, and most of the tools can be run from a
regular user account although a few need to be run as root to function properly. Details are
given under the Help menu when you run up the GUI.
2.2
Removal
The package can be cleanly removed using the remove script left behind by the installation
process. You should first terminate any running tools or monitors.
1. As root, execute the package removal script.
# cd /temp-directory/systune_v0.4
# ./remove
3
ftp://starlink-ftp.rl.ac.uk/pub/tools/systune_v0.4.tar
SSN/30.2
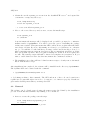
Networks
collisions
net
netstatx
4
CPU system
cpus
msacct
nproc
ps-ax
pwatch
uptime
cpu meter
multi meter
kview
vmstat
mpvmstat
infotool
Statistics Tools
Disks NFS
Description
collision rates for ethernet interfaces
network statistics (netstat -i)
network retransmissions/collisions
cpus and clock rates
microstate accounting
number of processes
ps-ax command
watch a process
continuous uptime display
CPU usage GUI
GUI showing CPU and VM system
GUI to monitor kernel variables
iostat
like iostat -D
xio
disk access statistics
xit
GUI version of iostat
dfstats
GUI version of df
nfsstat-m like nfsstat -m
like vmstat
vmstat for multi-processors
global system information GUI
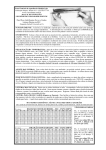
Table 1: A summary of the tools in the statistics grouping. Tools in bold type require root
privileges to function properly.
3
Using the Package
Although the tools in this package can be invoked independently, they are more conveniently
accessed from the SysTune GUI which groups them loosely under two headings:
1. Statistics: These tools retrieve system statistics to give a real-time picture of how the
system is performing. Examples would be looking at disk access times, network collision
rates, available swap space etc.
2. Monitors: These tools typically run in the background and periodically check the system
for deviation from established performance tolerences using a rules strategy. When a
performance target is broken, the manager is notified.
The tools are summarised in Table 1 and Table 2 and are further described in the online help
accessible through the SysTune GUI, which is intended to be self documenting to a large extent.
SSN/30.2
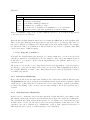
Monitor
quick tune
ruletool
virtual adrian
calendar monitor
syslog monitor
io monitor
net monitor
nfs monitor
vm monitor
percollator
5
Monitor Tools
Description
not really a monitor – performs a quick system tuning diagnostic to
identify possible problems
probably the most useful tool at the moment – a GUI based monitor
that interactively checks a system at specified intervals for a wide
range of performance problems
a command line version of ruletool – can be started at boot time and
can log results to a file
a monitor which logs its results as calendar appointments using the
OpenWindows calendar manager. Useful for collecting results from
multiple machines
a monitor which logs its results via the syslogd
a monitor version of iostat – monitors for slow disks
a monitor version of netstatx – monitors for a slow network
a monitor version of nfsstat-m – monitors for slow NFS client mount
points
a monitor version of vmstat – monitors for low RAM, swap and CPU
overloads
Performance collator: Runs the performance rules, including WWW
server performance, and writes concise output to a log file or stdout.
Table 2: A summary of the tools in the monitors grouping. Tools in bold type require root
privileges to function properly.
3.1
Statistics Tools
The statistics tools retrieve information from the kernel and currently display it in one of three
ways:
1. Tools with GUIs, such as infotool, use their own pop-up text windows or graphics to
display information. These tools can be exited and otherwise controlled via their own
menu bar options. After the tool has started, the SysTune window can be used again.
2. Some tools, such as ps-ax, display their output in the SysTune text window. Whilst these
tools are running, the SysTune window is frozen until they complete their function.
3. Other tools, such as iostat and vmstat, run in the background and send their output to
stdout. These tools loop until explicitly terminated using the stop button on the SysTune
GUI. Whilst these tools are executing other tools cannot be launched.
3.2
Monitor Tools
The monitor tools run continuously in the background and only output information when they
detect a problem. They periodically retrieve information from the kernel (such as disk access
times and CPU loads) and feed it into a series of rules which define acceptable ranges of performance. When one of these rules is ‘broken’, the manager is notified.
SSN/30.2
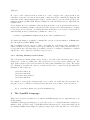
Colour
blue
white
green
amber
red
black
6
Monitor Colour Codes
Meaning
under utilisation or imbalance of an expensive resource
low usage or inactivity
performance within specifications
warning level - possible problem
problem level - something needs adjusting for good performance
critical problem could cause application or system to hang
Table 3: A summary of the colour codes used with the monitor tools, as defined in Appendix A
of Sun Performance and Tuning.
Each rule has a default definition which can be seen using the rules button on the SysTune GUI.
These are the rules that appear in Appendix A of Sun Performance and Tuning. The value of a
rule can be changed by defining a new current value as an environment variable. For example,
the disk service time beyond which slow disk problems are reported is, by default, 50ms. This
could be increased to 70ms if required:
> setenv DISK_SVC_T_PROBLEM 70
Obviously, the default tuning rules should not be changed without good reason and probably
only after considerable experimentation. For the changes to have effect, any running monitors
would have to be restarted. In the current implementation, the SysTune GUI needs to be
restarted as well.
The monitor tools use the colour coding scheme described in Appendix A of Sun Performance
and Tuning to categorise the nature and severity of a problem. This is summarised in Table 3.
For a graphic illustration of this colour coding scheme in action, start up the RuleTool monitor
on a fairly busy system.
3.2.1
Interactive Monitoring
Most of the monitors use the same rules definitions but output their results in different ways.
The RuleTool monitor is probably the most useful interactive system monitor available. This is
a GUI based tool which uses the above mentioned colour-coding scheme to indicate performance
problems. By clicking on the coloured bars, the data relating to the notified problem can be
obtained.
3.2.2
Non-interactive Monitoring
It may be more convenient to have a monitor run in the background and log its results to a file.
The virtual_adrian, syslog monitor, and calendar monitors all provide variations on this theme.
The calendar monitor (mon_cm) checks the system over a 15 minute period and if any rule gives
an amber state or worse, the rule state is entered as an appointment for that time period. The
calendar to use can be supplied as a command line option so that output from monitors on
different hosts can be sent to a calendar manager on a central host.
SSN/30.2
7
In order to send output from these monitors to a file or supply other options (such as the
calendar for mon_cm to use) the monitors must be started from the command line using the full
path, since in the current implementation these options cannot be provided if the monitors are
launched from the SysTune GUI. This is a limitation of the GUI library used to implement the
SysTune GUI.
As an example, here is a command to start the mon_cm monitor on node client1 with a monitoring interval of 30 minutes (1800 seconds) and send the output to the calendar manager belonging
to user star on node server1. A calendar file must already have been created for user star on
server1 using cm and you must have permission to write to it.
client1> /opt/RICHPse/examples/mon_cm.se 1800 star@server1 &
For further information on available command line options, see the information on Tools available through the SysTune HELP menu.
The percollator.se monitor is new to SE2.5. It applies the performance rules, including new
rules for WWW server performance, and logs its results in a concise format. It is intended to be
a long-term monitor allowing usage/performance trends to be analysed. Graphing tools which
will use the concise output are currently being developed.
3.2.3
Starting Monitors at Boot Time
The four monitors virtual_adrian, syslog monitor, percollator and calendar monitor can be
started at boot time by adding run control scripts in /etc/rc2.d at sequence number 90. The
appropriate scripts are placed in /etc/init.d by the package installation procedure. The scripts
are commented out unless the option to activate monitors at boot time was chosen during the
installation. The scripts are:
/etc/init.d/mon_cm
/etc/init.d/monlog
/etc/init.d/va_monitor
/etc/init.d/percol
For example, to start up the calendar monitor at boot time you would first edit /etc/init.d/mon_cm to remove commented out lines (if any) and then create a link to it in /etc/rc2.d
ln -s /etc/init.d/mon_cm /etc/rc2.d/S90mon_cm
4
The SymbEL Language
This section describes in a little more detail the SymbEL language used to implement the tools
in this package.
SymbEL is an interpreted language (i.e., it doesn’t need to be compiled) that has a syntax very
similar to that of C. The beauty of SymbEL is that it allows the user to extract information from
the running SPARC kernel simply by writing a script, in the same way that you could extract
SSN/30.2
8
information from a file by writing a Perl script. Previously, to retrieve kernel information, you
would have to write and compile a C program to use the kernel kvm library, or in SunOS 5.x the
kstat library
Although the SymbEL language is syntactically similar to C, a key difference is the definition
of active and inactive variables. When an active variable is read, a kernel access occurs and
data is retrieved from the kernel into that variable. Usually, active variables are structures so
that the whole structure will be filled when the variable is read.
SymbEL provides special language classes that are used to declare the active property of a
variable, that is, that it will receive information from the kernel. This property is signified in a
SymbEL script by preceeding the variable by the language class followed by a dollar ($) sign.
There are currently four language classes; the ones that provide access to the kstat and kvm
data being the kstat and kvm language classes.
This is probably best illustrated by an example. The following script will report the number of
processes currently running on the system. If the SymbEL interpreter (/opt/RICHPse/bin/se)
is installed on the system, then this script could be typed in and executed.
#!/opt/RICHPse/bin/se
#include <stdio.se>
#include <kstat.se>
main ()
{
ks_system_misc kstat$misc;
printf("There are %d processes on the system \n",kstat$misc.nproc);
}
Programming Notes
1. The initial line flags that this script should be processed using the SymbEL interpreter se.
2. The stdio.se and kstat.se header files (located in /opt/RICHPse/include) are included
to provide definitions for the printf function and for the kstat variable types.
3. The statement ks_system_misc kstat$misc; declares the variable kstat$misc to be of
type ks_system_misc (a structure type defined in the header file kstat.se). The form of
the variable name indicates that it is an active variable of the kstat$ language class.
4. The print statement prints out the number of processes on the system simply by referencing
the appropriate structure member. This automatically causes the structure to be updated
with information from the kernel.
For a more detailed introduction to the SymbEL language, see the user’s manual:
/opt/RICHPse/doc/USERS.MANUAL
or access it through the HELP button on the SysTune GUI.
SSN/30.2
5
9
The GUI extension
The SymbEL language has an attach statement which allows it to be extended by attaching
shared libraries, such as system libraries like libc.so. User supplied libraries can also be attached
and a GUI extensions library is included with the SymbEL release. This is basically a widget
library that allows simple GUI interfaces to be constructed. Although fairly easy to use, the
library is at present fairly limited and has some bugs.
For more information on the GUI extension, see the user’s manual
/opt/RICHPse/doc/GUI_MANUAL
or access it through the HELP button of the SysTune GUI. Alternatively, have a look at the
SysTune code which is written using the GUI extension library.
6
Further Information
For a general overview of tuning issues on SPARC/Solaris systems, see Configuring, monitoring
and tuning SPARC/Solaris systems, SSN/26.
Both this brief note and the above SSN refer to the more detailed treatment of tuning issues
to be found in Sun Performance and Tuning – SPARC and Solaris by Adrian Cockcroft (ISBN
0-13-149642-5).
Further tuning information is available on-line at various URLs. Since this information is being
updated all the time and the links may be volatile, the URLs are not listed explicitly here.
Instead, they can be accessed through the Starlink System Tuning and Configuration Page4
A
Changes since V0.3
This is a maintenance release for Solaris 2.5 platforms.
1. Systune V0.4 includes the SE2.5 package which works correctly on Solaris 2.5 platforms
(and earlier).
2. The Systune GUI includes links to 2 contributed tools (dfstats and kview) and to the
percollator monitor (percollator).
3. Help information and this document have changed accordingly.
B
Future Releases
The next release should be a major revision to V1.0 and will provide full functionality for the
SysTune GUI. Graphing tools for analyzing performance logs should also become available.
4
http://www.starlink.ac.uk/˜cac/sunspot/sun_perf.html