1
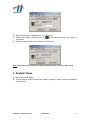
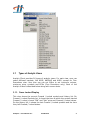
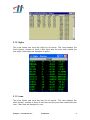
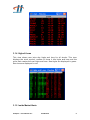
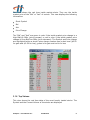
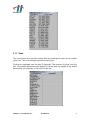
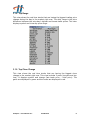
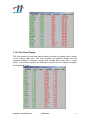
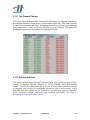
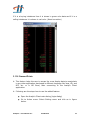
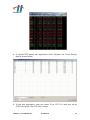
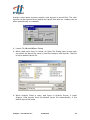
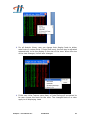
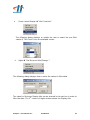
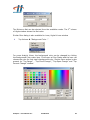
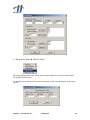
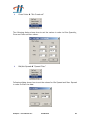
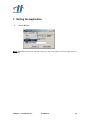
1. Overview <This section has been intentionally left blank > 2. Getting Started Click on the Start Menu Programs Hold Brothers Analytics Client Login Screen appears Enter the Server Name: analytics1.hold.com Port is defaulted to 35009 Enter the login Name: <Login Id> The login screen is shown below Note: Graybox Login/Trader ID and password are required Analytics – User Manual V1.1 Confidential 1 After entering the <password>, hit “Connect” Notice the traffic light turning to Color denoting that the login is successful Now the login screen looks like the one below: Note: If logon fails, please check the IP address and port number are correct and try again 3. Analytic Views Go to Action Open The following screen shows the various Analytic Views that are available for the user Analytics – User Manual V1.1 Confidential 2 3.1 Types of Analytic Views Analytic Client provides 26 types of analytic views. For each view, user can select different markets, like NYSE, NASDAQ and AMEX, except for Firm Executions view. User also can use set filters to set minimum volume, minimum price, symbols and ECNs (Firm Executions only). Each of the Analytic Views is described below along with screen shots. 3.1.1. Cross Locked Display This view shows the current Crossed / Locked symbols and history list. On Crossed / Locked Symbols list, it shows the time at which the symbol started Crossed / Locked, current “Bid” and “Ask” price and Crossed / Locked values. On the history list, it shows the last Crossed / Locked symbols and the time they left Crossed / Locked status. Analytics – User Manual V1.1 Confidential 3 3.1.2 Highs This view shows new intra day highs for all stocks. This view displays the stock symbol, number of times it hits highs and the price that creates the new highs. New highs are displayed in green. 3.1.3 Lows This view shows new intra day lows for all stocks. This view displays the stock symbol, number of times it hits lows and the price that creates the new lows. New lows are displayed in red. Analytics – User Manual V1.1 Confidential 4 3.1.4 Highs & Lows This view shows new intra day highs and lows for all stocks. This view displays the stock symbol, number of times it hits highs and lows and the price that creates the new highs and lows. New highs are displayed in green. New lows are displayed in red. 3.1.5 Inside Market Alerts Analytics – User Manual V1.1 Confidential 5 This view shows the real time inside market alerts. They are the inside market price of the “Bid” or “Ask” of a stock. This view displays the following information: Stock Symbol Bid Ask Price Change The “Bid” and “Ask” are green in color if the inside market price change is a High Bid/Lift Offer (price increase) or red in color if the inside market price change is Drop Bid/Low Offer (price decrease). The Symbol and Price change are highlighted when a stock’s price change reaches user’s alert level ($2.50 for gain and -$2.50 for loss), green is for gain and red is for loss 3.1.6 Top Volume This view shows the real time data of the most heavily traded stocks. The Symbol and the Current Volume of the stocks are displayed Analytics – User Manual V1.1 Confidential 6 3.1.7 Sales This view shows the real time stocks that are trading the most in the market right now. This view displays symbol and print bar. Prints are cumulated over the last 12 seconds. The number of prints over the last 12 seconds determines the length of the bar and the speed of the prints determines the intensity of the color of the bar Analytics – User Manual V1.1 Confidential 7 3.1.8 Top Range This view shows the real time stocks that are having the biggest trading price change during the day in the market right now. The daily range is the price difference between the intra day’s highest and lowest trade prices. This view displays symbol and intra day price range 3.1.9 Top Close Change This view shows the real time stocks that are having the biggest close change in the market right now. This view includes 2 parts (top gain and top loss). It displays symbol and change (last trade price – close price). The gains are displayed in green and the losses are displayed in red. Analytics – User Manual V1.1 Confidential 8 3.1.10 Top Open Change This view shows the real time stocks that are having the biggest open change in the market right now. This view includes top positive change and top negative change. It displays symbol and change (last trade price – open price). The positive changes are displayed in green and the negative changes are displayed in red Analytics – User Manual V1.1 Confidential 9 3.1.11 Top Present Change This view shows the real time stocks that are having the biggest changes in percentage based on close prices in the market right now. This view includes 2 parts (top gain and top loss). It displays symbol and change in percentage (last trade price – close price then divided by close change). The gains are displayed in green and the losses are displayed in red 3.1.12 Bid and Ask Scan This view catches large size best bids and asks. The minimum size is 5000 shares. It displays Symbol, Shares (in 100s), Bid/Ask price and market maker. The bid is in green and ask is in red. If the current market is locked or crossed, the line will be highlighted (green for bid or red for ask). A Bid and Ask scan filter dialog can be invoked to set minimum volume, minimum price, minimum spread, minimum size, symbols and ECNs. The filter is discussed in Customize Views section Analytics – User Manual V1.1 Confidential 10 3.1.13 Price Alerts User can use this view to set the below and above thresholds for stocks. If price is greater than/equal to the above price, the symbol and price are highlighted in green. If price is less than/equal to the below price, the symbol and price are highlighted in red. By default when a new Price Alerts view is open. It picks 20 default symbols and set the below and above based on the current price (minus 0.2 for the below and plus 0.2 for the above). User can use the Filter dialog to add/delete symbols, set/modify the below and above Analytics – User Manual V1.1 Confidential 11 3.1.14 Firm Executions This view shows the real time firm wide executions in Hold Brothers, Inc. The buy executions are displayed in green and the sale executions are displayed in red. The executions are highlighted if they are short sales. This view displays the information about Symbol, Quantity, Price, Side, Contractor and Time. Note: Special quote entitlements are required to view this feature. 3.1.15 Imbalances In financial market, imbalances there are too many “Sell” orders or “Buy” orders due to some major announcement for that company stock. This Imbalance view shows the market imbalance data for daily basic with opening (before market opens) and closing (after 3:40 PM till market closes) messages. There are 3 columns Symbol, Volume and Status available in this view. Symbol: Stock equity symbol for which imbalance occurs. Volume: Imbalances quantity in shares Status: displays the percentage imbalances or status with M (Market Imbalances) and MOC (Market On Close). Analytics – User Manual V1.1 Confidential 12 If it is a buying imbalance then it is shown in green color data and if it is a selling imbalance it is shown in red color. (Need correction) 3.1.16 Crossed Prints This feature helps the user to access the cross display data to manipulate in any other application developed in different language like Java, VB, and MFC etc. or in MS Excel, after connecting to the Analytic Client application. Following are the steps how to use the added feature: Open the Analytic Client main dialog (login dialog) Go to Action menu. Select Setting menu and click as in figure below. Analytics – User Manual V1.1 Confidential 13 The following Settings dialog appears. In order to send cross display print data to third party application, the user must check the check box option “Send Cross Display Print Data” and then press OK button. The default IP and Port is 127.0.0.1 (local host) and “37501” respectively. In order to get cross display print data in the 3rd party application, the user must open at least one Cross Display window with Select Market – All option with caption “Cross Prints” as shown in figure. Analytics – User Manual V1.1 Confidential 14 A sample MFC based test application which displays the Cross Display data is shown below: In the test application, user can insert IP as 127.0.0.1 and port no as 37501 and press “Set IP & Port” button. Analytics – User Manual V1.1 Confidential 15 There is a check box (Raw Data), if unchecked; user can see any update to the same symbol data in a different row. If checked (Filtered Data) the user can see the updated value to the symbol in the same row. 3.1.17 Pre/Post Market Print This feature is added from Version 8.5.2 onwards. This feature helps the user to access the Pre and Post market print data. The pre market data comes before market opens (morning 8:00 AM to market opening time 9:30 AM) and the post market data comes after the market closes. 3.1.18 Bid/Ask Spread This feature helps the user to access the Bid/Ask Spread market data in market time. Currently it displays top 20 spreads in descending order from top to bottom. There were 7 columns named Symbol, Bid, Ask, Spread, Time, #Prints and Last Print showing the respective data. Symbol: Displays the stock security symbol. Analytics – User Manual V1.1 Confidential 16 Bid: Displays the price at which someone will buy current day trading position. Ask: Displays the price at which someone will sell the position required. Spread: The gap between Bid and Ask. (Spread = (Ask price – Bid Price)) Time: time at which a new spread happens. This field is updated with the time at which a new spread value comes. #Prints: The no of prints comes since the last spread arrives. Reset to 0 if spread time changes or a new spread arrives. Last Print: Displays the last traded value or last execution price. Reset to 0.00 if a new spread arrives. NOTE: This feature works only with newer version of Analytic Server (v8.6.6) 3.1.19 Regulatory Imbalance This feature helps the user to access the Regulatory imbalances in the market time between 3:40 PM to 4:00 PM. Only regulatory imbalances are sent to Gray Box board view window after creating the files by the client. There were 3 columns named Symbol, Volume and Status showing the respective data. Symbol: Displays the stock security symbol Volume: Displays the Imbalance volume Status: Displays the percentage (%) imbalance Analytics – User Manual V1.1 Confidential 17 NOTE: This feature works only with newer version of Analytic Server (v8.6.6) 4. Settings Open the Analytic Client Main Dialog (Login Dialog) Go to Action Settings Click on Settings The following “Settings” dialog/screen appears Analytics – User Manual V1.1 Confidential 18 Under Settings dialog, there are two setting groups Imbalance Settings: This setting is required for the “Regulatory Imbalance” view in order to set the value for creating file and sending notification. There are two check box options available under these settings Create NYSE Imbalance for GB: If this is checked, the NYSE imbalance text files (around 24 text files) will be created in the same directory, where the application is running. By default, this check box is checked. The text file contains the symbols of the securities for which imbalance is published according to different combinations like, top 10, 20 & 30 with “only sell”, “only buy”, “both sell & buy” etc. For example, a sample text file is shown. These files are created according to the date suffixed with the name. Send NYSE Imbalance Notification: if this option is checked, then a notification is send to the Gray Box client application, to load the imbalance on Board view, for the corresponding symbols in the generated text files. By default, this check box is checked. Cross Display Send settings: This setting is required to send the cross display data to the 3rd party applications via UDP multicast. Further explanation is given in the section under “Cross Prints” Analytics – User Manual V1.1 Confidential 19 5. Layout Analytic client saves previous analytic view layouts in layout files. The view layouts can be restored from loading the layout files later on. Loading can be done automatically or manually Layout File Load Open Dialog When Load menu item is clicked, An Open File Dialog pops up and user can select the layout file name to load the analytic view layouts. That file is set as default layout file When Analytic Client is open, and logon to Analytic Server, it loads Analytic View layouts from the default layout file automatically, if the default layout file exists Analytics – User Manual V1.1 Confidential 20 When Analytic Client is closed, it saves analytic view layouts to the default layout file automatically (It creates the default layout file if it is not specified) Layout File Save When the Save menu item is clicked. The analytic view layouts are saved to the default layout file. If no default layout file exists, a Save File Dialog pops up and user can specify the layout file name to save the analytic view layouts. That file is set as default layout file Layout File Save As Save As Dialog When the Save As menu item is clicked, Save File Dialog pops up and user can specify the layout file name to save the analytic view layouts. That file is set as default layout file. Help About Dialog Help Release Document Analytics – User Manual V1.1 Confidential 21 6. Customizing Views In Analytic Client application, user can use the popup menu of each view to customize the background color, select market, set fonts, set always on top and set filters for incoming data The popup menu for each and every view is more or less the same with one or two additional options. For example, Analytic Views like Crossed Locked Display, Highs, Lows, Highs & Lows, Top Volume, Bid and Ask Scan, Price Alerts, Firm Execution, Imbalance, Cross Prints, Bid/Ask Spread, and Regulatory Imbalances have the special type of filter as follows Analytics – User Manual V1.1 Confidential 22 For all Analytic Views, user can change their display fonts to either auto fonts or custom fonts. If Auto Size is set, the font size is adjusted automatically to let the display fit the size of the view. When the size of the view changes, its font also changes If the user clicks Custom menu item, a Fonts Dialog will be opened to let user choose the fonts for the view. The changed fonts on a view apply to all displaying views Analytics – User Manual V1.1 Confidential 23 For all views except Firm Executions, user can choose select market to display the data for All / NASDAQ / NYSE / AMEX market. The default market is NASDAQ when a view is open Analytics – User Manual V1.1 Confidential 24 Cross Locked Display “Min CrossLock” The following dialog displays to enable the user to select the pre filled values of “Min Cross” from the available combo Highs “Set Minimum Hits/Change…” The following dialog displays how to enter the values to filter data. The value for Minimum Display Hits can be entered in the text box in order to filter the data. The 2nd column of Highs window shows the Display Hits. Analytics – User Manual V1.1 Confidential 25 The Minimum Net can be selected from the available combo. The 3rd column of Highs window shows the Net value. Similar filter dialog is also available for Lows, Highs & Lows window Top Volume “Background Color…” For some Analytic Views, the background color can be changed by clicking the Background Color menu item. It will open a Color Dialog and the user can choose the color for that view’s background color. Similar menu option is also present for “Top Range” , “Top Close Change”, “Top Open Change” and ”Top Percent Change” window Analytics – User Manual V1.1 Confidential 26 Bid and Ask Scan “Symbol Filter” The following Symbol filter dialog pops up when user selects Symbol Filter menu option. User can select Symbol filter with “Symbol Included” or “Symbol Excluded” options as well as ECN Filter with “ECN Included” or “ECN Excluded” options as shown in the following figure to filter out the data Symbols can be edited on the available Symbol text box and then added to the list box by clicking on the Add Symbol button. Similar operation could be done in ECN filter too. Also user can select any symbol from the list box and delete that by selecting the “Delete Symbol” button Analytics – User Manual V1.1 Confidential 27 Bid and Ask Scan “Bid Ask Filter” Following dialog shows how to filter while setting values for minimum size (share), Min Spread and Min Ask. For Min Size, the entered value must be multiple of the value displayed under share column. Analytics – User Manual V1.1 Confidential 28 Price Alerts “Price Alert Filter” The following dialog shows how to filter symbols with it’s below and above values. Imbalance “Imbalance Filter” Note: Similar filter dialog with caption “Regulatory Imbalance Filter” is attached with the “Regulatory Imbalance” window Analytics – User Manual V1.1 Confidential 29 Cross Prints “Min CrossLock” The following dialog shows how to set the values in order to filter Quantity, Price and Delta column values. Bid/Ask Spread “Spread Filter” Following dialog shows how to set the values for Min Spread and Max. Spread in order to filter the data. Analytics – User Manual V1.1 Confidential 30 7. Exiting the Application Action Exit Note: Application can be also exited by clicking on the cross button on the top right corner of the dialog Analytics – User Manual V1.1 Confidential 31