1
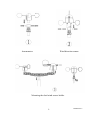
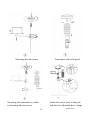
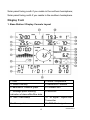
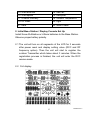
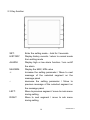
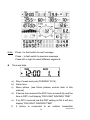
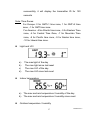
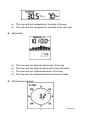
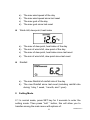
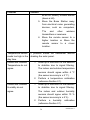
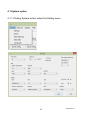
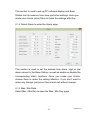
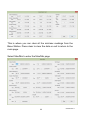
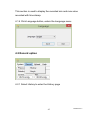
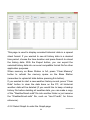
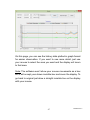
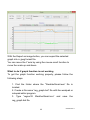
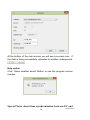
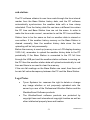
TP2700WC PROFESSIONAL WEATHER STATION Operations Manual About This Manual Thank you and congratulations on selecting this professional weather station! We are positive you will enjoy the benefits of accurate weather readings and the precise radio controlled time information that our instruments offer. This manual will guide you step-by-step through setting up your device. Use this manual to become familiar with your professional weather station, and save it for future reference. Glossary of Common Terms DCF/WWVB/MSF The DCF, WWVB or MSF time signal is an AM modulated time-of-day signal broadcasted by the Federal Government of Germany, NIST from USA or National Physical Laboratory. The time base is generated from an atomic time generator which is accurate to 10 billions of one second. This weather station uses WWVB only. LCD “LCD” is an acronym for ”Liquid Crystal Display”. This is a common type of display screen used in televisions, computers, watches, and digital clocks. 1 8000040 Rev 3 BAROMETER & BAROMETRIC PRESSURE A barometer is a device that measures the pressure of the air pushing on it—this measurement is called the barometric pressure. We don’t actually feel the barometric pressure because the air pressure is pushing equally in every direction. RELATIVE AIR PRESSURE Relative air pressure is the same as the barometric pressure. The calculation of relative air pressure is the absolute air pressure adjusted for altitude. ABSOLUTE AIR PRESSURE Absolute air pressure is the actual air pressure on the barometer without regard to altitude. INCHES OF MERCURY (inHg) Inches of Mercury is the common unit of measurement for air pressure in the United States. HECTOPASCALS (hPa) Hectopascals are the common units of measurement for air pressure in the International System (SI) of measurement. Important Note: The Professional weather station includes a Base Station (receiver), a transmitter unit with solar sensor, one wind direction sensor, one wind speed sensor, one rain gauge, USB cable and a PC software package on CD-ROM. An added feature of the Weather Station is the readout of all measured and displayed time and weather data on a PC through a USB connection. 2 8000040 Rev 3 OVERVIEW Base Station / Display console 5VDC USB interf Note: The unit can be powered with USB or via the 5VDC Connector in addition to 3 AA batteries. QTY Item 1 Display Console / Base Station 1 Outdoor Sensor Array (Thermo-hygrometer Transmitter with Solar Panel / Rain Gauge / Wind Speed Sensor/ Wind Direction) 1 CD contains PC software 1 USB Cable for connecting to a PC 1 Pole 1 Pole mounting clamps 1 User manual 2 AA rechargeable batteries for the Transmitter 3 8000040 Rev 3 Features Time, date, and Moon phase Indoor temperature and humidity Outdoor temperature and humidity Wind chill, wind direction Rainfall Display rain level and rainfall data in 24 hours, one week, one month, one year, total rain and rainfall event Wind speed in mph, km/h, m/s, knots or Beaufort The direction of the wind with 360 degrees Wind chill, dew point and heat index temperature display Barometric Pressure History, weather forecast MAX, MIN value with time stamp High / low alarms With message panel showing indication of alarms/Min/Max data, with time stamps Light and UV index Data saved in non-volatile memory with unlimited storage on PC Windows software Upload weather data to Weather Underground Set up Guide Before placing and installing all components of the weather station at their final destination, please set up the weather station with all parts nearby in order to test for correct function. 4 8000040 Rev 3 Setting up the Base Station and transmitter Thermo-hygro Sensor / Transmitter Setting up using batteries: LED Indicator Sensor Sockets Battery cover Battery Compartme nt 1) Insert two AA 1.5V alkaline rechargeable batteries or AA Lithium batteries first into the battery compartment of the transmitter and immediately afterwards three AA 1.5V alkaline or Lithium batteries in the Base Station, observing the correct polarity. When battery is first inserted, the red LED light on the remote sensor will light up for 3-4 seconds. (If no LED light or it is lit permanently, make sure the battery is inserted the correct way. Try resetting by removing the batteries, waiting 2 mins. and re-inserting) 2) When the Base Station is powered up, the LCD display activates for 3 seconds and after the “Beep”, it begins measuring indoor temperature, humidity and air pressure. The unit then enters the RF (Radio Frequency) state, where it receives data from the remote sensor transmitter. During 5 8000040 Rev 3 Base Station startup, there is no communications with the computer and normal communications will only resume after the startup has completed. RF (Radio Frequency) Receiving Mode 1. After power-on, the Base Station also enters the RF receiving state for 180s. During this time it will search for the transmitter signal. When it receives the transmitter signal and registers the transmitter, it will display outdoor temperature, humidity, rain, and wind readings. The light readings are a separate RF channel and may appear before or later than the other outdoor readings. 2. Base Station receives the temperature, humidity, wind speed and rain data each 48s and receives light data each 60s. If there is no signal received from the transmitter for 10 minutes, the outdoor temperature and humidity will display “----”. If the Base Station doesn’t receive the signal in 240 minutes, the Base Station will start to search for and register a new transmitter. 3. If the outdoor data is lost or a battery is changed in the transmitter, press the reset button on the bottom of the solar panel housing to send a reset signal to the Base Station. This will cause the Base Station to search for and re-register the transmitter. 4. Do not press any key until the outdoor transmitter data is received, otherwise the outdoor sensor search and register mode will be terminated. When the outdoor transmitter has been registered, the Base Station will automatically switch to the normal display mode from which all further settings can be performed by the user. 6 8000040 Rev 3 5. If there are no outdoor readings on the Base Station, make sure the units are within range of each other or repeat the battery installation procedure. Radio Controlled Clock (RCC) 1. When the Base Station is first powered up it will try to get data from the outdoor transmitter for 30 seconds and then it begin RCC clock reception. During the RCC time reception period, no weather data will be transmitted (to avoid interference). 2. If the RCC signal reception is not successful within 1 minute, the signal search will be cancelled and will automatically resume every two hours until the signal is successfully captured by the outdoor transmitter. In some locations, RCC reception could take a couple days before the signal is received successfully. 4. If RCC is received successfully, the signal icon will be displayed near the memory indicator window. Otherwise the icon will be hidden. If the RCC isn’t received it could be due to the location of outdoor transmitter or possibly that the proper RCC signal isn’t available in your area. You can try re-positioning the outdoor transmitter so it has a clear view of the sky or you can disregard and set the Base Station time manually. Note: The RCC is a shortwave signal originating near Fort Collins, CO and travels thousands of miles by bouncing between the ionosphere and the ground. Solar interference can block the signal. Thus, it is most likely to be received at night. Note: 7 8000040 Rev 3 Commonly the radio communication between receiver and transmitter in the open field can reach a distance of up to 330 feet providing that there are no interfering obstacles such as buildings, trees, vehicles, high voltage lines, etc. Radio interferences such as PC screens, radios or TV sets can, in bad cases, entirely cut off radio communication. Please take this into consideration when choosing standing or mounting locations. Mounting the Sensor Important Notes: On the edge of wind direction sensor, there are four alphabet letter of “N”,”E”,”S” and “W” representing the directions of North, East, South and West. These are located just under the rotating hub. The entire sensor array has to be rotated so that the direction indicators on the wind direction sensor are aligned with North, South East and West at your actual location. The screw head attaching the wind direction sensor will be pointing North in a proper install. A permanent wind direction error will be introduced if the wind direction sensor is not positioned correctly during installation. 8 8000040 Rev 3 Anemometer Wind direction sensor Mounting the dual wind sensor holder 9 8000040 Rev 3 Transmitter with solar panel. Mounting the rain sensor Attach the sensor array to the pole with the two adjustable hose clamps. Mounting the transmitter is similar to mounting the rain sensor 10 8000040 Rev 3 Note: The tilt in the solar panel cover should be facing toward the Equator. South in the Northern hemisphere and North in the Southern hemisphere. You can adjust by rotating the entire transmitter assembly around the pole. The anemometer’s cable is connected to the input on the wind direction sensor. The wind direction sensor’s cable is connected to the input marked Wind on the Transmitter The rain sensor’s cable is connected to the input marked Rain on the solar panel The solar panel’s cable is connected to the input marked Rain on the Transmitter The Solar Panel Module The solar panel module makes use of solar energy to power the Transmitter. Note: It can be used with AA size alkaline rechargeable batteries or AA Lithium Batteries. For the solar panel modules to function properly, make sure the solar receptors on the top are exposed to sunlight and the connectors of the connection cables are securely plugged in. For best results, orient the angled face of the solar panel as follows: 11 8000040 Rev 3 Solar panel facing south if you reside in the northern hemisphere; Solar panel facing north if you reside in the southern hemisphere. Display Unit 1. Base Station / Display Console Layout 22 1.Time 2. Indoor Temperature 3. Indoor Humidity 4. Barometric Pressure 5. Barometric Pressure graph 6. Forecast icon 7. Message panel showing 8. Minimum indication of alarms/Min/Max data 10.RF signal – Signal from 9. Time / Date stamp Transmitter 11. Memory status 12. RCC Clock signal 12 8000040 Rev 3 13. Wind direction 14. Rain fall 15. Wind speed 16. Dew point 17. Outdoor Humidity 18. Outdoor Temperature 19. UV index 20. Light 21. Date 22. Moon Phase 2. Initial Base Station / Display Console Set Up Install three AA Alkaline or Lithium batteries to the Base Station. Observe proper battery polarity. 2.1 The unit will turn on all segments of the LCD for 3 seconds after power reset and display setting value (RCC and RF frequency option). Then the unit will start to register the outdoor Transmitter which takes about 3 minutes. When the registration process is finished, the unit will enter the RCC receive mode. 2.2 Full display 13 8000040 Rev 3 2.3 Key function SET: HISTORY: ALARM: MAX/MIN: +: -: LEFT: RIGHT: Enter the setting mode – hold for 3 seconds Display history records / return to normal mode from setting mode Display high or low alarm function / turn on/off the alarm Display the MAX, MIN value Increase the setting parameter / Move to next message of the selected segment on the message panel decrease the setting parameter / Move to previous message of the selected segment on the message panel Move to previous segment / move to main menu during setting Move to next segment / move to sub menu during setting 14 8000040 Rev 3 Base Station / Display Console Operation Program mode The screen is divided into 10 segments for selection and there is a message display panel on the bottom. There are six program modes: normal, setting mode, history mode, alarm mode, max/min mode and calibrated mode. All the modes can be exited at any time by pressing the HISTORY key, or waiting for a 30 second timeout to take effect. Normally, if the segment selected has multiple parts, press SET key to choose a different part. Example: the current section is RAIN, you can press SET key to select among RAIN RATE, RAIN EVENT, DAY, WEEK, MONTH, YEAR and TOTAL. 1. Quick Display Mode (Updates every 5 Seconds) In the normal mode and once a segment is selected (Different segments can be chosen by pressing” Left ” or ” Right” key. The default selected segment is time and date), there will be different messages that show on the message panel. If any alarms occurred, the alarm information will be displayed in real time as well. The messages will rotate automatically or you can transfer between messages manually by pressing ”+” or “-” button. 15 8000040 Rev 3 Note: Press + to fast switch to next message Press – to fast switch to previous message Press left or right to select different segments Time and date a) b) c) d) e) f) Day of week and year (TUESDAY 2014) Alarm time Moon phase. (see Moon phases section later in this manual) If device has received the RCC time successfully and the time is DST, it will display “DAYLIGHT SAVINGS TIME” If no RCC received and the DST setting is ON, it will also display “DAYLIGHT SAVINGS TIME” If device is connected to an outdoor transmitter 16 8000040 Rev 3 successfully, it will display the transmitter ID for 120 seconds Note: Time Zones: For Europe: 0 for GMT+1 time zone, 1 for GMT+2 time zone, -1 for GMT time zone. For America: -4 for Atlantic time zone, -5 for Eastern Time zone, -6 for Central Time Zone, -7 for Mountain Time zone, -8 for Pacific time zone, -9 for Alaska time zone, -10 for Hawaii time zone. Light and UVI a) b) c) d) Indoor temperature a) b) The max light of the day The max light since last reset The max UVI of the day The max UVI since last reset The max and min temperature / humidity of the day The max and min temperature / humidity since reset Outdoor temperature / humidity 17 8000040 Rev 3 a) b) Barometric a) b) c) d) The max and min temperature / humidity of the day The max and min temperature / humidity since last reset The max and min absolute barometric of the day The max and min absolute barometric since last reset The max and min relative barometric of the day The max and min relative barometric since last reset Wind and gust speed 18 8000040 Rev 3 a) b) c) d) Wind chill, dew point, heat index a) b) c) d) The max wind speed of the day The max wind speed since last reset The max gust of the day The max gust since last reset The max of dew point, heat index of the day The min of wind chill, dew point of the day The max of dew point, heat index since last reset The min of wind chill, dew point since last reset Rainfall a) b) The max Rainfall of rainfall rate of the day The max Rainfall since last reset (including rainfall rate during 1 day, 1 week, 1 month, and 1 year) 2. Setting Mode 2.1 In normal mode, press SET key for 3 seconds to enter the setting mode. Then press ”Left ” button, this will allow you to transfer among the main menu with options of: 19 8000040 Rev 3 TIME SETTING UNIT SETTING Record save interval Rain sensor setting Barometric setting Contrast setting Key Beep Setting REREGISTER Transmitter Calibration setting Transmitter ID Choose one option and then press “Right” button. This allows you to enter the sub menu. Press + / - key to transfer the unit or change the value. Hold the + / - key for 2 seconds to increase / decrease digits in large steps. Press HISTORY key or wait for 30 seconds at any time; the Display Console will then return to normal mode. Sub menus of every option: TIME SETTING a) 12H / 24H format select b) MM-DD-YYYY / DD-MM-YYYY / YYYY-MM-DD select c) Set time (hour, minute) d) Set clock (month, day, year) e) Time Zone select f) Daylight saving settings (DST ON / OFF) g) Set Latitude (NORTH or SOUTH) 20 8000040 Rev 3 UNIT SETTING a) Light unit select (lux, fc, w/m2) b) Temperature unit select (C, F) c) Pressure unit select (hpa, inhg, mmhg) d) Wind speed unit select (km/h, m/s, bft, mph, knots) e) Rainfall unit select (mm, inch) Save record interval time setting: 16S, 32S, 48S, 1M, 2M, …, 239M, 240M S: Seconds M: Minute RAINY SEASON BEGINS (JAN, FEB, MAR, APR, MAY, JUN, JUL, AUG, SEP, OCT, NOV, DEC) Default: January. The total rain falls before date will be cleared once it comes to 0:00 of January 1st. This means the new annual statistic of rain fall begins from 0:00 on January 1st. Users can choose any month from January to December. PRESSURE SETTING a) Current weather setting b) Select the synoptic chart, Pre-set the value of weather and Pre-storm value c) Select the historical time coordinates of pressure graph LCD contrast setting Level 1-9 for option. Default: 5. The higher the level is, the brighter the display is. KEY BEEP ON/OFF 21 8000040 Rev 3 Register new transmitter (REREGISTER ON / OFF) Calibration setting a) LIGHT FACTOR LUX index calibration coefficient: default 1. (Range is 0.1-10) b) UV FACTOR UV factor calibration coefficient: default 1 (Range is 0.1-10) c) IN TEMP CORRECT Indoor temperature can be calibrated within measuring range d) IN HUMI CORRECT Indoor humidity can be calibrated within measuring range e) OUT TEMP CORRECT Outdoor temperature can be calibrated within measuring range f) OUT HUMI CORRECT Outdoor humidity can be calibrated within measuring range g) ABS PRESS CORRECT Absolute pressure can be calibrated within measuring range h) REL PRESS CORRECT Relatively pressure be calibrated within measuring range i) WIND DIR CORRECT Wind direction can be adjusted by 0-359°. For Southern 22 8000040 Rev 3 Hemisphere installations, the wind direction needs to change by 180° j) WIND FACTOR Wind speed calibration coefficient: default 1 (range is Range is 0.1-2.5) k) RAIN FACTOR Rain factor calibration coefficient: default 1 (range is Range is 0.1-2.5) l) RAIN DAY CORRECT Calibration for total rain falls of 1 day. (Range is 0-9999mm) m) RAIN WEEK CORRECT Calibration for total rain falls of 1 week (Range is 0-9999mm) n) RAIN MONTH CORRECT Calibration for total rain falls of 1 month (Range is 0-9999mm) o) RAIN YEAR CORRECT Calibration for total rain falls of 1 year (Range is 0-9999mm) p) RAIN TOTAL CORRECT Calibration for total rain falls since last reset. (Range is 0-9999mm) Transmitter ID Display the transmitter ID ALARM SETTING MODE 23 8000040 Rev 3 In normal mode, press ALARM key you will enter high alarm mode, press ALARM key again and you will switch to low alarm mode. HIGH ALARM SETTING Press Left/Right key to transfer among the different segments and press +/- key to adjust the value of the high alarm. TIME ALARM – Set time alarm LIGHT HIGH ALARM – Set light high alarm UVI HIGH ALARM – Set UVI high alarm In TEMP HIGH ALARM – Set indoor temperature high alarm e) In HUMI HIGH ALARM – Set indoor humidity high alarm f) Out TEMP HIGH ALARM – Set outdoor temperature high alarm g) Out HUMI HIGH ALARM – Set outdoor humidity high alarm h) ABS BARO HIGH ALARM – Set absolute barometric pressure high alarm i) REL BARO HIGH ALARM – Set relative barometric pressure high alarm j) WIND HIGH ALARM – Set wind speed high alarm k) GUST HIGH ALARM – Set gust speed high alarm l) DEW POINT HIGH ALARM – Set dew point high alarm m) HEAT INDEX HIGH ALARM – Set heat index high alarm n) RAIN RATE HIGH ALARM – Set rainfall rate high alarm o) RAIN DAY HIGH ALARM – Set rainfall day high alarm a) b) c) d) LOW ALARM SETTING a) In TEMP LOW ALARM – Set indoor temperature low alarm b) In HUMI LOW ALARM – Set indoor humidity low alarm 24 8000040 Rev 3 c) d) e) f) g) h) In TEMP LOW ALARM – Set outdoor temperature low alarm Out HUMI LOW ALARM – Set outdoor humidity low alarm ABS BARO LOW ALARM – Set absolute barometric low alarm REL BARO LOW ALARM – Set relatively barometric low alarm WIND CHILL LOW ALARM – Set wind chill low alarm DEW POINT LOW ALARM – Set dew point low alarm In alarm setting mode, you can press the SET key to choose turn the alarm on or off. Press ALARM key, you can switch between high alarm and low alarm setting. Press HISTORY key or wait for 30 seconds at any time, you will return to normal mode. When alarm occurs, the alarm information will be displayed in real time on the message panel. You can press any key to stop it. But the alarm ICON will still flash until the weather data returns to normal range. 3. Max / Min Mode In Normal Mode, press the MIN/MAX key to enter the max/min mode. Press MIN/MAX to select todays minimum / maximum and historical min / max. Press LEFT/RIGHT key to enter the sub menu of the each 4 options and display the maximum or minimum values of each parameter together with the time and date stamp. Today max and Total max: 25 8000040 Rev 3 Today max: The Maximum of 1 day Total max: The Maximum of total since last reset a) LIGHT TODAY MAX, LIGHT TOTAL MAX – Maximum Light b) UV TODAY MAX, UV TOTAL MAX – Maximum UVI c) IN TEMP TODAY MAX, IN TEMP TOTAL MAX – Maximum Indoor temperature d) IN HUMI TODAY MAX, IN HUMI TOTAL MAX – Maximum Indoor humidity e) OUT TEMP TODAY MAX, OUT TEMP TOTAL MAX – Maximum Outdoor temperature f) OUT HUMI TODAY MAX, OUT HUMI TOTAL MAX – Maximum Outdoor humidity g) ABS BARO TODAY MAX, ABS BARO TOTAL MAX – Maximum Absolute barometric h) REL BARO TODAY MAX, REL BARO TOTAL MAX – Maximum Relative barometric i) WIND SPEED TODAY MAX, WIND SPEED TOTAL MAX – Maximum Wind speed j) GUST SPEED TODAY MAX, GUST SPEED TOTAL MAX – Maximum Gust speed k) DEW POINT TODAY MAX, DEW POINT TOTAL MAX – Maximum Dew point temperature l) HEAT INDEX TODAY MAX, HEAT INDEX TOTAL MAX – Maximum Heat index temperature m) RAIN RATE TODAY MAX, RAIN RATE TOTAL MAX – Maximum Rainfall rate n) RAIN 24H TOTAL MAX – Maximum Rainfall within 24 hours o) RAIN WEEK TOTAL MAX – Maximum Rainfall within 1 week p) RAIN MONTH TOTAL MAX – Maximum Rainfall within 1 month 26 8000040 Rev 3 q) RAIN YEAR TOTAL MAX – Maximum Rainfall within 1 year Today min and Total min: Today min: The Maximum of 1 day Total min: The Maximum of total since last reset a) b) c) d) e) f) g) h) IN TEMP TODAY MIN, IN TEMP TOTAL MIN – Minimum Indoor temperature IN HUMI TODAY MIN, IN HUMI TOTAL MIN – Minimum Indoor humidity OUT TEMP TODAY MIN, OUT TEMP TOTAL MIN – Minimum Outdoor temperature OUT HUMI TODAY MIN, OUT HUMI TOTAL MIN – Minimum Outdoor humidity ABS BARO TODAY MIN, ABS BARO TOTAL MIN – Minimum Absolute barometric REL BARO TODAY MIN, ABS BARO TOTAL MIN – Minimum Relatively barometric WIND CHILL TODAY MIN, WIND CHILL TOTAL MIN – Minimum Wind chill temperature DEW POINT TODAY MIN, DEW POINT TOTAL MIN – Minimum Dew point temperature Each maximum/minimum value can be cleared by pressing the SET key for 3 seconds during this mode. Press the HISTORY key or wait for 30 seconds to return to Normal Mode. 4. History mode In normal mode, press the history key to switch to history mode. If no history data, it will show “HISTORY” and “NONE RECORD(ed)” in the message panel. Otherwise, it will display a 27 8000040 Rev 3 message like “HISTORY P/R 1.01” and “YEAR / SECOND 13.06”. In the example above: P means PAGE, R means RECORD. 1 is PAGE No., 01 is record No. Every page includes 32 records of history data. “YEAR / SECOND 13.06” is a time stamp of the record. 13 means 2013 year, 06 is the seconds stamp. The hour, minute, and date stamp will be shown in the time segment section of the display. Press the + / – key to switch to next / previous record. Press the LEFT / RIGHT key to switch to next / previous page. Other Console Functions Weather Tendency indicators There are tendency indicators which appear next to the indoor / outdoor temperature and humidity segments. They are defined below: Tendency indicators Meaning Humidity Temperature Rising Rising rate >= 10% within 30 minutes Rising >= 1℃ change within 30 minutes Steady Change rate < 10% within 30 minutes Change rate < 1℃ change within 30 minutes Falling Falling rate >= 10% within 30 minutes Falling >= 1℃ change within 30 minutes Moon Phases 28 8000040 Rev 3 Note: For the moon phases to display correctly you must manually set the time on the Base Station / display console after any Base Station reset. Icon: Northern Hemisphere Moon Phase Description Icon: Southern Hemisphere NEW MOON WAXING CRESCENT MOON FIRST QUARTER MOON WAXING GIBBOUS MOON FULL MOON WANING GIBBOUS MOON LAST QUARTER MOON WANING CRESCENT MOON Beaufort Scales (Wind Speed) Wind speed Beaufort number 29 Description 8000040 Rev 3 0-1mph(0-1.6kph) 0 Calm 1-3mph(1.6-4.8kph) 1 Light air 3-7mph(4.8-11.3kph) 2 Light breeze 7-12mph(11.3-19.3kph) 3 Gentile breeze 12-18mph(19.3-29.0kph) 4 Moderate breeze 18-24mph(29.0-38.6kph) 5 Fresh breeze 24-31mph(38.6-49.9kph) 6 String breeze 31-38mph(49.9-61.2kph) 7 Near gale 38-46mph(61.2-74.1kph) 8 Gale 46-54mph(74.1-86.9kph) 9 Strong gale 54-63mph(88.5-101.4kph) 10 Storm 66-73mph(103-117.5kph) 11 Violent storm 74mph or above(119.1kph) 12 Hurricane Specification Factory Default Settings EU (DCF, MSF) Version: 1) 2) 3) 4) 5) 6) Time: 1/1/2000 0:00:00 31/12/2099 23:59:59 (default: 1/1/2014 0:00 00 WED) Time zone: -12 +12 (default: DCF:1, MSF:0) 12 / 24 hour format (default: 24hr) DD-MM-YYYY / MM-DD-YYYY / YYYY-MM-DD format (default: DD-MM-YYYY) Temperature unit C or F (default: C) Wind speed units: km/h, m/s, bft, mph, knots (default: 30 8000040 Rev 3 7) 8) 9) 10) 11) 12) 13) 14) 15) 16) 17) 18) 19) 20) 21) 22) 23) 24) 25) km/h) Average wind speed / gust wind speed (default: average wind speed) Pressure units: hpa, mmHg, inHg (default: hpa) Weather forecast: 2, 3, 4 (default: 2) Storm: 39 (default: 4) Time format of history graph: 12h, 24h (default: 12h) Pressure display: absoluteness or relative (default: relative) Forecast : sun, partly cloudy, cloudy, rain, rain storm (default: partly cloudy) Temperature exponent: wind chill, dew point, heat index (default: dew point) Light units: lux, fc, w/m2 (default: w/m2) Rainfall units: mm, inch (default: mm) Rainfall display: rainfall rate/rainfall event/24H/WEEK/MONTH/YEAR (default: RAINFALL RATE) Rainfall of year season begin (default: JAN) Time alarm: 0:00 23:59 (default: 0:00, disable) Indoor temperature high alarm: -40.0 60.0C (14F 140F) (default: 20.0C, disable) Indoor temperature low alarm: -40.0 60.0C (14F 140F) (default: 0.0C, disable) Indoor humidity high alarm: 1% 99% (default: 65%, disable) Indoor humidity low alarm: 1% 99% (default: 35%, disable) Outdoor temperature high alarm: -40.0 60.0C (-40F 140F) (default: 30.0C, disable) Outdoor temperature low alarm: -40.0 60.0C (-40F 31 8000040 Rev 3 140F) (default: -10.0C, disable) 26) Outdoor humidity high alarm: 1% 99% (default: 75%, disable) 27) Outdoor humidity low alarm: 1% 99% (default: 45%, disable) 28) Wind chill temperature low alarm: -40.0 60.0C (-40F 140F) (default: 0.0C, disable) 29) Dew point temperature high alarm: -40.0 60.0C (-40F 140F) (default: 10.0C, disable) 30) Dew point temperature low alarm: -40.0 60.0C (-40F 140F) (default: -10.0C, disable) 31) Heat index temperature high alarm: -40.0 60.0C (-40F 140F) (default: 27.0C, disable) 32) Rainfall alarm: rainfall rate and rainfall 24H: 0-999.9mm (default: 0.0mm, disable) 33) Wind speed alarm: 0-50.0m/s (default: 1.8km/h, disable) 34) Guest speed alarm: 0-50.0m/s (default: 3.6km/h, disable) 35) Light high alarm: 0 to 300000 (default: 200000lux, disable) 36) UVI high alarm: 0 to 15 (default: 10, disable) USA (WWVB) Version (difference with EU version): 1) Time zone: default -5 2) 12/24 hour format: default 12hr 3) DD-MM-YYYY / MM-DD-YYYY / YYYY-MM-DD format (default: MM-DD-YYYY) 4) Temperature unit: F 5) Pressure unit: inHg 6) Wind speed unit: mph 7) Rain fall unit: inch 32 8000040 Rev 3 Specifications 1) 2) 3) 4) 5) 6) 7) 8) Indoor temperature measure range: -40 to 60C Outdoor temperature measure range: -40 to 60C Humidity measuring range: 1% to 99% Wind speed measure range: 0 to 50.0m/s Wind direction: 0 to 359 degree Rainfall range: 0 to 9999.9 mm Light range: 0 to 300000.0 lux UVI range: 0 to 15 index (0 to 20000 w/m2) Troubleshooting Guide Problem Solution Transmitter (outdoor unit) not reporting in to console. Check the transmitter and / or solar panel LED for flashing. You must remove the radiation shield to view the LED on the transmitter. There are dashes (--) on the display console. The transmitter has a LED just above the battery compartment. The solar panel has a led just below the solar panel. The LED should flash every 48 seconds. If the LED is not flashing every 48 seconds, Replace the batteries in the outside 33 8000040 Rev 3 Problem Solution transmitter. Always wait at least 2 minutes after removing the batteries before re-inserting to the transmitter. If the batteries were recently replaced, check the polarity. If the sensor is flashing every 48 seconds, proceed to the next step. There may be a temporary loss of communication due to reception loss related to interference or other location factors, or the batteries may have been changed in the remote and the Base Station has not been reset. The solution may be as simple as powering down and up the Base Station. 1. Make sure you have fresh batteries in the Base Station. 2. With the sensor array and Base Station 10 feet away from each other, remove the batteries from the Base Station and wait 10 seconds. Put the batteries back in. 3. Do not touch any buttons for several minutes. 4. The remote sensor search icon will splash on the display. Wait several minutes for this icon to turn off. 34 8000040 Rev 3 Problem Solution 5. If the search icon turns off and the outdoor temperature and humidity are still showing dashes (--), the remote sensor may be defective. If the sensor properly syncs up, proceed to the next step “How to prevent intermittent wireless communication”. How to prevent intermittent wireless communication issues: 1. Install a fresh set of batteries in the remote sensor array and Base Station. For cold weather environments, install lithium batteries. 2. The maximum line of sight communication range is 300’ but most users will get 100’ or less due to environmental conditions. Move the sensor and Base Station closer together. 3. If the sensor assembly is too close (less than 5’), move the remote sensor assembly away from the Base Station. 4. Make sure the remote sensors are not transmitting through solid metal like aluminum siding (acts 35 8000040 Rev 3 Problem Solution as an RF shield), or earth barrier (down a hill). 5. Move the Base Station away from electrical noise generating devices, such as computers, TVs and other wireless transmitters or receivers. 6. Move the remote sensor to a higher location or Move the remote sensor to a closer location. Temperature sensor reads too high in the day time. If possible shade the transmitter without shading the solar panel. Indoor and Outdoor Temperature do not agree. 1. Allow up to one hour for the sensors to stabilize due to signal filtering. The indoor and outdoor temperature sensors should agree within 4 °F (the sensor accuracy is ± 2 °F). 2. Perform a temperature calibration (reference Section 2.1). Indoor and Outdoor Humidity do not agree. 1. Allow up to one hour for the sensors to stabilize due to signal filtering. The indoor and outdoor humidity sensors should agree within 10 % (the sensor accuracy is ± 5 %) 2. Perform a humidity calibration (reference Section 2.1). 36 8000040 Rev 3 Problem Relative pressure does not agree with official reporting station. Solution 1. You may be viewing the relative pressure, not the absolute pressure. 2. Make sure you properly calibrate the barometer to an official local weather station (reference Section 2.1) 3. The barometer is only accurate to ± 0.08 inHg within the following relative pressure range: 27.13 to 32.50 inHg, which corresponds to an altitude of -2,200 to 2,700 feet. At higher altitudes, expect some non-linearity error. Time is incorrect. Make sure your time zone and daylight savings time setting is correct. The forecast icon is not accurate. The weather station console must run for several days to trend barometric pressure. The weather forecast is an estimation or generalization of weather changes in the next 24 to 48 hours, and varies from location to location. The tendency is simply a tool for projecting weather conditions and is never to be relied upon as an accurate method to predict the weather. Moon phase is not correct. Check your calendar date and make sure it is correct. Display console contrast is weak. Replace Base Station batteries with a fresh set of batteries. 37 8000040 Rev 3 WeatherSmart PC Software User Manual 1.0 General Information The Weather Station is a weather monitoring device that displays and records the weather data from internal and external sensors. Besides the indoor temperature, indoor humidity and air pressure measured by internal sensor, it will receive the outdoor temperature and humidity, wind and rainfall. Light & UVI and Heat index are transmitted by outdoor sensor as well. After installing the “WeatherSmart” program on your windows computer, you can see all the weather data from the Base Station including data from both indoor and outdoor sensors. For operation, simply use the supplied USB cable and connect the Base Station to the PC. After installation and connection you can start to track current and historical weather information at 38 8000040 Rev 3 your fingertips. 2.0 System Requirements To install the “Weather Smart” software onto your PC, the minimum requirements for the PC are as follows: Operating System: Windows NT4 (Service Pack >= 6a), Windows 2000, Windows XP, Windows Vista. Windows 7, Windows 8 Internet Explorer 6.0 or above Processor: Pentium III 500 MHz or above Memory: at least 128MB, 256MB recommended CD-ROM Drive Base Station and PC must be connected by USB cable 3.0 Installation of the “WeatherSmart” Software First, the Base Station and the Outdoor Sensors should be installed and checked for correct function. After successful checking, install the “WeatherSmart” software as follows: 1. Switch on your PC and insert the CD-ROM into the 2. 3. 4. 5. CD-ROM Drive Double click “Weather Smart.exe” Select the installation process language option and click ok Click next and select the destination folder (default is recommended) Click next and select the shortcut folder (default is recommended) 39 8000040 Rev 3 6. Click next and select the additional tasks 7. Click next and setup is now ready to begin installing Weather Smart on your computer 8. Click install, software will be installed automatically 9. Press Finish to finish the installation process and exit. If you tick “Launch Weather Smart” the software will start to run 10. Normally the installation process will install a launch icon on your desktop. Double click this icon to open WeatherSmart anytime Note: The graphic function needs the software to be installed under the administrator account. If it is installed under limited user accounts, the graphic function of the software might not be working correctly. 4.0 Basic Settings of the “WeatherSmart” Software After the “WeatherSmart.exe” program has been started, the following main window will appear on the PC screen: 40 8000040 Rev 3 All the settings from the base unit are mirrored into the PC software, so once you have done your settings on the base unit, then you don’t need to make any setting changes on the PC software. However, you can still easily make any setting changes you wanted on the PC and the Base Station will be updated automatically (the setting changes will be refreshed after 1 minute). When the Base Station is connected to the PC, it shows “USB Connected” at the bottom of screen. If no Base Station is connected, it shows “USB Unconnected”. Tool Bar: The tool bar at the top of the screen has 4 options; System, Record, Upload and Help. 41 8000040 Rev 3 4.1 System option 4.1.1 Clicking System button enters the Setting menu 42 8000040 Rev 3 This section is used to set up PC software display and Base Station unit of measure, time zone and other settings. Once you made your choice, press Save to make the settings effective. 4.1.2 Select Alarm to enter the Alarm page This section is used to set the desired time alarm, high or low alarm values for the Base Station, as well as enable or disable the corresponding alarm functions. Once you made your choice, choose Save to make the setting effective. If you don’t want to make any change, just press Cancel and exit without change. 4.1.3 Max / Min Data Select Max / Min Day to open the Max / Min Day page 43 8000040 Rev 3 This is where you can clear all the min/max readings from the Base Station. Press clear to clear the data or exit to return to the main page. Select Max/Min to enter the Max/Min page 44 8000040 Rev 3 This section is used to display the recorded min and max value recorded with time stamp. 4.1.4 Click Language button, enters the Language menu 4.2 Record option 4.2.1 Select History to enter the History page 45 8000040 Rev 3 This page is used to display recorded historical data in a spread sheet format. If you wanted to see all history data in a desired time period, choose the time duration and press Search to reload the history data. With the Export button, you can export the selected history data into an excel compatible format file for other application purposes. When memory on Base Station is full, press “Clear Memory” button to refresh the memory space on the Base Station (remember to upload all data before pressing this button). If you wanted to start a new weather history record, press “Clear Data” button to clear the data base on the PC, all historical weather data will be deleted (if you would like to keep a backup history file before deleting all weather data, you can make a copy of the “WeatherSmart.mdb” file into another folder or just rename the “WeatherSmart.mdb” file, such as “Jan-07.mdb”, for future reference). 4.2.2 Select Graph to enter the Graph page 46 8000040 Rev 3 On this page, you can see the history data plotted in graph format for easier observation. If you want to see more detail, just use your mouse to select the area you want and the display will zoom to that area. Note: The software won’t show your mouse movements as a box but it will accept your drawn invisible box and zoom the display. To go back to original just draw a straight invisible line on the display with your mouse. 47 8000040 Rev 3 With the Export as image button, you can export the selected graph into a .jpeg format file. You can move the Y axis by using the mouse scroll function to move the scale up and down. What to do if graph function is not working To get the graph function working properly, please follow the following steps: 1. Find the folder where the “WeahterSmart.exe” file is located. 2. Create a file name “reg_graph.bat” file with the wordpad or notepad editor program. 3. Type “regsvr32 WeatherSmart.ocx” and save the reg_graph.bat file. 48 8000040 Rev 3 4. Double click “reg_graph.bat” file and it should register the graphic driver again. If successful, then the following window will be displayed: 4.3 Upload Click UPLOAD to open the Upload Page. This is where you can set the software to upload the data to Weather Underground. First you must create a free account for your weather station at wunderground.com. Then you enter your Weather Underground credentials in ID and PASSWORD. Be sure to check Auto Upload to automatically upload real time data to Weather Underground. Your weather station must be connected to your PC which must be on and connected to the internet, the WeatherSmart software must be running in order to upload data to Weather Underground. If your PC is turned off and it cannot upload that realtime data, that data won’t be uploaded. There is no way to upload past data to weather underground using this software, only real time data. 49 8000040 Rev 3 At the bottom of the main screen you will see a success icon if the data is being successfully uploaded to weather underground. Help option Click “About weather smart” Button to see the program version number. Special Notes about time synchronization between PC and 50 8000040 Rev 3 sub-station: The PC software obtains its own time scale through the time interval marker from the Base Station history data, and the PC software automatically synchronizes the weather data with a time stamp calculated. Thus the history data file can have a different time when the PC time and Base Station time are not the same. In order to make the time scale correct, remember to set the PC time and Base Station time to be the same so that no weather data is missed or over-written. If the weather history memory on the Base Station is cleared manually, then the weather history data since the last uploading will be lost permanently. Before the memory is used up (memory icon on LCD display showing 100% full), remember to upload the weather history data to the PC periodically. If the Base Station is connected to the PC full time through the USB port and the weather station software is running on the PC then the weather station data will upload automatically in real time and there is no need to clear the memory. If the rain fall readings on the Base Station are reset, then there will be rain fall value discrepancy between the PC and the Base Station. Legal Notes Tycon Systems Inc. reserves the right to delete or change any image whether or not purposely uploaded onto the server by a user of the Professional Weather Station and the WeatherSmart Software products. The WeatherSmart software products are protected by copyright laws and international copyright treaties as well as other intellectual property laws and treaties. 51 8000040 Rev 3