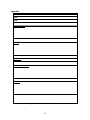
1
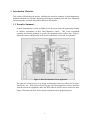
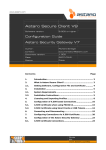
Fermentation Vessel Control and Automation
Design Report
Team: Dec06-07
Client:
Stephanie Loveland
ISU Department of Chemical and Biological Engineering
Faculty Advisor:
Dr. Degang Chen
Team Members:
Andrew Arndt
Adam Daters
Bradley DeSerano
Austin Striegel
Report Disclaimer Notice
DISCLAIMER: This document was developed as a part of the requirements of an electrical and computer
engineering course at Iowa State University, Ames, Iowa. This document does not constitute a professional
engineering design or a professional land surveying document. Although the information is intended to be accurate,
the associated students, faculty, and Iowa State University make no claims, promises, or guarantees about the
accuracy, completeness, quality, or adequacy of the information. The user of this document shall ensure that any
such use does not violate any laws with regard to professional licensing and certification requirements. This use
includes any work resulting from this student-prepared document that is required to be under the responsible charge
of a licensed engineer or surveyor. This document is copyrighted by the students who produced this document and
the associated faculty advisors. No part may be reproduced without the written permission of the senior design
course coordinator.
March 31, 2006
Table of Contents
List of Figures ................................................................................................................................iii
List of Tables.................................................................................................................................. iv
List of Symbols ............................................................................................................................... v
List of Definitions .......................................................................................................................... vi
1. Introduction Materials............................................................................................................. 1
1.1 Executive Summary ............................................................................................................ 1
1.2 Acknowledgement............................................................................................................... 2
1.3 Problem Statement .............................................................................................................. 2
1.3.1 Problem Statement .................................................................................................. 2
1.3.2 Problem Solution..................................................................................................... 3
1.4 Operating Environment ....................................................................................................... 4
1.5 Intended User(s) and Intended Use(s)................................................................................. 4
1.5.1 Intended User(s) ...................................................................................................... 4
1.5.2 Intended Use(s) ....................................................................................................... 4
1.6 Assumptions and Limitations.............................................................................................. 4
1.6.1 Assumptions ............................................................................................................ 5
1.6.2 Limitations .............................................................................................................. 5
1.7 Expected End Product and other Deliverables.................................................................... 5
2.
2.5
2.6
Design Approach ............................................................................................................... 6
Design Objectives ............................................................................................................... 6
Functional Requirements..................................................................................................... 6
Design Constraints .............................................................................................................. 7
Technology Considerations and Results ............................................................................. 8
2.4.1 Data Acquisition Board........................................................................................... 8
2.4.2 Signal Conditioning................................................................................................. 8
2.4.3 Oxygen Concentration Meter .................................................................................. 9
Testing Approach .............................................................................................................. 10
Project Continuation.......................................................................................................... 11
3.1
3.2
3.3
3.4
3.5
3.6
Detailed Design ................................................................................................................ 11
Oxygen Concentration Meter ............................................................................................ 12
Mass Gas Flow Meter ....................................................................................................... 13
Signal Conditioning Carrier .............................................................................................. 14
Stirrer Motor Control ........................................................................................................ 15
Data Acquisition Board..................................................................................................... 16
Software Interfacing.......................................................................................................... 17
2.1
2.2
2.3
2.4
3.
4.
Resources.......................................................................................................................... 18
4.1 Task Definitions ................................................................................................................ 18
4.1.1 Task 1 – Problem Definition ................................................................................. 18
4.1.2 Task 2 – Technology Considerations and Selection ............................................. 19
4.1.3 Task 3 – End-Product Design ............................................................................... 19
i
4.1.4 Task 4 – End-Product Prototype Implementation ................................................. 19
4.1.5 Task 5 – End-Product Testing............................................................................... 19
4.1.6 Task 6 – End-Product Documentation .................................................................. 19
4.1.7 Task 7 – End-Product Demonstration ................................................................... 19
4.1.8 Task 8 – Project Reporting.................................................................................... 19
4.2 Personal Effort................................................................................................................... 20
4.3 Other Resource Requirements........................................................................................... 20
4.4 Financial Requirements..................................................................................................... 21
5.
Scheduling ........................................................................................................................ 23
6.
Project Team Information.............................................................................................. 27
Client Information ............................................................................................................. 27
Faculty Advisor Information............................................................................................. 27
Team Members.................................................................................................................. 27
Closing Summary.............................................................................................................. 28
References ......................................................................................................................... 28
6.1
6.2
6.3
6.4
6.5
Appendix ...................................................................................................................................... 29
ii
List of Figures
Item
Page
Figure 1: Mock Fermentation Vessel Apparatus............................................................................. 1
Figure 2: Control flow of System Interaction ................................................................................. 2
Figure 3: Prototype GUI.................................................................................................................. 3
Figure 4: Process Model of Functional Requirements .................................................................... 7
Figure 5: The basic flow diagram of the system ........................................................................... 12
Figure 6: Orion 3-Star Meter........................................................................................................... 1
Figure 7: Rear connections of Orion 3-Star Meter.......................................................................... 1
Figure 8: Omega FMA-5000 Series ................................................................................................ 1
Figure 9: NI SCC-IC20 Current Input Module ............................................................................... 1
Figure 10: Omega FMA-5610 Connector Diagram, NI SCC-IC20 Current Input Module Wiring
Block Diagram ................................................................................................................................ 1
Figure 11: SCC carrier SC-2345 ................................................................................................... 14
Figure 12: Analog Input SCC Configuration, Diagram of Module Layout in SC-2345 Connector
Block ............................................................................................................................................... 1
Figure 13: NI SHC68-68 Connection Cable ................................................................................... 1
Figure 14: GKH Stir Tester............................................................................................................. 1
Figure 15: NI SCC-AI Series Isolated Analog Input Module Wiring Block Diagram ................. 16
Figure 16: NI PCI-6221 DAQ Board .............................................................................................. 1
Figure 17: Initialization Screen ....................................................................................................... 1
Figure 18: Real-time Display Screen .............................................................................................. 1
Figure 19: Original Project Schedule ............................................................................................ 24
Figure 20: Revised Project Schedule ............................................................................................ 25
Figure 21: Deliverable Schedule ................................................................................................... 26
Figure 22: Team Standard Test Documentation ........................................................................... 29
Figure 23: Intended User Survey .................................................................................................. 30
iii
List of Tables
Item
Page
Table 1: Original Personal Effort .................................................................................................. 20
Table 2: Revised Personal Effort .................................................................................................. 20
Table 3: Original Other Resources Required ................................................................................ 21
Table 4: Revised Other Resources Required................................................................................. 21
Table 5: Original Financial Requirements .................................................................................... 22
Table 6: Revised Financial Requirements..................................................................................... 22
iv
List of Symbols
None
v
List of Definitions
COM – Serial communications port
DAQ – Data acquisition
Flash – Animated graphics technology and format from Macromedia, which can be viewed with
a web browser plug-in
GUI – Graphical user interface
I/O – Input/output
LabVIEW – Laboratory Virtual Instrument Engineering Workbench
PCI – Peripheral component interconnect
PPM – Parts per million
PXI – PCI extensions for instrumentation
RPM – Rotations per minute
RS232 – Standard for serial cable interface
SCC – Signal conditioning system offered by National Instruments
SLM – Standard liters per minute
USB – Universal serial bus
VI (virtual instruments) – Sub-unit program in LabVIEW that represents the appearance and
function of a physical implement
vi
1. Introduction Materials
This section will introduce the project, including the executive summary, acknowledgements,
problem statement and solution, operating environment, intended users and uses, limitations
and assumptions, expected end-product and other deliverables.
1.1 Executive Summary
A mock fermentation vessel is available for use by senior chemical engineering students
to conduct experiments in their final laboratory course. This vessel experiment
currently uses archaic methods to operate the equipment and to collect data. Figure 1
shows the current configuration of the mock fermentation vessel and its equipment.
Figure 1: Mock Fermentation Vessel Apparatus
The objective of this project is to design an automated system to collect the necessary
data for the user. This system will involve the use of data acquisition cards to interface
with the current lab equipment, and LabVIEW software will be used to collect the data.
Figure 2 illustrates the flow of the system components in the proposed project.
1
Figure 2: Control flow of System Interaction
A user interface will be created that is simple enough for most users to operate, and will
be dynamic enough to display the appropriate information to the user as well as store
the information to a file for later analysis. Extensive documentation will also be
included with the user interface to insure easy use in the future.
1.2 Acknowledgement
For his aid in this project with technical and practical advice, the team would like to
acknowledge the effort of Dr. Degang Chen of Iowa State University. This group
would also like to recognize Stephanie Loveland of the Iowa State University
Department of Chemical and Biological Engineering. She will provide finances, design
specifications, and requirements for this project.
1.3 Problem Statement
The problem statement is broken up into two separate sections; one that defines the
general problem area and another that describes the proposed approach to the solution.
1.3.1 Problem Statement
A mock fermentation vessel is available for use by senior chemical engineering
students to conduct experiments in their final laboratory course. This vessel
currently uses archaic methods to operate the equipment and to collect data. The
objective of this project is to design, update, and install new equipment and
software for the mock fermentation vessel apparatus to become automated and
computer controlled. A new oxygen flow meter will be needed for the apparatus,
specifically one that is able to communicate with the LabVIEW software. The
remaining equipment, motor control and mass gas flow meter, must be adapted so
that they too can communicate with the LabVIEW software.
2
Software must also be developed to gather data from the equipment and allow for
smooth, efficient operation by the user. The software must be designed to take
readings from the equipment and place the readings into certain functions within
the program giving the user control over the use of the input data. A user interface
needs be developed so that the students can do several different functions with the
information streaming in from the lab metering equipment. A manual or tutorial
should be developed alongside the user interface to provide the user some aide in
using the software.
1.3.2 Problem Solution
With the need of a new oxygen concentration meter for this project apparatus, the
team will work with the client in determining the best meter to purchase. This
will involve checking for easy connection and support by LabVIEW, as well as
meeting the client’s needs. The team will also determine the necessary collection
equipment needed to collect data from the current laboratory equipment. This
will involve researching current methods of output from the equipment by
contacting the equipment manufacturers. This will allow the team to purchase the
necessary data acquisition cards and signal conditioning units to collect accurate
data from the equipment. Data acquisition information from the equipment will
then be interpreted by software developed using LabVIEW. A GUI will then be
developed to support real-time interaction with the user. An example of such a
GUI developed using LabVIEW is shown in Figure 3. An extensive manual will
be developed alongside this software to provide the user aide in using the
software. Also research into a possible flash interactive tutorial for the user to
follow when learning the software is being explored by the team.
Figure 3: Prototype GUI
3
1.4 Operating Environment
All equipment will be housed in the teaching laboratory of Sweeney 2059. This room is
subject to a temperature controlled environment of 60-80 degrees Fahrenheit. High
levels of moisture could cause hardware failures, which could render the data collection
or software inoperable. Also the connections need to be checked and cleansed from
time to time due to normal dust accumulation, and regular use.
1.5 Intended User(s) and Intended Use(s)
This section is divided into two parts, one to cover the intended user(s), and the second
is to cover the intended use(s).
1.5.1 Intended User(s)
The mock fermentation vessel is a setup to be used by senior level students in the
Department of Chemical and Biological Engineering as well as faculty within the
department. The users must have knowledge of safety procedures and
requirements while conducting experiments within the lab. Students will need to
have been exposed to the concepts that the lab is designed to simulate.
1.5.2 Intended Use(s)
The intended use of this project is to automate the collection of data from the
mock fermentation vessel apparatus. This automation process will yield data in a
real-time display as well as saved file format for further data analysis by the users.
The end system is not intended to be used on any other equipment that is not
supported.
1.6 Assumptions and Limitations
Certain aspects of this project need to be constrained to more specific terms. In the
individual assumptions and limitations sections, more specific details will be developed
to better outline the project.
4
1.6.1 Assumptions
To adequately develop this product certain assumptions about the project have
been developed. These assumptions were stated as follows:
• The end-user of this project will be someone who is familiar with the
fermentation process
• Only one experiment will be conducted at a time
• Environmental stability of 2059 Sweeney will be maintained
• All new components and cables will be paid for by the client
• The end-user understands basic computer terminology (double-click, scroll,
etc)
• All laboratory components will operate within their given rated power values
• A computer will be supplied by the client with LabVIEW and Excel already
installed
• An extra PCI slot will be available on the computer for data acquisition card
• The data acquisition card will supply its own clock
1.6.2 Limitations
A number of limitations have been imposed upon the project; including the
following:
• File format type is in Excel Format
• Software shall be written using LabVIEW
• One sample per second must be recorded from each specified device
• Maximum flow rate for the air/nitrogen must be less than 6 SLM
• Motor speed must be kept less than 600 RPM
• Safety glasses must be worn at all times when working in 2059 Sweeney
• No more than 4 significant digits stored upon measurement
• The voltage signals from the stirrer motor control must be electrically isolated
• The oxygen concentration meter must read from 0 to 9.5 PPM dissolved
oxygen
• The oxygen concentration meter must be a benchtop unit
1.7 Expected End Product and other Deliverables
The expected end product of this project is an automated collection system for the mock
fermentation vessel apparatus. This system will include all the necessary hardware for
collection and data acquisition. A GUI shall be developed that displays real-time
information to the user and can save this data into an Excel file format.
Along with the automated collection system, this project will produce two written
documents: a design document and an end-user operating manual. At the end of the
project, there will be a final report encompassing the entire project.
5
The end-user operation manual shall provide instruction on the operation of the software
and documentation information. It shall be written in a non-technical manner. It shall
be delivered at the completion of the project.
The final report shall include all the details about the project description, as well as
outline how the system operates.
2. Design Approach
This section outlines the approach formulated by the team to ensure that the system will be
correct.
2.1 Design Objectives
The information that the team has collected from the problem statement will be used to
design the automated collection system. The following is a list of objectives that the
team will use to build this system.
•
•
•
Ease of use: The software developed for the automated collection system will be
easy to use and is simple enough for most users to operate.
Reliability: The automated collection system will accurately capture the
appropriate data from repeated use by various users.
Dynamic: The system will provide real-time information to the user in of the
form a real-time display, and will provide access to the data through file storage
in Excel format.
2.2 Functional Requirements
The following functions will be implemented into this project and are required to
complete this project successfully. These requirements were specified by the client as
well as the faculty advisor, and are modeled in the process model in Figure 4.
Data acquisition:
The system will be able obtain measurements of speed, torque, air/nitrogen gas flow,
and oxygen concentration from the appropriate measurement devices. This system will
apply proper filtering on the equipment output, to obtain accurate measurements.
Data collection:
The measurements obtained will be recorded every second. This information is stored
in an Excel file format and available for user download.
Software interaction:
A GUI will display real-time information and will be developed in LabVIEW. It shall
be easy to use and will have a user manual detailing operation.
6
Figure 4: Process Model of Functional Requirements
2.3 Design Constraints
The entire project will be designed and constructed to perform under the following
conditions and constraints.
Software environment:
The software developed for this project will be developed in LabVIEW. This includes
creating a GUI for user interaction.
Measurement collection timing:
The measurements from the lab equipment will be recorded at one sample per second.
Max air/nitrogen gas flow rate:
The maximum air/nitrogen gas flow rate shall be less than 6 SLM.
Max motor speed:
The maximum motor speed will not exceed 600 RPM. If this is exceeded vibration
problems may occur with the system.
Electrical isolation on stirrer motor control:
The voltage signals from the stirrer motor control must be electrically isolated.
Oxygen Concentration Meter:
The oxygen concentration meter must be able to measure between 0 and 9.5 PPM of
dissolved oxygen, and must be able to interface with LabVIEW.
7
2.4 Technology Considerations and Results
For this project, there are four main areas for technology considerations. These areas
include the data acquisition board for collecting data, signal conditioning use, and
oxygen concentration meters.
2.4.1 Data Acquisition Board
Technology considered:
A means for collecting the information from the equipment will be done via a data
acquisition board, but there is a large variety of boards available. There were
several types of boards considered along with their unique attributes. A USB
DAQ unit would give the system easy connection to the computer that will be
used for experiments and be relatively inexpensive to implement. A drawback to
this unit is there is no way to apply any signal conditioning with this type of unit.
The second type of DAQ considered for this project was a PXI DAQ system. The
PXI system allows for signal conditioning at a very high resolution signal and
very high sampling rate, but these great features are translated into the high cost
of the this system. The final DAQ consideration was the PCI board, this board
allows for signal conditioning and sampling at lower cost. The PCI DAQ board
does not provide extremely high resolution or sampling rate.
Technology selected:
After careful consideration of the equipment and our requirements the PCI DAQ
board was selected. The PCI DAQ board will allow for a sampling rate that is
well within the constraints outlined by the client and will provide the advantage of
signal conditioning capability. Another benefit was the moderate cost of the PCI
DAQ board, while cost was not a constraint, having an overly excessive sampling
rate is not worth the extra cost.
2.4.2 Signal Conditioning
Technology considered:
Signal conditioning plays a huge role in obtaining reliable analog output from lab
equipment. Therefore in the design the team needed to explore equipment
transients, and other noise within the lab environment. Results from contacting
equipment manufacturers inquiring upon signal integrity of the output yielded an
effective approach to signal conditioning.
For the stirrer motor control unit two scaled voltage signals would require
electrical isolation up to 143Vrms due to a floating ground. This floating ground
will provide fast transients which will need to be filtered out. To get accurate
signal conditioning National Instruments was contacted for a recommendation for
equipment. Following their recommendation and an online advisory tool, many
signal conditioning modules were found having varying input with voltage ranges
from ±50mV to ±42V.
8
For the mass gas flow meter unit the output the output signal took the form of a
current ranging from 4 to 20mA. This output provided the choice of working
with the current directly or converting to a 0 to 5V signal. Working directly with
the current would decrease the amount of equipment needed to purchase, but
could not be hooked up directly to the DAQ board. By converting the current into
a 0 to 5V signal, the unit could easily hook up to the DAQ board, but would at
increased cost of a conversion module.
An additional consideration for signal conditioning is the extra purchase of a
signal conditioning carrier which would house potential signal conditioning
modules. This signal conditioning carrier offers a low cost signal conditioning
solution for a wide range of analog or digital input and output signals. Without
purchasing this SCC carrier, the overall cost would be decreased, but the signal
conditioning modules would be unable to be used.
Technology Selected:
The signal conditioning carrier was selected as the proper means for facilitating
signal conditioning. It would the use of the signal conditioning modules, and its
additional cost was outweighed by simplification of the design and the future
upgradeability of the system.
For the stirrer motor control as all the analog voltage input modules from National
Instruments have a working isolation up to 300V this covers the issue with the
floating ground. Also since transients may be present, utilizing the differential
capability of these modules shields against this danger. In evaluating each of the
modules for a necessary voltage range needed, the 0 to 5V input range twochannel analog input voltage module from National Instruments was selected.
For the mass gas flow meter, the output current signal was decided to be scaled to
the 0 to 5V signal. This would simply the overall design as a similar module
would be used as in the stirrer motor control. Also this would make the importing
of data into LabVIEW very similar to the data of stirrer motor control.
2.4.3 Oxygen Concentration Meter
Technology considered:
As the current oxygen concentration meter used in the mock fermentation vessel
is out of date, and does not provide an interface with a PC, a replacement must be
identified. There are a wide variety of oxygen concentration meters available on
the market, but as the client specified that it must be a benchtop meter this
narrowed the field. Two oxygen concentration meters were identified that met the
required specifications, but had a few differences. Omega Engineering carried a
benchtop oxygen concentration meter which had an RS232 link for computer
connection, and provided 100 data point logging. This unit offered little support
for future supplies and was to be no longer carried by the manufacturer. The
other unit identified was the Orion 3-Star benchtop oxygen concentration meter
9
from Thermo Electron. This unit offered an RS232 link for computer connection,
and provided 200 data point logging. This unit also offered a 3-year replacement
warranty and up to five years of guaranteed manufacturer supply support.
Technology selected:
The Orion 3-Star oxygen concentration meter was selected from Thermo
Electron. This unit offered all the functionality that was desired by the client,
while also offering attractive features and support for an extended period of time.
2.5 Testing Approach
The methods for testing and the criteria for acceptance will be discussed here. Testing
is another consideration that should not be overlooked, and will be thoroughly carried
out over the project. This project will be tested in three phases as follows:
First phase: testing the individual equipment
This involves testing the functionality of all of the devices and integrating this with
LabVIEW. The separate VI developed for each piece of equipment will be tested by
the team to ensure the information is reported accurately and the software is performing
correctly. The team member performing the test will fill out a standard form for each
test they run. This form can be found in the appendix. This form will include their
name, the date, and time performed. Also the form will note the test performed and its
results. If a problem occurred it will be noted, along with the problem description and a
solution field for noting the fix to the problem. This standard form for testing will help
ensure proper testing as well as good documentation for later use. In order to move on
to the next phase of testing, all device measurements must be reported accurately and
any additional software functions are performing correctly. The team will review the
testing data from this phase with the faculty advisor and then the final decision to move
onto the second phase of testing will be made.
Second phase: testing overall system
This involves testing the real-time data transfer from all devices at once. Also it
involves testing the data collection and file storage capabilities of the LabVIEW
program. Overall the GUI will be tested for errors, and for proper displaying of all
information. This phase of testing will be carried out again by the team using the
standard form found in appendix, and used in the first phase. To move on to the last
phase of testing, the team will evaluate the system by running through a mock
experiment and verifying results of output to those expected. The team will then
review the testing data from this phase with the client and then the final decision to
move onto the final phase of testing will be made.
10
Third phase: beta testing
This phase involves having the client and potential users test the software and report
problems to the team. For testing the system, four students will be asked to use the
software and fill out a survey after trying out the system. This survey can be found in
appendix. The survey will consist of opinions on: ease of use, functionality,
presentation, and usability of the data exported. These will be rated on a 1 to 5 scale,
and a section for comments will follow each section. Also a section for suggestions
appears at the end for additional comments. The client will also be asked to use the
software and fill out the survey. After the team has received comments from the client
and student testers, the appropriate changes will be made to the software. Another four
students will be asked to use the software and fill out the survey. This will insure that
any changes made did not affect the overall system. The team will evaluate the final
surveys, and upon final consultation with the client will decide if the final phase of
testing is complete.
2.6 Project Continuation
The project is on schedule as was planned in the project plan.
recommendation of the team to continue the project as proposed.
Thus, it is the
3. Detailed Design
This section covers all the specific details of the team’s design. It includes all hardware,
wiring diagrams, part numbers, estimated part costs, and part sources/sellers that are required
for each component. The automated collection system consists of three main pieces of
equipment in which data is collected from, each being acquired with LabVIEW for the final
product. This section is divided into the five main components of this project. These five
main components are listed below. The system flow diagram further relates these
components in Figure 5.
•
•
•
•
•
•
Oxygen concentration meter
Mass gas flow meter
Signal conditioning carrier
Stirrer motor control
DAQ board
Software interfacing – GUI
11
Figure 5: The basic flow diagram of the system
3.1 Oxygen Concentration Meter
The selected oxygen concentration meter is the
Thermo Electron Orion 3-Star benchtop dissolved
oxygen meter. This meter offers many features
including measuring the full scale of dissolved
oxygen (0-9.5 PPM), a 200-point data logger for
storing measurement information, and a RS232
bidirectional link for connection to a PC or printer.
This model is shown in Figure 6 to the right. This
meter will be purchased in a kit that will provide the Figure 6: Orion 3-Star Meter
meter, probe, probe stand, and calibration materials
for an approximate cost of $1335. This unit can be purchased from a number of
different retailers, but VWR Scientific was a recommended dealer from the
manufacturer so they will be used for purchasing.
In order to utilize the RS232 bidirectional link for data logging, an additional
conversion cable must be purchased to interface with the PC. The connections diagram
shown in Figure 7 below, shows that the RS232 connection to the meter is a 3.5mm
stereo jack connector. The conversion cable will convert this interface into a COM port
which can be connected with the serial port of the PC used. This conversion cable will
have an approximate cost of $30, and will be purchased from VWR Scientific with the
oxygen concentration meter.
12
Figure 7: Rear connections of Orion 3-Star Meter
To interface with LabVIEW, the team will use the onboard serial port for data
acquisition from the oxygen concentration meter. The meter will be configured to
transfer data continuously to the PC. This information will be in a comma delimited
output, which will be filtered using LabVIEW to grab the appropriate information for
data storage and display.
3.2 Mass Gas Flow Meter
The current mass gas flow meter of the mock fermentation
vessel is the Omega FMA-5610, shown in Figure 8. This meter
offers an output signal in the form of a 4 to 20mA analog
signal. This signal represents the mass gas flow in standard
liters per minute, and represents a scale of 0 to 10 SLM.
Therefore the scaling follows that 4mA corresponds to 0.0
SLM, and 20mA corresponds 10.0 SLM, and follows a linear
scale between each of these points. This output signal is
obtained from the 9-pin D connector on side of the enclosure.
The connector will output the current on pins 8 and 9. These
pins will be wired using standard copper wire to the current Figure 9: Omega
module selected from National Instruments for signal FMA-5000 Series
conditioning. This module is the NI SCC-IC20 current input module. This module is
shown in Figure 9. This module uses precision resistors to convert the 0 to 20mA
current into a 0 to 5V signal. The current will be wired in a
differential configuration to ensure accurate measurement
from the module.
Figure 10 below shows the pin
configuration of the D-connector on the Omega FMA-5610
(on the left), and shows the wiring block diagram used for
connecting to the SCC-IC20 (on the right). This SCC-IC20
module will be plugged in the signal conditioning carrier
Figure 8: NI SCC-IC20
for interaction with the PC and LabVIEW. The signal
Current Input Module
conditioning carrier will be discussed in the next section
(Section 3.3).
13
Figure 10: Omega FMA-5610 Connector Diagram (left), NI SCC-IC20 Current Input
Module Wiring Block Diagram (right)
The NI SCC-IC20 current input module will be purchased from National Instruments at
an approximate cost of $130.50.
3.3 Signal Conditioning Carrier
In order to use the signal conditioning modules for the design, an SCC carrier must be
purchased to house these modules. The SCC carrier selected was the SC-2345, which
would allow direct cabling to the M-Series DAQ board selected (Section 3.5). The
SCC carrier selected in shown in Figure 11. The SCC carrier comes at a price of
$220.50 and will be purchased from National Instruments.
Figure 11: SCC carrier SC-2345
14
This unit will provide a low-cost, low-profile housing for each of the SCC modules
purchased. The SCC carrier will be powered by the DAQ board with a 5V signal. The
modules will be connected in a configuration as shown in Figure 12. Figure 12 also
shows the connector block diagram of the SCC carrier unit. As can be seen the SCC
carrier unit can hold up to 20 SCC modules, which can be either analog or digital
signals. This will allow for future upgradeability for the mock fermentation vessel
collection system.
Figure 12: Analog Input SCC Configuration (left), Diagram of Module Layout in SC2345 Connector Block
The SCC carrier will connect with the DAQ board through the use of a 68 pin shielded
connector cable. This cable is the NI SHC68-68 that is specifically used for connection
to M-Series DAQ boards (section 3.5). The cable is shown in Figure 13. The cable
comes in many lengths from 0.5 to 10 meters in length,
but a length of 2 meters was chosen to allow for easy
spacing of PC away from the mock fermentation vessel.
The cable comes at a cost of approximately $99 and will
be purchased from National Instruments.
Figure 13: NI SHC68-68
Connection Cable
3.4 Stirrer Motor Control
The current stirrer motor control of the mock fermentation vessel is a component of the
Glas-Col GKH-Stir Tester 099D HST20N, shown in Figure 14. This control unit offers
two output signals that represent torque (oz-in) and speed (RPM) in the form of analog
voltage signals. The voltage signals are scaled signals which for every 1mV measured
they are either 1 oz-in of torque or 1 RPM of speed respectively. There a few design
issues that need to be taken into account when trying to measure these signals for data
acquisition. The unit operates with a floating ground that typically operates at 70 to
15
90V. Also 60V fast transient spikes could appear on the
output lines due to the switching DC motor that is driven
by the motor control. In order to measure the torque and
speed accurately, signal conditioning must be applied to
ensure signal integrity. To achieve proper conditioning
an isolated analog input module will be used from
National Instruments. The SCC AI Series modules from
National Instruments offer varying input voltage ranges
from ±50mV to ±42V. As discussed earlier the team
selected an input voltage module with an input range of 0
to 5V. This module is the NI SCC-AI04, which offers
two channels of isolated analog input, with isolation up to
300V, and differential input. In order to connect the
Figure 14: GKH Stir
stirrer motor control to the module, standard wire will be
Tester
used to connect differentially to each channel of the
module. This will protect against the fast voltage transients, and will offer better noise
rejection. Figure 15 below shows the wiring block diagram for connecting the SCCAI04. This SCC-AI04 module will be plugged in the signal conditioning carrier for
interaction with the PC and LabVIEW. Additional information on the signal
conditioning carrier can be read in section 3.3.
Figure 15: NI SCC-AI Series Isolated Analog Input Module Wiring Block Diagram
The NI SCC-AI04 isolated analog input module will be purchased from National
Instruments at an approximate cost of $265.50.
3.5 Data Acquisition Board
The selected data acquisition board is the National
Instruments NI PCI-6221 M-Series data acquisition
board.
This DAQ board offers many features
including 16 analog inputs, 2 analog outputs, 24
digital I/O lines, and two counters/timers. This DAQ
board is shown at the right in Figure 16. This unit
offers 16 bit resolution which correlates to an
accuracy of 70µV. The sampling rate of the board is
16
Figure 16: NI PCI-6221
DAQ Board
250 kilo-samples/sec which will provide an adequate signal sampling for the analog
input signals. This board will be purchased from National Instruments at an
approximate cost of $427.50.
In order to gather information from the SCC carrier and the signal conditioning
modules the DAQ board will connect to the SCC carrier via the NI SHC68-68 shielded
cable discussed in section 3.3. This cable will transfer the various analog input
channels to the DAQ card for sampling. By using the internal clock supplied on-board
the DAQ board each channel of input can be sampled and have data acquired.
In the current configuration proposed the DAQ board will have 6 of its 16 analog input
channels used for sampling and data acquisition. These 6 six channels will represent
the 3 differential pairs of signals for mass gas flow, torque, and speed. The additional
input and output channels can be used for future expanding or controlling of external
devices.
To interface with LabVIEW, the team will take advantage of the available express VI’s
that are currently available to define the operation of the card. With these express VI’s
scaling can be applied to account for the various signals that will be inputted. Also
these express VI’s will aid the team in not having to create new LabVIEW code to
define the operation of the DAQ board.
3.6 Software Interfacing
A graphical user interface (GUI) will help students navigate the integrated data
acquisition system for the mock fermentation vessel. The prototype design of the GUI
consists of three separate, but cross referenced screens. When starting the mock
fermentation vessel experiment, a user will access the GUI via an icon the desktop of
the computer located in the
lab. The first screen that
appears
shows
several
initialization
fields
for
student input.
Figure 17
illustrates the preliminary
design of this page.
This first page will prompt
users
for
initialization
information needed later for
documentation and to run the
experiment. The page will
enable users to specify runtime,
identify
group
members, the date, and the
time the experiment was
performed. Additional input
Figure 17: Initialization Screen
17
will be considered and added by the team if it is deemed necessary. At the bottom of
the page a button with the word “Start” appears. By clicking on this button, users will
continue with the experiment and will display the second screen.
As seen earlier in the executive summary (Section 1.1), screen two will hold four realtime displays for the four main sources of data from the experiment: torque, speed,
oxygen concentration, and mass gas flow. Each display will keep track of the data in
real time, which means that the users will be able to see the graphs update dynamically
as the experiment progresses. Figure 18
shows a zoomed in look at one of the
dynamic graph displays that will be
implemented.
The toggle switch at the top left of the
screen enables users to start and stop the
experiment on demand. This means that
data will not be recorded when the
experiment is turned off. Other features of
the page include a kill switch to totally
stop experiment if a problem is noted and
Figure 18: Real-time Display Screen
a button to allow users to examine the
data in an Excel spreadsheet as the experiment is being performed.
When the experiment completes, one more conclusion screen will appear in the form of
a pop up window. This pop up will signal the end of the experiment run time, but will
not close the real-time display in case further experimentation is to be carried out. This
conclusion screen will show a restatement of initial inputs, plus the file extension for
where the file of in Excel spreadsheet form can be found. Users will also be able to
access the Excel formatted data via this screen as well.
4. Resources
This section details the financial, personnel, and other resources that will be required in order
to complete the project.
4.1 Task Definitions
This section details the task definitions for each performed throughout the project.
4.1.1 Task 1 – Problem Definition
Understand the functionality of the product. Define the operation of the product
and identify constraints. Consult with advisor about the feasibility of the project.
18
4.1.2 Task 2 – Technology Considerations and Selection
List the choices of technologies that can be used in the product design. Contact
manufacturers for product specifications and information, and select the best and
most feasible approach.
4.1.3 Task 3 – End-Product Design
Construct a series of VI’s that define the functionality of the technology selected.
4.1.4 Task 4 – End-Product Prototype Implementation
Integrate the VI’s developed in the design process into a main GUI system.
4.1.5 Task 5 – End-Product Testing
Test the product to check that it meets all operational and user-defined
requirements.
4.1.6 Task 6 – End-Product Documentation
Document all the details of the product design, and develop an end-user manual
and maintenance documentation.
4.1.7 Task 7 – End-Product Demonstration
Demonstrate the functionality of the product to the client, advisor, and industrial
review panel.
4.1.8 Task 8 – Project Reporting
Document the details of the whole project in a final report.
19
4.2 Personal Effort
The tables below show the original and revised allocations of hours for personal effort.
Table 1: Original Personal Effort
Table 2: Revised Personal Effort
Task 1 – Problem Definition
Task 2 – Technology Considerations and Selection
Task 3 – End-Product Design
Task 4 – End-Product Prototype Implementation
Task 5 – End-Product Testing
Task 6 – End-Product Documentation
Task 7 – End-Product Demonstration
Task 8 – Task Reporting
The changes made in the distribution of hours reflect greater insight into the
commitment required for each task. The only increase in time allocation occurred in
the end-product testing task; this results from the need to thoroughly test and debug the
software and hardware. The team decreased the amount of time for end-product design
and end-product prototype implementation.
Both of the tasks were simply
overestimated based upon lack of knowledge of LabVIEW. After researching more
about LabVIEW less time would be required to design and implement the end-product.
4.3 Other Resource Requirements
Other resource requirements entail all those resources that are not associated with
personnel effort or financial resources. These resources may include parts, materials,
and services required throughout the project as well as support for test and
measurement equipment. The tables below outline the original and revised other
resources for this project.
20
Table 3: Original Other Resources Required
Table 4: Revised Other Resources Required
The revisions made between the other required resources reflect an overestimation of
the estimated cost of the hardware. The original costs did not figure in the academic
discount given by National Instruments nor shipping costs. Also the cost of the oxygen
concentration meter was also decreased due to an academic discount.
4.4 Financial Requirements
The financial requirements are the consolidation of the monetary costs of all resources:
personnel, parts, service, etc. that are needed to complete the project. This includes not
only the costs relating directly to the final product itself, but also any and all costs
incurred during the planning and implementation of the project. The tables below show
this information with and without the calculated cost of labor. The cost of labor used
was an hourly rate of $10.50.
21
Table 5: Original Financial Requirements
Table 6: Revised Financial Requirements
Due to a decrease in the cost of hardware, and lowered project hours the total project
cost has been lowered by approximately $525.
22
5. Scheduling
The project schedule went through some slight modifications since the initial planning of the
project. These resulted from new insight into the appropriate time frame for each task. This
evolved from team member insight and understanding of LabVIEW as well as re-thinking
start dates for tasks to deliver a better project. The changes can be seen in stand-alone
versions of the original and updated schedules which appear in Figures 5 and 6 respectively.
The project deliverable schedule is located below in Figure 7.
23
Figure 19: Original Project Schedule
24
Figure 20: Revised Project Schedule
25
Figure 21: Deliverable Schedule
26
6. Project Team Information
The following section will detail the contact information for every person that is involved in
this project.
6.1 Client Information
Stephanie Loveland
ISU Department of Chemical and Biological Engineering
Office: 2033 Sweeney Hall
Office Phone: 515-294-3024
Email: [email protected]
6.2 Faculty Advisor Information
Dr. Degang Chen
Office: 329 Durham
Office Phone: 515-294-6277
Email: [email protected]
6.3 Team Members
Andrew Arndt
Major: Electrical Engineering
Address: 209 N. Hyland #5, Ames IA 50010
Phone: (515)-450-8650
Email: [email protected]
Adam Daters
Major: Electrical Engineering
Address: 123 Sheldon Ave. #11, Ames IA 50010
Phone: (641)-485-5286
Email: [email protected]
Bradley DeSerano
Major: Electrical Engineering
Address: 119 Stanton Ave #710, Ames IA 50014
Phone: (319)-610-3901
Email: [email protected]
Austin Striegel
Major: Electrical Engineering
Address: 125 Campus Ave #4, Ames IA 50014
Phone: (712)-830-0470
Email: [email protected]
27
6.4 Closing Summary
A mock fermentation vessel is available for use by senior chemical engineering
students to conduct experiments in their final laboratory course. This vessel currently
uses archaic methods to operate the equipment and to collect data. The objective of this
project is to design an automated system to collect the necessary data for the user. This
system will involve the use of a data acquisition card to interface with the current lab
equipment, and LabVIEW software will be used to collect the data. A user interface
will be created that is simple enough for most users to operate, and will be dynamic
enough to display the appropriate information to the user as well as store the
information to a file for later analysis. When completed, the entire system should allow
end users complete access to data collection from all laboratory equipment. This will
ensure a deeper more complete understanding of the fermentation process, and will
culture a better environment for learning.
6.5 References
1. Loveland, Stephanie. “Power Requirements and oxygen mass transfer in an
aerated agitated solution”.
2. EE/CprE 491 Senior Design Course Notes. By Dr. John Lamont.
3. EE/CprE 491 Senior Design Coursepack Supplement. By Dr. John Lamont.
4. National Instruments. “LabVIEW”. 2004. <http://www.ni.com/labview>
28
Appendix
Name:
Date:
Time:
Test Performed
Results
Problems
Yes
/
No
Problem Description
Solution
Figure 22: Team Standard Test Documentation
29
Name:
Date:
Ease of Use
1
2
3
4
Poor
5
Excellent
Comments
Functionality
1
2
3
4
Poor
5
Excellent
Comments
Presentation
1
2
3
4
Poor
5
Excellent
Comments
Data Usability
1
2
3
4
Poor
5
Excellent
Comments
Suggestions
Figure 23: Intended User Survey
30