1
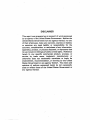
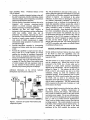
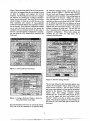
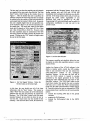
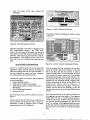
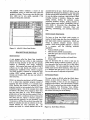
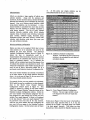
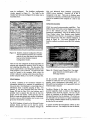
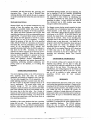
,
,
AIAA-21)00-(X)52
HARDWARE
AND SOFTWARE
DEVELOPMENTS
ACQUISITION
FOR THE ACCURATE
SYSTEM*S
Dale E. Berg+, Mark A. Rumsey:
Wind Energy Technology Department
Sandia National Laboratories
Albuquerque, New Mexico
TIME-LINKED
DATA
JljLEc;E1vE;c;
!Kc
Jose R. Zayas
General Technology Corporation
Albuquerque, New Mexico
ABSTRACT
Wind-energy
researchers
at
Sandia
National
Laboratories have developed a new, light-weight,
modular data acquisition system capable of acquiring
long-term, continuous, multi-channel time-series data
tiom operating wind-turbines. New hardware features
have been added to this system to make it more flexible
and permit programming via telemetry. User-tliendly
Windows-based sotlware has been developed for
programming the hardware and acquiring, storing,
analyzing, and archiving the data. This paper briefly
reviews the major components of the system,
summarizes the recent hardware enhancements and
operating experiences, and discusses the features and
capabilities of the software programs that have been
developed.
INTRODUCTION
Personnel in the Wind Energy Technology Department
at Sandia National Laboratories, a part of the National
Wind Technology Center (NWTC), began the
development of hardware and software for a new, stateof-the-art wind turbine data acquisition system in late
1997. The primary design goal of the new system was
that it be capable of acquiring long-term, continuous,
multi-channel time series data tlom operating wind
turbines. We have developed the Accurate, TimeLinked Data Acquisition System (ATLAS) hardware
and soflware to achieve this goal.
.
‘ This work was supported by the U.S. Department of
Energy under contracts DE-AC04-94AL85000 and DEAC36-83CH1OO93.
+ Principal Member of Technical Staff, Associate
~ellow of AlAA.
Senior Member of Technical Staff.
$This paper is declared a work of the U.S. Government
and is not subject to copyright protection in the United
States.
●
...
,,... .,,.,
,,,.. .,,,, .. ,.,
/1
,7,,.>.., ,
,:
.>...
. ...”
~ 71999
@sTl
A complete wind-turbine data acquisition configuration
typically contains several data acquisition subsystems
(DAS). Normally, a system configuration utilizes at
least one rotor-based DAS unit (RBU), at kst one
ground-based DAS unit (GBU) and one ground-based
computer unit (GBCU), as illustrated in Figurr 1. The
RBU is mounted on the rotor, rotating with and in close
proximity to the blade- and main shatl-mountl:d strain
gauges and other sensors. The GBUS are any and all
data acquisition units that don’t mount on the rotor—a
GBU could be mounted in the turbine nacelle, on the
turbine tower, or on the meteorological tower. All
acquisition units are located close to the sensors from
which they are acquiring data in order to minimize
contamination of the data by electrical noise picked up
by long signal wires. The ground-based control unit
(GBCU) is the heart and brains of the system. The
GBCU queries the user to determine the configuration
of each DAS (the channels to sample, the channel
gains, offsets and filters, and the rate at which data is to
be sampled); programs each DAS to perform the
acquisition; performs calibrations; retrieves and collates
the data acquired by each DAS; and displays and stores
that data to disk. The smart data acquisition system
(SDAS) retrieves that data from disk, post processes it,
and archives it.
ATLAS
utilizes
commercially
available
data
acquisition, telemet~, and global positioning system
(GPS) receiver hardware, together with a custom-built
programmable logic device subsystem (PLDS), to
acquire long-term time series data from multiple data
acquisition units. The PLDS utilizes the GPS receivers
to maintain precise time synchronization between the
various DAS units, forcing data acquisition on all units
at exactly the same time over the entire duration of a
test.
An ATLAS prototype, with a mixture of
Windows- and DOS-based software, has been installed
on the Atlantic Orient Corporation 15/50 wind turbine
at the U.S. Department of Agriculture (USDA)
Agricultural Research Service (ARS) site at Bushland
-,>.
:.73X
:-,,
::-..,.
:.
s.:
‘.’e+., :
,,, ,..
,—----
--
DISCLAIMER
This repofi was prepared as an account of work sponsored
by an agency of the United States Government. Neither the
United States Government nor any agency thereof, nor any
of their employees, make any warranty, express or implied,
or assumes any “legal liability or responsibility for the
accuracy, completeness, or usefulness of any information,
apparatus, product, or process disclosed, or represents that
its use would not infringe privately owned rights. Reference
herein to any specific commercial product, process, or
manufacturer,
or
service by trade name, trademark,
otherwise does not necessarily constitute or imply its
endorsement, recommendation, or favoring by the United
States Government or any agency thereof. The views and
opinions of authors expressed herein do not necessarily
state or reflect those of the United States Government or
any agency thereof.
.. —.7—
,,
.......... ,.,
---~
-
DISCLAIMER
Portions of this document may be illegible
in electronic image products. Images are
produced from the best available original
document.
.—. .
.... .
.
.
,e.
-
. – .=.,..-=.
———.
..—
,
(near Amarillo), Texas. Prominent features of the
ATLAS include:
●
Provides a complete integrated package using offthe-shelf components, thereby minimizing custom
electronics design, system integration, and software
support and development functions.
●
Provides flexible, expandable hardware that can be
integrated with common experiment-control
software to provide necessary quick-look data
display, processing, and analysis capabilities.
●
Decreases the time and effort required to
instrument a field experiment, perform calibrations,
verify data validity, collect data, and do
prelimina~ data analysis, improving the end-toend accuracy of data collected in field experiments.
●
Provides a versatile system capable of making a
wide variety of reliable measurements in rugged
environments using equipment of unobtrusive size
and minimal weight.
●
Provides stand-alone operation by incorporating
telemetry and battery packs that can be recharged
on site.
●
Provides the capability to acquire and save data to
disk at rates up to 12,500 samples per second,
enabling the recording of contiguous long-period
time records, so unexpected transients will not be
missed, and available testing time is not wasted.
●
Provides an easy---way to get experimental
data into
.
a standard PC data file format, thus enabling users
of varied computer skill and experience levels to
use any standard PC-based software products to
perform post-processing analyses and displays.
The ATLAS hardware is only part of the system. In
order to tailor the system for wind turbine use nnd make
it user-friendly and flexible, powerfil, user-irlteractive
sofiware is required. As mentioned in the earlier
references, we have chosen to develo the so Ilware in
the National Instruments LabVIE $
for Windowss
environment, both to facilitate the development of a
single data acquisition software system (the ADAS II
sofiware) for this and other hardware systems, and to
utilize LabVIEW’s power to develop a robust and
tliendly user-interface. Some hardware developments
have been accomplished during the months since the
last paper on this system was pubIished4, but most of
the development has been on the software side, with the
development of the ATLAS program to configure the
hardware, the ADAS 11 program to acquire and store
the data, and the SDAS program to post process,
analyze, and archive the data. All of these programs are
LabVIEW executable and require no software license
or additional sotlware to run.
RECENT HARDWARE DEVELOPMENTS
Several additional hardware features have been added
to the PLDS to yield new capabilities since the
prototype was deployed on the AOC turbine during the
summer of 1998.
The GPS receiver is no longer mounted on the PLDS
card as a daughter card. Instead, the receiver is now
connected to the PLDS via a 9-wire cable and is
mounted in a small, sealed enclosure immediately
adjacent to the GPS antenna. The new configuration is
pictured in Figure 2. This reduces the size of the
PLDS, so that it only requires one slot in the DAS
mainframe, fleeing up room for additional data
acquisition modules. It also enables the user to mount
the antenna for GBUS several hundred feet away from
the PLDS, with no need to be concerned about
attenuation of the GPS antenna signal, as was the case
with the earlier configuration. The RBU anterma must
still be mounted on the rotor axis of rotation, so it will
still be close to the PLDS.
Additional information on the ATLAS hardware
development may be found in references 1-4.
Post Pmcuslng
~-=+wu
&
Ram
e4*
Tc’nw
“...
.-.,..,—
i
‘m
,, ..,.
,,,
I
,,,
An analog-to-digital conversion chip has been added to
the PLDS board to facilitate measurement of
temperatures, currents, and voltages. This enables the
user to track the health and status of the card and the
new battery power supply. We are now utilizing lowerpower GPS receivers (dropping the power consumption
from 1.1 watt to 0.2 watts) and have implemented a
“sleep” mode to further conserve power when data are
not being acquired. This would normally be used only
in the RBU, where a battery pack is used for pclwer. In
this mode, - we switch off the power to ‘the DAS
mainframe, all the DAS modules, the modelms, and
I
Figure 1. Schematic of Typical Wind Turbine Data
Acquisition System
2
.~
.... ——
..
.. . . .,’u,.
,>..,,...,.,
..”,...,
---- .
..... ?. ,,..,.
?<>%..
3-,.:-< .’ ...?‘ ?m<.i!
,..... . I—-—
.
-
.
selected components of the PLDS module for 50
seconds of every minute. The programmable logic
device (PLD) on the PLDS module remains alive, and
will turn on the telemetry components for the first 10
seconds of each minute to check for communications
from the user. The RBU remains in this mode until a
wake up call is received. These features result in a
For
dramatic reduction in power consumption.
example, the ATLAS RBU on the AOC turbine, which
provides excitation power to and acquires data from 15
strain gauges, now consumes about 32.5 watts of power
whenever it is acquiring data or not. The new version
of the PLDS enables us to place the unit into sleep
mode when not actually acquiring data. This drops the
power consumption to about 2 watts. Whenever we are
ready to take data, we wake the unit up and within five
seconds it is consuming 32.5 watts and acquiring data.
●
●
●
●
●
●
transmit the unique PLDS identification cclde to the
GBCU
reset the PLDS
enter or exit the sleep mode
turn DAS (12-volt) power on or off
turn GPS (5-volt) power on or off
turn the PLDS-generated external pulse train
generation on or ofil
A prototype battery system permits the installation of
an RBU on a rotor that has no electrical power. The
15-pound unit consists ofnickel/metal hydride cells and
has a nominal rating of 48 amp hours at 12 VI)C. The
nickel/metal hydride cells have twice the energt density
of the more common nickel/cadmium cells and do not
suffer from the memory effect (a loss of ability to
accept charge and an increase in internal resistance) that
affects those cells. Nickel/metal hydride cell:; can be
recharged hundreds of times with little or no
degradation and do not require a complex charging unit,
unlike the higher energy-density but less robust lithiumion cells. With this battery pack and the sleep mode of
the new PLDS card, we could run the AOC rotor unit
for a full week (168 hours), assuming we acquire no
more than 8 hours of data (the unit is in sleep mode for
160 hours or more). The system will provide power for
about 18 hours of continuous data acquisition. We have
not yet had the opportunity to gain any field experience
with this unit.
ATLAS SOFTWARE PROGRAM
The computer requirements necessa~ to run the
ATLAS software package are
.
Pentium 200 MHz or faster
.
32Mb of RAM (64Mb recommended)
●
20Mb disk space
●
800 X 600 minimal resolution with small fonts
(1024 X 768 recommended)
●
Windows 95 or 98
Figure 2. GPS Antenna and Receiver
Enclosure
t
The ACRA ControlGKAM 500 (also sold in the US as
Nicolet MicroPro) that we use for the DAS unit was
supplied with a rudimentary 16-bit DOS-based
programming/data acquisition software.
While this
software was adequate for initial system development,
it was apparent that we needed to develop software that
would operate under and take full advantage of the 32bit Windows environment. The new ATLAS software
(written in LabVIEW) allows the user to speci~ the
hardware configuration of all the DAS units, to speci~
the setup (actual hardware, gain, filter setting, etc.) for
each channel, and to actually program the DAS units to
acquire the desired data.
The PLD logic program has been enhanced to latch the
GPS time (accurate to one microsecond) when the
analog and strain-gauge data are actually acquired.
Including this time in the data stream gives the user a
powerful tool for determining if and when
communication dropouts occur. In addition, the user
can now direct the PLDS to
●
transmit the GPS data to the GBCU
●
connect the full duplex communications between
the GBCU and the DAS (for remote programming
of the DAS)
●
transmit the DAS data via serial link to the GBCU
3
.
the “MicroPro Settings” button, which brings up the
window shown in Figure 5. Here the data word size,
the sync word, and the type of data encodinig (NRZ-L
or Bi-phase) must be specified. These settings apply to
all DAS units in the ATLAS. Whether the mode of
data communication is TTL or RS422 must also be
specified, and this can vary from DAS to DAS. RS-422
can be utilized to transfer data over distances of up to
one kilometer, while TTL can be utilized if the transfer
distance does not exceed about 20 feet. TTI. must be
utilized if telemetry is being used. The user also can
enter a description (255 characters or less) of the data
acquisition configuration.
When these settings are
complete, the user clicks the “OK” button and is
returned to the front panel.
Figure 3 shows the front panel of the ATLAS software.
From here, the program takes the user through a series
of steps to configure and program the ATLAS
hardware. The first thing the user must do is configure
the hardware by selecting the “Configure Hardware”
button from the front panel. This brings up the window
shown in Figure 4, where he can select the size of the
DAS maintlame (the number of data-acquisition
module slots) and the different data acquisition modules
that are inserted. If the hardware configuration contains
one or more slave units, the user can also specifi the
mainframe size and modules inserted in those units at
this time. Once the hardware configuration is compIete,
the user clicks the “OK” button and is returned to the
front panel.
Figure 3. ATLAS Software Front Panel.
Figure 5. MicroPro Settings Window
The next step defines the data acquisition signals, done
with the “Set Test Signals” button, which brings up the
window shown in Figure 6. The user selects a module
and creates a data channel with the specific infcmnation
required for that channel. This information includes
channel name, filter settings, excitation voltage,
amplifier gain, etc. At any time in this process, the user
can view the signals that have been definec~ in the
“Review” window and edit or delete any existing
signals. After all of the signals have been defined, the
user clicks the “OK” button and again is returned to the
front panel.
Figure 4. Configure Hardware Window. Notice the
Setup Slave button on the right.
The communications protocol to be used by the various
DAS units is the next parameter to be specified using
4
The last step is to select the sampling rate (all channels
are sampled at the same rate), done with the “Set Data
Rates” button, which brings up the window shown in
Figure 7. After the desired data rate is specified, the
software computes the closest data rate that can actually
be realized, given the number of bits being acquired for
each sample and the internal 8 MHz clock. In general,
this rate is slightly higher than the user-specified one.
In the example in Figure 7, the user has requested a 30Hz sample rate. The actual rate, based on the 8MHz
clock and 48 channels of 16-bit words (12 bits of data
and 4 bits of blank fill), is 30.02 Hz. However, since
the data acquisition signal is synchronized with GPS
time every second, the result is exactly 30 samples each
second. Clicking on the “OK” button will again return
the user to the front panel.
programmed with the “Program” button. If the ATLAS
system contains only one DAS unit, ATLAS will
immediately start to program the hardware over the RS232 link. If the setup contains slave units, ATLAS can
program the entire system sequentially or just
individual DAS units as specified by Ihe user.
Programming DAS units individually can be useful if a
configuration modification to only one unit in the
system is made.
Figure 7. Set Data Rate Window
The program versatility and simplicity allows the user
to program an entire data acquisition system in a short
amount of time.
Figure
6. Set Test Signals Window. Notice the
Review button on the bottom right.
At this time, the user should save all of the input
information with the “Save” button. This creates an
ASCII “PCM’ file that contains all of the information
gathered from the user and necessary to program the
hardware. The “PCM Editor” button in the front panel
launches Notepad+ (a text editor) to allow the user to
view this file. Expert users may also modifi the tile
manually. After the PCM file is saved, the hardware is
Another key feature of the ATLAS software is the
ability to monitor and/or control the GPS module,
which is only activated if the user has selected the
“7010_GPS_RevC”
module in the “Configure
Hardware” window. In this case, the DAS unit in
which the PLDS module is located - is actually
controlled by the signals generated by the PLDS,
utilizing the values calculated from user input in “Set
Data Rate” window. The “GPS Data” butlon on the
Front Panel window then permits the user to monitor
GPS data and to switch the PLDS communications
mode tlom the GPS Communications window (Figure
8). From this window the user can command the PLDS
communication lines to perform one of several possible
actions:
●
transmit the incoming GPS data to the ground
computer
●
program the DAS hardware
.
transmit the DAS-acquired data to the GBCU
serially
●
return the unique
information
PLDS
logic software
ID
Figure 9. ADAS II Software Front Panel.
The ADAS II Channel Configuration window is shown
in Figure 10.
Figure 8. GPS Communication Window
GPS data transmitted to the GBCU is displayed in the
GPS Communication window.
The “GPS Valid”
button in the lower right of the window will turn from
red to green when the GPS receiver is actually locked to
GPS time. Once this occurs, the DAS unit is ready for
data acquisition. This condition must be true for all
DAS units in the ATLAS before data acquisition takes
place.
ADAS 11 SOFTWARE
Figure
PROGRAM
ADAS II is a modified version of the Advanced Data
Acquisition System (ADAS) software developed by
NREL for acquiring data from the ADAS hardware. It
has been enhanced to acquire and store continuous
time-series data from the ATLAS hardware.
10. ADAS H Charnel Configuration Window
Once the program has been configured, the user must
specify the location and the time duration of the data
files to be taken, and then the software is ready to
acquire continuous data. All saved data files are stored
with a header file, which contains all of the ~ertinent
information that belongs to that specific data ~le. The
data and header files can then be read by many software
packages for post processing (NREL programs GPP,
Crunch, and Genstats, as well as the new SDAS). The
“Collect Data” window, shown in Figure 11, is
displayed during actual data acquisition. Within this
window, the user also has the capability to view the
data in pseudo real time in any of several different chart
formats.
This software will run on a computer with the following
minimum capabilities:
●
Pentium 200 MHz or faster
●
64Mb of RAM (128Mb recommended)
.
25Mb disk space (plus necessary disk space for
data storage)
●
1024 X 768 minimal resolution
●
Windows 95 or 98
Other important features of the ADAS II sotlware are
the triggering routine and the logbook. The tri~ering
routine allows the user to speci~ specific quotas or
conditions to their data. In other words, if the data does
not meet the specific requirements, the data are not
saved. For example: If the triggering conditions are set
to take data when the wind speed is greater than 6m/s,
data will not be saved unless the wind speed exceeds
6m/s.
The Front Panel of the ADAS II sofiware is shown in
Figure 9.
ADAS 11accesses the PCM file that was created by the
ATLAS sotlware and decodes that file to acquire the
information it needs to configure itself to actually
acquire data from the ATLAS hardware.
6
....—..-
.,-..
..
,“,<.,.
..-.,.,, ,.. . . .--l-.‘ .... :..
—.,.*
,,.<.-.;;,..:..,.>%<
---.:.
:~..?.-..,-,f=,...;: .>/:
...?: : ,——.-
- .-----–
*
The logbook feature maintains a record of
modifications, errors, or events that occur while
program is running. The user may view this file at
time, which can be very useful, especially if
program is taking data unattended.
,,.
.-
,“.
.“,
,..
,“
,.”
,-
,..
,.”
.,
.“
.
4.”
.“
.“,
.“,
..”
..-
I~,m
I
Figure
any
the
any
the
accessed later by the user. SDAS will allow a user to
interactively interrogate the database or any time-series
file that was previously processed by SDAS. This gives
the user the ability to perform a large number of tasks
including looking at statistics,; looking fclr trends,
finding extrema, looking for particular events,;
performing Rainflow analysis, plotting channels or
statistics against each another, investigating point-bypoint details in time-series files, determining file
commonality (redundant time-series
fih:s), and
dissecting, concatenating, and archiving time-series
files.
,-.=.
“]=
“.,”
,.o-
-
----
.
0-,,,..,.
.$..
SDAS Comtmter Recwirements
We knew up front that SDAS could possibly be
required to handle large data files, thus requiring it to
have large system memory requirements. SDAS was
written to optimize computer memory wherever
possible. SDAS is also graphics intensive. It will run
on a computer with the following minimum
capabilities:
●
Pentium 200MH2 or f~ter
.
64Mb of RAM (12SMb recommended)
.
25Mb disk space (plus necessary disk space for
data storage)
●
1024 X 768 minimal resolution with small fonts
.
Windows NT
Only one time-series file at a time is read into the
SDAS memory during an SDAS acquisition, and up to
four time-series files can be read in at a time during
post-processing. The only potentially large Files that
SDAS creates are the SDAS databases, which start out
at 74 kilobytes each and grow at a rate of 2 kilobytes
for every time series file acquired and processed.
“ ~‘--““
11. ADAS II Collect Data Window
SDAS SOFTWARE
PROGRAM
SDAS Overview
A new program called the Smart Data Acquisition
System (SDAS) has been written to help researchers
process the large amounts of data that are typically
acquired in performing wind energy technology
research. Data acquired and stored with the ADAS 11
sofiware can be read directly into SDAS, in effect
enhancing the capabilities of the ADAS H program.
The SDAS program is intended to complement other
existing NREL analysis programs, such as GPP,
Genstats and Crunch, which can also read ADAS II
time-series files.
SDAS Status Window
The main window in SDAS, called the SDAS Status
window, is shown below in Figure 12. The dynamic
settings of SDAS, as they are set and changed, are
displayed in this window. All of the functions available
in SDAS can be reached from this window through the
(File, Acquisition, Post Processing, View, Utilities,
Options, Help) menu bar. As long as SDAS is running,
this window will always be on the desktop.
SDAS is an interactive stand-alone LabVIEW program.
It is a unique data acquisition program; instead of
acquiring data from hardware, as is normally done,
SDAS acquires data created (or acquired) by other
programs, usually, but not necessarily the ADAS 11data
acquisition program. One of the concepts that is built
into SDAS is the ability of the program to know what
data have been taken; in a way, SDAS maintains a
global picture of what data has been acquired. SDAS is
designed to receive a continuous stream of time-series
files either ffom the ADAS II computer program in
pseudo-real-time (typically, but not necessarily, every
10 minutes), or off-line tlom archived time-series files.
SDAS can calculate and store an extensive set of userselected statistics for every time-series file.
All
statistics are stored in a central database that can be
Figure 12. SDAS Status Window.
7
-.
,
SDAS Statistics
13. At this point, any simple statistics can be
selected/deselected for the yaw error statistic.
SDAS can calculate a large number of built-in userAlong with the minimum and
selected statistics.
maximum, the four moments (mean, standard deviation,
skewness and kurtosis) can be calculated for each data
channel. Also, up to thirteen special statistics, called
cross-channel statistics, can be calculated. A crosschannel statistic is calculated from more than one data
channel, and such statistics are routinely calculated in
wind energy research. The list of cross- channel
statistics currently available within SDAS includes
capacity factor, horizontal sonic direction, horizontal
sonic velocity, Obukhov length, Reynolds stress,
Richardson number, total sonic velocity, vertical sonic
velocity, wind direction, wind shear, yaw error, yaw
rate, and turbulence intensity.
SDAS Accmisition Configuration
Before any data can be acquired, SDAS has to know
what statistics are to be calculated and stored “in the
database for each input channel.
The Statistical
Analysis Configuration window, shown in Figure 13,
allows the user to interactively point to a
channel/statistic field intersection and select or deselect
the statistics to be calculated and stored for any raw
(data) or calculated channel. An X indicates the
statistic will be calculated and stored; the absence of an
X indicates the statistic is not calculated or stored. The
vertical list of channels in this window (except the yaw
error) is read in from a time-series header file, or a
previously saved Statistical Analysis Configuration file.
Figure 13. Statistical Analysis Configuration
Window. This allows the user to de~ine the
statistics to be calculated for each data and
calculated channel.
The Cross Channel Statistics are selected or deselected
in the same manner as the simple statistics described
above. As can be seen in Figure 14, the yaw error is the
only cross-channel statistic selected.
For example, for the yaw error statistic to be calculated,
SDAS needs to map two variables to two data channels,
done in the’ SDAS Cross Channel Statistics
Configuration window shown in Figure 14. This
window is reached by clicking on the button labeled
“Edit Cross Channel Statistics” along the bottom of the
Statistical Analysis Configuration window. Notice the
yaw error variable “wind direction (degrees)” has not
been assigned to a data channel yet, but the yaw error
variable “yaw angle (degrees)” is about to be assigned
to the data channel “rotor yaw angle (degrees)” from
the pull-down menu that lists all the data channels.
After the yaw error statistic has been configured, the
yaw error will now appear in the Statistical Analysis
Configuration window. See the bottom entry in Figure
Figure 14. Cross Channel Statistics Configuration
Window. The yaw angle variable is about
to be mapped to the rotor yaw angle clata
channel.
Notice also in Figure 13 that two boxes in the Rainflow
column have been selected (with an X in the last
column) for the “blade 1 root strain gauge” ancl “blade
1 tip strain gauge” channels. This means two data
channels have been selected for Rainflow analysis, and
.
SQL and Microsoft Open Database Connectivity
(ODBC) driver interfaces. However, al] of this is
transparent to the user. There are no database query
commands to remember, and Microsoft Access does not
need to be installed on the computer in order to run
SDAS.
must be configured.
The Rainflow configuration
window appears in Figure 15. The fields in this
window have been user-configured in the same way as
described above.
SDAS Post-txocessing
SDAS has several post-processing capabilities. Four
different kinds of XY-plots can be displayed, each with
one to four charnels per plot, and they can be
interactively manipulated. They can be Statistic versus
Time, Channel versus Time, Statistic versus Statistic
and Channel versus Channel. An example of it Channel
versus Channel plot, with four channels displayed, is
shown in Figure 16. The arrays generated by the
Rainflow analysis are plotted using LabVIEW intensity
plots.
Figure 15. Rainflow Analysis Configuration Window.
The user-defined parameters for a rainflow
analysis for two data channels have already
been set in the Statistical Analysis
Configuration window.
Afler the user has configured the SDAS acquisition by
selecting and mapping the statistics, SDAS is ready to
start acquiring time-series data. The time-series files
can be acquired from a user-designated location on the
local computer or over a network. The time-series files
could be located in the computer folder where the
ADAS 11software is storing current time-series files, in
another computer folder, or on a CD-R or a floppy disk.
Figure 16. Channel versus Channel Plot. Four strain
gauge channels are plotted against a.fifth
strain gage channel.
All the powerful LabVIEW graphics functions are
available to modifi the view of any of the plots (zoom,
panning, cursor measurement, auto-scaling, etc.). A
Microsoft Excel spreadsheet can be generated from the ‘
windowed data in any plot.
SDAS Database
[n SDAS, a database is the cumulative collection of
information obtained by a sequence of acquisitions of
time-series data. Each database is a knowledge base of
information about a specific grouping of data. For
instance, if you have processed data from both the
Bergey 850 and the Zond Z-56 wind turbines, you’d
probably want to separate that data into at least two
groups, one for each turbine. SDAS gives the user the
ability to create and maintain any number of databases.
However, only one SDAS database can be open at any
given time while SDAS is running.
Conditions filtering is the name we have given a
powerful capability which is similar to the triggering
capability of the ADAS 11program. The user can set
criteria or limitations on the data displayed, in effect
filtering information fi-omthe database. The criteria are
user selectable and are based on a logical combination
of any SDAS calculated statistic from any channel and
the time the file was created.
The SDAS database is based on the Microsoft Access
database format, and thus can be read by Access.
SDAS communicates with the database through the
A number of SDAS file-manipulation utilities are also
available to the user. For example, the user can dissect,
9
.
,
electrostatic discharge (ESD), not due to lightning, but
due to handling in the low humidity environments
found in Bushland and Albuquerque. ACRA Control
has responded to these failures by identi~ing less
susceptible components for some circuits and adding
protection for others. In fact, ACRA’S new Series II
line, introduced late in 1999, includes many design
changes to address these problems.
concatenate, and edit time-series file, generating new
time-series files. There is also a powerfhl dataarchiving fi.mction~which permits the user to compress
or zip (if so desired) time-series files and write them to
CD-R.
SDAS and Power Failures
Because SDAS may be operated unattended for long
periods of time, the program was written with the
capability to gracefully handle utility power failures
that could affect the integri~ of the data acquisition.
The ADAS and SDAS computers and ATLAS data
acquisition hardware are all on an uninterruptible power
supply (UPS). If a power failure occurs, the software
that controls the UPS generates a text file in a userdefined folder on one of the computers. If SDAS
detects the presence of this text file in the specified
folder, SDAS will finish all calculations on the current
time-series file, store all calculations in the database,
record all the user-defined SDAS settings, and
gracefully terminate itself before the SDAS computer is
shut down by the UPS. (Currently, the ADAS II
sofiware and ADAS computer do not have this powerfailure shutdown capability.) When the utility power
recovers, the SDAS computer is powered on by the
UPS, self boots, and SDAS is restarted. SDAS will
reverse the shutdown process, reestablishing its
acquisition configuration, and resume time-series file
acquisitions, performing statistical calculations, and
storing results in the databaseY as if nothing had
happened.
OPERATING
Our biggest concern during normal operation has been
the possible loss of telemetered data tlom the RBU,
which transmits a data flame each data acquisition
cycle. This frame is merged into the master data tlame
which goes to the GBCU. If the RBU frame is not
received, the master frame will contain the last RBU
frame that it received. Since we are including data
acquisition time in the data stream from the RBU, it is
relatively easy to spot drop outs - we simply run a
program to check the RBU acquisition times and report
all data points for which the interval between
acquisition times is too long.. Examination of a 20minute data file we acquired from the AOC shows just
12 RBU drop outs in the 36,000 flames of data
recorded. Each drop out was for a single fiwme - the
preceding and succeeding fi-ames were received
correctly.
TRANSFER
OF TECHNOLOGY
We are currently writing user’s manuals for both the
hardware and software, and we plan to make the
ATLAS and SDAS sofiware available for use by NREL
and others in the near fi,nure. The plans, part lists,
specifications, and wiring diagrams for the R.BUSand
GBUS that we have built will be in the user’s manual,
and we will be available to assist customers with
assembling ATLAS units for their particular
application.
EXPERIENCE
Two severe lightning strikes on the AOC prevented us
from acquiring much data from our prototype
installation, even though we installed it over a year ago.
The first strike damaged the ATLAS extensively. We
added lightning protection to protect most data lines,
but lack of space in the RBU enclosure forced us to
leave it unprotected. The second strike, which was
powerful enough to “fry” the turbine controller,
damaged a couple of modules in a tower-mounted GBU
next to the controller, but the ATLAS damage was far
less severe than in the first strike. For a variety of
reasons, the AOC turbine was still not back in operating
status at the time the time of writing. As a result, we do
not have much actual data at this time from which to
draw operating experience.
SUMMARY
Several enhancements have been made to the ATLAS
wind turbine data acquisition hardware. Changes to the
mounting of the GPS receiver provide greater flexibility
on antenna mounting location, and changes to the PLD
now enable the user to program the system via
telemetry. Addition of a sleep mode and a 48 amp-hour
battery pack enable a rotor-based data unit to operate on
battery power for up to a week between battery pack
replacements.
A suite of LabVIEW-based software routines has been
assembled to complement the recent advancements in
The ATLAS software
data acquisition hardware.
allows the user to speci~ the ATLAS hardware
configuration, the channels to be sampled, the sampling
Reliability of the system hardware has been a problem
during the last year. We have experienced several
failures in both the TTL and RS-422 communications
hardware. Most of the failures appear to be the result of
10
L
,
rate, and the setup specifics for each channel. It then
programs the data acquisition units to petiorm the
desired operations. The NREL-deveIoped ADAS 11
software, enhanced to handle the continuous, long-term
time-series data acquired by ATLAS, retrieves the
acquired data from computer memory, displays data as
directed by the user, stores data to disk, and performs a
limited amount of user-directed analysis in near real
time.
SvmPosium, Reno, NV, January 11-14,.1999, pp
236-242.
5.
National Instruments Corporation, 1I!iOO North
Mopac Expressway, Austin, TX
78.759-3504,
telephone: (512) 794-0 100, UU. www.ni.com.
6.
ACRA Control Corporation, Landscape House,
Landscape Road, Dublin 14, Ireland, telephone: +1
353-1-2951264.
The time-series data files generated by ADAS 11can be
imported directly into several analysis routines such as
the NREL-developed programs GPP, Genstats and
Crunch, as well as the new SDAS program.
The SDAS software has been written to help process
the large amounts of data that are typically collected in
wind energy research. SDAS can retrieve a continuous
stream of time-series files either from ADAS II in
pseudo-real-time, or off-line from archived time-series
files. It can calculate and store an extensive set of userselected and configured statistics, saving the results in a
central database for later access. SDAS also has a
powerful conditions-filtering capability that will allow a
user to interactively interrogate the database for any set
of time-series files that was previously processed by
SDAS. Results can be plotted for easy viewing,
displayed in Excel spreadsheets, or written to new timeseries files.
REFERENCES
1.
Berg, D., Rumsey, M., Robertson, P., Kelley, N.,
McKenna, Ed, and Gass, K, “Development of a
Light-Weight, Wind-Turbine-Rotor-Based Data
Acquisition System:’
Paper AIAA-98-0051,
Proceedings of 1998 ASME Wind Enerw
Svm~osium, Reno, NV, January 12-15, 1998, pp
238-249.
2.
Berg, D. E., Robertson, P. J., and OrtiL M. F.,
“Development and Application of a Light-Weight,
Wind-Turbine-Rotor-Based
Data
Acquisition
System,” Winduower ’98 Proceedings, Bakersfield,
CA, April 27-May 1, 1998.
3.
Berg, D. E., and Robertson, P. J., “Precise Time
Synchronization Data Acquisition with Remote
Systems” Proceedings of 1998 International
Telemetering Conference, San Diego, CA, October
26-29, 1998.
4.
Berg, D.E., Robertson, P., and Zayas, J., “ATLAS:
a Small, Light Weight, Time-Synchronized WindTurbine Data Acquisition System”, AIAA 99-0050,
Proceedings of 1999 ASME Wind Ener~v
11
/
—.4 —.
. . .
.
. . .
.
,. .,, -,.,
... ,.. . . . . >... .
.“. -.=-?.
-. . ...-7-. .,-.
.. .,,
, ,.. -
ax.
‘.-, .. . f,
,.
t>:. ,.-.. ,
,L..: ?.: .-..
.,,
,,,
.
.
.