1
B UILDING I NTELLIGENT T UTORING S YSTEMS
A Major Qualifying Project Report
submitted to the faculty of
W ORCESTER P OLYTECHNIC I NSTITUTE
in partial fulfillment of the requirements for the
Degree of Bachelor of Science
by
F ELIX G ELLER
C ANDICE R ICHARDSON
P ETRE RONTEA
Advisors:
Neil T. Heffernan, Gábor Sárközy, Stanley M. Selkow
A PRIL 25, 2007
Building Intelligent Tutoring Systems
Abstract
This project’s goal was to improve the ASSISTments intelligent tutoring system’s algebraic
capabilities. We worked towards three main objectives. First, we built support for parsing expressions and comparing them for algebraic equality. Second, we implemented an interactive
grapher capable of plotting a variety of expressions. Third, we added support for rendering expressions to well formatted images. Finally, we implemented a basic tutoring system including
sample problems that demonstrate our work, establishing our tools’ usability and integrability.
1
Building Intelligent Tutoring Systems
Acknowledgements
This project owes a great deal to many individuals, whose assistance has earned our eternal gratitude. We would like to extend our deepest gratitude first to Professor Gábor Sárközy for his tireless
assistance in every aspect of our Budapest experience, from arranging this project, to guiding our
progress, to apartment maintenance. We could not have hoped for a better or more considerate
advisor. Professor Neil T. Heffernan for his prompt correspondence and for his supervision and
advice every step of the way, and whose enthusiasm about the ASSISTments system is highly contagious. Professor Stanley M. Selkow for his significant aide in various aspects of our project, and
for his undeniable enthusiasm about the Budapest project center.
We would also like to thank Péter Juhász of MTA SZTAKI for his crucial guidance on the
development of our parser and demonstration problems. József Patvarczki for preparing us for
the project and for his advice in our selection of tools. We would like to thank everyone at MTA
SZTAKI for their generous hospitality which has made our stay here a most pleasant and enjoyable experience. Finally, we would like to express our gratitude for the help provided to us by
the ASSISTments team at WPI both while preparing for this project and during the development
process.
2
CONTENTS
Building Intelligent Tutoring Systems
Contents
1
Introduction
1.1 Intelligent Tutoring Systems . . . . . . .
1.2 The ASSISTments Project . . . . . . . .
1.2.1 Assistance in ASSISTments . . .
1.2.2 Assessment in ASSISTments . . .
1.2.3 Architecture of ASSISTments . .
1.2.4 Content Creation in ASSISTments
.
.
.
.
.
.
.
.
.
.
.
.
.
.
.
.
.
.
.
.
.
.
.
.
.
.
.
.
.
.
.
.
.
.
.
.
2
Problems to Solve
3
Methodology
3.1 Parsing and Comparison of Algebraic Expressions . .
3.1.1 Analysis of Requirements . . . . . . . . . .
3.1.2 Brief Discussion of Context-Free Grammars
3.1.3 Analysis of Implementation . . . . . . . . .
3.1.4 The Solution’s Design . . . . . . . . . . . .
3.2 Graph an Algebraic Expression . . . . . . . . . . . .
3.2.1 Analysis of Requirements . . . . . . . . . .
3.2.2 Development and Implementation Details . .
3.2.3 The Grapher’s External Interface . . . . . . .
3.2.4 The Grapher’s Toolbox . . . . . . . . . . . .
3.3 Rendering of Algebraic Expressions . . . . . . . . .
.
.
.
.
.
.
.
.
.
.
.
.
.
.
.
.
.
.
.
.
.
.
.
.
.
.
.
.
.
.
.
.
.
.
.
.
.
.
.
.
.
.
.
.
.
.
.
.
.
.
.
.
.
.
.
.
.
.
.
.
.
.
.
.
.
.
.
.
.
.
.
.
.
.
.
.
.
.
.
.
.
.
.
.
.
.
.
.
.
.
.
.
.
.
.
.
7
7
10
11
14
18
20
22
.
.
.
.
.
.
.
.
.
.
.
.
.
.
.
.
.
.
.
.
.
.
.
.
.
.
.
.
.
.
.
.
.
.
.
.
.
.
.
.
.
.
.
.
.
.
.
.
.
.
.
.
.
.
.
.
.
.
.
.
.
.
.
.
.
.
.
.
.
.
.
.
.
.
.
.
.
.
.
.
.
.
.
.
.
.
.
.
.
.
.
.
.
.
.
.
.
.
.
.
.
.
.
.
.
.
.
.
.
.
.
.
.
.
.
.
.
.
.
.
.
.
.
.
.
.
.
.
.
.
.
.
.
.
.
.
.
.
.
.
.
.
.
.
.
.
.
.
.
.
.
.
.
.
.
.
.
.
.
.
.
.
.
.
.
.
.
.
.
.
.
.
.
.
.
.
26
28
29
31
33
39
41
41
42
45
50
54
4
Implementation
57
4.1 Parsing and Comparison of Algebraic Expressions . . . . . . . . . . . . . . . . . . 59
4.2 Graphing of Algebraic Expressions . . . . . . . . . . . . . . . . . . . . . . . . . . 60
4.3 Rendering of Algebraic Expressions . . . . . . . . . . . . . . . . . . . . . . . . . 65
5
Demonstration Implementation
67
5.1 Building an ASSISTment in the Demo System . . . . . . . . . . . . . . . . . . . . 67
5.2 Perpendicular Line Demo Problem . . . . . . . . . . . . . . . . . . . . . . . . . . 68
5.3 The Biker Problem . . . . . . . . . . . . . . . . . . . . . . . . . . . . . . . . . . 74
6
Tests and Analysis
6.1 Traffic Analysis . . . . . . . . . . . . .
6.2 Analysis of Server load . . . . . . . . .
6.3 Analysis of the Interface’s Re-usability .
6.4 Source Code Metrics . . . . . . . . . .
.
.
.
.
.
.
.
.
.
.
.
.
.
.
.
.
.
.
.
.
.
.
.
.
.
.
.
.
.
.
.
.
.
.
.
.
.
.
.
.
.
.
.
.
.
.
.
.
.
.
.
.
.
.
.
.
.
.
.
.
.
.
.
.
.
.
.
.
.
.
.
.
.
.
.
.
.
.
.
.
.
.
.
.
.
.
.
.
.
.
.
.
80
80
82
84
85
7
Conclusions
87
8
APPENDIX: Grapher User Manual
93
3
LIST OF FIGURES
Building Intelligent Tutoring Systems
List of Figures
1
2
3
4
5
6
7
8
9
10
11
12
13
14
15
16
17
18
19
20
21
22
23
24
25
26
27
28
29
30
31
32
33
34
35
36
37
38
39
40
41
Screen-shot of the ASSISTments system. . . . . . . . . . . . . . . . . . . . .
Screen-shot of the ASSISTments system: forced scaffolding. . . . . . . . . . .
Screen-shot of the ASSISTments system providing hints. . . . . . . . . . . . .
Screen-shot of the Student-Gradebook Interface . . . . . . . . . . . . . . . . .
Screen-shot of the WEKA Interface . . . . . . . . . . . . . . . . . . . . . . .
Screen-shot of the ASSISTments Builder . . . . . . . . . . . . . . . . . . . .
Screen-shot of the Report Criteria . . . . . . . . . . . . . . . . . . . . . . . .
Screen-shot Showing the Need for an Algebraic Parser . . . . . . . . . . . . .
Development Process . . . . . . . . . . . . . . . . . . . . . . . . . . . . . . .
Parse Expression Tree . . . . . . . . . . . . . . . . . . . . . . . . . . . . . . .
Normalized Expression Tree . . . . . . . . . . . . . . . . . . . . . . . . . . .
Plot Segments Feature . . . . . . . . . . . . . . . . . . . . . . . . . . . . . .
Show Coordinates Feature . . . . . . . . . . . . . . . . . . . . . . . . . . . .
Find Point Feature . . . . . . . . . . . . . . . . . . . . . . . . . . . . . . . . .
Set Ranges Feature . . . . . . . . . . . . . . . . . . . . . . . . . . . . . . . .
Screen-shot of Rendering In-lined Expressions . . . . . . . . . . . . . . . . .
Architecture Of Our Framework . . . . . . . . . . . . . . . . . . . . . . . . .
Communication Process for Parsing and Comparison of Algebraic Expressions
OpenLaszlo Architecture . . . . . . . . . . . . . . . . . . . . . . . . . . . . .
Abstract Diagram Illustrating Usage Of ExternalInterface . . . . . . . . . . . .
Communication Process for Graphing Algebraic Expressions . . . . . . . . . .
Communication Process for Rendering Algebraic Expressions . . . . . . . . .
Preview of Problem Statement . . . . . . . . . . . . . . . . . . . . . . . . . .
Grapher Setup . . . . . . . . . . . . . . . . . . . . . . . . . . . . . . . . . . .
Perpendicular Line Demo Problem . . . . . . . . . . . . . . . . . . . . . . . .
Perpendicular Line Problem Hint . . . . . . . . . . . . . . . . . . . . . . . . .
Biker Demo Problem . . . . . . . . . . . . . . . . . . . . . . . . . . . . . . .
Biker Demo Problem Hints . . . . . . . . . . . . . . . . . . . . . . . . . . . .
Biker Demo Problem: Change Ranges . . . . . . . . . . . . . . . . . . . . . .
Biker Demo Problem: Find Point . . . . . . . . . . . . . . . . . . . . . . . . .
Octagate Results . . . . . . . . . . . . . . . . . . . . . . . . . . . . . . . . .
Grapher Setup . . . . . . . . . . . . . . . . . . . . . . . . . . . . . . . . . . .
Screen-shot of the ASSISTments Grapher . . . . . . . . . . . . . . . . . . . .
Enabling Shockwave in IE 6 . . . . . . . . . . . . . . . . . . . . . . . . . . .
Insert an Equation . . . . . . . . . . . . . . . . . . . . . . . . . . . . . . . . .
Displaying Your First Graph . . . . . . . . . . . . . . . . . . . . . . . . . . .
ASSISTments Grapher Interface . . . . . . . . . . . . . . . . . . . . . . . . .
Graph Name Insert Box . . . . . . . . . . . . . . . . . . . . . . . . . . . . . .
Multiple Graphs on the Same Canvas . . . . . . . . . . . . . . . . . . . . . . .
Graph of First Degree Equation . . . . . . . . . . . . . . . . . . . . . . . . . .
First, Second and Third Degree Equations . . . . . . . . . . . . . . . . . . . .
4
.
.
.
.
.
.
.
.
.
.
.
.
.
.
.
.
.
.
.
.
.
.
.
.
.
.
.
.
.
.
.
.
.
.
.
.
.
.
.
.
.
.
.
.
.
.
.
.
.
.
.
.
.
.
.
.
.
.
.
.
.
.
.
.
.
.
.
.
.
.
.
.
.
.
.
.
.
.
.
.
.
.
10
12
14
16
18
20
22
23
26
35
39
48
51
52
55
56
58
59
62
63
64
66
68
69
70
72
75
76
77
78
82
85
93
94
95
95
96
96
97
98
98
LIST OF FIGURES
Building Intelligent Tutoring Systems
42
43
44
45
46
47
48
49
50
51
52
53
54
55
56
57
58
59
60
61
62
63
64
65
66
67
68
Preparing a Line Segment . . . . . . . . . . . . .
Drawing a Line Segment . . . . . . . . . . . . .
Graphing with Colors . . . . . . . . . . . . . . .
Different Stroke Sizes . . . . . . . . . . . . . . .
Using the Erasable Check Box . . . . . . . . . .
Displaying Toolbox . . . . . . . . . . . . . . . .
Displaying Toolbox from The Check Box . . . .
Toolbox Can Only Be Displayed On The Canvas
How to Resize the Toolbox . . . . . . . . . . . .
Resizing the Toolbox . . . . . . . . . . . . . . .
Display a Coordinate . . . . . . . . . . . . . . .
Display a Different Coordinate . . . . . . . . . .
Find Point Tab . . . . . . . . . . . . . . . . . . .
Find Point Tab Widgets . . . . . . . . . . . . . .
Finding a Point on a Graph . . . . . . . . . . . .
Trace a Graph . . . . . . . . . . . . . . . . . . .
Prepare for Tracing . . . . . . . . . . . . . . . .
Tracing Steps 1-4 . . . . . . . . . . . . . . . . .
Tracing Steps 5-6 . . . . . . . . . . . . . . . . .
The Range Tab . . . . . . . . . . . . . . . . . .
Zoom Into A Location of the Canvas . . . . . . .
The Clear Canvas Tab . . . . . . . . . . . . . . .
Clear a Graph . . . . . . . . . . . . . . . . . . .
Trigonometric Warm Up . . . . . . . . . . . . .
Drawing a Sine Curve . . . . . . . . . . . . . . .
Exploring the Sine Curve . . . . . . . . . . . . .
Drawing a Vertical Line . . . . . . . . . . . . . .
5
.
.
.
.
.
.
.
.
.
.
.
.
.
.
.
.
.
.
.
.
.
.
.
.
.
.
.
.
.
.
.
.
.
.
.
.
.
.
.
.
.
.
.
.
.
.
.
.
.
.
.
.
.
.
.
.
.
.
.
.
.
.
.
.
.
.
.
.
.
.
.
.
.
.
.
.
.
.
.
.
.
.
.
.
.
.
.
.
.
.
.
.
.
.
.
.
.
.
.
.
.
.
.
.
.
.
.
.
.
.
.
.
.
.
.
.
.
.
.
.
.
.
.
.
.
.
.
.
.
.
.
.
.
.
.
.
.
.
.
.
.
.
.
.
.
.
.
.
.
.
.
.
.
.
.
.
.
.
.
.
.
.
.
.
.
.
.
.
.
.
.
.
.
.
.
.
.
.
.
.
.
.
.
.
.
.
.
.
.
.
.
.
.
.
.
.
.
.
.
.
.
.
.
.
.
.
.
.
.
.
.
.
.
.
.
.
.
.
.
.
.
.
.
.
.
.
.
.
.
.
.
.
.
.
.
.
.
.
.
.
.
.
.
.
.
.
.
.
.
.
.
.
.
.
.
.
.
.
.
.
.
.
.
.
.
.
.
.
.
.
.
.
.
.
.
.
.
.
.
.
.
.
.
.
.
.
.
.
.
.
.
.
.
.
.
.
.
.
.
.
.
.
.
.
.
.
.
.
.
.
.
.
.
.
.
.
.
.
.
.
.
.
.
.
.
.
.
.
.
.
.
.
.
.
.
.
.
.
.
.
.
.
.
.
.
.
.
.
.
.
.
.
.
.
.
.
.
.
.
.
.
.
.
.
.
.
.
.
.
.
.
.
.
.
.
.
.
.
.
.
.
.
.
.
.
.
.
.
.
.
.
.
.
.
.
.
.
.
.
.
.
.
.
.
.
.
.
.
.
.
.
.
.
.
.
.
.
.
.
.
.
.
.
.
.
.
.
.
.
.
.
.
.
.
.
.
.
.
.
.
.
.
.
.
.
.
.
.
.
.
.
.
.
.
.
.
.
.
.
.
.
.
.
.
.
.
.
.
.
.
.
.
.
.
.
.
.
.
.
.
.
.
.
.
.
.
98
99
99
100
101
101
102
102
103
103
104
104
105
105
106
107
107
108
108
109
109
110
110
110
111
111
112
LIST OF TABLES
Building Intelligent Tutoring Systems
List of Tables
1
2
3
4
5
6
7
Ruby Source Code: compare degrees . .
Input Grammar For Parser . . . . . . . .
Class Representations for Algebraic Terms
Class Representations for Numeric Values
Ruby Source Code: collapse multiparens
Single Expression Normal Form Grammar
Comparison Normal Form Grammar . . .
6
.
.
.
.
.
.
.
.
.
.
.
.
.
.
.
.
.
.
.
.
.
.
.
.
.
.
.
.
.
.
.
.
.
.
.
.
.
.
.
.
.
.
.
.
.
.
.
.
.
.
.
.
.
.
.
.
.
.
.
.
.
.
.
.
.
.
.
.
.
.
.
.
.
.
.
.
.
.
.
.
.
.
.
.
.
.
.
.
.
.
.
.
.
.
.
.
.
.
.
.
.
.
.
.
.
.
.
.
.
.
.
.
.
.
.
.
.
.
.
.
.
.
.
.
.
.
.
.
.
.
.
.
.
.
.
.
.
.
.
.
.
.
.
.
.
.
.
.
.
.
.
.
.
.
30
34
34
35
36
37
40
1 INTRODUCTION
Building Intelligent Tutoring Systems
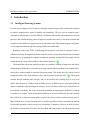
1 Introduction
1.1 Intelligent Tutoring Systems
In recent years computers have become increasingly common and powerful, and the tasks assigned
to software programs have grown in number and complexity. They are used to automate paperwork and record keeping, to perform difficult calculations and simulate environments for research
purposes, and to build and play games of impressive number and variety. It was thus inevitable that
computers would make their appearance on the education front. Educational programs and games
were designed and built to help teach young children and adults alike.
Beginning in the early 1970s, a challenging and innovative new form of computer-based instruction was being developed. Researchers hoped to create a system that would imitate a personal
human tutor by “[engaging] the students in sustained reasoning activity and [interacting] with the
student based on a deep understanding of the student’s behavior” [5].
The benefit that one-on-one tutoring can have on a student’s learning is impressive and widely
acknowledged. Studies have shown that on average tutored students perform at two standard deviations above students taught in a normal classroom setting. This means that “the average tutored
student was above 98% of the students in the control [normal classroom] class” [3]. Tutors guide
students through problems and concepts, and can personalize their teaching style to suite each
child’s individual needs. Children learn in different ways, at different paces, and require different
degrees of guidance when learning new concepts. A tutor can learn a child’s style, and tailor his or
her methods accordingly. He or she can provide immediate and appropriate feedback if a student
is confused, so students’ errors and misunderstandings are corrected effectively and more quickly
than is likely in a classroom setting where a teacher has twenty to thirty students to keep track of.
Many schools strive to keep classroom sizes as small as possible in order to maximize the amount
of individual attention a teacher can give to each student. Computers will never be able to replace
the distinctly human touch of a tutor, but when built and used properly, an educational program
7
1 INTRODUCTION
Building Intelligent Tutoring Systems
can prove to be a very helpful teaching tool. Such programs can provide assistance and guidance
to clarify concepts learned in class, teach new information, build simulations to illustrate in-depth
concepts, provide students with the individual feedback that is so helpful for the learning process
but difficult to accomplish in today’s crowded classrooms, and even help teachers in such tasks as
grading homework and assessing a class’ progress. Computers provide tools that can be used by
students to help them learn, and by teachers to review concepts with their class or to free up some
of their valuable time [4].
Initial research for such an “Intelligent Tutoring System” (ITS) centered around deploying and
improving artificial intelligence (AI) algorithms. For example, the first such program, SCHOLAR [5],
used a natural language dialogue structure to communicate with students. It was capable of both
asking and answering questions, as a human tutor would be. However, the parsing and comprehension of natural language proved to be a great enough obstacle that it deterred developers from
the original goal of education. Unfortunately, the early ITSs were evaluated against AI quality
standards and not by any measurement of their educational effectiveness.
However, since the 1990s, ITSs are once again becoming increasingly popular as researchers
try to shift their focus to a point where systems are evaluated by their success in improving students’ performance [5], not by the quality of their AI logic. There have been several successful
ITS projects recently. For example, the Pittsburgh Urban Math Project’s (PUMP) Algebra Tutor
(PAT) [22] was developed by the Pittsburgh Advanced Cognitive Tutor Center at Carnegie Mellon University to help students learn to model real-life situations using algebraic representations.
Its curriculum uses activities that draw on a student’s common sense in order to help him or her
develop and understand “formal mathematical strategies.” PAT aims to help students succeed in
algebra and see its relevance in the real world as well as the classroom. In an experiment that compared the performance of students using the PAT system on standardized tests to a comparison set
of students not using it, classes using PAT scored about one standard deviation better on the exams
that were the target of the curriculum, and “their scores were about 100% better than or double
8
1 INTRODUCTION
Building Intelligent Tutoring Systems
those of the Comparison classes. The average performance of students who used the PAT system
was significantly higher than the average performance of those who didn’t. These learning gains
appear to occur at no expense to basic skills objectives of standardized tests. In fact, PUMP+PAT
classes scored about 15% better on these tests” [23].
The Andes Physics tutoring system [36] is designed to take over the task of grading physics
homework for a teacher, and replace the traditional tools of pencil and paper to help students work
through the steps and calculations of a problem. It offers hints, including bottom-out-hints that
tell the student exactly what to do, and provides instant feedback for everything the student enters.
If a step is incorrect because of what is likely a typo or an oversight (e.g. forgetting an entry
box) the system alerts the student. Otherwise correct answers turn green, and incorrect entries
are colored red. The system uses this immediate feedback and many teaching hints to keep the
student working in the right direction. Using this system to replace pencil-and-paper homework
may lead to shallower thinking in some cases, as the instant feedback can encourage guessing, but
it is ultimately beneficial, partly because students using the system tend to do more work. Penciland-paper homework is often assigned for practice but not collected or graded, and thus many
students will skip the work. But assignments on the Andes system are automatically graded, and
thus the student cannot skip without penalty.
The web-based intelligent tutoring system Study Island [18] has shown great success in preparing elementary students for standardized tests. For the 2004-2005 school year, the percentage of
schools in North Carolina using Study Island that met the Annual Yearly Progress (AYP) rose by
11.4%, while the percentage of public schools not using Study Island that met AYP decreased by
13.6% [19].
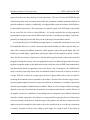
The ASSISTments [15] web-based intelligent tutoring system tutors eighth and tenth grade
students on concepts needed for the mathematics portion of the Massachusetts Comprehensive
Assessment System exam, and estimates the score they will likely achieve on the exam. The system
combines assistance (for students) with assessment(for teachers)in one comprehensive program.
9
1 INTRODUCTION
Building Intelligent Tutoring Systems
Figure 1: Screen-shot of the ASSISTments system.
1.2 The ASSISTments Project
Following the Education Reform Law of 1993, the Massachusetts Comprehensive Assessment
System (MCAS) [29] was implemented. MCAS tests are administered in selected grades to all
public school students in the Commonwealth, and are an important basis of accountability for
schools and districts as well as students.
The ASSISTments system is an effective web-based intelligent tutoring system used in several
schools throughout the Worcester and Boston areas to help prepare students for the math portion
of the MCAS exams. In May of 2004, the ASSISTments system was being used by approximately
200 students “in three different schools from about 13 different classrooms” [31] and has grown
significantly since then.
The mission of the ASSISTment system consists of three major goals: to provide tutoring
content to students, to provide teachers with useful reports on students, and to provide teachers
with the tools required for creating their own tutoring content [16].
10
1 INTRODUCTION
Building Intelligent Tutoring Systems
1.2.1
Assistance in ASSISTments
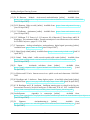
While the class is using the system, each student is presented with a series of questions similar to
those used on the MCAS exams. If the student answers the question correctly, he or she moves
on to the next question. If the answer provided is incorrect, the student is presented with a series
of simpler questions, called scaffolding questions, that break the problem down into simpler subproblems, as seen in Figure 1 [31]. The student must complete these scaffolding questions in order
to move on to the next question. They guide the student through a step-by-step process of solving
a given problem, but ask him or her to perform each step and apply each rule him- or herself. This
follows the example of many expert human tutors, who use hints and ask questions in an attempt
to guide students and remind them of existing knowledge, but still make sure it is the students
who actually do the work, go through the steps, and find a solution. As seen in Figure 2, once the
scaffolding questions are triggered, the solution box in the original question is de-activated, and
the student must work through all of the smaller steps. The student is thus prevented from rushing
through or skipping difficult problems. These scaffolding questions aim to give the student a
clearer and more complete understanding of the concepts used in the question; it forces the student
to work through the entire problem (an example of “learning-by-doing”) and provides a detailed
view of what the question requires, thus also revealing where the student went wrong the first
time [32]. A series of hints is available to the student if he or she is having trouble, and the final
hint provides the correct answer to the question, as shown in Figure 3 [38]. Thus, even if students
use hints to find the solution, they are still guided through the entire problem. As a result, they can
benefit from the problem even if they do not reach its conclusion on their own.
This method of teaching, where the tutor or tutoring system guides a student through a problem
is called “coached practice”. In such a system, the student is engaged in solving a specific problem
and the ITS guides the student to its solution. The coached practice method clearly follows the idea
of “learning-by-doing”, which is a recognized model of cognitive skill acquisition. The student
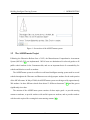
learns a topic by doing problems and working through them to a solution. Furthermore, the guided
11
1 INTRODUCTION
Building Intelligent Tutoring Systems
Figure 2: Screen-shot of the ASSISTments system: forced scaffolding.
student will always reach the solution of a problem and the system will not quit or move on to
another problem prior to receiving the appropriate answers. This has been proven to be beneficial
even if the student does not actively participate in the process of finding the solution and the
guide provides every step. The student is at the very least watching an example of the problem
being solved properly, rather than immediately moving on to another question with no attempt to
understand the current problem.
Furthermore, this approach overcomes the technical problems associated with using natural
language dialogues. In non-dialogue based systems, the problem solving environment is usually an
abstracted version of a real situation, where steps towards the solution can only be taken from a predefined set of actions, or where the problem’s domain has an underlying formalism that is easier
to parse than natural language (e.g. algebraic expressions). There is no need to try understanding
arbitrary questions from the student; the system only needs to be able to interpret answers. With a
12
1 INTRODUCTION
Building Intelligent Tutoring Systems
student’s actions thus restricted, the system development can focus on maximizing its educational
value and on providing appropriate feedback at any stage of the process. Even if the tutor fails to
identify a student’s action, it can still provide support; the guide is aware of the problem’s solution
and the developer can prepare stages that lead to the desired end result.
In 1993, V.J. Shute analyzed two variations on the feedback provided for students by tutoring
environments. The first variation is called “Rule Application”, in which the tutoring environment describes both the concept behind the question and the relationships between the variables
used. The second variation is called “Rule Induction”, which consists of the tutor pointing out the
relevant variables but requiring students to find the relationships between them [33]. The study
suggested that the student’s learning style and knowledge level should be the main factors influencing the content of the ITS’s provided advice. The advice should be generated based upon what
each student knows, and what information he or she needs to have to properly understand the concepts behind each question. This imitates the ability of a human tutor to provide hints and other
guidance based upon what he or she knows of the student’s existing knowledge and learning style.
However, the same graduated advice technique can also be accomplished by using different levels of advice without the need to model a student’s progress [4]. A proposed framework [4] for
generating advice content, or hints, consists of four stages:
• a reminder of the problem solving goal,
• a description of the current problem state and the desired goal state,
• a description of the rule for moving from the current state to the desired state,
• a description of the concrete action to take.
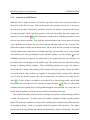
Questions in the ASSISTment system contain a series of hints which were developed following
similar guidelines, and are available to the student at his or her request. The final hint provides the
correct answer to the question, as shown in Figure 3 [38], thus ensuring the student’s awareness of
the problem’s solution.
13
1 INTRODUCTION
Building Intelligent Tutoring Systems
Figure 3: Screen-shot of the ASSISTments system providing hints.
1.2.2
Assessment in ASSISTments
The ASSISTments system is not just a tutoring system. It combines assistance, or tutoring, with
assessment of the student’s performance. By tracking all of a student’s actions within the system
(which questions were answered correctly on the first try, which required scaffold questions, when
the student asked for hints, how long it took to answer a question, etc.), it can measures a student’s,
or class’, understanding of each subject. Furthermore, the gathered data is used to estimate how
well each will perform on the MCAS exam. All of this information is made available to the
classes’ teachers who are thus able to track their students’ progress. The MCAS puts a great deal of
pressure not only on the students but also on the state’s teachers and schools to produce high scores.
Therefore, it is valuable to a teacher to be able to track his or her students’ progress. Measurements
provided by the ASSISTments system can be used to determine what areas need more attention,
14
1 INTRODUCTION
Building Intelligent Tutoring Systems
where a student is doing well, and where the class needs help. This sort of assessment can consume
vital classroom time that could otherwise be spent furthering the student’s progress.
With the ASSISTments program, the teacher can spend less time evaluating his or her class [31];
the reports from the system will provide him or her with a thorough and accurate evaluation on each
student and on the class as a whole. In addition, the students are learning while being assessed.
This means that the time lost on evaluating students through exams is reduced, instead they are tutored while their progress and knowledge is being assessed. The ASSISTments system will record
if a child gets an item wrong, but will also provide assistance and teach the child by guiding them
to the correct solution. Students also receive immediate feedback this way, so that questions are answered while they are still paramount in the students’ consciousness. This has obvious advantages
over the alternative of standard pen-and-paper evaluations where students do not receive feedback
on the exam until it is graded and passed back. Teachers can spend less class time evaluating
progress, while students can spend more time learning.
As with the actual MCAS tests, each ASSISTment, or question in the ASSISTments system, is
designed to test the student’s understanding on a few basic concepts. Each ASSISTment involves
at most three specific topics from a list produced by subject-matter experts. When a question is answered correctly, the probability of that student understanding all of these topics increases. When
a student answers incorrectly, each scaffold question presented correlates to one of the specific topics tested in the original question, and the student’s predicted skills are adjusted accordingly [10].
This “dynamic assessment” allows the ASSISTments program, and thus the student’s teacher, to
track each student’s skill levels, as well as which topics he or she needs help on, with much more
accuracy, and also provides a better estimation of the student’s likely performance on the MCAS
exams.
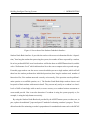
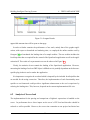
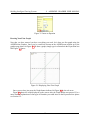
Therefore, an important tool of the ASSISTments system for teachers to quickly assess the
progress of their students is the “Student Grade Book”. Through this tool, the system reveals
information on each student’s performance to the teachers [31]. The picture in Figure 4 shows the
15
1 INTRODUCTION
Building Intelligent Tutoring Systems
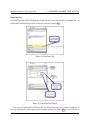
Figure 4: Screen-shot of the Student-Gradebook Interface
Student Grade Book interface. It provides the teacher with access to information like the “elapsedtime,” how long the student has spent using the system, the number of hints requested by a student,
his or her predicted MCAS score based on how well he has done on ASSISTments thus far, and his
or her “Performance Level” which indicates how his or her scores compare to the expected average.
From this page teachers can also access a more detailed report on a single student, which will tell
them how the student performed on individual questions (how long the student took, number of
hints asked for, if the student answered correctly or incorrectly, if the question was the problem’s
main question or a scaffold question, etc.). The Student Grade Book helps teachers observe and
keep track of their students with extensive detail. They can not only easily see a student’s or class’s
levels of skill or knowledge with as much, or more accuracy as a standard written assessment or
exam would provide. But it can also determine if a student is using the system properly or, for
example, is using the help button excessively.
By using the Student Grade Book tool provided by the ASSISTments system, teachers can, in
part, replace the traditional ”paper-and-pencil” method of evaluating a student’s progress. The traditional method for estimating a student’s preparedness for standardized exams such as the MCAS
16
1 INTRODUCTION
Building Intelligent Tutoring Systems
Tests is to issue practice exams during class, then grade them and possibly review them in class.
This method consumes a great deal of class time that could be more effectively used. The class
is not really learning while they take the practice exams, and students who already understand the
material will not benefit from reviewing it later. The ASSISTment system provides the same information as the written practice exams and offers further detail, and the teacher doesn’t have to do
any grading. The students are learning topics that confuse them while they do the problems, and
students with a complete grasp on a topic will not be forced to read hints and do scaffolding problems, but can instead continue on to the next problem without unnecessary and redundant review
that would only bore the student. Thus teachers and students both benefit from the ASSISTment
system’s combination of assistance and assessment.
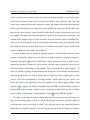
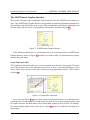
A major problem faced by Intelligent Tutoring Systems is off-task student behavior, where
students systematically exploit the system behavior to advance through a curriculum without intellectual participation [38]. In the ASSISTments system, this means asking for hints on every
question until the final “bottom-out” hint is reached, and then simply entering the correct answer
without giving any actual thought to the problem. This off-task behavior is called “gaming”. To
detect if a student is gaming, the ASSISTment team developed a set of machine-learned gamingdetection models which were able to identify this sort of behavior from a student with a certain
accuracy. This was accomplished by recording students’ actions while using the system. The
dataset generated by this observation had 1430 attributes and a boolean target attribute called
’gaming’ [38]. Using twelve different algorithms from the WEKA machine-learning system on
the generated dataset, the team was able to create a decision tree model which can detect whether
or not a student is gaming with a certain probablity. Figure 5 shows the WEKA interface.
The study revealed that on average, students who have less prior knowledge of the respective
topic are more likely to game or cheat the system. This suggests that students are often reading all
of the questions, and are more likely to “game” only if they do not have the required background
knowledge for solving the problem. To prevent gaming, the system logs the number of requested
17
1 INTRODUCTION
Building Intelligent Tutoring Systems
Figure 5: Screen-shot of the WEKA Interface
hints and the time spent on a particular problem. An analysis of this information could warn the
teacher of that students are possibly gaming, allowing them to take action in attempt to prevent
further gaming. In addition, a feature was added to the ASSISTments system that shows each
student a record of their activities. Also, if students ask for too many consecutive hints and the
system determines that they are likely to be gaming, an alert pops up that querying the student
whether he or she requires the requested hint in an attempt to prevent the student simply contiously
asking for hints. It was observed that students are less likely to game when they can see that the
system is tracking their actions [38].
1.2.3
Architecture of ASSISTments
“In 2001, the ratio of students to instructional computers with Internet access in public schools was
5.4 to 1, an improvement from the 12.1 to 1 ratio in 1998,” [21] that indicates the increased Internet
18
1 INTRODUCTION
Building Intelligent Tutoring Systems
availability for students. This means that more students and teachers will be able to use, and
contribute to, educational programs and tutoring systems that are developed as web applications,
such as the ASSISTments system, in order to facilitate accessibility and usage [35].
Because the ASSISTments system is a web application, it allows for much greater flexibility
than traditional desktop ITS programs. Content can be added by teachers and researchers, not just
highly experienced programmers. The system can be scaled up with relative ease to include more
material and servers for better performance. Teachers have easier, more convenient and complete
access via the “Portal” to the various aspects of the system. Researchers and programmers can
extend the system and add functionality in a central place, without the need to deploy the changes
to each client individually. In addition, its content can be incorporated into other systems with web
access to reach a much broader audience [30].
Currently, the ASSISTments system is a web-based “install-free”application which means that
accessing all of its functionality is possible from any machine with access to the Internet. This provides for convenient usage and content creation for students and teachers [35], as they can utilize
the system from any computer of their choice that is capable of connecting to the Internet. This
also means that that students or teachers can use the system on a school’s network without needing
to obtain any special access privileges that would be required to install programs on a school’s
network given the basic setup of an Internet node. Also, because the system is “install-free”, network administrators at the schools using this system do not have the additional responsibility of
continously upgrading the application. Moreover, building the ASSISTments system as a web
application not only provided greater flexibility than desktop programs, but also offers more protection against unforeseen technical or external complications. For example, if a school’s network
crashes, or a computer at the school is stolen or destroyed, students’ records will remain intact
on the ASSISTments team’s servers. This also facilitates the recovery process because it will not
force network administrators to look through different backup versions of their records. Finally, if
the system becomes so widely used that the load on the servers requires upgraded resources, the
19
1 INTRODUCTION
Building Intelligent Tutoring Systems
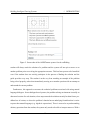
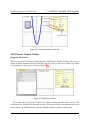
Figure 6: Screen-shot of the ASSISTments Builder
system can be enhanced centrally.
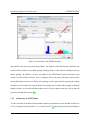
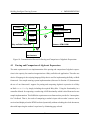
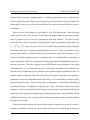
1.2.4
Content Creation in ASSISTments
Adding content to the system is a reasonably effortless process that does not require programming
experience. Content developers, both teachers and researchers, are provided with the ASSISTment
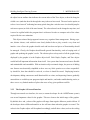
Builder, the intuitive interface of which is presented in Figure 6. The ASSISTment Builder provides teachers with the means for constructing questions, or ASSISTments, which they can then
add to a “curriculum” and assign to the students in their class. It contains the interface needed to
build a tree of scaffolding questions, branching from a main question and dependent upon the user’s
input [31]. Each of the scaffolding questions could in turn contain further branches of scaffolding questions and hints, and each could have different widgets for processing the student’s input,
such as radio-buttons, pull-down menus, check-boxes and text-fields. For developers to verify that
their content is being constructed correctly, the Builder also provides users with a ”live preview”
which is updated whenever the content of the ASSISTment is modified. This feature allows the
20
1 INTRODUCTION
Building Intelligent Tutoring Systems
author to see how the ASSISTment will appear to a student using the system and working through
a problem. The first scaffolding question is triggered automatically when a user answers the initial
question incorrectly or when when a user presses the ”Hint” button.
To test the efficiency of the ASSISTment Builder a different system was built to log the actions
of the authors. The data obtained by the system suggests that the average time needed to build
an entirely new ASSISTment, not including time spent planning the question and creating any
necessary graphics before entering the builder, is approximately 25 minutes [31]. With the use of
the ASSISTment Builder, content can be added simultaneously by several teachers and researchers,
from various locations, provided they all have an Internet connection. Thus the Builder enables
intuitive and rapid content development, allowing the system to grow as needed.
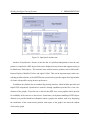
The ASSISTment system also provides teachers and researchers with easy access to a broad
range of features via the “Portal.” The Portal grants access to various capabilities of the system like
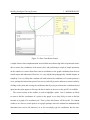
online reports, and administration and authoring tools [9]. For example, teachers have the option
of creating a report based on several criteria. A screen-shot displaying this process is shown in
Figure 7. In it we see that teachers can choose a specific class or student for which to generate
a report. Moreover, they can select a time period for the report and various sorting methods for
displaying its content.
21
2 PROBLEMS TO SOLVE
Building Intelligent Tutoring Systems
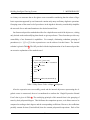
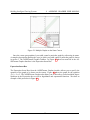
Figure 7: Screen-shot of the Report Criteria
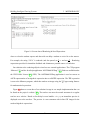
2 Problems to Solve
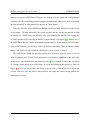
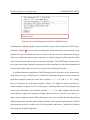
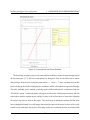
Currently, the ASSISTments system’s support for dealing with algebra is minimal. Expressions
cannot be evaluated for algebraic equality, making it difficult to fairly judge a student’s input, and
nearly impossible to provide specialized and useful feedback on it. Student text input currently
is evaluated via simple string comparison. This leads most content developers to make any problems that require an answer more complicated than a simple number be a multiple-choice question.
While this is true to the style of MCAS exams, it means that students can often derive their answer
(at least in part) from the options provided, rather than entirely working it out from the information
in the question. This speaks to the student’s cleverness, but defeats the system’s goal of assessing
his or her understanding of the topics. The system needs a way to evaluate and compare algebraic expressions based upon their mathematical value, not just the string’s ASCII content. If the
system had a way to parse strings and determine their simplified value, it would be able to show
more flexibility when dealing with students’ input (i.e. 3x + 3x is mathematically equivalent to 6x,
but a string comparator will not recognize this and could unjustly conclude that the student was
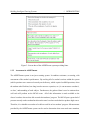
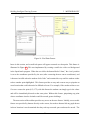
incorrect). In the picture below we show a similar situation that clearly illustrates the need for
22
2 PROBLEMS TO SOLVE
Building Intelligent Tutoring Systems
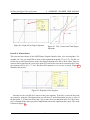
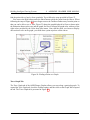
Figure 8: Screen-shot Showing the Need for an Algebraic Parser
evaluating and comparing algebraic expression based on their value instead of their ASCII representation. In Figure 8, we can see that even though the student entered the correct solution for the
problem, the system evaluated the result as “incorrect” because it cannot “understand” the input.
Such errors could lead to an inaccurate evaluation of a student’s progress and thus send the teacher
in the wrong direction when it comes to class time allocation. The ASSISTments system needs a
tool to parse and compare algebraic expressions in order to maximize its educational potential and
to ensure that students and teachers are receiving accurate feedback and results.
A problem inherent to comparison of ASCII strings is the fact that there are no common standards about the usage of white-spaces. Consider the following strings that represent intuitively
equivalent statements, namely the value of the variable x: “x = 1.25” and “x = 1.25”. Clearly,
these two strings are not equal when compared. However, we might use regular expressions or
similar techniques to ignore the use of white-spaces. Another possible cause for misinterpreting
expressions is illustrated in the following situation: x = 1 1/4. Most students and educators
would quickly recognize this statement as being equivalent to the two previous ones, but no ordinary string comparison would. While white-spaces seem to be a simple obstacle when parsing
algebraic expressions, both the nature of algebra and the various possible interpretations of ASCII
representations provide for endless ways of writing similar expressions. Consider the following
four strings that a student might enter:
23
2 PROBLEMS TO SOLVE
Building Intelligent Tutoring Systems
1. 2x = 3
2. 2 ∗ x = 3
3. x + x = 3
4. x = 3/2, x = 1 1/2, x = 1.5
Clearly the first three equations are equivalent. Only (4) is slightly different, in that it contains
the result of simplifying the previous equations to identify the numeric value of x. These examples
illustrate a further requirement for improving the tutoring capabilities of the current ASSISTments
system: manipulation of algebraic expression according to the associative, commutative, and distributive laws.
Also, the current ASSISTments system shows input simply as plain text, not as in the intuitive format they would take if the student were to write them, or as they would appear in a math
textbook. It is up to the student to convert a formula between proper equation appearance and the
ASCII string required by the system. Enhancing the system with the ability to display formulas
and equations as the student would write them on paper (i.e. with exponents indicated via superscript instead of carrots, and fraction denominators being displayed actually under the numerators),
would not only be more aesthetically pleasing, but would also aid the student’s progress, i.e. by
making it easier to determine if he or she has entered the formula as intended. Visualization is
an important learning tool, and equation formatting is a part of that. “Representing functions in
multiple ways is critical in student understanding of functions and success in mathematics” [7].
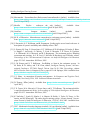
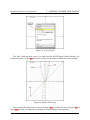
A vital part of learning algebra is understanding graphs. In academia, graphs have become an
indispensable tool for helping students to better understand the relationship between two functions
or curves, by offering them a visual representation of a function. Graphs are also indispensable
for students when exploring the mathematical patterns of first, second and third degree equations.
Unfortunately, graphing mathematical expressions can be a difficult skill to acquire especially
when teachers are forced to allocate class time to help students become comfortable with various
graphing tools. Pilot studies with PAT revealed an unexpected difficulty in graphing; it emerged
24
2 PROBLEMS TO SOLVE
Building Intelligent Tutoring Systems
that students did not have good heuristics for setting the axes’ scales and bounds dependent on the
size of the values being plotted in each problem [4]. Students must learn to graph formulas, read
graphs, and estimate the formula for a line or curve based upon how it is graphed.
Despite the importance of these skills, the ASSISTments system lacks sufficient support for
graph-related ASSISTments. If a content developer wishes to refer to a graph within a question,
he or she must include an image by uploading it. The system provides no feature for helping
the developer build this graph. He or she must create the graph in an external program, save the
image, and load it into the system while building the ASSISTment. Thus a developer’s ability
to include graphs is dependent upon his or her having access to, and knowing how to use, an
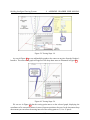
external program capable of producing the graph he or she needs. This is undoubtedly a timeconsuming and tiresome process. Including graphs in ASSISTments would be significantly more
efficient and desirable from the content creator’s end if the system provided an internal feature to
assist in the creation of these images. Even when developers do include images in their questions,
there is no way for a student to manipulate or interact with a graph. The abilities to graphically
visualize a formula, and manipulate or interact with a graph, could be powerful educational tools.
However, the current ASSISTments system has no sufficient support for such features. Extending
the algebraic capabilities of the ASSISTments system by allowing questions to include well-drawn,
interactive graphs that students can manipulate and use to draw their own graphs could have a major
positive impact on the educational value of the student’s experience with the system.
25
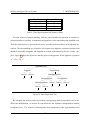
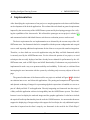
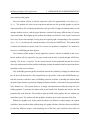
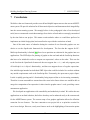
3 METHODOLOGY
Building Intelligent Tutoring Systems
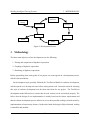
Analysis &
Test Cases
Initial
Planning
Prototyping
Requirements
Evaluation
Implementation
Release
Testing
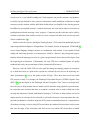
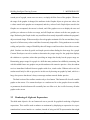
Figure 9: Development Process
3 Methodology
The three main objectives of our development were the following:
1. Parsing and comparison of algebraic expressions
2. Graphing of algebraic expressions
3. Rendering of algebraic expressions
Before approaching these main goals of our project, our team agreed on a development process,
which is discussed below.
Our development style generally followed the Test-Driven Model for software development,
which required us to develop test cases before writing actual code. Our main reason for choosing
this style of software development was the short time frame for our project. The Test-Driven
development model allowed us to ensure that all code written served and worked properly. We
believe that the design of our implementation is mainly based on the feature requirements and
that the chosen development process allowed us to cut down possible coding overhead caused by
implementation of unnecessary features. On the other hand, the design is Object-Oriented, making
it extensible and modular.
26
3 METHODOLOGY
Building Intelligent Tutoring Systems
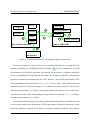
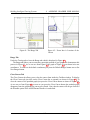
Our development process consisted of eight phases. Figure 9 shows an abstracted diagram of
this process. In the remainder of this section we will explain each stage of our development process
in detail. Our development process was iterative and circular at the same time. We first approached
subproblems of our main objectives and followed a common procedure that is represented by the
circular section of the diagram for solving the problem.
The first step of the process, the “Initial Planning”, represents the Pre-Qualifying Project phase
of our project which preceded our work in Budapest. In this stage, we conducted preliminary
research on ITS systems and agreed on the general project methodology. Also during this step, we
also wrote an initial project proposal and created our first prototypes to test possible tools. This
part of the development process ensured that all team members understood the requirements of
the project and agreed with the choice of tools. With our background research and our project
proposal completed, we were able to move to the second step of our development process, the
“Requirements.”
A major part of our Requirements phase consisted of identifying the features that our system
should support and figuring out under what constraints they would have to operate. This phase
also helped us ensure that our team was well synchronized and that dependencies between features
were handled correctly. By analyzing the the main requirements and identifying what subproblem
they consisted of we created our own set of requirements that helped us accomplish the main goals
of the project. We were thus able to assign tasks to different team members so that each of us could
work individually, increasing the efficiency and synchronization of our team.
The next step of our development process, “Analysis and Test Cases”, consisted of confirming that the requirements built in the previous stage were helpful for accomplishing the main requirements of the project. Additionally, we created test cases that identified our requirements for
features. The test cases were designed to target specific features.
The “Prototyping” step of our development process was aimed at illustrating whether our
choice for tools was appropriate and was sufficient for implementing the previously identified
27
3 METHODOLOGY
Building Intelligent Tutoring Systems
requirements. The use of prototypes in our project enforced an incremental software development
approach. To facilitate the release of our prototypes and gather feedback, we created a website
where we posted our prototypes, making them accessible to others. These frequent updates and
releases enabled us to constantly verify the status of our project.
The “Implementation” stage centered around the realization of chosen feature requirements. In
this phase we also used pair-programming in order to ensure the quality of our code and similarly
maintain a common level of understanding of the code base. The new features were then verified
in the “Testing” phase.
During the Testing phase we ran our implementations against the previously designed test
cases. Additionally, we looked for potential integration problems that could hinder the incorporation of our system into the current ASSISTments system. To ensure the compatibility of our
implementation with the current tutoring system, we used a Ruby on Rails [14] server to test our
server-side applications not only locally but also on a different setup that was in use by the ASSISTments system’s team. The testing phase served as the preparation for the “Evaluation” phase.
To enable remote evaluation of our software we made use of our website by providing prototypes online. We also used web-conferencing tools such as Skype and WebDialog’s Unyte to
communicate with Professor Heffernan who was at WPI while we worked at Sztaki in Budapest.
This step was usually performed once a week and its main purpose was to gather feedback on the
current status of our project. Once a prototype made it to the Evaluation phase, we made sure that
it had complete and comprehensive documentation and that it could easily be integrated into the
ASSISTments system.
3.1 Parsing and Comparison of Algebraic Expressions
The first objective of our project was to remedy a major lack of functionality in the current ASSISTments system: comparison of student answers and teachers’ solutions based on their algebraic
equality instead of their string equality. Adding the capability of comparing algebraic expressions
28
3 METHODOLOGY
Building Intelligent Tutoring Systems
has obvious advantages and leads to improved tutoring abilities of the system. It also provides for
a more convenient problem creation process, as a teacher need not try to anticipate what possible
answers a student might submit but can simply rely on the system to recognize equality. This
renders the requirement of anticipating multiple solution strings unneccessary.
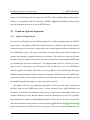
3.1.1
Analysis of Requirements
In addition to fulfilling the main objective, we decided to provide an extensible framework that
one could use to implement functionality for transforming or comparing algebraic expressions for
custom needs. To this end, we decomposed the functionality of our product into modular functions
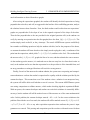
that can be reused by any application that supports calls to Ruby methods. For example, in a tutoring environment the need for appropriate feedback is obvious. For this one might require enhanced
features for the analysis of a possibly wrong answer in order to offer the student helpful advice.
Our system allows not only the use of the equality testing functionality, but can also be extended to
compare expressions based on other factors, such as the occurrences of terms with equal degrees.
This type of comparison might help to indicate that a student misunderstood the use of a coefficient
and the tutor could provide fitting feedback to the wrong answer, therewith improving the student’s
experience with the system. An implementation of a function that compares expressions based on
their degrees is part of our framework and can be taken as an example for extending the original
requirements to our system. One can observer that adding such functionality is relatively effortless
from the function’s implementation (Table 1).
In order to properly fulfill the requirements for features involved in comparing algebraic expressions for equality, we determined three main steps to take for processing the ASCII representations of an answer and solution expression. These were used for making design decisions for our
implementation, and can be summarized as follows:
1. Parsing of algebraic expressions
2. Transformation to a well defined normal form
29
3 METHODOLOGY
Building Intelligent Tutoring Systems
1 def compare degrees(a, b)
2
3 normalized exprs = eliminate fractions(a,b)
4
5 a degrees = get degree coefficients mapping(normalized exprs[0])
6 b degrees = get degree coefficients mapping(normalized exprs[1])
7
8 if a degrees.size == b degrees
9 a degrees.each{ |degree,coefficient|
10
if !b degrees[degree]
11
return nil
12
end
13 }
14 else
15 return nil
16 end
17
18 return true
19 end
Table 1: Ruby Source Code: compare degrees
3. Comparison of two expressions based on their normal forms
We decided to approach these three phases as a whole, but iteratively. This means that we
advanced by completing prototypes that would support a limited input grammar, but would be
able to parse, transform and compare a supported expression appropriately. After running our
previously devised test-suite and making sure that the process was implemented correctly, we
planned on extending the input grammar and devised appropriate test cases. After deciding upon
the next extension to the accepted input, we planned the required changes to the system. After
implementing this additional support, we ran the new set of test cases we had designed when
planning the extension, as well as the test-suite from the previous stage in order to fully ensure the
correctness of our additions.
We used a set of context-free grammars to define the set of algebraic expressions that our parser
supports as input. Similarly, we also defined the normal form that would be the basis for compar30
3 METHODOLOGY
Building Intelligent Tutoring Systems
ison of algebraic expressions as a context-free grammar. Using well-defined grammars to define
the capabilities of our framework helped us to write test cases before implementing functionality,
following the test-driven software development paradigm. More importantly however, grammars
allow for a universal definition of required input and output and therewith provide for reusability
to individual features of our framework.
3.1.2
Brief Discussion of Context-Free Grammars
We chose a formal grammar for documentation purposes, in order to clearly define the required
input to our framework’s tools and document their output for future reuse. The structure of an
algebraic expression lead us to use a context-free grammar, a well understood tool for defining a
set of strings that are accepted or produced by an application. A formal context-free grammar G is
commonly denoted as a four-tuple, G = hVn ,Vt , S, Pi, where:
• Vn is a finite set of non-terminal symbols,
• Vt is a finite set of terminal symbols,
• S ∈ Vn is a unique start symbol ,
• P is a finite set of production rules,
such that every p ∈ P is of the form N → w where N ∈ Vn and w = a0 a1 a2 . . . ai for 0 ≤ i
and a j ∈ Vn ∪ Vt for 0 ≤ j ≤ i. Furthermore, the language of the grammar, L = L (G) is the
set of strings that can be derived from S by applying rules in P such that for all α ∈ L we have
α = b0 b1 b2 . . . bk for 0 ≤ k and bm ∈ Vt for 0 ≤ m ≤ k. We chose to denote the respective grammars
by listing the production rules in P.
Context-free grammars (CFGs) are “Type-2” grammars within the Chomsky containment hierarchy for formal grammars and their respective languages. This means the languages that can
31
3 METHODOLOGY
Building Intelligent Tutoring Systems
be expressed by context-free grammars are equivalent to those that can be recognized by nondeterministic pushdown automata. A non-deterministic pushdown automata, or NDPA, has a stack
for storing a potentially infinite amount of information in a last-in-first-out fashion. At each step
a NDPA pops a symbol off the stack and can push a symbols onto the stack, read the next symbol
in the input string, and change state. CFG languages are contained in the set of languages that are
produced by “Type-1” (equivalent to the languages expressible by context-sensitive grammars) and
“Type-0” grammars (equivalent in expressibility to unrestricted grammars). The set of languages
that can be derived from regular grammars (“Type-3”) is contained within the set of languages that
are expressible through context-free grammars.
Context-free grammars provide a formal technique to clearly define the requirements for the
input to our framework as well as the output, the normalized form of an expression. More specifically, the language of the given context-free grammar is precisely the set of input or output expressions that are taken in or produced by our framework. The set of terminals consists of the
supported variable string, algebraic operations and representations of numerical values.
Using a context-free grammar improves our system’s expand-ability, as it is widely understood
by computer scientists and, and is a common and accepted way to document the capabilities of a
parsing application. Furthermore, it is worth noting that as context-free grammars are an established tool in the field of computer science, there exists a variety of optimized tools that use them.
For example, tools called parser generators have been created that can be used to produce a parser
from a given context-free grammar. For example, the application “Coco/R(uby)” generates “LL”
parsers in Ruby. The “LL” denotes a top-down parser that proceeds from the left to the right end
of the string (similar to the parser that is a part of our implementation), constructing what is called
the “left-most” derivation of the given word. One produces a left-most derivation by continuously
replacing the non-terminal that is closest to the left end of the string until only terminals remain.
The existence and popularity of these applications further emphasizes the usefulness of employing
such formal tools to describe our system’s capabilities.
32
3 METHODOLOGY
Building Intelligent Tutoring Systems
3.1.3
Analysis of Implementation
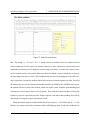
Before implementing the parser that would process the ASCII representation of an algebraic expression, we devised the grammar for the desired input. As mentioned in the previous section, we
approached the problem by iteratively adding to the supported grammar; the grammar that the current implementation supports can be found in Table 2. The grammar contains the basic algebraic
operations of addition, subtraction, multiplication and division. Furthermore, we included support
for exponentiation where the exponents are limited to non-negative integers, and for grouping expressions by a set of parentheses. The supported expressions are limited to one variable (according
to the grammar in Table [?] this variable is called x, however, the implementation is modular and
allows for choosing a custom string for the used variable). The parser supports three main numerical formats: integers, decimal numbers and improper fractions. Additionally, the parser ignores
white-spaces by removing them from the input string, except for the use of improper fractions,
which are delimited for internal recognition. Furthermore, we process the string before the parsing
starts in order to insert missing multiplication operators. This allows for the ASCII representation
to be more intuitive to the student and eliminates a possible source of confusion. For example, the
following string contains terms that are commonly recognized as products and also supported by
our parser: “(23x − 3x3 )(−x)”
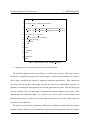
Our implementation of the parser proceeds by pattern matching for algebraic terms in the given
string recursively in order of algebraic precedence. This means that the string is processed similarly to a possible production using the given “Input Grammar”in Table 2. For example, the
expression 3x + x2 is first split into the summands 3x and x2 . Then the first summand is split into
the multiplicands 3 and x while the second is identified as base and exponent and split up accordingly. Following this procedure, the parser pattern matches a string until it identifies a “leaf” (or
terminal), in our case either a numerical value or the used variable.
After defining the desired input grammar, we designed the elements required for its internal
representation. We decided to use an object-based tree that would facilitate a convenient traversal
33
3 METHODOLOGY
Building Intelligent Tutoring Systems
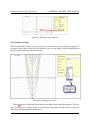
hExpi→+hSndihExpi|-hSndihExpi|+hSndi|-hSndi|hSndi
hSndi→*hMultihSndi|hMultihSndi|hMulti
hMulti→hBaseiˆhInti|hMultiˆhInti|hBasei
hBasei→x|(hExpi)|hNumerici|hInti hNumericihNumerici
hNumerici→hInti|hInti.hInti|.hInti
hInti→hIntihInti|1|2|3|4|5|6|7|8|9|0
Table 2: Input Grammar For Parser
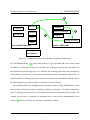
and transformation of the expression tree produced. Therefore, the created structure is an objectbased tree, where there is an internally defined class for each operation, the variable or numerical
values. This allows for immediate and clear identification of the nodes, and also isolates the functionality that applies to certain operations by containing it inside the class definition. Therefore,
our internal representation reflects the mathematical structure of the expression, grouping nodes
by their corresponding algebraic operations or isolating them as the number or variable that they
represent. The names of the current set of class definitions with their corresponding algebraic
equivalent terms are listed in Table 3. Additionally, Table 4 contains the set of class names for representing numerical values. The API for our implementation, which can be found on the project’s
website [12], contains a comprehensive documentation of the classes and their member methods.
Internal Object Name
Algebraic Term
SummandNode
Sum
MultiplicantNode
Product
FractionNode
Divisor
ParenNode
Expression grouped by parentheses
NegatedNode
Negation of an expression
ExpNode
Exponentiation
NumericNode
Numeric values
VarLeaf
The variable
Table 3: Class Representations for Algebraic Terms
34
3 METHODOLOGY
Building Intelligent Tutoring Systems
Class Name
IntLeaf
FloatLeaf
NumericFractionLeaf
TripleFractionLeaf
Numerical Type
Integer
Decimal Number
Rational Number
Improper Fractions
Table 4: Class Representations for Numeric Values
For each iteration of pattern matching, after the parser identifies an operation or terminal expression (number or variable), it instantiates and populates a class representing the identified term.
Thus, the expression tree is generated recursively, according to the precedence of the algebraic operations. The corresponding tree is intuitive with respect to the algebraic expression and therewith
should be reasonably integrable and adaptable to custom requirements for the tree’s nodes’ purpose. Figure 10 shows the object tree that the parser would generate for the algebraic expression
“x5 − (2x + 23)/x”.
SummandNode
(h
((
(
((
((((
hhh h
hhh h
h
NegatedNode
ExpNode
©
©
©H
H
H
VarLeaf IntLeaf
MultiplicantNode
»X
»»»
»
x
»
X XX
SummandNode
5
³
³³
³PP
MultiplicantNode
X
X
FractionNode
©©HH
©
H
PP
IntLeaf
IntLeaf
VarLeaf
23
1
x
©© HH
©
H
IntLeaf
VarLeaf
2
x
Figure 10: Parse Expression Tree
By arranging the nodes in order of precedence and grouping them by operations such as addition and multiplication, we achieve an expression tree that facilitates manipulation according
to algebraic laws. The structure is advantageous when compared to other representations such
35
3 METHODOLOGY
Building Intelligent Tutoring Systems
as a binary tree structure that at first glance seem reasonable considering that the subset of algebraic expression supported by our framework contains only unary and binary algebraic operations.
Grouping terms of the same level of precedence in the algebraic hierarchy considerably simplifies
the traversal of tree and transformation to the desired normal form.
Our framework provides methods that allow for a depth-first traversal of the object tree, visiting
only desired nodes and modifying them based on given predicates. These functions provide easy
extensibility of our framework’s capabilities. For example, eliminating redundant grouping of
parentheses (i.e. “((2 ∗ x))”) in the expression tree can be achieved via this feature. The internal
solution is given in Table 5. The API provided with the implementation of our framework provides
an extensive explanation of the methods used.
1 def collapse multiparens(node)
2
3 p = Proc.new { |paren node|
4 if paren node.child.class == ParenNode
5
paren node.child
6 else
7
paren node
8 end
9 }
10
11 return tree walker(node,ParenNode,p)
12 end
Table 5: Ruby Source Code: collapse multiparens
After the expression was successfully parsed and the internal object-tree representing the algebraic terms is constructed, the tree is transformed to conform the “Single Expression Normal
Form” that is given in Table 6. The underlying principle of this normal form is the grouping of
terms by their polynomial degree. This facilitates the comparison process, as it allows terms to be
compared according to their degrees and the corresponding coefficients. However, the coefficients
possibly contain divisors (FractionNode) that also contain polynomial expressions. Each of the
36
3 METHODOLOGY
Building Intelligent Tutoring Systems
FractionNodes (their denominator) is reduced into the single expression normal form in order to
facilitate later transformation into the normal form that is used to test two expressions for equality.
hExpri→hSummandNodei
hSummandNodei→+hMultiplicantNodeihSummandNodei|+hMultiplicantNodei
hMultiplicantNodei→hParenNodei*hExpNodei
hExpNodei→hVarLeafiˆhIntLeafi
hParenNodei→hCoefficientsSummandNodei
hCoefficientsSummandNodei→+hNumericNodei|+hCoefficientMultiplicantNodei
hCoefficientMultiplicantNodei→hNumericNodei*hFractionNodei
hFractionNodei→1/hExpri
hNumericNodei→hNegatedNodei|hNumerici
hNegatedNodei→-hNumerici
hNumerici→hIntLeafi|hFloatLeafi|hNumericFractionLeafi|hTripleFractionLeafi
hFloatLeafi→hDeci
hIntLeafi→hInti
hNumericFractionLeafi→hInti/hInti|hDeci/hInti|hInti/hDeci|hDeci/hDeci
hTripleFractionLeafi→hInti+hInti/hInti|hInti+hDeci/hInti|hInti+hInti/hDeci|hInti+hDeci/hDeci
hInti→hIntihInti|1|2|3|4|5|6|7|8|9|0
hDeci→hInti.hInti|.hInti
Table 6: Single Expression Normal Form Grammar
For the manipulation process, our framework contains a collection of methods that implement
singular operations on the expression tree. This follows the practice of decomposing functionality
into modules, isolating responsibility for certain operations. This isolation reduces the impact
of changes to these modules and therewith lowers the framework’s vulnerability to modifications.
Furthermore, it also allows for the partial reuse of our functionality when extending our framework.
The main steps of the transformation process can be summarized in the following list of operations:
1. Eliminating exponentiation with base other than the variable “x” by expanding to a product
or collapsing in case of a numeric base.
37
3 METHODOLOGY
Building Intelligent Tutoring Systems
2. Eliminate parentheses from expression according via the algebraic distributive law.
3. Transform negation into product, if negated expression is not numerical.
4. Combine multiple divisors in one product, by substituting them with a divisor that consists
of their product.
5. Group terms by polynomial degree
6. Combine numerical coefficients of all terms
It is worth noting that the implemented operations aim to maintain the form closest to the
normal form when manipulating an expression, for example when expanding expressions that are
grouped by parentheses. This means, for example, that at no point would an operation add an
exponentiation with a base other than a variable (VarLeaf) after the corresponding “expanding”
operation has been performed. For this reason, the framework distinguishes between parsed expressions and already processed expressions. This means that transforming a parsed expression
into a normal form is more expensive than transforming already processed expressions. This assumption is formalized in the API by the requirement that the input has been passed through a
subset of operations. The framework’s implementation “protects” such assumptions by conditionals which raise an AssertionError that is specific to our framework if they are violated. Figure 11
illustrates an example for the single expression normal form of the expression “(x + 1)2 − 1” as
the framework would produce it. The normal form can be seen as a sum of products, where the
products contain as one multiplicand the variable exponentiated to the degree of the term, and the
other multiplicand the sum of coefficients of the polynomial term.
However, the single expression normal form is inappropriate for the comparison of two expressions. In order to support the correct comparison of polynomial fractions, the expressions are
considered as a pair and their fractions are eliminated by multiplication. This means that each side
is multiplied with the greatest common denominator of the other side until all fractions have been
38
3 METHODOLOGY
Building Intelligent Tutoring Systems
SummandNode
(h
((
((((
(
((
hh hh
MultiplicantNode
»X
»»»
»
XX
ParenNode
ParenNode
ExpNode
©
©
SummandNode
MultiplicantNode
»» XXX
XX
»»»
XX
©H
x
ExpNode
H
H
VarLeaf IntLeaf
IntLeaf
hh hh
h
©
©
SummandNode
2
H
H
VarLeaf IntLeaf
IntLeaf
1
©H
x
1
2
Figure 11: Normalized Expression Tree
eliminated. The greatest common denominator is simply the product of the fractions that occur
as coefficients. It is worth noting that the polynomial expression’s degree, and possibly the number of summands, will increase after this procedure, as only non-numeric divisors will remain as
a FractionNode in the single expression normal form. This might lead to expensive operations
when a divisor contains a considerable amount of summands. After the fractions are cancelled out,
both expressions conform to the “Comparison Normal Form” given in Table 7. The two expressions can now be compared based on the degrees of the occurring terms and their corresponding
numerical coefficients.
3.1.4
The Solution’s Design
The nature of the programming language used, Ruby, allowed us to take advantage of both object
oriented and functional programming styles. We decided to use an object-based structure to represent the expression tree, because the representation is subject to frequent changes and traversals.
By using classes to represent operations as part of the structure, we can isolate the specific node
functionality in a class definition. Using objects to represent algebraic operations allows us to implement functionality specific to a certain operation in an isolated location and similarly facilitates
the identification of an algebraic operation while traversing the expression tree.
39
3 METHODOLOGY
Building Intelligent Tutoring Systems
hExpri→hSummandNodei
hSummandNodei→+hMultiplicantNodeihSummandNodei|+hMultiplicantNodei
hMultiplicantNodei→hParenNodei*hExpNodei
hExpNodei→hVarLeafiˆhIntLeafi
hParenNodei→hCoefficientsSummandNodei
hCoefficientsSummandNodei→+hNumericNodei
hNumericNodei→hNegatedNodei|hNumerici
hNegatedNodei→-hNumerici
hNumerici→hIntLeafi|hFloatLeafi|hNumericFractionLeafi|hTripleFractionLeafi
hFloatLeafi→hDeci
hIntLeafi→hInti
hNumericFractionLeafi→hInti/hInti|hDeci/hInti|hInti/hDeci|hDeci/hDeci
hTripleFractionLeafi→hInti+hInti/hInti|hInti+hDeci/hInti|hInti+hInti/hDeci|hInti+hDeci/hDeci
hInti→hIntihInti|1|2|3|4|5|6|7|8|9|0
hDeci→hInti.hInti|.hInti
Table 7: Comparison Normal Form Grammar
Furthermore, our implementation follows commonly accepted coding practices such as “Design Patterns” to improve modularity and extensibility. For example, the “Factory Pattern” was
used to hide the internal representation of numerical values. This is achieved by a common interface to a numeric value object and a central “factory” that returns the correct object for a given
numeric input. This allows us to support a variety of numerical notations (i.e. integers, decimals,
triple fractions, rationals, etc) and change their internal representation without impact on the other
parts of the framework.
The operations that are performed on the expression tree in order to transform it, were decomposed into individual functions in order to be able to use them in custom order and reuse them
from other Ruby compliant code. Therewith we tried to facilitate the use of our functionality in the
future version of the ASSISTments system, which will be based on the Ruby on Rails framework.
Furthermore, to improve the integrability of our framework, the provided methods and class defi-
40
3 METHODOLOGY
Building Intelligent Tutoring Systems
nitions are well documented in the framework’s API. The API is available online, on the project’s
website. It was produced with the commonly used RDoc [34] tool that produces documentation
based on comments in the source code in HTML format.
3.2 Graph an Algebraic Expression
3.2.1
Analysis of Requirements
Our project’s second objective was to build a grapher that could be incorporated into the ASSISTments system. The grapher would allow content developers to include graphs in their questions
without needing to create and save images using some external program and then load them into
the ASSISTments system. The system would have an internal feature that allows developers to
generate and customize a graph for inclusion in a question. This would save a great deal of time
and effort for the developers, and in many cases speed up the process of generating ASSISTments
by eliminating the need for an outside tool. The grapher would not just be a tool for the developers, however. It would be a powerful interactive tool for students as well. If an ASSISTment
includes a grapher, the student will be able to use it to graph his or her own functions and to gain
detailed information about all the lines plotted on the grapher. With this feature the ASSISTments
system will be able to offer students a much more powerful and educationally valuable tool than
the standard image that developers were previously able to include.
The grapher had a few very important requirements at the start of the project, based upon
the likely needs of the ASSISTments system. It must, obviously, draw a graph efficiently and
accurately. It would need to understand a large variety of expressions so that neither teachers nor
students would have to worry that their function would be misinterpreted or rejected. If possible,
users should not be required to install additional plug-ins for their browser in order to use the tool,
and it must run on three major browsers: Internet Explorer [6], Mozilla Firefox [27], and Safari [1].
Page refreshes must be avoided, and if server request is necessary the program should make use
41
3 METHODOLOGY
Building Intelligent Tutoring Systems
of AJAX functionality to only reload the necessary areas of the page. The grapher should be able
to draw in various colors to help distinguish old graphs from new, or a teacher’s graphs from a
student’s. It must be flexible enough to serve the needs of a great variety of question types. Finally,
the ASSISTments team must be able to incorporate the grapher into their system.
Our first task in developing this interactive graphing tool was to come up with a set of features
that should be included, and to decide what the grapher should be capable of. For this we examined
several existing graphing tools as well as existing ASSISTments that included graphs. It was
suggested from the beginning that the grapher should be able to draw in various colors. The
graphing tools in the Texas Instruments [17] TI-83 and TI-89 calculators became our models for
graphing style and capability. We also concluded that a tool for tracing a graph, like that available
in these calculators, would be very helpful for the student. Labeling numbers and units on the axes
could be essential to many ASSISTment questions. Highlighting points where two curves intersect
could be valuable to many questions. It was also deemed likely that a teacher or content developer
would like to only show the student a certain segment of a graph for some questions. A variety of
such features was compiled into a list and prioritized according to importance and difficulty.
3.2.2
Development and Implementation Details
We began work on the grapher by building a basic prototype to help us work out essential functionality and integration issues. The prototype tested communication between our various tools.
Our prototype verified that an SWF object created through OpenLaszlo and included in an HTML
page via an object tag could successfully communicate with JavaScript embedded in the HTML
page, or included in the page from an external file. The prototype also verified that we would be
able to utilize AJAX functionality in this page. Our group then continued to use this prototype to
test our process for drawing graphs. We drew axes, then added arrows and tic marks. We computed and drew basic graphs. We worked out how to change the scale, or ranges, of the grapher
and redraw the axes accordingly. New features were added and old code was altered as needed.
42
3 METHODOLOGY
Building Intelligent Tutoring Systems
However, through all this testing, code was added haphazardly to the program with thought only
to functionality and not style or good programming practices. When we had arrived at what would
be our final implementation we restructured the grapher program to incorporate Object-Oriented
programming principles and techniques. Our program became significantly more logical and modular. Using JavaScript’s support for Object-Oriented programming we built three classes, each of
which is responsible for its own data and functionality: the Grapher class, the Graph class, and the
Trace class.
The first and central module is the Grapher class. There will only ever be one Grapher object
for a given grapher. This class stores the canvas height and width, dimensions that indicate the size
of the Grapher object on the web page. The Grapher class also keeps track of values indicating the
scale of the graph(s) to be drawn on it, namely the minimum and maximum x and y values, and
their scaling factors. Also, so that we do not continually recompute a necessary value so often,
the Grapher class contains variables with the screen coordinates of the graph’s origin. The object
maintains an array containing the x-coordinate of each pixel across the canvas (not the screen
coordinate, but the ’actual’ value, the value that is represented to the user by that location on the
graph). Finally, the Grapher object maintains a list of all graphs currently drawn on it, and holds
the current trace object. An object of the Grapher class also contains a great deal of functionality.
The Grapher is responsible for building new graphs as they are input to the system, and for drawing
them. It contains all functionality needed should a user desire to change the scale or appearance of
the grapher itself.
Naturally the next module is the Graph class. A Graph object keeps track of all information
needed for its rendering. It contains all the traits chosen by the user: color, line width, erase-ability,
name, and the mathematical expression that is being graphed. The Graph class also maintains an
array containing the y-value of the curve for each x-value stored in the Grapher. These values are
necessary for when the graph is actually drawn onto the canvas. Having a Graph class provided
a data structure in which to store all information about a graph, which allowed us to remember
43
3 METHODOLOGY
Building Intelligent Tutoring Systems
the graph’s values so they would not need to be recomputed as long as the graph’s scale remained
unchanged. It also meant that these traits could be specific to a graph, not global to the grapher,
and thus the Grapher could maintain several Graphs each with different properties. Thus the appearance of our grapher, or at least it’s drawings, became more flexible. The ability to access
any attribute of multiple Graphs (as many as are drawn on the screen), makes it possible to add
countless new features that would have been exceedingly more complicated and inefficient without
this object-oriented design. For example, because the Grapher contains all of its Graphs, and each
graph contains all of its properties, it is a simple matter, when the Grapher’s scale is changed, to
recompute each Graph’s y-values and redraw them. Thus the user is able to “zoom in” or “zoom
out” without having to remember and re-enter all of his or her graphs.
In addition to standard graphs, the grapher can also draw segments of a curve or line; a feature
that would be useful if a teacher wished to highlight only a certain part of a graph. To implement
this we added two more attributes to the Graph class: a minimum and maximum x value. If the
Graph object is a full curve or line, then these attributes will be equal to the grapher’s minimum
and maximum x value. If the object represents a segment, then the values for these attributes will
be set by the user when the object is created.
The need for our third class became evident when we wanted the grapher to have a tracing
feature. The Trace module takes as input a Graph object and builds a Trace object based upon the
y values stored in that Graph, and the x values stored in the Grapher. The Trace object constructor
iterates through each value in the Graph’s array of y-values, and each value that is a valid number
and represents a coordinate that would actually appear on the grapher is converted to canvas coordinates and added to another array, and the x-value from the Grapher’s array that pairs with that
y-value to form the coordinates for a point on the Graph’s curve is likewise converted to canvas
coordinates and stored in another array in the Trace object. When the user traces a graph, a view
containing a small circle is moved so that the circle is centered over the coordinate point formed
by getting values from these two arrays with the same index. Thus, in addition to these two arrays
44
3 METHODOLOGY
Building Intelligent Tutoring Systems
the object has an attribute that indicates the current index of the Trace object, or how far along the
visible curve (and thus how far through the arrays) the user has traced. The user has the option to
select a “trace interval” indicating how many pixels along the x-axis the trace view should jump for
each trace request (or click of the trace button). The value selected can be changed at any time, and
is stored as a global within the program that is referenced in order to compute each of the values
required for the trace animation.
This object-oriented design approach meant very organized data management. Having separate, distinct classes, each with their own clearly defined roles to play, created a very clean and
intuitive view of how the grapher should work and how data and pieces of functionality should
be managed. Clearly, the Grapher should handle general functionality, such as keeping track of
graphs and updating the grapher’s scale. The obvious place to keep track of all the graphs being
displayed by the grapher is in the Grapher object itself. Each Graph, Grapher, and Trace object
would hold all important information about itself. Our system thus became much more flexible
and maintainable and extendable. With an intuitive object-oriented design, the process of adding
new features was drastically simplified as there was very little question as to where responsibility should lie, how data should be retrieved, or where it should be stored. Employing iterative
development, adding content one small functional bit at a time, and improving features gradually
ensured that we could keep our program simple and intuitive, and made troubleshooting easier, as
there were a very limited number of places the cause of any given problem could lie.
3.2.3
The Grapher’s External Interface
Through an external user interface, the user (a content developer for the ASSISTments system)
sets several important values for the grapher. This user chooses the initial range of the grapher.
By default, the x and y values of the grapher will range from negative fifteen to positive fifteen. If
the developer desires different bounds he or she will enter them when the grapher is created. The
values in the Grapher object will be updated accordingly, and all other values (such as the scaling
45
3 METHODOLOGY
Building Intelligent Tutoring Systems
factors, and the location of the graph’s origin on the canvas) will be recalculated based upon this.
The grapher includes a feature that will draw a pale grey grid in the background of the grapher.
This is a simple grid similar to what appears on graphing paper, but can be very helpful when
locating a point on the graph or estimating values along a curve. The lines extend the full length
or width of the canvas and coincide with the tic marks on the axes, meaning they represent whole
number intervals. The external user interface gives the developer the option of displaying this grid
on the grapher or leaving the background blank. Similarly the developer can choose not to display
the axes of a graph. If the developer does not want a student to be concerned with the values of
a curve but only the shape of it, he or she can turn off the axes and even the grid so the student
will see the expressions rendered on the grapher. By default both the grid and the axes are visible,
but the developer can easily change this. The external interface also allows the developer to set
labels for the x and y axes. By default, the axes are simply labeled X and Y respectively, but the
developer may wish to give the labels values that have some meaning in the ASSISTment being
developed.
OpenLaszlo provides us with the ability to pre-load data into the grapher. Thus the developer is
able to enter settings that will determine how the grapher will look when displayed to the student
attempting the ASSISTment. In addition, the developer can supply values for a Graph object that
will similarly be pre-loaded and appear when the ASSISTment being built is run and the grapher
first loaded on the page.
The most significant of the Grapher’s features is the ability to draw a graph. Through a user
interface the user (student or teacher) provides various attributes of the desired graph and the
grapher builds a Graph object with these attributes, stores the object in its array of graphs, and
draws the appropriate curve on the canvas. One attribute the user provides the graph with is a
name. This is a simple string that is stored within the Graph object and used to identify the Graph
when the user is selecting a curve to trace. While the implementation is not currently available,
a feature could be added to the grapher that would display this name on the grapher to identify a
46
3 METHODOLOGY
Building Intelligent Tutoring Systems
curve. If a name is not provided it will by default be set to “Graph“x”” where x is the order in
which the graph was added, or the Graph object’s index in the Grapher object’s array of graphs.
The user can also select a color for the graph (currently only eight color options are provided) and
the desired width of the line in pixels. Both of these attributes are stored in the Graph object upon
creation and will help determine the appearance of the graph when it is rendered.
The user building a Graph also determines whether or not it should be erasable. By default,
graphs created by developers are not erasable, or are permanent, and graphs created by students
are erasable. It is almost certain that when a grapher is used in the ASSISTments tutoring system,
and the ASSISTment’s author would like to present the question to the student with a graph preloaded onto the grapher, he or she would usually like that graph to be always visible to the student.
The student would be able to draw his or her own graphs, and erase them as desired, but the
author’s initial graph should never vanish. Thus we sought to make a graph permanent, so it would
remain on the grapher regardless of how many times a student clicks the “clear” button. This was
a simple matter of adding a boolean “erasable” attribute to a graph object, which corresponds to an
appropriate element in the external user interface. If the graph is set to be erasable, it is removed
from the screen and also the Grapher object when the graph is cleared. Ideally, permanent graphs
would not be removed. However, there is no way to selectively erase elements from the canvas
in the OpenLaszlo environment. Therefore even non-erasable curves are removed from the canvas
when it is cleared, but permanent graphs are not removed from the Grapher object, and they are
redrawn along with the coordinate system (axes), and any other permanent graphs, on the clean
canvas.
If the user wishes the Graph to be only a segment and not the full length of the line, he or she
will enter separate minimum and maximum x values for the graph. If these values are present when
the Graph is created it will be a segment only drawn between these points, otherwise the values
will be set to the Grapher’s minimum and maximum x values, and the graph will appear to full
length on the canvas. Figure 12 shows our user interface where the user can enter information on a
47
3 METHODOLOGY
Building Intelligent Tutoring Systems
Figure 12: Plot Segments Feature
graph , and the resulting graph. You can see first a full graph was drawn, and then only a segment
of a curve similar to that graph was drawn. The input that formed this segment is presented in the
fields of the interface.
The most important attribute of a Graph is its expression. The user enters a mathematical
expression into the external interface and this is given to the Graph object and used to perform the
calculations that determine what curve is drawn.
In order to draw the graph the user requested, the system must know the y-values of the graph
(what its expression evaluates to) at each x-value stored in the Grapher object. To calculate the y
values for the Graph object, we utilized ASCIIMathCalculator, a JavaScript file created by Peter
Jipsen and available under the GNU General Pubic License [11]. Our team used the mathjs()
method from this file to convert the ASCII string representation of the Graph’s expression into a
JavaScript string (i.e. x2 would become Math.pow(x,2). Using regular expressions to replace x
in the JavaScript string with each of the Grapher’s x values in turn, and using the eval() method
48
3 METHODOLOGY
Building Intelligent Tutoring Systems
to get a numerical value indicating what the expression evaluates to at each x value, our program
is able to assemble the formula’s y values.
With the y values for a graph thus computed, it is an easy task to convert these values to screen
coordinates based upon the size in pixels of the grapher’s canvas and the provided extents of the
graph’s axes. Before drawing a graph, the Grapher determines if each value is a valid coordinate.
Simple checks are required to make sure each element in the Graph’s array of y values is not
undefined, and is not Infinity. If the value failed either of these checks it was set to NaN (Not a
Number), which is why a check for !isNaN was unnecessary. If the Graph represents a segment,
then all y values matching x values outside of its desired range were replaced with NaN. To actually
draw a Graph, the Grapher iterates through the array of y-values and if a value is valid, it uses turtle
strings to draw a line from the previous value to the current value’s converted coordinate (and its
accompanying x-coordinate stored in the Grapher). If the graph contains invalid values (now a
simple check for isNaN), the Grapher will “lift the pen” and wait until it finds another valid value,
then start a new line segment at that location. This method of drawing by finding the right height for
each column of pixels in the screen and connecting them could potentially lead to jagged curves,
but as two calculated and connected coordinates will never be more than a pixel apart horizontally
the overall appearance is rather smooth. Any method for drawing would have similar results as
screens have square pixels and thus are incapable of displaying truly smooth curves. At first our
system also discarded any y values outside the Grapher’s range, but this resulted in incomplete and
disjointed graphs when a curve increased or decreased rapidly, and a section of the curve began
close to the center of the canvas, because the previous value was outside the grapher’s limits and
thus was skipped. If the Graph being rendered is a segment, then all y values that coincide with x
values outside of the segments range desired will be set to NaN and thus passed over when the the
graph is being drawn.
Drawing a graph using these calculations involves converting between the “actual” value of a
point (what the calculator determines it to be), and the screen coordinate of the point (where it will
49
3 METHODOLOGY
Building Intelligent Tutoring Systems
be drawn on the canvas). This is a simple matter of multiplying the “actual” value by a scaling
factor, which is computed by dividing the “actual” extents of the graph (twenty in a graph ranging
from negative ten to ten) by the “canvas” dimensions of the graph (500 pixels by default) and then
shifting the result so that it is properly placed relative to the “actual” origin. For example, in a 500
pixel wide graph ranging from negative ten to ten, the origin would be located in the center, at 250
pixels. But as the screen origin is in fact at (0,0), the pixel in the upper left-hand corner, we must
shift each point in the graph over 250 pixels (and likewise down 250 pixels if the y-axis dimensions
are the same) so that the origin of the graph will appear to be at the center of the grapher where it
belongs, not in the upper left-hand corner of the canvas.
3.2.4
The Grapher’s Toolbox
While external interfaces are used to set initial, pre-loaded values for the grapher and to build
Graph objects and draw their curves, we added a toolbox within the grapher to provide access to
its other features. This toolbox is in an OpenLaszlo window, a simple feature to create via the
OpenLaszlo framework. The toolbox window can be moved and resized, but is only visible within
the grapher object. The student can access the toolbox by clicking anywhere on the canvas, but a
check-box labeled “Toolbox” is provided on the grapher and when clicked this will bring up the
toolbox in its default location. This check-box is useful because clicking the canvas will bring up
the toolbox in its previous location, and if the student accidentally dragged the toolbox off of the
canvas he or she would not be able to retrieve it otherwise.
Within this toolbox window are several collapsible sections, one for each feature the user could
wish to access. The window and the sliding tab elements within it are features of Open Laszlo,
and were easily constructed. The functionality of the features within each section, however, are
largely implemented using JavaScript. The first section of this toolbox displays the coordinates of
a left mouse click. Whenever the user clicks on the canvas this section will open displaying the x
and y coordinates of the mouse click, relative to the Grapher’s axes as shown in Figure 13 This is
50
3 METHODOLOGY
Building Intelligent Tutoring Systems
Figure 13: Show Coordinates Feature
a simple feature whose implementation involved little more than using built-in OpenLaszlo methods to retrieve the coordinates of the mouse click, and performing a couple of simple operations
on the numbers to convert them from canvas coordinates to the graph coordinates that the user
would expect and understand. However, it is very helpful and pedagogically valuable despite its
simplicity. It is very likely that a student will wish to know the coordinates of a certain point on a
curve, perhaps the intersection point of two curves, and will get easier and more accurate results by
clicking on the point and viewing the coordinates than by trying to estimate the coordinates based
upon how the point appears to line up with the tic marks on the axes, or the grid if it is available.
The second section of the toolbox is used to highlight a point. Just as students are likely
to want to find the coordinates of a point on the graph, so are they likely to want to find the
location on a graph of a coordinate pair. That is where this feature will be useful. If a student
wishes to see where a certain point is on a graph (perhaps where the student has mathematically
determined two curves will intersect), he or she can simply type the coordinates into the text-
51
3 METHODOLOGY
Building Intelligent Tutoring Systems
Figure 14: Find Point Feature
boxes in this section, and a small red square will appear centered over that point. This feature is
illustrated in Figure 15. This was implemented by creating a small view with a red background
in the OpenLaszlo program. When the user clicks the button labeled “show,” the view’s position
is set to the coordinates provided by the user (after converting them to canvas coordinates), and
it becomes invisible when the student clicks “hide” and remains this way until the student wishes
to have another point highlighted. This feature provides an easy and accurate way to pinpoint an
exact location that could otherwise be difficult to locate. For example, if the student wishes to see
if a curve crosses the point (0.5, 0.75), with this feature the student can simply type in the values
and will be immediately directed to that exact point. Without this feature, pinpointing any point
whose coordinates involve decimals would be a much greater challenge.
The next section of the toolbox provides easy access to the trace feature. Initially, access to this
feature was provided by buttons directly on the canvas, but as these buttons hid any graph drawn
in those locations it was determined that they took up too much space and must be moved. The
52
3 METHODOLOGY
Building Intelligent Tutoring Systems
current incarnation of the trace feature can be seen in Figure 12. The trace feature maintains a
list, accessible via a combo-box, that contains all of the graphs currently on the canvas. The list is
updated every time the graph is cleared or a new curve is drawn. Each Graph is identified by the
name given to it by the user upon creation.
The feature implemented by the Trace module allows students to move a pointer along the
graph of a particular function and simultaneously display the coordinates of the current location of
the trace pointer. In this section of the Toolbox is a combo-box labeled “Increment” which allows
the student to select a value (five, ten or fifteen). This value will set the increment of the Trace
object, which determines how many pixels along the x-axis it jumps each time the student sends a
request to move the trace pointer. A lower value will show the student more detail about the graph,
while a higher number lets the student move the tracer along the graph more quickly.
The usefulness of the tracing feature becomes evident in any problem where a student is asked
to identify one or more points along a curve. A student could easily use a grapher for questions that
requires the student to identify, for example, a graph’s y intercept, or the point where two graphs
intersect, or at what x-value a graph has a certain y value. Once the student has deduced the answer
to this type of question, by visually analyzing the graph or by other means, he or she can verify
answers by using the trace feature to follow along the curve until the trace pointer hits a desired
value. Also, if a student isn’t looking for a specific point but merely wishes to see how the values
of a graph change, this tracing tool could be invaluable. By watching the trace pointer travel along
the curve at a steady pace, and reading the coordinates that are displayed at each point, a student
can see exactly how a graph’s values are changing. By providing both visual and numeric data
for the curve, this feature can help students with many different learning styles fully understand a
graph, thus providing an educational tool.
The next section of the toolbox allows students to change the grapher’s bounds. As demonstrated in Figure ??, by opening this section of the toolbox and entering new values into the textboxes provided, a student can change the extents of the graph. Thus the student can zoom in on a
53
3 METHODOLOGY
Building Intelligent Tutoring Systems
certain part of a graph, zoom out to see more, or simply shift the focus of the grapher. Whenever
the range of the grapher is changed, the attributes in the Grapher object are given new values, the
x values stored in the grapher are recomputed, and the y values of each Graph object stored in the
Grapher are recomputed, the canvas is cleared, and if the grapher was set to display the axes and
grid they are redrawn to fit the new range, and all Graphs are redrawn to fit the new grapher settings. Redrawing the Graphs in this way would have been nearly impossible without the program’s
object-oriented design. Without an object for each graph to maintain all of its own attributes, keeping track of all necessary values would have been nearly impossible. Giving students access to this
scaling tool provides a range of flexibility that still images would never have been able to accomplish. Students can learn by quick and simple practice about finding the best range for a graph.
Content Developers can ask a student to determine the proper range for the graph that displays
the solution to a question, rather than providing an image that already has the proper range set.
Determining proper range for a graph is a skill that many students have difficulty mastering, but
with this added feature our grapher can provide students with extensive practice. Also, the student
receives immediate feedback from our grapher with clear, visual results. Without such a tool, the
student would only be able to get practice in this area by drawing out graphs by hand, which is a
long, slow process that doesn’t always encourage students towards further practice.
The final section of the toolbox contains only a clear button. This button will clear all erasable
graphs on the canvas. If a content developer or a student sets his or her graph to be not erasable,
or permanent, then this button will essentially have no effect on it, but it will clear away all other
graphs on the screen.
3.3 Rendering of Algebraic Expressions
The third main objective for our framework was to provide for graphical rendering of algebraic
expressions. This could be used to enhance an assistment by displaying an expression in a representation that is more intuitive to a student, instead of using an ASCII representation that might
54
3 METHODOLOGY
Building Intelligent Tutoring Systems
Figure 15: Set Ranges Feature
lead to unwanted results. In order to identify appropriate requirements for our system, we first
considered under what circumstances a rendered expression might be used in the current ASSISTments system. We identified two main uses for rendering algebraic expressions that would improve
the student’s experience with the tutoring system.
The first way to improve the student’s experience is by integrating rendered expressions into a
problem or hint statement. This provides for improved understanding of the problem and prevents
confusion that is due to the representation of the problem statement. The expression is easier
to read for the student and therewith improves the learner’s experience with the tutoring system.
Therefore, integration within (HTML formatted) text had to be feasible and could not result in a
broken formatting of the statement.
Second, the rendering can be used to provide immediate feedback for an entered expression.
By previewing a rendered version of an input expression, the system can help the student identify mistakes based on incorrectly typed ASCII representations. Often the rendered version looks
55
3 METHODOLOGY
Building Intelligent Tutoring Systems
Figure 16: Screen-shot of Rendering In-lined Expressions
closer to what the student expects and therewith can help a student to revise his or her answer.
For example, the string “3/4*x” is rendered (and also parsed) as
3
4
∗ x and not
3
4∗x .
Rendering
expressions provides for immediate feedback and eliminates a possible source of confusion.
Our solution to the rendering objective involves two external applications: The CGI program
“Mimetex” [2] and the JavaScript application “ASCIIMathTeXImg” [25]. Both are available under
the GNU Public License [11] (GPL). The ASCIIMathTeXImg application is used to convert an
ASCII representation of an algebraic expression into a valid TEX expression. The TEX expression
is sent to the Mimetex program, which then renders an image using the TEX type-setting features
for mathematical expressions.
Figure 16 shows a screen-shot of our solution’s usage in our sample implementation that can
be found on the project’s website [12]. The teacher can enter the textual statement in a regular
text-box on a website. Based on JavaScript’s event handler onkeyup an immediate preview is
displayed next to the text-box. The preview is a text statement with in-line GIF images for the
rendered algebraic expressions.
56
4 IMPLEMENTATION
Building Intelligent Tutoring Systems
4 Implementation
After identifying the requirements of our project we sought appropriate tools that would facilitate
our development of the desired applications. We evaluated the tools based on general requirements
imposed by the current setup of the ASSISTments system and by developing prototypes for verifying the capabilities of the chosen tools. We collected the prototypes on our project’s website [12]
and commented on their individual features such that our evaluation process can be traced.
The basic requirements for our implementation were dictated by the current setup of the ASSISTments tutor. Our framework had to be compatible with the present configuration and our goal
was to avoid imposing additional requirements for the client so as to provide seamless integration.
Therefore, we have built our server-side application using the Ruby on Rails framework which
is currently used by the ASSISTments team. For the client-side portion of our project, we used
techniques that are easily deployed and have already been evaluated for performance by the ASSISTments team, such as SWF objects and AJAX functionality. Furthermore our project had to be
implemented in such a way as to promote usability and scalability. To this end, we refrained from
interrupting the user interaction with the system by refreshing only necessary objects of the web
page.
The general architecture of the framework for our project is outlined in Figure 17. We divided
our solution into server- and client-side applications. The parsing and comparison of expressions,
and dynamic rendering of images for representing algebraic expressions is handled on a server as
part of a Ruby on Rails ?? web application. Directly integrating our framework into the setup of
a Ruby on Rails application enforces its integrability into the ASSISTments system. The client’s
browser is used to display the rendered images and the grapher application. It also has to include
the required JavaScript functionality into the web-site’s DOM structure. As most modern browsers
support the displaying of images and provide support for JavaScript, the only additional requirement that is imposed on the client’s setup by our framework is the need for the “Flash Player”
57
4 IMPLEMENTATION
Building Intelligent Tutoring Systems
Mimetex
Rendering
Parsing
Parsing / Comparison
Controllers
Comparison
Graphing
Views
Included Javascripts
Models
Browser: HTML DOM
Ruby on Rails Framework
SQL Database
Figure 17: Architecture Of Our Framework
plug-in. However, the plug-in is supported by almost any modern browser and therefore seems a
reasonable requirement.
We generally followed commonly accepted programming practices. Both our client- and
server-side solutions make use of aspects of the object-oriented paradigm as well as the functional
programming paradigm where appropriate. This was made possible by our choice of languages and
tools. To implement server-side features we used the programming language Ruby. The client-side
functionality was written mainly in JavaScript, and using the OpenLaszlo framework as a development environment. Both languages support the above mentioned paradigms. We believe that
through making use of these paradigms, we gain benefits such as extensibility and modularity for
our framework.
58
4 IMPLEMENTATION
Building Intelligent Tutoring Systems
1c
Mimetex
1
Parsing
1d
Rendering
Parsing / Comparison
Controllers
Comparison
Graphing
2
Views
1a
Included Javascripts
Models
Browser: HTML DOM
Ruby on Rails Framework
1b
SQL Database
Figure 18: Communication Process for Parsing and Comparison of Algebraic Expressions
4.1 Parsing and Comparison of Algebraic Expressions
The main requirement for our implementation of the parsing and comparison of algebraic expressions is the capacity for seamless integration into a Ruby on Rails web application. Therefore our
choice of language is the scripting language Ruby that is used for implementing the Ruby on Rails
framework. Our sample tutoring system implementation (discussed in Section 6.2) demonstrates
the use of our framework’s support for parsing and comparing algebraic expression in a Ruby
on Rails Controller by simply including the required Ruby files. Using the functionality in a
controller allowed for requesting a result using AJAX functionality which is also illustrated on our
sample implementation. This fulfills the requirement to our framework to provide for “interruptionfree” feedback. That is, the result of comparing a student’s input with a teacher’s answer can be
retrieved and displayed on the HTML website dynamically without reloading the whole document,
therewith improving the student’s experience by eliminating page reloads.
59
4 IMPLEMENTATION
Building Intelligent Tutoring Systems
However, the language Ruby itself also proved to be a correct choice for this part of our project.
Ruby’s native support for regular expressions strongly supported our approach to parsing expressions based on well-defined context-free grammars. Additionally, it allowed for iterative addition
to the supported input grammar by simply extending the regular expressions for mathematical
terms. It also facilitated the pre-processing of a string in order to strip unrequired white-spaces
and identify certain missing multiplication operators or the use of “improper fractions” such as
“3 3/2”. Furthermore, Ruby provides convenient support for object-oriented programming and
therewith facilitates our approach to producing an object-based expression tree. On the other hand,
its support for closures proved to be convenient for the transformation of the object structure and
providing an easily extendable framework.
The abstract diagram in Figure 18 summarizes the communication process for the parsing
and comparison of algebraic expressions. The process is started after a student has entered an
expression as his or her answer. By using JavaScript’s XMLHttpRequest object, the reply is sent
“asynchronously” to the server, more precisely to a controller action of the Ruby on Rails web
application. The controller then retrieves the stored teacher’s solution from the SQL database. It
uses the included parsing and comparison API to test the two strings for equality. The textual
response is rendered and retrieved by the XMLHttpRequest object on the client side. The call-back
that was added for the retrieved response then populates the result to the HTML DOM, providing
the student with feedback about his or her answer.
4.2 Graphing of Algebraic Expressions
To govern the user’s interaction with the grapher and the internal handling of events, we decided to
use JavaScript. It is a scripting language that implements the ECMAScript language specifications
and therewith provides extensive functionality for handling objects based on events. It can be
easily integrated and embedded into HTML web pages as most modern browsers provide support
for it. As the ASSISTments system is a web application, and our grapher program would be used
60
4 IMPLEMENTATION
Building Intelligent Tutoring Systems
as part of the DOM structure of an HTML page, embedded JavaScript was a natural choice. Also,
actions such as drawing or clearing a graph would be triggered by the user interacting with the
web page. Thus the event driven programming supported by JavaScript was essential. JavaScript
is object based and supports higher-order functions and closures. Therefore, we were able to make
use of both the object-oriented and functional programming paradigm in our implementation.
OpenLaszlo is an open source platform for developing “Rich Internet Applications”. The platform consists of the LZX programming language and an OpenLaszlo Server application. LZX is an
XML and JavaScript description language similar to XUL (Extensible User Interface Language),
and XAML (Extensible Application Markup Language). The OpenLaszlo server is a Java servlet,
running on an Apache Tomcat server, that compiles LZX applications into executable binaries for
targeted run-time environments. Figure 19 shows an overview of the OpenLaszlo Architecture.
From the two deployment methods shown, our team made use of the “Stand-alone,” also called
“Solo,” deployment method. Our choice of deployment supports integration of the compiled SWF
object without requiring a running OpenLaszlo server in the background. This cuts down the traffic
overhead and also reduces the server-side requirements that our framework imposes.
There are several features of the OpenLaszlo platform that motivated our choice to use it for
our project. OpenLaszlo is an open source product and currently has a rapidly expanding community that provides the required support. The project also includes updated and comprehensive
documentation, along with extensive tutorials and examples. Another factor that made OpenLaszlo
our preferred choice is its debugging capabilities that were especially helpful in the troubleshooting of JavaScript source code. The framework provides a convenient “debugging console” that
can be compiled into the SWF object for testing purposes when the object is executed through the
OpenLaszlo server. The console can be used to inspect objects and follow the execution process
inside the OpenLaszlo application cleanly. This provides for a more orderly development process,
rather then using ad-hoc techniques to reconstruct the SWF’s execution by manually setting GUI
elements to display the desired values.
61
4 IMPLEMENTATION
Building Intelligent Tutoring Systems
Figure 19: OpenLaszlo Architecture
Another of OpenLaszlo’s features is the fact that it is platform-independent in that the endproduct is compiled to a SWF object which can be displayed in any browser that supports a plug-in
for Shockwave-Flash objects. This includes most modern browser products such as Microsoft’s
Internet Explorer, Mozilla’s Firefox, and Apple’s Safari. This was an important aspect when considering possible solutions, as the ASSISTments system needs to provide support for a high number
of clients with possible varying browser preferences.
In addition, the platform has an aesthetically pleasing interface which includes powerful and
helpful GUI components. OpenLaszlo’s extensive drawing capabilities provided for a clear visualization of the graphs. Of special note is the fact that SWF uses vector graphics which provide
for scalability of the canvas to a desired size. Furthermore, the dynamic handling of SWF objects
allowed us to provide immediate information about a graph to the student, such as by displaying
the coordinates of the current mouse position with respect to the graph’s axes when the student
clicks on the graph.
62
4 IMPLEMENTATION
Building Intelligent Tutoring Systems
JavaScript Functions
JavaScript Functions
ExternalInterface.addCallback()
LzBrowser.loadJS
External Interface
Open Laszlo Application
HTML DOM
Figure 20: Abstract Diagram Illustrating Usage Of ExternalInterface
One feature of OpenLaszlo that is very important to the integrability of our framework is its
support for dynamically loading XML data into an application. This feature of OpenLaszlo allows
for seamless integration into a Ruby on Rails (Rails) web application, as the web framework supports the convenient conversion of “Model-Data” to XML data [13]. Our implementation makes
use of both OpenLaszlo’s and Rail’s features to load the setup for a grapher object, and populates
the canvas with stored graph expressions if applicable.
In order to integrate the SWF object into an HTML page, we used Flash’s ExternalInterface
class which is supported not only by the OpenLaszlo framework but also most modern browsers [26]
This class provides for adding call-backs to internal functions to the SWF object in the web-site’s
DOM structure. It similarly allows calls from inside the SWF object to JavaScript functions that
are defined in the enclosing DOM structure. This allowed us to remedy certain shortcomings of
the current version of OpenLaszlo (such as the support for ECMAScript/JavaScript functionality is
limited) [24] by implementing selected features in JavaScript files that can be included in a website
and which the grapher object can make use of through the ExternalInterface.
63
4 IMPLEMENTATION
Building Intelligent Tutoring Systems
Mimetex
Rendering
Parsing
1
Controllers
Comparison
Parsing / Comparison
Graphing
Views
2
1a
3
4
Included Javascripts
Models
Browser: HTML DOM
Ruby on Rails Framework
1b
SQL Database
Figure 21: Communication Process for Graphing Algebraic Expressions
In order to compute the required values for a user input expression, we are using the functionality provided by the ASCIIMath Scientific Calculator [20]. It takes a string that is an ASCII
representation of an algebraic expression, and converts the occurrences of algebraic operations
to their corresponding JavaScript function invocations. For example the algebraic exponentiation
operation is commonly represented with the “caret” character ˆ in an ASCII representation, while
the corresponding JavaScript function is Math.pow(b,e) where b and e are the numeric base and
exponent respectively. Therefore the string “5ˆ2” would be converted to “pow(5,2)” which can be
evaluated with JavaScript’s Math object. Our tool then replaces all occurrences of a variable like x
with a numerical value. After transforming the string, it then uses JavaScript’s eval() to evaluate
the string using JavaScript’s Math object.
One should note that our project is not entirely dependent on this product, but instead one could
reuse any other product that substitutes the ASCII representation of algebraic operations by their
JavaScript equivalent in a given string. However, using the existing functionality means that the
64
4 IMPLEMENTATION
Building Intelligent Tutoring Systems
graphing capabilities exceed our initial requirements. The grapher is able to handle trigonometric
as well as the natural logarithmic and exponential functions. Additionally, we were able to focus
on the functionality of our grapher tool instead of the acquisition of numerical values.
Our choice for tools and languages provides for easy integration into any existing web application. We believe that the requirement of a browser that supports the “Flash Player 8” (or higher)
plug-in is reasonable and would likely not impose deployment difficulties for the system.
4.3 Rendering of Algebraic Expressions
In order to provide for rendering of algebraic expressions, we sought a solution that could easily be integrated into the existing ASSISTments system and would not increase the client-side
requirements unnecessarily. This dictated two main requirements:
1. Browser compatibility (without additional plug-ins)
2. Suitable input formatting
The constraint of having to support most graphical browsers ruled out solutions that required
an additional plug-in or are only supported on specific products (such as W3C’s recommendations
for MathML [37]). Our solution instead relies on server-side image generation, which is supported
by virtually any modern browser. The image generation is done by querying the CGI-program
“Mimetex” [2] which is available under the GNU General Public License [11] (GPL). The programs is queried by referencing it in the src attribute of an HTML img tag and passing a TEX
mathematical expression as an argument. The program returns a GIF image corresponding the
TEX rendering of the expression.
In order to fulfill the second requirement, we chose a markup-like integration, using delimiters (backticks) to highlight which substring of a given text should be rendered as an expression.
This provides for seamless integration of algebraic expressions into problem statements. The expression entered by a content-creator is processed by a JavaScript function that is provided by
65
4 IMPLEMENTATION
Building Intelligent Tutoring Systems
3
Mimetex
Rendering
Parsing
Parsing / Comparison
Controllers
Comparison
2
1
Graphing
Views
Included Javascripts
Models
Browser: HTML DOM
Ruby on Rails Framework
SQL Database
Figure 22: Communication Process for Rendering Algebraic Expressions
the “ASCIIMathTeXImg” [25] script which produces a TEX expression and can be used as input
for Mimetex. Furthermore, because our solution uses JavaScript to process the expressions, and
then dynamically sets the image tag’s “src” attribute, the rendering can be timed using JavaScript’s
event-handlers. This provides a convenient and immediate preview of an algebraic expression. Using this method of rendering expressions, teachers and students can immediately identify whether
the ASCII string they entered actually corresponds to their desired input.
Our solution provides for straightforward integration into the existing ASSISTments system
and any other website that requires rendering of algebraic expression. Our sample implementation of a tutoring system exercises the described functionality and demonstrates its benefits. The
example can be used as a guideline for integration but we also provide documentation on our
website [12] on how to include our solution in any arbitrary website.
66
5 DEMONSTRATION IMPLEMENTATION
Building Intelligent Tutoring Systems
5 Demonstration Implementation
To demonstrate the use of our tools and that they could be incorporated into the existing ASSISTments system, we built a “mini-assistment system” that included all of our tools. Questions can
include a grapher, and student answers are parsed and checked against the correct answer provided
by the teacher based upon algebraic equivalence not string comparison, and student input (and
mathematical expressions in a question or hint) is rendered as the student types. With this sample
system, because it is only for demonstration purposes, a question can have a hint or scaffolding
question, which may contain a grapher, but anything more (further hints or scaffolds) must be hardcoded uniquely for that problem. Questions in this system, therefore, provide less guidance than
the standard ASSISTment system would include, but the questions fully demonstrate the feasibility
and educational value of its features.
5.1 Building an ASSISTment in the Demo System
To build an “ASSISTment” in our mini system, the user enters the system as a teacher, selects
“New Assistment” and is brought to the builder. The developer types in his or her question, with
any mathematical formulae they need to be rendered delimited with backticks. A preview of the
question, including rendered formulae and HTML text formatting, appears beside the text-box
as the developer types. As the next step, the solution to the question is entered, and this is also
rendered as an algebraic formula, in a readable format, again allowing the teacher to verify that the
entered ASCII representation meets the intended expression. Then the developer creates the initial
settings he would like the grapher to have when the question is loaded and seen by the student.
He or she can set a custom range for the grapher, decide whether or not the grid or axes should be
shown, and enter labels for the axes that are appropriate to the grapher. Finally, the content-creator
can enter a custom expression whose graph, or only a segment of the graph are displayed on the
grapher when it is loaded. For such a graph, the developer can choose a color, line width, and
67
5 DEMONSTRATION IMPLEMENTATION
Building Intelligent Tutoring Systems
Figure 23: Preview of Problem Statement
assign the graph a name, by which it will be identified if the student tries to trace the graph. The
developer can also set the “erasable” setting of each graph, which determines whether or not the
graph will be erased when the student clears the grapher. Previews of the grapher are generated so
that the developer is sure he or she will be showing the student what he or she intended to. This
same procedure is followed then for the ASSISTment’s scaffolding question, and the development
procedure is complete.
5.2 Perpendicular Line Demo Problem
One problem built in our demonstration system is typical of the type of question in which the actual
ASSISTments system could use our features to improve the student’s experience with the tutoring
system. It presents the student with the expression for a line ( f (x) = 2x + 1), properly rendered,
68
5 DEMONSTRATION IMPLEMENTATION
Building Intelligent Tutoring Systems
Figure 24: Grapher Setup
and displays the graph of this line on the grapher’s canvas. It asks the student for the expression
for the function whose graph is perpendicular to this line, and additionally passes through the point
(3, 7). This problem could be built with the tools available in the current ASSISTments system,
but the graph would be a simple image, and the student would not be able to interact with it. Any
graphs a student would try to plot while solving the problem would have to be done by hand on
scratch paper, which is a time consuming process. With our system, the student can instantly (and
accurately) draw the graph of a given expression and compare it to the graph presented by the
teacher’s problem statement.
Figure 25 shows the sample problem. Note that when this question was built, the content
developer decided to decrease the bounds of the grapher to range from negative ten to ten on both
axes. The developer is free to decide which “zoom level” best suits the problem, how much of the
graph should be shown to help the student focus on what the question requires.
69
5 DEMONSTRATION IMPLEMENTATION
Building Intelligent Tutoring Systems
Figure 25: Perpendicular Line Demo Problem
The first thing a student trying to solve this problem could do is locate the point through which
the line must pass: (3, 7). He has several options for doing this. First, he can follow the tic marks
and grid lines from the axes to find the point where x = 3 and y = 7 meet, and then click on that
point to bring up the toolbox displaying the coordinates which will confirm or negate the findings.
The other, probably easier, method is to bring up the toolbox and enter the coordinates under the
“Find Point” option. A small red square will appear over the point, identifying its location, and will
remain there until the student moves or hides it, so he or she will not have to waste time re-finding
the point every time he looks at the graph. This small step of making the student find the point
has a pedagogical benefit over still images that would just provide the point, because it forces the
student to pay attention to the process of locating a point on a coordinate system, an essential skill
70
5 DEMONSTRATION IMPLEMENTATION
Building Intelligent Tutoring Systems
when working with graphs.
Next, the student will try to find the expression of the line perpendicular to the line f (x) =
2x + 1. The student will work out an expression and then use the provided grapher to plot the
expression and see if it is indeed perpendicular to the given line. Perhaps the student makes several
attempts without success, and the graph becomes crowded with many different lines of various
colors and widths. By bringing up the toolbox the student can click the “clear canvas” button and
clear away all previous attempts, leaving only the original graph corresponding to the expression
f (x) = 2x + 1, provided by the content developer who built the ASSISTment. The student finds
a solution and submits an answer, and if it is correct, the problem is completed. If a solution is
incorrect, a scaffolding question appears.
The evaluation of the student’s answer against the teacher’s solution is handled on the server,
but the student will not experience any page reloads and the data is gained through AJAX functionality. The server’s “response” for the entered answer is then populated beneath the text-box
where the student answered the problem indicating whether the student found an expression that is
equivalent to the correct solution.
This scaffolding question guides the student towards the solution by helping the student learn
how to derive the formula for a line perpendicular to a given line. In the actual ASSISTments system this question would have more scaffolding questions and hints, reminding the student about
the point-slope form for expressions, helping the student find the y-intercept for the perpendicular
line’s formula, etc. This system, however, is simply a demonstration and thus has only one scaffolding question. It presents the student with several simple line formulas and asks for the line
perpendicular to the first one. The student is again provided with a grapher, this one without any
initial lines given. The student will then graph the formulae given in the statement of the hint.
Without our grapher tool, if the content developer was limited to simple images, the student
would have been provided either with an image of a graph with these four lines drawn and labeled,
or with four different images, each containing one of the lines, and would have been asked to
71
5 DEMONSTRATION IMPLEMENTATION
Building Intelligent Tutoring Systems
Figure 26: Perpendicular Line Problem Hint
find the scaffold’s solution based upon that. This gives the students no freedom to manipulate the
graphs and plot the combinations most helpful to them. With the grapher, the student is free to
graph the lines in any arrangement and color combination he or she pleases. As seen in Figure 26,
the student can graph the first line in one color and the rest in another color, so it is clear which line
each is being compared against. If the student wishes to see the first line paired alone with each
of the other lines, he can draw the first line and set it to non-erasable, and then graph and clear
each of the other lines in turn. With the grapher, the student is given the tools, freedom, and ability
to build the visual representations most appropriate for his individual learning style, and to get as
72
5 DEMONSTRATION IMPLEMENTATION
Building Intelligent Tutoring Systems
much information as desired from these graphs.
After seeing the expressions graphed, the student will identify the third expression as being
perpendicular to the first, and will, as suggested in the last line of the scaffolding question, analyze
the relations between these formulae. Next, the ideal student would realize that two expressions’
graphs are perpendicular if the slope of one is the negated reciprocal of the slope of the other.
Thus the line perpendicular to the one provided in the original question will (as the student can
verify by entering an expression into the first grapher) have the form f (x) = (−1/2) ∗ x + b. The
student simply needs to find b, or the y-intercept. The actual ASSISTments system would likely
have another scaffolding question to help the student with this, but for the purposes of the demo,
we assume the student will know that he or she simply needs to plug the x and y coordinates of the
point into the expression, which yields 7 = (−1/2) ∗ 3 + b, and then solve for b. The student finds
the answer to be (−1/2) ∗ x + 8.5, graphs the line to be sure, and then submits the correct answer.
As the student types the answer, it is rendered next to the text entry box in a form that’s easier to
read, so the student can be sure that the expression he or she provides is of the intended form, and
no stray parentheses or mistyped fractions will result in a wrong answer.
Finally, for each of the answers the student submits, the system uses our parsing and comparison mechanism to evaluate the student’s expression for equality with the solution provided by the
content developer. This means that even if the student writes a solution in an unexpected way,
the system will still be able to tell whether or not it is correct. The current ASSISTments system
uses string comparison to validate answers, which makes checking algebraic equations difficult.
With our parser, the content developer and student can write their solutions in essentially different ways, but the student will still be marked correct if the answers are of the same mathematical
value. In this problem, the content developer entered −0.5 ∗ x + 8.5 as the correct solution to the
problem. But with the use of our tools, the student will still be marked correct if (−1/2) ∗ x + 8.5,
−x/2 + 17/5 or 8.5 − 0.5x or any other equivalent expression that conforms the parser’s input
grammar was entered. This parsing and comparison provides teachers with much more freedom
73
5 DEMONSTRATION IMPLEMENTATION
Building Intelligent Tutoring Systems
when creating assignments for their classes, because they are not forced to make multiple-choice
answers to questions, trying to anticipate possible answer expressions of equivalent value.
5.3 The Biker Problem
With the help of Péter Juhász of MTA SZTAKI, our team built a more challenging problem into
our demonstration ASSISTment system. In this problem there are two bike riders, one (Max) starts
at point (−10, 0), traveling straight from left to right, and one (Moritz) at (0, 10) traveling from
top to bottom on the coordinate plane. The student is asked to find the time (after how many units
of time) at which they are closest if Moritz is traveling at twice the speed of Max. The student is
provided with a grapher (initially blank) in order to be able to graph any formulae they develop
while solving the problem. The grapher’s axes are labeled, indicating to the student that he or
she should find a function to plot the distance between Max and Moritz over time. As few eighth
or tenth grade students know calculus, and the MCAS exams do not test for calculus, the student
would solve this by graphing the parabola and finding the value of the vertex, or minimum. This
type of problem requires the system to have an interactive grapher. As the student is expected to
derive the formula for the parabola, still images would not be helpful, and expecting the student to
graph the parabola by hand on scrap paper is not practical. This demonstrates an important way of
using our tools in order to solve problems of maximizing or minimizing certain functions without
requiring prior knowledge of derivatives and other calculus operations.
Assuming the student does not provide the correct answer on the first try, the system presents
a series of scaffolding questions to guide the student towards the answer. As seen in Figure 28,
the first two scaffolding questions ask the student to derive values for the bikers’ positions relative
to time. In the actual ASSISTments system, the student would be provided with hints to guide
him towards the solution, but for demonstration purposes the student must come up with a solution
without hints. Also, the current ASSISTments system would require multiple-choice answers for
these two questions because there is no sure way to know what form the student’s answer will
74
5 DEMONSTRATION IMPLEMENTATION
Building Intelligent Tutoring Systems
Figure 27: Biker Demo Problem
take. The strings “x − 10” and “−10 + x” are the same to a student, but not in a character based
string comparison. In this system, the student’s answers to these questions are parsed and tested
against the provided answer for algebraic and not string equivalence, so neither the content creator
nor the student needs to worry about what exact form the student’s answer should take, as long as
the knowledge conveyed is correct. This fundamentally increases the pedagogical value of the student’s experience, because the student cannot infer the answer from the options provided. Provided
the student does not use the bottom-out hint that would be provided by the ASSISTments system,
the student will have to derive the formula, which can require a more complete understanding than
selecting the correct answer from a list of options. Even with the bottom-out hints, forcing the
student to write the expression provides further exposure and makes understanding more likely
than simply selecting the proper radio button would.
When the student has derived the formulas for the two speeds (x − 10 for Max and 10 − 2 ∗ x for
Moritz), our system reveals this assistment’s final scaffolding question. It helps the student derive
75
5 DEMONSTRATION IMPLEMENTATION
Building Intelligent Tutoring Systems
Figure 28: Biker Demo Problem Hints
the distance function’s expression. The assistment points out that the lines are perpendicular, thus
forming two sides of a right triangle. The distance between the points on either line at any point
in time, therefore, is the length of the hypotenuse of that triangle, which can be found by using
the Pythagorean Theorem. According to the Pythagorean Theorem, the distance would be equal
to the square root of the sum of the squares of the sides. The question does not reveal this much
detail, but if this problem were to be implemented in the actual ASSISTments system this question
could have hints and perhaps scaffolding questions of its own to help the student discover this
information. The question’s text further points out however, that the task of minimizing the result
of a square root is equivalent to the task of minimizing the radicand, and thus the student is only
asked to do this. The correct answer to this question is (x − 10)2 + (10 − 2x)2 , or 5x2 − 60x + 200
if the student chooses to expand the expression’s terms.
76
5 DEMONSTRATION IMPLEMENTATION
Building Intelligent Tutoring Systems
After the student correctly answers the final scaffolding question, a hint appears that tells the
student that he or she needs to graph the formula he has just derived, and then determine the
minimum value of the function from this graph. The student is also reminded that when graphing
expressions one must consider what ranges should be graphed. If the student tries to graph the
expression with the grapher’s bounds at their initial setting they will not see a result. Once again,
the grapher is forcing the student to learn more than pre-made still images could.
Figure 29: Biker Demo Problem: Change Ranges
The student must consider the proper bounds for the grapher. Logically, as the x values in
the formula represent units of time, and y values on the graph represent distance at certain time
points, neither of these can be negative, so the grapher’s x-min and y-min values can be set to 0.
Mathematically, the expression is the sum of squares and thus can have no negative y values. The
student is only interested in the minimum values of the expression, and the expression would be
lowest when the factors it is summing up approach zero. Thus the student should derive that the
graph should be most interesting around the values of 10 and 5, and then perhaps choosing 15 as
77
5 DEMONSTRATION IMPLEMENTATION
Building Intelligent Tutoring Systems
a safe value for the maximum positive value on the X-axis. The value of f (10) is 100, but f (5)
is 25. The student can discard any values greater than 25, perhaps choosing 30 as the maximum
positive value on the Y-axis.
Finding appropriate bounds for a graph is an important skill for students to learn, as it must be
done whenever graphs are built. Our grapher tool clearly facilitates the acquisition of such a skill
by providing the student with the ability to modify the canvas’ ranges. This skill would be difficult
to practice and test in a system whose only graphs are static images.
After changing the ranges of the axes, the vertex of the graph, the time at which distances
is lowest, becomes clearly visible on the graph. To find this value the student can estimate the
value based upon grid lines and labeled tic marks on the axes, or the graph can be clicked, and the
coordinates viewed as displayed in the grapher’s toolbox.
Figure 30: Biker Demo Problem: Find Point
Another way for the student to find the coordinates of the point is to use the grapher’s Trace
feature, accessible from the toolbox. The student can bring up the “Trace Graph” section of the
78
5 DEMONSTRATION IMPLEMENTATION
Building Intelligent Tutoring Systems
toolbox, choose a graph (listed by the name the student provided when he or she graphed the
expression), click the “Select” button, and then use the “+” and “-” buttons to move the trace point
along the curve until it approximately reaches the parabola’s vertex and displays its coordinates.
To verify that the coordinates are correct, the student can use the “Find Point” feature in the
toolbox to type in his coordinates, and see if the point highlighted by the red box is at the base
of the parabola’s curve. Since the question is asking for the number of units of time, which is
measured on the x-axis, the student should submit the x-coordinate of this point, which can then
be identified as the value 6.
79
6 TESTS AND ANALYSIS
Building Intelligent Tutoring Systems
6 Tests and Analysis
We analyzed the implementations of our tools by commonly accepted metrics. The evaluation was
done with mainly our initial requirements in mind. The main design goals, besides fulfilling the
technical requirements, were the integrability of our code and its modularity. To achieve these
goals, our choice of tools was made after taking into consideration the ASSISTments system’s
current setup, and its future migration to a Ruby on Rails web application. We demonstrated the
integrability and re-usability of our solution mainly via the sample tutoring system implementation available the project’s website. In addition, we made use of software engineering metrics to
evaluate our application’s performance. Because our framework is to be part of a web application,
the main concerns were download speed and the traffic imposed on the system’s server by our
framework. The load imposed on the server by the usage of our parsing and comparison functionality is also of concern when arguing for our framework’s usability and practicality. Therefore our
analysis distinguishes between download size and load imposed on the server. Additionally, we
argue for the re-usability of our framework by analyzing the customizability of the user interface.
6.1 Traffic Analysis
In order to analyze the additional traffic imposed on the user’s web connection, we need to identify
the actual total size of the files that need to be downloaded from the server. This consists of the files
needed for client-side execution of our grapher, the JavaScript files needed for rendering algebraic
expressions, and possibly the images that represent rendered expressions.
The biggest part of the required files is the OpenLaszlo application which is embedded in the
website’s DOM structure. The source code of this application adds up to only 40 Kilobytes, but
its compiled version takes up 149 Kilobytes. This compiled version, together with the required
JavaScript files and a basic HTML file sums up to approximately 210 Kilobytes. In this value, we
included an estimated size of 55 Kilobytes for the JavaScript files required for the computation of
80
6 TESTS AND ANALYSIS
Building Intelligent Tutoring Systems
graph related data and the rendering of such expressions. The rest is left for the HTML file that
contains the grapher tool, its controls and possibly the assistment’s problem statement and hints to
guide the student to a solution. Additionally, we might include a generous estimate of 40 Kilobytes
for the rendered expressions. The expressions are rendered as gray-scale GIF images, and usually
do not exceed the size of five to eight Kilobytes. It is worth noting that the serving program is
generating the images in the order of milliseconds, therefore, according to the authors’ experience,
generally not imposing a noticeable delay on the rendering of a downloaded website.
A total download size of 240 Kilobytes might impose a considerable constraint for users with
low bandwidth. However, we believe that most educational facilities are able to provide their students with a stronger broadband connection which supports connection speeds higher than 256
kilobits per second (kbps), significantly reducing the impact of the imposed overhead. Furthermore, this file need only be loaded once (with the initial page load) and is afterwards controlled
through JavaScript if necessary. Also, the application requires no additional page loads for acquiring data to populate graphs, as the application is able to load the required XML data autonomously
and dynamically based on arguments given to the object’s tag. Furthermore, the ASSISTments
team is currently expecting actions from an individual student in intervals of twenty seconds on
average. With this in mind, an average page load time of approximately three to five seconds for
rendering the assistment seems reasonable to the authors. We also believe that the usage of an interactive grapher might increase the average time taken for an assistment, as a student’s interaction
with the system might be stimulated by new abilities. However, such a change of behavior strongly
depends on the type of problem that is posed by the assistment and whether it makes full use of
the grapher’s interactive capabilities. Generalizing such an assumption is thus difficult and should
instead be verified empirically. Nevertheless, it seems possible to argue that the level of interaction
with an assistment could increase with the usage of the grapher tool and thus a longer load time
might seem more reasonable to the student as he or she would not move on to the next assistment
as quickly. Students are likely to be willing to wait longer for a page to load, if they know an
81
6 TESTS AND ANALYSIS
Building Intelligent Tutoring Systems
Figure 31: Octagate Results
appreciable amount time will be spent on that page.
In order to further examine the performance of our tools, mainly that of the grapher application, with respect to download and rendering time, we employed the online statistics tool by
Octagate [28] to benchmark the loading time of a sample website. The test website includes the
JavaScript files that are required for the control of the OpenLaszlo application as well as the application itself. The results of a representative run can be observed in Figure 31.
Clearly, the statistics do not contain the loading of the OpenLaszlo application. However,
measuring the loading of such an SWF object is difficult as it is partially dependent on the browserspecific plug-in that is used to render the application.
It is important to recognize the overhead which is imposed by the included JavaScript files that
are needed for the string conversion. Therefore, the implementation of such functionality more
specific to our framework could provide a significant enhancement to the user’s experience by
reducing the loading time. This, however, depends on the custom implementation’s file size.
6.2 Analysis of Server load
The implementation for the parsing and comparison of algebraic expressions is handled on the
server. Its performance has a direct impact on the server’s CPU load and therefore should be
reduced as well as possible. However, the severe time constraint on our project has limited our
82
6 TESTS AND ANALYSIS
Building Intelligent Tutoring Systems
analysis of the framework’s implementation to verifying its performance by the used test suite.
The test suite incorporated a large set of test cases that were used mainly to verify the framework’s
functionality. However, we believe them sufficient to draw initial conclusions about the system’s
performance.
Most test cases were handled in a time frame of 80 to 1200 milliseconds. Where the upper
values are mainly due to the increase of terms when expanding products of parentheses groups,
sums, or products that are bases for exponentiation with large numbers. The authors experienced such delay only for expressions with reasonably large corresponding normal forms (e.g.
(x − 1)10 /(x + 2)6 ). These test suites were run on an author’s personal laptop, using an Intel Pentium M processor with 1.6 Gigahertz and 2048 Kilobytes cache size. The average runtime of a test
case was approximately 140 milliseconds for expressions whose normal form contains up to 70100 terms. We believe that the average of 140 milliseconds is a reasonable time for evaluating two
answer expressions. For this, it is important to note that such requests are handled only on the submission of an answer. Therefore, using the current ASSISTments team assumption of an average
“interaction time” of 25 seconds between server requests and a 200 milliseconds estimated computation time per comparison request yields that a non-optimized laptop could handle at most 125
students without waiting time. This holds true if the set of students is assumed to start requesting a
comparison in intervals of 200 milliseconds with a “delay” of 25 seconds before a student requests
the next comparison result. This is, however, only an estimation, as it discards the possibility of
queueing the requests, accepting an average load time. This is the normal situation for requests
handled by a web server, and we believe that under such circumstances our framework will provide
sufficiently quick responses for multiple classes. Expecting improved serving capabilities with the
ASSISTments system’s setup, we believe that our framework performs with reasonable bounds to
the imposed server load.
One possible improvement to our current setup would be a change to the storage of a teacher’s
solution to a problem. Currently, the solution expression is stored in its ASCII representation and
83
6 TESTS AND ANALYSIS
Building Intelligent Tutoring Systems
has to be parsed and normalized for each comparison request. One could instead store a serialized
copy of the normalized object at the time of the problem’s creation. Our framework facilitates this
process, as the expression tree is an instantiation of a set of Ruby classes. The object would be
normalized to conform to the single expression normal form, therewith reducing the operations
required to transform this expression for comparison (i.e. only the existence of fractions would
require further processing). This would certainly lead to a performance improvement in the case
of expressions whose normal form is large in size.
6.3 Analysis of the Interface’s Re-usability
An important part of integrating our framework into the ASSISTments system is the customizability of the interface to our tools. This requires that our tools can be adjusted to fit the overall
appearance and design decisions of the tutoring system. More specifically, control of the graphing
tool should be adaptable and modular.
We believe that our grapher framework can be reused by, and customized to meet the requirements of any web application’s user interface. This is mainly due to the fact that our application
can be controlled through JavaScript. This means that regular HTML elements can be used to
manipulate the grapher. This enables our framework to be controlled by form elements, allowing
for effortless database integration together with the combination with Ruby on Rails’ Model-ViewController setup. Figure 32 shows the plain HTML form elements that are used for controlling the
grapher. The fields are used first for acquiring values for controlling the grapher through JavaScript
to preview the desired setup. After submitting the entered data, the information is stored in a Ruby
on Rails model. Therewith, the OpenLaszlo application can query the corresponding controller for
the XML representation of the parameters that a content creator entered the application’s setup.
Furthermore, the OpenLaszlo application offers a plain but pleasing interface that remains
elegant. Therefore, the authors believe that integrating the graphing tool into a website significantly
adds to the user’s experience by adding interactivity. Additionally, we try to demonstrate the
84
6 TESTS AND ANALYSIS
Building Intelligent Tutoring Systems
Figure 32: Grapher Setup
educational value of the implemented features of our graphing tool in Section 6.
6.4 Source Code Metrics
For the acquisition of metrics for the software engineering perspective, we decided to use Noel
Danjou’s Count [8] tool to analyze our JavaScript files. Using this tool, we were able to find
statistics for the source code of our implementations, and also analyzed the files included from
applications external to our project.
The source file of the OpenLaszlo application takes up approximately 42 Kilobytes for about
1200 lines of code, where about 10% are used for commenting purposes and another 15% were
left blank for the readability of the code. The code contains 48 function definitions of which
three are used to define “objects.” Additionally the code contains two methods that are part of
the XML structure of the OpenLaszlo application. We have compiled a file that is required for
85
6 TESTS AND ANALYSIS
Building Intelligent Tutoring Systems
the control of the grapher tool through HTML elements. Furthermore, it provides the interface
to the files that are included in order to compute the graph’s values. The file has an approximate
size of 3 Kilobytes and contains 91 lines of code from which 12 are used to add comments. The
file currently includes seven function definitions. The “ASCIIMathCalculator.js” file provides the
functionality for transforming an ASCII representation of an algebraic expression into a string that
is evaluable by JavaScript. The size of the file is approximately 6 Kilobytes and has a total of 216
lines of code of which 17 were lines of comments. The file’s functionality is decomposed into
seven methods. The “ASCIIMathML.js” file contains functionality required for the conversion of
the ASCII representation of an algebraic expression. More specifically, the implementation of the
ASCIIMathCalculator.js file requires its availability. It has an approximated size of 41 Kilobytes
and a total of 939 lines of code of which 42 lines were left blank, and 73 were lines to comment
on the source code. The file contains three function definitions.
The parsing and comparison of algebraic expressions on the server-side consists of seven files
that contain Ruby source code. The total of their individual sizes adds up to 72 Kilobytes. They
contain approximately 2300 lines of code, 28% of which contain comments on the implementation’s details. The API totals seven class definitions together with 129 method definitions.
86
7 CONCLUSIONS
Building Intelligent Tutoring Systems
7 Conclusions
We believe that our framework provides a useful and helpful improvement to the current ASSISTment system. We provide solutions for all three main objectives and demonstrate their integrability
into the current tutoring system. We strongly believe in the pedagogical value of our developed
tools, but we encountered certain shortcomings of our choice of tools and were strongly constrained
by the time limit to our project. This meant certain setbacks where we would have preferred to
implement our initial design plan, but instead had to cope with the restrictions at hand.
One of the main source of obstacles during the creation of our client-side grapher was our
choice to use the OpenLaszlo framework for development. The fact that the support for ECMAScript functionality is limited [24] forced us to partition our solution for the grapher into two
applications: The SWF object for plotting of graphs on the one hand and the JavaScript functions
that have to be included in order to compute an expression’s values on the other. This was due
to the fact that the OpenLaszlo framework does not support the eval() and only supports parts
of JavaScript’s Math object’s functionality., and does not support the use of regular expressions.
Our initial design intended an individual SWF object that could be included in a website without
any outside requirements such as the JavaScript files. Fortunately, the open-source project OpenLaszlo is rapidly growing and it’s functionality being improved due to its increasing community.
Therefore it seems reasonable to assume that with a near in the future release one would be able to
merge the computation of an expression’s values into the grapher source’s code, providing a more
autonomous application.
We developed our applications with extensibility and modularity in mind. We realize that our
applications are no final solutions, but believe that they can be enhanced easily to fit custom needs
for the ASSISTments system. The current setup of our grapher application allows for effortless
extension for new features. The time constraint to our project led us to prioritize certain features in our design. However, surely new features such as the highlighting of intersection points
87
7 CONCLUSIONS
Building Intelligent Tutoring Systems
or the timed animation of a graph could be added in order to improve the student’s experience
with the system. OpenLaszlo’s components provide a rather straight-forward use of a so called
animatorgroup to animate certain elements of the canvas. All graph related data (such as the
y-values) is stored conveniently in a “Graph” object for each expression inside the application
and can be used for the animation. The collection of Graph objects that is associated with the
“Grapher” object can also be used for realizing the highlighting of intersecting points by simply
checking for equal Y-values when plotting the graphs and then placing a marker on points with
equivalent coordinates.
Another possible enhancement to the current framework would be an original implementation
of the ASCIIMath Scientific Calculator’s functionality that is used for converting ASCII representations of algebraic expression into evaluable JavaScript representations. The solution could be
handled on the server’s side or on the client’s side. We believe that the most appropriate solution would be implemented as part of the OpenLaszlo application such that the application would
not rely on outside files. But the above mentioned limited support of ECMAScript functionality
currently obstructs this approach.
Our current solution for parsing and comparison of expressions covers polynomials of nonnegative degree, the most commonly used algebraic operations and also polynomial fractions.
However, there remains a more advanced set of operations (such as taking the square root and
trigonometric functions) that is not supported by our current implementation. The time constraint
was our main reason for the limited support of algebraic expression in our parser and comparison
mechanism. However, the framework is well documented and the current support well defined by
the given grammars. Additionally, our current solution is clearly structured and can be reused in
modules. Therefore, we believe that our solution facilitates the extending of support for additional
algebraic operations and can be customized to a tutoring system’s requirements.
88
REFERENCES
Building Intelligent Tutoring Systems
References
[1] Apple.
Apple - mac os x - safari rss [online].
Available
http://www.apple.com/macosx/features/safari/ [cited 24 April 2007].
from:
[2] J.
F.
Associates.
mimetex.html
[online].
http://www.forkosh.com/mimetex.html [cited 24 April 2007].
from:
Available
[3] B. S. Bloom. The 2 sigma problem: The search for methods of group instruction as effective
as one-to-one tutoring. Educational Researcher, 13(6):4–16, jun 1984. Available from:
http://links.jstor.org/sici?sici=0013-189X%28198406%2F07%2913%3A6%3C4%3AT2SPTS%3E2.0.
[4] A. T. Corbett and K. R. Koedinger. Intellingent tutoring systems. In Handbook of HumanComputer Interaction, pages Second Edition, Chapter 37, Pittsburg, Pennsylvania, USA,
1997. Carnegie Mellon University.
[5] A. T. Corbett, K. R. Koedinger, and J. R. Anderson. Intelligent tutoring systems. In M. G. Helander, T. K. Landauer, and P. V. Prabhu, editors, Handbook of Human-Computer Interaction,
pages 849–874, Amsterdam, The Netherlands, 1997. Elsevier Science B. V.
[6] M. Corporation.
Internet explorer:
Home page [online].
Available from:
http://www.microsoft.com/windows/products/winfamily/ie/default.mspx [cited
24 April 2007].
[7] R. F. Cunningham. Agebra teachers’utilization of problems requiring transfer between algebraic, numeric, and graphic representations. In School Science an Mathematics, Vol 105.
Questia Media America, Inc., 2005.
[8] N.
Danjou.
Miscellaneous
tools
[online].
Available
from:
http://www.noeld.com/programs.asp?cat=misc#lcounter [cited 24 April 2007].
[9] M. Feng, N. T. Heffernan, and K. R. Koedinger. Addressing the testing challenge with a webbased e-assessment system that tutors as it assesses. In WWW ’06: Proceedings of the 15th
international conference on World Wide Web, pages 307–316, New York, NY, USA, 2006.
ACM Press.
[10] M. Feng, N. T. Heffernan, M. Mani, and C. Heffernan. Using mixed-effects modeling to
compare different grain-sized skill models. In J. Beck, E. Aimeur, and T. Barnes, editors,
Educational Data Mining: Papers from the AAAI Workshop, pages 55–66. Menlo Park, CA:
AAAI Press., 2006.
[11] F. S. Foundation. GNU general public license - GNU Project - Free Software Foundation
(FSF) [online]. Available from: http://www.gnu.org/copyleft/gpl.html [cited 24
April 2007].
[12] F. Geller, C. Richardson, and P. Rontea. Building intelligent tutoring systems [online]. Available from: http://www.wpi.edu/˜fgeller/mqp/ [cited 24 April 2007].
89
REFERENCES
Building Intelligent Tutoring Systems
[13] D. H. Hansson. Module: Activerecord::xmlserialization [online]. Available from:
http://api.rubyonrails.org/classes/ActiveRecord/XmlSerialization.html#M000910
[cited 24 April 2007].
[14] D. H. Hansson. Ruby on rails [online]. Available from: http://www.rubyonrails.org
[cited 24 April 2007].
[15] N. T. Heffernan. Assistments [online]. Available from: http://www.assistment.org/
[cited 24 April 2007].
[16] N. T. Heffernan, T. E. Turner, A. L. N. Lourenco, M. A. Macasek, G. Nuzzo-Jones, and K. R.
Koedinger. The assistment builder: Towards an analysis of cost effectiveness of its creation.
In FLAIRS Conference, pages 515–520, 2006.
[17] T. Instruments. Analog technologies; semiconductors, digital signal processing [online].
Available from: http://www.ti.com/ [cited 24 April 2007].
[18] S. Island. Study island [online]. Available from: http://www.studyisland.com/ [cited 24
April 2007].
[19] S. Island. Study island: “solid research equals solid results [online]. Available from:
http://www.studyisland.com/salessheets/2005NorthCarolinaResearch.pdf
[cited 24 April 2007].
[20] P. Jipsen.
Asciimath calculator demo [online].
Available
http://www1.chapman.edu/˜jipsen/mathml/asciimathcalculator.html
24 April 2007].
from:
[cited
[21] A. Kleiner and E. Farris. Internet access in u.s. public scools and classrooms: 1994-2001.
2002.
[22] K. Koedinger and J. Anderson. Pump algebra project: Ai and high school math [online].
Available from: http://act.psy.cmu.edu/awpt/awpt-home.html [cited 24 April 2007].
[23] K. R. Koedinger and J. R. Anderson. Intelligent tutoring goes to school in the big city.
International Journal of Artificial Intelligence in Education, 8:30–43, 1997. Available from:
http://www.carnegielearning.com/web_docs/Intelligent_tutoring.pdf.
[24] LaszloSystems.
Appendix b. ecmascript [online].
Available from:
http://www.openlaszlo.org/lps/docs/guide/ecmascript-and-lzx.html#ecmascript.object-ta
[cited 24 April 2007].
[25] D.
Lippman.
Asciimathteximg.js
[online].
Available
http://www.pierce.ctc.edu/dlippman/asciimathtex/ASCIIMathTeXImg.js
24 April 2007].
90
from:
[cited
REFERENCES
Building Intelligent Tutoring Systems
[26] Macromedia. Externalinterface (flash.external.externalinterface) [online]. Available from:
http://www.adobe.com/livedocs/flash/8/main/wwhelp/wwhimpl/common/html/wwhelp.htm?cont
[cited 24 April 2007].
[27] Mozilla.
Firefox - rediscover the web [online].
http://www.mozilla.com/en-US/firefox/ [cited 24 April 2007].
Available
[28] OctaGate.
Octagate
sitetimer
[online].
Available
http://www.octagate.com/service/SiteTimer/ [cited 24 April 2007].
from:
from:
[29] M. D. of Education. Massachusetts comprehensive assissment system [online]. Available
from: http://www.doe.mass.edu/mcas/ [cited 24 April 2007].
[30] J. Patvarczki, N. T. Heffernan, and K. Rasmussen. Scaling up the server-based web tutor: A
description of system’s scalability and reliability efforts. 2007.
[31] L. Razzaq, M. Feng, G. Nuzzo-Jones, N. T. Heffernan, K. R. Koedinger, B. Junker, S. Ritter,
A. Knight, C. Aniszczyk, S. Choksey, T. Livak, E. Mercado, T. E. Turner, R. Upalekar,
J. A. Walonoski, M. A. Macasek, and K. P. Rasmussen. The assistment project: Blending
assessment and assisting. In C. K. Looi, G. McCalla, B. Bredeweg, and J. Breuker, editors,
Proceedings of the 12th International Conference on Artificial Intelligence In Education,
pages 555–562. Amsterdam: IOS Press, 2005.
[32] L. M. Razzaq and N. T. Heffernan. Scaffolding vs. hints in the assistment system. In
M. Ikeda, K. D. Ashley, and T.-W. Chan, editors, Intelligent Tutoring Systems, 8th International Conference, ITS 2006, Jhongli, Taiwan, June 26-30, 2006, Proceedings, volume
4053 of Lecture Notes in Computer Science, pages 635–644. Springer, 2006. Available from:
http://dx.doi.org/10.1007/11774303_63.
[33] V. J. Shute. A comparison of learning environments. In Computers and Cognitive Tools,
Hillsdale, New Jersey, USA, 1993. Lawrence Eribaum Associates.
[34] D. Thomas. RDoc [online]. Available from: http://rdoc.sourceforge.net/ [cited 24
April 2007].
[35] T. E. Turner, M. A. Macasek, G. Nuzzo-Jones, and N. T. Heffernan. The assistment builder:
A rapid development tool for its. In Proceedings of 12th Artificial Intelligence In Education,
pages 929–931. Amsterdam: ISO Press, 2005.
[36] K. VanLehn, C. Lynch, K. Schulze, J. A. Shapiro, R. Shelby, L. Taylor, D. Treacy, A. Weinstein, and M. Wintersgill. The andes physics tutoring system: Lessons learned. International Journal of Artificial Intelligence in Education, 15(3):147–204, 2005. Available from:
http://aied.inf.ed.ac.uk/abstract/Vol_15/VanLehn05.html.
[37] W3C. Mathematical markup language (mathml) 1.01 specification [online]. Available from:
http://www.w3.org/1999/07/REC-MathML-19990707/ [cited 24 April 2007].
91
REFERENCES
Building Intelligent Tutoring Systems
[38] J. A. Walonoski and N. T. Heffernan. Detection and analysis of off-task gaming behavior
in intelligent tutoring systems. In M. Ikeda, K. D. Ashley, and T.-W. Chan, editors, Intelligent Tutoring Systems, 8th International Conference, ITS 2006, Jhongli, Taiwan, June 26-30,
2006, Proceedings, volume 4053 of Lecture Notes in Computer Science, pages 382–391.
Springer, 2006. Available from: http://dx.doi.org/10.1007/11774303_38.
92
8 APPENDIX: GRAPHER USER MANUAL
Building Intelligent Tutoring Systems
8 APPENDIX: Grapher User Manual
Getting Started with The ASSISTments Grapher
Welcome to ASSISTments Grapher
This web application can be used by teachers and students for creating and solving math related
problems. The purpose of this manual is to help you quickly get started using The ASSISTments
Grapher and become comfortable with its interface and features. Presented in Figure 33 is the
ASSISTments Grapher application.
Figure 33: Screen-shot of the ASSISTments Grapher
In the left side of Figure 33, we can see the canvas of the ASSISTments Grapher on which
graphs received from the user through the interface, shown on the right side of the canvas, will
be plotted. The following sections will give you an overview on how to master the interactions
between the interface and the canvas.
Requirements
To use the ASSISTments Grapher you will need a computer with an Internet connection, and
an Internet Browser that supports SWF files, also known as Flash objects. Most browsers, like
Mozilla Firefox, Internet Explorer Opera and Safari, already have the Flash Player plug-in installed; however, default settings of the above browsers might have the Shockwave Flash Object
93
8 APPENDIX: GRAPHER USER MANUAL
Building Intelligent Tutoring Systems
plug-in disabled. Of course, you cannot use this application in a text browser like Lynx that doesn’t
support graphics.
System Requirements:
• Modem or Internet Connection
• Super VGA(800x600) or higher resolution monitor with 256 colors
• 16 MB of RAM
In the following pages, we will provide the steps required to ensure that the Shockwave Flash
Object plug-in is enabled. Please skip them if you already know that the plug-in is enabled for the
browser you are using.
To ensure that Shockwave is enabled in Internet Explorer, open Internet Explorer then go to
Tools, Manage Add-ons.... This will bring up the Manage Add-ons dialog box as presented in
Figure ??.
Figure 34: Enabling Shockwave in IE 6
If necessary scroll down until you see the Shockwave Flash Object entry. After you select it,
the Settings section at the bottom of the dialog box becomes active. In there, make sure that the
Enable radio button is checked. If you don’t see the Shockwave Flash Object entry in the Manage
Add-ons dialog box you need to install the Adobe’s Flash Player for your specific platform. The
player can be found at www.adobe.com
If you are having problems viewing Flash objects from websites you visit with browsers like
Mozilla Firefox, Opera or Safari please download the Adobe’s Flash Player from Adobe’s website.
In order for you to use the ASSISTments Grapher your browser must be able to display Flash
Objects.
94
8 APPENDIX: GRAPHER USER MANUAL
Building Intelligent Tutoring Systems
Figure 35: Insert an Equation
Drawing Your First Graph
Now that you have ensured you have everything you need, let’s draw our first graph using the
ASSISTments Grapher. Once you’ve created an account on the ASSISTments website go to the
grapher page shown in Figure 33. To draw a graph, simply type in a formula in the Expression box
like Figure 35 shows.
Figure 36: Displaying Your First Graph
Once you are done just press the Graph button indicated in Figure 36 by the red arrow.
Figure 36 shows the result displayed on the canvas after the Graph button was pressed. For a
more detailed explanation of what type of formulas you could insert in the Expression box please
see Section 2.2.
95
8 APPENDIX: GRAPHER USER MANUAL
Building Intelligent Tutoring Systems
The ASSISTments Grapher Interface
This section will help you get comfortable with the interface that the ASSISTments Grapher provides. The ASSISTments Grapher Interface is responsible for gathering information from the user
and sending it to the Flash object or the canvas. This communication provides the application with
the data required for the canvas to get populated. The interface is shown in Figure 37.
Figure 37: ASSISTments Grapher Interface
In the following subsections, we will introduce all of the insert boxes that the ASSISTments
Grapher Interface, shown in Figure 37, provides in an effort to help you understand their purpose
and therefore your input.
Graph Name Insert Box
The Graph Name Insert Box allows you to insert a unique name for each of your graph. The name
is used by the other side of the application, the canvas, to refer to one particular graph of your
choice. There is no restriction on the type of characters your graph name can have. This is shown
in Figure 38.
Figure 38: Graph Name Insert Box
As we can see in Figure 38, after you insert a name in the Graph Name box you could then select
it from inside the Flash object. The Graph Name box permits you to insert multiple graphs from
the Grapher Interface and then allows you to control them separately on the Canvas. For example,
let’s insert multiple graphs on the same canvas. Figure 39 shows the results after inserting three
more graphs.
96
8 APPENDIX: GRAPHER USER MANUAL
Building Intelligent Tutoring Systems
Figure 39: Multiple Graphs on the Same Canvas
Once the canvas gets populated, you could control a particular graph by referencing its name.
A complete description showing the ways in which you could control a particular graph is shown
in section 3, The ASSISTments Grapher Toolbox. As Figure 37 shows our next box in the ASSISTments Grapher Interface is the Expression Insert Box.
Expression Insert Box
The Expression Insert Box from the ASSISTments Grapher interface allows you to specify the
equation of the graph to be drawn on the canvas. Figure 40 shows the graph for the equation
f (x) = 2x + 2. The ASSISTments Grapher also allows you to insert first, second and third degree
equations in the Expression box as well as logarithmic and exponential functions. We show an
example of this procedure in Figure 41.
97
8 APPENDIX: GRAPHER USER MANUAL
Building Intelligent Tutoring Systems
Figure 40: Graph of First Degree Equation
Figure 41: First, Second and Third Degree
Equations
From X to X Insert Boxes
The next two insert boxes of the ASSISTments Grapher Interface have to be used together. For
example, let’s say you would like to draw a line segment from point(-3,2) to (3,2). For this, we
need to set up our Expression box with a first degree equation to be able to draw a line. Since we
want our line to intersect the y axis at the point (0,2) and we do not want it to intersect the X axis,
our equation will be f(x) = 2. Let’s first draw this equation so we can see its result. Figure 42
illustrates this process.
Figure 42: Preparing a Line Segment
Now that we have our line let’s convert it into a line segment. To do this, we need to first clear
our canvas by using the Clear button then we will insert 2 in the Expression box; the x value of
the first point, -3, in the From X box and 3, the x value of our second point in the To X box. Once
you’ve inserted all the values press the Graph Button to draw the segment on the canvas. The result
is shown in Figure 43.
98
8 APPENDIX: GRAPHER USER MANUAL
Building Intelligent Tutoring Systems
Figure 43: Drawing a Line Segment
Color Drop Down Menu
The Color Drop Down menu, as you expected, let’s you choose the color in which your graph will
get drawn on the canvas. After you have selected a color for your graph, click the Graph button to
have the graph displayed in the selected color.
Figure 44: Graphing with Colors
Figure 44 shows us all the eight colors that are available from the Drop Down Menu. These are
black, red, blue, green, yellow, purple, teal and maroon. Note that you cannot select a color for a
graph that is already displayed on the canvas.
99
Building Intelligent Tutoring Systems
8 APPENDIX: GRAPHER USER MANUAL
Line Width Drop Down Menu
The Line Width Drop Down Menu allows you to select the stroke size for your graph. Figure 45
shows various graphs in all the available sizes that the Line Width Drop Down Menu provides.
From Figure 45, we can see the different stroke sizes with the red arrow pointing at a size 10
stroke. The rest of the displayed graphs from Figure 45 decrement their stroke size by 1 unit;
therefore the last graph has a stroke of size 1.
Figure 45: Different Stroke Sizes
Erasable Check Box
The Erasable Check box from the ASSISTments Grapher Interface allows you to maintain a graph
on the canvas even if the Clear button is pressed. A demonstration of this check box is presented
in Figure 46.
One way to use this feature is in case you would like to draw multiple graphs on the canvas
without having to restart from the beginning in case you drew a graph incorrectly.
100
Building Intelligent Tutoring Systems
8 APPENDIX: GRAPHER USER MANUAL
Figure 46: Using the Erasable Check Box
ASSISTments Grapher Toolbox
Displaying The Toolbox
There are two ways in which you could display the ASSISTments Grapher Toolbox. One way is to
simply check the Toolbox check-box from the upper left corner of the canvas which is by default
set to unchecked. This process is shown in Figure 47.
Figure 47: Displaying Toolbox
The second way to display the Toolbox is by simply clicking anywhere on the canvas. This
will position the Toolbox at its last used position. This process will be demonstrated in the next
section where you will learn how to move the Toolbox window anywhere on the canvas.
101
Building Intelligent Tutoring Systems
8 APPENDIX: GRAPHER USER MANUAL
Moving The Toolbox
To move the ASSISTments Grapher Toolbox to a different location on the canvas, you can use
the traditional click and drag method. To be able to use this method you must ensure that you are
”grabbing” the Toolbox from its title bar as shown in Figure 48.
Figure 48: Displaying Toolbox from The Check Box
Please note that you will only be able to position the Toolbox inside the the canvas. If you try
to move it outside of the canvas, only the part that is on the canvas will be displayed. This is shown
in Figure 49.
Once you have decided on a position for the Toolbox, you can safely close it and then redisplay
it on the same position by using the second method of displaying the Toolbox: clicking anywhere
on the canvas.
Figure 49: Toolbox Can Only Be Displayed On The Canvas
102
Building Intelligent Tutoring Systems
8 APPENDIX: GRAPHER USER MANUAL
Figure 50: How to Resize the Toolbox
Resizing The Toolbox
To resize the ASSISTments Grapher Toolbox, you need to position the mouse pointer in the lower
right corner of the Toolbox as shown in Figure 50.
The window can be resized to show only a certain section of your interest. Once you have
chosen a size for the Toolbox, the size will remain the same until you press the refresh button of
your browser. We can see a resized Toolbox in Figure 51
Figure 51: Resizing the Toolbox
103
Building Intelligent Tutoring Systems
8 APPENDIX: GRAPHER USER MANUAL
Coordinates Tab
The Coordinates Tab of the Toolbox shows the coordinates of a point on the canvas when the left
mouse button is clicked. Figure 52 shows a demonstration of this process.
Figure 52: Display a Coordinate
If you would like to see the coordinates of a different point just click the canvas at that point.
Also do not forget to move the toolbox if the point you want to reach is under the toolbox. Figure
53 shows this process.
Figure 53: Display a Different Coordinate
104
Building Intelligent Tutoring Systems
8 APPENDIX: GRAPHER USER MANUAL
Find Point Tab
The Find Point tab of the ASSISTments Grapher is the second tab after the Coordinates tab. To
expand the Find Point tab just click on the tab as shown in Figure 54.
Figure 54: Find Point Tab
Figure 55: Find Point Tab Widgets
After you’ve expanded the Find Point tab, you will be able to see the contents of this tab. In
here you will find two insert boxes and two buttons as shown in Figure 55. Let’s use this tab to
105
Building Intelligent Tutoring Systems
8 APPENDIX: GRAPHER USER MANUAL
find the point with x=0 and y=0 on a parabola. Try to follow the steps provided in Figure ??
You can use the Hide button under the Show button to hide the point from the canvas. When
following the steps of Figure 48 do not forget to move the Toolbox window away from the point so
that you can be able to see it. Also, Figure ?? shows the graph displayed in Green to better make
the distinction between the axes and the graph; feel free to change the graph color with any of the
eight colors provided by the Color drop down menu. Note, that the point you choose to display
does not have to be on the graph; you could draw a point anywhere on the canvas.
Figure 56: Finding a Point on a Graph
Trace Graph Tab
The Trace Graph tab of the ASSISTments Grapher allows you trace along a particular graph. To
expand the Trace Graph tab, check the Toolbox option, and then click on the Graph Tab to expand
the tab. The Trace Graph tab is presented in Figure 57.
106
Building Intelligent Tutoring Systems
8 APPENDIX: GRAPHER USER MANUAL
Figure 57: Trace a Graph
The Trace Graph tab takes some of its input from the ASSISTments Grapher Interface described in chapter 2. Figure 58 shows how to prepare your canvas to follow our tracing example.
Figure 58: Prepare for Tracing
Once you have the canvas set up as shown in Figure 58, try to follow the steps of Figure 59 and
Figure 60 in which, we will guide you through the steps of using the tracing feature.
107
Building Intelligent Tutoring Systems
8 APPENDIX: GRAPHER USER MANUAL
Figure 59: Tracing Steps 1-4
As seen in Figure 59 you can add multiple graphs to the canvas at any time from the Grapher’s
Interface. The name of the graph will appear in the drop down menu as illustrated in Figure 59.
Figure 60: Tracing Steps 5-6
We can see in Figure 60 that the tracing point moves on the selected graph, displaying the
coordinates of its current location as it moves from one position to the next. In the increments drop
down menu you can select the tracing interval of the tracing point to 5, 10 or 15 pixels.
108
Building Intelligent Tutoring Systems
8 APPENDIX: GRAPHER USER MANUAL
Figure 62: Zoom Into A Location of the
Canvas
Figure 61: The Range Tab
Range Tab
Under the Tracing tab we have the Range tab which is displayed in Figure 61.
The Range tab allows you to zoom into a particular portion of your graph. We demonstrate this
process in Figure 62. As we can see from Figure 62 the graph of Figure 61 gets drawn in its new
coordinates. To return to the default coordinates just press the Default Ranges button next to Set
New Ranges button.
Clear Canvas Tab
The Clear Canvas tab allows you to clear the canvas from inside the Toolbox window. To display
the Clear Canvas tab just click on the Clear Canvas bar to expand it as shown in Figure 63. To
clear the canvas of the parabola graph just press the Clear Canvas button as shown in Figure 64.
As we can see from Figure 64, as soon as you press the Clear Canvas button the parabola graph
disappears from the graph and the canvas gets cleared. Note, that the canvas will not get cleared if
the Erasable option of the ASSISTments Interface is unchecked.
109
Building Intelligent Tutoring Systems
8 APPENDIX: GRAPHER USER MANUAL
Figure 63: The Clear Canvas Tab
Figure 64: Clear a Graph
Trigonometry
Trigonometry can be a difficult topic to master without a graphing tool which can allow you to plot
the functions so that you can better visualize the main differences between them.
Figure 65: Trigonometric Warm Up
The ASSISTments Grapher can be such a tool. It will allow you to display multiple trigonometric functions on the same canvas so that you can easily see the differences between them. The
ASSISTments Grapher can be used to achieve this goal and more. It will let you explore these
functions by allowing you to enter different values to be evaluated; you don’t have to limit yourself
110
Building Intelligent Tutoring Systems
8 APPENDIX: GRAPHER USER MANUAL
to ”x”. Moreover, you can use any of the Toolbox features presented in Chapter 3 on any trigonometric functions presented here. This section will show you what type of trigonometric functions
you can use with the ASSISTments Grapher. As a quick trigonometric warm up, see if you can
recognize any of the curves from Figure 65.
Figure 66: Drawing a Sine Curve
The curve drawn in green shows a cosine curve, the sine curve is displayed in yellow and the
tangent curve is displayed in blue. To draw a sine curve just enter ”sin(x)”, without the quotes in
the Expression box of the ASSISTments Interface. Figure 66 shows this process. As Figure 67
shows, the ASSISTments Grapher also recognizes such constants as ”pi”.
Figure 67: Exploring the Sine Curve
You can also use the ASSISTments Grapher to draw a cosine, tangent, secant, Co-secant and a
cotangent curve by typing in cos(x), tan(x), sec(x), csc(x) and cot(x) respectively. We will
let you explore the rest of the trigonometric functions on your own.
111
Building Intelligent Tutoring Systems
8 APPENDIX: GRAPHER USER MANUAL
What The ASSISTments Grapher Can Not Do
No tool is perfect, and there are several important limitations of this one that a user should be aware
of before utilizing it. One limitation of the ASSISTments Grapher is that, due to the way coordinates are calculated, it cannot accept an expression to draw a vertical line. The implementation is
designed to only handle one point per x value, or per column of pixels. Truly vertical lines violate
this rule. However, as Figure 68 shows, you can achieve a nearly vertical line along the y-axis by
modifying the slope of a line.
Also, this Grapher cannot handle a function with multiple variables. Expressions can only have
one variable, and it must be x.
Another limitation of this graphing tool concerns the graph’s extents. When setting the minimum and maximum x and y values, the Grapher will not accept values less than -99 or greater
than 999. Users may wish to use caution when setting the extents to extreme values, however. The
grid and the tic marks and numbering on the axes are acurate, but always label all odd whole numbers. When the extents become too broad, these labels and lines will blend together and become
unreadable.
One additional thing to note is that when drawing expressions such as tan(x), the grapher
will frequently display the curve’s vertical asymptotes. While this may not be ideal, many professional graphing tools also have this trait, and attempts to eliminate the asymptotes from graher’s
display resulted in other, more serious inaccuracies. In addition, removing asymptotes from the
grapher entirely is also not an ideal solution, because in the case of an ASSISTment question about
asymptotes, one may wish to view a graph displaying them.
Figure 68: Drawing a Vertical Line
112