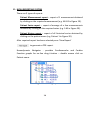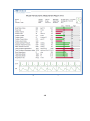
1
USER MANUAL USER MANUAL FOR FOR (2011) MODEL NEW NI MEDICAL NEW NI MEDICAL (2011) LTD’s MODEL NICaS TM CS With Software version 3.58 With Software versionMEASURING 3.58 BIOIMPEDANCE CARDIAC and ANALYZING SYSTEM BIOIMPEDANCE CARDIAC MEASURING and SYSTEM Caution: Federal LawANALYZING restricts this device for sale, distribution and use by or on the order of a physician. Caution: Federal Law restricts this device for sale, distribution and use by or on the order of a physician. 0473 0473 Catalogue No. 1 NI5.0001.01 Catalogue No. NI5.0001.01 TABLE OF CONTENTS 1. INTRODUCTION ………………………………………………………………….. 4 2. SAFEGUARDS & STANDARD CLASSIFICATION ……………………… 6 2.1 CLASSIFICATION ………………………………………………………….. 6 2.2 SIGNS ………………………………………………………………………….. 6 2.3 CAUTION …………………………………………………………………….. 6 2.4 WARNING…………………………………………………………………….. 7 3. TECHNICAL SPECIFICATIONS …………………………………………………. 8 4. TAKING CARE OF YOUR SYSTEM ……………………………………………. 9 4.1 ROUTINE CARE ……………………………………………………………. 9 4.2 MAINTENANCE ……………………………………………………………. 9 4.3 CLEANING ……………………………………………………………………. 9 4.4 ORDERING INFORMATION …………………………………………… 9 5. COMPONENTS ……………………………………………………………………….. 10 6. UNIT SETUP ……………………………………………………………………………. 11 7. PATIENT HOOKUP ………………………………………………………………….. 12 7.1 CONNECTING THE ICG SENSORS ………………………………….. 12 7.2 CONNECTING THE ECG SEMSORS ………………………………… 13 8. GETTING STARTED …………………………………………………………………. 15 8.1 TYPICAL OPERATING SEQUENCE NICaS ………………………… 15 8.2 FUNCTIONALITIES DURING MONITORING ……………………. 17 8.3 TABLE OF PARAMETERS …………………………………………….… 18 8.4 GGI – Granov Goor Index …………………………………………….. 19 9. FUNCTIONAL DESCRIPTION ……………………………………………………. 20 10. COMPARATIVE SCREEN ………………………………………………………….. 36 2 1. IN 11. NICaS REPORTING SYSTEM …………………………………………………….. 38 11.1 PATIENT SINGLE MEASUREMENT REPORT …………………… 39 11.2 PATIENT STATUS REPORT ……………………………………………. 41 11.3 PATIENT HISTORY REPORTS ………………………………………… 43 11.4 NICaS HEMODYNAMIC NAVIGATOR REPORT ………………. 45 11.5 REPORT OPTIONS ………………………………………………………… 47 12. ALARMS ……………………………………………………………….………………… 48 13. INTENDED PATIENT POPULATION ………………………………………….. 50 14. TROUBLESHOOTING ………………………………………………………………. 51 15. SERVICE …………………………………………………………………………………. 52 16. ORDERING INFORMATION …………………………………………………….. 53 APPENDIX A: KIMITED ONE-YEAR WARRANTY ………………………………. 54 The N focus respir by a m param given param heart histor The transf variou and it contr Imped place contr ICG, o This t The f than arteri condu meas and th The s on th 3 2. SAFEGUARDS & STANDARD CLASSIFICATION 1. INTRODUCTION NICaS (Non-Invasive Cardiac System) is a bioimpedance system 2.1.The CLASSIFICATION focusing on noninvasive assessment and monitoring of cardiovascular, 2.1.1. Equipment Classification according to IEC 601-1 respiratory, and fluid parameters. The system provides real-time data on various parameters of a patient's cardiac vascular functions. The data from CLASS II EQUIPMENT according to the type any given ofreading session is displayed on the screen according to the protection against electrical shock; different parameters, patient reports can be issued and saved, trends in the EQUIPMENT notcan suitable for useand in the patient's heart condition be viewed monitored, and the system presence of a FLAMMABLE ANAESTHETIC also provides historical data and comparative reports. MIXTURE, with air or with oxygen or with The NICaSnitrous device replaces the CD drive in any laptop computer, oxide; transforming it into a medical instrument for non-invasive measuring of CONTINUOUS according toinclude the the cardiac output various cardiac functions.OPERATION These measurements mode of operation. and its derivatives, as well as an assessment of the left ventricular cardiac contractility. The NICaS is also unique in that is the only method of 2.1.2. Equipment Classification According to EUit Medical Device Impedance Cardiography (ICG) which utilizes dual impedance electrodes, Directive DEGREE OF PROTECTION against electric shock is placed on two limbs, preferably one on the wrist and the other on the type BF. ankle. This type of electrical surveillance is called Regional contra-lateral or RIC. 2.2.ICG, SIGNS This technology is based on two independent principles: Class II double isolated device The first is the fact that the electrical conductance of the blood is higher than that of the surrounding tissue structures. Consequently, with each sign (pulsation), an increase in the electrical arterial General systolicwarning expansion conductance (or reduction in the electrical resistance) of the body is measured. This(body-protected change in systolic resistance (impedance) is marked ΔR, BF-type floating) symbol and the baseline body resistance is R (measured in ohms Ω). 2.3. CAUTION: NOT FOR INTRACARDIAC USE. The instrument does not The second principle, which is called the Granov Goor Index is(GGI), utilize a protective (earth) ground. The instrument not is based on the systolic time intervals (STI) which, similarly to Left Ventricle Ejection protected against ingress of liquid or against explosive hazards. DEGREE OF MOBILITY: Portable. 4 Fraction (LVEF), can assess cardiac function i.e., as indicated by LVEF measurement, the lower the GGI the graver the condition). REPORTING SYSTEM …………………………………………………….. 38 The NICaS 11. is a NICaS tetrapolar apparatus which operates by an alternating current of 1.4 mA11.1 and 32PATIENT kHZ. TheSINGLE analogMEASUREMENT resistance signals are received by REPORT …………………… 39 the device, where they are amplified andREPORT filtered.……………………………………………. These signals are then 11.2 PATIENT STATUS 41 transmitted to a 11.3 microprocessor, where they are digitized and analyzed via PATIENT HISTORY REPORTS ………………………………………… 43 mathematical algorithms. 11.4 NICaS HEMODYNAMIC NAVIGATOR REPORT ………………. 45 ECG resistance and respiratory waveforms as well as numerical patterns are 11.5 REPORT OPTIONS ………………………………………………………… 47 displayed on12. theALARMS screen ……………………………………………………………….………………… 48 The collected can be easily printed or viewed………………………………………….. through several easy to 13.data INTENDED PATIENT POPULATION 50 define reports. 14. TROUBLESHOOTING ………………………………………………………………. 51 15. SERVICE …………………………………………………………………………………. 52 16. ORDERING INFORMATION …………………………………………………….. 53 APPENDIX A: KIMITED ONE-YEAR WARRANTY ………………………………. 54 5 2. SAFEGUARDS & STANDARD CLASSIFICATION 2.1. CLASSIFICATION 2.1.1. Equipment Classification according to IEC 601-1 CLASS II EQUIPMENT according to the type of protection against electrical shock; EQUIPMENT not suitable for use in the presence of a FLAMMABLE ANAESTHETIC MIXTURE, with air or with oxygen or with nitrous oxide; CONTINUOUS OPERATION according to the mode of operation. 2.1.2. Equipment Classification According to EU Medical Device Directive DEGREE OF PROTECTION against electric shock is type BF. 2.2. SIGNS Class II double isolated device General warning sign BF-type (body-protected floating) symbol 2.3. CAUTION NOT FOR INTRACARDIAC USE. The instrument does not utilize a protective (earth) ground. 6 The instrument is not protected INPUT PROTECTION: The device is not protected against defibrillation. Therefore, before the patient undergoes defibrillation, all five electrodes (3 ECG and 2 dual impedance) must be disconnected from the patient. This can be achieved by pulling the two main cable plugs from the NICaS box. 2.4. WARNINGS DO NOT USE ANY ELECTRODE PASTE, WHICH WILL REDUCE ELECTRICAL CONDUCTION. DO NOT REMOVE COVERS OR PANELS. REFER TO QUALIFIED SERVICE PERSONNEL. NO MODIFICATION OF THIS EQUIPMENT IS ALLOWED 3. NICa Weig Pow Tem Meth Lead Wav Swee Impe ΔR R ΔR Si Accu Samp Injec 7 5. COMPONENTS 3. TECHNICAL SPECIFICATIONS The package includes the following components (See Figure 1): NICaS Dimensions: Weight: 5.1 One NICaS CS device Power: Temperature: (L)12.8 x (W)13.1 x (H)1.3 cm (5.0 x 5.2 x 0.5 inch) 150 gm (5 oz) USB: 5v/15]0mA DC 10C,50F to 32C to 90F for operation and sensor transport and storage 5.2 One laptop computer is required for system: ICG regional impedance 1 lead (I, V+, V-, 5.3 ICG Cable I_GND) Waveform single channel Sweep speed 25 mm/s Impedance range: 200-500 Ω ΔR Range to 1Ω 5.4 ECG Cable ΔR Signal Bandwidth 0.3Hz to 12 Hz Accuracy ±5% Sample Rate 200 Hz Injection Current 1.35 +/- 0.1mA RMS 5.5 NICaS CS USB cable at 32.5 +/-0.5kHz (purchase from NI Medical is optional) Method: Lead mode: Lead mode Waveform: ECG 3 lead (RA,LA,LL) single channel Gain Sweep speed Heart Rate range HR Accuracy x1,x2,x4 25mm/s 30-240bpm ±1bpm 5.6 NICaS CS Sensor Kit, pack of 20 applications (may be sold separately) Figure 1: NICaS Components Note: Please inspect the device to verify that no parts are missing, and that no 8 4. TAKING CARE OF YOUR SYSTEM 4.1 ROUTINE CARE The following rules should be applied in everyday work to allow the NICaS CS extended durability: Keep the NICaS CS dry. Do not expose the NICaS CS to extreme temperatures. Keep the NICaS CS away from dust and any kind of dirt (pay particular attention to the electrode connectors). 4.2 MAINTENANCE All repairs are to be performed only by New NI Medical (2011) Ltd. service personnel or, alternatively, by authorized distributor personnel. 4.3 CLEANING ECG and BIP cables and lead wires must be cleaned with soap and water before each application to a new patient. 4.4 ORDERING INFORMATION See Section 16. 9 7. PATIENT HOOKUP Five sensors connect to the patient: two (2) are paired ICG sensors and 5. COMPONENTS three (3) are ECG sensors. The package includes the following components (See Figure 1): 7.1. CONNECTING THE ICG SENSORS One NICaS device ICD Cable5.1 is connected byCS a blue plug to the ICG slot of the NICaS. The ICG Cable is split into two branches labeled 1 (Red) and 2 (Blue), each have 1 double connector and one single connector. Connect the sensors the patient as followsfor (see Figure 3): 5.2 ICG One laptoptocomputer is required 1 (Red) branch: system: (purchase Medical is optional) Single connector – left from wristNIproximal; Double connector – left wrist distal; 5.3 ICG Cable 2 (Blue) branch: Single connector – right ankle proximal; Double connector – right ankle distal; 5.4 ECG Cable 5.5 NICaS CS USB cable 5.6 NICaS CS Sensor Kit, pack of 20 applications (may be sold separately) Figure 1: NICaS Components Note: Figure 3: ICG Sensors locations and connection to ICG Cable Please inspect the device to verify that no parts are missing, and that no visible damage has occurred during shipment. 10 visible damage has occurred during shipment. 6. UNIT SETUP According to IEC 601-1-1, if the computer (or any other attached device) is connected to an external power source (the power supply should be listed to UL 60950) it must be kept at least 1.5m (60 inches) away from the patient. When the laptop, connected to the NICaS , is operated on a battery, no distance limitations exist. The lifespan of a fully charged battery is approximately one hour. 6.1 CONNECTING TO A POWER OUTLET Connect the power cord to the NICaS CS back panel and to a laptop USB slot. The AC power connects to a power supply that supplies DC power to the computer, and simultaneously recharges its battery. 6.2 CONNECTING THE LEAD WIRES TO THE CONNECTORS PANEL Connect the lead wire plugs as shown below in Figure 2. Plug ECG connector into designated slot (No. 2 in Fig. 2). Plug Impedance Cardiography (ICG) connector into designated slot (No.1 in Fig. 2). Connect power/data cable to the laptop USB port (No. 3 in Fig. 2). 1.ICG connector 3.USB connector 2.ECG connector Figure 2: NICas Device Connectors 11 7. Make sure the area where sensors are to be placed on patient’s PATIENT HOOKUP arm and leg is clean, free of perfumes/colognes and lotions and Five sensors to the patient: two (2) are paired ICG sensors and the skin is connect not damaged. three (3) are ECG sensors. Patient’s limbs should not be cold, and pulse should be palpated. Patient’s limbs should be placed so that electrodes do not touch 7.1. CONNECTING THE ICG SENSORS each other. ICD Cable connected a blue plug of to patient’s the ICG slot of the NICaS. The There shouldisbe no metal by in the vicinity limbs. Place a new set of disposable electrodes onto patient’s skin2 (Blue), each ICG Cable is split into two branches labeled 1 (Red) and before measurement. have each 1 double connector and one single connector. To prevent the sensors from drying out, do not open until Connect the ICG sensors immediately before use. to the patient as follows (see Figure 3): 1 (Red) branch: Caution:Single Do not use sensors after specified shelf life has expired. connector – left wrist proximal; Double connector – left wrist distal; 2 (Blue) branch: Single connector – right ankle proximal; Double connector – right ankle distal; Figure 3: ICG Sensors locations and connection to ICG Cable 12 7.2. CONNECTING THE ECG SENSORS Place the ECG sensors onto the patient as described in Figure 4. The White ECG lead wire is attached to the Right Arm. The Black ECG lead wire is attached to the Left Arm. The Red ECG lead wire (ground) is attached to the patient's lower abdomen or leg. White ECG Clip Black ECG Clip RED ECG Clip Figure 4: Connecting the ECG sensors NICaS CS is optimized for the wrist-ankle (WA) connection which allows to estimate the SV based on both upper and lower peripheral flow. In case that pulse can be palpated the signal is strong enough for the NICaS to correctly estimate the SV. Note: Do not place the connector on a limb with the following abnormalities, and choose a different limb: • Peripheral Arterial Disease (PAD) • Significant Edema • Damaged skin Note: Do not use any sensor paste, as this will reduce the electrical conduction. 13 s Make sure the area where sensors are to be placed on patient’s begin. arm and leg is clean, free of perfumes/colognes and lotions and c. Press Start’ button . The the skin isthe not ‘Measurement damaged. following window Patient’s limbs shouldwill notopen: be cold, and pulse should be palpated. Patient’s limbs should be placed so that electrodes do not touch each other. There should be no metal in the vicinity of patient’s limbs. Place a new set of disposable electrodes onto patient’s skin before each measurement. To prevent the sensors from drying out, do not open until Figure 5: Patient Reminder immediately before use. Select ‘Enter Patient' the window with allexpired. the Caution: Do not useNew sensors afterand specified shelf life has details required for the patient will open. 8.1.3.2. To start the measurement of an existing patient select one of the following 2 options: a. Press 'Patient Button' and select ‘Find’. b. Press ‘Measurement Start' button . The 'Patient Reminder' window opens (see above): i. If the name in the field following 'current patient' is correct - select ‘Continue’. ii. If the name in the field following 'current patient is' incorrect or blank - select ‘Find Existing Patient’. A ‘Patient List’ window will open, in which you can seek the relevant patient (see a more detailed explanation in the Functional Description below). 14 8. GETTING STARTED 8.1. TYPICAL OPERATING SEQUENCE NICAS The following paragraphs describe a typical operating sequence with the NICaS CS monitor 8.1.1. Power Up NICaS CS Ensure the laptop is on and running and that the NICaS CS is connected to its USB connector. Double-click the NICaS icon. The start-up process might take a few minutes to complete. 8.1.2. Connecting Lead Wires to a Patient See explanation in section of Patient Hookup. 8.1.3. Measurement Start-Up To start the monitoring process, select either ‘New Patient’ or ‘Existing Patient’. 8.1.3.1. To begin measurement of a new patient select one of the following 3 options: a. Press ‘Patient’ button and select ‘New’ b. Press the first icon on the toolbar After selecting one of these two options, a window with all the details relevant to the patient will open. Fill in details and click . The measurement will 15 begin. 8.3. TABLE OF PARAMETERS Parameter Heart Rate Stroke Volume Stroke index Cardiac Output Cardiac Index Cardiac Power Index Granov Goor Index Total Peripheral Resistance Total Peripheral Resistance Index c. Press the ‘Measurement Start’Normal buttonRange . The Abb. Definition following window open: Number of heartwill beats each 58 - 86 bpm (beats HR minute per minute) Number of heart beats each SV 60 - 130 milliliter minute Stroke volume normalized 35 - 65 SI 2 for body surface area milliliter/beat/m Amount of blood pumped by CO 4.5 – 8.5 liter/min the left ventricle minute Figure 5: Patientper Reminder Cardiac Output normalized 2.5 - 4.7 CI 2 Selectfor ‘Enter Patient' window with all the bodyNew surface area and theliter/min/m details required for the patient will open. An indicator of myocardial 2 CPI 0.45 - 1.0ofwatt/m 8.1.3.2. To start the measurement an existing contractility patientofselect An indicator Left one of the following 2 options: > 10.0 (equals an Ventricular Function, which a. Press 'Patient Button' andEjection select ‘Find’. GGI Fraction is strongly related to > 55%) Ejection Fraction b. Press ‘Measurement Start' button . The 'Patient The resistance to the flow of Reminder' window opens (see above): blood in the arterial system 770 - 1500 patient' TPR i. If the name in the field following 'current -5 (often referred to as dynes·sec·cm is correct - select ‘Continue’. ii. “Afterload”) If the name in the field following 'current patient The resistance to the flow of is' incorrect or blank - select ‘Find Existing 1540 - 3000 blood in the arterial system -5 TPRI dynes·sec·cm / in Patient’. A ‘Patient List’ window will open, normalized for body surface 2 m which you can seek the relevant patient (see a area more detailed explanation in the Functional Total Body Water TBW Respiration rate RR The amount of extracellular Description below). fluid in % or kilograms 40.0 – 63.0% Number of breaths each minute 8 – 24 breaths / minute 16 8.2. FUNCTIONALITIES DURING MONITORING 8.2.1. Alarms – NICaS has a built-in alarm system that alerts the user of a technical failure. This alarm may sound while monitoring a patient however it indicates a technical failure only. In the event of a technical failure the system sounds an audio notification and the status line at the bottom of the screen will display the cause of the alarm. Note: See Alarms (Section 11) for a more detailed explanation. 8.2.2. Review Collected Data – ‘Review Mode’ enables the review of previously measured data. This mode can be accessed by directly pressing the ‘Review’ button on the main menu or by pressing . 17 8.3. TABLE OF PARAMETERS Parameter Abb. Heart Rate HR Stroke Volume SV Stroke index SI Cardiac Output CO Cardiac Index CI Cardiac Power Index CPI Granov Goor Index GGI Total Peripheral Resistance TPR Total Peripheral Resistance Index TPRI Total Body Water TBW Respiration rate RR Definition Normal Range Number of heart beats each minute Number of heart beats each minute Stroke volume normalized for body surface area Amount of blood pumped by the left ventricle per minute 58 - 86 bpm (beats per minute) Cardiac Output normalized for body surface area 2.5 - 4.7 2 liter/min/m An indicator of myocardial contractility 0.45 - 1.0 watt/m 60 - 130 milliliter 35 - 65 2 milliliter/beat/m 4.5 – 8.5 liter/min An indicator of Left Ventricular Function, which is strongly related to Ejection Fraction The resistance to the flow of blood in the arterial system (often referred to as “Afterload”) The resistance to the flow of blood in the arterial system normalized for body surface area 770 - 1500 -5 dynes·sec·cm The amount of extracellular fluid in % or kilograms 40.0 – 63.0% Number of breaths each minute 8 – 24 breaths / minute 18 > 10.0 (equals an Ejection Fraction > 55%) 1540 - 3000 -5 dynes·sec·cm / 2 m 2 8.4. GGI – Granov Goor Index - is a ratio that assesses Left Ventricular Systolic Function similarly to LVEF. Higher GGI readings indicate a better Left Ventricular Systolic Function. Below is the Correlation graph of GGI vs LVEF (GGI < 10 is associated with LVEF of < 55). The graph represents Blinded comparison of EF and GGI in 60 patients presenting at a cardiology clinic asymptomatic of ischemic heart disease and, selected to undergo echocardiography, and selected in accordance with device exclusion criteria. Data is not from an unselected population. Figure 6: Granov Goor Index 19 9. 9. FUNCTIONAL DESCRIPTION Right pane display: The right pane displays 10 parameters that provide data on the current 9.1. Main Screen measurements. These parameters display the real time values of the measurement the selected The normal Theformain screen isparameters. used to navigate andmeasurement operate the system and range for each parameter is displayed below the measured value. present the different views of the measurement data (see Figure 7 below). The color display is to enhance distinction between the parameters in real-time and does not qualify theAt measurement in any way.there are 2 navigation Toolbars and menus: the top of the screen toolbars. They functionally – of theParameters top one is textual and For parameters glossary of are abbreviations seeidentical the Table the bottom one has icon representations. in the section Getting Started. screen is divided into 3 main sections as follows: Bottom leftThe pane – Trends display: pane is divided horizontally The This area isLeft divided intodisplay 3 graphs. The trends are choseninto fromthree a list sections. of sections display waveforms representing real time ECG, ∆R and 14 parameters in the Options window (see Figure 12 below), whereas, of thetrends presentdisplayed. measurement. HR, SV andRespiratory CO are therate default Each point on the screen represents thedisplays measured and pre-selected computed result of a single Right pane 10 user parameters (from a total of measurement. The sequence of points displays the TREND for 14). The values of the parameters are preprogrammedthat to be updated parameter at during measurement at 10,a measurement. 20 or 30 seconds 10, 20the or specific 30 seconds intervals during preset intervals. The latest measurement point is located furthest to the right. Bottom left pane, below the wavelength, displays the trends of three of the parameters selected from the vertical right side readings (HR, SV and CO) during a measurement. 9.3. Toolbar menus The main screen offers 2 options for navigating through the NICaS system: the top is a text menu and the bottom is a graphic tool bar (see Figure 8). Figure 8: Main screen navigating menu 20 I II III Figure 7: Main Screen 9.2. THE DISPLAY Left pane screen – waveform display (refer to Figure 7 above): I. GREEN waveform represents the ECG. II. RED waveform represents the bioimpedance ΔR. III WHITE waveform represents the respiration. The waveforms progress from left to right along a horizontal axis drawing the vertical values (of the ECG, ICG and respiratory measurements). The Horizontal axis is marked by 1 second interval indicators 21 Rightsee pane display: For example Patient 3 in Figure 9. The right pane displays 10 parameters that provide data on the current Clicking measurements. the button "Enter/Update patientdisplay data"the real time values on theof the These parameters upper right corner opens ‘New Patient’ window were patient data measurement for the selected parameters. The normal measurement need torange be filled in. In the event of an existing patient, just update data for each parameter is displayed below the measured value. that were changed from previous measurement (see Figure 10). The color display is to enhance distinction between the parameters in real-time and does not qualify the measurement in any way. For parameters glossary of abbreviations see the Table of Parameters in the section Getting Started. Bottom left pane – Trends display: This area is divided into 3 graphs. The trends are chosen from a list of 14 parameters in the Options window (see Figure 12 below), whereas, HR, SV and CO are the default trends displayed. Each point on the screen represents the measured and computed result of a single measurement. The sequence of points displays the TREND for that parameter during the specific measurement at 10, 20 or 30 seconds preset intervals. The latest measurement point is located furthest to the right. 9.3. Toolbar menus Figure 10: New Patient The main screen offers 2 options for navigating through the NICaS The following Patient data in full: system: the top is menu a textshould menu be andcompleted the bottom is a graphic tool bar (see TypeFigure in full 8). name and ID number Click on the icon to indicate sex M/F Choose from scroll menu date of birth mm/dd/yy Enter the data for the Height, Weight, Hematocrit; Sodium; Systolic Blood Pressure, Diastolic Blood Pressure. Figure 8: Main screen navigating menu 22 Patient - Patient Management window Before entering a new patient you may want to check if he/she is already registered in the system: use this option to add a new patient, find an existing one, or to edit data of an existing patient (See Figure 9). Figure 9: Patient Management The window displays the list of patients already registered in the system. To enter a new patient or to search for an existing patient, enter the patient's Last Name, First Name or ID in one of the top 3 boxes. If the patient exists, click on the selected patient in the list of patients. Patient First Name, Last Name and ID will appear in the top 3 boxes. 23 Clicking the button "Enter/Update patient data" on the upper right corner opens ‘New Patient’ window were patient data need to be filled in. In the event of an existing patient, just update data that were changed from previous measurement (see Figure 10). Figure 10: New Patient The following Patient data menu should be completed in full: Type in full name and ID number Click on the icon to indicate sex M/F Choose from scroll menu date of birth mm/dd/yy Enter the data for the Height, Weight, Hematocrit; Sodium; Systolic Blood Pressure, Diastolic Blood Pressure. o Note: If no updated data on Hematocrit and Sodium for 24 o Note: If no updated data on Hematocrit and Sodium for Patient - Patient Management window patient the system enters a default measurement. Before entering a new patient you may want to check if he is already o The numbers on the right indicate the accepted range for registered in the system: use this option to add a new patient, find an each of the data entered. existing one, or to edit data of an existing patient (See Figure 9). Connecting the sensors: choose 2 options - left and right wrists (RW/LW) and left and right ankles (RA/LA). o Clicking on your choice of icons will change the "not set" to indicate the selected placement: i.e. RW+ LA Choose one of the three positions of the patient during the measurement: supine, sitting or standing. Click to save and measure Click to save and exit Click to cancel Patient measurements file display Click on a selected patient from the left pane list will display his/her measurements file in the right pane. The name of the patient appears at the top of the right pane. Management Selecting the Figure 9: Patient relevant patient’s name displays the measurement data on a 3 The window displays the list of patients already registered in the level hierarchy. system. To enter a new patient or to search for an existing patient, Example Figure 9 –the leftpatient's pane Patient 3 is selected; Right enter Last Name, First Name or pane ID in one of the top 3 boxes. 3 measurement library. Click on Patient shows the Patient number to open all patient files. exists, click on the selected patient in the list of patients. If the Patient First Name, Last Name and ID will appear in the top 3 boxes. P – Patient name or number For example see(Patient Patient3) 3 in Figure 9. 25 S w M ( T t p were taken Eachopens Series when has several measurements. Patient Reminder – A(23-Sep-12). window that the program is reopened. The includes the name of the current patient, and 4 M –window Listed Measurements stating by the measurement number options: (M #17) and hour 10:34:34). The Patient Management window has additional 6 function buttons at the bottom of the window for accessing, managing and retrieving patient data and issuing reports. a. o - enable changing the following parameters of Figure 10: Patient Reminder existing series: Systolic Blood Pressure, Diastolic Blood Pressure, Sensors Location, Patient Position. Continue – Choosing this option continues the measurement of the current patient. b. New Patient – Opens - Opens a window entering o Enter a window thatfor includes allfree the text comments relevant to the patient, the specific measurement or data necessary for a new patient (see above). other data entered. These comments will appear at the bottom o Find Existing Patient – Opens the ‘Patient List’ window, of the series reports (see can Figure To write a comment, from which the relevant patient be 11). selected by marking position cursor in the right box, type-in the comment, and press his/her name in the left screen. the arrow to transfer the comment into the highlighted series o Cancel – Closes this window. at the left box. The left box shows all the comments that were Measurement Pause - Stops the measurement. To dates. continue, written for the selected patient, and their select ‘Measurement Continue’are displayed . The measurement continues All comments in the patient report, with the date the sequence fromand where it was stopped, without losing the data time of entry. already accumulated for this series i.e. trends and last results of all parameters. When Pause is activated, 4 menus can be opened: 1) Report – for a single measurement; 2) Settings – ‘options’ are available, the number and/or types of trends displayed on the screen can be changed; 3) Comments; and 4) Help. Stop - Stops the measurement. When restarting, the measurement continues the sequential numbering from the last measurement (without retaining comparative data). 26 patient the system enters a default measurement. The numbers on the right indicate the accepted range for each of the data entered. Connecting the sensors: choose 2 options - left and right wrists (RW/LW) and left and right ankles (RA/LA). o Clicking on your choice of icons will change the "not set" to indicate the selected placement: i.e. RW+ LA Choose one of the three positions of the patient during the measurement: supine, sitting or standing. o Click to save and measure Figure 9: Add Comments c. Click to save and exit – Opens a window with the option to view the Click to cancel data through four types of reports: Measurement Report, Series Report, History Report (in ascending order) and Hemodynamic Navigator. Patient measurements file display d. - Exportpatient data of specific patient all displays data his Click on a selected from the left paneor listofwill basemeasurements to Excel. file in the right pane. The name of the patient appears at the top of the right pane. Selecting the relevant e. Use thisthe option to reviewdata a selected patient’s name- displays measurement on a 3 level measurement. hierarchy. f. Example Figure 9 – left Patient 3 is selected; Right pane - Use this pane option to start an additional measurement an existing patient. Afterlibrary. patientClick has on beenPatient shows theofPatient 3 measurement selected, clicking ‘Continue’ will start a measurement. number to open all files. Measurement Start - Starts the measurement. Clicking this P – Patient name or number (Patient 3) button changes it to ‘Measurement Pause' S - Measurement Series (S #4) followed by the date the series 27 A window opensgain when the program is Patient Reminder ECG zoom – Choose– one of three that amplitude options reopened. The window includes the name of the current patient, and 4 for the ECG: 1, 2 or 4. Gain 2 is default. options: Measurement duration – Offers the option to choose the rate of updating the data during the measurement: 10, 20, or 30 seconds intervals (default is 20 seconds). Trends - Lists the parameters that can be selected to be displayed in the trends charts at the bottom left of the main screen (see Figure 11). Choose 3 of the 11 options Figure 10: Patient Reminder for display per measurement by ticking the relevant checkbox. o Continue Choosingthatthis option the Parameters - Lists the –parameters can be selectedcontinues to measurement of the current patient. be displayed in the Parameters pane to the right of the o Enter Patient – Opens10a of window includes all the the 14that options main screen (seeNew Figure 11). Choose for a new for displaydata pernecessary measurement by patient ticking (see theabove). relevant o Find Existing Patient – Opens the ‘Patient List’ window, checkbox. from which the relevant patient can be Trends Speed - Determines the rate at selected which by marking his/her in displayed the left screen. measurement dataname will be on the chart to o Cancel – Closes this create the trend graph. Choosewindow. from 1, 3, 5 or 10 minute intervals. - Stops the measurement. To continue, Measurement Pause select ‘Measurement Continue’ . The measurement continues Settings/Techniques is available when measurement is paused the sequence from where it was stopped, without losing the data or stopped.already It can accumulated be accessed for only by authorized personal withresults of all this series i.e. trends and last validated password. The advance setting enables the Algorithm parameters. Selection (See Figure 12). When Pause is activated, 4 menus can be opened: 1) Report – for a single measurement; 2) Settings – ‘options’ are available, the number and/or types of trends displayed on the screen can be changed; 3) Comments; and 4) Help. Stop - Stops the measurement. When restarting, the measurement continues the sequential numbering from the last measurement (without retaining comparative data). 28 Review - Opens a window with a 4 graphs display: ECG, dR, dR/dt and respiration, and the calculated results of the patient’s last measurement. This option is available only when the patient is no longer connected to the NICaS system. In addition, any other measurement can be selected from the 'Patient List' window, and by clicking this 'Review' button in the 'Patient List', the review of the selected measurement will appear. To stop the measurement review, press the 'Stop' button. Setting/Options - Use this window to select your default or premeasurement settings. Click on 'Settings' or the icon to open a window menu that displays all the system parameters and check boxes (see Figure 11). Figure 11: Setting/Options 29 ECG zoom – Choose one of three amplitude gain options for the ECG: 1, 2 or 4. Gain 2 is default. Measurement duration – Offers the option to choose the rate of updating the data during the measurement: 10, 20, or 30 seconds intervals (default is 20 seconds). Trends - Lists the parameters that can be selected to be displayed in the trends charts at the bottom left of the main screen (see Figure 11). Choose 3 of the 11 options for display per measurement by ticking the relevant checkbox. Parameters - Lists the parameters that can be selected to be displayed in the Parameters pane to the right of the main screen (see Figure 11). Choose 10 of the 14 options for display per measurement by ticking the relevant checkbox. Trends Speed - Determines the rate at which measurement data will be displayed on the chart to create the trend graph. Choose from 1, 3, 5 or 10 minute intervals. Settings/Techniques - is available when measurement is paused or stopped. It can be accessed only by authorized personal with validated password. The advance setting enables the Algorithm Selection (See Figure 12). 30 Figure 12: Advance Settings Authorization Algorithm selection: The default setting is for volumetric measurement and should be the standard mode of measurement. This option is for use by advance settings and should be changed only by an authorized technician (see Figure 13). Figure 13: Advance Settings Authorization There are two options for measuring the CO: A) The standard Volumetric method, where the SV is calculated by Frinerman’s (ΔR) algorithm. B) The alternative Velocimetric method, where the SV is calculated by the first derivative of ΔR. 31 The velocimetric option should algorithm be used only when Correlation with Thermodilution of volumetric 25 post operative patients patient’sinadmitting diagnosis is “acute heart failure”. 8 Enclosed is a graph showing correlations with range lines of the results from acute heart failure and another graph for all other patients. The data from which these two graphs were constructed were published in Cotter’s paper (Physio Measures 2006; 27:817-27). 7 NICAS CO (lit/min) the 6 5 4 Correlation with Thermodilution of Volumetric vs. Velocimetric Algorithm in post operative patients 3 13.0 2 3 11.0 2 4 5 6 7 8 Thermodilution CO (lit/min) 9.0 NICaS (lit/min) Figure 16: Correlation of Volumetric Algorithm to TD in 7.0 Post-Operative Patients Velocimetric Volumetric *Range lines in the plot represent +/- 0.8 L/min for TD CO values <= 4 5.0 L/min, +/- 20% for TD CO values > 4 L/min. 3.0 Print Screen - is a function that enables converting the data on the screen into a PDF format and Thermodilution then save or send it to a mail (lit/min) recipient. Figure 14: Correlation with TD in P Operative Patients 1.0 1.0 Help 3.0 5.0 7.0 9.0 11.0 13.0 – Click to access user *Range lines inthe the electronic plot represent +/-guide. 0.8 L/min for TD CO values <= 4 L/min, +/- 20% for TD CO values > 4 L/min. Your NICaS version currently installed. – provides information regarding the version Exit – To close the program click on the main screen. 32 at the top right of the Correlation with Thermodilution of Volumetric vs. Velocimetric Algorithm in Acute Heart failure patients 8 7 NICaS (lit/min) 6 5 Velocimetric 4 Volumetric 3 2 1 1 2 3 4 5 6 7 8 Thermodilution (lit/min) Figure 15: Correlation with TD in Acute Heart Failure Patients *Range lines in the plot represent +/- 0.8 L/min for TD CO values <= 4 L/min, +/- 20% for TD CO values > 4 L/min. As one can see in the acute heart failure group, the lower the cardiac output (below 4.0 lit/min) the higher the accuracy of the velocimetric results, and the higher the cardiac output, the better the volumetric results. Results of an additional group of patients measured with the Volumetric algorithm – (see Figure 18) below. 33 Correlation with Thermodilution of volumetric algorithm in 25 post operative patients 8 NICAS CO (lit/min) 7 6 5 4 3 2 2 3 4 5 6 7 8 Thermodilution CO (lit/min) Figure 16: Correlation of Volumetric Algorithm to TD in Post-Operative Patients *Range lines in the plot represent +/- 0.8 L/min for TD CO values <= 4 L/min, +/- 20% for TD CO values > 4 L/min. Print Screen - is a function that enables converting the data on the screen into a PDF format and then save or send it to a mail recipient. Help – Click to access the electronic user guide. Your NICaS version currently installed. – provides information regarding the version Exit – To close the program click on the main screen. 34 at the top right of the Shut Down Pressing the laptop’s Power button willwith begin the shutting down sequence. Correlation Thermodilution of Volumetric vs. Velocimetric Algorithm in Acute Heart Note: If you wish to continue using your laptop, simplyfailure exit patients the NICaS 8 application by clicking on the X at the top right of the screen 7 1 T ( C u p NICaS (lit/min) 6 5 Velocimetric 4 Volumetric 3 2 1 1 2 3 4 5 6 7 8 Thermodilution (lit/min) Figure 15: Correlation with TD in Acute Heart Failure Patients *Range lines in the plot represent +/- 0.8 L/min for TD CO values <= 4 L/min, +/- 20% for TD CO values > 4 L/min. As one can see in the acute heart failure group, the lower the cardiac output (below 4.0 lit/min) the higher the accuracy of the velocimetric results, and the higher the cardiac output, the better the volumetric results. Results of an additional group of patients measured with the C Volumetric algorithm – (see Figure 18) below. T N m 35 e. CaS 10. COMPARATIVE SCREEN The NICaS system offers users a shift between the regular measurement (Figure 7: Main screen) screen to a comparative screen (Figure 17: Comparative Screen). The comparative screen is designed to enable users to perform a set of comparative measurements according to different parameters. Figure 17: Comparative Screen Click on to shift from the regular to the comparative screen. The top screen display is of the ECG (green) and ∆R (red) waveforms. Note: Enter the comparative parameters of your choice for each measurement/series in Parameters 1/Parameter 2. These parameters can 36 be customized through the 'Setting/Options' menu. Click to open the Comparative Measurement Options and edit Parameters 1 and 2 according to your comparative parameters. Before starting a new measurement the system will open a dialog box reminding the user to change the comparative parameters for that measurement. The right pane displays the data for each series – in descending sequential order; the current or last measurement appears at the bottom. The numerical data in the right pane columns displays and updates the values per series with reference to the comparative parameters 1 and 2. The left pane displays 4 trends representing the series graphically and numerically (each dot is a measurement in a series). The numeric data displays current vs. average values. When the measurement is stopped, a click on any of the dots changes the top ECG/∆R waveforms to that of the specific measurement. Placing the cursor on the dot and right click on the mouse neutralizes it from the average calculation for that trend (displayed numerically at the side). The bottom right continues the numerical comparison between the current and average values for the other parameters When opening the Patient Management window from this screen the patient file also displays the date of each of the series. 37 11 he ld. ox hat tial he ues nd ata ,a he he ed ent 11. NICAS REPORTING SYSTEM There are 3 types of reports: Patient Measurement report – report of 1 measurement obtained by clicking on the required measurement (e.g. M #12 in Figure 20). Patient Series report – report of average of a few measurements obtained by clicking on the required series (e.g. S #3 in Figure 20). Patient History report – report of all historical series obtained by clicking on the patient name (e.g. Patient 1 in Figure 20). After required report has been selected press ‘View Report’ to generate a PDF report. Hemodynamic Navigator - provides Cardiovascular and Cardiac Function graphs for on-line drug titration – double mouse click on Patient name. he Figure 20: Selecting reports 38 All reports display the patient's identification data as entered during registration: Name, ID number, sex, date of birth, and height. All other data and display varies according to the selected event and type of report. 11.1. PATIENT SINGLE MEASUREMENT REPORT The report heading states the number of the selected measurement for the report (see Figure 21: M13). Top of the page shows patient’s permanent data and identifies the date and time of the measurement and the recording intervals (20 seconds). This is followed by a tabular display of all the measurement parameters and their results. The table states the name and abbreviation of each parameter, the measurement unit and the actual reading. The last column displays a scale with the low to high values for each parameter. The measurement reading is indicated on the scale: Green = in norm; Red = out of norm. The table is followed by 2 graphs representing a sample of ECG and ∆R waveform of the measurement. 39 Figure 21: Measurement Report 40 11.2. PATIENT STATUS REPORT The Series Report is similar in form to a Measurement Report with certain additional data. The tabular data displays the average of the series' measurements results per parameter. The scale displays the readings per series within the high/low range for each parameter. The continuous colored section on the scale indicates the values for the current series measurement. In addition, Patient Series report compares the current series measurements with those of the last series taken on the sequential date prior to the current one (see Figure 22: M3). The earlier series is marked with a dot before the date (column heading). The dot indicating the values of earlier measurement - it can be within the colored range (lower) or out of the colored range (higher) than the current value/reading. The graphic data displays the ECG and ΔR waveform. The report displays 3 measurement trends chosen for that series. Each dot on the trend display represents a single measurement. Example: HR, SV, CO The bottom of the page displays all the comments entered by the physician. 41 Figure 18: Status Report 42 11.3. PATIENT HISTORY REPORTS The top of the page shows patient’s permanent data. A Hemodynamic Patient Report provides a tabular summary of a patient's previous measurements in ascending order of occurrence. Additionally, the values of three user-selected parameters are plotted to display the trend with relation to its time sequence. All the physician's comments are displayed at the bottom of the page. 43 Figure 19: Patient History Report 44 11.4. NICAS HEMODYNAMIC NAVIGATOR REPORT Provides Cardiovascular and Cardiac Function graphs for on-line drug titration – double mouse click on Patient name. Figure 20: Hemodynamic Navigator 45 11.4.1. Cardiovascular Status Graph This graph displays Blood Pressure vs. Cardiac Index and helps understand the vascular status. To the left and right of the graph are the measurement scales for MAP, SBP and DBP – each with a graphic representation (MAP – black dot; SBP red triangle; DBP blue square). The normal range is indicated by a green hexagon. Measurement values within the hexagon boundaries are within norm. Below the graph is a tabular display of the values for the two measurements parameters. 11.4.2. Cardiac Function This graph display of Stroke Index (SI) vs. Heart Rate (HR). Each series is represented by a blue dot on the graph. The arrow indicated the sequence, earlier measurement to later. The Green graphic form indicates the norm. Measurement values within the graphic boundaries are within norm. Below the graph is a tabular display of the values for the two measurements parameters. 46 11.5. REPORT OPTIONS 12 11.5.1. Quick Report Pointing the mouse to a measurement (M) or to a series (S) in the right-hand pane will open a small window with the results of 5 parameters (HR, SV, CO, CI, TPR) either for the specific measurement or the average for the series. 11.5.2. Omitting a measurement/s from a report Selecting a measurement or several measurements with the right mouse button excludes these measurements from statistics and from calculated averages in reports (see Figure 25: M#8). Figure 21: Patient Management Windows 47 As al Te Te W is th (S) he he th om ee 12. ALARMS As mentioned in the previous section, the system can set-off one type of alarm while monitoring a patient. Technical Alarm Technical alarms are activated as a result of a technical or software failure. When a technical alarm sounds, a unique technical-alarm audio notification is heard, and the status line in bottom of the screen displays the cause of the alarm. Figure 23 demonstrates a technical alarm scenario. Figure 22: Technical Alarm 48 Possible Technical Alarms are: A) Communication port problem- there is no data received from the unit Root cause: Communication cable is not properly connected. Hardware defect on the cable, or port of NICaS or PC. B) Bad electrodes - No data from electrodes. Root Cause Electrodes are not attached properly Hardware defect on electrodes C) Cannot calculate results - Bad data from electrodes Root Cause Electrodes are not attached properly Electrodes are dry 13 Th pa ind Ind ne Ex Fo be At no rec 49 he 13. INTENDED PATIENT POPULATION The NICaS CS is intended to monitor and display patients hemodynamic parameters (including stroke volume, stroke index, heart rate, cardiac index, cardiac output, total peripheral resistance, and the Granov-Goor Index), in males and females with known or suspected cardiac disorders needing cardiac assessment. Exclusion Criteria For proper use of the RIC technology, the following exclusion criteria must be strictly adhered to: Aortic valve insufficiency Significant aortic valve stenosis Severe mitral valve insufficiency The following aortic conditions: a) aneurysm; b) coarctation; c) obstruction (bifurcation) Peripheral vascular disease with feeble or absent peripheral pulses Restlessness and/or chaotic breathing Congenital cardiac malformations Extra-cardiac shunts During renal dialysis Adiposity – 50% or more than normal Height under 1.50 m and above 2.00 m. Attention: For optimal results, the patient must be motionless except for normal breathing. If the patient cannot be immobile, sedation is recommended. 50 14. TROUBLESHOOTING 1 When problems arise, a message will be displayed at the top of the screen referring the user to the following chart: S c A PROBLEM 9.1 MESSAGE: “Check Connectors” 9.2 MESSAGE: “Bad Electrodes” ACTION - Check if power connection and the RS232 plug are properly plugged in. - If problem persists, contact manufacturer’s local Service Department. - Check ECG and impedance electrodes for dirt or broken parts. - Unplug sensors, clean connectors with a clean cloth and 90% alcohol. - If unsuccessful, replace with new set of electrodes. in o t N 3 K T F In case of a general problem, refer to the following chart for further details: PROBLEM RESOLUTION E N L T E N T F E N 51 : 15. SERVICE Should service be required during or after the warranty period, please contact New NI Medical representative as per list below (please visit our website www.ni-medical.com for an update distributor list) to obtain a Return Authorization Number. Please repackage the device carefully in its original box or in a sturdy carton to prevent damage. Include a note describing the nature of the problem and your return address. We also suggest that you insure the package. Send the medical device to: Main Office New NI Medical (2011) Ltd. 3 En Hay St. Kfar Mallal 4592000, Israel Tel.: +972 9 7407031 Fax: +972 9 7401030 Email: [email protected] www.ni-medical.com EU Official representative New NI Medical (2011) UK TEL: +44-(0)758-049-8397 E-mail: [email protected] www.ni-medical.com USA New NI Medical (2011) USA 500 Market St. Suite205 Chapel Hill, NC 27516 USA Tel.: +1-800-979-2904 Fax: +1-888-724-2926 E-mail: [email protected] www.ni-medical.com 52 NI Medical will provide service and support for the product for at least seven years from the day of manufacture. 16. ORDERING INFORMATION If for any reason you wish to order one of the following items, please write to us or to your supplier, and remember to enter part number and description, as specified below: Part No. NI2.0001.01 NI2.0005.01 NI2.0006.01 NI2.0009.04 Description NICaS CS Module, Integrated ECG NICaS CS ICG Cable NICaS CS ECG Cable NICaS CS Sensor Kit, ICG only, box of 100 applications N fr e to M fa c n L a w m e T re a g w in 53 st e s APPENDIX A: LIMITED ONE-YEAR WARRANTY 1. Warranty N.I. Medical Ltd. warrants that for a period of twelve (12) months from installation of equipment at a customer’s premises, such equipment (excluding consumable component) will materially conform to its published specifications under normal use and service. New NI Medical Ltd.'s sole obligation and customer's sole remedy, for any failure of an equipment to perform as warranted above, is, the correction or replacement, at New NI Medical Ltd.'s option, of the non-conforming equipment, provided, however, that New NI Medical Ltd. has been notified by customer or New NI Medical Ltd.'s authorized distributor of the non-conformity prior to expiration of the warranty period set forth above; replacement of equipment shall be made by New NI Medical Ltd. only against receipt of the defective equipment unless otherwise agreed between the parties. 2. Warranty Exceptions The warranty set forth herein will not apply, and, customer will reimburse New NI Medical Ltd. or its authorized distributor, as applicable, for any costs and expenses incurred in connection with goods or services provided in the event: a) the equipment has been used other than in accordance with this User Manual, its documentation or other written operating instructions or has been subject to negligence or accident by anyone 54 other than New NI Medical Ltd. or its authorized distributor; b) use of the equipment in excess of the maximum period determined by New NI Medical Ltd. or its authorized distributor; c) products or parts identification labels are removed or altered from the equipment; d) the equipment has been modified, repaired, serviced, maintained or altered by anyone other than New NI Medical Ltd. or its authorized distributor; e) the equipment has been combined with software, hardware or other equipment not supplied by New NI Medical Ltd. or its authorized distributor; f) if at any time the power supplied to any part of the equipments exceeds the rated tolerance design parameters or applicable local regulations; g) the equipment has been installed not in accordance with the written installation instructions provided by New NI Medical Ltd. or by its authorized distributor; h) the equipment has been damaged by causes beyond the control of New NI Medical Ltd.; i) the equipment has been modified without New NI Medical Ltd.'s written consent; or j) if any time the serial number plate is removed or defaced. 55 3 E E O I M P A D O S E I S T 4 Customer will reimburse New NI Medical Ltd. for all expenses and costs involved in New NI Medical Ltd.'s efforts in the event the problem for which service sought is not covered by the above warranty. 3. Limited Warranty. EXCEPT FROM THE WARRANTY SPECIFIED ABOVE THE EQUIPMENT IS PROVIDED “AS IS” AND THERE ARE NO OTHER WARRANTIES EXPRESSED OR IMPLIED, IN LAW OR IN FACT, INCLUDING THE IMPLIED WARRANTIES OF MERCHANTABILITY AND FITNESS FOR A PARTICULAR PURPOSE TO CUSTOMER HEREUNDER. CUSTOMER ACKNOWLEDGES THAT THE EQUIPMENT IS NOT A DIAGNOSTIC OR THERAPEUTIC DEVICE AND MAY BE USED ONLY FOR THE PURPOSES APPROVED BY THE FDA AS SPECIFIED BELOW. CUSTOMER ACKNOWLEDGES THAT EQUIPMENT MAY BE USED ONLY ON PERSONS WHICH ARE INCLUDED IN THE "INTENDED PATIENT POPULATION" SPECIFIED ABOVE AND THAT DO NOT FALL WITHIN ANY OF THE EXCLUSION CRITERIA SPECIFIED THEREIN. 4. Limitation of Liability. N.I. MEDICAL LTD. IS NOT LIABLE TO CUSTOMER FOR INDIRECT, SPECIAL, INCIDENTAL, OR CONSEQUENTIAL DAMAGES RESULTING FROM ANY BREACH OF WARRANTY OR BREACH OF THIS AGREEMENT OR UNDER ANY OTHER 56 LEGAL THEORY INCLUDING, BUT NOT LIMITED TO, LOST PROFITS, DOWNTIME, GOODWILL, DAMAGE TO OR REPLACEMENT OF EQUIPMENT AND PROPERTY, AND ANY COSTS OF RECOVERING, REPROGRAMMING, OR REPRODUCING ANY PROGRAM OR DATA STORED IN OR USED WITH AN EQUIPMENT EVEN IF N.I. MEDICAL LTD. HAS BEEN ADVISED OF THE POSSIBILITY OF SUCH DAMAGES OR LOSSES. IN NO EVENT SHALL N.I. MEDICAL LTD. BE LIABLE FOR THE CUSTOMER'S COSTS OF PROCURING SUBSTITUTE PRODUCTS OR COMPONENTS. IN NO EVENT SHALL N.I. MEDICAL LTD. BE LIABLE FOR ANY THIRD PARTY PRODUCTS (SUCH US COMPUTERS) THAT ARE USED TOGETHER WITH THE EQUIPMENT EVEN IF THEY WERE PURCHASED VIA N.I. MEDICAL LTD. OR ITS AUTHORIZED DISTRIBUTORS. THE AMOUNT OF LIABILITY OF N.I. MEDICAL LTD. FOR ANY CLAIM ARISING UNDER CUSTOMER'S USE OR INABILITY TO USE THE EQUIPMENT, WHETHER BASED ON BREACH OF CONTRACT, BREACH OF WARRANTY, NEGLIGENCE, STRICT LIABILITY OR OTHERWISE WILL NOT EXCEED THE AMOUNT PAID BY CUSTOMER. THESE LIMITATIONS APPLY TO ALL CAUSES OF ACTION IN THE AGGREGATE. SOME OF THESE LIMITATIONS MAY NOT BE FULLY APPLICABLE IN CERTAIN JURISDICTIONS. 57 58