1
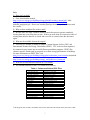
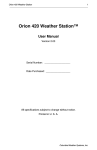
July 2003 • NREL/BR-550-34303 Real-Time Weather Data Access Guide N. Long National Renewable Energy Laboratory 1617 Cole Boulevard Golden, Colorado 80401-3393 NREL is a U.S. Department of Energy Laboratory Operated by Midwest Research Institute • Battelle • Bechtel Contract No. DE-AC36-99-GO10337 July 2003 • NREL/BR-550-34303 Real-Time Weather Data Access Guide N. Long Prepared under Task No. BEC3.4005 National Renewable Energy Laboratory 1617 Cole Boulevard Golden, Colorado 80401-3393 NREL is a U.S. Department of Energy Laboratory Operated by Midwest Research Institute • Battelle • Bechtel Contract No. DE-AC36-99-GO10337 NOTICE This report was prepared as an account of work sponsored by an agency of the United States government. Neither the United States government nor any agency thereof, nor any of their employees, makes any warranty, express or implied, or assumes any legal liability or responsibility for the accuracy, completeness, or usefulness of any information, apparatus, product, or process disclosed, or represents that its use would not infringe privately owned rights. Reference herein to any specific commercial product, process, or service by trade name, trademark, manufacturer, or otherwise does not necessarily constitute or imply its endorsement, recommendation, or favoring by the United States government or any agency thereof. The views and opinions of authors expressed herein do not necessarily state or reflect those of the United States government or any agency thereof. Printed on paper containing at least 50% wastepaper, including 20% postconsumer waste Acknowledgments This work was made possible under the Department of Energy’s (DOE’s) Office of Energy Efficiency and Renewable Energy’s High Performance Building’s Initiative. We appreciate the support and guidance of Dru Crawley, Program Manager for High Performance Buildings as well as the following people who reviewed this document prior to publication: Ron Judkoff, Paul Torcellini, Mike Deru, and Sheila Hayter (National Renewable Energy Laboratory) and Linda Lawrie (U.S. Army Engineer Research and Development Center). iii Table of Contents Acknowledgments.............................................................................................................. iii Introduction......................................................................................................................... 1 Parsing Data ........................................................................................................................ 1 Filling Data ......................................................................................................................... 2 Verification of Filling Routines ...................................................................................... 3 Accessing the Database....................................................................................................... 3 Requesting Data .............................................................................................................. 3 Station Listings................................................................................................................ 4 Weather Output Format................................................................................................... 5 CSV ............................................................................................................................. 6 IWEC ........................................................................................................................... 6 Contact ............................................................................................................................ 6 FAQ................................................................................................................................. 7 References......................................................................................................................... 10 Tables Table 1. Format for Manual E-mail................................................................................................ 4 Table 2. Station File Format........................................................................................................... 5 Table 3. Column and Units of CSV Files....................................................................................... 6 Table 4. Column and Units of CSV Files....................................................................................... 7 Table 5. Column and Units of IWEC Files .................................................................................... 8 Table 6. Station File Format......................................................................................................... 10 Figures Figure 1. Filling routine verification.................................................................................. 3 iv Introduction From 1998 until 2001, the Gas Technology Institute (GTI, formerly the Gas Research Institute) created a database to collect weather data for 234 locations in the United States. GTI and its subcontractors (Mason-Grant and Rocket Science) graciously donated the data to the National Renewable Energy Laboratory (NREL) and allowed its incorporation into a new weather database designed by the NREL's High Performance Buildings Research Team. The weather data can be used for building energy simulation software such as Energy Plus or other thermal simulation software packages. Building researchers at NREL created the new weather database to make access to the weather data easier and faster for engineers in the building community not familiar with the National Weather Service (NWS) data collection format. NREL building researchers created this guide to explain to users of their weather database how the data are parsed, how the data are filled, and how to access the database. The NREL weather database uses a computer program that collects current weather conditions for over 4,000 sites around the world and allows access to the data via a web page designed by NREL's Buildings Team. The database provides data for some locations from late 1998 through today (although there may be significant gaps in the data). Users can request data to be sent to them via e-mail by using the interactive web page. The local computer program automatically processes the requests and replies with the appropriate data attached. Before using this guide, be aware that the accuracy and continuity of the data in the local database is dependent on many procedures operating seamlessly. The NWS ftp site must be active, the local data collection computer must be on and stable, and local Internet services must be available. If any of these variables are unavailable for more than a couple hours, then missing data may occur. Also, the data received is only as good as the data reported. The accuracy of the data depends on the accuracy of the sensors, which are uncontrollable. The database does not determine if the data was off by a certain percent because of a failing sensor or unusual conditions during the time of the reading. The majority of the data that is collected is the wet- and dry-bulb temperatures, pressure, and wind conditions. In some cases more information was available and is included in the database. Parsing Data The format of the weather data received from the NWS is extremely inconvenient to read, especially for trending historical data; therefore, a parsing program was created to simplify the data. The weather-parsing program allows for gigabytes of data to be processed into an accessible indexed database format. Although there are many consistent errors with the format of the weather data files, the data parser checks for many of the errors and compensates for them. Many stations have multiple readings near the hour. The program finds the closest entry to the hour and uses those values. However, if newer information (such as cloud cover) is received in a reading and that data point is not already stored, then the new data point is stored as if it occurred for that hour. The overwriting of old data will not occur unless 1 the new time stamp is closer to the hour of interest or the value was not previously stored. It is very seldom that the database does not find a reading within five minutes to the top of the hour. Filling Data The weather database may not have a contiguous collection of data. There are basically two different failure areas: (1) on the NREL side, where the connection to the Internet was interrupted either by a network failure or a computer failure preventing the weather data to be downloaded; (2) on the NWS side, where the station was not accessed to collect the data and store it in a file. Also, heavy traffic to the NWS ftp site has prevented several data sets from being retrieved. Upon request of the data, the missing data can be exported with interpolated values for the holes. The filled values are not stored in the database; they are calculated every time a data request isreceived. If the user requests filled data, there are two different routines that operate to smooth the data, while a third routine simply breaks the file and skips the missing data. The only data that are filled are the wet- and dry-bulb temperatures. If the missing period is less than 6 hours, then the data are simply filled linearly or as seen in Equation (1). f (t2 ) − f (t1 ) ⋅ n f (t n ) = f (t1 ) + t2 − t1 (1) Where: f(tn) is the time step to fill f(t1) and f(t2) are the values around the missing time step n is the missing data step If there are more than 6 hours and less then 48 hours of missing data, then the data are filled by taking the trend of the first previous day that is valid, as seen in Equation (2). The trend is offset by the values that surround the missing data to smooth the filled data. ( f (t2 ) − f (t2 − d ) ) − ( f (t1 ) − f (t1− d ) ) ⋅ n f (tn ) = f (tn − d ) + ( f (t1 ) − f (t1− d ) ) + t2 − t1 + 1 (2) Where: f(tn) is the time step to fill f(t1) and f(t2) are the values around the missing time step d is the offset back to the previous valid day n is the missing data step If the missing data covers more than 48 hours, then the program creates a new file where the data starts again. The naming convention for the new filename is an underscore and the valid file dates, for example: KDEN_20020824-20031015. When viewing the data in CSV format, the missing data will contain an asterisk next to the filled value regardless if the data were filled with the linearly interpolated equation or the nonlinear equation. 2 However, when viewing the data in IWEC format, the program will output the uncertainty flags as specified in the IWEC manual. The filling data routine does not scan for values outside of a given range, for instance, if the temperature suddenly dropped 50ºC in one hour, then there must have been an error with the reading of the station or the parsing of the data file. The program does not attempt to correct these values; therefore, the user must manually identify these outliers and correct them. Note: When filling, if the wet-bulb temperature is larger than the dry bulb then the program will force the wet bulb to equal the dry bulb. Verification of Filling Routines Figure 1 shows the wet- and dry-bulb temperatures for the real data and filled data. This is the worst-case scenario because an abundant amount of data is missing over several days. For the large pieces of missing data, the trend is continued from the previous days, while for the smaller pieces of missing data, the trend is linear. 300 Filled Dry Bulb Measured Dry Bulb Fillled Wet Bulb Measured Wet Bulb 250 200 Temperature (Tenth Deg C) 150 100 50 0 03/08/2003 03/09/2003 03/10/2003 03/11/2003 03/12/2003 03/13/2003 03/14/2003 03/15/2003 03/16/2003 03/17/2003 03/18/2003 -50 -100 -150 -200 Figure 1. Filling routine verification. Accessing the Database Requesting Data There are two methods to retrieve data from the database. The preferred way to request data is to access the weather request web page currently located at http://www.eere.energy.gov/buildings/energyplus/cfm/weatherdata/weather_request.cfm. 3 The process is simple and outlined on the web page. It is possible to enter the 4-character ICAO station ID directly or to search for a valid ID by selecting the “search” option on the home page. Upon completion of the request, data should be sent within an hour. The second way of retrieving data is to manually send an email to [email protected] with a specific format. It is suggested to use the web interface explained in the previous paragraph because a mistype in the e-mail may prevent the data from being sent. However, if it is chosen to use a manual e-mail, the format must be as follows: Table 1. Format for Manual E-mail Format Example To: [email protected] Subject: Weather Data Body: StationID=<Enter 4-character ICAO Station ID> StartDate=<Enter Start Date in MM/DD/YYYY> EndDate=<Enter End Date in MM/DD/YYYY> OutputType=<1 for CSV, 2 for IWEC> FillData=<0 for No, 1 for Yes> To: [email protected] Subject: Weather Data Body: StationID=KDEN StartDate=08/24/2002 EndDate=10/15/2002 OutputType=1 FillData=1 The station ID must be on the first line of the body and appear exactly as above. Nor should the greater than “>” or less than “<” signs appear in the text. The format of the start date and end date are the same. If the dates entered in the StartDate and EndDate fields are out of range of the actual data, then the program will converge on the valid dates. If the e-mail is in the correct format and the return address is valid, then the user should receive an e-mail with the data within an hour. If the entire period requested is not available as a contiguous piece, the returned email will have several “files” attached with appropriate identifications as to the data period (e.g., KDEN_20020212200205061.iwc, KDEN _20020509-200205241.iwc). If no data are received within eight hours, the process should be repeated. Certain e-mail clients do not allow for large attachments to be sent during peak hours. In this case, the data may take longer to receive. Also, some e-mail clients do not allow for large attachments at all. In this case, the requester should break up the dates to receive smaller files, then piece the files together manually. It is possible that no information is to be found for the station entered, and in this case, an empty email will be returned to the user. If the data request occurs during the night or during a weekend (MDT), the process may take longer because maintenance operations are running during these hours. Station Listings It is possible to retrieve a listing of all the valid stations and the data range by selecting “Retrieve a list of stations and data availability” on the web page or by sending an e-mail to [email protected] with “Station Listings” in the subject (the body can be blank). 4 The format of the station file is below. It is a semicolon delimited ASCII file with the following information in each column, starting at column 1. If the entry is null, then the column will contain a period. Table 2. Station File Format 1. 2. 3. 4. 5. 6. 7. 8. 9. 10. 11. 12. 13. 14. 15. 16. 17. 18. 19. 20. 21. Column Irrelevant Irrelevant Station ID Station Name or Airport Name City State or Providence Country Continent Index Latitude Longitude Elevation in Meters WMO Identifier – IWEC Code Time Zone Offset From GMT First Valid Timestamp Last Valid Timestamp Number of Valid Records Percentage of Valid Records Latitude in Radians Longitude in Radians County Alternate 3-character Station Code Units/Notes ICAO Code If Available Degrees, Minutes Degrees, Minutes Meters This file is automatically created every weekend to update the valid station dates. Also, the database is continually adjusted to reflect station information because exhaustive information (such as GMT to LST offsets) for the stations could not be found and are continually adjusted when new information is found. Weather Output Format After a request has been received via the e-mail with appropriate fields, the local program will attempt to output the data. If there was an error with the e-mail format (this will typically occur if the user manually sends an email instead of using the web interface) then the user will receive an email with the correct format outlined in the body. If no data are available for the site, then the user will receive an email with an attachment stating “Station or Data For Station Not Found.” Other errors may occur if the subject has the wrong title. If no email is received within 8 hours, try requesting the data again. When requesting data, the program searches for a station listing that details the parameters of the station such as longitude, latitude, and time offset for Greenwich Mean Time (GMT). All data requests are in GMT. If the user requests data that are outside of the available time stored in the database, then the program will only report the data that falls within the bounds. If no station information was found or the time offset was not present, then a line in the output file will warn the user that the time stamps are not in local standard time. For certain applications the data need to be in local standard time before using them in an energy simulator. Conversely, if the time offset values are found, then the time stamps will be in local standard time. 5 The output of the weather data is available in two formats: Comma Separated Values (CSV) and International Weather for Energy Calculations (IWEC) [1]. CSV The CSV files have the following columns and respective units: Table 3. Column and Units of CSV Files Column 1. Local Standard Date and Time 2. Greenwich Mean Time 3. Dry Bulb Temperature 4. Wet Bulb Temperature 5. Wind Direction 6. Wind Speed 7. Wind Gusts 8. Wind Variability 9. Altimeter 10. Visibility 11. Weather Description 12. Weather Precipitation 13. Weather Observation 14. Weather Other 15. Cloud Cover Level 1 16. Cloud Cover Level 2 17. Cloud Cover Level 3 18. Sea Level Pressure Units/Notes MM/DD/YYYY HH:MM1 MM/DD/YYYY HH:MM Tenths of Degree Celsius Tenths of Degree Celsius Degrees (0º = North, 90º = East) Tenths of Meter Per Second Tenths of Meter Per Second Range in Degrees Hundreds of Pascals Tenths of Kilometers MI, BC, PR, TS, BL, SH, DR, F DZ, RA, SN, SG, IC, PL, GR, GS, UP BR, FG, FU, VA, SA, HZ, PY, DU SQ, SS, DS, PO, FC Identifier + Height in Hundreds of Feet Identifier + Height in Hundreds of Feet Identifier + Height in Hundreds of Feet Hundreds of Pascals More information on the cloud cover and weather descriptors can be found in the Surface Weather Observations and Reports Handbook, http://www.ofcm.gov/fmh1/pdf/fmh1.pdf. [2]. If filled data is requested then there will be an asterisk next to the filled value. An easy way to remove the asterisk is to load the data into Microsoft Excel and type the following formula into the cell adjacent to the asterisk. The “XX” is the cell that contains the data. Simply fill this formula, (3), down to the end of the column. = IF ( Right (Trim( XX ),1) ="*", Value( Left (Trim ( XX ), Len(Trim ( XX )) − 1)), XX ) IWEC The IWEC format is based on the field position. The information in the IWEC file is available in the IWEC manual or from the IWEC format file, http://www.eere.energy.gov/buildings/energy_tools/pdfs/iwec_format.pdf. Contact For more information please contact Nicholas Long, [email protected]. Do not e-mail questions to [email protected] because a person does not read these e-mails. 1 If the program does not find a valid GMT offset for the station, then this column will be the same as GMT. 6 (3) FAQ Q. How can I get help? A. First, download the manual, http://www.eere.energy.gov/buildings/energyplus/pdfs/weather_manual.pdf. After reading the manual, if you still have questions you can e-mail Nicholas Long, [email protected]. Do not use [email protected] because a person does not read the e-mails. Q. Why are there multiple files in the e-mail? A. Because there are many variables needed to make this process operate seamlessly, missing data may occur from time to time. If there are more than 48 consecutive hours of missing data, then the data file is closed and a new file is created where the data starts again. Q. What are the available formats for output? A. There are two formats available for output: Comma Separate Values (CSV) and International Weather for Energy Calculations (IWEC). CSV is the raw data separated by commas for easy import into several different spreadsheet programs. IWEC files contain a specific format used by programs to evaluate energy performance of buildings. For more information on IWEC files, visit http://www.eere.energy.gov/buildings/energyplus/weatherdata_sources.html or download the file format from http://www.eere.energy.gov/buildings/energy_tools/pdfs/iwec_format.pdf . Q. What are the units when the data are in CSV format? A. The columns and units in the CSV format are as follows: Table 4. Column and Units of CSV Files Column 1. Local Date and Time 2. Greenwich Mean Time 3. Dry Bulb Temperature 4. Wet Bulb Temperature 5. Wind Direction 6. Wind Speed 7. Wind Gusts 8. Wind Variability 9. Altimeter 10. Visibility 11. Weather Description 12. Weather Precipitation 13. Weather Observation 14. Weather Other 15. Cloud Cover Level 1 16. Cloud Cover Level 2 17. Cloud Cover Level 3 18. Sea Level Pressure 1 Units/Notes MM/DD/YYYY HH:MM1 MM/DD/YYYY HH:MM Tenths of Degree Celsius Tenths of Degree Celsius Degrees (0º = North) Tenths of Meter Per Second Tenths of Meter Per Second Range in Degrees Hundreds of Pascals Tenths of Kilometers MI, BC, PR, TS, BL, SH, DR, F DZ, RA, SN, SG, IC, PL, GR, GS, UP BR, FG, FU, VA, SA, HZ, PY, DU SQ, SS, DS, PO, FC Identifier + Height in Hundreds of Feet Identifier + Height in Hundreds of Feet Identifier + Height in Hundreds of Feet Hundreds of Pascals If the program does not find a valid GMT offset for the station then this column will be the same as GMT. 7 Q. What are the units when the data are in IWEC format? A. The format for the IWEC files are very cryptic, to get a full understanding of IWEC files download the IWEC Manual published by ASHRAE, or download the IWEC format file, http://www.eere.energy.gov/buildings/energy_tools/pdfs/iwec_format.pdf. The units of the data are as follows: Table 5. Column and Units of IWEC Files Entry Local Date and Time Dry Bulb Temperature Wet Bulb Temperature Wind Direction Wind Speed Altimeter Visibility Units/Notes YYYYMMDDHH Tenths of Degree Celsius Tenths of Degree Celsius Degrees (0º = North) Tenths of Meter Per Second Hundreds of Pascals Tenths of Kilometers If the program does not find a valid GMT offset for the station, then the data will state that an error occurred while trying to offset the data. In this instance, all the data is in GMT and should be converted by the user. Also, the hours are from 1 to 24 not 0 to 23. Q. What time zone is the data reported in? A. All the data are stored in Greenwich Mean Time (GMT) but upon retrieval, the program attempts to convert the time steps to local standard time (LST). If the time steps are not converted, it is most likely because the station database did not contain an offset variable for the time zone. Also, when the time steps are not converted, a warning line is inserted into the data file to warn that the steps are incorrect and that they need to be corrected manually. Q. How are missing data filled? A. When there are missing data, the requestor has the option of filling the hole or leaving it blank. If the user requests filled data there are two different routines that operate to smooth the data while a third routine simply breaks the file and leaves the missing data empty. The only data that are filled is the wet bulb and dry bulb temperatures. If the missing period is less then 6 hours, then the data are simply filled linearly. If there are more than 6 hours and less then 48 hours of missing data, then the data are filled by taking the trend of the first valid previous day. The trend is offset by the values that surround the missing data to smooth the filled data. If the missing data covers more than 2 days or 48 hours, then the program creates a new file where the data starts again. The naming convention for the new filename is an underscore and the valid file dates, for example KDEN_20020824-20031015. Note: When filling data, if the wet-bulb temperature is larger than the dry bulb then the program will force the wet bulb to equal the dry bulb. Q. Does the parser check the data to make sure the values seem reasonable? A. No, the parser does not check the data for reasonability. There are cases when the temperature increases or decreases more than a reasonable amount. Manual plotting or subsequent processing on the data sets should be used to determine these values. 8 Q. Can I receive data without having the data filled? A. Yes, when you request the data from the web page make sure the “Fill Missing Time Steps” under “Step 2: Choose Dates and Formats” checkbox is not selected. The data you receive will only contain the data that is stored in the local database. Q. Can I retrieve data without having to use the web interface? A. Yes, to receive data without using the web interface, please refer to the manual, http://www.eere.energy.gov/buildings/energy_tools/pdfs/weather_manual.pdf. The data retrieval is still e-mail based and will require a mail client. Q. What is the asterisk and can I remove it for the data in CSV Format? A. The asterisk indicates that the data point was filled. The best way to remove the asterisks for the filled data is to import all the data into Microsoft Excel, make sure to put the data into individual columns by selecting “Text to columns” under the “Data” menu. Create new columns next to the columns of data that contain the asterisks. In the new columns enter the following formula: =IF(Right(Trim(XX,1)=”*”,Value(Left(Trim(XX),Len(Trim(XX))-1)),XX) (4) Where XX is the cell that contains the first data point with or without the asterisk. Then simply fill this formula down to the end of the column. Q. What is the file naming convention? A. The typical naming convention is the station ID with the start date and end date appended. For example KDEN_20020824-20021015.csv contains data for Denver from August 24, 2002 through October 15, 2002. If you chose to have IWEC information, then if the WMO code is found in the station database, then the station ID is replaced with the WMO code. For example 724760_20020824-20021015.iwc contains the same information as above but in IWEC format. Q. Why are the dates in the file different than the dates I requested? A. If you requested data that were not available in the database, then the dates are automatically adjusted to include any dates that fall within the requested range. Q. What is the source of the data? A. The National Weather Service (NWS) collects weather information from stations across the world in METAR format. There are over 4,000 stations in the world that are currently monitored. This weather information is collected, parsed, and stored into a local database at the National Renewable Energy Laboratory (NREL). 9 Q. How do I interpret the Stations Listing File? A. The station file is comma delimited and contains the following information in each column: Table 6. Station File Format 1. 2. 3. 4. 5. 6. 7. 8. 9. 10. 11. 12. 13. 14. 15. 16. 17. 18. 19. 20. Column Irrelevant Irrelevant Station ID Station Name or Airport Name City State or Providence Country Continent Index Latitude Longitude Elevation in Meters WMO Identifier – IWEC Code Time Zone Offset From GMT First Valid Timestamp Last Valid Timestamp Number of Valid Records Percentage of Valid Records Latitude in Radians Longitude in Radians County Units/Notes ICAO Code If Available Degrees, Minutes Degrees, Minutes Meters Q. What happens if my mail server does not allow large attachments? A. Certain e-mail clients do not allow for large attachments to be sent during peak hours. In this case, the data may take longer to receive. Also, some e-mail clients do not allow for large attachments at all. In this case, the requester should break up the dates to receive smaller files, then piece the files together manually. If you believe your mail client does not allow large attachments, then please wait 24 hours before requesting the data again. References [1] International Weather for Energy Calculations (IWEC Weather Files) User’s Manual. ASHRAE. March 31, 2001. [2] Surface Weather Observations and Reports. FCM-H1-1995. Washington, D.C.: U.S. Department of Commerce/National Oceanic and Atmospheric Administration. December 1995. 10