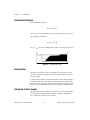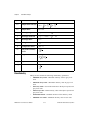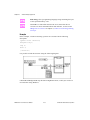
1
IMAQ™ Vision for G Reference Manual IMAQ Vision for G Reference Manual June 1997 Edition Part Number 321379B-01 © Copyright 1996, 1997 National Instruments Corporation. All rights reserved. Internet Support E-mail: [email protected] [email protected] FTP Site: ftp.natinst.com Web Address: http://www.natinst.com Bulletin Board Support BBS United States: (512) 794-5422 BBS United Kingdom: 01635 551422 BBS France: 01 48 65 15 59 Fax-on-Demand Support (512) 418-1111 Telephone Support (U.S.) Tel: (512) 795-8248 Fax: (512) 794-5678 International Offices Australia 03 9879 5166, Austria 0662 45 79 90 0, Belgium 02 757 00 20, Canada (Ontario) 905 785 0085, Canada (Québec) 514 694 8521, Denmark 45 76 26 00, Finland 09 725 725 11, France 01 48 14 24 24, Germany 089 741 31 30, Hong Kong 2645 3186, Israel 03 5734815, Italy 02 413091, Japan 03 5472 2970, Korea 02 596 7456, Mexico 5 520 2635, Netherlands 0348 433466, Norway 32 84 84 00, Singapore 2265886, Spain 91 640 0085, Sweden 08 730 49 70, Switzerland 056 200 51 51, Taiwan 02 377 1200, U.K. 01635 523545 National Instruments Corporate Headquarters 6504 Bridge Point Parkway Austin, TX 78730-5039 Tel: (512) 794-0100 Important Information Warranty The media on which you receive National Instruments software are warranted not to fail to execute programming instructions, due to defects in materials and workmanship, for a period of 90 days from date of shipment, as evidenced by receipts or other documentation. National Instruments will, at its option, repair or replace software media that do not execute programming instructions if National Instruments receives notice of such defects during the warranty period. National Instruments does not warrant that the operation of the software shall be uninterrupted or error free. A Return Material Authorization (RMA) number must be obtained from the factory and clearly marked on the outside of the package before any equipment will be accepted for warranty work. National Instruments will pay the shipping costs of returning to the owner parts which are covered by warranty. National Instruments believes that the information in this manual is accurate. The document has been carefully reviewed for technical accuracy. In the event that technical or typographical errors exist, National Instruments reserves the right to make changes to subsequent editions of this document without prior notice to holders of this edition. The reader should consult National Instruments if errors are suspected. In no event shall National Instruments be liable for any damages arising out of or related to this document or the information contained in it. EXCEPT AS SPECIFIED HEREIN, NATIONAL INSTRUMENTS MAKES NO WARRANTIES, EXPRESS OR IMPLIED, AND SPECIFICALLY DISCLAIMS ANY WARRANTY OF MERCHANTABILITY OR FITNESS FOR A PARTICULAR PURPOSE. CUSTOMER’S RIGHT TO RECOVER DAMAGES CAUSED BY FAULT OR NEGLIGENCE ON THE PART OF NATIONAL INSTRUMENTS SHALL BE LIMITED TO THE AMOUNT THERETOFORE PAID BY THE CUSTOMER . NATIONAL INSTRUMENTS WILL NOT BE LIABLE FOR DAMAGES RESULTING FROM LOSS OF DATA, PROFITS, USE OF PRODUCTS , OR INCIDENTAL OR CONSEQUENTIAL DAMAGES , EVEN IF ADVISED OF THE POSSIBILITY THEREOF . This limitation of the liability of National Instruments will apply regardless of the form of action, whether in contract or tort, including negligence. Any action against National Instruments must be brought within one year after the cause of action accrues. National Instruments shall not be liable for any delay in performance due to causes beyond its reasonable control. The warranty provided herein does not cover damages, defects, malfunctions, or service failures caused by owner’s failure to follow the National Instruments installation, operation, or maintenance instructions; owner’s modification of the product; owner’s abuse, misuse, or negligent acts; and power failure or surges, fire, flood, accident, actions of third parties, or other events outside reasonable control. Copyright Under the copyright laws, this publication may not be reproduced or transmitted in any form, electronic or mechanical, including photocopying, recording, storing in an information retrieval system, or translating, in whole or in part, without the prior written consent of National Instruments Corporation. Trademarks IMAQ™, LabVIEW®, and BridgeVIEW ™ are trademarks of National Instruments Corporation. Product and company names listed are trademarks or trade names of their respective companies. WARNING REGARDING MEDICAL AND CLINICAL USE OF NATIONAL INSTRUMENTS PRODUCTS National Instruments products are not designed with components and testing intended to ensure a level of reliability suitable for use in treatment and diagnosis of humans. Applications of National Instruments products involving medical or clinical treatment can create a potential for accidental injury caused by product failure, or by errors on the part of the user or application designer. Any use or application of National Instruments products for or involving medical or clinical treatment must be performed by properly trained and qualified medical personnel, and all traditional medical safeguards, equipment, and procedures that are appropriate in the particular situation to prevent serious injury or death should always continue to be used when National Instruments products are being used. National Instruments products are NOT intended to be a substitute for any form of established process, procedure, or equipment used to monitor or safeguard human health and safety in medical or clinical treatment. IMAQGTOC.fm Page v Monday, July 7, 1997 12:11 PM Contents About This Manual Organization of This Manual ...........................................................................................xix Conventions Used in This Manual...................................................................................xxi Related Documentation....................................................................................................xxii Customer Communication ...............................................................................................xxii Chapter 1 Algorithms and Principles of Image Files and Data Structures Introduction to Digital Images .........................................................................................1-1 Properties of a Digitized Image .......................................................................................1-1 Image Resolution...............................................................................................1-1 Image Definition................................................................................................1-2 Number of Planes ..............................................................................................1-2 Image Types and Formats................................................................................................1-3 Gray-Level Images ............................................................................................1-3 Color Images .....................................................................................................1-3 Complex Images................................................................................................1-3 Image Files.......................................................................................................................1-5 Processing Color Images .................................................................................................1-5 Image Pixel Frame ...........................................................................................................1-6 Rectangular Frame.............................................................................................1-7 Hexagonal Frame...............................................................................................1-8 Chapter 2 Tools and Utilities Palettes .............................................................................................................................2-1 B&W (Gray) Palette ..........................................................................................2-2 Temperature Palette...........................................................................................2-3 Rainbow Palette.................................................................................................2-3 Gradient Palette .................................................................................................2-3 Binary Palette ....................................................................................................2-4 Image Histogram..............................................................................................................2-4 Definition...........................................................................................................2-4 Linear Histogram...............................................................................................2-5 © National Instruments Corporation v IMAQ Vision for G Reference Manual Contents Cumulative Histogram ...................................................................................... 2-6 Interpretation..................................................................................................... 2-6 Histogram of Color Images............................................................................... 2-6 Histogram Scale ................................................................................................ 2-7 Line Profile ....................................................................................................... 2-7 3D View ............................................................................................................ 2-8 Chapter 3 Lookup Transformations About Lookup Table Transformations ............................................................................ 3-1 Example ............................................................................................................ 3-2 Predefined Lookup Tables............................................................................................... 3-3 Equalize............................................................................................................. 3-4 Example 1 ........................................................................................... 3-4 Example 2 ........................................................................................... 3-5 Reverse.............................................................................................................. 3-6 Example .............................................................................................. 3-6 Logarithmic and Inverse Gamma Correction.................................................... 3-7 Exponential and Gamma Correction................................................................. 3-9 Chapter 4 Operators Concepts and Mathematics.............................................................................................. 4-1 Arithmetic Operators ....................................................................................................... 4-2 Logic Operators ............................................................................................................... 4-2 Truth Tables ...................................................................................................... 4-4 Example 1 ......................................................................................................... 4-5 Example 2 ......................................................................................................... 4-6 Chapter 5 Spatial Filtering Concept and Mathematics ............................................................................................... 5-1 Spatial Filter Classification Summary .............................................................. 5-3 Linear Filters or Convolution Filters............................................................................... 5-3 Gradient Filter ................................................................................................... 5-4 Example .............................................................................................. 5-5 Kernel Definition ................................................................................ 5-5 Filter Axis and Direction .................................................................... 5-6 Examples .............................................................................. 5-7 Edge Extraction and Edge Highlighting ............................................. 5-7 Edge Thickness................................................................................... 5-9 IMAQ Vision for G Reference Manual vi © National Instruments Corporation Contents Predefined Gradient Kernels...............................................................5-10 Prewitt Filters .......................................................................5-10 Sobel Filters ..........................................................................5-11 Laplacian Filters ................................................................................................5-12 Example ..............................................................................................5-12 Kernel Definition ................................................................................5-13 Contour Extraction and Highlighting..................................................5-14 Examples ..............................................................................5-14 Contour Thickness ..............................................................................5-15 Predefined Laplacian Kernels .............................................................5-16 Smoothing Filter................................................................................................5-17 Example ..............................................................................................5-17 Kernel Definition ................................................................................5-18 Examples ..............................................................................5-18 Predefined Smoothing Kernels ...........................................................5-19 Gaussian Filters .................................................................................................5-20 Example ..............................................................................................5-20 Kernel Definition ................................................................................5-21 Predefined Gaussian Kernels ..............................................................5-21 Nonlinear Filters ..............................................................................................................5-22 Nonlinear Prewitt Filter.....................................................................................5-23 Nonlinear Sobel Filter .......................................................................................5-23 Example.............................................................................................................5-24 Nonlinear Gradient Filter ..................................................................................5-25 Roberts Filter .....................................................................................................5-25 Differentiation Filter..........................................................................................5-25 Sigma Filter .......................................................................................................5-26 Lowpass Filter ...................................................................................................5-26 Median Filter .....................................................................................................5-27 Nth Order Filter .................................................................................................5-27 Examples.............................................................................................5-28 Chapter 6 Frequency Filtering Introduction to Frequency Filters ....................................................................................6-1 Lowpass FFT Filters..........................................................................................6-2 Highpass FFT Filters .........................................................................................6-2 Mask FFT Filters ...............................................................................................6-3 Definition .........................................................................................................................6-3 FFT Display .....................................................................................................................6-4 Standard Representation....................................................................................6-6 Optical Representation ......................................................................................6-6 © National Instruments Corporation vii IMAQ Vision for G Reference Manual Contents Frequency Filters ............................................................................................................. 6-7 Lowpass Frequency Filters ............................................................................... 6-7 Lowpass Attenuation .......................................................................... 6-7 Lowpass Truncation ........................................................................... 6-8 Highpass Frequency Filters............................................................................... 6-9 Highpass Attenuation ......................................................................... 6-10 Highpass Truncation........................................................................... 6-10 Chapter 7 Morphology Analysis Thresholding.................................................................................................................... 7-1 Example ............................................................................................................ 7-2 Thresholding a Color Image ............................................................................. 7-3 Automatic Threshold......................................................................................... 7-3 Clustering............................................................................................ 7-3 Example................................................................................ 7-4 Entropy ............................................................................................... 7-6 Metric.................................................................................................. 7-6 Moments ............................................................................................. 7-6 Interclass Variansce ............................................................................ 7-6 Structuring Element......................................................................................................... 7-7 Primary Binary Morphology Functions........................................................................... 7-9 Erosion Function ............................................................................................... 7-9 Concept and Mathematics .................................................................. 7-9 Dilation Function .............................................................................................. 7-9 Concept and Mathematics .................................................................. 7-9 Erosion and Dilation Examples......................................................................... 7-10 Opening Function.............................................................................................. 7-12 Closing Function ............................................................................................... 7-12 Opening and Closing Examples........................................................................ 7-13 External Edge Function..................................................................................... 7-13 Internal Edge Function...................................................................................... 7-13 External and Internal Edge Example ................................................................ 7-14 Hit-Miss Function ............................................................................................. 7-14 Concept and Mathematics .................................................................. 7-15 Example 1 ........................................................................................... 7-15 Example 2 ........................................................................................... 7-16 Thinning Function............................................................................................. 7-17 Examples ............................................................................................ 7-17 Thickening Function ......................................................................................... 7-18 Examples ............................................................................................ 7-19 Proper-Opening Function.................................................................................. 7-20 IMAQ Vision for G Reference Manual viii © National Instruments Corporation Contents Proper-Closing Function ...................................................................................7-21 Auto-Median Function ......................................................................................7-21 Advanced Binary Morphology Functions........................................................................7-22 Border Function.................................................................................................7-22 Hole Filling Function ........................................................................................7-22 Labeling Function..............................................................................................7-23 Lowpass Filters..................................................................................................7-23 Highpass Filters .................................................................................................7-24 Lowpass and Highpass Example .......................................................................7-24 Separation Function...........................................................................................7-25 Skeleton Functions ............................................................................................7-26 L-Skeleton Function............................................................................7-26 M-Skeleton Function...........................................................................7-27 Skiz Function ......................................................................................7-27 Segmentation Function......................................................................................7-27 Comparisons Between Segmentation and Skiz Functions ..................7-28 Distance Function..............................................................................................7-29 Danielsson Function ..........................................................................................7-29 Example ..............................................................................................7-29 Circle Function ..................................................................................................7-30 Example ..............................................................................................7-31 Convex Function ...............................................................................................7-31 Example ..............................................................................................7-32 Gray-Level Morphology ..................................................................................................7-32 Erosion Function ...............................................................................................7-33 Concept and Mathematics...................................................................7-33 Dilation Function...............................................................................................7-33 Concept and Mathematics...................................................................7-33 Erosion and Dilation Examples .........................................................................7-34 Opening Function ..............................................................................................7-34 Closing Function ...............................................................................................7-35 Opening and Closing Examples ........................................................................7-35 Proper-Opening Function ..................................................................................7-36 Proper-Closing Function ...................................................................................7-37 Auto-Median Function ......................................................................................7-38 Chapter 8 Quantitative Analysis Spatial Calibration ...........................................................................................................8-1 Intensity Calibration ........................................................................................................8-2 Definition of a Digital Object ..........................................................................................8-2 Intensity Threshold............................................................................................8-2 © National Instruments Corporation ix IMAQ Vision for G Reference Manual Contents Connectivity ...................................................................................................... 8-3 Connectivity-8 .................................................................................... 8-3 Connectivity-4 .................................................................................... 8-4 Area Threshold.................................................................................................. 8-4 Object Measurements ...................................................................................................... 8-5 Areas ................................................................................................................. 8-5 Particle Number .................................................................................. 8-5 Number of Pixels ................................................................................ 8-5 Particle Area ....................................................................................... 8-5 Scanned Area ...................................................................................... 8-6 Ratio.................................................................................................... 8-6 Number of Holes ................................................................................ 8-6 Holes’ Area......................................................................................... 8-6 Total area ............................................................................................ 8-6 Lengths.............................................................................................................. 8-7 Particle Perimeter ............................................................................... 8-7 Holes’ Perimeter ................................................................................. 8-7 Breadth................................................................................................ 8-7 Height ................................................................................................. 8-8 Coordinates ....................................................................................................... 8-8 Center of Mass X and Center of Mass Y............................................ 8-8 Min(X, Y) and Max(X, Y).................................................................. 8-9 Max Chord X and Max Chord Y ........................................................ 8-9 Chords and Axes ............................................................................................... 8-9 Max Chord Length.............................................................................. 8-10 Mean Chord X .................................................................................... 8-10 Mean Chord Y .................................................................................... 8-10 Max Intercept...................................................................................... 8-10 Mean Intercept Perpendicular............................................................. 8-10 Particle Orientation............................................................................. 8-10 Shape Equivalence ............................................................................................ 8-11 Equivalent Ellipse Minor Axis ........................................................... 8-12 Ellipse Major Axis.............................................................................. 8-12 Ellipse Minor Axis.............................................................................. 8-13 Ellipse Ratio ....................................................................................... 8-13 Rectangle Big Side ............................................................................. 8-13 Rectangle Small Side.......................................................................... 8-14 Rectangle Ratio................................................................................... 8-14 Shape Features .................................................................................................. 8-14 Moments of Inertia Ixx, Iyy, Ixy ........................................................ 8-14 Elongation Factor ............................................................................... 8-15 Compactness Factor............................................................................ 8-15 Heywood Circularity Factor ............................................................... 8-15 IMAQ Vision for G Reference Manual x © National Instruments Corporation Contents Hydraulic Radius.................................................................................8-15 Waddel Disk Diameter........................................................................8-16 Definitions of Primary Measurements..................................8-16 Derived Measurements .........................................................8-17 Densitometry .....................................................................................................8-18 Diverse Measurements ......................................................................................8-19 Chapter 9 VI Overview and Programming Concepts Images ..............................................................................................................................9-1 IMAQ Vision VIs ............................................................................................................9-2 Image-Type Icons..............................................................................................9-2 MMX Compatibility of IMAQ Vision for G.....................................................9-3 About Intel MMX Technology ...........................................................9-3 Overview of MMX Features in IMAQ Vision for G ..........................9-4 MMX Icon...........................................................................................9-4 IMAQ VI Error Clusters....................................................................................9-4 Base and Advanced Versions of IMAQ Vision ................................................9-6 VIs in the Base and Advanced Versions .............................................9-6 VIs in the Advanced Version Only .....................................................9-7 Manipulation of Images by IMAQ Vision.......................................................................9-9 Rectangle.............................................................................................9-14 Line .....................................................................................................9-14 Table of pixels.....................................................................................9-15 Connectivity 4/8..................................................................................9-15 Structuring Element ............................................................................9-16 Square/Hexa ........................................................................................9-16 Chapter 10 Management VIs IMAQ Create.......................................................................................10-1 IMAQ Create&LockSpace..................................................................10-3 IMAQ Dispose ....................................................................................10-4 IMAQ Error.........................................................................................10-5 IMAQ Status .......................................................................................10-6 Chapter 11 File VIs IMAQ ReadFile...................................................................................11-1 IMAQ GetFileInfo ..............................................................................11-4 IMAQ WriteFile..................................................................................11-5 © National Instruments Corporation xi IMAQ Vision for G Reference Manual Contents Chapter 12 Display Introduction ..................................................................................................................... 12-1 Display (Basics)............................................................................................................... 12-2 IMAQ WindDraw............................................................................... 12-2 IMAQ WindClose............................................................................... 12-4 IMAQ WindShow............................................................................... 12-5 IMAQ WindMove .............................................................................. 12-6 IMAQ WindSize................................................................................. 12-7 IMAQ GetPalette ................................................................................ 12-8 IMAQ PaletteTolerance (Macintosh/Power Macintosh only)............ 12-9 Display (Tools)................................................................................................................ 12-10 IMAQ WindToolsSetup ..................................................................... 12-12 IMAQ WindToolsSelect..................................................................... 12-14 IMAQ WindToolsShow ..................................................................... 12-16 IMAQ WindToolsMove ..................................................................... 12-17 IMAQ WindToolsClose ..................................................................... 12-18 IMAQ WindLastEvent ....................................................................... 12-18 IMAQ WindZoom .............................................................................. 12-21 IMAQ WindGrid ................................................................................ 12-22 Regions of Interest........................................................................................................... 12-23 IMAQ WindGetROI ........................................................................... 12-24 IMAQ WindSetROI............................................................................ 12-25 IMAQ WindEraseROI ........................................................................ 12-26 IMAQ ROIToMask ............................................................................ 12-27 IMAQ MaskToROI ............................................................................ 12-28 Display (User) ................................................................................................................. 12-29 IMAQ WindUserSetup ....................................................................... 12-29 IMAQ WindUserStatus ...................................................................... 12-30 IMAQ WindUserShow ....................................................................... 12-31 IMAQ WindUserMove....................................................................... 12-32 IMAQ WindUserClose ....................................................................... 12-33 IMAQ WindUserEvent....................................................................... 12-33 Display (Special) ............................................................................................................. 12-34 IMAQ WindSetup............................................................................... 12-34 IMAQ WindGetMouse ....................................................................... 12-35 IMAQ WindROIColor........................................................................ 12-36 IMAQ WindDrawRect ....................................................................... 12-37 IMAQ GetScreenSize ......................................................................... 12-37 IMAQ WindXYZoom ........................................................................ 12-38 IMAQ SetUserPen .............................................................................. 12-40 IMAQ GetUserPen ............................................................................. 12-42 IMAQ Vision for G Reference Manual xii © National Instruments Corporation Contents IMAQ SetupBrush ..............................................................................12-43 IMAQ GetLastKey..............................................................................12-46 Chapter 13 Tool VIs Tools (Image)...................................................................................................................13-1 IMAQ Copy ........................................................................................13-1 IMAQ GetImageSize ..........................................................................13-2 IMAQ SetImageSize ...........................................................................13-3 IMAQ Extract .....................................................................................13-4 IMAQ Expand.....................................................................................13-5 IMAQ GetOffset .................................................................................13-7 IMAQ SetOffset ..................................................................................13-9 IMAQ Resample .................................................................................13-10 IMAQ GetCalibration .........................................................................13-11 IMAQ SetCalibration..........................................................................13-12 IMAQ ImageToImage.........................................................................13-14 Tools (Pixel) ....................................................................................................................13-16 IMAQ GetPixelValue .........................................................................13-16 IMAQ SetPixelValue ..........................................................................13-17 IMAQ GetPixelLine............................................................................13-18 IMAQ GetRowCol ..............................................................................13-19 IMAQ SetPixelLine ............................................................................13-20 IMAQ SetRowCol...............................................................................13-21 IMAQ ImageToArray .........................................................................13-22 IMAQ ArrayToImage .........................................................................13-23 Tools (Diverse) ................................................................................................................ 13-24 IMAQ ImageToClipboard...................................................................13-24 IMAQ ClipboardToImage...................................................................13-25 IMAQ Draw ........................................................................................13-26 IMAQ DrawText.................................................................................13-27 IMAQ MagicWand .............................................................................13-30 IMAQ FillImage .................................................................................13-31 Chapter 14 Conversion VIs IMAQ Convert ....................................................................................14-1 IMAQ Cast..........................................................................................14-3 IMAQ ConvertByLookup ...................................................................14-4 IMAQ Shift16to8 ................................................................................14-5 © National Instruments Corporation xiii IMAQ Vision for G Reference Manual Contents Chapter 15 Operator VIs Arithmetic Operators ....................................................................................................... 15-1 IMAQ Add.......................................................................................... 15-1 IMAQ Subtract ................................................................................... 15-2 IMAQ Multiply................................................................................... 15-4 IMAQ Divide...................................................................................... 15-5 IMAQ MulDiv .................................................................................... 15-7 IMAQ Modulo .................................................................................... 15-8 Logic Operators ............................................................................................................... 15-10 IMAQ And.......................................................................................... 15-10 IMAQ Or ............................................................................................ 15-11 IMAQ Xor .......................................................................................... 15-12 IMAQ LogDiff ................................................................................... 15-13 IMAQ Compare .................................................................................. 15-15 IMAQ Mask........................................................................................ 15-17 Chapter 16 Processing VIs IMAQ Threshold ................................................................................ 16-1 IMAQ MultiThreshold ....................................................................... 16-2 IMAQ AutoBThreshold...................................................................... 16-4 IMAQ AutoMThreshold..................................................................... 16-5 IMAQ UserLookup............................................................................. 16-7 IMAQ MathLookup............................................................................ 16-8 IMAQ Equalize................................................................................... 16-11 IMAQ Label ....................................................................................... 16-13 Chapter 17 Filter VIs IMAQ Convolute ................................................................................ 17-2 IMAQ GetKernel ................................................................................ 17-3 Example................................................................................ 17-5 IMAQ BuildKernel............................................................................. 17-5 IMAQ EdgeDetection......................................................................... 17-6 IMAQ NthOrder ................................................................................. 17-8 IMAQ LowPass .................................................................................. 17-10 IMAQ Correlate.................................................................................. 17-11 IMAQ Vision for G Reference Manual xiv © National Instruments Corporation Contents Chapter 18 Morphology VIs IMAQ Morphology .............................................................................18-3 IMAQ GrayMorphology .....................................................................18-5 IMAQ Distance ...................................................................................18-7 IMAQ Danielsson ...............................................................................18-8 IMAQ RemoveParticle .......................................................................18-9 IMAQ FillHole....................................................................................18-10 IMAQ RejectBorder............................................................................18-11 IMAQ Convex.....................................................................................18-12 IMAQ Circles......................................................................................18-13 IMAQ Segmentation ...........................................................................18-14 IMAQ Skeleton ...................................................................................18-15 IMAQ Separation................................................................................18-17 Chapter 19 Analysis VIs IMAQ Histogram ................................................................................19-1 IMAQ Histograph ...............................................................................19-3 IMAQ LineProfile...............................................................................19-6 IMAQ LinearAverages .......................................................................19-8 IMAQ Quantify...................................................................................19-9 IMAQ Centroid ...................................................................................19-10 IMAQ BasicParticle............................................................................19-11 IMAQ ComplexParticle ......................................................................19-13 IMAQ ComplexMeasure.....................................................................19-15 IMAQ ChooseMeasurements..............................................................19-20 Chapter 20 Geometry VIs IMAQ 3DView ...................................................................................20-1 IMAQ Rotate.......................................................................................20-4 IMAQ Shift .........................................................................................20-5 IMAQ Symmetry ................................................................................20-7 Chapter 21 Complex VIs IMAQ FFT ..........................................................................................21-2 IMAQ InverseFFT ..............................................................................21-3 IMAQ ComplexFlipFrequency ...........................................................21-4 © National Instruments Corporation xv IMAQ Vision for G Reference Manual Contents IMAQ ComplexConjugate ................................................................. 21-5 IMAQ ComplexAttenuate .................................................................. 21-6 IMAQ ComplexTruncate.................................................................... 21-7 IMAQ ComplexAdd ........................................................................... 21-8 IMAQ ComplexSubtract..................................................................... 21-9 IMAQ ComplexMultiply .................................................................... 21-11 IMAQ ComplexDivide ....................................................................... 21-12 IMAQ ComplexImageToArray .......................................................... 21-14 IMAQ ArrayToComplexImage .......................................................... 21-15 IMAQ ComplexPlaneToArray ........................................................... 21-16 IMAQ ArrayToComplexPlane ........................................................... 21-17 IMAQ ComplexPlaneToImage........................................................... 21-18 IMAQ ImageToComplexPlane........................................................... 21-19 Chapter 22 Color VIs Color Planes Inversion [PC]............................................................................................ 22-2 IMAQ ExtractColorPlanes ................................................................. 22-4 IMAQ ReplaceColorPlane.................................................................. 22-5 IMAQ ColorHistogram....................................................................... 22-7 IMAQ ColorHistograph...................................................................... 22-9 IMAQ ColorThreshold ....................................................................... 22-11 IMAQ ColorUserLookup ................................................................... 22-13 IMAQ ColorEqualize ......................................................................... 22-15 IMAQ GetColorPixelValue ................................................................ 22-16 IMAQ SetColorPixelValue................................................................. 22-17 IMAQ GetColorPixelLine .................................................................. 22-18 IMAQ SetColorPixelLine................................................................... 22-20 IMAQ ColorImageToArray................................................................ 22-21 IMAQ ArrayToColorImage................................................................ 22-22 IMAQ RGBToColor........................................................................... 22-23 IMAQ IntegerToColorValue .............................................................. 22-24 IMAQ ColorValueToInteger .............................................................. 22-26 Chapter 23 External Library Support VIs IMAQ GetImagePixelPtr .................................................................... 23-1 Example................................................................................ 23-4 IMAQ CharPtrToString ...................................................................... 23-6 IMAQ MemPeek ................................................................................ 23-7 Example................................................................................ 23-8 IMAQ Interlace................................................................................... 23-9 IMAQ Vision for G Reference Manual xvi © National Instruments Corporation Contents IMAQ ImageBorderOperation............................................................23-10 IMAQ ImageBorderSize .....................................................................23-11 Appendix A Customer Communication Glossary Index Figures Figure 1-1. Figure 1-2. Figure 2-1. Figure 2-2. Figure 2-3. Figure 2-4. Rectangular Frame ..................................................................................1-7 Hexagonal Frame ....................................................................................1-8 Linear Vertical Scale ...............................................................................2-5 Linear Cumulative Scale .........................................................................2-6 Linear Vertical Scale ...............................................................................2-7 Logarithmic Vertical Scale......................................................................2-7 Tables Table 5-1. Table 5-2. Table 5-3. Table 5-4. Table 5-5. Table 5-6. Table 5-7. Table 5-8. Table 5-9. Table 5-10. Table 5-11. Table 5-12. Table 5-13. Prewitt Filters ..........................................................................................5-10 Sobel Filters.............................................................................................5-11 Gradient 5 × 5..........................................................................................5-12 Gradient 7 × 7..........................................................................................5-12 Laplacian 3 × 3 ........................................................................................5-16 Laplacian 5 × 5 ........................................................................................5-17 Laplacian 7 × 7 ........................................................................................5-17 Smoothing 3 × 3 ......................................................................................5-19 Smoothing 5 × 5 ......................................................................................5-20 Smoothing 7 × 7 ......................................................................................5-20 Gaussian 3 × 3 .........................................................................................5-21 Gaussian 5 × 5 .........................................................................................5-22 Gaussian 7 × 7 .........................................................................................5-22 © National Instruments Corporation xvii IMAQ Vision for G Reference Manual About This Manual The IMAQ Vision for G Reference Manual describes the features, functions, and operation of IMAQ Vision for G. To use this manual effectively, you should be familiar with image processing, your image capture hardware, and LabVIEW or BridgeVIEW. Organization of This Manual The IMAQ Vision for G Reference Manual is organized as follows: • Chapter 1, Algorithms and Principles of Image Files and Data Structures, contains an overview of image files and data structures. • Chapter 2, Tools and Utilities, describes the tools and utilities used in IMAQ Vision. • Chapter 3, Lookup Transformations, provides an overview of lookup table transformations. • Chapter 4, Operators, describes the arithmetic and logic operators used in IMAQ Vision. • Chapter 5, Spatial Filtering, provides an overview of the spatial filters, including linear and nonlinear filters, used in IMAQ Vision. • Chapter 6, Frequency Filtering, describes the frequency filters used in IMAQ Vision. • Chapter 7, Morphology Analysis, provides an overview of morphology image analysis. • Chapter 8, Quantitative Analysis, provides an overview of quantitative image analysis. • Chapter 9, IMAQ Vision Programming Concepts, contains an overview of IMAQ Vision programming concepts, a description of the Base and Advanced versions of IMAQ Vision, and a listing of the VIs included in these versions. It also provides a summary of the icons used in the function reference chapters of this manual. • Chapter 10, Management VIs, describes the Management VIs in IMAQ Vision. • Chapter 11, File VIs, describes the File VIs in IMAQ Vision. © National Instruments Corporation xix IMAQ Vision for G Reference Manual About This Manual • Chapter 12, Display VIs, describes various Display VIs in IMAQ Vision. • Chapter 13, Tool VIs, describes the image, pixel, and diverse Tool VIs in IMAQ Vision. • Chapter 14, Conversion VIs, describes the Conversion VIs in IMAQ Vision. • Chapter 15, Operator VIs, describes the Operator VIs in IMAQ Vision. • Chapter 16, Processing VIs, describes the Processing VIs i n IMAQ Vision. • Chapter 17, Filter VIs, describes the Filter VIs in IMAQ Vision. • Chapter 18, Morphology VIs, describes the Morphology VIs in IMAQ Vision. • Chapter 19, Analysis VIs, describes the Analysis VIs in IMAQ Vision. • Chapter 20, Geometry VIs, describes the Geometry VIs in IMAQ Vision. • Chapter 21, Complex VIs, describes the Complex VIs in IMAQ Vision. • Chapter 22, Color VIs, describes the Color VIs in IMAQ Vision. • Chapter 23, External Library Support VIs, describes the External Library Support VIs in IMAQ Vision. • Appendix A, Customer Communication, contains forms you can use to request help from National Instruments or to comment on our products and manuals. • The Glossary contains an alphabetical list and description of terms used in this manual, including abbreviations, acronyms, metric prefixes, mnemonics, and symbols. • The Index contains an alphabetical list of key terms and topics in this manual, including the page where you can find each one. IMAQ Vision for G Reference Manual xx © National Instruments Corporation About This Manual Conventions Used in This Manual The following conventions are used in this manual: bold Bold text denotes the names of menus, menu items, parameters, dialog box buttons or options, icons, Windows 95 tabs, or LEDs. italic Italic text denotes variables, emphasis, a cross reference, or an introduction to a key concept. bold italic Bold italic text denotes an activity objective, note, caution, or warning. monospace Text in this font denotes text or characters that you should literally enter from the keyboard, sections of code, programming examples, and syntax examples. This font also is used for the proper names of disk drives, paths, directories, programs, subprograms, subroutines, device names, filenames, and extensions, and for statements and comments taken from program code. bold monospace Bold text in this font denotes the messages and responses that the computer automatically prints to the screen. This font also emphasizes lines of code that are different from the other examples. <> Angle brackets enclose the name of a key on the keyboard—for example, <PageDown>. - A hyphen between two or more key names enclosed in angle brackets denotes that you should simultaneously press the named keys—for example, <Control-Alt-Delete>. <Control> Key names are capitalized. » The » symbol leads you through nested menu items and dialog box options to a final action. The sequence File»Page Setup»Options»Substitute Fonts directs you to pull down the File menu, select the Page Setup item, select Options, and finally select the Substitute Fonts option from the last dialog box. paths Paths in this manual are denoted using backslashes (\) to separate drive names, directories, and files, as in C:\dir1name\dir2name\filename. This icon to the left of bold italicized text denotes a note, which alerts you to important information. The Glossary lists abbreviations, acronyms, metric prefixes, mnemonics, symbols, and terms. © National Instruments Corporation xxi IMAQ Vision for G Reference Manual About This Manual Related Documentation The following documents contain information that you may find helpful as you read this manual: • LabVIEW User Manual • LabVIEW Tutorial • BridgeVIEW User Manual • G Programming Reference Manual Customer Communication National Instruments wants to receive your comments on our products and manuals. We are interested in the applications you develop with our products, and we want to help if you have problems with them. To make it easy for you to contact us, this manual contains comment and configuration forms for you to complete. These forms are in Appendix A, Customer Communication, at the end of this manual. IMAQ Vision for G Reference Manual xxii © National Instruments Corporation Algorithms and Principles of Image Files and Data Structures Chapter 1 This chapter describes the algorithms and principles of image files and data structures. Introduction to Digital Images An image is a function of the light intensity f(x, y) where f is the brightness of the point (x, y), and x and y represent the spatial coordinates of a picture element (abbreviated pixel). By default the spatial reference of the pixel with the coordinates (0, 0) is located at the upper-left corner of the image. In digital image processing, an acquisition device converts an image into a discrete number of pixels. This device assigns a numeric location and gray-level value which specifies the brightness of pixels. Properties of a Digitized Image A digitized image has three basic properties: image resolution, image definition, and number of planes. Image Resolution The spatial resolution of an image is its number of rows and columns of pixels. An image composed of m rows and n columns has a resolution of mn. This image has n pixels along its horizontal axis and m pixels along its vertical axis. © National Instruments Corporation 1-1 IMAQ Vision for G Reference Manual Chapter 1 Algorithms and Principles of Image Files and Data Structures Image Definition The definition of an image, also called pixel depth, indicates the number of colors or shades that you can see in the image. Pixel depth is the number of bits used to code the intensity of a pixel. For a given definition of n, a pixel can take 2n different values. For example, if n equals 8-bits, a pixel can take 256 different values ranging from 0 to 255. If n equals 16 bits, a pixel can take 65,536 different values ranging from 0 to 65,535 or –32,768 to 32,767. Number of Planes The number of planes in an image is the number of arrays of pixels that compose the image. A gray-level or pseudo-color image is composed of one plane, while a true-color image is composed of three planes (one for the red component, one for the blue, and one for the green), as shown in the following figure. In gray-level images, the red, green, and blue intensities (RGB) of a pixel combine to produce a single value. This single value is converted back to an RGB intensity when displayed on a monitor. This conversion is performed by a color lookup table (CLUT) transformation. In three-plane or true color images, the red, green, and blue intensities of a pixel are coded into three different values. The image is the combination of three arrays of pixels corresponding to the red, green, and blue components. IMAQ Vision for G Reference Manual 1-2 © National Instruments Corporation Chapter 1 Algorithms and Principles of Image Files and Data Structures Image Types and Formats The IMAQ Vision libraries can manipulate three types of images: gray-level, color, and complex images. Gray-Level Images Gray-level images are composed of a single plane of pixels. Standard gray-level formats are 8-bit PICT (Macintosh only), BMP (PC only), TIFF, RASTR, and AIPD. Standard 16-bit gray-level formats are TIFF and AIPD. AIPD is an internal file format that offers the advantage of storing the spatial calibration of an image. Gray-level images that use other formats and have a pixel depth of 8-bit, 16-bit or 32-bit can be imported into the IMAQ Vision libraries. Color Images Color images are composed of three planes of pixels in which each pixel has a red, green, and blue intensity, each coded on 8-bit planes. Color images coded using the RGB-chunky standard contain an extra 8-bit plane, called the alpha channel. These images have a definition of 32-bit or 4 × 8-bit. Standard color formats are PICT, BMP, TIFF and AIPD. Complex Images Complex images are composed of complex data in which pixel values have a real part and an imaginary part. Such images are derived from the Fast Fourier Transform of gray-level images. Four representations of a complex image can be given: the real part, imaginary part, magnitude, and phase. The following table shows how many bytes are used per pixel in graylevel, color, and complex images. For an identical spatial resolution, a color image occupies four times the memory space used by an 8-bit © National Instruments Corporation 1-3 IMAQ Vision for G Reference Manual Chapter 1 Algorithms and Principles of Image Files and Data Structures gray-level image and a complex image occupies eight times this amount. Image Type Number of Bytes Per Pixel Data 8-bit (Unsigned) Integer Gray-Level (1 byte or 8-bit) 8-bit for the gray-level intensity 16-bit (Signed) Integer Gray-Level (2 bytes or 16-bit) 16-bit for the gray-level intensity 32-bit FloatingPoint Gray-Level (4 bytes or 32-bit) 32-bit floating for the gray-level intensity Color (3 bytes or 24-bit) 8-bit for the alpha value (not used) 8-bit for the red intensity 8-bit for the green intensity 8-bit for the blue intensity Complex (8 bytes or 64-bit) 32-bit floating for the real part IMAQ Vision for G Reference Manual 1-4 32-bit floating for the imaginary part © National Instruments Corporation Chapter 1 Algorithms and Principles of Image Files and Data Structures Image Files An image file is composed of a header followed by pixel values. Depending on the file format, the header contains information such as the image horizontal and vertical resolution, its pixel definition, the physical calibration, and the original palette. Processing Color Images Most image-processing and analysis functions apply to 8-bit images. However, you also can process color images by manipulating their color components individually. You can break down a color image into various sets of primary components such as RGB (red, green, and blue), HSL (hue, saturation, and lightness), or HSV (hue, saturation, and value). Each component becomes an 8-bit image and can be processed as any gray-level image. © National Instruments Corporation 1-5 IMAQ Vision for G Reference Manual Chapter 1 Algorithms and Principles of Image Files and Data Structures You can reassemble a color image later from a set of three 8-bit images taking the place of its RGB, HSL, or HSV components. Image Pixel Frame As introduced earlier, a digital image is a two-dimensional array of pixel values. Using this definition, you might assume that pixels are arranged in a regular rectangular frame. However from an image processing point of view you can consider another grid arrangement, such as a hexagonal pixel frame which offers the advantage that the six neighbors of a pixel are equidistant. The pixels in an image are arranged in a rectangular grid. However, some image processing algorithms can reproduce a hexagonal neighborhood using the representations illustrated in the following table. The pixels considered as neighbors of the given pixel (shown in solid) are indicated by the shaded pattern. IMAQ Vision for G Reference Manual 1-6 © National Instruments Corporation Chapter 1 Algorithms and Principles of Image Files and Data Structures Pixel Frame Neighborhood Size Rectangular 3×3 5×5 7×7 Hexagonal 5×3 7×5 9×7 Rectangular Frame Each pixel is surrounded by eight neighbors. Figure 1-1. Rectangular Frame If d is the distance from the vertical and horizontal neighbors to the central pixel, then the diagonal neighbors are at a distance of 2d from the central pixel. © National Instruments Corporation 1-7 IMAQ Vision for G Reference Manual Chapter 1 Algorithms and Principles of Image Files and Data Structures Hexagonal Frame Each pixel is surrounded by six neighbors. Each neighbor is found at an equal distance d from the central pixel. Figure 1-2. Hexagonal Frame This notion of pixel frame is important for a category of image processing functions called neighborhood operations. These functions alter the value of pixels depending on the intensity values of their neighbors. They include spatial filters, which alter the intensity of a pixel with respect to variations in intensities of neighboring pixels, and morphological transformations, which extract and alter the structure of objects in an image. IMAQ Vision for G Reference Manual 1-8 © National Instruments Corporation Chapter 2 Tools and Utilities This chapter describes the tools and utilities used in IMAQ Vision. Palettes At the time an image is displayed on the screen, the value of each pixel is converted into a red, green, and blue intensity which produces a color. This conversion is defined in a table called color lookup table (CLUT). For 8-bit images, it associates a color to each gray-level value and produces a gradation of colors, called a palette. With palettes, you can produce different visual representations of an image without altering the pixel data. Palettes can generate effects such as a photonegative display or color-coded displays. In the latter case, palettes are useful for detailing particular image constituents in which the total number of colors are limited. Displaying images in different palettes helps emphasize regions with particular intensities, identify smooth or abrupt gray-level variations, and convey details that might be lost in a gray-scale image. In the case of 8-bit resolution, pixels can take 28 or 256 values ranging from 0 to 255. A black and white palette associates different shades of gray to each value so as to produce a linear and continuous gradation of gray, from black to white. At this point, the palette can be set up to assign the color black to the value 0 and white to 255, or vice versa. Other palettes can reflect linear or nonlinear gradations going from red to blue, light brown to dark brown, and so forth. The gray-level value of a pixel acts as an address that is indexed into three tables, with three values corresponding to a red, green, and blue (RGB) intensity. This set of three conversion tables defines a palette in © National Instruments Corporation 2-1 IMAQ Vision for G Reference Manual Chapter 2 Tools and Utilities which varying amounts of red, green, and blue are mixed to produce a color representation of the value range [0, 255]. Five pseudo-color palettes are predefined in the programs and libraries. Each palette emphasizes different shades of gray. However, they all use the following conventions: • Gray level 0 is assigned to black. • Gray level 255 is assigned to white. Because of these conventions, you can associate bright areas to the presence of pixels with high gray-level values, and dark areas to the presence of pixels with low gray-level values. The following sections introduce the five predefined palettes. The graphs in each section represent the three RGB lookup tables used by each palette. The horizontal axes of the graphs represent the input gray-level range [0, 255], while the vertical axes give the RGB intensities assigned to a given gray-level value. B&W (Gray) Palette This palette has a gradual gray-level variation from black to white. Each value is assigned to an equal amount of the RGB intensities. IMAQ Vision for G Reference Manual 2-2 © National Instruments Corporation Chapter 2 Tools and Utilities Temperature Palette This palette has a gradation from light brown to dark brown. 0 is black and 255 is white. Rainbow Palette This palette has a gradation from blue to red with a prominent range of greens in the middle value range. 0 is black and 255 is white. Gradient Palette This palette has a gradation from red to white with a prominent range of light blue in the upper value range. 0 is black and 255 is white. © National Instruments Corporation 2-3 IMAQ Vision for G Reference Manual Chapter 2 Tools and Utilities Binary Palette This palette has 16 cycles of 16 different colors, where g is the gray-level value and g = 0 corresponds to R = 0, G = 0, B = 0, which appears black; g = 1 corresponds to R = 1, G = 0, B = 0,which appears red; g = 2 corresponds to R = 0, G = 1, B = 0 which appears green; and so forth. This periodic palette is appropriate for the display of binary and labeled images. Image Histogram The histogram of an image indicates the quantitative distribution of pixels per gray-level value. It provides a general description of the appearance of an image and helps identify various components such as the background, objects, and noise. Definition The histogram is the function H defined on the gray-scale range [0, …, k, …, 255] such that the number of pixels equal to the gray-level value k is H(k) = nk where k is the gray-level value, nk is the number of pixels in an image with a gray-level value equal to k, and ∑ nk = n is the total number of pixels in an image. IMAQ Vision for G Reference Manual 2-4 © National Instruments Corporation Chapter 2 Tools and Utilities The following histogram plot reveals which gray levels occur frequently and which occur rarely. Two types of histograms can be plotted per image: the linear and cumulative histograms. In both cases, the horizontal axis represents the gray-level range from 0 to 255. For a gray-level value k, the vertical axis of the linear histogram indicates the number of pixels nk set to the value k, and the vertical axis of the cumulative histogram indicates the percentage of pixels set to a value less than or equal to k. Linear Histogram The density function is HLinear(k) = nk where HLinear(k) is the number of pixels equal to k. The probability function is PLinear(k) = nk /n where PLinear(k) is the probability that a pixel is equal to k. Figure 2-1. Linear Vertical Scale © National Instruments Corporation 2-5 IMAQ Vision for G Reference Manual Chapter 2 Tools and Utilities Cumulative Histogram The distribution function is k HCumul(k)= ∑ nk 0 where HCumul(k) is the number of pixels that are less than or equal to k. The probability function is k PCumul(k) = nk ∑ ----n0 where PCumul(k) is the probability that a pixel is less than or equal to k. Figure 2-2. Linear Cumulative Scale Interpretation The gray-level intervals with a concentrated set of pixels reveal the presence of significant components in the image and their respective intensity ranges. In the previous example, the linear histogram reveals that the image is composed of three major elements. The cumulative histogram shows that the two left-most peaks compose approximately 80 percent of the image, while the remaining 20 percent corresponds to the third peak. Histogram of Color Images The histogram of a color image is expressed as a series of three tables corresponding to the histograms of the three primary components (R, G, and B; H, S, and L; or H, S, and V). IMAQ Vision for G Reference Manual 2-6 © National Instruments Corporation Chapter 2 Tools and Utilities Histogram Scale The vertical axis of a histogram plot can be shown in a linear or logarithmic scale. A logarithmic scale lets you visualize gray-level values used by small numbers of pixels. These values might appear unused when the histogram is displayed in a linear scale. In the case of a logarithmic scale, the vertical axis of the histogram gives the logarithm of the number of pixels per gray-level value. The use of minor gray-level values is made more prominent at the expense of the dominant gray-level values. The following two figures illustrate the difference between the display of the histogram of the same image in a linear and logarithmic scale. In this particular image, three pixels are equal to 0. This information is unobservable in the linear representation of the histogram but evident in the logarithmic representation. Figure 2-3. Linear Vertical Scale Figure 2-4. Logarithmic Vertical Scale Line Profile A line profile plots the variations of intensity along a line. This utility is helpful for examining boundaries between components, quantifying © National Instruments Corporation 2-7 IMAQ Vision for G Reference Manual Chapter 2 Tools and Utilities the magnitude of intensity variations, and detecting the presence of repetitive patterns. The following figure illustrates a line profile. The peaks and valleys reveal increases and decreases of the light intensity along the line selected in the image. Their width and magnitude are proportional to the size and intensity of their related regions. For example, a bright object with uniform intensity appears in the plot as a plateau. The higher the contrast between an object and its surrounding background, the steeper the slopes of the plateau. Noisy pixels, on the other hand, produce a series of narrow peaks. 3D View The 3D view illustrated in the following graphic displays a three-dimensional perspective of the light intensity in an image. It gives a relief map of the image in which high-intensity values are associated to summits and low-intensity values are associated to valleys. IMAQ Vision for G Reference Manual 2-8 © National Instruments Corporation Chapter 3 Lookup Transformations This chapter provides an overview of lookup table transformations. About Lookup Table Transformations The lookup table (LUT) transformations are basic image-processing functions that you can use to improve the contrast and brightness of an image by modifying the intensity dynamic of regions with poor contrast. The LUT transformations can highlight details in areas containing significant information, at the expense of other areas. These functions include histogram equalization, histogram inversion, Gamma corrections, Inverse Gamma corrections, logarithmic corrections, and exponential corrections. An LUT transformation converts input gray-level values (those from the source image) into other gray-level values (in the transformed image). The transfer function has an intended effect on the brightness and contrast of the image. Each input gray-level value is given a new value such that output value = F(input value), where F is a linear or nonlinear, continuous or discontinuous transfer function defined over the interval [0, max]. © National Instruments Corporation 3-1 IMAQ Vision for G Reference Manual Chapter 3 Lookup Transformations In the case of an 8-bit resolution, an LUT is a table of 256 elements. Each element of the array represents an input gray-level value. Its content indicates the output value. Example In this example, the following source image is used. In the histogram of the source image, the gray-level intervals [0, 49] and [191, 255] do not contain significant information. Using the following LUT transformation, any pixel with a value less than 49 is set to 0, and any pixel with a value greater than 191 is set to 255. The interval [50, 190] expands to [1, 255], increasing the intensity dynamic of the regions with a concentration of pixels in the gray-level range [50, 190]. If Ginput is between [0, 49] or [191, 255], then F(Ginput) = 0, else F(Ginput) = 1.8 × Ginput – 91. IMAQ Vision for G Reference Manual 3-2 © National Instruments Corporation Chapter 3 Lookup Transformations The LUT transform produces the following image. The histogram of the new image only contains the two peaks of the interval [50, 190]. Predefined Lookup Tables Eight predefined LUTs are available in IMAQ Vision: Reverse, Equalize, Logarithmic, Power 1/Y, Square Root, Exponential, Power Y, and Square. The following table shows the transfer function for each LUT and describes its effect on an image displayed in a palette that associates dark colors to low intensity values and bright colors to high intensity values (such as the B&W or Gray palette). LUT © National Instruments Corporation Transfer Function Shading Correction Equalize Increases the intensity dynamic by evenly distributing a given gray-level interval [min, max] over the full gray scale [0, 255]. Min and max default values are 0 and 255 for an 8-bit image. Reverse Reverses the pixel values, producing a photometric negative of the image. Logarithmic Power 1/Y Square Root Increases the brightness and contrast in dark regions. Decrease the contrast in bright regions. 3-3 IMAQ Vision for G Reference Manual Chapter 3 Lookup Transformations LUT Transfer Function Exponential Power Y Square Shading Correction Decreases the brightness and increases the contrast in bright regions. Decreases the contrast in the dark regions. Equalize The Equalize function alters the gray-level value of pixels so they become distributed evenly in the defined gray-scale range (0 to 255 for an 8-bit image). The function associates an equal amount of pixels per constant gray-level intervals and takes full advantage of the available shades of gray. Use this transformation to increase the contrast of images in which gray-level intervals are not used. The equalization can be limited to a gray-level interval, also called the equalization range. In this case, the function evenly distributes the pixels belonging to the equalization range over the full interval (0 to 255 for an 8-bit image) and the other pixels are set to 0. The image produced reveals details in the regions that have an intensity in the equalization range; other areas are cleared. Example 1 This example shows how an equalization of the interval [0, 255] can spread the information contained in the three original peaks over larger intervals. The transformed image reveals more details about each component in the original image. The following graphics show the original image and histograms. IMAQ Vision for G Reference Manual 3-4 © National Instruments Corporation Chapter 3 Lookup Transformations An equalization from [0, 255] to [0, 255] produces the following image and histograms. Note: The cumulative histogram of an image after a histogram equalization always has a linear profile, as seen in the preceding example. Example 2 This example shows how an equalization of the interval [166, 200] can spread the information contained in the original third peak (ranging from 166 to 200) to the interval [1, 255]. The transformed image reveals details about the component with the original intensity range [166, 200] while all other components are set to black. An equalization from [166, 200] to [0, 255] produces the following image and histograms. © National Instruments Corporation 3-5 IMAQ Vision for G Reference Manual Chapter 3 Lookup Transformations Reverse The Reverse function displays the photometric negative of an image. Goutput = Maximum - Ginput For an 8-bit image, Maximum = 255. Therefore, Goutput 0 1 2 ... 128 ... 253 254 255 = corresponds to corresponds to corresponds to 255 – Ginput 255 254 253 corresponds to 128 corresponds to corresponds to corresponds to 2 1 0 The histogram of a reversed image is equal to the histogram of the original image after a vertical symmetry centered on the gray-level value 128 (when processing an 8-bit image). Example This example uses the following original image and histogram. IMAQ Vision for G Reference Manual 3-6 © National Instruments Corporation Chapter 3 Lookup Transformations A Reverse transformation produces the following histogram and image. Logarithmic and Inverse Gamma Correction The logarithmic and inverse gamma corrections expand low gray-level ranges while compressing high gray-level ranges. When using the B&W (or Gray) palette, these transformations increase the overall brightness of an image and increase the contrast in dark areas at the expense of the contrast in bright areas. The following graphs show how the transformations behave. The horizontal axis represents the input gray-level range and the vertical axis represents the output gray-level range. Each input gray-level value is plotted vertically, and its point of intersection with the lookup curve is plotted horizontally to give an output value. The Logarithmic, Square Root, and Power 1/Y functions expand intervals containing low gray-level values while compressing intervals containing high gray-level values. The higher the gamma coefficient Y, the stronger the intensity correction. The Logarithmic correction has a stronger effect than the Power 1/Y function. © National Instruments Corporation 3-7 IMAQ Vision for G Reference Manual Chapter 3 Lookup Transformations The following series of illustrations presents the linear and cumulative histograms of an image after various LUT transformations. The more the histogram is compressed on the right, the brighter the image. The following graphic shows the original image and histograms. A Power 1/Y transformation (where Y = 1.5) produces the following image and histograms. A Square Root or Power 1/Y transformation (where Y = 2) produces the following image and histograms. IMAQ Vision for G Reference Manual 3-8 © National Instruments Corporation Chapter 3 Lookup Transformations A Logarithm transformation produces the following image and histograms. Exponential and Gamma Correction The exponential and gamma corrections expand high gray-level ranges while compressing low gray-level ranges. When using the B&W (or Gray) palette, these transformations decrease the overall brightness of an image and increase the contrast in bright areas at the expense of the contrast in dark areas. The following graphs show how the transformations behave. The horizontal axis represents the input gray-level range and the vertical axis represents the output gray-level range. Each input gray-level value is plotted vertically, and its point of intersection with the lookup curve then is plotted horizontally to give an output value. The Exponential, Square, and Power Y functions expand intervals containing high gray-level values while compressing intervals containing low gray-level values. The higher the gamma coefficient Y, the stronger the intensity correction. The Exponential correction has a stronger effect than the Power Y function. © National Instruments Corporation 3-9 IMAQ Vision for G Reference Manual Chapter 3 Lookup Transformations The following series of illustrations presents the linear and cumulative histograms of an image after various LUT transformations. The more the histogram is compressed on the left, the darker the image. The following graphic shows the original image and histograms. A Power Y transformation (where Y = 1.5) produces the following image and histograms. A Square or Power Y transformation (where Y = 2) produces the following image and histograms. IMAQ Vision for G Reference Manual 3-10 © National Instruments Corporation Chapter 3 Lookup Transformations An Exponential transformation produces the following image and histograms. © National Instruments Corporation 3-11 IMAQ Vision for G Reference Manual Chapter 4 Operators This chapter describes the arithmetic and logic operators used in IMAQ Vision. Concepts and Mathematics Arithmetic and logic operators mask, combine, and compare images. Common applications of these operators include time-lapse comparisons, identification of the union or intersection between images, and comparisons between several images and a model. Operators also can be used to threshold or mask images and to alter contrast and brightness. An arithmetic or logic operation between images is a pixel-by-pixel transformation. It produces an image in which each pixel derives from the values of pixels with the same coordinates in other images. If A is an image with a resolution XY, B is an image with a resolution XY, and Op is the operator, then the image N resulting from the combination of A and B through the operator Op is such that each pixel P of N is assigned the value pn = (pa)(Op)(pb), where pa is the value of pixel P in image A, and pb is the value of pixel P in image B. © National Instruments Corporation 4-1 IMAQ Vision for G Reference Manual Chapter 4 Operators Arithmetic Operators In the case of images with 8-bit resolution, the following equations describe the usage of the arithmetic operators: Operator Equation Multiply pn = min(pa × pb, 255) Divide pn = max(pa/pb, 0) Add pn = min(pa + pb, 255) Subtract pn = max(pa – pb, 0) Remainder pn = pamodpb If the resulting pixel value pn is negative, it is set to 0. If it is greater than 255, it is set to 255. Logic Operators Logic operators are bit-wise operators. They manipulate gray-level values coded on one byte at the bit level. The truth tables for logic operators are presented in the Truth Tables section. Operator Equation AND pn = pa AND pb NAND pn = pa NAND pb OR pn = pa OR pb NOR pn = pa NOR pb XOR pn = pa XOR pb Difference pn = pa AND (NOT pb) IMAQ Vision for G Reference Manual 4-2 © National Instruments Corporation Chapter 4 Operator Operators Equation Mask if pb = 0, then pn = 0, else pn = pa Mean pn = mean[pa, pb] Max pn = max[pa, pb] Min pn = min[pa, pb] In the case of images with 8-bit resolution, logic operators mainly are designed to combine gray-level images with mask images composed of pixels equal to 0 or 255 (in binary format 0 is represented as 00000000 and 255 is represented as 11111111). The following table illustrates how logic operations can be used to extract or remove information in an image. For a given pa, © National Instruments Corporation if pb = 255, then if pb = 0, then (AND) pa AND 255 = pa pa AND 0 = 0 (NAND) pa NAND 255 = NOT pa pa NAND 0 = 255 (OR) pa OR 255 = 255 pa OR 0 = pa (NOR) pa NOR 255 = 0 pa NOR 0 = NOT pa (XOR) pa XOR 255 = NOT pa pa XOR 0 = pa (Logic Difference) pa – NOT 255 = pa pa – NOT 0 = 0 4-3 IMAQ Vision for G Reference Manual Chapter 4 Operators Truth Tables The following truth tables describe the rules used by the logic operators. The top row and left column give the values of input bits. The cells in the table give the output value for a given set of two input bits. AND NAND b=0 b=1 b=0 b=1 a=0 0 0 a=0 1 1 a=1 0 1 a=1 1 0 OR NOR b=0 b=1 b=0 b=1 a=0 0 1 a=0 1 0 a=1 1 1 a=1 0 0 XOR NOT b=0 b=1 NOT a a=0 0 1 a=0 1 a=1 1 0 a=1 0 IMAQ Vision for G Reference Manual 4-4 © National Instruments Corporation Chapter 4 Operators Example 1 The following series of graphics illustrates images in which regions of interest have been isolated in a binary format, retouched with morphological manipulations, and finally multiplied by 255. The following gray-level source image is used for this example. The following mask image results. The operation (source image AND mask image) has the effect of restoring the original intensity of the object regions in the mask. © National Instruments Corporation 4-5 IMAQ Vision for G Reference Manual Chapter 4 Operators The operation (source image OR mask image) has the effect of restoring the original intensity of the background region in the mask. Example 2 An image revealing two groups of objects that require different processing results in two binary images. Multiplying each binary image by a constant and applying an OR operation produces an image that shows their union, as illustrated in the following series of graphics. The following image illustrates Object Group #1 × 128. The following image illustrates Object Group #2 × 255. IMAQ Vision for G Reference Manual 4-6 © National Instruments Corporation Chapter 4 Operators Object Group #1 OR Object Group #2 produces a union, as shown in the following image. © National Instruments Corporation 4-7 IMAQ Vision for G Reference Manual Chapter 5 Spatial Filtering This chapter provides an overview of the spatial filters, including linear and nonlinear filters, used in IMAQ Vision. Concept and Mathematics Spatial filters alter pixel values with respect to variations in light intensity in their neighborhood. The neighborhood of a pixel is defined by the size of a matrix, or mask, centered on the pixel itself. These filters can be sensitive to the presence or absence of light intensity variations. Spatial filters can serve a variety of purposes, such as the detection of edges along a specific direction, the contouring of patterns, noise reduction, and detail outlining or smoothing. Spatial filters can be divided into two categories: • Highpass filters emphasize significant variations of the light intensity usually found at the boundary of objects. • Lowpass filters attenuate variations of the light intensity. They have the tendency to smooth images by eliminating details and blurring edges. In the case of a 3 × 3 matrix as illustrated in the following illustration, the value of the central pixel (shown in solid) derives from the values of its eight surrounding neighbors (shown in shaded pattern). © National Instruments Corporation 5-1 IMAQ Vision for G Reference Manual Chapter 5 Spatial Filtering A 5 × 5 matrix specifies 24 neighbors, a 7 × 7 matrix specifies 48 neighbors, and so forth. If P(i, j) represents the intensity of the pixel P with the coordinates (i, j), the pixels surrounding P(i, j) can be indexed as follows (in the case of a 3 × 3 matrix): P(i – 1, j – 1) P(i, j – 1) P(i + 1, j – 1) P(i – 1, j) P(i, j) P(i + 1, j) P(i – 1, j + 1) P(i, j + 1) P(i + 1, j + 1) A linear filter assigns to P(i, j) a value that is a linear combination of its surrounding values. For example, P(i, j) = (P(i, j – 1) + P(i – 1, j) + 2P(i, j) + P(i + 1, j) + P(i, j + 1) ). A nonlinear filter assigns to P(i, j) a value that is not a linear combination of the surrounding values. For example, P(i, j) = max(P(i – 1, j – 1), P(i + 1, j – 1), P(i – 1, j + 1), P(i + 1, j + 1)). IMAQ Vision for G Reference Manual 5-2 © National Instruments Corporation Chapter 5 Spatial Filtering Spatial Filter Classification Summary The following table describes the classification of spatial filters. Highpass Filters Lowpass Filters Linear Filters Gradient, Laplacian Smoothing, Gaussian Nonlinear Filters Gradient, Roberts, Sobel, Prewitt, Differentiation, Sigma Median, Nth Order, Lowpass Linear Filters or Convolution Filters A convolution is a mathematical function that replaces each pixel by a weighted sum of its neighbors. The matrix defining the neighborhood of the pixel also specifies the weight assigned to each neighbor. This matrix is called the convolution kernel. For each pixel P(i, j) in an image (where i and j represent the coordinates of the pixel), the convolution kernel is centered on P(i, j). Each pixel masked by the kernel is multiplied by the coefficient placed on top of it. P(i, j) becomes the sum of these products. In the case of a 3 × 3 neighborhood, the pixels surrounding P(i, j) and the coefficients of the kernel, K, can be indexed as follows: P(i – 1, j – 1) P(i, j – 1) P(i + 1, j – 1) K(i – 1, j – 1) K(i, j – 1) K(i + 1, j – 1) P(i – 1, j) P(i, j) P(i + 1, j) K(i – 1, j) K(i, j) K(i + 1, j) P(i – 1, j + 1) P(i, j + 1) P(i + 1, j + 1) K(i – 1, j + 1) K(i, j + 1) K(i + 1, j + 1) The pixel P(i, j) is given the value (1/N)Σ K(a, b)P(a, b), with a ranging from (i – 1) to (i + 1), and b ranging from (j – 1) to (j + 1). N is the normalization factor, equal to Σ K (a, b) or 1, whichever is greater. Finally, if the new value P(i, j) is negative, it is set to 0. If the new value P(i, j) is greater than 255, it is set to 255 (in the case of 8-bit resolution). The greater the absolute value of a coefficient K(a, b), the more the pixel P(a, b) contributes to the new value of P(i, j). If a coefficient K(a, b) is null, © National Instruments Corporation 5-3 IMAQ Vision for G Reference Manual Chapter 5 Spatial Filtering the neighbor P(a, b) does not contribute to the new value of P(i, j) (notice that P(a, b) might be P(i, j) itself). If the convolution kernel is 0 –2 0 0 1 0 0 2 0 then P(i, j) = (–2P(i – 1, j) + P(i, j) + 2P(i + 1, j)). If the convolution kernel is 0 1 0 1 0 1 0 1 0 then P(i, j) = (P(i, j – 1) + P(i – 1, j)+ P(i + 1, j) + P(i, j + 1)). If the kernel contains both negative and positive coefficients, the transfer function is equivalent to a weighted differentiation, and produces a sharpening or highpass filter. Typical highpass filters include gradient and Laplacian filters. If all coefficients in the kernel are positive, the transfer function is equivalent to a weighted summation and produces a smoothing or lowpass filter. Typical lowpass filters include smoothing and Gaussian filters. Gradient Filter A gradient filter highlights the variations of light intensity along a specific direction, which has the effect of outlining edges and revealing texture. IMAQ Vision for G Reference Manual 5-4 © National Instruments Corporation Chapter 5 Spatial Filtering Example This example uses the following source image. A gradient filter extracts horizontal edges to produce the following image. A gradient filter highlights diagonal edges to produce the following image. Kernel Definition A gradient convolution filter is a first order derivative and its kernel uses the following model: a –b c b x –d c d –a © National Instruments Corporation 5-5 IMAQ Vision for G Reference Manual Chapter 5 Spatial Filtering where a, b, and c are integers and x = 0 or 1. This kernel has an axis of symmetry that runs between the positive and negative coefficients of the kernel and through the central element. This axis of symmetry gives the orientation of the edges to outline. Filter Axis and Direction The axis of symmetry of the gradient kernel gives the orientation of the edges to outline. For example, where a = 0, b = –1, c = –1, d = –1, and x = 0, the kernel is the following: 0 1 –1 0 –1 –1 1 1 0 The axis of symmetry is at 135 degrees. For a given direction, you can design a gradient filter to highlight or darken the edges along that direction. The filter actually is sensitive to the variations of intensity perpendicular to the axis of symmetry of its kernel. Given the direction D going from the negative coefficients of the kernel towards the positive coefficients, the filter highlights the pixels where the light intensity increases along the direction D, and darkens the pixels where the light intensity decreases. IMAQ Vision for G Reference Manual 5-6 © National Instruments Corporation Chapter 5 Spatial Filtering Examples The following two kernels emphasize edges oriented at 135 degrees. Gradient #1 Gradient #2 0 –1 –1 1 0 –1 1 1 0 0 1 –1 0 –1 –1 Gradient #1 highlights pixels where the light intensity increases along the direction going from northeast to southwest. It darkens pixels where the light intensity decreases along that same direction. This processing outlines the northeast front edges of bright regions such as the ones in the illustration. Gradient #2 highlights pixels where the light intensity increases along the direction going from southwest to northeast. It darkens pixels where the light intensity decreases along that same direction. This processing outlines the southwest front edges of bright regions such as the ones in the illustration. p. Note: 1 1 0 . Applying Gradient #1 to an image gives the same results as applying Gradient #2 to its photometric negative, because reversing the lookup table of an image converts bright regions into dark regions and vice versa. Edge Extraction and Edge Highlighting The gradient filter has two effects, depending on whether the central coefficient x is equal to 1 or 0: • © National Instruments Corporation If the central coefficient is null (x = 0), the gradient filter highlights the pixels where variations of light intensity occur along a direction specified by the configuration of the coefficients a, b, c, and d. 5-7 IMAQ Vision for G Reference Manual Chapter 5 Spatial Filtering The transformed image contains black-white borders at the original edges and the shades of the overall patterns are darkened. Source Image Gradient #1 Filtered Image –1 –1 0 –1 0 1 0 1 1 • If the central coefficient is equal to 1 (x = 1), the gradient filter detects the same variations as mentioned above, but superimposes them over the source image. The transformed image looks like the source image with edges highlighted. You can use this type of kernel for grain extraction and perception of texture. Source Image Gradient #2 1 –1 0 1 1 1 Filtered Image 0 1 1 Notice that the kernel Gradient #2 can be decomposed as follows: –1 –1 –1 1 0 1 Note: 0 1 1 = –1 –1 –1 0 0 1 0 1 1 + 0 0 0 0 1 0 0 0 0 The convolution filter using the second kernel on the right side of the equation reproduces the source image. All neighboring pixels are multiplied by 0 and the central pixel remains equal to itself: (P(i, j) = 1 × P(i, j) ). IMAQ Vision for G Reference Manual 5-8 © National Instruments Corporation Chapter 5 Spatial Filtering This equation indicates that Gradient #2 adds the edges extracted by the Gradient #1 to the source image. Gradient #2 = Gradient #1 + Source Image Edge Thickness The larger the kernel, the larger the edges. The following image illustrates gradient west–east 3 × 3. The following image illustrates gradient west–east 5 × 5. Finally, the following image illustrates gradient west–east 7 × 7. © National Instruments Corporation 5-9 IMAQ Vision for G Reference Manual Chapter 5 Spatial Filtering Predefined Gradient Kernels The tables in this section list the predefined gradient kernels. Prewitt Filters The Prewitt filters have the following kernels. The notations West (W), South (S), East (E), and North (N) indicate which edges of bright regions they outline. Table 5-1. Prewitt Filters W/Edge W/Image SW/Edge SW/Image –1 0 –1 0 –1 0 –1 –1 –1 0 1 –1 0 –1 –1 1 1 0 0 1 1 –1 1 1 –1 –1 0 1 1 1 1 1 1 S/Edge S/Image SE/Edge SE/Image 1 1 1 0 0 0 –1 –1 –1 1 1 1 0 1 0 –1 –1 –1 1 1 0 1 0 –1 0 –1 –1 1 1 0 1 1 –1 0 –1 –1 E/Edge E/Image NE/Edge NE/Image 0 –1 1 –1 0 –1 0 –1 –1 1 0 –1 1 1 0 0 –1 –1 1 1 –1 1 1 0 N/Edge N/Image NW/Edge NW/Image –1 –1 –1 0 0 0 1 1 1 –1 –1 –1 0 1 0 1 1 1 –1 –1 –1 0 0 1 1 0 –1 1 0 –1 1 0 –1 IMAQ Vision for G Reference Manual 0 1 0 1 1 1 5-10 0 1 1 –1 –1 0 –1 1 1 0 1 1 © National Instruments Corporation Chapter 5 Spatial Filtering Sobel Filters The Sobel filters are very similar to the Prewitt filters except that they highlight light intensity variations along a particular axis that is assigned a stronger weight. The Sobel filters have the following kernels. The notations West (W), South (S), East (E), and North (N) indicate which edges of bright regions they outline. Table 5-2. Sobel Filters W/Edge W/Image SW/Edge SW/Image –1 –2 –1 –1 –2 –1 1 2 1 0 1 2 –1 0 1 –2 –1 0 0 1 –1 1 –2 –1 S/Edge S/Image SE/Edge SE/Image 1 2 1 0 0 0 –1 –2 –1 1 2 1 0 1 0 –1 –2 –1 2 1 0 1 0 –1 0 –1 –2 2 1 0 1 1 –1 0 –1 –2 E/Edge E/Image NE/Edge NE/Image 0 –1 1 –2 0 –1 0 –1 –2 1 0 –1 2 1 0 0 –1 –2 1 1 –1 2 1 0 N/Edge N/Image NW/Edge NW/Image –1 –2 –1 0 0 0 1 2 1 –1 –2 –1 0 1 0 1 2 1 –2 –1 0 –1 0 1 0 1 2 1 2 1 © National Instruments Corporation 0 0 0 1 2 1 0 –1 0 –2 0 –1 1 2 1 5-11 0 1 0 –2 –1 –1 1 0 1 2 1 0 0 1 2 IMAQ Vision for G Reference Manual Chapter 5 Spatial Filtering The following tables list the predefined gradient 5 × 5 and 7 × 7 kernels. Table 5-3. Gradient 5 × 5 W/Edge 0 –1 –1 –1 0 –1 –2 –2 –2 –1 0 0 0 0 0 1 2 2 2 1 W/Image 0 1 1 1 0 0 –1 –1 –1 0 –1 –2 –2 –2 –1 0 0 1 0 0 1 2 2 2 1 0 1 1 1 0 Table 5-4. Gradient 7 × 7 W/Edge 0 –1 –1 –1 –1 –1 0 –1 –2 –2 –2 –2 –2 –1 –1 –2 –3 –3 –3 –3 –1 0 0 0 0 0 0 0 1 2 3 3 3 3 1 W/Image 1 2 2 2 2 2 1 0 1 1 1 1 1 0 0 –1 –1 –1 –1 –1 0 –1 –2 –2 –2 –2 –2 –1 –1 –2 –3 –3 –3 –3 –1 0 0 0 1 0 0 0 1 2 3 3 3 3 1 1 2 2 2 2 2 1 0 1 1 1 1 1 0 Laplacian Filters A Laplacian filter highlights the variation of the light intensity surrounding a pixel. The filter extracts the contour of objects and outlines details. Unlike the gradient filter, it is omni-directional. Example This example uses the following source image. IMAQ Vision for G Reference Manual 5-12 © National Instruments Corporation Chapter 5 Spatial Filtering A Laplacian filter extracts contours to produce the following image. A Laplacian filter highlights contours to produce the following image. Kernel Definition The Laplacian convolution filter is a second order derivative and its kernel uses the following model: a b c d x d c b a where a, b, c, and d are integers. The Laplacian filter has two different effects, depending on whether the central coefficient x is equal to or greater than the sum of the absolute values of the outer coefficients: x ≥ 2( a + b + c + d ) . © National Instruments Corporation 5-13 IMAQ Vision for G Reference Manual Chapter 5 Spatial Filtering Contour Extraction and Highlighting If the central coefficient is equal to this sum ( x = 2 ( a + b + c + d ) ) , the Laplacian filter extracts the pixels where significant variations of light intensity are found. The presence of sharp edges, boundaries between objects, modification in the texture of a background, noise, and other effects can cause these variations. The transformed image contains white contours on a black background. Examples Notice the following source image, Laplacian kernel, and filtered image. Source Image Laplacian #1 Filtered Image –1 –1 –1 –1 8 –1 –1 –1 –1 If the central coefficient is greater than the sum of the outer coefficients (x > 2(a + b + c + d)), the Laplacian filter detects the same variations as mentioned above, but superimposes them over the source image. The transformed image looks like the source image, with all significant variations of the light intensity highlighted. Source Image Laplacian #2 Filtered Image –1 –1 –1 –1 9 –1 –1 –1 –1 IMAQ Vision for G Reference Manual 5-14 © National Instruments Corporation Chapter 5 Spatial Filtering Notice that the Laplacian #2 kernel can be decomposed as follows: –1 –1 –1 1 9 –1 0 1 –1 Note: = 1 –1 –1 1 8 –1 1 1 –1 + 0 0 0 0 1 0 0 0 0 The convolution filter using the second kernel on the right side of the equation reproduces the source image. All neighboring pixels are multiplied by 0 and the central pixel remains equal to itself: (P(i, j) = 1 × P(i, j)). This equation indicates that the Laplacian #2 kernel adds the contours extracted by the Laplacian #1 kernel to the source image. Laplacian #1 = Laplacian #2 + Source Image For example, if the central coefficient of Laplacian #2 kernel is 10, the Laplacian filter adds the contours extracted by Laplacian #1 kernel to the source image times 2, and so forth. A greater central coefficient corresponds to less-prominent contours and details highlighted by the filter. Contour Thickness Larger kernels correspond to larger contours. The following image is a Laplacian 3 × 3. The following image is a Laplacian 5 × 5. © National Instruments Corporation 5-15 IMAQ Vision for G Reference Manual Chapter 5 Spatial Filtering The following image is a Laplacian 7 × 7. Predefined Laplacian Kernels The following tables list the predefined Laplacian kernels. Table 5-5. Laplacian 3 × 3 IMAQ Vision for G Reference Manual Contour 4 + Image × 1 + Image × 2 0 –1 0 –1 4 –1 0 –1 0 0 –1 0 –1 5 –1 0 –1 0 0 –1 0 –1 6 –1 0 –1 0 Contour 8 + Image × 1 + Image × 2 –1 –1 –1 –1 8 –1 –1 –1 –1 –1 –1 –1 –1 9 –1 –1 –1 –1 –1 –1 –1 –1 10 –1 –1 –1 –1 Contour 12 + Image × 1 –1 –2 –1 –2 12 –2 –1 –2 –1 –1 –2 –1 –2 13 –2 –1 –2 –1 5-16 © National Instruments Corporation Chapter 5 Spatial Filtering Table 5-6. Laplacian 5 × 5 Contour 24 –1 –1 –1 –1 –1 –1 –1 –1 –1 –1 –1 –1 24 –1 –1 –1 –1 –1 –1 –1 + Image × 1 –1 –1 –1 –1 –1 –1 –1 –1 –1 –1 –1 –1 –1 –1 –1 –1 –1 25 –1 –1 –1 –1 –1 –1 –1 –1 –1 –1 –1 –1 Table 5-7. Laplacian 7 × 7 Contour 48 –1 –1 –1 –1 –1 –1 –1 –1 –1 –1 –1 –1 –1 –1 –1 –1 –1 –1 –1 –1 –1 –1 –1 –1 48 –1 –1 –1 –1 –1 –1 –1 –1 –1 –1 + Image × 1 –1 –1 –1 –1 –1 –1 –1 –1 –1 –1 –1 –1 –1 –1 –1 –1 –1 –1 –1 –1 –1 –1 –1 –1 –1 –1 –1 –1 –1 –1 –1 –1 –1 –1 –1 –1 –1 –1 49 –1 –1 –1 –1 –1 –1 –1 –1 –1 –1 –1 –1 –1 –1 –1 –1 –1 –1 –1 –1 –1 –1 –1 –1 Smoothing Filter A smoothing filter attenuates the variations of light intensity in the neighborhood of a pixel. It smoothes the overall shape of objects, blurs edges, and removes details. Example This example uses the following source image. © National Instruments Corporation 5-17 IMAQ Vision for G Reference Manual Chapter 5 Spatial Filtering A smoothing filter produces the following image. Kernel Definition A smoothing convolution filter is an averaging filter and its kernel uses the following model: a b c d x d c b a where a, b, c, and d are integers and x = 0 or 1. Because all the coefficients in a smoothing kernel are positive, each central pixel becomes a weighted average of its neighbors. The stronger the weight of a neighboring pixel, the more influence it has on the new value of the central pixel. For a given set of coefficients (a, b, c, d), a smoothing kernel with a central coefficient equal to 0 (x = 0) has a stronger blurring effect than a smoothing kernel with a central coefficient equal to 1 (x = 1). Examples Notice the following smoothing kernels and filtered images. A larger kernel size corresponds to a stronger smoothing effect. Kernel #1 0 1 0 IMAQ Vision for G Reference Manual 1 0 1 Filtered Image 0 1 0 5-18 © National Instruments Corporation Chapter 5 Kernel #2 2 2 2 Filtered Image 2 2 1 2 2 2 Kernel #3 1 1 1 1 1 1 1 1 1 1 1 1 1 1 1 Filtered Image 1 1 1 1 1 1 1 1 1 1 Kernel #4 1 1 1 1 1 1 1 1 1 1 1 1 1 1 1 1 1 1 1 1 1 Spatial Filtering 1 1 1 1 1 1 1 Filtered Image 1 1 1 1 1 1 1 1 1 1 1 1 1 1 1 1 1 1 1 1 1 Predefined Smoothing Kernels The following tables list the predefined smoothing kernels. Table 5-8. Smoothing 3 × 3 © National Instruments Corporation 0 1 0 1 0 1 0 1 0 0 1 0 1 1 1 0 1 0 0 2 0 2 0 1 2 2 0 0 4 0 4 1 4 0 4 0 1 1 1 1 0 1 1 1 1 1 1 1 1 1 1 1 1 1 2 2 2 2 2 1 2 2 2 4 4 4 4 1 4 4 4 4 5-19 IMAQ Vision for G Reference Manual Chapter 5 Spatial Filtering Table 5-9. Smoothing 5 × 5 1 1 1 1 1 1 1 1 1 1 1 1 0 1 1 1 1 1 1 1 1 1 1 1 1 1 1 1 1 1 1 1 1 1 1 1 1 1 1 1 1 1 1 1 1 1 1 1 1 1 1 1 1 1 1 1 1 1 1 1 1 1 1 1 1 1 1 1 1 1 1 1 1 1 1 1 1 1 Table 5-10. Smoothing 7 × 7 1 1 1 1 1 1 1 1 1 1 1 1 1 1 1 1 1 1 1 1 1 1 1 1 0 1 1 1 1 1 1 1 1 1 1 1 1 1 1 1 1 1 1 1 1 1 1 1 1 1 1 1 1 1 1 1 1 1 1 1 1 1 1 1 1 1 1 1 1 1 Gaussian Filters A Gaussian filter attenuates the variations of light intensity in the neighborhood of a pixel. It smoothes the overall shape of objects and attenuates details. It is similar to a smoothing filter, but its blurring effect is more subdued. Example This example uses the following source image. IMAQ Vision for G Reference Manual 5-20 © National Instruments Corporation Chapter 5 Spatial Filtering A Gaussian filter produces the following image. Kernel Definition A Gaussian convolution filter is an averaging filter and its kernel uses the following model: a b c d x d c b a where a, b, c, and d are integers and x > 1. Since all the coefficients in a Gaussian kernel are positive, each pixel becomes a weighted average of its neighbors. The stronger the weight of a neighboring pixel, the more influence it has on the new value of the central pixel. Unlike a smoothing kernel, the central coefficient of a Gaussian filter is greater than 1. Therefore the original value of a pixel is multiplied by a weight greater than the weight of any of its neighbors. As a result, a greater central coefficient corresponds to a more subtle smoothing effect. A larger kernel size corresponds to a stronger smoothing effect. Predefined Gaussian Kernels The following tables list the predefined Gaussian kernels. Table 5-11. Gaussian 3 × 3 © National Instruments Corporation 0 1 1 2 0 1 0 1 0 0 1 0 1 4 1 0 1 0 1 1 1 2 1 1 1 1 1 1 1 1 4 1 1 1 1 1 1 2 1 2 4 2 1 2 1 1 4 4 16 1 4 1 4 1 5-21 IMAQ Vision for G Reference Manual Chapter 5 Spatial Filtering Table 5-12. Gaussian 5 × 5 1 2 4 2 1 2 4 2 4 8 4 8 16 8 4 8 4 2 4 2 1 2 4 2 1 Table 5-13. Gaussian 7 × 7 1 1 2 2 2 1 1 1 2 2 4 2 2 1 2 2 2 2 4 2 4 8 4 8 16 8 4 8 4 2 4 2 2 2 2 1 2 2 4 2 2 1 1 1 2 2 2 1 1 Nonlinear Filters A nonlinear filter replaces each pixel value with a nonlinear function of its surrounding pixels. Like the convolution filters, the nonlinear filters operate on a neighborhood. The following notations describe the behavior of the nonlinear spatial filters. If P(i, j) represents the intensity of the pixel P with the coordinates (i, j), the pixels surrounding P(i, j) can be indexed as follows (in the case of a 3 × 3 matrix): P(i – 1, j – 1) P(i, j – 1) P(i + 1, j – 1) P(i – 1, j) P(i, j) P(i + 1, j) P(i – 1, j + 1) P(i, j + 1) P(i + 1, j + 1) In the case of a 5 × 5 neighborhood, the i and j indexes vary from –2 to 2, and so forth. The series of pixels including P(i, j) and its surrounding pixels is annotated as P(n, m). IMAQ Vision for G Reference Manual 5-22 © National Instruments Corporation Chapter 5 Spatial Filtering Nonlinear Prewitt Filter The nonlinear Prewitt filter is a highpass filter that extracts the outer contours of objects. It highlights significant variations of the light intensity along the vertical and horizontal axes. Each pixel is assigned the maximum value of its horizontal and vertical gradient obtained with the following Prewitt convolution kernels: Kernel #1 Kernel #2 –1 –1 –1 –1 –1 –1 0 0 0 1 1 1 0 1 0 1 0 1 P(i, j) = max[|P(i + 1, j – 1) – P(i – 1, j – 1) + P(i + 1, j) – P(i – 1, j) + P(i + 1, j + 1) – P(i – 1, j + 1)|, |P(i – 1, j + 1) – P(i – 1, j – 1) + P(i, j + 1) – P(i, j – 1) + P(i + 1, j + 1) – P(i + 1, j – 1)|] Nonlinear Sobel Filter The nonlinear Sobel filter is a highpass filter that extracts the outer contours of objects. It highlights significant variations of the light intensity along the vertical and horizontal axes. Each pixel is assigned the maximum value of its horizontal and vertical gradient obtained with the following Sobel convolution kernels: Kernel #1 Kernel #2 –1 –2 –1 –1 –2 –1 0 0 0 1 2 1 0 1 0 2 0 1 As opposed to the Prewitt filter, the Sobel filter assigns a higher weight to the horizontal and vertical neighbors of the central pixel: P(i, j) = max[|P(i – 1, j – 1) – P(i + 1, j – 1) + 2P(i – 1, j) – 2P(i + 1, j) + P(i – 1, j + 1) – P(i + 1, j + 1)|, |P(i – 1, j – 1) – P(i – 1, j + 1) + 2P(i, j – 1) – 2P(i, j + 1) + P(i + 1, j – 1) – P(i + 1, j + 1)|] © National Instruments Corporation 5-23 IMAQ Vision for G Reference Manual Chapter 5 Spatial Filtering Example This example uses the following source image. A nonlinear Prewitt filter produces the following image. A nonlinear Sobel filter produces the following image. Both filters outline the contours of the objects. Because of the different convolution kernels they combine, the nonlinear Prewitt has the tendency to outline curved contours while the nonlinear Sobel extracts square contours. This difference is noticeable when observing the outlines of isolated pixels. IMAQ Vision for G Reference Manual 5-24 © National Instruments Corporation Chapter 5 Spatial Filtering Nonlinear Gradient Filter The nonlinear gradient filter outlines contours where an intensity variation occurs along the vertical axis. The new value of a pixel becomes the maximum absolute value between its deviation from the upper neighbor and the deviation of its two left neighbors. P(i, j) = max[|P(i, j – 1) – P(i, j)|, |P(i – 1, j – 1) – P(i – 1, j)|] Roberts Filter The Roberts filter outlines the contours that highlight pixels where an intensity variation occurs along the diagonal axes. The new value of a pixel becomes the maximum absolute value between the deviation of its upper-left neighbor and the deviation of its two other neighbors. P(i, j) = max[|P(i – 1, j – 1) – P(i, j)|, |P(i, j – 1) – P(i – 1, j)|] Differentiation Filter The differentiation filter produces continuous contours by highlighting each pixel where an intensity variation occurs between itself and its three upper-left neighbors. The new value of a pixel becomes the absolute value of its maximum deviation from its upper-left neighbors. P(i, j) = max[|P(i – 1, j) – P(i, j)|, |P(i – 1, j – 1) – P(i, j)|, |P(i, j – 1) – P(i, j)|] © National Instruments Corporation 5-25 IMAQ Vision for G Reference Manual Chapter 5 Spatial Filtering Sigma Filter The Sigma filter is a highpass filter. It outlines contours and details by setting pixels to the mean value found in their neighborhood, if their deviation from this value is not significant. Given M, the mean value of P(i, j) and its neighbors and S, their standard deviation, each pixel P(i, j) is set to the mean value M if it falls inside the range [M – S, M + S]. If P(i, j) – M > S, then P(i, j) = P(i, j), else P(i, j) = M. Lowpass Filter The lowpass filter reduces details and blurs edges by setting pixels to the mean value found in their neighborhood, if their deviation from this value is large. Given M, the mean value of P(i, j) and its neighbors and S, their standard deviation, each pixel P(i, j) is set to the mean value M if it falls outside the range [M – S, M + S]. If P(i, j) – M < S, then P(i, j) = P(i, j), else P(i, j) = M. IMAQ Vision for G Reference Manual 5-26 © National Instruments Corporation Chapter 5 Spatial Filtering Median Filter The median filter is a lowpass filter. It assigns to each pixel the median value of its neighborhood, effectively removing isolated pixels and reducing details. However, the median filter does not blur the contour of objects. P(i, j) = median value of the series [P(n, m)]. Nth Order Filter The Nth order filter is an extension of the median filter. It assigns to each pixel the Nth value of its neighborhood (when sorted in increasing order). The value N specifies the order of the filter, which you can use to moderate the effect of the filter on the overall light intensity of the image. A lower order corresponds to a darker transformed image; a higher order corresponds to a brighter transformed image. Each pixel is assigned the Nth value of its neighborhood, N being specified by the user. P(i, j) = Nth value in the series [P(n, m)], where the P(n, m) are sorted in increasing order. The following example uses a 3 × 3 neighborhood: P(i – 1, j – 1) P(i, j – 1) P(i + 1, j – 1) P(i – 1, j) P(i, j) P(i + 1, j) P(i – 1, j + 1) P(i, j + 1) P(i + 1, j + 1) = 13 10 9 12 4 8 5 5 6 The following table shows the new output value of the central pixel for each Nth order value: Nth Order 0 1 2 3 4 5 6 7 8 New Pixel Value 4 5 5 6 8 9 10 12 13 Note that for a given filter size f, the Nth order can rank from 0 to f 2 – 1. For example, in the case of a filter size 3, the Nth order ranges from 0 to 8 (32 – 1). © National Instruments Corporation 5-27 IMAQ Vision for G Reference Manual Chapter 5 Spatial Filtering Examples To see the effect of the Nth order filter, notice the example of an image with bright objects and a dark background. When viewing this image with the B&W (or Gray) palette, the objects have higher gray-level values than the background. For a Given Filter Size f × f 2 • If N < ( f – 1)/2, the Nth order filter has the tendency to erode bright regions (or dilate dark regions). Example of a Filter Size 3 × 3 Order 0 (smoothes image, erodes bright objects) • If N = 0, each pixel is replaced by its local minimum. 2 • If N = ( f – 1)/2, each pixel is replaced by its local median value. Dark pixels isolated in objects are removed, as well as bright pixels isolated in the background. The overall area of the background and object regions does not change. 2 • If N > ( f – 1)/2, the Nth order filter has the tendency to dilate bright regions (or erode dark regions). Order 4 (equivalent to a median filter) Order 8 (smoothes image, dilates bright objects) 2 • If N = f – 1, each pixel is replaced by its local maximum. IMAQ Vision for G Reference Manual 5-28 © National Instruments Corporation Chapter 6 Frequency Filtering This chapter describes the frequency filters used in IMAQ Vision. Introduction to Frequency Filters Frequency filters alter pixel values with respect to the periodicity and spatial distribution of the variations in light intensity in the image. Highpass frequency filters help isolate abruptly varying patterns which correspond to sharp edges, details, and noise. Lowpass frequency filters help emphasize gradually varying patterns such as objects and the background. Frequency filters do not apply directly to a spatial image, but to its frequency representation. The latter is obtained via a function called the Fast Fourier Transform (FFT). It reveals information about the periodicity and dispersion of the patterns found in the source image. The spatial frequencies seen in an FFT image can be filtered and the Inverse FFT then restores a spatial representation of the filtered FFT image. In an image, details and sharp edges are associated to high spatial frequencies because they introduce significant gray-level variations over short distances. Gradually varying patterns are associated to low spatial frequencies. For example, an image can have extraneous noise such as periodic stripes introduced during the digitization process. In the frequency domain, the periodic pattern is reduced to a limited set of high spatial frequencies. Truncating these particular frequencies and converting the filtered FFT image back to the spatial domain produces a new image in which the grid pattern has disappeared, yet the overall features remain. © National Instruments Corporation 6-1 IMAQ Vision for G Reference Manual Chapter 6 Frequency Filtering Lowpass FFT Filters A lowpass FFT filter attenuates or removes high frequencies present in the FFT plane. It has the effect of suppressing information related to rapid variations of light intensities in the spatial image. In this case, the Inverse FFT command produces an image in which noise, details, texture, and sharp edges are smoothed. Highpass FFT Filters A highpass FFT filter attenuates or removes low frequencies present in the FFT plane. It has the effect of suppressing information related to slow variations of light intensities in the spatial image. In this case, the Inverse FFT command produces an image in which overall patterns are attenuated and details are emphasized. IMAQ Vision for G Reference Manual 6-2 © National Instruments Corporation Chapter 6 Frequency Filtering Mask FFT Filters A mask filter removes frequencies contained in a mask specified by the user. Depending on the mask definition, this filter may behave as a lowpass, bandpass, highpass, or any type of selective filter. Definition The spatial frequencies of an image are calculated by a function called the Fourier Transform. It is defined in the continuous domain as ∞ ∞ F ( u, v ) = ∫ ∫ f ( x, y )e – j2π ( xu + yv ) dx dy –∞ –∞ where f(x, y) is the light intensity of the point (x, y), and (u, v) are the horizontal and vertical spatial frequencies. The Fourier Transform assigns a complex number to each set (u, v). Inversely, a Fast Fourier Transform F(u, v) can be transformed into a spatial image f (x, y) using the following formula: f ( x, y ) = N – 1M – 1 ∑ ∑ F ( u, v )e ux vy j2π ------ + ----- N M u = 0v = 0 In the discrete domain, the Fourier Transform is calculated with an efficient algorithm called the Fast Fourier Transform (FFT). This algorithm requires that the resolution of the image be 2n2m. Notice that the values and n and m can be different, which indicates that the image does not have to be square. N – 1M – 1 1 F ( u, v ) = --------- ∑ ∑ f ( x, y )e NM x = 0 y = 0 © National Instruments Corporation 6-3 ux vy – j2π ------ + ----- N M IMAQ Vision for G Reference Manual Chapter 6 Frequency Filtering where NM is the resolution of the spatial image f(x, y). – j2πux Because e = cos 2πux – j sin 2πux , F(u, v) is composed of an infinite sum of sine and cosine terms. Each pair (u, v) determines the frequency of its corresponding sine and cosine pair. For a given set (u, v), note that all values f (x, y) contribute to F(u, v). Because of this complexity, the FFT calculation is time consuming. The relation between the sampling increments in the spatial domain ( ∆ x, ∆ y) and the frequency domain ( ∆ u, ∆ v) is: 1 ∆u = ----------------N × ∆x 1 ∆v = -----------------M × ∆y The FFT of an image, F(u, v), is a two dimensional array of complex numbers, or a complex image. It represents the frequencies of occurrence of light intensity variations in the spatial domain. The low frequencies (u, v) correspond to smooth and gradual intensity variations found in the overall patterns of the source image. The high frequencies (u, v) correspond to abrupt and short intensity variations found at the edges of objects, around noisy pixels, and around details. FFT Display An FFT image can be visualized using any of its four complex components: real part, imaginary part, magnitude, and phase. The relation between these components is expressed by F(u, v) = R(u, v) + jI(u, v), where R(u, v) is the real part and I(u, v) is the imaginary part, and F(u, v) = F ( u, v ) × e jϕ 〈 u, v〉 , where F ( u, v ) is the magnitude and ϕ(u, v) is the phase. The magnitude of F(u, v) is also called the Fourier spectrum and is equal to F ( u, v ) = 2 R ( u, v ) + I ( u, v ) 2 The Fourier spectrum to the power of two is known as the power spectrum or spectral density. IMAQ Vision for G Reference Manual 6-4 © National Instruments Corporation Chapter 6 Frequency Filtering The phase ϕ(u, v) is also called the phase angle and is equal to I ( u, v ) ϕ ( u, v ) = atan ----------------- . R ( u, v ) Given an image with a resolution NM and given ∆ x and ∆ y the spatial step increments, the FFT of the source image has the same resolution NM and its frequency step increments ∆ u and ∆ v, which are defined in the following equations: 1 ∆u = ----------------N × ∆x 1 ∆v = ------------------ . M × ∆y The FFT of an image has the following two properties: • It is periodic: F(u, v) = F(u + N, v + M) • It is conjugate-symmetric: F(u, v) = F*(–u, –v) These properties result in two possible representations of the Fast Fourier Transform of an image: the standard representation and the optical representation. © National Instruments Corporation 6-5 IMAQ Vision for G Reference Manual Chapter 6 Frequency Filtering Standard Representation High frequencies are grouped at the center while low frequencies are located at the edges. The constant term, or null frequency is in the upper-left corner of the image. The frequency range is [ 0, N∆u ] × [ 0, M∆v ]. Optical Representation Low frequencies are grouped at the center while high frequencies are located at the edges. The constant term, or null frequency, is at the center of the image. The frequency range is M M N N – ---- ∆u, ---- ∆u × – ----- ∆v, ----- ∆v . 2 2 2 2 . IMAQ Vision for G Reference Manual 6-6 © National Instruments Corporation Chapter 6 Frequency Filtering You can switch from the standard representation to the optical representation by permuting the A, B, C and D quarters. Intensities in the FFT image are proportional to the amplitude of the displayed component. Frequency Filters This section describes the frequency filters in detail and includes information on lowpass and highpass attenuation and truncation. Lowpass Frequency Filters A lowpass frequency filter attenuates or removes high frequencies present in the FFT plane. This filter suppresses information related to rapid variations of light intensities in the spatial image. In this case, the Inverse FFT command produces an image in which noise, details, texture, and sharp edges are smoothed. A lowpass frequency filter removes or attenuates spatial frequencies located outside a frequency range centered on the fundamental (or null) frequency. Lowpass Attenuation Lowpass attenuation applies a linear attenuation to the full frequency range, decreasing from f0 to fmax. This is done by multiplying each frequency by a coefficient C which is a function of its deviation from the fundamental and maximum frequencies. © National Instruments Corporation 6-7 IMAQ Vision for G Reference Manual Chapter 6 Frequency Filtering f max – f C ( f ) = -------------------- , f max – f 0 where C( f0) = 1 and C( fmax) = 0. Lowpass Truncation Lowpass truncation removes a frequency f if it falls outside the truncation range [f0, fc]. This is done by multiplying each frequency f by a coefficient C equal to 0 or 1, depending on whether the frequency f is greater than the truncation frequency fc. If f > f c, then C(f ) = 0 else C(f ) = 1. The following series of graphics illustrates the behavior of each type of filter. They give the 3D-view profile of the magnitude of the FFT. This example uses the following original FFT. IMAQ Vision for G Reference Manual 6-8 © National Instruments Corporation Chapter 6 Frequency Filtering After lowpass attenuation, the magnitude of the central peak has been attenuated, and variations at the edges almost have disappeared. After lowpass truncation with fc = f0 + 20%( fmax – f0), spatial frequencies outside the truncation range [ f0, fc ] are removed. The part of the central peak that remains is identical to the one in the original FFT plane. Highpass Frequency Filters A highpass frequency filter attenuates or removes low frequencies present in the FFT plane. It has the effect of suppressing information related to slow variations of light intensities in the spatial image. In this case, the inverse FFT produces an image in which overall patterns are attenuated and details are emphasized. A highpass frequency filter removes or attenuates spatial frequencies located inside a frequency range centered on the fundamental (or null) frequency. © National Instruments Corporation 6-9 IMAQ Vision for G Reference Manual Chapter 6 Frequency Filtering Highpass Attenuation Highpass attenuation applies a linear attenuation to the full frequency range, decreasing from fmax to f0. This is done by multiplying each frequency by a coefficient C which is a function of its deviation from the fundamental and maximum frequencies. f – f0 C ( f ) = -------------------- , f max – f 0 where C( f0) = 1 and C( fmax) = 0. Highpass Truncation Highpass truncation removes a frequency f if it falls inside the truncation range [ f0, fc ]. This is done by multiplying each frequency f by a coefficient C equal to 1 or 0, depending on whether the frequency f is greater than the truncation frequency fc. If f < f c, then C(f) = 0 else C(f) = 1. IMAQ Vision for G Reference Manual 6-10 © National Instruments Corporation Chapter 6 Frequency Filtering The following series of graphics illustrates the behavior of each type of filter. They give the 3D-view profile of the magnitude of the FFT. This example uses the following original FFT image. After highpass attenuation, the central peak has been removed and variations present at the edges remain. © National Instruments Corporation 6-11 IMAQ Vision for G Reference Manual Chapter 6 Frequency Filtering After highpass truncation with fc = f0 + 20%( fmax – f0 ), spatial frequencies inside the truncation range [ f0, fc ] are set to 0. The remaining frequencies are identical to the ones in the original FFT plane. IMAQ Vision for G Reference Manual 6-12 © National Instruments Corporation Chapter Morphology Analysis 7 This chapter provides an overview of morphology image analysis. Morphological transformations extract and alter the structure of objects in an image. You can use these transformations to prepare objects for quantitative analysis, observe the geometry of regions, extract the simplest forms for modeling and identification purposes, and so forth. The morphological transformations can be used for expanding or reducing objects, filling holes, closing inclusions, smoothing borders, removing dendrites, and more. They can be divided into two categories: • Gray-level morphology functions, which apply to gray-level images. • Binary Morphology functions, which apply to binary images. A binary image is an image that has been segmented into an object region (pixels equal to 1) and a background region (pixels equal to 0). Such an image is generated by the thresholding process. Thresholding Thresholding consists of segmenting an image into two regions: an object region and a background region. This is performed by setting to 1 all pixels that belong to a gray-level interval, called the threshold interval. All other pixels in the image are set to 0. You can use this operation to extract areas that correspond to significant structures in an image and to focus the analysis on these areas. © National Instruments Corporation 7-1 IMAQ Vision for G Reference Manual Chapter 7 Morphology Analysis Pixels outside the threshold interval are set to 0 and considered as part of the background area. Pixels inside the threshold interval are set to 1 and considered as part of an object area. Example This example uses the following source image. Highlighting the pixels that belong to the threshold interval [166, 255] (the darkest areas) produces the following image. Highlighting produces the following binary image. A critical and frequent problem in segmenting an image into an object and a background region occurs when the boundaries are not sharply demarcated. In such a case, the choice of a correct threshold becomes subjective. Therefore, it is highly recommended that images be IMAQ Vision for G Reference Manual 7-2 © National Instruments Corporation Chapter 7 Morphology Analysis enhanced prior to thresholding, so as to outline where the correct borders lie. Observing the intensity profile of a line crossing a boundary area can also be helpful in selecting a correct threshold value. Finally, keep in mind that morphological transformations can help you retouch the shape of binary objects and therefore correct unsatisfactory selections that occurred during the thresholding. Thresholding a Color Image To threshold a color image, three threshold intervals need to be specified, one for each color component. The final binary image is the intersection of the three binary images obtained by thresholding each color component separately. Automatic Threshold A number of different automatic thresholding techniques are available, including clustering, entropy, metric, moments, and interclass variance. In contrast to manual thresholding, these methods do not require that the user set the minimal and maximal light intensities. These techniques are well suited for conditions in which the light intensity varies. Depending on your source image, it is sometimes useful to invert (reverse) the original gray scale image before applying an automatic threshold function (for example, moments and entropy). This is especially true for cases in which the region you want to threshold is black and the background you want to eliminate is red (when viewing with a binary palette). Clustering is the only multi-class thresholding method available. Clustering operates on multiple classes so you can create tertiary or even higher level images. The other four methods (entropy, metric, moments, and interclass variance) are reserved for strictly binary thresholding techniques. The choice of which algorithm to apply depends on the type of image to threshold. Clustering In this rapid technique, the image is randomly sorted within a discrete number of classes corresponding to the number of phases perceived in an image. The gray values are determined and a barycenter is determined for each class. This process is repeated until a value is obtained that represents the center of mass for each phase or class. © National Instruments Corporation 7-3 IMAQ Vision for G Reference Manual Chapter 7 Morphology Analysis Example The automatic thresholding method most frequently used is clustering, also known as multi-class thresholding. This example uses a clustering technique in two and three phases on an image. Note that the results from this function are generally independent of the lighting conditions as well as the histogram values from the image. This example uses the following original image. IMAQ Vision for G Reference Manual 7-4 © National Instruments Corporation Chapter 7 Morphology Analysis Clustering in two phases produces the following image. Clustering in three phases produces the following image. © National Instruments Corporation 7-5 IMAQ Vision for G Reference Manual Chapter 7 Morphology Analysis Entropy Based on a classical image analysis technique, this method is best suited for detecting objects that are present in minuscule proportions on the image. For example, this function would be suitable for default detection. Metric Use this technique in situations similar to interclass variance. For each threshold, a value is calculated that is determined by the surfaces representing the initial gray scale. The optimal threshold corresponds to the smallest value. Moments This technique is suited for images that have poor contrast (an overexposed image is better processed than an underexposed image). The moments method is based on the hypothesis that the observed image is a blurred version of the theoretically binary original. The blurring that is produced from the acquisition process (electronic noise or slight defocalization) is treated as if the statistical moments (average and variance) were the same for both the blurred image and the original image. This function recalculates a theoretical binary image. Interclass Variansce Interclass variance is a classical statistic technique used in discriminating factorial analysis. This method is well-suited for images in which classes are not too disproportionate. For satisfactory results, the smallest class must be at least five percent of the largest one. Note that this method has the tendency to underestimate the class of the smallest standard deviation if the two classes have a significant variation. IMAQ Vision for G Reference Manual 7-6 © National Instruments Corporation Chapter 7 Morphology Analysis Structuring Element A structuring element is a binary mask used by most morphological transformations. You can use a structuring element to weigh the effect of these functions on the shape and the boundary of objects. A morphological transformation using a structuring element alters a pixel P0 so that it becomes a function of its neighboring pixels. These neighboring pixels are masked by 1 when the structuring element is centered on P0. A neighbor masked by 0 simply is discarded by the function. The structuring element is a binary mask (composed of 1 and 0 values). It is used to determine which neighbors of a pixel contribute to its new value. A structuring element can be defined in the case of a rectangular or hexagonal pixel frame, as shown in the following examples. © National Instruments Corporation 7-7 IMAQ Vision for G Reference Manual Chapter 7 Morphology Analysis The following graphic illustrates a morphological transformation using a structuring element. This example uses a 3 × 3 image which has a rectangular frame. → p'0 = T( p0, p2, p4, p5, p7) Rectangular Frame, Neighborhood 3 × 3 The next graphic illustrates a morphological transformation using a structuring element for an image that has a hexagonal frame. This example uses a 5 × 3 image. → p'0 = T(p0, p2, p4, p6) Hexagonal Frame, Neighborhood 5 × 3 The default configuration of the structuring element is a 3 × 3 matrix with each coefficient set to 1: 1 1 1 IMAQ Vision for G Reference Manual 7-8 1 1 1 1 1 1 © National Instruments Corporation Chapter 7 Morphology Analysis Primary Binary Morphology Functions The primary morphology functions apply to binary images in which objects have been set to 1 and the background is equal to 0. They include three fundamental binary processing functions: erosion, dilation, and hit-miss. The other transformations derive from combinations of these three functions. The primary morphology transformations are described in detail in this section of the manual. They include: erosion, dilation, opening, closing, inner gradient, outer gradient, hit-miss, thinning, thickening, proper-opening, proper-closing, and auto-median. Note: In the following descriptions, the term pixel denotes a pixel equal to 1 and the term object denotes a group of pixels equal to 1. Erosion Function An erosion eliminates pixels isolated in the background and erodes the contour of objects with respect to the template defined by the structuring element. Concept and Mathematics For a given pixel P0 , the structuring element is centered on P0. The pixels masked by a coefficient of the structuring element equal to 1 are then referred as Pi. In the example of a structuring element 3 × 3, the Pi can range from P0 itself to P8. 1. If the value of one pixel Pi is equal to 0, then P0 is set to 0, else P0 is set to 1. 2. If AND(Pi) = 1, then P0 = 1, else P0 = 0. Dilation Function A dilation has the reverse effect of an erosion because dilating objects is equivalent to eroding the background. This function eliminates tiny holes isolated in objects and expands the contour of the objects with respect to the template defined by the structuring element. Concept and Mathematics For a given pixel P0, the structuring element is centered on P0. The pixels masked by a coefficient of the structuring element equal to 1 then © National Instruments Corporation 7-9 IMAQ Vision for G Reference Manual Chapter 7 Morphology Analysis are referred to as Pi. In the example of a structuring element 3 × 3, the Pi can range from P0 itself to P8. 1. If the value of one pixel Pi is equal to 1, then P0 is set to 1, else P0 is set to 0. 2. If OR(Pi) = 1, then P0 = 1, else P0 = 0. Erosion and Dilation Examples This example uses the following binary source image. The erosion function produces the following image. The dilation function produces the following image. IMAQ Vision for G Reference Manual 7-10 © National Instruments Corporation Chapter 7 Morphology Analysis The next example uses the following source image. Gray cells indicate pixels equal to 1. The following tables show how the structuring element can be used to control the effect of an erosion or a dilation. The larger the structuring element, the more templates can be edited and the more selective the effect. Structuring Element After Erosion Description A pixel is cleared if it is equal to 1 and does not have its three upper-left neighbors equal to 1. The erosion truncates the upper-left borders of the objects. A pixel is cleared if it is equal to 1 and does not have its lower and right neighbors equal to 1. The erosion truncates the bottom and right borders of the objects, but retains the corners. © National Instruments Corporation 7-11 IMAQ Vision for G Reference Manual Chapter 7 Morphology Analysis Structuring Element After Dilation Description A pixel is set to 1 if it is equal to 1 or if it has one of its three upper-left neighbors equal to 1. The dilation expands the lower-right borders of the objects. A pixel is set to 1 if it is equal to 1 or if it has its lower or right neighbor equal to 1. The dilation expands the upper and left borders of the objects. Opening Function The opening function is an erosion followed by a dilation. This function removes small objects and smoothes boundaries. If I is an image, opening(I) = dilation(erosion(I)). This operation does not alter the area significantly and shape of objects because erosion and dilation are dual transformations. Borders removed by the erosion are restored by the dilation. However, small objects that vanish during the erosion do not reappear after the dilation. Closing Function The closing function is a dilation followed by an erosion. It fills tiny holes and smoothes boundaries. If I is an image, closing(I) = erosion(dilation(I)). This operation does not alter significantly the area and shape of objects because dilation and erosion are morphological complements. Borders expanded by the dilation function are reduced by the erosion function. However, tiny holes filled during the dilation do not reappear after the erosion. IMAQ Vision for G Reference Manual 7-12 © National Instruments Corporation Chapter 7 Morphology Analysis Opening and Closing Examples The following series of graphics illustrate examples of openings and closings. 1 1 1 Original Image 1 1 1 1 1 1 1 1 1 1 1 1 1 1 1 1 1 1 1 1 1 1 1 1 1 1 Structuring Element After Opening 1 1 1 1 1 0 1 0 0 Structuring Element After Opening 0 1 1 0 1 1 1 1 0 1 1 0 After Closing 0 1 0 0 Structuring Element After Closing External Edge Function The external edge subtracts the source image from the dilated image of the source image. The remaining pixels correspond to the pixels added by the dilation. If I is an image, external edge(I) = dilation(I) – I = XOR(I, dilation(I)). Internal Edge Function The internal edge subtracts the eroded image from its source image. The remaining pixels correspond to the pixels eliminated by the erosion. If I is an image, internal edge(I) = I – erosion(I) = XOR(I, dilation(I)). © National Instruments Corporation 7-13 IMAQ Vision for G Reference Manual Chapter 7 Morphology Analysis External and Internal Edge Example This example uses the following binary source image. Extraction using a 5 × 5 structuring element produces the following image. The superimposition of the internal edge is in white and the external edge is in gray. The thickness of the extracted contours depends on the size of the structuring element. Hit-Miss Function You can use the hit-miss function to locate particular configurations of pixels. It extracts each pixel of an image that is placed in a neighborhood matching exactly the template defined by the structuring element. Depending on the configuration of the structuring element, the hit-miss function can be used to locate single isolated pixels, cross-shape or longitudinal patterns, right angles along the edges of objects, and other user-specified shapes. The larger the size of the structuring element, the more specific the researched template can be. IMAQ Vision for G Reference Manual 7-14 © National Instruments Corporation Chapter 7 Morphology Analysis Concept and Mathematics For a given pixel P0, the structuring element is centered on P0. The pixels masked by the structuring element are then referred as Pi. In the example of a structuring element 3 × 3, the Pi range from P0 to P8. If the value of each pixel Pi is equal to the coefficient of the structuring element placed on top of it, then the pixel P0 is set to 1, else the pixel P0 is set to 0. In other words, if the pixels Pi define the exact same template as the structuring element, then P0 is set to 1, else P0 is set to 0. A hit-miss function using a structuring element with a central coefficient equal to 0 changes all pixels set to 1 in the source image to the value 0. Example 1 This example uses the following source image. The following series of graphics shows the results of three hit-miss functions applied to the same source image. Each hit-miss function uses a different structuring element (specified above each transformed image). Gray cells indicate pixels equal to 1. © National Instruments Corporation 7-15 IMAQ Vision for G Reference Manual Chapter 7 Morphology Analysis Example 2 This example uses the following binary source image. Given this binary image, the hit-miss function can be used to locate pixels surrounded by various patterns specified via the structuring element. Use the hit-miss function to locate pixels isolated in a background. The structuring element presented on the right extracts all pixels equal to 1 that are surrounded by at least two layers of pixels equal to 0. 0 0 0 0 0 0 0 0 0 0 0 0 1 0 0 0 0 0 0 0 1 1 1 0 1 1 1 1 1 1 1 1 1 1 1 0 0 0 0 0 0 0 0 Use the hit-miss function to locate single pixel holes in objects. The structuring element presented on the right extracts all pixels equal to 0 that are surrounded by at least one layer of pixels equal to 1. Use the hit-miss function to locate pixels along a vertical left edge. The structuring element presented on the right extracts pixels surrounded by at least one layer of pixels equal to 1 to the left and pixels equal to 0 to the right. IMAQ Vision for G Reference Manual 7-16 © National Instruments Corporation Chapter 7 Morphology Analysis Thinning Function The thinning function eliminates pixels that are located in a neighborhood that matches a template specified by the structuring element. Depending on the configuration of the structuring element, thinning can be used to remove single pixels isolated in the background and right angles along the edges of objects. The larger the size of the structuring element, the more specific the template can be. The thinning function extracts the intersection between a source image and its transformed image after a hit-miss function. In binary terms, the operation subtracts its hit-miss transformation from a source image. If I is an image, thinning(I) = I – hit-miss(I) = XOR (I, hit-miss(I)). This operation is useless when the central coefficient of the structuring element is equal to 0. In such cases, the hit-miss function can only change the value of certain pixels in the background from 0 to 1. The subtraction of the thinning function then resets these pixels back to 0 anyway. Examples This example uses the following binary source image. This example uses the thinning function and the following structuring element: 0 0 0 © National Instruments Corporation 7-17 0 1 0 0 0 0 IMAQ Vision for G Reference Manual Chapter 7 Morphology Analysis Thinning produces the following image. Single pixels in the background of this image have been removed. The next example uses the following source image. The following series of graphics shows the results of three thinnings applied to the source image. Each thinning uses a different structuring element (specified above each transformed image). Gray cells indicate pixels equal to 1. Thickening Function The thickening function adds to an image those pixels located in a neighborhood that matches a template specified by the structuring element. Depending on the configuration of the structuring element, thickening can be used to fill holes, smooth right angles along the edges of objects, and so forth. The larger the size of the structuring element, the more specific the template can be. IMAQ Vision for G Reference Manual 7-18 © National Instruments Corporation Chapter 7 Morphology Analysis The thickening function extracts the union between a source image and its transformed image after a hit-miss function that uses the structuring element specified for the thickening. In binary terms, the operation adds a hit-miss transformation to a source image. If I is an image, thickening(I) = I + hit-miss(I) = OR (I, hit-miss(I)). This operation is useless when the central coefficient of the structuring element is equal to 1. In such case, the hit-miss function only can turn certain pixels of the objects from 1 to 0. The addition of the thickening function resets these pixels to 1 anyway. Examples This example uses the following binary source image. Thickening using the structuring element 1 1 1 1 0 1 1 1 1 produces the following image. Single pixel holes are filled. © National Instruments Corporation 7-19 IMAQ Vision for G Reference Manual Chapter 7 Morphology Analysis The next example uses the following source image. The following series of graphics shows the results of three thickenings applied to the source image. Each thickening uses a different structuring element (specified on top of each transformed image). Gray cells indicate pixels equal to 1. Proper-Opening Function The proper-opening function is a finite and dual combination of openings and closings. It removes small particles and smoothes the contour of objects with respect to the template defined by the structuring element. If I is the source image, the proper-opening extracts the intersection between the source image I and its transformed image obtained after a closing, followed by and opening, and followed by another closing. proper-opening(I) = AND(I, OCO(I)), or proper-opening(I) = AND(I, DEEDDE(I)), where I is the source image, E is an erosion, D is a dilation, O is an opening, C is a closing, IMAQ Vision for G Reference Manual 7-20 © National Instruments Corporation Chapter 7 Morphology Analysis F(I) is the image obtained after applying the function F to the image I, and GF(I) is the image obtained after applying the function F to the image I followed by the function G to the image I. Proper-Closing Function The proper-closing function is a finite and dual combination of closings and openings. It fills tiny holes and smoothes the inner contour of objects with respect to the template defined by the structuring element. If I is the source image, the proper-closing extracts the union of the source image I and its transformed image obtained after an opening, followed by and closing, and followed by another opening. proper-closing(I) = OR(I, COC(I)), or proper-closing(I) = OR(I, EDDEED(I)), where I is the source image, E is an erosion, D is a dilation, O is an opening, C is a closing, F(I) is the image obtained after applying the function F to the image I, and GF(I) is the image obtained after applying the function F to the image I followed by the function G to the image I. Auto-Median Function The auto-median function uses dual combinations of openings and closings. It generates simpler objects that have fewer details. If I is the source image, the auto-median function extracts the intersection between the proper-opening and proper-closing of the source image I. auto-median(I) = AND(OCO(I), COC(I)), or auto-median(I) = AND(DEEDDE(I), EDDEED(I)), © National Instruments Corporation 7-21 IMAQ Vision for G Reference Manual Chapter 7 Morphology Analysis where I is the source image, E is an erosion, D is a dilation, O is an opening, C is a closing, F(I) is the image obtained after applying the function F to the image I, and GF(I) is the image obtained after applying the function F to the image I followed by the function G to the image I. Advanced Binary Morphology Functions The advanced morphology functions are conditional combinations of fundamental transformations such as the binary erosion and dilation. They apply to binary images in which a threshold of 1 has been applied to objects and the background is equal to 0. The advanced binary morphology functions include the border, hole filling, labeling, lowpass filters, highpass filters, separation, skeleton, segmentation, distance, Danielsson, circle, and convex functions. Note: In this section of the manual, the term pixel denotes a pixel equal to 1 and the term object denotes a group of pixels equal to 1. Border Function The border function removes objects that touch the border of the image. These objects may have been truncated during the digitization of the image, and their elimination might be useful to avoid erroneous particle measurements and statistics. Hole Filling Function The hole filling function fills the holes within objects. IMAQ Vision for G Reference Manual 7-22 © National Instruments Corporation Chapter 7 Morphology Analysis Labeling Function The labeling function assigns a different gray-level value to each object. The image produced is not a binary image, but a labeled image using a number of gray-level values equal to the number of objects in the image plus the gray level 0 used in the background area. The labeling function can identify objects using connectivity-4 or connectivity-8 criteria. Lowpass Filters The lowpass filter removes small objects with respect to their width (specified by a parameter called filter size). Connectivity-4 Definition Two pixels are considered as part of the same object if they are horizontally or vertically adjacent. The pixels are considered as part of two different objects if they are diagonally adjacent. Connectivity-8 The pixels are considered as part of the same object if they are horizontally, vertically, or diagonally adjacent. Illustration For a same pixel pattern, different sets of objects can be identified. Example For a given filter size N, the lowpass filter eliminates objects with a width less than or equal to (N – 1) pixels. These objects are those that would disappear after (N – 1)/2 erosions. © National Instruments Corporation 7-23 IMAQ Vision for G Reference Manual Chapter 7 Morphology Analysis Highpass Filters The highpass filter removes large objects with respect to their width (specified by a parameter called filter size). For a given filter size N, the highpass filter eliminates objects with a width greater than or equal to N pixels. These objects are those which would not disappear after (N/2 + 1) erosions. Both the highpass and lowpass morphological filters use erosions to determine if an object is to be removed. Therefore, they cannot discriminate objects with a width of 2k pixels from objects with a width of 2k – 1 pixels. For example, one erosion eliminates both objects that are 2-pixels and 1-pixel wide. The precision of the filters then depends on the parity of the filter size N. Highpass filter If N is an even number (N = 2k) If N is an odd number (N = 2k + 1) Lowpass filter • removes objects with a width greater than or equal to 2k • removes objects with a width less than or equal to 2k – 2 • uses k – 1 erosions • uses k – 1 erosions • removes objects with a width greater than or equal to 2k + 1 • removes objects with a width less than or equal to 2k • uses k erosions • uses k erosions Lowpass and Highpass Example This example uses the following binary source image. IMAQ Vision for G Reference Manual 7-24 © National Instruments Corporation Chapter 7 Morphology Analysis For a given filter size, a highpass filter produces the following image. Gray objects and white objects are filtered out by a lowpass and highpass filter, respectively. Separation Function The separation function breaks narrow isthmuses and separates objects that touch each other with respect to an user-specified filter size. For example, after thresholding an image, two gray-level objects overlapping one another might appear as a single binary object. A narrowing can be observed where the original objects intersected each other. If the narrowing has a width of M pixels, a separation using a filter size of (M + 1) breaks it and restore the two original objects. This applies at the same time to all objects that contain a narrowing shorter than N pixels. For a given filter size N, the separation function segments objects having a narrowing shorter than or equal to (N – 1) pixels. These objects are those that are divided into two parts after (N – 1)/2 erosions. This operation uses erosions, labeling, and conditional dilations. The above definition is true when N is an odd number. It needs to be modified slightly when N is an even number. This modification is due to the use of erosions to determine if a narrowing has to be broken or kept. The function cannot discriminate a narrowing with a width of 2k pixels from a narrowing with a width of (2k – 1) pixels. For example, one erosion breaks both a narrowing that is two pixels wide and a narrowing that is one pixel wide. © National Instruments Corporation 7-25 IMAQ Vision for G Reference Manual Chapter 7 Morphology Analysis The precision of the separation is then limited to the elimination of constrictions having a width lesser than an even number of pixels: • If N is an even number (2k), the separation breaks a narrowing with a width smaller than or equal to (2k – 2) pixels. It uses (k – 1) erosions. • If N is an odd number (2k + 1), the separation breaks a narrowing with a width smaller than or equal to 2k. It uses k erosions. Skeleton Functions A skeleton function applies a succession of thinnings until the width of each object becomes equal to one pixel. The skeleton functions are both time- and memory-consuming. They are based on conditional applications of thinnings and openings using various configurations of structuring elements. L-Skeleton Function The L-skeleton function indicates the L-shaped structuring element skeleton function. For example, notice the following original image. The L-skeleton function produces the following rectangle pixel frame image. IMAQ Vision for G Reference Manual 7-26 © National Instruments Corporation Chapter 7 Morphology Analysis M-Skeleton Function The M-skeleton (M-shaped structuring element) function extracts a skeleton with more dendrites or branches. Using the same original image as in the previous example, the M-skeleton function produces the following image. Skiz Function The skiz (skeleton of influence zones) function behaves like an L-skeleton applied to the background regions, instead of the object regions. It produces median lines that are at an equal distance from the objects. Using the same source image as in the previous example, the skiz function produces the following image (shown after superimposition on top of the source image). Segmentation Function The segmentation function is only applied to labeled images. It partitions an image into segments, each centered on an object, such that they do not overlap each other or leave empty zones. This result is obtained by dilating objects until they touch one another. © National Instruments Corporation 7-27 IMAQ Vision for G Reference Manual Chapter 7 Morphology Analysis Note: The segmentation function is time-consuming. It is recommended that you reduce the image to its minimum significant size before selecting this function. In the following image, binary objects (shown in black) are superimposed on top of the segments (shown in gray shades). When applied to an image with binary objects, the transformed image turns entirely red because it is entirely composed of pixels set to 1. Comparisons Between Segmentation and Skiz Functions The segmentation function extracts segments that each contain one object and represent the area in which this object can be moved without intercepting another object (assuming that all objects move at the same speed). The edges of these segments give a representation of the external skeletons of the objects. As opposed to the skiz function, segmentation does not involve median distances. Segments are obtained by successive dilations of objects until they touch each other and cover the entire image. The final image contains as many segments as there were objects in the original image. On the other hand, if you consider the inside of closed skiz lines as segments, you might produce more segments than objects originally present in the image. Notice the upper-right region in the following example. IMAQ Vision for G Reference Manual 7-28 © National Instruments Corporation Chapter 7 Morphology Analysis The following image shows: • Original objects in black • Segments in dotted patterns • Skiz lines Distance Function The distance function assigns to each pixel a gray-level value equal to the shortest distance to the border of the object. That distance may be equal to the distance to the outer border of the object or to a hole within the object. Danielsson Function The Danielsson function also creates a distance map, but is a more accurate algorithm than the classical distance function. Use the Danielsson function instead of the distance function when possible. Example This example uses the following source threshold image. © National Instruments Corporation 7-29 IMAQ Vision for G Reference Manual Chapter 7 Morphology Analysis The image is sequentially processed with a lowpass filter, hole filling, and the Danielsson function. The Danielsson function produces the following distance map image. It is useful to view this final image with a binary palette. In this case, each level corresponds to a different color. The user easily can determine the relation of a set of pixels to the border of an object. The first layer (the layer that forms the border) is colored red. The second layer (the layer closest to the border) is green, the third layer is blue, and so forth. Circle Function The circle function enables the user to separate overlapping circular objects. The circle function uses the Danielsson coefficient to reconstitute the form of an object, provided that the objects are essentially circular. The objects are treated as a set of overlapping discs that is then separated into separate discs. Therefore, it is possible to trace circles corresponding to each object. IMAQ Vision for G Reference Manual 7-30 © National Instruments Corporation Chapter 7 Morphology Analysis Example This example uses the following source image. The circle function produces the following processed image. Convex Function The convex function is useful for closing particles so that measurements can be made on the particle, even though the contour of the object is discontinuous. This command is usually needed in cases in which the sample object is cut because of the acquisition process. The convex function calculates a convex envelope around the perimeter of each object, effectively closing the object. The image to be treated must be both binary and labeled. © National Instruments Corporation 7-31 IMAQ Vision for G Reference Manual Chapter 7 Morphology Analysis Example This example uses the following original binary labeled image. The convex function produces the following image. Gray-Level Morphology The gray-level morphology functions apply to gray-level images. You can use these functions to alter the shape of regions by expanding bright areas at the expense of dark areas and vice-versa. These functions smooth gradually varying patterns and increase the contrast in boundary areas. The gray-level morphology functions include the erosion, dilation, opening, closing, proper-opening, proper-closing, and auto-median functions. These functions derive from the combination of gray-level erosions and dilations that use the structuring element. IMAQ Vision for G Reference Manual 7-32 © National Instruments Corporation Chapter 7 Morphology Analysis Erosion Function A gray-level erosion reduces the brightness of pixels that are surrounded by neighbors with a lower intensity. The concept of neighborhood is determined by the template of the structuring element. Concept and Mathematics Each pixel P0 in an image becomes equal to the minimum value of its neighbors. For a given pixel P0, the structuring element is centered on P0. The pixels masked by a coefficient of the structuring element equal to 1 are then referred as Pi. In the example of a 3 × 3 structuring element, Pi can range from P0 to P8. P0 = min(Pi). Note: A gray-level erosion using a structuring element f × f with all its coefficients set to 1 is equivalent to an Nth order filter with a filter size f × f and the value N equal to 0 (refer to the nonlinear spatial filters). Dilation Function The gray-level dilation has the same effect as the gray-level erosion, because dilating bright regions is equivalent to eroding dark regions. This function increases the brightness of each pixel that is surrounded by neighbors with a higher intensity. The concept of neighborhood is determined by the structuring element. Concept and Mathematics Each pixel P0 in an image becomes equal to the maximum value of its neighbors. For a given pixel P0, the structuring element is centered on P0. The pixels masked by a coefficient of the structuring element equal to 1 are then referred as Pi. In the example of a structuring element 3 × 3, Pi can range from P0 to P8. P0 = max(Pi). Note: A gray-level dilation using a structuring element f × f with all its coefficients set to 1 is equivalent to an Nth order filter with a filter size f × f and the value N equal to f × f – 1 (refer to the nonlinear spatial filters). © National Instruments Corporation 7-33 IMAQ Vision for G Reference Manual Chapter 7 Morphology Analysis Erosion and Dilation Examples This example uses the following source image. The following table provides example structuring elements, and the corresponding eroded and dilated images. Structuring Element 1 1 1 1 1 1 1 1 1 0 1 1 1 0 1 0 1 0 Erosion Dilation Opening Function The gray-level opening function consists of a gray-level erosion followed by a gray-level dilation. It removes bright spots isolated in dark regions and smoothes boundaries. The effects of the function are moderated by the configuration of the structuring element. opening(I) = dilation(erosion (I)). IMAQ Vision for G Reference Manual 7-34 © National Instruments Corporation Chapter 7 Morphology Analysis This operation does not alter significantly the area and shape of objects because erosion and dilation are morphological opposites. Bright borders reduced by the erosion are restored by the dilation. However, small bright objects that vanish during the erosion do not reappear after the dilation. Closing Function The gray-level closing function consists of a gray-level dilation followed by a gray-level erosion. It removes dark spots isolated in bright regions and smoothes boundaries. The effects of the function are moderated by the configuration of the structuring element. closing(I) = erosion(dilation (I)). This operation does not alter significantly the area and shape of objects because dilation and erosion are morphological opposites. Bright borders expanded by the dilation are reduced by the erosion. However, small dark objects that vanish during the dilation do not reappear after the erosion. Opening and Closing Examples This example uses the following source image. © National Instruments Corporation 7-35 IMAQ Vision for G Reference Manual Chapter 7 Morphology Analysis The opening function produces the following image. Consecutive applications of an opening or closing command always give the same results. A closing function produces the following image. Proper-Opening Function The gray-level proper-opening is a finite and dual combination of openings and closings. It removes bright pixels isolated in dark regions and smoothes the boundaries of bright regions. The effects of the function are moderated by the configuration of the structuring element. If I is the source image, the proper-opening extracts the minimum value of each pixel between the source image I and its transformed image obtained after a closing, followed by an opening, and followed by another closing. proper-opening(I) = min(I, OCO (I)), or proper-opening(I) = min(I, DEEDDE(I)), where I is the source image, IMAQ Vision for G Reference Manual 7-36 © National Instruments Corporation Chapter 7 Morphology Analysis E is an erosion, D is a dilation, O is an opening, C is a closing, F(I) is the image obtained after applying the function F to the image I, and GF(I) is the image obtained after applying the function F to the image I followed by the function G to the image I. Proper-Closing Function The proper-closing is a finite and dual combination of closings and openings. It removes dark pixels isolated in bright regions and smoothes the boundaries of dark regions. The effects of the function are moderated by the configuration of the structuring element. If I is the source image, the proper-closing extracts the maximum value of each pixel between the source image I and its transformed image obtained after an opening, followed by a closing, and followed by another opening. proper-closing(I) = max(I, COC(I)), or proper-closing(I) = max(I, EDDEED(I)), where I is the source image, E is an erosion, D is a dilation, O is an opening, C is a closing, F(I) is the image obtained after applying the function F to the image I, and GF(I) is the image obtained after applying the function F to the image I followed by the function G to the image I. © National Instruments Corporation 7-37 IMAQ Vision for G Reference Manual Chapter 7 Morphology Analysis Auto-Median Function The auto-median function uses dual combinations of openings and closings. It generates simpler objects that have fewer details. If I is the source image, the auto-median extracts the minimum value of each pixel between the two images obtained by applying a proper-opening and a proper-closing of the source image I. auto-median(I) = min(OCO(I), COC(I)), or auto-median(I) = min(DEEDDE(I), EDDEED(I)), where I is the source image, E is an erosion, D is a dilation, O is an opening, C is a closing, F(I) is the image obtained after applying the function F to the image I, and GF(I) is the image obtained after applying the function F to the image I followed by the function G to the image I. IMAQ Vision for G Reference Manual 7-38 © National Instruments Corporation Chapter 8 Quantitative Analysis This chapter provides an overview of quantitative image analysis. The quantitative analysis of an image consists of obtaining densitometry and object measurements. Before starting this analysis, it is necessary to calibrate the image spatial dimensions and intensity scale to obtain measurements expressed in real units. Spatial Calibration Spatial calibration consists of correlating the area of a pixel with physical dimensions. The latter can be defined by three parameters: X Step, Y Step, and Unit. X Step and Y Step are the horizontal and vertical lengths of a pixel. Unit is the selected unit of distance. The area of a pixel is then equal to (X Step × Y Step)Unit 2. If a pixel represents a square area, then X Step = Y Step = Sampling Step. The spatial calibration of an image can be performed using two methods: • Pixel calibration, or editing the dimensions of a single pixel • Distance calibration, or editing a the length of a line selected in the image © National Instruments Corporation 8-1 IMAQ Vision for G Reference Manual Chapter 8 Quantitative Analysis Intensity Calibration Intensity calibration consists of correlating the gray-scale values to user-defined quantities such as optical densities or concentrations. The intensity calibration of an image is performed in two steps: • Selection of sample points in an image and calibration of their gray-level value • Selection of a curve-fitting algorithm to calibrate the entire gray scale The following example uses an 8-bit image, or 256 gray levels. Definition of a Digital Object In digital images, objects can be defined by three criteria: intensity threshold, connectivity, and area threshold. Intensity Threshold Objects are characterized by an intensity range. They are composed of pixels with gray-level values belonging to a given threshold interval (overall luminosity or gray shade). Then other pixels are considered part of the background. The threshold interval is defined by the two parameters [Lower Threshold, Upper Threshold]. In the case of binary objects the Threshold Interval is [1, 1]. IMAQ Vision for G Reference Manual 8-2 © National Instruments Corporation Chapter 8 Quantitative Analysis Connectivity Once the pixels belonging to a specified intensity threshold are identified, they are grouped into objects. This process introduces the notion of adjacent pixels or connectivity. In a rectangular pixel frame, each pixel P0 has eight neighbors, as shown in the following graphic. From a mathematical point of view, the pixels P1, P3, P5, P7 are closer to P0 than the pixels P2, P4, P6, and P8. P8 P1 P2 P7 P0 P3 P6 P5 P4 If D is the distance from P0 to P1, then the distances between P0 and its eight neighbors can range from D to 2 D, as shown in the following graphic. 2D D D 0 2D D 2D D 2D Connectivity-8 A pixel belongs to an object if it is at a distance D or 2 D from another pixel in the object. Two pixels are considered as part of a same object if they are horizontally, vertically, or diagonally adjacent. In the following image, the object count equals 1. © National Instruments Corporation 8-3 IMAQ Vision for G Reference Manual Chapter 8 Quantitative Analysis Connectivity-4 A pixel belongs to an object if it is at a distance D from another pixel in the object. Two pixels are considered as part of a same object if they are horizontally or vertically adjacent. They are considered as part of two different objects if they are diagonally adjacent. In the following image, the object count equals 4. Area Threshold Finally a size criteria can be specified to detect only objects falling in a given area range. The area threshold is defined by the two parameters [Minimum Area, Maximum Area]. Examples In the following example, 1 pixel = 1 square inch. Objects to Detect Lower Upper Minimum Threshold Threshold Area Black objects (gray level 0) as small as 1 sq-µi. Maximum Area 0 0 1 65536 255 255 500 65536 Labeled objects placed in a black background and ranging from 200 to 1000 sq-µi. 1 255 200 1000 Light-gray objects belonging to the gray-level range [190, 200] and smaller than 3000 sq-µi. 190 200 1 3000 White objects (gray level 255) bigger than 500 sq-µi. IMAQ Vision for G Reference Manual 8-4 © National Instruments Corporation Chapter 8 Note: Quantitative Analysis The most straightforward way to isolate objects is to use the threshold function and convert them to binary objects. This method offers the advantage of clearly showing the objects while the threshold interval remains constant and equal to [1, 1]. Object Measurements A digital object can be characterized by a set of morphological and intensity parameters described in the Areas, Lengths, Coordinates, Chords and Axes, Shape Equivalence, Shape Features, Densitometry, and Diverse Measurements sections. Areas This section describes the following area parameters: • Number of pixels—Area in number of pixels • Particle area—Area expressed in real units (based on image spatial calibration) • Scanned area—Area of the entire image expressed in real units • Ratio—Ratio of the object area to the entire image area • Number of holes—Number of holes within the object • Holes’ area—Total area of the holes • Total area—Area of the object including its holes’ area (equals Particle Area + Holes’ Area) Particle Number Identification number assigned to an object. Particles are numbered starting from 1 in increasing order from the upper-left corner of the image to the lower-right corner. Number of Pixels Number of pixels in an object. This value gives the area of an object, without holes, in pixel units. Particle Area Area of an object expressed in real units. This value is equal to Number of pixels when the spatial calibration is such that one pixel represents one square unit. © National Instruments Corporation 8-5 IMAQ Vision for G Reference Manual Chapter 8 Quantitative Analysis Scanned Area Area of the entire image expressed in real units. This value is equal to the product (Resolution X × X-Step)(Resolution Y × Y-Step). Ratio The percentage of the image occupied by all objects. particle area scanned area Ratio = -------------------------------- Number of Holes Number of holes inside an object. The software detects holes inside an object as small as 1 pixel. Holes’ Area Total area of the holes within an object. Total area Area of an object including the area of its holes. This value is equal to (Particle Area + Holes’ Area). Note: An object located inside a hole of a bigger object is identified as a separate object. The area of a hole that contains an object includes the area covered by the object. IMAQ Vision for G Reference Manual 8-6 © National Instruments Corporation Chapter 8 Quantitative Analysis Object # Particle Area Holes’ Area Total Area Object 1 A B+C A+B+C Object 2 D 0 D Object 3 E F+G E+F+G Object 4 G 0 G Lengths This section describes the following length parameters: • Particle perimeter—Length of the outer contour. • Holes’ perimeter—Sum of the perimeters of the holes within the object • Width—Distance between the left-most and right-most pixels in the object • Height—Distance between the upper-most and lower-most pixels in the object Particle Perimeter Length of the outer contour of an object. Holes’ Perimeter Sum of the perimeters of the holes within an object. Note: Holes’ measurements can turn into valuable data when studying constituents A and B such that B is occluded in A. If the image can be processed so that the B regions appear as holes in A regions after a threshold, the ratio (Holes Area ÷ Particle Total Area) gives the percentage of B in A. Holes’ perimeter gives the length of the boundary between A and B. Breadth Distance between the left-most and right-most pixels in an object, or max(Xi) – min(Xi). It is also equal to the horizontal side of the smallest horizontal rectangle containing the object, or the difference maxX – minX. © National Instruments Corporation 8-7 IMAQ Vision for G Reference Manual Chapter 8 Quantitative Analysis Height Distance between the upper-most and lower-most pixels in an object, or max(Yi) – min(Yi). It is also equal to the vertical side of the smallest horizontal rectangle containing the object, or the difference maxY – minY. Coordinates Coordinates are expressed with respect to an origin (0, 0), located at the upper-left corner of the image. This section describes the following coordinate parameters: • Center of Mass (X, Y)—Coordinates of the center of gravity • Min X, Min Y—Upper-left corner of the smallest horizontal rectangle containing the object • Max X, Max Y—Lower-right corner of the smallest horizontal rectangle containing the object • Max chord X and Y—Left-most point along the longest horizontal chord Center of Mass X and Center of Mass Y Coordinates of the center of gravity of an object. The center of gravity of an object composed of N pixels Pi is defined as the point G such that 1OG = --N i=N ∑ OP , and i i=1 i=N 1center of mass X G = --∑ Xi . Ni = 1 XG gives the average location of the central points of horizontal segments in an object. i=N 1Center of Mass Y G = --∑ Yi . Ni = 1 YG gives the average location of the central points of horizontal segments in an object. Note: G can be located outside an object if the latter has a convex shape. IMAQ Vision for G Reference Manual 8-8 © National Instruments Corporation Chapter 8 Quantitative Analysis Min(X, Y) and Max(X, Y) Coordinates of the upper-left and lower-right corners of the smallest horizontal rectangle containing an object. The origin (0, X, Y) has two pixels that have the coordinates (minX, minY) and (maxX, maxY) such that minX = min(Xi ) minY = min(Yi ) maxX = max(Xi ) maxY = max(Yi ) where Xi and Yi are the coordinates of the pixels Pi in an object. Max Chord X and Max Chord Y Coordinates of the left-most pixel along the longest horizontal chord in an object. Chords and Axes This section describes the following chord and axis parameters: • Max chord length—Length of the longest horizontal chord • Mean chord X—Mean length of horizontal segments • Mean chord Y—Mean length of vertical segments • Max intercept—Length of the longest segment (in all possible directions) © National Instruments Corporation 8-9 IMAQ Vision for G Reference Manual Chapter 8 Quantitative Analysis • Mean intercept perpendicular—Mean length of the segments perpendicular to the max intercept • Particle orientation—Orientation in degree with respect to the horizontal axis Max Chord Length Length of the longest horizontal chord in an object. Mean Chord X Mean length of horizontal segments in an object. Mean Chord Y Mean length of vertical segments in an object. Max Intercept Length of the longest segment in an object (in all possible directions of projection). Mean Intercept Perpendicular Mean length of the segments in an object perpendicular to the max intercept. paricle area max intercept Mean intercept perpendicular = -------------------------------- Particle Orientation The angle of the longest axis with respect to the horizontal axis. The value can be between 0° and 180°. IMAQ Vision for G Reference Manual 8-10 © National Instruments Corporation Chapter 8 Quantitative Analysis Notice that this value does not give information regarding the symmetry of the particle. Therefore, an angle of 190° is considered the same as 10°. Shape Equivalence This section describes the following shape-equivalence parameters: • Equivalent ellipse minor axis—Minor axis of the ellipse that has the same area as the object and a major axis equal to half its max intercept • Ellipse major axis—Major axis of the ellipse that has the same area and same perimeter as the object • Ellipse minor axis—Minor axis of the ellipse that has the same area and same perimeter as the object • Ellipse Ratio—Ratio of the major axis of the equivalent ellipse to its minor axis • Rectangle big side—Big side of the rectangle that has the same area and same perimeter as the object • Rectangle small side—Small side of the rectangle that has the same area and same perimeter as the object • Rectangle ratio—Ratio of the big side of the equivalent rectangle to its small side © National Instruments Corporation 8-11 IMAQ Vision for G Reference Manual Chapter 8 Quantitative Analysis Equivalent Ellipse Minor Axis The equivalent ellipse minor axis is the minor axis of the ellipse that has the same area as the object and a major axis equal to half the max intercept of the object. This definition gives the following set of equations: particle area = πab, and max intercept = 2a. The equivalent ellipse minor axis is defined as 4 × particle area π × max intercept 2b = ------------------------------------------ . Ellipse Major Axis The ellipse major axis is the total length of the major axis of the ellipse that has the same area and same perimeter as an object. This length is equal to 2a. This definition gives the following set of equations Area = πab 2 2 Perimeter = π 2 ( a + b ) This set of equations can be expressed so that the sum a + b and the product ab become functions of the parameters Particle Area and Particle Perimeter. a and b then become the two solutions of the polynomial equation X 2 – (a + b)X + ab = 0. IMAQ Vision for G Reference Manual 8-12 © National Instruments Corporation Chapter 8 Quantitative Analysis Notice that for a given area and perimeter, only one solution (a, b) exists. Ellipse Minor Axis The ellipse minor axis is the total length of the minor axis of the ellipse that has the same area and same perimeter as an object. This length is equal to 2b. Ellipse Ratio The ellipse ratio is the ratio of the major axis of the equivalent ellipse to its minor axis. ellipse major axis ellipse minor axis a b It is defined as ------------------------------------------ = --- . The more elongated the equivalent ellipse, the higher the ellipse ratio. The closer the equivalent ellipse is to a circle, the closer to 1 the ellipse ratio. Rectangle Big Side Rectangle big side is the length of the big side (a) of the rectangle that has the same area and same perimeter as an object. This definition gives the following set of equations Area = ab Perimeter = 2 ( a + b ) This set of equations can be expressed so that the sum a + b and the product ab become functions of the parameters Particle Area and Particle Perimeter. a and b then become the two solutions of the 2 polynomial equation X – (a + b)X + ab = 0. Notice that for a given area and perimeter, only one solution (a, b) exists. © National Instruments Corporation 8-13 IMAQ Vision for G Reference Manual Chapter 8 Quantitative Analysis Rectangle Small Side Rectangle small side is the length of the small side of the rectangle that has the same area and same perimeter as an object. This length is equal to b. Rectangle Ratio Rectangle ratio is the ratio of the big side of the equivalent rectangle to its small side. rectangle big side rectangle small side a b It is defined as ------------------------------------------------ = --- . The more elongated the equivalent rectangle, the higher the Rectangle ratio. The closer the equivalent rectangle is to a square, the closer to 1 the Rectangle ratio. Shape Features This section describes the following shape-feature parameters: • Moments of Inertia—Moments of Inertia Ixx, Iyy, Ixy with respect to the center of gravity • Elongation factor—Ratio of the longest segment within the object to the mean length of the perpendicular segments • Compactness factor—Ratio of the object area to the area of the smallest rectangle containing the object • Heywood Circularity factor—Ratio of the object perimeter to the perimeter of the circle with the same area • Hydraulic Radius—Ratio of the object area to its perimeter • Waddel Disk Diameter—Diameter of the disk with the same area as the object Moments of Inertia Ixx, Iyy, Ixy The moments of inertia give a representation of the distribution of the pixels in an object with respect to its center of gravity. IMAQ Vision for G Reference Manual 8-14 © National Instruments Corporation Chapter 8 Quantitative Analysis Elongation Factor The elongation factor is the ratio of the longest segment within an object to the mean length of the perpendicular segments. It is defined as max intercept ----------------------------------------------------------------------- . mean perpendicular intercept The more elongated the shape of an object, the higher its elongation factor. Compactness Factor The compactness factor is the ratio of an object area to the area of the smallest rectangle containing the object. It is defined as particle area ----------------------------------------- . breadth × width The compactness factor belongs to the interval [0, 1]. The closer the shape of an object is to a rectangle, the closer to 1 the compactness factor. Heywood Circularity Factor The Heywood circularity factor is the ratio of an object perimeter to the perimeter of the circle with the same area. It is defined as particle perimeter particle perimeter ------------------------------------------------------------------------------------------------------------- = ------------------------------------------------ . perimeter of circle with same area as particle 2 π × particle area The closer the shape of an object is to a disk, the closer the Heywood circularity factor to 1. Hydraulic Radius The hydraulic radius is the ratio of an object area to its perimeter. It is defined as particle area ------------------------------------------- . particle perimeter © National Instruments Corporation 8-15 IMAQ Vision for G Reference Manual Chapter 8 Quantitative Analysis If a particle is a disk with a radius R, then its hydraulic radius is equal to 2 πR R ---------- = --- . 2πR 2 The hydraulic radius is equal to half the radius R of the circle such that particle area circle area -------------------------------------- = ------------------------------------------- . particle perimeter circle perimeter Waddel Disk Diameter Diameter of the disk with the same area as the particle. It is defined as 2 particle area -------------------------------------- . π The following tables list the definition of the primary measurements and the measurements that are derived from them. Definitions of Primary Measurements A Area p Perimeter Left Left-most point Top Top-most point Right Right-most point Bottom Bottom-most point Px Projection x Py Projection y IMAQ Vision for G Reference Manual 8-16 © National Instruments Corporation Chapter 8 Quantitative Analysis Derived Measurements Symbol Derived Measurement Primary Measurement l Width Right – Left h Height Bottom – Top d Diagonal 2 l +h 2 Mx Center of Mass X (Σx)/A My Center of Mass Y (Σy)/A Ixx Inertia XX (Σx2) – A × Mx2 Iyy Inertia YY (Σy2) – A × My2 Ixy Inertia XY (Σxy) – A × Mx × My Cx Mean Chord X A/Py Cy Mean Chord X A/Px Smax Max Intercept (Cmax /h)2 × max(h, l) + d(1 – (Cmax /l)2) Mean Perpendicular Intercept A/Smax A2b Equivalent Ellipse Minor Axis 4 × A / ( π Smax) d° Orientation If Ixx = Iyy , C then d°= 45, 90 atan ( 2 × I XY ÷ ( I XX – I YY ) ) else d° = -----------------------------------------------------------------If Ixx ≥ Iyy and Ixy ≥ 0, then d° = 180 - d° If Ixx ≥ Iyy and Ixy < 0, then d° = –d° E2a Ellipse major axis (2a) © National Instruments Corporation If Ixx < Iyy, then d° = 90 – d° If d° < 0, then d° = 0° 2 E 2a = 2 p p 2π 2π --------2- + ------ + --------2- – -----A A 2π 2π 8-17 IMAQ Vision for G Reference Manual Chapter 8 Quantitative Analysis Symbol Derived Measurement Primary Measurement E2b Ellipse minor axis (2b) Eab Ellipse Ratio E2a / E2b Rc Rectangle big side ¼ (p + t´ ) where t´ = p – 16A rc Rectangle small side ¼ (p – t´ ) where t´ = p – 16A RRr Rectangle Ratio Rc /rc Fe Elongation factor Smax /C π Fc Compactness factor A/(h × l) FH Heywood Circularity factor p -------------2 πA Ft Type factor Rh Hydraulic Radius Rd Waddel Disk Diameter 2 2 p p 2π 2π --------2- + ------ – --------2- – -----A A 2π 2π E 2b = 2 2 2 A --------------------------------4π I XX × I YY A/p A 2 --π Densitometry IMAQ Vision contains the following densitometry parameters: • Minimum Gray Value—Minimum intensity value in gray-level units • Maximum Gray Value—Maximum intensity value in gray-level units • Sum Gray Value—Sum of the intensities in the object expressed in gray-level units • Mean Gray Value—Mean intensity value in the object expressed in gray-level units • Standard deviation—Standard deviation of the intensity values • Minimum User Value—Minimum intensity value in user units IMAQ Vision for G Reference Manual 8-18 © National Instruments Corporation Chapter 8 Quantitative Analysis • Maximum User Value—Maximum intensity value in user units • Sum User Value—Sum of the intensities in the object expressed in user units • Mean User Value —Mean intensity value in the object expressed in user units • Standard deviation (Unit)—Standard deviation of the intensity values in user units Diverse Measurements These primary coefficients are used in the computation of measurements such as moments of inertia and center of gravity. IMAQ Vision contains the following diverse-measurement parameters • SumX—Sum of the x coordinates of each pixel in a particle • SumY—Sum of the y coordinates of each pixel in a particle • SumXX, SumYY, SumXY—Sum of x coordinates squared, sum of y coordinates squared, and sum of xy coordinates for each pixel in a particle • Corrected Projection X—Sum of the horizontal segments that do not superimpose any other horizontal segment • Corrected Projection Y—Sum of the vertical segments that do not superimpose any other horizontal segment © National Instruments Corporation 8-19 IMAQ Vision for G Reference Manual VI Overview and Programming Concepts Chapter 9 This chapter contains an overview of IMAQ Vision programming concepts, describes the Base and Advanced versions of IMAQ Vision, and lists the VIs included in these versions. It also provides a summary of the icons used in the function reference chapters of this manual. Images An image is a function of the light intensity f(x, y) where x and y represent the spatial coordinates of a point in an image and f is the brightness of the point (x, y). The pixel depth and the number of planes in an image determines the image type. Multiple image types are supported by IMAQ Vision. The decision to encode an image in 8 bits, 16 bits, or in a floating value is influenced by several factors: the nature of the image, the type of image processing you need to use, and the type of analysis you need to perform. For example, 8-bit encoding is sufficient if you plan to perform a morphology analysis (for example, surface or elongation factor). On the other hand, if the goal is to obtain a highly precise quantification of the light intensity from an image or a region of an image, then 16-bit or 32-bit (floating-point) encoding is required. VIs that perform frequency-domain operations can be applied to images that are Fourier transformed. Each pixel in a Fourier-transformed image, called a complex image, is encoded as 2 × 32-bit floating. It is also possible to acquire and process a real color image, known as RGB chunky. This image type is encoded in 32 bits, 8 bits for the alpha channel (not used in IMAQ Vision), and 8 bits each for the red, green, and blue planes. The most common operation applied to this image type is the extraction of the color, light, saturation, or hue component from the image. The final result is an 8-bit image that can be processed as a classical monochrome image. © National Instruments Corporation 9-1 IMAQ Vision for G Reference Manual Chapter 9 VI Overview and Programming Concepts The image types mentioned above are all supported by IMAQ Vision. However, certain operations on specific image types do not have any practical sense (for example, applying the logic operator AND to a complex image). Other image types, particularly images encoded in files as 1-bit, 2-bit, or 4-bit images are not directly supported by IMAQ Vision. In these cases, IMAQ Vision automatically transforms the image into an 8-bit image (minimum for IMAQ Vision) when opening the image file. This transformation is transparent and has no effect on the use of these image types in IMAQ Vision. In IMAQ Vision, the image type is defined at the creation of the image object by the VI IMAQ Create. The default image type is 8-bit (a single image plane encoded in 8 bits per pixel), the most prevalent image type for the scientific and industrial fields. IMAQ Vision, however, is designed to acquire and process images encoded in 10-bit, 12-bit, or 16-bit as well as in floating point and true color (RGB). IMAQ Vision VIs This section describes the organization of the IMAQ Vision VIs. It also describes the icons used in both IMAQ Vision and the VI reference chapters in this manual. Image-Type Icons In this manual, the following icons describe the image types supported by each VI. Icon IMAQ Vision for G Reference Manual Type Description 0 8 bits per pixel (unsigned, standard monochrome) 1 16 bits per pixel (signed) 2 32 bits (floating point) per pixel 3 2 × 32 bits (floating point) per pixel (native format after a FFT) 4 32 bits per pixel (RGB chunky, standard color) 9-2 © National Instruments Corporation Chapter 9 VI Overview and Programming Concepts An IMAQ Vision image has other attributes in addition to its type and size. The calibration attribute defines the physical horizontal and vertical dimensions of the pixels. The ability to calibrate two axes permits you to correct defaults resulting from the captor (not uncommon). These coefficients are used only when performing calculations (for example, surface or perimeter) based on morphological transformations. They have no effect on either processing or operations between images. For optimization reasons, a border also exists. This border is a space that is physically reserved in the image and it is completely transparent to you. This border is necessary when you want to perform a morphological transformation, a convolution, or particle analysis. These processes all use neighboring operations between pixels. These operations consist of applying a new value to a pixel in relation to the value of its neighbor. The advantage of the border is that all pixels can be treated the same when performing these types of operations. A detailed discussion of the techniques used for image analysis can be found in chapters 1 through 8 of this manual. These methods can be applied directly to an application built with IMAQ Vision and LabVIEW or BridgeVIEW. MMX Compatibility of IMAQ Vision for G This section discusses MMX technology and the MMX features available in IMAQ Vision for G. About Intel MMX Technology Intel released its first Pentium chip with MMX technology early in 1997 and since then has released the Pentium II chip, a Pentium Pro chip with MMX technology. These new chips are completely compatible with existing Intel architecture and operating systems and are applications transparent. MMX technology consists of 57 new instructions, which operate on a new 64-bit data type (QWORD), and eight new 64-bit registers. Those instructions can do calculations on eight BYTE, four WORD, or two DWORD simultaneously, which theoretically can speed up calculations two, four, or eight times. However, MMX has some restrictions. A significant restriction is that MMX instructions cannot handle floating-point calculations, and extra CPU time is need to switch from MMX instructions to regular floating-point instructions. © National Instruments Corporation 9-3 IMAQ Vision for G Reference Manual Chapter 9 VI Overview and Programming Concepts Overview of MMX Features in IMAQ Vision for G Currently IMAQ Vision supports Intel MMX technology in the areas of arithmetic operations, logic operations, comparison operations, linear filtering, morphology, and processing operations. Only those algorithms suitable for MMX optimization were chosen. At the first instance of a VI from IMAQ Vision, the presence of the MMX capability of the CPU is automatically detected and a MMX enabling flag is set. During subsequent VI executions, IMAQ Vision will execute MMX instructions if the MMX enabling flag is set and regular instructions if the MMX enabling flag is not set. The following special considerations apply to the use of MMX with IMAQ Vision: • Only 8-bit image types are optimized. • For operations where the use of a mask is permitted, only the case where no mask is specified is optimized. • For the maximum optimization of the MMX instructions, you should try to align your image data width to a multiple of eight pixels. For the following operations, alignment of four pixels is required to achieve maximum optimization: multiply, multiply constant, average, average constant, sigma, Sobel, Prewitt, lowpass, convolute, and correlate. • Convolution is best optimized when the scaling factor is 1. MMX Icon In this manual, the following symbol designates functions that are optimized for MMX. IMAQ VI Error Clusters Your IMAQ VIs use a standard control and indicator (error in and error out) to notify you that an error has occurred. The error in and error out parameters are described here. error in (no error) is a cluster that describes the error status before this VI executes. If error in indicates that an error occurred before this VI was called, this VI might choose not to execute its function, but just pass the error through to its error out cluster. If no error has occurred, IMAQ Vision for G Reference Manual 9-4 © National Instruments Corporation Chapter 9 VI Overview and Programming Concepts this VI executes normally and sets its own error status in error out. Use the Error Handler VIs to look up the error code and to display the corresponding error message. Using error in and error out clusters is a convenient way to check errors and to specify execution order by wiring the error output from one subVI to the error input of the next. status is TRUE if an error occurred before this VI was called, or FALSE if not. If status is TRUE, code is a nonzero error code. If status is FALSE, code can be 0 or a warning code. code is the number identifying an error or warning. If status is TRUE, code is a nonzero error code. If status is FALSE, code can be 0 or a warning code. Use the Error Handler VIs to look up the meaning of this code and to display the corresponding error message. source is a string that indicates the origin of the error, if any. Usually, source is the name of the VI in which the error occurred. error out is a cluster that describes the error status after this VI executes. If an error occurred before this VI was called, error out is the same as error in. Otherwise, error out shows the error, if any, that occurred in this VI. Use the Error Handler VIs to look up the error code and to display the corresponding error message. Using error in and error out clusters is a convenient way to check error and to specify execution order by wiring the error output from one subVI to the error input of the next. status is TRUE if an error occurred, or FALSE if not. If status is TRUE, code is a nonzero error code. If status is FALSE, code can be 0 or a warning code. code is the number identifying an error or warning. If status is TRUE, code is a nonzero error code. If status is FALSE, code can be 0 or a warning code. Use the Error Handler VIs to look up the meaning of this code and to display the corresponding error message. source is a string that indicates the origin of the error, if any. Usually, source is the name of the VI in which the error occurred. © National Instruments Corporation 9-5 IMAQ Vision for G Reference Manual Chapter 9 VI Overview and Programming Concepts Base and Advanced Versions of IMAQ Vision IMAQ Vision is available in both a Base version and an Advanced version. The description of each VI is accompanied by an icon that denotes whether the VI is included in both the Base and Advanced versions or the Advanced version only . VIs in the Base and Advanced Versions Both versions of IMAQ Vision contain the following VI families. Icon Name of VI Family Management Chapter 10 Functionality of VIs Creating, listing, and disposing of image structures Error handling for all the VIs in IMAQ Vision Files 11 Image acquisition Reading and writing images to and from disk files Display (basics, special, tools, and user) 12 All aspects of image visualization (color palettes) and its control; you can control up to 16 image windows as well as six user floating windows Image window managers that you can use to select various tools for creating and manipulating a region of interest Tools* (pixels, image, and diverse) 13 Manipulation of images (for example, reduction, expansion, extraction, and modification of pixel values) Transformation of the contents of an image to and from a LabVIEW array *Certain Tools and Analysis VIs are restricted to the Advanced version of IMAQ Vision. IMAQ Vision for G Reference Manual 9-6 © National Instruments Corporation Chapter 9 VI Overview and Programming Concepts Analysis* 19 Analysis of the contents of an image Geometry 20 3D view, rotate, shift, and symmetry Color 22 Color image processing and analysis (histogram, threshold) Manipulation of color images planes (conversions) External Library Support 23 Access to information about image pixel organization. Useful for creating device-driver VIs *Certain Tools and Analysis VIs are restricted to the Advanced version of IMAQ Vision. VIs in the Advanced Version Only IMAQ Vision Advanced contains all the functions found in Base as well as an additional set of VIs. Icon Name of VI Family Conversion © National Instruments Corporation Chapter Functionality of VIs 14 Linear or nonlinear conversions from one image type into another 9-7 IMAQ Vision for G Reference Manual Chapter 9 Icon VI Overview and Programming Concepts Name of VI Family Operators (Arithmetic, Logic, and Comparison) Chapter Functionality of VIs 15 Addition, Subtraction, Multiplication, Division, Ratio and Modulo between two images or between one image and a constant Logic operators include AND, NAND, OR, NOR, XOR, XNOR, and LogDiff between two images or between one image and a constant. Clear or Set as a function of a relational operator between two images or between one image and a constant Masking and the extraction of a minimum, maximum, or average can be performed between two images or between an image and a constant Processing 16 Threshold, Label, LUT (lookup table), Transformation, and so forth Filters 17 Convolutions, construction and choosing of user-defined kernels Nonlinear Filters (for example, gradient, lowpass, Prewitt, Sobel, and Roberts) Morphology 18 Morphology functions for editing binary images, including erosions, dilations, closings, openings, edge detection, thinning, thickening, hole filling, low pass, high pass, distance mapping, and rejection of particles touching the border Morphology functions for modifying gray scale images, including erosions, dilations, closings, openings, and auto-median Complex 21 Frequency processing including FFT, Inverse FFT, Truncation, Attenuation, Addition, Subtraction, Multiplication, and Division for complex images Functions for extraction and manipulation of planes IMAQ Vision for G Reference Manual 9-8 © National Instruments Corporation Chapter 9 VI Overview and Programming Concepts In the Advanced version, the following VIs are added to the existing VI families. Icon Name of VI Family Chapter Functionality of VIs Tools 13 Calibration, control of offset, and the ability to create a mask starting from a user-selected point and a user-defined tolerance value Analysis 19 Simple and complex particle detection Extraction of measurement and morphological coefficients for each object in an image Manipulation of Images by IMAQ Vision An 8-bit encoded image, possessing a resolution 512 × 512 occupies 262,144 bytes or 256 KB of memory. Because LabVIEW and BridgeVIEW cannot realistically handle these large regions of memory, IMAQ Vision itself is responsible for managing these image spaces. Inherent in all VIs belonging to the IMAQ Vision library is an input of one or more image structures. These structures are managed directly by IMAQ Create. Each image must be given a unique name that is a generic structure representing all aspects contained and associated with an image. An image structure can contain different data or information. The image structure is dependent on the image processing and type of functions that you need to perform. This image structure which enters each VI is a specific data type (a cluster in the G programming language) resulting directly or indirectly form the execution of IMAQ Create. In order to execute its operation, the VI must have information about which image is processed and which image (the original or another) should receive the results. This image structure provides this information when entering a VI. © National Instruments Corporation 9-9 IMAQ Vision for G Reference Manual Chapter 9 VI Overview and Programming Concepts To create an image, use the procedure illustrated in the following graphic. An image is created and referenced by the name Image Src. This name is displayed in the VI front panel of all VIs that receive data from this image structure. The cluster New Image resulting from the output must be connected with the Image type input. This connection identifies the image to be processed. Multiple images can be created by executing IMAQ Create the number of times corresponding to the number of images desired. Each image created requires a unique name. The number or required images can be determined from an analysis of your intended application. The decision is based upon different processing phases and your need to keep the original image (after each processing step). In the preceding example, two images (Gray and Binary) are created, and at the first stage are completely empty (the size is equal to (0, 0)). After the video acquisition, the Gray image contains the captured image at a size (x, y). Then a thresholding is performed using the VI IMAQ Threshold. Note that this VI possesses two inputs, Image Src and Image Dst, that receive the images Gray and Binary, respectively. Immediately prior to the execution of this function (IMAQ Threshold), the size of the Binary image is (0, 0). Immediately following this IMAQ Vision for G Reference Manual 9-10 © National Instruments Corporation Chapter 9 VI Overview and Programming Concepts threshold, the Binary image has the exact same size as the Gray image and contains the data resulting from the threshold Gray image. Depending on the type of function performed by a VI, different combinations of input and output are possible. In the above example, the Gray image is intact because it is connected only to the input Image Src. You can use this flexibility to decide, as in the case above, which image is to be processed and where the resulting image is to be stored. The output Image Dst Out from a VI gives the same image cluster as that which is connected to the input Image Dst. Therefore, it would seem that the connections from the input Image Dst or the output Image Dst Out to subsequent VIs (downstream in the processing flow) are equivalent. However, the difference between the two is that Image Dst Out can be used to synchronize processes without resorting to using a LabVIEW or BridgeVIEW sequence structure. The following graphic shows several connection types used in IMAQ Vision. This connection schema applies only to VIs that analyze an image and therefore do not modify either the size or contents of the image. Examples of these types of operations include particle analysis and histogram calculations. In the following schema, an Image Mask is introduced. The presence of an Image Mask input indicates that the processing or analysis is dependent on the contents of another image (the Image Mask). The processing of each pixel in Image is dependent on the corresponding pixel (residing in the Image Mask) having a value different than zero. This image mask must be an 8-bit image type and its contents are considered to be binary (zero or different than zero). © National Instruments Corporation 9-11 IMAQ Vision for G Reference Manual Chapter 9 VI Overview and Programming Concepts If you want to apply a processing or analysis function to the entire image, do not connect the Image Mask input. The connection of the same image to both inputs Image and Image Mask also gives the same effect as leaving the input Image Mask unconnected, except in this case the Image must be an 8-bit image. The following connection schema applies to VIs performing an operation that fills an image. Examples of this type of operation include reading a file, a video acquisition, or transforming a G 2D array (IMAQ ArrayToImage) into an image. This type of VI can modify the size of an image. The following connection schema applies to VIs that process an image. This connection is the most common type in IMAQ Vision. The Image Src input receives the image to process. The Image Dst output can receive either another image or the original, depending on your goals. If two different images are connected to the two inputs, then the original Image Src image is not modified. If the Image Dst and Image Src inputs receive the same image, then the processed image is placed into the original image and the original image data is lost. A shortcut exists to join the two inputs if you prefer to have a single image for both source and destination. In this case, you can connect only the Image Src input. Functionally this shortcut is equivalent to connecting the same image to Image Dst. The following graphic illustrates the two functionally equivalent connections. The Image Dst image is the image that receives the processing results. Depending on the functionality of the VI, this image can be either the same or a different image type as that of the source image. IMAQ Vision for G Reference Manual 9-12 © National Instruments Corporation Chapter 9 VI Overview and Programming Concepts The description of each VI and the type of image that can be connected to their Image inputs are described in the VI reference chapters (10 through 23) of this manual. In all cases, the size of an image connected to Image Dst is irrelevant as it is modified automatically by the VI to correspond to the source image size. The existence of the output Image Dst Out enables you to synchronize the various processes without systematically creating a new LabVIEW or BridgeVIEW sequence structure. The name available from the output Image Dst Out is the same as that supplied by the Image Dst except its contents are different after executing the VI. The following connection schema applies to VIs that perform arithmetic or logical operations between two images. Two source images exist for the destination image. The user can perform an operation between two images A and B and then either store the result in another image or in one of the two source images. In the latter case, you can consider the original data to be unnecessary after the processing has occurred. The following combinations are possible in this schema. In the schema on the left, the three images are all different. Image Src A and Image Src B are intact after processing and the results from this operation are stored in Image Dst. In the schema in the center, Image Src A is also connected to the Image Dst which therefore receives the results from the operation. In this operation the source data for Image Src A is overwritten. In the schema on the right, Image Src B receives the results from the operation. Any operation between two images requires that the images have the same size. However, arithmetic operations can be performed between two different types of images (for example, 8-bit and 16-bit). © National Instruments Corporation 9-13 IMAQ Vision for G Reference Manual Chapter 9 VI Overview and Programming Concepts Certain other data structures are frequently used in IMAQ Vision. All VIs that use coordinates (for example, line or rectangle) use an array of integers. Rectangle The entity Rectangle is composed of four coordinates (Left / Top / Right / Bottom). A rectangle is specified by constructing an array of integers containing the following information: Rectangle[0] Rectangle[1] Rectangle[2] Rectangle[3] = = = = L, where L is the left-horizontal position. T, where T is the top-vertical position. R, where R is the right-horizontal position. B, where B is the bottom-vertical position. An image with a resolution of 256 × 256 is composed of the points [0, 0] to [255, 255] but the rectangle takes into account the entirety of the image [0, 0, 256, 256]. The right-horizontal and the bottom-vertical positions must be greater than 1 for the last specified column and line. The default coordinates for a rectangle are [0, 0, 32767, 32767]. If these coordinate values are shown (in the front panel of the VI), the rectangle input is not connected. In this case the entire image is taken into account when the operation is performed. Line The entity Line is composed of four coordinates distributed in two points. Each point contains horizontal and vertical information. An array of integers must be constructed to specify a line. This includes the following information. Line[0] = x1 Line[1] = y1 Line[2] = x2 Line[3] = y2 where x1 is the horizontal starting position. where y1 is the vertical starting position. where x2 is the horizontal end-point position. where y2 is the vertical end-point. No default vector is defined. In executing this type of VI, you must connect a table of four elements. Note that a line contains 256 points; the line [0, 0, 255, 255] also contains 256 points. IMAQ Vision for G Reference Manual 9-14 © National Instruments Corporation Chapter 9 VI Overview and Programming Concepts Table of pixels The entity table of pixels is represented as a 2D array. The first dimension in a G array is the vertical axis and the second dimension is the horizontal axis. In memory, the pixels are stored in the order of the X axis. Y Dimension (I32) X Dimension (I32) Connectivity 4/8 Specific-label and particle-measurement VIs possess the input Connectivity 4/8. This parameter determines how the algorithm determines whether two adjacent pixels are part of the same particle. Connectivity 4 Connectivity 8 Example The gray points in the original image define the particle. In connectivity 4, six particles are detected. In connectivity 8, three particles are detected Original Image © National Instruments Corporation Connectivity 4 9-15 Connectivity 8 Particles IMAQ Vision for G Reference Manual Chapter 9 VI Overview and Programming Concepts Structuring Element A structuring element is a 2D G array. It is used specifically for morphological transformations. The values contained in this array are either 0 or 1. These values dictate which pixels are to be taken into account during processing. The use of a structuring element requires that the image contain a border. The application of a 3 × 3 structuring element requires a minimal border size of 1. In the same way, a structuring elements of 5 × 5 and 7 × 7 require a minimal border size of 2 and 3, respectively. Structuring elements greater than these sizes require corresponding increases in the image border. 3×3 5×5 7×7 The coordinate locations of the central pixel (the pixel being processed) is determined as a function of the structuring element. In this example the coordinates of the processed pixels are (1, 1), (2, 2), and (3, 3). Note that the origin is always the upper left-hand corner pixel. Square/Hexa Remember that a digital image is a 2D array of pixels arranged in a regular rectangular grid. In image processing, this grid can have two different (pixel) frames: square or hexagonal. Therefore the structuring element that is applied during a morphological transformation can have either a square frame or hexagonal frame; you decide whether to use a square frame or hexagonal frame. This decision affects how the algorithm perceives the image during processing, when using those functions that use this concept of a frame. The chosen pixel frame directly affects the output from morphological measurements (for example, perimeter and surface). Notice, however, that the frame has no effect on the availability of the pixel in memory. By default, the square frame is used in IMAQ Vision. The use of a hexagonal frame is advised for obtaining highly precise results. As shown in the following graphics, the even lines (with respect to the odd lines) have shifted a half pixel right. The hexagonal frame places the pixels in a configuration approaching a true circle. In those cases when IMAQ Vision for G Reference Manual 9-16 © National Instruments Corporation Chapter 9 VI Overview and Programming Concepts the hexagonal frame is used, not all the structuring element values are used. Only the values possessing an x are used. All VIs that use this information have the input Square/Hexa. Square 3 × 3 Hexagonal 3 × 3 The size of the structuring element directly determines the speed of the morphological transformation. Different results occur when the contents of the structuring element are changed. It is recommended that you understand morphology or learn how to use these elements before changing the standard structuring element. The structuring elements shown below each give a different result. © National Instruments Corporation 9-17 IMAQ Vision for G Reference Manual Chapter 10 Management VIs This chapter describes the functionality of the IMAQ Vision Management VIs. IMAQ Create Creates an image. Note: IMAQ Create must be used in conjunction with IMAQ Dispose in order to avoid saturating the memory reserved for LabVIEW or BridgeVIEW. Border Size determines the width in pixels of the border created around an image. These pixels are used only for specific VIs. You should create a border at the beginning of your application if an image is to be processed later using functions that require a border (for example, labeling and morphology). The default value, 0, creates no border. To optimize transfer time, especially for real-time acquisition, use a border that is an even number of pixels wide. The following graphic illustrates an 8 × 6 image with a border equal to 0. © National Instruments Corporation 10-1 IMAQ Vision for G Reference Manual Chapter 10 Management VIs In the following 8 × 6 image, the border equals 2. Image Name is a name that is associated with the created image. Each image created must have a unique name. Image Type. This parameter specifies the image type. This input can accept the following values: 0 8 bits per pixel (unsigned, standard monochrome) 1 16 bits per pixel (signed) 2 32 bits (floating point) per pixel 3 2 × 32 bits (floating point) per pixel (native format after an FFT) 4 32 bits per pixel (RGB chunky, standard color) error in (no error) is a cluster that describes the error status before this VI executes. For more information about this control, see the section IMAQ VI Error Clusters in Chapter 9, VI Overview and Programming Concepts. New Image is the Image structure that is supplied as input to all subsequent (downstream) functions used by IMAQ Vision. Multiple images can be created in a LabVIEW or BridgeVIEW application. Activating the IMAQ ImageStatus VI shows you all created images and the space they occupy in memory during the execution of your application. error out is a cluster that describes the error status after this VI executes. For more information about this indicator, see the section IMAQ Vision for G Reference Manual 10-2 © National Instruments Corporation Chapter 10 Management VIs IMAQ VI Error Clusters in Chapter 9, VI Overview and Programming Concepts. IMAQ Create&LockSpace Creates a new image that has a permanently-allocated maximum memory space. Using this VI, the pixel memory space allocated to an image can increase but never decreases. This mechanism guarantees that an image that has filled a certain amount of memory always is able to occupy the same space, regardless of memory fragmentation. Note: IMAQ Create is recommended over IMAQ Create&LockSpace for most applications. IMAQ Create&LockSpace must be used only in applications in which the memory requirements are stringent. IMAQ Create&LockSpace must be used in conjunction with IMAQ Dispose to avoid saturating the memory reserved for LabVIEW or BridgeVIEW. Note: IMAQ Create&LockSpace is hidden in the Image palette but can be found in Manage.llb. Border Size determines the width in pixels of the border created around an image. These pixels are used only for specific VIs. You should create a border at the beginning of your application if an image is to be processed later using functions that require a border (for example, labeling and morphology). The default value, 0, creates no border. To optimize transfer time, especially for real-time acquisition, use a border that is an even number of pixels wide. Image Name is the name that is associated with the created image. Image Type specifies the image type. Refer to the IMAQ Create section for a description of the various image types supported in IMAQ Vision. X Resolution specifies the X size of the image to be created. © National Instruments Corporation 10-3 IMAQ Vision for G Reference Manual Chapter 10 Management VIs Y Resolution specifies the Y size of the image to be created. This parameter, X Resolution, and Border Size define the memory that is allocated permanently for this image. error in (no error) is a cluster that describes the error status before this VI executes. For more information about this control, see the section IMAQ VI Error Clusters in Chapter 9, VI Overview and Programming Concepts. New Image is the image structure that is supplied as input to all subsequent functions used by IMAQ Vision. error out is a cluster that describes the error status after this VI executes. For more information about this indicator, see the section IMAQ VI Error Clusters in Chapter 9, VI Overview and Programming Concepts. IMAQ Dispose Destroys an image and frees the space it occupied in memory. This VI must be used for each image created in an application to free the memory allocated to IMAQ Create. IMAQ Dispose is only executed when the image reference is no longer used in an application. You can use IMAQ Dispose for each call to IMAQ Create or just once for all images created with IMAQ Create. Image is the name of the image to be destroyed. All Images? (No) determines whether the user wants to destroy a single image or all previously created images. Giving a TRUE value on input destroys all images previously created. The default is FALSE. This function must be used at the end of an application to free the memory occupied by the images. error in (no error) is a cluster that describes the error status before this VI executes. For more information about this control, see the section IMAQ Vision for G Reference Manual 10-4 © National Instruments Corporation Chapter 10 Management VIs IMAQ VI Error Clusters in Chapter 9, VI Overview and Programming Concepts. error out is a cluster that describes the error status after this VI executes. For more information about this indicator, see the section IMAQ VI Error Clusters in Chapter 9, VI Overview and Programming Concepts. Note: When a LabVIEW or BridgeVIEW application is aborted the image space remains occupied. Image Processing (Generic) IMAQ Error An error-management facility for IMAQ Vision that can be programmed to perform specific actions in case of an error. The previous error code also can be read. Error Processing is a number representing the type of error processing you need to use. This value is used only when the Boolean Set Error Condition is set to TRUE. The following values are possible: 0 Dialog Displays a Stop/Continue dialog box, to determine whether to stop or continue when an error occurs. Dialog is the default value. 1 Stop Stops in case of error. 2 Ignore Ignores all errors and does not display an error message. © National Instruments Corporation 10-5 IMAQ Vision for G Reference Manual Chapter 10 Management VIs Set Error Condition rereads the last occurring error (FALSE) or programs a procedure when an error occurs (TRUE). The default value is FALSE. Last Error Code contains the last occurring error code if the Boolean Set Error Condition is set to FALSE. This error code is accessible only once and is reset automatically after reading. Last Error Message contains the message associated with the last error code if the Boolean Set Error Condition is set to FALSE. As in Last Error Code, this error message is accessible only once and is reset automatically after reading Note: Error codes returned from the VIs in IMAQ Vision are not accessible directly. If an error occurs, depending on the error condition chosen (Dialog, Stop, or Ignore), a programmed action is taken. The reading of the last occurring error then is reset. IMAQ Status Lists all the images created and the space in memory occupied. This VI can not be used as a subVI; it must be executed from its front panel. All existing images are written at intervals or step-by-step depending on the action chosen. This VI IMAQ Vision for G Reference Manual 10-6 © National Instruments Corporation Chapter 10 Management VIs also gives the total space in kilobytes occupied by the existing images. It can be used during the writing of an application. © National Instruments Corporation 10-7 IMAQ Vision for G Reference Manual Chapter 11 File VIs This chapter describes the File VIs in IMAQ Vision. IMAQ ReadFile Reads an image file. The file format can be a standard format [APD, TIF, BMP, and PICT (Macintosh Only)] or a non-standard format known to the user. In all cases, the read pixels are converted automatically into the image type passed by Image. Image is the reference to the image structure to which the data from the image file is applied. Load Color Palette? (No) determines whether the user wants to load the color table present in the file (if it exists). If loaded, this table is read and made available to the output Color palette. The default is FALSE. File Options is a cluster of user-optional values that permits the user to read non-standard file formats. The file structure must be known to the user. This cluster consists of the following elements: File Data Type indicates how the image file is encoded. The possible formats are: © National Instruments Corporation 0 1 bit 1 2 bits 2 4 bits 3 8 bits (default) 11-1 IMAQ Vision for G Reference Manual Chapter 11 File VIs 4 16 bits (unsigned) 5 16 bits (signed) 6 16 bits (RGB chunky) 7 24 bits (RGB chunky) 8 24 bits (RGB planar) 9 32 bits (unsigned) 10 32 bits (signed) 11 32 bits (RGB chunky) 12 32 bits (float) 13 48 bits (Complex 2 × 24 int) 14 64 bits (Complex 2 × 32 float) Offset to Data specifies the size, in bytes, of the file header. This part of the file is not taken into account when read. The pixel values are read from the byte immediately after the offset size. The default is 0. Use Min Max determines if the user is using a predetermined minimum and maximum. The technique to determine this minimum and maximum depends on the following input values: 0 Don’t use min max Minimum and maximum are dependent on the type of image. For an 8-bit image, min = 0 and max = 255. 1 Use file values 2 Use optional values Uses the two values described below. Pixel values from the file are scanned one time to determine the minimum and maximum. Then a linear interpolation is performed before loading the image. Optional Min Value is the minimum value of the pixels if Use Min Max is selected in mode 2 (Use optional values). In this IMAQ Vision for G Reference Manual 11-2 © National Instruments Corporation Chapter 11 File VIs case, pixels with a smaller value are altered to match the chosen minimum. The default is 0. Optional Max Value is the maximum value of the pixels if Use Min Max was selected in mode 2 (Use optional values). In this case, pixels with a greater value are truncated to match the chosen maximum. The default is 255. Byte Order determines if the byte weight is to be swapped (Intel or Motorola). The default is FALSE, which specifies Big endian (Motorola). TRUE specifies Little endian (Intel). This function is only useful if the pixels are encoded on more than 8 bits. File Path is the complete path name, including drive, directory, and filename, for the file to be loaded. This path can be supplied either by the user or the VI File Dialog from LabVIEW or BridgeVIEW. error in (no error) is a cluster that describes the error status before this VI executes. For more information about this control, see the section IMAQ VI Error Clusters in Chapter 9, VI Overview and Programming Concepts. Image Out is the reference to the image structure containing the data read from the image file. File Type indicates the file type that is read. This string contains the three indicative characters of the read file: APD (internal file format), TIF, BMP (Windows only) and PICT (Macintosh only). File Type returns xxx if the file format is unknown. File Data Type indicates the pixel size defined in the header for standard image file types. File Options are not necessary for reading standard image files. For other types of image files, the returned values are passed from File Options / File Data Type. Note that the original file type is never modified because only the image in memory is converted. Color Palette contains the RGB color table (if the file has one) read from the file when the user passes the value TRUE for the input Load Color Palette? (No). © National Instruments Corporation 11-3 IMAQ Vision for G Reference Manual Chapter 11 File VIs You can use this VI to open and display an image, as illustrated in the following graphic. IMAQ GetFileInfo Obtains information regarding the contents of the file. This information is supplied only if the file has a standard file format (APD, BMP, TIF, PICT). File Path is the complete path name, including drive, directory, and filename, for the file to be loaded. This path can be supplied either by the user or the VI File Dialog from LabVIEW or BridgeVIEW. error in (no error) is a cluster that describes the error status before this VI executes. For more information about this control, see the section IMAQ VI Error Clusters in Chapter 9, VI Overview and Programming Concepts. Calibration is a cluster containing the following elements. X Step is the horizontal distance separating two adjacent pixels in user units. Y Step is the vertical distance separating two adjacent pixels in user units. Unit is the measuring unit associated with the image. It can have the following values. IMAQ Vision for G Reference Manual 11-4 © National Instruments Corporation Chapter 11 Note: File VIs This data is accessible only if the image is saved in the internal APD file format. For all other file types, this VI returns the values (in mm) X Step = 1, Y Step = 1, and Unit = 3. File Type indicates the file type that is read. This string contains the three indicative characters of the read file: APD (internal file format), BMP, TIF, or PICT (Macintosh only). File Data Type indicates the pixel size defined in the header for standard image file types. X Resolution indicates the horizontal resolution in pixels of the image file. Y Resolution indicates the vertical resolution in pixels of the image file. error out is a cluster that describes the error status after this VI executes. For more information about this indicator, see the section IMAQ VI Error Clusters in Chapter 9, VI Overview and Programming Concepts. IMAQ WriteFile Writes an image in a file. Image is the reference to the image structure to which the data from the image file is applied. File Type describes the file type to be written. The default file type is APD. The file types supported are: BMP, TIFF, PICT (Macintosh only), and AIPD (internal file format). File Path is the complete path name, including drive, directory, and filename, for the file to be loaded. This path can be supplied either by the user or the VI File Dialog from LabVIEW or BridgeVIEW. © National Instruments Corporation 11-5 IMAQ Vision for G Reference Manual Chapter 11 File VIs error in (no error) is a cluster that describes the error status before this VI executes. For more information about this control, see the section IMAQ VI Error Clusters in Chapter 9, VI Overview and Programming Concepts. error out is a cluster that describes the error status after this VI executes. For more information about this indicator, see the section IMAQ VI Error Clusters in Chapter 9, VI Overview and Programming Concepts. Note: The options regulating the saving of an image file can be used for certain file types. These options exist as a cluster that is not visible from the connection panel but is visible from the front panel of the VI. For example, the cluster TIFF Options allows the user to specify the value of certain tags (for example, RowsPerStrip, PhotometricInterpretation, or ByteOrder). To change the default values for a TIFF file it is sufficient to modify the parameter in the front panel of IMAQ WriteFile. IMAQ Vision for G Reference Manual 11-6 © National Instruments Corporation Chapter 12 Display This chapter describes the Display VIs in IMAQ Vision. Introduction The control of image visualization is of primary importance in an imagery application. Image processing and image visualization are distinct and separate elements that should not be confused. An IMAQ Vision image is controlled by IMAQ Create, which is responsible for the manipulation of the image data and its proper preparation for the various processing and analysis functions that can be applied to the image data. On the other hand, image visualization involves the presentation of the image data to the user and how the user works with the visualized images. Note that a typical imagery application has many more images than the number of image windows. IMAQ Vision is used for a wide variety of imagery needs by users with varying skill levels. Four Display sections exist so that the novice user can easily access the basic Display functions while OEMs and other professional users can create imagery applications containing sophisticated display and control capabilities. The Display (basics) library contains VIs that control the display of images in image windows as well as the positioning, opening, and closing of these windows on the display screen. These image windows can be resized, and the user can place scroll bars in these image windows. The user also can regulate when the image data is displayed. Note that these image windows are not LabVIEW or BridgeVIEW panels, and they are directly managed by IMAQ Vision. The Display (tools) library contains VIs for controlling image window tools. These tools include points, lines, rectangles, ovals, and freehand contours that can be used to physically access the image data displayed in the image window. Once accessed, this data can be converted into a region of interest or ROI. The VIs also regulate the user interaction in the IMAQ Vision image windows as well as the events that occur in these image windows. © National Instruments Corporation 12-1 IMAQ Vision for G Reference Manual Chapter 12 Display The Display (user) library enables the advanced user to create and manipulate user windows. These palettes (user windows) are defined by the user and can be used to create sophisticated applications. The Display (Special) library contains advanced functionalities and user-interface management. Display (Basics) IMAQ WindDraw Displays an image in an image window. The image window appears automatically when the VI is executed. Note that by default the image window does not have scroll bars. Scroll bars can be added by using the IMAQ WindSize VI. Window Number (0…15) specifies the image window in which the image is displayed. As many as 16 windows can be displayed simultaneously. Each window is specified with an indicator ranging from 0 to 15. Only the specified image window is affected, and all other image windows remain the same. The default value is 0. Image specifies the image reference for the displayed image. Note: 16-bit and floating-point images can be displayed by using an 8-bit image buffer (Tmp). This 8-bit image buffer, used only to display the image, is calculated as a function of the dynamic range from the image source. The minimum value (min) and the maximum value (max) are calculated automatically. Then the following formula is applied to each pixel: Tmp(x, y) = (Src(x, y) – min) × 255/(max – min). IMAQ Vision for G Reference Manual 12-2 © National Instruments Corporation Chapter 12 Display Title is an image window name. If a string is attached to this input then the image window automatically takes that name. The default name for the image window is Image #<Window Number>. Color Palette is used to apply a color palette to an image window. Color Palette is an array of clusters constructed by the user or supplied by IMAQ GetPalette. This palette is composed of 256 elements for each of the three color planes. A specific color is the result of applying a value between 0 and 255 for each of the three color planes (red, green, and blue). If the three planes have the identical value, then a gray level is obtained. (0 specifies black and 255 specifies white). Note: A color palette is not used for a true color image (RGB). Note: You should use a screen capable of displaying thousands (15/16-bit) or 16 million colors (24-bit). Currently, LabVIEW and BridgeVIEW do not display a full palette of 256 colors (or gray scales) unless your monitor has a display capability of 16 million colors. A true color image does not use a display palette and therefore displays in true color if your monitor is in a 24-bit display mode. Note: (Macintosh only) You can change the palette tolerance in a Macintosh or Power Macintosh. You can display a full palette of 256 colors (or gray scales) even with an 8-bit display mode. In this case it is necessary to use the IMAQ PaletteTolerance VI and change from Tolerant mode to Exact mode. Resize to Image Size? (Y) specifies whether the user wants to resize the image window automatically to fit the image size. The default is set to TRUE (yes), in which case the user does not have to know the size of a source image prior to displaying it. Note: You must use the IMAQ WindSize function to place scroll bars in an image window. error in (no error) is a cluster that describes the error status before this VI executes. For more information about this control, see the section IMAQ VI Error Clusters in Chapter 9, VI Overview and Programming Concepts. error out is a cluster that describes the error status after this VI executes. For more information about this indicator, see the section IMAQ VI Error Clusters in Chapter 9, VI Overview and Programming Concepts. © National Instruments Corporation 12-3 IMAQ Vision for G Reference Manual Chapter 12 Display The following graphic illustrates how to use IMAQ WindDraw. IMAQ WindClose Closes an image window. Note that this VI also clears the space reserved in memory for the image window. Window Number (0…15) specifies the image window to close. It is specified by a number from 0 to 15. The default value is 0. Close All Windows? (N) specifies if all the image windows are to be closed. The default value FALSE (No) closes only the specified window. Setting this value to TRUE closes all windows simultaneously. error in (no error) is a cluster that describes the error status before this VI executes. For more information about this control, see the section IMAQ VI Error Clusters in Chapter 9, VI Overview and Programming Concepts. error out is a cluster that describes the error status after this VI executes. For more information about this indicator, see the section IMAQ VI Error Clusters in Chapter 9, VI Overview and Programming Concepts. Note: At the end of an application it is necessary to remove all image windows from memory. Otherwise, LabVIEW or BridgeVIEW will not have sufficient memory, possibly causing stability problems. The use of this VI is similar to the use of IMAQ Dispose. In the case of IMAQ WindClose, you IMAQ Vision for G Reference Manual 12-4 © National Instruments Corporation Chapter 12 Display remove image windows from memory; and in the case of IMAQ Dispose, you remove image data from memory. In both cases you reallocate free memory to LabVIEW or BridgeVIEW after executing these functions. IMAQ WindShow Shows or hides an image window. Window Number (0…15) specifies the image window to show or hide. It is specified by a number from 0 to 15. The default value is 0. Hide/Show (Show) specifies if an image window is visible. This input is used only when Get/Set Status? is TRUE (Set). Bring To Front? (N) determines if a windows is to be brought to the front. This input is only used when Get/Set Status? is TRUE (Set) and Hide/Show is also TRUE. Get/Set Status? (Set) specifies if the user wants to know if the image window is visible or if the user wants to modify the visibility of an image window. The default is set to TRUE (Set). error in (no error) is a cluster that describes the error status before this VI executes. For more information about this control, see the section IMAQ VI Error Clusters in Chapter 9, VI Overview and Programming Concepts. Visible? returns the present visibility status of the window. A visible image window returns TRUE. Frontmost Window? returns TRUE if an image window is in the front. error out is a cluster that describes the error status after this VI executes. For more information about this indicator, see the section IMAQ VI Error Clusters in Chapter 9, VI Overview and Programming Concepts. © National Instruments Corporation 12-5 IMAQ Vision for G Reference Manual Chapter 12 Display IMAQ WindMove Indicates and sets the position of an image window. Window Number (0…15) is a number from 0 to 15 that specifies the image window. The default value is 0. Coordinates (screen) is a structure that contains the screen coordinates, in X and Y positions, where the image window is located or where the image window will be placed. This input is only necessary when the input Get/Set Status is set to Set. Get/Set Status? (Set) specifies if the user wants to know the coordinates of an image window or change the position of an image window. The default is set to TRUE (Set). error in (no error) is a cluster that describes the error status before this VI executes. For more information about this control, see the section IMAQ VI Error Clusters in Chapter 9, VI Overview and Programming Concepts. Coordinates (screen) returns the present coordinates (X and Y) of an image window. error out is a cluster that describes the error status after this VI executes. For more information about this indicator, see the section IMAQ VI Error Clusters in Chapter 9, VI Overview and Programming Concepts. IMAQ Vision for G Reference Manual 12-6 © National Instruments Corporation Chapter 12 Display IMAQ WindSize Indicates and sets the size of an image window. You also can use this VI to set scroll bars for image windows and test for the presence of scroll bars in an image window. Window Number is a number from 0 to 15 that specifies the image window. The default value is 0. Width & Height is a cluster containing two elements. Setting the input Get/Set Status to TRUE (Set) allows the user to specify the width and height of an image window. If the input is not connected, or if the value is (0, 0), the image window is resized automatically to the image associated with it. Note: This value is independent of the size of the scroll bars. Scrollbars? (N) controls the presence of scroll bars in an image window. By default, scroll bars are not used. An image window can be resized and moved by the user in the presence or absence of scroll bars. Get/Set Status? (Set) determines if the user wants to know the position of an image window or specify the position of an image window. The default value is TRUE (Set). error in (no error) is a cluster that describes the error status before this VI executes. For more information about this control, see the section IMAQ VI Error Clusters in Chapter 9, VI Overview and Programming Concepts. Width & Height returns the present width and height of an image window. Note: The returned value includes the size of the scroll bars. Has Scrollbars? returns the present scroll-bar status for an image window. © National Instruments Corporation 12-7 IMAQ Vision for G Reference Manual Chapter 12 Display error out is a cluster that describes the error status after this VI executes. For more information about this indicator, see the section IMAQ VI Error Clusters in Chapter 9, VI Overview and Programming Concepts. IMAQ GetPalette Selects a display palette. Five predefined palettes are available. To activate a color palette choose a code (0 to 4) for Palette Number and connect the output Color Palette to the input Palette Number of IMAQ WindDraw. Palette Number (gray) enables the user to select one of the five predefined palettes. The relationship between the value and Palette Number is described below. Gray Gray scale is the default palette. The color tables are all identical. Binary Binary palette is designed especially for binary images. Gradient Gradient palette. Rainbow Rainbow palette. Temperature Temperature palette. error in (no error) is a cluster that describes the error status before this VI executes. For more information about this control, see the section IMAQ VI Error Clusters in Chapter 9, VI Overview and Programming Concepts. Color Palette indicates an array of clusters composed of 256 elements for each of the three color planes. A specific color is the result of applying a value between 0 and 255 for each of the three color planes (red, green, and blue). If the three planes have the identical value, then IMAQ Vision for G Reference Manual 12-8 © National Instruments Corporation Chapter 12 Display a gray level is obtained (0 specifies black and 255 specifies white). This output is to be directly connected to the input Color Palette of IMAQ WindDraw. error out is a cluster that describes the error status after this VI executes. For more information about this indicator, see the section IMAQ VI Error Clusters in Chapter 9, VI Overview and Programming Concepts. IMAQ PaletteTolerance (Macintosh/Power Macintosh only) Defines the tolerance for the colors associated to an image window. Note: This VI is specific to Macintosh or Power Macintosh users of IMAQ Vision. Note: This VI is useful only if the display is limited to 8 bits (256 colors or gray scales). By changing the palette tolerance using this VI, you can display a full palette of 256 colors (or gray scales) even with an 8-bit display mode. Window Number (0…15) is a number from 0 to 15 that specifies the image window. The default value is 0. Exact/Tolerant? (Tolerant) sets the tolerance level of the image window. In the Exact mode, 256 colors are associated with an image window (and therefore the other inactive image windows temporarily lose their color). In Exact mode the user can have 256 colors or gray scale even when the display is limited to 8 bits. The user only has a limited number (about 12) of gray scales or colors when working under LabVIEW in the Tolerant mode while in 8-bit display mode. The default mode is Tolerant. © National Instruments Corporation 12-9 IMAQ Vision for G Reference Manual Chapter 12 Display error in (no error) is a cluster that describes the error status before this VI executes. For more information about this control, see the section IMAQ VI Error Clusters in Chapter 9, VI Overview and Programming Concepts. error out is a cluster that describes the error status after this VI executes. For more information about this indicator, see the section IMAQ VI Error Clusters in Chapter 9, VI Overview and Programming Concepts. Display (Tools) This library enables the user to perform the following functions: • Select a region tool for defining an ROI • Manage a standard palette of display tools • Retrieve both the events generated by a user and the associated data from an image window With IMAQ WindToolStatus you can select from a number of region tools including: point, line, rectangle, oval, polygon and freehand. With these tools you can decide which sub-region of an image to analyze or process. These selected regions then can be transformed into an image mask with IMAQ WinGetROI and IMAQ ROIToMask. It is possible to program a region by using the VIs IMAQ MaskToROI and IMAQ WindSetROI. Also you can configure a floating palette of tools from which you can choose a tool by clicking its icon. This palette displays the coordinates of the cursor within the image and the parameters of the active region. You can also magnify (zoom) an image. IMAQ WindLastEvent is used to retrieve and manage the events resulting from the interaction in an image window. IMAQ Vision for G Reference Manual 12-10 © National Instruments Corporation Chapter 12 Display The following figure illustrates the possible interactions found between a user, IMAQ Vision, and LabVIEW or BridgeVIEW. User Action Tool Selection Region Selection Command Action Event © National Instruments Corporation 12-11 Selection IMAQ Vision Display (basics) Display (tools) Display (user) Command Event LabVIEW or BridgeVIEW Application IMAQ Vision for G Reference Manual Chapter 12 Display IMAQ WindToolsSetup Configures the appearance and availability of the region tools found in the WindTools palette. By default, with no input connections, a palette is displayed containing all nine region tools. The WindTools palette is a floating palette and is always visible. Show Coordinates? (T) specifies if the active pixel coordinates are shown. Coordinates are shown (TRUE) by default. Note: Unlike an image window, the WindTools window is not visible unless activated by calling IMAQ WindToolsShow. Note: You must have LabVIEW version 3.1 (or higher) to access the pixel-coordinate and parameter information. Tools specifies which icons are displayed in the WindTools window. There are seven region tools available: Number Icon 0 NA Tool Name Function No Selection NA 1 Point Select a pixel in the image. 2 Line Draw a line in the image. 3 Rectangle Draw a rectangle (or square) in the image. 4 Oval Draw an oval (or circle) in the image. IMAQ Vision for G Reference Manual 12-12 © National Instruments Corporation Chapter 12 Number Icon Tool Name Function 5 Polygon Draw a polygon in the image. 6 Free Draw a freehand region in the image Unused 1 NA. Zoom Zoom-in or zoom-out in an image. Unused 2 NA. 10 Broken Line Draw a broken line in the image. 11 Free Hand Line Draw a free hand line in the image. 7 NA 8 9 NA Display Icons per Line (4) determines the number of icons per line. The subsequent lines are set as a function of the number of remaining available icons. Note: The WindTools palette automatically displays cursor information if the input Icons per Line is set to 3 (or higher) for the Macintosh version and 4 (or higher) for the Windows version. With IMAQ WindLastEvent you can find the coordinates of a selected region. The functionality of region tools can be altered by using a tool while pressing certain keyboard keys. Keyboard options are the same for all platforms: <Shift> before a <Click> adds an ROI. <Shift> while drawing constrains square angles. <Control> before a <Click> displaces an ROI. <Control> and <Click> while drawing produces the last point of a polygon. © National Instruments Corporation 12-13 IMAQ Vision for G Reference Manual Chapter 12 Display The following examples of the WindTools palette have three icons per line. Image-type indicator (8-bit, 16-bit, RGB) Pixel intensity Coordinates of a region within an image Anchoring coordinates of a region Size of an active region Length and vertical displacement angle of a line region The WindTools palette on the left is transformed automatically to the palette on the right when the user manipulates a region tool in an image window. IMAQ WindToolsSelect Obtains or modifies the status of the region tools. IMAQ Vision for G Reference Manual 12-14 © National Instruments Corporation Chapter 12 Display Tool (Point) can have the following values: Number Icon 0 NA Tool Name Function No Selection NA. 1 Point Select a pixel in the image. 2 Line Draw a line in the image. 3 Rectangle Draw a rectangle or square in the image. 4 Oval Draw an oval or circle in the image. 5 Polygon Draw a polygon in the image. 6 Free Draw a freehand region in the image Unused 1 NA. Zoom Zoom-in or zoom-out in an image. Unused 2 NA. 10 Broken Line Draw a broken line in the image. 11 Free Hand Line Draw a free hand line in the image. 7 NA 8 9 NA © National Instruments Corporation 12-15 IMAQ Vision for G Reference Manual Chapter 12 Display Get/Set Status? (Set) specifies if the user wants to know the present status or modify the status of the available region tools. The default is TRUE (Set). error in (no error) is a cluster that describes the error status before this VI executes. For more information about this control, see the section IMAQ VI Error Clusters in Chapter 9, VI Overview and Programming Concepts. Tool returns the chosen region tool. error out is a cluster that describes the error status after this VI executes. For more information about this indicator, see the section IMAQ VI Error Clusters in Chapter 9, VI Overview and Programming Concepts. Note: This VI can be used even if the WindTools palette is not displayed. IMAQ WindToolsShow Shows or hides the WindTools palette and sets the region status. This VI functions in the same way as IMAQ WindShow, which is used for displaying image windows. Hide/Show (Show) specifies whether the tools palette is visible. Use this input only when Get/Set Status (Set) is TRUE (Set). Get/Set Status (Set) specifies if the user wants to know the present status or modify the status of the available region tools. The default is TRUE (Set). error in (no error) is a cluster that describes the error status before this VI executes. For more information about this control, see the section IMAQ VI Error Clusters in Chapter 9, VI Overview and Programming Concepts. Visible? returns the present visibility status of the tools palette. A visible tools palette returns TRUE. IMAQ Vision for G Reference Manual 12-16 © National Instruments Corporation Chapter 12 Display error out is a cluster that describes the error status after this VI executes. For more information about this indicator, see the section IMAQ VI Error Clusters in Chapter 9, VI Overview and Programming Concepts. IMAQ WindToolsMove Obtains or sets the position of the WindTools palette. This VI functions in the same way as IMAQ WindMove, which is used for moving image windows. Coordinates is a structure that contains the screen coordinates (in X and Y positions) where the tools palette is located or where the tools palette will be placed. This input is necessary only when Get/Set Status (Set) is set to TRUE (Set). Get/Set Status (Set) specifies if the user wants to know the present status or modify the status of the available region tools. The default is TRUE (Set). error in (no error) is a cluster that describes the error status before this VI executes. For more information about this control, see the section IMAQ VI Error Clusters in Chapter 9, VI Overview and Programming Concepts. Coordinates indicates the relative position of the event. error out is a cluster that describes the error status after this VI executes. For more information about this indicator, see the section IMAQ VI Error Clusters in Chapter 9, VI Overview and Programming Concepts. © National Instruments Corporation 12-17 IMAQ Vision for G Reference Manual Chapter 12 Display IMAQ WindToolsClose Closes the WindTools window. This VI functions in the same way as IMAQ WindClose, which is used for closing image windows. Note that this function also destroys the space reserved in memory for the WindTools window. error in (no error) is a cluster that describes the error status before this VI executes. For more information about this control, see the section IMAQ VI Error Clusters in Chapter 9, VI Overview and Programming Concepts. error out is a cluster that describes the error status after this VI executes. For more information about this indicator, see the section IMAQ VI Error Clusters in Chapter 9, VI Overview and Programming Concepts. IMAQ WindLastEvent Returns the events generated through the image windows as well as the data associated with them. Event list (all) specifies which events to obtain. The default case returns all events generated through the image windows as well as the IMAQ Vision for G Reference Manual 12-18 © National Instruments Corporation Chapter 12 Display data associated with them. This VI enables you to specify the image window events that interest you. 0 No event No event. 1 Click event A user has clicked in an image window. 2 Draw event A user has drawn in an image window. 3 Move event A user has moved an image window. 4 Size event A user has resized an image window. 5 Scroll event A user has moved the scroll bars in an image window. 6 Activate event A user has chosen (clicked once to activate) an image window. 7 Close event A user has closed an image window. 8 Reserved error in (no error) is a cluster that describes the error status before this VI executes. For more information about this control, see the section IMAQ VI Error Clusters in Chapter 9, VI Overview and Programming Concepts. Window Number (0...15) indicates the image window that is queried for events. Event indicates the type of event. Tool returns a code indicating the region tool used. Coordinates indicates the relative position of the event. Other Parameters supplies information associated with an event, such as positioning and region distances. © National Instruments Corporation 12-19 IMAQ Vision for G Reference Manual Chapter 12 Display The following table describes the possible values for the Event, Tool, Coordinates, and Other Parameters indicators. Event Tool Coordinates 0 None NA 1 Click 0 Cursor [0, 1] position (x, y) of click [0, 1, 2] 8 Zoom [0, 1] position of click [0] zoom factor [2, 3] position of image center [0, 1] position of starting point [0, 1] width and height [2, 3] position of ending point [2] vertical segment angle 2 Draw 1 empty Other Parameters Line empty pixel value* [3] segment length 2 Rectangle [0...3] bounding rectangle [0, 1] width and height 3 Oval [0...3] bounding rectangle [0, 1] width and height 4 Polygon [0...3] bounding rectangle [0, 1] width and height 5 Freehand [0...3] bounding rectangle [0, 1] width and height 3 Move NA [0, 1] position of image window empty 4 Size NA [0, 1] width and height of image window empty 5 Scroll NA [0, 1] empty 6 Activate NA empty empty 7 Close NA empty empty center position of image * Pixel values are stored in the first element of the array for 8-bit, 16-bit, and floating-point images. The RGB values of color images are stored in the order [0, 1, 2]. The real and imaginary values of a complex image are stored in the order [0, 1]. error out is a cluster that describes the error status after this VI executes. For more information about this indicator, see the section IMAQ VI Error Clusters in Chapter 9, VI Overview and Programming Concepts. IMAQ Vision for G Reference Manual 12-20 © National Instruments Corporation Chapter 12 Display The following graphic illustrates how to use IMAQ WindLastEvent. IMAQ WindZoom Obtains or modifies the status of the zoom factor. Window Number (0…15) is a number from 0 to 15 that specifies the image window. The default value is 0. Zoom Factor can have the following values: 1 to 16 and –1 to –16. The default value is 1 (image is displayed at its original size). Center Point is a structure containing two elements containing the (x, y) coordinates used to center the image in the image window. This enables the user to center an image with respect to a user-chosen region. Additionally, Center Point can be used to place only a part of an image into an image window. This value is adjusted automatically when Center Point is not coherent with the size of the image window and the zoom factor. For example, an image at 256 × 256 displayed in an image window of 256 × 256 containing a zoom factor of 1 by definition has a single © National Instruments Corporation 12-21 IMAQ Vision for G Reference Manual Chapter 12 Display Center point of (127, 127). An erroneously entered figure is corrected automatically, making the output value different than the input value. Get/Set Status? (Set) specifies if the user wants to know the present status or modify the Zoom Factor and Center Point. The default is TRUE (Set). error in (no error) is a cluster that describes the error status before this VI executes. For more information about this control, see the section IMAQ VI Error Clusters in Chapter 9, VI Overview and Programming Concepts. Zoom Factor returns the present zoom factor. Center Point returns the present coordinates of the Center Point. error out is a cluster that describes the error status after this VI executes. For more information about this indicator, see the section IMAQ VI Error Clusters in Chapter 9, VI Overview and Programming Concepts. IMAQ WindGrid Obtains or modifies the status of the grid. The grid can be used to help trace a region of interest accurately. Grid Size is a structure containing two elements that encode the size of the horizontal and vertical steps for the grid. The cursor is moved by steps, as defined in this VI, when tracing a region of interest. The default value is (1, 1). Get/Set Status? (Set) specifies whether the user wants to know the present status or modify the step values for the grid. The default is TRUE (Set). IMAQ Vision for G Reference Manual 12-22 © National Instruments Corporation Chapter 12 Display error in (no error) is a cluster that describes the error status before this VI executes. For more information about this control, see the section IMAQ VI Error Clusters in Chapter 9, VI Overview and Programming Concepts. Grid Size returns the present grid-step size. error out is a cluster that describes the error status after this VI executes. For more information about this indicator, see the section IMAQ VI Error Clusters in Chapter 9, VI Overview and Programming Concepts. Regions of Interest Regions of interest can be used to focus your processing and analysis on part of an image. An ROI can be traced using standard contours (oval, rectangle, and so forth) or free contours (freehand). The IMAQ Vision user has the following options: • Associate an ROI with an image window • Extract an ROI associated with an image window • Erase the current ROI from an image window • Transform an ROI into an image mask • Transform an image mask into an ROI An image mask that is converted into an ROI must support an offset. The offset is used to place a newly converted ROI into the space of another image. This offset associates the ROI with an image window that possesses the image data. The offset defines the upper left hand corner coordinates (x, y) for the bounding rectangle belonging to the ROI. The default value of the offset is (0, 0). Image with an ROI © National Instruments Corporation 12-23 Mask without Offset Mask with Offset IMAQ Vision for G Reference Manual Chapter 12 Display (Advanced users only) The ROI Descriptor cluster contains the following two elements: • Bounding rectangle for an ROI • Regions list, which contains • contour identifier, where 0 specifies an exterior contour and 1 specifies an interior contour, • contour type (point, line, rectangle, oval, freehand, and so forth), and • list of points (x, y) describing the contour. IMAQ WindGetROI Returns the descriptor for an ROI. Window Number (0…15) is a number from 0 to 15 that specifies the image window. The default value is 0. error in (no error) is a cluster that describes the error status before this VI executes. For more information about this control, see the section IMAQ VI Error Clusters in Chapter 9, VI Overview and Programming Concepts. ROI Descriptor returns the descriptor for an ROI. error out is a cluster that describes the error status after this VI executes. For more information about this indicator, see the section IMAQ VI Error Clusters in Chapter 9, VI Overview and Programming Concepts. IMAQ Vision for G Reference Manual 12-24 © National Instruments Corporation Chapter 12 Display IMAQ WindSetROI Associates an ROI with an image window. Window Number (0…15) is a number from 0 to 15 that specifies the image window. The default value is 0. ROI Descriptor is the descriptor that defines the region of interest that is associated with an image window. error in (no error) is a cluster that describes the error status before this VI executes. For more information about this control, see the section IMAQ VI Error Clusters in Chapter 9, VI Overview and Programming Concepts. error out is a cluster that describes the error status after this VI executes. For more information about this indicator, see the section IMAQ VI Error Clusters in Chapter 9, VI Overview and Programming Concepts. The following graphic illustrates how an ROI can be created from events generated in an image window. © National Instruments Corporation 12-25 IMAQ Vision for G Reference Manual Chapter 12 Display This example creates a very useful type of ROI called Magic Wand. A Magic Wand is a technique of selecting an ROI based on the pixel intensity value selected by the user. A Magic Wand ROI selects the contours of those pixels with values that fall in the range determined by an input pixel value. In this example IMAQ WindLastEvent is used to retrieve the pixel value directly from a user click in an image window. This value is released to the Tools VI IMAQ MagicWand which creates an image mask based on the input pixel value and a tolerance level also set in IMAQ MagicWand. The mask is then transformed into an ROI (IMAQ MaskToROI and IMAQ WindSetROI). IMAQ WindEraseROI Erases the active region of interest associated with an image window. Window Number (0…15) is a number from 0 to 15 that specifies the image window. The default value is 0. error in (no error) is a cluster that describes the error status before this VI executes. For more information about this control, see the section IMAQ VI Error Clusters in Chapter 9, VI Overview and Programming Concepts. error out is a cluster that describes the error status after this VI executes. For more information about this indicator, see the section IMAQ VI Error Clusters in Chapter 9, VI Overview and Programming Concepts. Note: You can erase an ROI in an image window by pressing <Backspace> when the current image window is active. IMAQ Vision for G Reference Manual 12-26 © National Instruments Corporation Chapter 12 Display IMAQ ROIToMask Transforms a region of interest into a mask. Image Model serves as a template for the destination image where the mask is placed. Image takes the characteristics of Image Model (size and location of ROI) when Image Model is connected. However, the connection of Image Model is optional. This can be any image type supported by IMAQ Vision. Image is the destination image where the mask is copied. This image must be an 8-bit image type. ROI Descriptor is the descriptor that defines the region of interest. Filling Value (255) is the pixel value of the mask. All pixels inside the region of interest take this value. The default value is 255. error in (no error) is a cluster that describes the error status before this VI executes. For more information about this control, see the section IMAQ VI Error Clusters in Chapter 9, VI Overview and Programming Concepts. Image Out is the reference to the image mask transformed from the ROI descriptor. Coordinates out of space? returns TRUE if any ROI data is found outside the space associated with the image. error out is a cluster that describes the error status after this VI executes. For more information about this indicator, see the section IMAQ VI Error Clusters in Chapter 9, VI Overview and Programming Concepts. You can use this VI in two ways. The simplest technique is to connect the input Image Model. In this case you can use the source image, in which the image ROI was drawn, as © National Instruments Corporation 12-27 IMAQ Vision for G Reference Manual Chapter 12 Display a template for the final destination image by connecting it to Image Model. The output image (Image Out) automatically acquires the size of the image and location of the ROI as found in the original source image. However, you do not have to connect an Image Model. In this case the ROI requires an offset that is determined automatically from the upper-left corner of the bounding rectangle described by the ROI. The bounding-rectangle information is part of the ROI Descriptor. IMAQ MaskToROI Transforms an image mask into a region of interest. External edges only (T) specifies whether only the external edges are transformed. The default is TRUE. Image is the image containing the image mask that is transformed into a region of interest. This image must be an 8-bit image. Max number of vectors in ROI is the limit of points that define the contour of a region of interest. This value is 2500 by default but can be increased if necessary. ROI Descriptor returns the descriptor for a region of interest. error out is a cluster that describes the error status after this VI executes. For more information about this indicator, see the section IMAQ VI Error Clusters in Chapter 9, VI Overview and Programming Concepts. IMAQ Vision for G Reference Manual 12-28 © National Instruments Corporation Chapter 12 Display Display (User) This library enables the advanced user to create and manipulate user windows. These palettes (user windows) are defined by the user and can be used to create sophisticated applications. The user window is constructed from two images that are dynamically loaded. Within these images there are defined zones that respond to a user click, just like the buttons in LabVIEW or BridgeVIEW. These zones can be used to control events and their actions interpreted and processed by LabVIEW or BridgeVIEW. These palettes are created in the following manner: • Loading a foreground image that appears when a zone has not been chosen • Loading a background image that appears when a zone has been chosen • Specifying the coordinates of the zones and their mechanical action (how they function) IMAQ WindUserSetup Loads and configures the user window. Window Number (17…22) is a number from 17 to 22 that specifies the user window. It is possible to manipulate six different user windows. The default value is 17. Foreground Image is an 8-bit or RGB user image. The corresponding part of the image is displayed when a zone within this image is FALSE. Background Image is an 8-bit or RGB user image. The corresponding part of the image is displayed when a zone within this image is TRUE. © National Instruments Corporation 12-29 IMAQ Vision for G Reference Manual Chapter 12 Display User Mechanical Actions specifies the method of operation of each zone. Two modes are possible: Note: 0 Switch The first click causes the zone to change to TRUE. A second click on the same zone causes it to change to FALSE. 1 Latch A click on the zone causes it to change to TRUE temporarily. In both cases the status of the zone can be determined using IMAQ WindUserEvent or IMAQ WindUserStatus. User Rectangles is a 2D array that defines the coordinates of each zone in the user window. Each line in this array must contain the four coordinates that specify the position of the zone. error in (no error) is a cluster that describes the error status before this VI executes. For more information about this control, see the section IMAQ VI Error Clusters in Chapter 9, VI Overview and Programming Concepts. error out is a cluster that describes the error status after this VI executes. For more information about this indicator, see the section IMAQ VI Error Clusters in Chapter 9, VI Overview and Programming Concepts. IMAQ WindUserStatus Obtains or modifies the status of each zone in a user window. Window Number (17…22) is a number from 17 to 22 that specifies the user window. The default value is 17. Region Status modifies the status of a user zone (TRUE or FALSE) when the input Get/Set Status? is TRUE (Set). IMAQ Vision for G Reference Manual 12-30 © National Instruments Corporation Chapter 12 Display Get/Set Status? (Set) specifies whether the user needs to know the present status or modify the status of the zones. The default is TRUE (Set). error in (no error) is a cluster that describes the error status before this VI executes. For more information about this control, see the section IMAQ VI Error Clusters in Chapter 9, VI Overview and Programming Concepts. Regions Status returns the present status (TRUE or FALSE) of each zone. error out is a cluster that describes the error status after this VI executes. For more information about this indicator, see the section IMAQ VI Error Clusters in Chapter 9, VI Overview and Programming Concepts. IMAQ WindUserShow Obtains or modifies the status regarding the visibility of a user window. This VI functions in the same way as IMAQ WindShow, which is used for displaying image windows. Window Number (17…22) is a number from 17 to 22 that specifies the user window. The default value is 17. Hide/Show (Show) specifies whether the tools palette is visible. Use this input only when Get/Set Status (Set) is TRUE (Set). Get/Set Status? (Set) specifies whether the user needs to know the present status or modify the status of the zones. The default is TRUE (Set). error in (no error) is a cluster that describes the error status before this VI executes. For more information about this control, see the section IMAQ VI Error Clusters in Chapter 9, VI Overview and Programming Concepts. © National Instruments Corporation 12-31 IMAQ Vision for G Reference Manual Chapter 12 Display Visible? returns the present visibility status of the tools palette. A visible tools palette returns TRUE. error out is a cluster that describes the error status after this VI executes. For more information about this indicator, see the section IMAQ VI Error Clusters in Chapter 9, VI Overview and Programming Concepts. IMAQ WindUserMove Obtains or sets the position of a user window. This VI functions in the same way as IMAQ WindMove, which is used for moving image windows. Window Number (17…22) is a number from 17 to 22 that specifies the user window. The default value is 17. Coordinates is a structure that contains the screen coordinates (in X and Y positions) where the tools palette is located or where the tools palette will be placed. This input is necessary only when Get/Set Status (Set) is set to TRUE (Set). Get/Set Status? (Set) specifies whether the user needs to know the present status or modify the status of the zones. The default is TRUE (Set). error in (no error) is a cluster that describes the error status before this VI executes. For more information about this control, see the section IMAQ VI Error Clusters in Chapter 9, VI Overview and Programming Concepts. Coordinates indicates the relative position of the event. error out is a cluster that describes the error status after this VI executes. For more information about this indicator, see the section IMAQ VI Error Clusters in Chapter 9, VI Overview and Programming Concepts. IMAQ Vision for G Reference Manual 12-32 © National Instruments Corporation Chapter 12 Display IMAQ WindUserClose Closes a user window. This VI functions in the same way as IMAQ WindClose, which is used for closing image windows. Window Number (17…22) is a number from 17 to 22 that specifies the user window. The default value is 17. Close All Windows? (N) specifies if all the image windows are to be closed. The default value FALSE (No) closes only the specified window. Setting this value to TRUE closes all windows simultaneously. error in (no error) is a cluster that describes the error status before this VI executes. For more information about this control, see the section IMAQ VI Error Clusters in Chapter 9, VI Overview and Programming Concepts. error out is a cluster that describes the error status after this VI executes. For more information about this indicator, see the section IMAQ VI Error Clusters in Chapter 9, VI Overview and Programming Concepts. IMAQ WindUserEvent Returns the events generated through the user windows and the data associated with them. © National Instruments Corporation 12-33 IMAQ Vision for G Reference Manual Chapter 12 Display error in (no error) is a cluster that describes the error status before this VI executes. For more information about this control, see the section IMAQ VI Error Clusters in Chapter 9, VI Overview and Programming Concepts. Window Number (17…22) indicates the image window that is queried for events. User Click returns TRUE if a zone has been chosen by a user. User Number returns the zone number chosen by the user. User State returns the present status (TRUE or FALSE) of each zone. after a click has been registered. This output is by definition TRUE when the Mechanical Action of the zone is Latch; reading this event causes the zone to pass to FALSE. error out is a cluster that describes the error status after this VI executes. For more information about this indicator, see the section IMAQ VI Error Clusters in Chapter 9, VI Overview and Programming Concepts. Display (Special) The Display (special) library contains 12 new VIs that help you make more sophisticated user front panels. IMAQ WindSetup Configures the look and attributes of an image window Window Number (0…22) selects the window to configure. The default is 0. IMAQ Vision for G Reference Manual 12-34 © National Instruments Corporation Chapter 12 Display Window can grow? (Yes) enables or disables the user resize window box. Default is TRUE, which indicates windows the user can resize. Window can close? (Yes) shows or does not show the close box of the window. The default is TRUE, which shows the close box. Window has title bar? (Yes) shows or does not show the title bar. The default is TRUE, which shows the title bar. Window is floating? (No) produces either a normal or a floating window. The default is FALSE, which produces a floating window. error in (no error) is a cluster that describes the error status before this VI executes. For more information about this control, see the section IMAQ VI Error Clusters in Chapter 9, VI Overview and Programming Concepts. error out is a cluster that describes the error status after this VI executes. For more information about this indicator, see the section IMAQ VI Error Clusters in Chapter 9, VI Overview and Programming Concepts. IMAQ WindGetMouse When the mouse is moved over an active window, this VI returns the window number and the mouse coordinates. error in (no error) is a cluster that describes the error status before this VI executes. For more information about this control, see the section IMAQ VI Error Clusters in Chapter 9, VI Overview and Programming Concepts. Window Number gives the number of active windows. X mouse coordinate gives the X coordinate of the mouse in the active screen. © National Instruments Corporation 12-35 IMAQ Vision for G Reference Manual Chapter 12 Display Y mouse coordinate gives the Y coordinate of the mouse in the active screen. error out is a cluster that describes the error status after this VI executes. For more information about this indicator, see the section IMAQ VI Error Clusters in Chapter 9, VI Overview and Programming Concepts. IMAQ WindROIColor Selects the color of ROI lines. Color of ROI is a cluster that specifies the color of the ROI. The default color is white. Red gives the red plane intensity. The default is 255. Green gives the green plane intensity. The default is 255. Blue gives the blue plane intensity. The default is 255. error in (no error) is a cluster that describes the error status before this VI executes. For more information about this control, see the section IMAQ VI Error Clusters in Chapter 9, VI Overview and Programming Concepts. error out is a cluster that describes the error status after this VI executes. For more information about this indicator, see the section IMAQ VI Error Clusters in Chapter 9, VI Overview and Programming Concepts. IMAQ Vision for G Reference Manual 12-36 © National Instruments Corporation Chapter 12 Display IMAQ WindDrawRect Refreshes a rectangle in an image window. The advantage of this VI is that refreshing part of an image is always faster than drawing the whole image. Window Number (0…15) selects the window to refresh. The default is 0. Update Rectangle is an array of elements. They are the coordinates of the rectangle to be refreshed (Left / Top / Right / Bottom). error in (no error) is a cluster that describes the error status before this VI executes. For more information about this control, see the section IMAQ VI Error Clusters in Chapter 9, VI Overview and Programming Concepts. error out is a cluster that describes the error status after this VI executes. For more information about this indicator,see the section IMAQ VI Error Clusters in Chapter 9, VI Overview and Programming Concepts. Note: There is a direct relationship between a window number and the last drawn image. Therefore, specifying only the window number is enough to know which image is to be refreshed. IMAQ GetScreenSize Returns the screen size in pixels. © National Instruments Corporation 12-37 IMAQ Vision for G Reference Manual Chapter 12 Display Ref. Point X. Unused. Ref. Point Y. Unused. error in (no error) is a cluster that describes the error status before this VI executes. For more information about this control, see the section IMAQ VI Error Clusters in Chapter 9, VI Overview and Programming Concepts. Screen Width gives the X size of screen. Screen Height gives the Y size of screen. error out is a cluster that describes the error status after this VI executes. For more information about this indicator, see the section IMAQ VI Error Clusters in Chapter 9, VI Overview and Programming Concepts. IMAQ WindXYZoom This VI is similar to IMAQ WindZoom, but allows the user to zoom the image at different scales in X and Y. IMAQ WindXYZoom produces rectangular pixels in displaying the image. Window number (0…15) is a number that specifies the image window. The default value is 0. ZoomFactors X and Y is a cluster containing the zoom factors for X and Y scale. Zoom Factor X ranges from –16 to +16. IMAQ Vision for G Reference Manual 12-38 © National Instruments Corporation Chapter 12 Display Zoom Factor Y ranges from –16 to +16. Center Point is a structure containing two elements that describe the (x, y) coordinates used to center the image in the image window. Using Center Point, you can center an image with respect to a user-chosen region. Additionally, you can use Center Point to place only a part of an image into an image window. X is the horizontal coordinate of the center point. Y is the vertical coordinate of the center point. This value is adjusted automatically in cases in which the Center Point value is not coherent with the size of the image window and zoom factor. For example, an image at 256 × 256 displayed in an image window of 256 × 256 containing a zoom factor of (1, 1) by definition has a single Center Point of (127, 127). An erroneously entered value is corrected, which produces an output value that is different than the input value. Get/Set Status? (Set) specifies whether the user wants to know the present status or modify the Zoom Factor and Center Point. error in (no error) is a cluster that describes the error status before this VI executes. For more information about this control, see the section IMAQ VI Error Clusters in Chapter 9, VI Overview and Programming Concepts. Zoom Factors X and Y returns the actual Zoom Factor in both the axis. Zoom Factor X returns the horizontal Zoom Factor. Zoom Factor Y returns the vertical Zoom Factor. Center Point returns the actual Center Point. X is the horizontal coordinate. © National Instruments Corporation 12-39 IMAQ Vision for G Reference Manual Chapter 12 Display Y is the vertical coordinate. error out is a cluster that describes the error status after this VI executes. For more information about this indicator, see the section IMAQ VI Error Clusters in Chapter 9, VI Overview and Programming Concepts. Note: The interactive zoom tool produces the same results as a homogeneous X and Y zoom: it doubles (or reduces, by shift-clicking) the dimensions of the pixels in the image window by a factor of 2. For example, if you have a 5 × 3 zoom and you click with the zoom tool, you produce a 10 × 6 zoom. If you shift-click, you produce a 2 × 1 zoom. Note that zoom is bounded by the highest absolute value in X or Y: if you have a 10 × 2, you cannot zoom in because the double of 10 is greater than 16. IMAQ SetUserPen Defines a pen with user specified features. The user pen affects each region tracked with the freehand tools. No other ROI selection tools work with user pen. Paint mode indicates the mode of painting in zoom mode. Paint mode has three possible values: don’t change, Paint, or Frame. Note: This mode is useful only in positive zoom mode greater than 3: in this mode the ROI is tracked using pen size 1 and ignoring the pen width value. Pen transfer mode describes the mode in which the foreground and the background of the pen affect the image. Pen transfer mode has five possible values: don’t change IMAQ Vision for G Reference Manual (Default) 12-40 © National Instruments Corporation Chapter 12 Display srcCopy Overwrites the background and foreground with specified colors. srcOr Overwrites only the foreground. srxXor Inverts the pixels below the foreground pixels. The new value equals 255 minus the old value; this operation occurs for each plane of an RGB image. srcBic Forces the background color on foreground pixels. Pen style specifies the pen style. Pen Style has six possible values: Don’t change, Solid, Dash, Dot, DashDot, and DashDotDot. Foreground color specifies the color of the foreground pixels. Use a LabVIEW or BridgeVIEW color box for color specification. Background color specifies the color of the background pixels. Use a LabVIEW or BridgeVIEW color box for color specification. Pen pattern (8x8). This Boolean 2D array describes the pattern associated with the user pen. TRUE value is associated to foreground, while FALSE is associated to background. The pattern is always an 8 × 8 matrix. The default is FALSE, which specifies that the current pattern is not changed. User pen active? (no) enables the pen when set to TRUE. The default value is FALSE, which specifies the use of the standard pen. Pen width specifies the pen width. The default value is 0, which specifies no change. error in (no error) is a cluster that describes the error status before this VI executes. For more information about this control, see the section IMAQ VI Error Clusters in Chapter 9, VI Overview and Programming Concepts. error out is a cluster that describes the error status after this VI executes. For more information about this indicator, see the section IMAQ VI Error Clusters in Chapter 9, VI Overview and Programming Concepts. Note: In zoom mode greater than 3, the values of Paint mode and Pen Style are ignored. © National Instruments Corporation 12-41 IMAQ Vision for G Reference Manual Chapter 12 Display IMAQ GetUserPen Returns the user pen status. error in (no error) is a cluster that describes the error status before this VI executes. For more information about this control, see the section IMAQ VI Error Clusters in Chapter 9, VI Overview and Programming Concepts. Paint mode is used for zoom factors greater than 3. If the value is Paint, the rectangles which compose the ROI bounds are painted; if the value if Frame, these rectangles are framed (only the contour is traced). Pen transfer mode is the actual transfer mode. Pen transfer mode has four possible values: srcCopy Overwrites the background and foreground with specified colors. srcOr Overwrites only the foreground. srxXor Inverts the pixels below the foreground pixels. The new value equals 255 minus the old value; this operation occurs for each plane of an RGB image. srcBic Forces the background color on foreground pixels. Pen style is the actual pen style. Pen Style has five possible values: Solid, Dash, Dot, DashDot, and DashDotDot. Foreground color is the actual foreground color. IMAQ Vision for G Reference Manual 12-42 © National Instruments Corporation Chapter 12 Display Foreground color is the actual foreground color. Background color is the actual background color. Pen pattern is the actual pen pattern. TRUE values are assigned to the foreground while FALSE values are assigned to the background. The pattern size is a 8 × 8 2D array. User pen active. If TRUE, the user pen is active. Pen width is the actual pen width. error out is a cluster that describes the error status after this VI executes. For more information about this indicator, see the section IMAQ VI Error Clusters in Chapter 9, VI Overview and Programming Concepts. IMAQ SetupBrush Configures the shape of a brush used in ROI tracing in conjunction with freehand tools. A brush is a mask that indicates the neighborhood of pixels that are colored when painting. Normally you use a brush in which the only pixel involved in drawing is the one under the cursor. However, with this VI you can define any shape. Note: Do not use this VI in zoom mode. Color LUT is an array of clusters with the following fields: Pixvalue, R, G, and B. This array of clusters changes the value of a pixel in the image, making a multicolored brush possible. The new pixel value is © National Instruments Corporation 12-43 IMAQ Vision for G Reference Manual Chapter 12 Display given by Pixvalue. On the display window, the appearance of this pixel changes to the color specified by R, G, and B. This array has 256 clusters, each containing the following fields. Pixvalue. This field indicates the new pixel value. Pixels affected include those in the last image connected to the window specified by the parameter Brush Window. When touched by the brush, each pixel that has a value equal to the array entry is changed. For example, if entry 7 of the Color LUT array parameter specifies a Pixvalue of 127, every pixel with a value of 7 that the brush touches is changed to 127. R, G, and B. These three parameters specify the color on the display window of pixels that have a value equal to Pixvalue. For example, if entry 7 of the Color LUT array parameter specifies (R = 255, G = 0, B = 0), every pixel with value 7 that the brush touches is painted red. Get/Set? (Set) specifies that input parameters are set when the value is TRUE (Set). If the value is FALSE (Get), input parameters are ignored. Output parameters are always effective. Brush shape in. This Boolean 2D array specifies the shape of the brush. TRUE values (in conjunction with brush width) define the pixels that are affected in your drawing. If your shape is described in a 3 × 3 grid, use a pen size of 3 for viewing a complete portion of the shape. If all values are FALSE, the brush shape is not changed. Brush element size in specifies parameters that define the dimension of the brush element. Brush Parameters in. is a cluster consisting of the following parameters. Brush Window is the number of the window in which the brush is active. Density is a parameter with a value between 1 and 100 that defines the probability (D/100) that a pixel will be written. Use this parameter to generate spray effects. Left 1 pix? (No) is a Boolean that specifies whether a separation pixel is used between brush elements. IMAQ Vision for G Reference Manual 12-44 © National Instruments Corporation Chapter 12 Display Synchronous. If this parameter is TRUE, the drawing of the brush is denied until the previous ROI is recovered using IMAQ WindGetROI. Use this parameter to synchronize brush drawing with ROI recovering. Brush active? (False) activates or deactivates the special brush feature. error in (no error) is a cluster that describes the error status before this VI executes. For more information about this control, see the section IMAQ VI Error Clusters in Chapter 9, VI Overview and Programming Concepts. Brush shape out indicates the current shape of the brush. Brush element size out indicates the X and Y dimensions of the brush. Brush Parameters out indicates the current settings of the brush parameters Brush Window, Density, Left 1 Pix? (No), and Synchronous. Brush active out indicates whether the brush is active. error out is a cluster that describes the error status after this VI executes. For more information about this indicator, see the section IMAQ VI Error Clusters in Chapter 9, VI Overview and Programming Concepts. © National Instruments Corporation 12-45 IMAQ Vision for G Reference Manual Chapter 12 Display IMAQ GetLastKey Returns the last key pressed when the focus was on the window indicated by the Window ID input. error in (no error) is a cluster that describes the error status before this VI executes. For more information about this control, see the section IMAQ VI Error Clusters in Chapter 9, VI Overview and Programming Concepts. Window number indicates the window in which the key was caught. Key present. If TRUE, a new key was pressed. If FALSE, no new keys were pressed and the VI returns the last key pressed. Key pressed indicates the last key pressed. Modifiers specifies a set of flags that identifies the modifiers. Some flags are platform dependent. • Option • Shift • Caps Lock • Cmd • Ctrl • Menu error out is a cluster that describes the error status after this VI executes. For more information about this indicator, see the section IMAQ VI Error Clusters in Chapter 9, VI Overview and Programming Concepts. IMAQ Vision for G Reference Manual 12-46 © National Instruments Corporation Chapter 13 Tool VIs This chapter describes the Tool VIs used in IMAQ Vision for G. Tools (Image) IMAQ Copy Copies the specifications and pixels of one image into another image of the same type. This function is used for keeping an original copy of an image (for example, before processing an image). Image Src is the reference to the source (input) image. Image Dst is the reference to the destination image. If it is connected, it must be the same type as the Image Src. error in (no error) is a cluster that describes the error status before this VI executes. For more information about this control, see the section IMAQ VI Error Clusters in Chapter 9, VI Overview and Programming Concepts. Image Dst Out is the reference to the destination (output) image which receives the processing results of the VI. If the Image Dst is connected, then Image Dst Out is the same as Image Dst. Otherwise, Image Dst Out refers to the image referenced by Image Src. © National Instruments Corporation 13-1 IMAQ Vision for G Reference Manual Chapter 13 Tool VIs error out is a cluster that describes the error status after this VI executes. For more information about this indicator, see the section IMAQ VI Error Clusters in Chapter 9, VI Overview and Programming Concepts. Note: The images to be copied must be the same type. The full definition of the source image as well as the pixel data are copied to the destination image. The border size of the destination image also is modified to be equal to that of the source image. IMAQ GetImageSize Gives information regarding the size (resolution) of the image. Image is the reference to the image whose size has to be determined. error in (no error) is a cluster that describes the error status before this VI executes. For more information about this control, see the section IMAQ VI Error Clusters in Chapter 9, VI Overview and Programming Concepts. X Resolution gives the number of pixels per line. Y Resolution gives the number of pixels per column. error out is a cluster that describes the error status after this VI executes. For more information about this indicator, see the section IMAQ VI Error Clusters in Chapter 9, VI Overview and Programming Concepts. IMAQ Vision for G Reference Manual 13-2 © National Instruments Corporation Chapter 13 Tool VIs IMAQ SetImageSize Modifies the resolution of an image. Image is the reference to the image whose size has to be modified. X Resolution gives the new horizontal resolution of the image. Y Resolution gives the new vertical resolution of the image. error in (no error) is a cluster that describes the error status before this VI executes. For more information about this control, see the section IMAQ VI Error Clusters in Chapter 9, VI Overview and Programming Concepts. Image Out is the reference to the image whose size is modified to a resolution specified by the X Resolution and Y Resolution parameters. error out is a cluster that describes the error status after this VI executes. For more information about this indicator, see the section IMAQ VI Error Clusters in Chapter 9, VI Overview and Programming Concepts. Note: This function reuses the space previously occupied by the pixels of the image. This function is used in preparation for a fill-in and does not transfer the original image into a new memory space. The original image is lost. © National Instruments Corporation 13-3 IMAQ Vision for G Reference Manual Chapter 13 Tool VIs IMAQ Extract Extracts (reduces) an image or part of an image with adjustment of the horizontal and vertical resolution. Optional Rectangle defines an array (four elements) containing the coordinates (Left / Top / Right / Bottom) of the region to extract. The operation is applied to the entire image if the input is empty or not connected. Image Src is the reference to the source (input) image. Image Dst is the reference to the destination image. If it is connected, it must be the same type as the Image Src. X Step Size is the vertical sampling step, which defines the columns to be extracted (the horizontal reduction ratio). For example, with an X Step Size equal to 3, one out of every three columns is extracted from the Image Src into the Image Dst. Each column is extracted if the default value (1) is used. Y Step Size is the horizontal sampling step, which defines the lines to be extracted (the vertical reduction ratio). Each row is extracted if the default value (1) is used. error in (no error) is a cluster that describes the error status before this VI executes. For more information about this control, see the section IMAQ VI Error Clusters in Chapter 9, VI Overview and Programming Concepts. Image Dst Out is the reference to the destination (output) image which receives the processing results of the VI. If the Image Dst is connected, then Image Dst Out is the same as Image Dst. Otherwise, Image Dst Out refers to the image referenced by Image Src. IMAQ Vision for G Reference Manual 13-4 © National Instruments Corporation Chapter 13 Tool VIs error out is a cluster that describes the error status after this VI executes. For more information about this indicator, see the section IMAQ VI Error Clusters in Chapter 9, VI Overview and Programming Concepts. For example, if a 512 × 512 image is connected and the X Step Size and Y Step Size are both equal to 2, then the resulting image has a resolution of 256 × 256. The resulting image contains the lines from the Image Src 0, 2, 4, …, 510 and the columns 0, 2, 4, …, 510 from the Image Src. The input images must be of the same image type. The following graphic illustrates an extraction of an image where X Step Size equals 2 and Y Step Size equals 3. IMAQ Expand Expands (duplicates) an image or part of an image with adjustment of the horizontal and vertical resolution. Optional Rectangle defines an array (four elements) containing the coordinates (Left / Top / Right / Bottom) of the region to expand. The operation is applied to the entire image if the input is empty or not connected. © National Instruments Corporation 13-5 IMAQ Vision for G Reference Manual Chapter 13 Tool VIs Image Src is the reference to the source (input) image. Image Dst is the reference to the destination image. If it is connected, it must be the same type as the Image Src. X Duplication Step specifies the number of pixel duplications per column. The column is recopied if the default value (1) is used. Y Duplication Step specifies the number of pixel duplications per line. The row is recopied if the default value (1) is used. error in (no error) is a cluster that describes the error status before this VI executes. For more information about this control, see the section IMAQ VI Error Clusters in Chapter 9, VI Overview and Programming Concepts. Image Dst Out is the reference to the destination (output) image which receives the processing results of the VI. If the Image Dst is connected, then Image Dst Out is the same as Image Dst. Otherwise, Image Dst Out refers to the image referenced by Image Src. error out is a cluster that describes the error status after this VI executes. For more information about this indicator, see the section IMAQ VI Error Clusters in Chapter 9, VI Overview and Programming Concepts. For example, if a 256 × 256 image is connected and the X Duplication Step and Y Duplication Step are both equal to 2, then the resulting image has a resolution of 512 × 512. Each pixel in the original image now is represented by four pixels in new image (2 × 2). The input images must be of the same image type. IMAQ Vision for G Reference Manual 13-6 © National Instruments Corporation Chapter 13 Tool VIs The following graphic illustrates an expansion of an image where X Duplication Step equals 2 and Y Duplication Step equals 3. IMAQ GetOffset Returns the position of an image mask in relation to the origin of the coordinate system (0, 0). The default offset value [0, 0] is established when the image is initially created by IMAQ Create. The offset is used only for masked images. With this offset, the mask can be moved to any location in the image without having to create a new image for each mask. Image is the reference to the source (input) image. error in (no error) is a cluster that describes the error status before this VI executes. For more information about this control, see the section IMAQ VI Error Clusters in Chapter 9, VI Overview and Programming Concepts. X Offset specifies the horizontal offset of the image mask. © National Instruments Corporation 13-7 IMAQ Vision for G Reference Manual Chapter 13 Tool VIs Y Offset specifies the vertical offset of the image mask. error out is a cluster that describes the error status after this VI executes. For more information about this indicator, see the section IMAQ VI Error Clusters in Chapter 9, VI Overview and Programming Concepts. The following graphic illustrates the use of a mask with two different offsets [0, 0] and [3, 1]. Image A Image Mask Image B Image C A VI processing Image A and using the Image Mask with an offset of [0, 0] and [3, 1] gives the results as shown in Image B and Image C respectively. Notice the location of the pixels. Pixels from the border Pixels outside the mask Pixels from the Image Mask IMAQ Vision for G Reference Manual 13-8 © National Instruments Corporation Chapter 13 Tool VIs IMAQ SetOffset Defines the position of an image mask in relation to the origin of the coordinate system (0, 0). Image is the reference to the source (input) image. X Offset specifies the horizontal offset of the image mask. Y Offset specifies the vertical offset of the image mask. error in (no error) is a cluster that describes the error status before this VI executes. For more information about this control, see the section IMAQ VI Error Clusters in Chapter 9, VI Overview and Programming Concepts. Image Out is the reference to the destination (output) image. error out is a cluster that describes the error status after this VI executes. For more information about this indicator, see the section IMAQ VI Error Clusters in Chapter 9, VI Overview and Programming Concepts. © National Instruments Corporation 13-9 IMAQ Vision for G Reference Manual Chapter 13 Tool VIs IMAQ Resample Redraws an image in a user-defined size. This VI is useful for displaying a reduced or enlarged image (for example, a zoom-in or zoom-out image). Interpolation Type specifies the type of interpolation (zero-order or bilinear) used to resample the image. Optional Rectangle defines an array (four elements) containing the coordinates (Left / Top / Right / Bottom) of the region to redraw. The operation is applied to the entire image if the input is empty or not connected. Image Src is the reference to the source (input) image. Image Dst is the reference to the destination image. If it is connected, it must be the same type as the Image Src. X Resolution gives the final horizontal size of the image. Y Resolution gives the final vertical size of the image. error in (no error) is a cluster that describes the error status before this VI executes. For more information about this control, see the section IMAQ VI Error Clusters in Chapter 9, VI Overview and Programming Concepts. Image Dst Out is the reference to the destination (output) image which receives the processing results of the VI. If the Image Dst is connected, then Image Dst Out is the same as Image Dst. Otherwise, Image Dst Out refers to the image referenced by Image Src. IMAQ Vision for G Reference Manual 13-10 © National Instruments Corporation Chapter 13 Tool VIs error out is a cluster that describes the error status after this VI executes. For more information about this indicator, see the section IMAQ VI Error Clusters in Chapter 9, VI Overview and Programming Concepts. IMAQ GetCalibration Obtains the present image calibration. Image is the reference to the source (input) image. error in (no error) is a cluster that describes the error status before this VI executes. For more information about this control, see the section IMAQ VI Error Clusters in Chapter 9, VI Overview and Programming Concepts. Unit is the measuring unit associated with the image. It can have the following values. 0 Undefined 1 Angstrom 2 micrometer 3 millimeter 4 centimeter 5 meter 6 kilometer 7 microinch © National Instruments Corporation 13-11 IMAQ Vision for G Reference Manual Chapter 13 Tool VIs 8 inch 9 feet 10 nautical miles 11 standard miles X Step specifies the horizontal distance separating two adjacent pixels in the specified Unit. Y Step specifies the vertical distance separating two adjacent pixels in the specified Unit. error out is a cluster that describes the error status after this VI executes. For more information about this indicator, see the section IMAQ VI Error Clusters in Chapter 9, VI Overview and Programming Concepts. IMAQ SetCalibration Sets the calibration scale for an image. Unit is the measuring unit associated with the image. It can have the following values. 0 Undefined 1 Angstrom 2 micrometer 3 millimeter 4 centimeter IMAQ Vision for G Reference Manual 13-12 © National Instruments Corporation Chapter 13 5 meter 6 kilometer 7 microinch 8 inch 9 feet 10 nautical miles 11 standard miles Tool VIs Image is the reference to the source (input) image. X Step specifies the horizontal distance separating two adjacent pixels in the specified Unit. Y Step specifies the vertical distance separating two adjacent pixels in the specified Unit. error in (no error) is a cluster that describes the error status before this VI executes. For more information about this control, see the section IMAQ VI Error Clusters in Chapter 9, VI Overview and Programming Concepts. Image Out is the reference to the destination (output) image. error out is a cluster that describes the error status after this VI executes. For more information about this indicator, see the section IMAQ VI Error Clusters in Chapter 9, VI Overview and Programming Concepts. © National Instruments Corporation 13-13 IMAQ Vision for G Reference Manual Chapter 13 Tool VIs IMAQ ImageToImage Copies a small image into part of another larger image. This VI is useful for making thumbnail sketches from multiple miniature images. Offset Left/Top is an array specifying the Image Dst pixel coordinates that receive the image copied from Image Src. Image Src is the reference to the source (input) image. Image Dst is the reference to the destination image. If it is connected, it must be the same type as the Image Src. error in (no error) is a cluster that describes the error status before this VI executes. For more information about this control, see the section IMAQ VI Error Clusters in Chapter 9, VI Overview and Programming Concepts. Image Dst Out is the reference to the destination (output) image which receives the processing results of the VI. If the Image Dst is connected, then Image Dst Out is the same as Image Dst. Otherwise, Image Dst Out refers to the image referenced by Image Src. error out is a cluster that describes the error status after this VI executes. For more information about this indicator, see the section IMAQ VI Error Clusters in Chapter 9, VI Overview and Programming Concepts. IMAQ Vision for G Reference Manual 13-14 © National Instruments Corporation Chapter 13 Tool VIs For example, an Image Dst with a resolution of 512 × 512 and an Image Src with a resolution of 256 × 256, having an Offset Left/Top value [256,256], produce the following operation. However, using an Offset Left/Top value [256, 256] and a resolution of 384 × 384 for the Image Src produce the following operation. With an Image Dst with a resolution of 512 × 512 and an Image Src with a resolution of 512 × 512 produce the following operation. © National Instruments Corporation 13-15 IMAQ Vision for G Reference Manual Chapter 13 Tool VIs Tools (Pixel) IMAQ GetPixelValue Reads or extracts a pixel value from an image. Image is the reference to the source (input) image. X Coordinate is the horizontal coordinate of the pixel to read. Y Coordinate is the vertical coordinate of the pixel to read. error in (no error) is a cluster that describes the error status before this VI executes. For more information about this control, see the section IMAQ VI Error Clusters in Chapter 9, VI Overview and Programming Concepts. Pixel Value (U8) returns the specified pixel value. This output is used only for an 8-bit image. Pixel Value (I16) returns the specified pixel value. This output is used only for an 8-bit or 16-bit image. Pixel Value (SGL) returns the specified pixel value. The SGL format can accept values from all supported image types (8-bit, 16-bit, or 32-bit floating point). error out is a cluster that describes the error status after this VI executes. For more information about this indicator, see the section IMAQ VI Error Clusters in Chapter 9, VI Overview and Programming Concepts. IMAQ Vision for G Reference Manual 13-16 © National Instruments Corporation Chapter 13 Tool VIs IMAQ SetPixelValue Changes the pixel value in an image. Image is the reference to the source (input) image. X Coordinate is the horizontal coordinate of the pixel to modify. Y Coordinate is the vertical coordinate of the pixel to modify. Pixel Value contains the replacement pixel value. error in (no error) is a cluster that describes the error status before this VI executes. For more information about this control, see the section IMAQ VI Error Clusters in Chapter 9, VI Overview and Programming Concepts. Image Out is the reference to the destination (output) image. error out is a cluster that describes the error status after this VI executes. For more information about this indicator, see the section IMAQ VI Error Clusters in Chapter 9, VI Overview and Programming Concepts. © National Instruments Corporation 13-17 IMAQ Vision for G Reference Manual Chapter 13 Tool VIs IMAQ GetPixelLine Extracts the intensity values of a line of pixels. Image is the reference to the source (input) image. Line Coordinates are the coordinates of the line to extract. These coordinates are in the form of an array specifying the endpoints of the line. Note that a line with the coordinates (0, 0, 0, 255) is formed from 256 pixels. The output Pixels Line is an array containing the intensity values of the pixels in the selected line. Any pixels designated by the Line Coordinates found outside the actual image are set to zero in Pixels Line. error in (no error) is a cluster that describes the error status before this VI executes. For more information about this control, see the section IMAQ VI Error Clusters in Chapter 9, VI Overview and Programming Concepts. Pixels Line (U8) returns the intensity values for the specified line of pixels. This output is used only for an 8-bit image. Pixels Line (I16) returns the intensity values for the specified line of pixels. This output is used only for a 16-bit image. Pixels Line (SGL) returns the intensity values for the specified line of pixels. This output is used only for a 32-bit floating-point image. error out is a cluster that describes the error status after this VI executes. For more information about this indicator, see the section IMAQ VI Error Clusters in Chapter 9, VI Overview and Programming Concepts. IMAQ Vision for G Reference Manual 13-18 © National Instruments Corporation Chapter 13 Tool VIs IMAQ GetRowCol Extracts a range of pixel values, either a row or column, from an image. Image is the reference to the source (input) image. Number is the row or column number to be extracted. Row / Column uses the row Number by default (the default is FALSE). When the TRUE value is connected, the column Number is used. error in (no error) is a cluster that describes the error status before this VI executes. For more information about this control, see the section IMAQ VI Error Clusters in Chapter 9, VI Overview and Programming Concepts. Pixels (U8) returns the intensity values for the specified row or column of pixels. This output is used only for an 8-bit image. Pixels (I16) returns the intensity values for the specified row or column of pixels. This output is used only for a 16-bit image. Pixels (SGL) returns the intensity values for the specified row or column of pixels. This output is used only for a 32-bit floating-point image. error out is a cluster that describes the error status after this VI executes. For more information about this indicator, see the section IMAQ VI Error Clusters in Chapter 9, VI Overview and Programming Concepts. © National Instruments Corporation 13-19 IMAQ Vision for G Reference Manual Chapter 13 Tool VIs IMAQ SetPixelLine Changes the intensity values in a line of pixels from an image. Note: Each Pixels Line input is specific for a particular type of data. Line Coordinates are the coordinates of the line to change. These coordinates are in the form of an array specifying the endpoints of the line. Any pixels designated by the Line Coordinates found outside the actual image are not replaced. Image is the reference to the source (input) image. Pixels Line (U8) is an array containing the coordinates of the pixel line to be drawn. This input must be used if the image connected is an 8-bit image. The drawing is made between the endpoints of the line and contains the values supplied from Pixels Line. Pixels Line (I16) is an array of 16-bit integers. This input must be used if the image connected is a 16-bit image. Pixels Line (float) is an array of floating-point values. This input must be used if the image connected is a 32-bit floating-point image. error in (no error) is a cluster that describes the error status before this VI executes. For more information about this control, see the section IMAQ VI Error Clusters in Chapter 9, VI Overview and Programming Concepts. Image Out is the reference to the destination (output) image. error out is a cluster that describes the error status after this VI executes. For more information about this indicator, see the section IMAQ VI Error Clusters in Chapter 9, VI Overview and Programming Concepts. IMAQ Vision for G Reference Manual 13-20 © National Instruments Corporation Chapter 13 Tool VIs IMAQ SetRowCol Changes the intensity values in either a row or a column of pixels in an image. Note: Each Pixels input is specific for a particular type of data. Row / Column uses the row Number by default (the default is FALSE). When the TRUE value is connected, the column Number is used. Number is the row or column number to be replaced in the image. Image is the reference to the source (input) image. Pixels is an array specifying the coordinates of the pixel row or column to be drawn. This input must be used if the image connected is an 8-bit image. The drawing is made between the endpoints of the line and contains the values supplied from Pixels. Pixels (I16) is an array of 16-bit integers specifying the coordinates of the pixel row or column to be drawn. This input must be used if the image connected is a 16-bit image. The drawing is made between the endpoints of the line and contains the values supplied from Pixels. Pixels (float) is an array of floating-point values specifying the coordinates of the pixel row or column to be drawn. This input must be used if the image connected is a 32-bit floating-point image. The drawing is made between the endpoints of the line and contains the values supplied from Pixels. error in (no error) is a cluster that describes the error status before this VI executes. For more information about this control, see the section IMAQ VI Error Clusters in Chapter 9, VI Overview and Programming Concepts. © National Instruments Corporation 13-21 IMAQ Vision for G Reference Manual Chapter 13 Tool VIs Image Out is the reference to the destination (output) image. error out is a cluster that describes the error status after this VI executes. For more information about this indicator, see the section IMAQ VI Error Clusters in Chapter 9, VI Overview and Programming Concepts. IMAQ ImageToArray Extracts (copies) the pixels from an image, or part of an image, into a 2D array encoded in 8 bits, 16 bits, or floating point, which is determined by the type of input image. Various processing can be applied to this array. These arrays can be programmed either from LabVIEW or BridgeVIEW, or from standard programming languages (such as C) via a Code Interface Node. Image is the reference to the source (input) image. Optional Rectangle defines an array (four elements) containing the coordinates (Left / Top / Right / Bottom) of the region to extract. The operation is applied to the entire image if the input is empty or not connected. error in (no error) is a cluster that describes the error status before this VI executes. For more information about this control, see the section IMAQ VI Error Clusters in Chapter 9, VI Overview and Programming Concepts. Image Pixels (U8) returns the extracted pixel values into a 2D array (line, column). This output is used only for an 8-bit image. Image Pixels (I16) returns the extracted pixel values into a 2D array (line, column). This output is used only for a 16-bit image. IMAQ Vision for G Reference Manual 13-22 © National Instruments Corporation Chapter 13 Tool VIs Image Pixels (SGL) returns the extracted pixel values into a 2D array (line, column). This output is used only for a 32-bit floating-point image. error out is a cluster that describes the error status after this VI executes. For more information about this indicator, see the section IMAQ VI Error Clusters in Chapter 9, VI Overview and Programming Concepts. IMAQ ArrayToImage Creates an image from a 2D array. Note: For this VI you have a choice of inputs, depending on how the data is encoded (see the following descriptions). Image is the reference to the source (input) image. Image Pixels is a 2D array (Line, Column) containing all the pixel values that form the image. The first index corresponds to the vertical axis and the second to the horizontal index. The final size of the image is equal to the size of the array. The image passed in the input image is forced to the same size as the array encoded by Input Pixels. This input should only be used to create an 8-bit image. Image Pixels (I16) is a 2D array of 16-bit integers. This input must be used if the image connected is a 16-bit image. This input should only be used to create a 16-bit signed image. Image Pixels (float) is a 2D array of floating-point values. This input must be used if the image connected is a 32-bit floating-point image. This input only should be used to create single plane images that are not encoded as 8-bit, 16-bit signed, or complex. © National Instruments Corporation 13-23 IMAQ Vision for G Reference Manual Chapter 13 Tool VIs error in (no error) is a cluster that describes the error status before this VI executes. For more information about this control, see the section IMAQ VI Error Clusters in Chapter 9, VI Overview and Programming Concepts. Image Out is the reference to the destination (output) image. error out is a cluster that describes the error status after this VI executes. For more information about this indicator, see the section IMAQ VI Error Clusters in Chapter 9, VI Overview and Programming Concepts. See the additional VIs in Chapter 21, Complex VIs, for performing array-to-image transformations with complex images. Tools (Diverse) IMAQ ImageToClipboard Copies the image to the clipboard. Image is the reference to the source (input) image. Color Palette can be applied to an 8-bit image. It can be taken directly from the output of IMAQ GetPalette or specified by the user. It is formed from an array of clusters composed of 256 elements for each of the three color planes. A specific color is the result of affecting a value between 0 and 255 for each of the three color planes (red, green, and blue). If the three planes have the identical value, then a gray level is obtained. (0 specifies black and 255 specifies white). By default the palette is a gray-scale ramp. IMAQ Vision for G Reference Manual 13-24 © National Instruments Corporation Chapter 13 Tool VIs error in (no error) is a cluster that describes the error status before this VI executes. For more information about this control, see the section IMAQ VI Error Clusters in Chapter 9, VI Overview and Programming Concepts. error out is a cluster that describes the error status after this VI executes. For more information about this indicator, see the section IMAQ VI Error Clusters in Chapter 9, VI Overview and Programming Concepts. IMAQ ClipboardToImage Copies the clipboard data into an image. Image is the reference to the source (input) image. error in (no error) is a cluster that describes the error status before this VI executes. For more information about this control, see the section IMAQ VI Error Clusters in Chapter 9, VI Overview and Programming Concepts. Image Out contains a copy of the clipboard if the clipboard is an image. Color Palette is the color palette that is stored on the clipboard. A gray ramp is returned if no color palette is found on the clipboard. Clipboard has an image? returns a TRUE value if the clipboard contains an image. error out is a cluster that describes the error status after this VI executes. For more information about this indicator, see the section IMAQ VI Error Clusters in Chapter 9, VI Overview and Programming Concepts. © National Instruments Corporation 13-25 IMAQ Vision for G Reference Manual Chapter 13 Tool VIs IMAQ Draw Draws geometric objects in an image. Draw Mode defines how to draw the object and has the following choices: 0 Frame (Default) Specifies the use of Pixel Color in tracing the contour 1 Paint Specifies the use of Pixel Color in tracing the contour and the interior of the shape 2 Invert Frame Specifies the use of the inverse of the pixel values when drawing the contour 3 Invert Paint Specifies the use of the inverse of the pixel values when drawing the contour and the interior of the shape Pixel Color is the pixel value used for tracing the design. This value is not used when in the mode Invert Frame or Invert Paint. The default is 0. Image Src is the reference to the source (input) image. Image Dst is the reference to the destination image. If it is connected, it must be the same type as the Image Src. Coordinates is an array of four elements. A line is specified by the two points forming it. Rectangles and ovals are specified by their bounding rectangle, with the format (Left / Top / Right / Bottom). In these cases, the tracing of a rectangle or oval stops at the column (Right – 1) and at the row (Bottom – 1). The values by default are (0, 0, SizeX, SizeY) IMAQ Vision for G Reference Manual 13-26 © National Instruments Corporation Chapter 13 Tool VIs where (SizeX, SizeY) is the resolution of the image. The default is used if the input is 0 or is not connected. Shape to draw is the form to draw. The following shapes are available: 0 Line (Default) Defined by the two points specified in the array Coordinates 1 Rectangle Defined by the bounding rectangle specified in the array Coordinates 2 Oval Defined by the bounding rectangle specified in the array Coordinates error in (no error) is a cluster that describes the error status before this VI executes. For more information about this control, see the section IMAQ VI Error Clusters in Chapter 9, VI Overview and Programming Concepts. Image Dst Out is the reference to the destination (output) image which receives the processing results of the VI. If the Image Dst is connected, then Image Dst Out is the same as Image Dst. Otherwise, Image Dst Out refers to the image referenced by Image Src. error out is a cluster that describes the error status after this VI executes. For more information about this indicator, see the section IMAQ VI Error Clusters in Chapter 9, VI Overview and Programming Concepts. IMAQ DrawText Inserts text in an image. © National Instruments Corporation 13-27 IMAQ Vision for G Reference Manual Chapter 13 Tool VIs String (empty by default) is the text to write in an image. The string can be composed of multiple lines separated by a hard return. Color is the mode for writing the text. The default is 0, which specifies white. 0 White (Default) White on the image background 1 Black Black on the image background 2 Inverted Text inverted on the image background 3 Black on White 4 White on Black Image Src is the image reference source. It must be an 8-bit or RGB image. Image Dst is the reference of the image destination. If it is connected, it must be the same type as the Image Src. Insertion Point is an array (x and y) specifying the location in which the text is inserted. The text position depends on the alignment mode chosen. The default is (0, 0). Font, Size & Style is a cluster that enables the user to choose the font, size, style, and alignment and contains the following elements: desired font (Application) specifies the character type of the text. The following values are possible: IMAQ Vision for G Reference Manual 0 User-specified Font 1 (Default) Application Font 2 System Font 3 Dialog Font 13-28 © National Instruments Corporation Chapter 13 Tool VIs user-specified font is a cluster containing the specific font characteristics for the text to draw. This specification is ignored unless the desired font control is set to user-specified font. Note: The list of fonts on a Macintosh and Windows are different. Font Name is the name of the user-specified font. Strikeout? If TRUE, text appears in strikeout. Italic? If TRUE, text appears in italic. Underline? If TRUE, text appears underlined. Outline? If TRUE, text appears outlined. Shadow? If TRUE, text appears shadowed. Bold? If TRUE, text appears in bold. Size is the size of the font. The default is 9. Alignment specifies the alignment of the text. The following values are possible: Left (default), Center, and Right. error in (no error) is a cluster that describes the error status before this VI executes. For more information about this control, see the section IMAQ VI Error Clusters in Chapter 9, VI Overview and Programming Concepts. Image Dst Out is the reference to the destination (output) image which receives the processing results of the VI. If the Image Dst is connected, then Image Dst Out is the same as Image Dst. Otherwise, Image Dst Out refers to the image referenced by Image Src. StringWidth returns the string length from the text. © National Instruments Corporation 13-29 IMAQ Vision for G Reference Manual Chapter 13 Tool VIs error out is a cluster that describes the error status after this VI executes. For more information about this indicator, see the section IMAQ VI Error Clusters in Chapter 9, VI Overview and Programming Concepts. IMAQ MagicWand Creates an image mask by extracting a region surrounding a reference pixel, called the origin, and using a tolerance (+ or –) of intensity variations based on this reference pixel. Using this origin, the VI searches for its neighbors with an intensity equal to, or falling within the tolerance value, of the point of reference. The resulting image is binary. The image passed as input for Image Dst must be an 8-bit image. If the same image is entered for Image Src and Image Dst then both must be 8-bit images. Connectivity 4/8 (8) determines the type of connectivity to be used by the algorithm creating the mask. The default is 8. Fill Value is the value that is used for the lit pixels in the destination image. The default is 1. Image Src is the image reference source. It must be an 8-bit or RGB image. Image Dst is the reference of the image destination. It must be an 8-bit image. Hot spot (x,y) is an array counting the (x, y) coordinates of the origin pixel chosen from the image source. Tolerance is the maximum authorized deviation from the origin. All pixels satisfying the tolerance criteria (origin pixel – tolerance / origin pixel + tolerance) and connectivity criteria, as specified in Connect 4/8 (8), are lit and all other pixels are turned off. The default is 20. IMAQ Vision for G Reference Manual 13-30 © National Instruments Corporation Chapter 13 Tool VIs error in (no error) is a cluster that describes the error status before this VI executes. For more information about this control, see the section IMAQ VI Error Clusters in Chapter 9, VI Overview and Programming Concepts. Image Dst Out is the reference to the destination (output) image which receives the processing results of the VI. If the Image Dst is connected, then Image Dst Out is the same as Image Dst. Otherwise, Image Dst Out refers to the image referenced by Image Src. error out is a cluster that describes the error status after this VI executes. For more information about this indicator, see the section IMAQ VI Error Clusters in Chapter 9, VI Overview and Programming Concepts. IMAQ FillImage Fills an image and its border with a specified value. Complex Pixel Value specifies the value used for filling a complex image. Image is the reference to the source (input) image. Image Mask is an 8-bit image that specifies the region in the image to modify. Only pixels in the original image that correspond to the equivalent pixel in the mask are replaced by the values in the lookup table (provided that the value in the mask is not 0). All pixels not corresponding to this criteria keep their original value. The complete image is modified if Image Mask is not connected. Pixel Value (U8, I16, Float) specifies the value with which the image is to be filled. This value is used for 8-bit, 16-bit and 32-bit floating-point images. © National Instruments Corporation 13-31 IMAQ Vision for G Reference Manual Chapter 13 Tool VIs Color Pixel Value specifies the value used for filling a color image. error in (no error) is a cluster that describes the error status before this VI executes. For more information about this control, see the section IMAQ VI Error Clusters in Chapter 9, VI Overview and Programming Concepts. Image Out contains the image that has been filled with the specified pixel value. error out is a cluster that describes the error status after this VI executes. For more information about this indicator, see the section IMAQ VI Error Clusters in Chapter 9, VI Overview and Programming Concepts. IMAQ Vision for G Reference Manual 13-32 © National Instruments Corporation Chapter 14 Conversion VIs This chapter describes the Conversion VIs in IMAQ Vision. IMAQ Convert Converts the image type specified by Image Src into the image type specified by Image Dst. Image Src is the reference to the source (input) image. Image Dst is the reference to the destination image. error in (no error) is a cluster that describes the error status before this VI executes. For more information about this control, see the section IMAQ VI Error Clusters in Chapter 9, VI Overview and Programming Concepts. Image Dst Out is the reference to the destination (output) image which receives the processing results of the VI. If the Image Dst is connected, then Image Dst Out is the same as Image Dst. Otherwise, Image Dst Out refers to the image referenced by Image Src. error out is a cluster that describes the error status after this VI executes. For more information about this indicator, see the section IMAQ VI Error Clusters in Chapter 9, VI Overview and Programming Concepts. © National Instruments Corporation 14-1 IMAQ Vision for G Reference Manual Chapter 14 Conversion VIs The conversion rules are performed as a function of the image type specified by Image Src and Image Dst. The image type encoded by Image Dst defines the how the conversion is performed. The conversion rules are described in the following table. to to to Pixel values are recopied (0 to 255). Pixel values are copied into each of the three color planes (red, green, and blue). Pixel values less than 0 are set to 0. Pixel values between 0 and 255 are recopied. Pixel values greater than 255 are set to 255. Pixel values are recopied (–32768 to 32767). to to Pixel values are copied into each of the three color planes (red, green, and blue) with the same conversion rule as 16-bit to 8-bit. to Pixel values less than 0 are set to 0. Pixel values between 0 and 255 are recopied. Pixel values greater than 255 are forced to 255. to Pixel values less than –32768 are set to –32768. Pixel values between –32768 and 32767 are recopied. Pixel values greater than 32767 are set to 32767. Same conversion rule as 16-bit to RGB. to IMAQ Vision for G Reference Manual 14-2 © National Instruments Corporation Chapter 14 Conversion VIs IMAQ Cast Converts the current image type of an image to the image type specified by Image Type. Image is both the image to be converted (input) and the image that receives the conversion (output). With this VI only the image type of the image changes. The conversion rules are the same as described in IMAQ Convert. Image Type determines into what image type the input Image is converted. The following values are valid: 0 8 bits 8 bits per pixel (unsigned, standard monochrome) 1 16 bits 16 bits per pixel (signed) 2 float 32 bits (floating-point) per pixel 3 Unused 4 RGB 5 Unused 32 bits per pixel (RGB chunky, standard color) error in (no error) is a cluster that describes the error status before this VI executes. For more information about this control, see the section IMAQ VI Error Clusters in Chapter 9, VI Overview and Programming Concepts. Image Out is the reference to the input image with the new image type. © National Instruments Corporation 14-3 IMAQ Vision for G Reference Manual Chapter 14 Conversion VIs error out is a cluster that describes the error status after this VI executes. For more information about this indicator, see the section IMAQ VI Error Clusters in Chapter 9, VI Overview and Programming Concepts. The conversion rules are the same as the rules for IMAQ Convert. IMAQ ConvertByLookup Converts an image by using a lookup table which is encoded in floating-point values. Lookup Table is an array consisting of 256 elements maximum if Image Src has an 8-bit or a maximum of 65536 elements if the Image Src has a 16-bit image. This array is filled with values equal to the index if it has less elements than the amount demanded by the image type in Image Src. The lookup table can be used to calculate a polynomial giving a relation between a gray-level value and a user value. VIs capable of analyzing floating-point type images can be used to directly quantify an image, or regions from an image, in user values after converting the image into a floating-point type image. Image Src is the image to be converted. It must be an 8-bit or 16-bit image. Image Dst is the image that receives the conversion. The image type for Image Dst can take the following values: • 16-bit if Image Src has an 8-bit image • 32-bit floating point if Image Src has an 8-bit or 16-bit image error in (no error) is a cluster that describes the error status before this VI executes. For more information about this control, see the section IMAQ VI Error Clusters in Chapter 9, VI Overview and Programming Concepts. IMAQ Vision for G Reference Manual 14-4 © National Instruments Corporation Chapter 14 Conversion VIs Image Dst Out is the reference to the destination (output) image which receives the processing results of the VI. If the Image Dst is connected, then Image Dst Out is the same as Image Dst. Otherwise, Image Dst Out refers to the image referenced by Image Src. error out is a cluster that describes the error status after this VI executes. For more information about this indicator, see the section IMAQ VI Error Clusters in Chapter 9, VI Overview and Programming Concepts. IMAQ Shift16to8 Converts a 16-bit image to an 8-bit image. The VI executes this conversion by shifting the 16-bit pixel values right by the specified number (from 1 to 8) of shift operations and then truncating to get an 8-bit value. Shift Value specifies the number of right shifts (between 1 and 8) by which each pixel value in the input image is shifted. Image Src is the reference to the 16-bit image. Image Dst is the reference to the 8-bit output image. error in (no error) is a cluster that describes the error status before this VI executes. For more information about this control, see the section IMAQ VI Error Clusters in Chapter 9, VI Overview and Programming Concepts. Image Dst Out is the reference to the destination (output) image which receives the processing results of the VI. If the Image Dst is connected, then Image Dst Out is the same as Image Dst. Otherwise, Image Dst Out refers to the image referenced by Image Src. © National Instruments Corporation 14-5 IMAQ Vision for G Reference Manual Chapter 14 Conversion VIs error out is a cluster that describes the error status after this VI executes. For more information about this indicator, see the section IMAQ VI Error Clusters in Chapter 9, VI Overview and Programming Concepts. IMAQ Vision for G Reference Manual 14-6 © National Instruments Corporation Chapter 15 Operator VIs This chapter describes the Operator VIs in IMAQ Vision. Arithmetic Operators IMAQ Add Adds two images or an image and a constant. Constant is the value added to the input Image Src A for image-constant operations. The constant is rounded down in the cases in which the image is encoded as an integer. The default is 0. Image Src A is the reference to the source (input) image A. Image Dst is the reference to the destination image. Image Src B is the reference to the source (input) image B. error in (no error) is a cluster that describes the error status before this VI executes. For more information about this control, see the section IMAQ VI Error Clusters in Chapter 9, VI Overview and Programming Concepts. © National Instruments Corporation 15-1 IMAQ Vision for G Reference Manual Chapter 15 Operator VIs Image Dst Out is the reference to the destination (output) image which receives the processing results of the VI. If the Image Dst is connected, then Image Dst Out is the same as Image Dst. Otherwise, Image Dst Out refers to the image referenced by Image Src A. error out is a cluster that describes the error status after this VI executes. For more information about this indicator, see the section IMAQ VI Error Clusters in Chapter 9, VI Overview and Programming Concepts. An operation between an image and a constant occurs when the input Image Src B is not connected. The two possibilities are distinguished in the following equations: Dst(x, y) = SrcA(x, y) + SrcB(x, y), or Dst(x, y) = SrcA(x, y) + Constant. The different image type-combinations supported by this VI are described in the following equations. The first symbol represents the image connected to Image Src A and the second symbol represents the image type connected to Image Src B. The third symbol represents the image type that should be connected to the output Image Dst. + = + = + = + = + = + = + = + = + = To add a constant to an image, the output Image Dst must be connected to the same image type as the input Image Src A. IMAQ Subtract Subtracts one image from another or a constant from an image. IMAQ Vision for G Reference Manual 15-2 © National Instruments Corporation Chapter 15 Operator VIs Constant is the value subtracted from the input Image Src A for image-constant operations. The constant is rounded down in the cases in which the image is encoded as an integer. The default is 0. Image Src A is the reference to the source (input) image A. Image Dst is the reference to the destination image. Image Src B is the reference to the source (input) image B. error in (no error) is a cluster that describes the error status before this VI executes. For more information about this control, see the section IMAQ VI Error Clusters in Chapter 9, VI Overview and Programming Concepts. Image Dst Out is the reference to the destination (output) image which receives the processing results of the VI. If the Image Dst is connected, then Image Dst Out is the same as Image Dst. Otherwise, Image Dst Out refers to the image referenced by Image Src A. error out is a cluster that describes the error status after this VI executes. For more information about this indicator, see the section IMAQ VI Error Clusters in Chapter 9, VI Overview and Programming Concepts. An operation between an image and a constant occurs when the input Image Src B is not connected. The two possibilities are distinguished in the following equations: Dst(x, y) = SrcA(x, y) – SrcB(x, y), or Dst(x, y) = SrcA(x, y) – Constant. The different image-type combinations supported by this VI are described in the following equations. The first symbol represents the image connected to Image Src A and the second symbol represents the image type connected to Image Src B. The third symbol represents the image type that should be connected to the output Image Dst. – = – = – = – = – = © National Instruments Corporation 15-3 – = IMAQ Vision for G Reference Manual Chapter 15 Operator VIs To subtract a constant from an image, the output Image Dst must be connected to the same image type as the input Image Src A. If one of the two source images is empty, the result is a copy of the other. IMAQ Multiply Multiplies two images or an image and a constant. Constant. The input Image Src A is multiplied by the Constant value for image-constant operations. The default is 1. Image Src A is the reference to the source (input) image A. Image Dst is the reference to the destination image. Image Src B is the reference to the source (input) image B. error in (no error) is a cluster that describes the error status before this VI executes. For more information about this control, see the section IMAQ VI Error Clusters in Chapter 9, VI Overview and Programming Concepts. Image Dst Out is the reference to the destination (output) image which receives the processing results of the VI. If the Image Dst is connected, then Image Dst Out is the same as Image Dst. Otherwise, Image Dst Out refers to the image referenced by Image Src A. error out is a cluster that describes the error status after this VI executes. For more information about this indicator, see the section IMAQ VI Error Clusters in Chapter 9, VI Overview and Programming Concepts. IMAQ Vision for G Reference Manual 15-4 © National Instruments Corporation Chapter 15 Operator VIs An operation between an image and a constant occurs when the input Image Src B is not connected. The two possibilities are distinguished in the following equations: Dst(x, y) = SrcA(x, y) × SrcB(x, y), or Dst(x, y) = SrcA(x, y) × Constant. The different image-type combinations supported by this VI are described in the following equations. The first symbol represents the image connected to Image Src A and the second symbol represents the image type connected to Image Src B. The third symbol represents the image type that should be connected to the output Image Dst. × = × = × = × = × = × = × = × = × = To multiply a constant and an image, the output Image Dst must be connected to the same image type as the input Image Src A. If one of the two source images is empty, the result is a copy of the other. IMAQ Divide Divides one image by another or an image by a constant. Constant. The input Image Src A is divided by the Constant value for image-constant operations. The default is 1. Image Src A is the reference to the source (input) image A. Image Dst is the reference to the destination image. © National Instruments Corporation 15-5 IMAQ Vision for G Reference Manual Chapter 15 Operator VIs Image Src B is the reference to the source (input) image B. error in (no error) is a cluster that describes the error status before this VI executes. For more information about this control, see the section IMAQ VI Error Clusters in Chapter 9, VI Overview and Programming Concepts. Image Dst Out is the reference to the destination (output) image which receives the processing results of the VI. If the Image Dst is connected, then Image Dst Out is the same as Image Dst. Otherwise, Image Dst Out refers to the image referenced by Image Src A. error out is a cluster that describes the error status after this VI executes. For more information about this indicator, see the section IMAQ VI Error Clusters in Chapter 9, VI Overview and Programming Concepts. An operation between an image and a constant occurs when the input Image Src B is not connected. The two possibilities are distinguished in the following equations. Dst(x, y) = SrcA(x, y) ÷ SrcB(x, y), or Dst(x, y) = SrcA(x, y) ÷ Constant. The different image-type combinations, supported by this VI, are described below. The first symbol represents the image connected to Image Src A and the second symbol represents the image type connected to Image Src B. The third symbol represents the image type that should be connected to the output Image Dst. ÷ = ÷ = ÷ = ÷ = ÷ = ÷ = To divide an image by a constant, the output Image Dst must be connected to the same image type as the input Image Src A. Division by 0 is not allowed. If the constant is 0 it automatically is replaced by 1. If one of the two source images is empty, the result is a copy of the other. IMAQ Vision for G Reference Manual 15-6 © National Instruments Corporation Chapter 15 Operator VIs IMAQ MulDiv Computes a ratio between two images. Each pixel in input Image Src A is multiplied by the integer value specified in the input Constant before being divided by the equivalent pixel found in input Image Src B. If the background is lighter than the image, this function can be used to correct the background. In a background correction image, Image Src A is the acquired image, and Image Src B is the light background. Constant. Each pixel in Image Src A is multiplied by the Constant value prior to being divided by the equivalent pixel in Image Src B. The default is 255, which corresponds to the maximum value for a pixel encoded in an 8-bit image. Image Src A is the reference to the source (input) image A. Image Dst is the reference to the destination image. If it is connected, it must be the same type as the Image Src A. Image Src B is the reference to the source (input) image B. error in (no error) is a cluster that describes the error status before this VI executes. For more information about this control, see the section IMAQ VI Error Clusters in Chapter 9, VI Overview and Programming Concepts. Image Dst Out is the reference to the destination (output) image which receives the processing results of the VI. If the Image Dst is connected, then Image Dst Out is the same as Image Dst. Otherwise, Image Dst Out refers to the image referenced by Image Src A. error out is a cluster that describes the error status after this VI executes. For more information about this indicator, see the section IMAQ VI Error Clusters in Chapter 9, VI Overview and Programming Concepts. © National Instruments Corporation 15-7 IMAQ Vision for G Reference Manual Chapter 15 Operator VIs Dst(x, y) = (SrcA(x, y) × Constant)÷ SrcB(x, y) All input images must of be the same image type. Division by 0 is not allowed. If this value is found in Image Src B, the equivalent pixel value from Image Src A is directly applied to Image Dst. If one of the two source images is empty, the result is a copy of the other. IMAQ Modulo Executes modulo division (remainder) of one image by another or an image by a constant. Constant. The input Image Src A is divided by the Constant value for image-constant operations. The default is 1. Image Src A is the reference to the source (input) image A. Image Dst is the reference to the destination image. If it is connected, it must be the same type as the Image Src A. Image Src B is the reference to the source (input) image B. error in (no error) is a cluster that describes the error status before this VI executes. For more information about this control, see the section IMAQ VI Error Clusters in Chapter 9, VI Overview and Programming Concepts. Image Dst Out is the reference to the destination (output) image which receives the processing results of the VI. If the Image Dst is connected, then Image Dst Out is the same as Image Dst. Otherwise, Image Dst Out refers to the image referenced by Image Src A. IMAQ Vision for G Reference Manual 15-8 © National Instruments Corporation Chapter 15 Operator VIs error out is a cluster that describes the error status after this VI executes. For more information about this indicator, see the section IMAQ VI Error Clusters in Chapter 9, VI Overview and Programming Concepts. An operation between an image and a constant occurs when the input Image Src B is not connected. The two possibilities are distinguished in the following equations: Dst(x, y) = SrcA(x, y) % SrcB(x, y), or Dst(x, y) = SrcA(x, y) % Constant. If Image Src A is a 32-bit floating-point image then the following operation is performed: Dst(x, y) = SrcA(x, y) – SrcB(x, y) × E(SrcA(x, y) ÷ SrcB(x, y)), or Dst(x, y) = SrcA(x, y) – Constant × E(SrcA(x, y) ÷ Constant), where E(x) is the integer part of x. The different image-type combinations supported by this VI are described in the following equations. The first symbol represents the image connected to Image Src A and the second symbol represents the image type connected to Image Src B. The third symbol represents the image type that should be connected to the output Image Dst. % = % = % = % = % = % = To modulo-divide an image by a constant, the output Image Dst must be connected to the same image type as the input Image Src A. Division by 0 is not allowed. If 0 is found in the divider, it automatically is replaced by 1. If one of the two source images is empty, the result is a copy of the other. © National Instruments Corporation 15-9 IMAQ Vision for G Reference Manual Chapter 15 Operator VIs Logic Operators IMAQ And Performs an AND or NAND operation on two images or an image and a constant. And/Nand (And) is the result from a logic operation. If set to TRUE, the result of a logic operation is the negative of the performed logic operation (NAND instead of AND). The default is FALSE, which specifies a positive operation (AND). Image Src A is the reference to the source (input) image A. Image Dst is the reference to the destination image. If it is connected, it must be the same type as the Image Src A. Image Src B is the reference to the source (input) image B. Constant is a binary constant used for image-constant operations. The default is 0. error in (no error) is a cluster that describes the error status before this VI executes. For more information about this control, see the section IMAQ VI Error Clusters in Chapter 9, VI Overview and Programming Concepts. Image Dst Out is the reference to the destination (output) image which receives the processing results of the VI. If the Image Dst is connected, then Image Dst Out is the same as Image Dst. Otherwise, Image Dst Out refers to the image referenced by Image Src A. IMAQ Vision for G Reference Manual 15-10 © National Instruments Corporation Chapter 15 Operator VIs error out is a cluster that describes the error status after this VI executes. For more information about this indicator, see the section IMAQ VI Error Clusters in Chapter 9, VI Overview and Programming Concepts. All connected images must be the same image type. An operation between an image and a constant occurs when the input Image Src B is not connected. This VI is performed for each pixel (x, y) in the following manner. If two images are connected on input, then Dst(x, y) = SrcA(x, y) AND SrcB(x, y). If the input Image Src B is not connected, then Dst(x, y) = SrcA(x, y) AND Constant. IMAQ Or Performs an OR or NOR operation on two images or an image and a constant. Or/Nor (Or) is the result from a logic operation. If set to TRUE, the result of a logic operation is the negative of the performed logic operation (NOR instead of OR). The default is FALSE, which specifies a positive operation (OR). Image Src A is the reference to the source (input) image A. Image Dst is the reference to the destination image. If it is connected, it must be the same type as the Image Src A. Image Src B is the reference to the source (input) image B. Constant is a binary constant used for image-constant operations. The default is 0. © National Instruments Corporation 15-11 IMAQ Vision for G Reference Manual Chapter 15 Operator VIs error in (no error) is a cluster that describes the error status before this VI executes. For more information about this control, see the section IMAQ VI Error Clusters in Chapter 9, VI Overview and Programming Concepts. Image Dst Out is the reference to the destination (output) image which receives the processing results of the VI. If the Image Dst is connected, then Image Dst Out is the same as Image Dst. Otherwise, Image Dst Out refers to the image referenced by Image Src A. error out is a cluster that describes the error status after this VI executes. For more information about this indicator, see the section IMAQ VI Error Clusters in Chapter 9, VI Overview and Programming Concepts. All connected images must be the same image type. An operation between an image and a constant occurs when the input Image Src B is not connected. This VI is performed for each pixel (x, y) in the following manner. If two images are connected on input, then Dst(x, y) = SrcA(x, y) OR SrcB(x, y). If the input Image Src B is not connected, then Dst(x, y) = SrcA(x, y) OR Constant. IMAQ Xor Performs an XOR or XNOR operation on two images or an image and a constant. Xor/Xnor (Xor) is the result from a logic operation. If set to TRUE, the result of a logic operation is the negative of the performed logic operation (XNOR instead of XOR). The default is FALSE, which specifies a positive operation (XOR). Image Src A is the reference to the source (input) image A. IMAQ Vision for G Reference Manual 15-12 © National Instruments Corporation Chapter 15 Operator VIs Image Dst is the reference to the destination image. If it is connected, it must be the same type as the Image Src A. Image Src B is the reference to the source (input) image B. Constant is a binary constant used for image-constant operations. The default is 0. error in (no error) is a cluster that describes the error status before this VI executes. For more information about this control, see the section IMAQ VI Error Clusters in Chapter 9, VI Overview and Programming Concepts. Image Dst Out is the reference to the destination (output) image which receives the processing results of the VI. If the Image Dst is connected, then Image Dst Out is the same as Image Dst. Otherwise, Image Dst Out refers to the image referenced by Image Src A. error out is a cluster that describes the error status after this VI executes. For more information about this indicator, see the section IMAQ VI Error Clusters in Chapter 9, VI Overview and Programming Concepts. All connected images must be the same image type. An operation between an image and a constant occurs when the input Image Src B is not connected. This VI is performed for each pixel (x, y) in the following manner. If two images are connected on input, then Dst(x, y) = SrcA(x, y) XOR SrcB(x, y). If the input Image Src B is not connected, then Dst(x, y) = SrcA(x, y) XOR Constant. IMAQ LogDiff Keeps bits found in Image Src A that are absent from image Image Src B. © National Instruments Corporation 15-13 IMAQ Vision for G Reference Manual Chapter 15 Operator VIs This VI is performed for each pixel (x, y) in the following manner. If two images are connected on input, then Dst(x, y) = SrcA(x, y) And Not (SrcB(x, y)). If the input Image Src B is not connected, then Dst(x, y) = SrcA(x, y) And Not (Constant). Constant is a constant value that can replace Image Src B for image-constant operations. The default is 0. Image Src A is the reference to the source (input) image A. Image Dst is the reference to the destination image. If it is connected, it must be the same type as the Image Src A. Image Src B is the reference to the source (input) image B. error in (no error) is a cluster that describes the error status before this VI executes. For more information about this control, see the section IMAQ VI Error Clusters in Chapter 9, VI Overview and Programming Concepts. Image Dst Out is the reference to the destination (output) image which receives the processing results of the VI. If the Image Dst is connected, then Image Dst Out is the same as Image Dst. Otherwise, Image Dst Out refers to the image referenced by Image Src A. error out is a cluster that describes the error status after this VI executes. For more information about this indicator, see the section IMAQ VI Error Clusters in Chapter 9, VI Overview and Programming Concepts. IMAQ Vision for G Reference Manual 15-14 © National Instruments Corporation Chapter 15 Operator VIs IMAQ Compare Regroups all comparison operations between two images or an image and a constant. An operation between an image and a constant occurs when the input Image Src B is not connected. Operator specifies the comparison operator to use. The valid operators are described in the following table. 0 Average Calculates the average. 1 Min Extracts the smallest value. 2 Max Extracts the largest value. 3 Clear if < If then else SrcA(x, y) < SrcB(x, y) or a constant, Dst (x, y) = 0, Dst(x, y) = SrcA(x, y). 4 Clear if < or = If then else SrcA(x, y) ≤ SrcB(x, y) or a constant, Dst (x, y) = 0, Dst(x, y) = SrcA(x, y). 5 Clear if = If then else SrcA(x, y) = SrcB(x, y) or a constant, Dst (x, y) = 0, Dst(x, y) = Src A(x, y). 6 Clear if > or = If then else SrcA(x, y) ≥ SrcB(x, y) or a constant, Dst (x, y) = 0, Dst(x, y) = SrcA(x, y). 7 Clear if > If then else Src A(x, y) > SrcB(x, y) or a constant, Dst (x, y) = 0, Dst(x, y) = SrcA(x, y). © National Instruments Corporation 15-15 IMAQ Vision for G Reference Manual Chapter 15 Operator VIs Image Src A is the reference to the source (input) image A. Image Dst is the reference to the destination image. If it is connected, it must be the same type as the Image Src A. Image Src B is the reference to the source (input) image B. Constant is the value used in comparison with Image Src A for image-constant operations. The default is 0. error in (no error) is a cluster that describes the error status before this VI executes. For more information about this control, see the section IMAQ VI Error Clusters in Chapter 9, VI Overview and Programming Concepts. Image Dst Out is the reference to the destination (output) image which receives the processing results of the VI. If the Image Dst is connected, then Image Dst Out is the same as Image Dst. Otherwise, Image Dst Out refers to the image referenced by Image Src. error out is a cluster that describes the error status after this VI executes. For more information about this indicator, see the section IMAQ VI Error Clusters in Chapter 9, VI Overview and Programming Concepts. The different image-type combinations supported by this VI are described in the following equations. The first symbol represents the image connected to Image Src A and the second symbol represents the image type connected to Image Src B. The third symbol represents the image type that should be connected to the output Image Dst. # = # = # = # = # = # = For all comparison operations, the output Image Dst must be connected to the same image type as the input Image Src A. If one of the two source images is empty, the result is a copy of the other. IMAQ Vision for G Reference Manual 15-16 © National Instruments Corporation Chapter 15 Operator VIs IMAQ Mask Recopies the Image Src into the Image Dst. If a pixel value is 0 (OFF) in the Image Mask, then all corresponding pixels in Image Dst are reset to 0. Image Src is the reference to the source (input) image. Image Mask is an 8-bit image that specifies the region in the image to modify. Only pixels in the original image that correspond to the equivalent pixel in the mask are replaced by the values in the lookup table (provided that the value in the mask is not 0). All pixels not corresponding to this criteria keep their original value. The complete image is modified if Image Mask is not connected. Image Dst is the reference to the destination image. If it is connected, it must be the same type as the Image Src. error in (no error) is a cluster that describes the error status before this VI executes. For more information about this control, see the section IMAQ VI Error Clusters in Chapter 9, VI Overview and Programming Concepts. Image Dst Out is the reference to the destination (output) image which receives the processing results of the VI. If the Image Dst is connected, then Image Dst Out is the same as Image Dst. Otherwise, Image Dst Out refers to the image referenced by Image Src. error out is a cluster that describes the error status after this VI executes. For more information about this indicator, see the section IMAQ VI Error Clusters in Chapter 9, VI Overview and Programming Concepts. The Image Mask contents are considered to be binary. All pixel values other than zero are lit and all pixel values of 0 are turned off. Image Mask must be an 8-bit image if it is different than the Image Src. Image Dst must be the same image type as Image Src. © National Instruments Corporation 15-17 IMAQ Vision for G Reference Manual Chapter 16 Processing VIs This chapter describes the Processing VIs in IMAQ Vision. IMAQ Threshold Applies a threshold to an image. Keep/Replace Value (Replace) determines whether the pixels existing in the range between Lower value and Upper value are to be replaced by another value. The default TRUE replaces these pixel values and the status FALSE keeps the original values. Image Src is the reference to the source (input) image. Image Dst is the reference to the destination image. If it is connected, it must be the same type as the Image Src. Range is a cluster specifying the threshold range. It is composed of the following elements: Lower value is the lowest pixel value used during a threshold. The default is 128. Upper value is the highest pixel value used during a threshold. The default is 255. © National Instruments Corporation 16-1 IMAQ Vision for G Reference Manual Chapter 16 Processing VIs All pixels not contained between Lower value and Upper value are set to 0. All values found between this range are replaced by the value entered in Replace Value, if Keep/Replace Value (Replace) is set to TRUE. Replace Value is the value used to replace pixels between the Lower value and Upper value. This operation requires that Keep/Replace Value (Replace) be set to TRUE. Note: You should use a binary palette when you plan to visualize an image to which a threshold has been applied in Replace mode. However, which palette to use for visualization depends on the value of Replace Value. For example, the visualization of a threshold image could be performed with a gray palette. However, in this case it is advised that you use a replacement value of 255 (white) to see the threshold image better. error in (no error) is a cluster that describes the error status before this VI executes. For more information about this control, see the section IMAQ VI Error Clusters in Chapter 9, VI Overview and Programming Concepts. Image Dst Out is the reference to the destination (output) image which receives the processing results of the VI. If the Image Dst is connected, then Image Dst Out is the same as Image Dst. Otherwise, Image Dst Out refers to the image referenced by Image Src. error out is a cluster that describes the error status after this VI executes. For more information about this indicator, see the section IMAQ VI Error Clusters in Chapter 9, VI Overview and Programming Concepts. IMAQ MultiThreshold Applies a multi-threshold to an image. IMAQ Vision for G Reference Manual 16-2 © National Instruments Corporation Chapter 16 Processing VIs Threshold Data is an array of clusters specifying the mode and threshold range. This operation is analogous to the process in IMAQ Threshold. Each cluster is composed of the following elements. Lower value is the lowest pixel value to be taken into account during a threshold. The default is 128. Upper value (default 255) is the highest pixel value to be taken into account during a threshold. The default is 128. All pixels not contained between these the two values Lower value and Upper value are set to 0. All values found between this range are replaced by the value entered in Replace, if Replace is set to TRUE. Image Src is the reference to the source (input) image. Image Dst is the reference to the destination image. If it is connected, it must be the same type as the Image Src. error in (no error) is a cluster that describes the error status before this VI executes. For more information about this control, see the section IMAQ VI Error Clusters in Chapter 9, VI Overview and Programming Concepts. Image Dst Out is the reference to the destination (output) image which receives the processing results of the VI. If the Image Dst is connected, then Image Dst Out is the same as Image Dst. Otherwise, Image Dst Out refers to the image referenced by Image Src. error out is a cluster that describes the error status after this VI executes. For more information about this indicator, see the section IMAQ VI Error Clusters in Chapter 9, VI Overview and Programming Concepts. The threshold operations are performed in the order that the data is received from Threshold Data. A pixel can be taken into account only once, even if the pixel is included in the threshold range of two different thresholds by Threshold Data. For example, a VI contains two clusters on input: Cluster 1 Cluster 2 Lower value = 80, Upper value = 150, Keep/Replace Value = TRUE, Replace Value = 255. Lower value = 120, Upper value = 200, Keep/Replace Value = FALSE. © National Instruments Corporation 16-3 IMAQ Vision for G Reference Manual Chapter 16 Processing VIs This example shows two threshold ranges with an overlap between 120 and 150. Therefore, the pixels between 120 and 150 are treated only by the first threshold. The following results occur after execution of this VI: • Pixel values between 0 and 79 are replaced by 0 • Pixel values between 80 and 150 are replaced by 255 • Pixel values between 151 and 200 keep their original values • Pixel values greater than 200 are set to 0 IMAQ AutoBThreshold Applies an automatic binary threshold to an image that initially possesses 256 gray levels in two classes. Performs a statistical calculation to determine the optimal threshold. Image is the reference to the source (input) image. Method is the threshold method used. The following values are valid. Note: 0 clustering 1 entropy 2 metric 3 moments 4 inter-class variance See the Thresholding section of Chapter 7, Morphology Analysis, for more information about these methods. IMAQ Vision for G Reference Manual 16-4 © National Instruments Corporation Chapter 16 Processing VIs error in (no error) is a cluster that describes the error status before this VI executes. For more information about this control, see the section IMAQ VI Error Clusters in Chapter 9, VI Overview and Programming Concepts. Threshold Value outputs the threshold value. This value can be directly connected to Lower value from IMAQ Threshold, provided that 255 is connected to Upper value. Lookup Table outputs a lookup table containing 256 elements encoded in 0 and 1. If the threshold value is 160 then the values between 0 and 159 become zero and the values between 160 and 255 become 1. This array can be used directly by IMAQ UserLookup. Threshold Data outputs an array containing two clusters compatible with IMAQ MultiThreshold. The elements in this array define a set of intervals equivalent to the LUT outputted by Lookup Table. error out is a cluster that describes the error status after this VI executes. For more information about this indicator, see the section IMAQ VI Error Clusters in Chapter 9, VI Overview and Programming Concepts. The VI outputs the threshold data in three forms: • The threshold data directly (Threshold Value) • An LUT directly usable by IMAQ UserLookup • An array directly usable by IMAQ MultiThreshold (Threshold Data) IMAQ AutoMThreshold Applies an automatic multi-threshold by using a variant of the classification by clustering method. Starting from a random sort, the gray scale values are determined. This technique is rapid. © National Instruments Corporation 16-5 IMAQ Vision for G Reference Manual Chapter 16 Processing VIs Image is the reference to the source (input) image. Number of Classes is the number of desired phases. This algorithm uses a clustering method and can use any value between 2 and 256. The default is 2. error in (no error) is a cluster that describes the error status before this VI executes. For more information about this control, see the section IMAQ VI Error Clusters in Chapter 9, VI Overview and Programming Concepts. Lookup Table is an array containing the values of the 256 transformed elements encoded between 0 and the (n – 1), where n is the Number of Classes. This array can be connected directly to IMAQ UserLookup. Threshold Data outputs an array containing the Number of Classes compatible with IMAQ MultiThreshold. The results range from 0 to (n – 1), where n is the Number of Classes. error out is a cluster that describes the error status after this VI executes. For more information about this indicator, see the section IMAQ VI Error Clusters in Chapter 9, VI Overview and Programming Concepts. This method is based on a reiterated measurement of an histogram. After finding the best result (a very rapid process), the histogram is segmented into n groups. These groups are based on the fact that each point in a group is closer to the barycenter of its own group than the other group. The VI outputs the threshold data in two forms: • A LUT directly usable by IMAQ UserLookup • An array directly usable by IMAQ MultiThreshold (Threshold Data) IMAQ Vision for G Reference Manual 16-6 © National Instruments Corporation Chapter 16 Processing VIs IMAQ UserLookup Performs a user-chosen lookup table transformation by remapping the pixel values in an image. Lookup Table is a color replacement table. This array can contain 256 elements (8-bit) or 65536 elements (16-bit) depending on the type of image. Individual pixels within the image are not modified in cases in which the lookup table is missing a corresponding value. Image Src is the reference to the source (input) image. Image Mask is an 8-bit image that specifies the region in the image to modify. Only pixels in the original image that correspond to the equivalent pixel in the mask are replaced by the values in the lookup table (provided that the value in the mask is not 0). All pixels not corresponding to this criteria keep their original value. The complete image is modified if Image Mask is not connected. Image Dst is the reference to the destination image. If it is connected, it must be the same type as the Image Src. error in (no error) is a cluster that describes the error status before this VI executes. For more information about this control, see the section IMAQ VI Error Clusters in Chapter 9, VI Overview and Programming Concepts. Image Dst Out is the reference to the destination (output) image which receives the processing results of the VI. If the Image Dst is connected, then Image Dst Out is the same as Image Dst. Otherwise, Image Dst Out refers to the image referenced by Image Src. error out is a cluster that describes the error status after this VI executes. For more information about this indicator, see the section IMAQ VI Error Clusters in Chapter 9, VI Overview and Programming Concepts. © National Instruments Corporation 16-7 IMAQ Vision for G Reference Manual Chapter 16 Processing VIs The following example creates a negative of an 8-bit image (256 values) by applying IMAQ UserLookup. Each gray-level value is replaced by the value (255 – n). The result is a negative of the original image placed in Image Dst. IMAQ MathLookup Converts the pixel values of an image by replacing them with values from a defined lookup table. This VI modifies the dynamic range of either part of an image or the complete image, depending on the type of curve chosen. Note: This VI is fundamental for many image processing procedures. You can use this VI with 8-bit and 16-bit images to create your own lookup table. You can then apply your new curve with the VI IMAQ UserLookup. Range is a cluster containing the minimum and maximum values for the range to modify. The dynamic range of the entire image is modified if this cluster is not connected (or the defaults 0 and 0 are used as input). The dynamic range of the destination image is dependent on the type of input image. The dynamic range for an 8-bit image is between 0 and 255. The dynamic range for 16-bit and 32-bit floating-point images IMAQ Vision for G Reference Manual 16-8 © National Instruments Corporation Chapter 16 Processing VIs is the smallest and largest pixel value contained in the original image prior to processing. The default is (0, 0). Note: The dynamic range for 16-bit and 32-bit floating-point images is not modified. Only the distribution of the values is changed. The following elements are specified in the Range cluster. Minimum is the smallest value used for processing. After processing, all pixel values that are less than or equal to the Minimum (in the original image) are set to 0 for an 8-bit image. In 16-bit and 32-bit floating-point images, these pixel values are set to the smallest pixel value found in the original image. Maximum is the largest value used for processing. After processing, all pixel values that are greater than or equal to the Maximum (in the original image) are set to 255 for an 8-bit image. In 16-bit and 32-bit floating-point images, these pixel values are set to the largest pixel value found in the original image. X value is a value used only for the operators Power X and Power 1/X. Image Src is the reference to the source (input) image. Image Mask is an 8-bit image that specifies the region in the image to modify. Only pixels in the original image that correspond to the equivalent pixel in the mask are replaced by the values in the lookup table (provided that the value in the mask is not 0). All pixels not corresponding to this criteria keep their original value. The complete image is modified if Image Mask is not connected. Image Dst is the reference to the destination image. If it is connected, it must be the same type as the Image Src. Operator specifies the remapping procedure used. The horizontal axis represents the pixel values before processing (between Minimum and Maximum) and the vertical axis represents the pixel values (between Dynamic Minimum and Dynamic Maximum) after processing. The default is 0, which specifies linear remapping. © National Instruments Corporation 16-9 IMAQ Vision for G Reference Manual Chapter 16 Processing VIs Note: 0 Linear Linear remapping. 1 Log A logarithmic remapping operation that gives extended contrast for small pixel values and less contrast for large pixel values. 2 Exp An exponential remapping operation that gives extended contrast for large pixel values and less contrast for small pixel values. 3 Square Similar to Exponential but with a more gradual effect. 4 Square Root 5 Power X 6 Power 1/X Similar to Logarithmic but with a more gradual effect. Gives variable effects depending on the value of X. The default value of X is 1.5. Gives variable effects depending on the value of X. The default value of X is 1.5. For an 8-bit image, the minimum is always 0 and the maximum is always 255. For 32-bit floating-point images, the minimum and maximum are the endpoint values found in the image prior to processing. error in (no error) is a cluster that describes the error status before this VI executes. For more information about this control, see the section IMAQ VI Error Clusters in Chapter 9, VI Overview and Programming Concepts. Image Dst Out is the reference to the destination (output) image which receives the processing results of the VI. If the Image Dst is connected, then Image Dst Out is the same as Image Dst. Otherwise, Image Dst Out refers to the image referenced by Image Src. error out is a cluster that describes the error status after this VI executes. For more information about this indicator, see the section IMAQ VI Error Clusters in Chapter 9, VI Overview and Programming Concepts. IMAQ Vision for G Reference Manual 16-10 © National Instruments Corporation Chapter 16 Processing VIs IMAQ Equalize Produces a histogram equalization of an image. This VI redistributes the pixel values of an image in order to provide an accumulated linear histogram. It is necessary to execute IMAQ Histogram prior to this VI in order to supply Histogram Report as input. The precision of the VI is dependent on the histogram precision, which in turn is dependent on the number of classes used in the histogram. Histogram Report is the histogram from the source image. This histogram is supplied from the output of the VI IMAQ Histogram. No processing occurs if this input is not connected, therefore you need to connect the same image to both IMAQ Histogram and this VI. Image Src is the reference to the source (input) image. Image Mask is an 8-bit image that specifies the region in the image to modify. Only pixels in the original image that correspond to the equivalent pixel in the mask are replaced by the values in the lookup table (provided that the value in the mask is not 0). All pixels not corresponding to this criteria keep their original value. The complete image is modified if Image Mask is not connected. Image Dst is the reference to the destination image. If it is connected, it must be the same type as the Image Src. Range is a cluster containing the minimum and maximum values for the range to equalize. The equalization of the entire image occurs if this cluster is not connected (or the defaults 0 and 0 are used as input). In this case, the Minimal Value and Maximal Value contained in Histogram Report are considered to be the min and max. The default is (0, 0). © National Instruments Corporation 16-11 IMAQ Vision for G Reference Manual Chapter 16 Processing VIs The following elements are specified in this cluster. Minimum is the smallest value used for processing. After processing, all pixel values that are less than or equal to the Minimum (in the original image) are set to 0 for an 8-bit image. In 16-bit and 32-bit floating-point images, these pixel values are set to the smallest pixel value found in the original image. Maximum is the largest value used for processing. After processing, all pixel values that are greater than or equal to the Maximum (in the original image) are set to 255 for an 8-bit image. In 16-bit and 32-bit floating-point images, these pixel values are set to the largest pixel value found in the original image. error in (no error) is a cluster that describes the error status before this VI executes. For more information about this control, see the section IMAQ VI Error Clusters in Chapter 9, VI Overview and Programming Concepts. Image Dst Out is the reference to the destination (output) image which receives the processing results of the VI. If the Image Dst is connected, then Image Dst Out is the same as Image Dst. Otherwise, Image Dst Out refers to the image referenced by Image Src. error out is a cluster that describes the error status after this VI executes. For more information about this indicator, see the section IMAQ VI Error Clusters in Chapter 9, VI Overview and Programming Concepts. Note: The modification to the pixel value is dependent on the histogram contents, regardless of the image type used. All pixels entering into the same histogram class have an identical value after equalization. IMAQ Vision for G Reference Manual 16-12 © National Instruments Corporation Chapter 16 Processing VIs IMAQ Label Labels the particles in a binary image. Connectivity 4/8 (8) specifies the connectivity used for particle detection. The default is 8. Image Src is the reference to the source (input) image. Image Dst is the reference to the destination image. If it is connected, it must be the same type as the Image Src. error in (no error) is a cluster that describes the error status before this VI executes. For more information about this control, see the section IMAQ VI Error Clusters in Chapter 9, VI Overview and Programming Concepts. Image Dst Out is the reference to the destination (output) image which receives the processing results of the VI. If the Image Dst is connected, then Image Dst Out is the same as Image Dst. Otherwise, Image Dst Out refers to the image referenced by Image Src. Number of Particles indicates the number of particles detected in the image. error out is a cluster that describes the error status after this VI executes. For more information about this indicator, see the section IMAQ VI Error Clusters in Chapter 9, VI Overview and Programming Concepts. This operation applies a color to all pixels composing the same group of pixels (a particle). This color level is encoded in 8 or 16 bits, depending on the image type. Therefore, 255 particles can be labeled in an 8-bit image and 65535 particles in a 16-bit image. If you want to label more than 255 particles in an 8-bit image, you need to perform a threshold operation with an interval of [255, 255] after processing the first 254 © National Instruments Corporation 16-13 IMAQ Vision for G Reference Manual Chapter 16 Processing VIs particles. The goal of this threshold operation is to eliminate the first 254 particles in order to visualize the next 254 particles. Image Src is the input image and Image Dst is the resulting image. This operation requires that Image Src and Image Dst be the same image type and that the border for these images be greater or equal to 2. IMAQ Vision for G Reference Manual 16-14 © National Instruments Corporation Chapter 17 Filter VIs This chapter describes the Filter VIs in IMAQ Vision. The filters are divided into two types: linear (also called convolution) and nonlinear. A convolution is a special algorithm that consists of recalculating the value of a pixel based on its own pixel value as well as the pixel values of its neighbors. The sum of this calculation is divided by the sum of the elements in the matrix in order to obtain a new pixel value. The size of the convolution matrix (or kernel) does not have a theoretical limit and can be either square or rectangular (3 × 3, 5 × 5, 5 × 7, 9 × 3, 127 × 127, and so forth). The convolutions are divided into four families: gradient, Laplacian, smoothing, and Gaussian. This grouping is determined by the convolution matrix contents or the weight assigned to each pixel depending on the geographical position of that pixel in relation to the central matrix pixel. IMAQ Vision supplies a set of standard convolution kernels for each family and for the usual sizes (3 × 3, 5 × 5 and 7 × 7). These convolution kernels are accessible from the VI IMAQ GetKernel. You can also create your own kernels. The contents of these user-defined kernels are chosen by the user, and the size of the kernel is virtually unlimited. With this capability, you can create special effect filters. The purpose of the nonlinear filters is to either extract the contours (edge detection) or remove the effect or the isolated pixels. The VI IMAQ EdgeDetection provides six different methods for contour extraction (Differentiation, Gradient, Prewitt, Roberts, Sigma, Sobel). The harmonization of pixel values can be performed with two VIs each using a different method: IMAQ NthOrder and IMAQ LowPass. These VIs require that a kernel size and order number (IMAQ NthOrder) or percentage (IMAQ LowPass) is specified on input. © National Instruments Corporation 17-1 IMAQ Vision for G Reference Manual Chapter 17 Filter VIs IMAQ Convolute Filters an image using a linear filter. The calculations are performed either with integers or floating points, depending on the image type and the contents of the kernel. Divider (kernel sum) is a normalization factor that can be applied to the sum of the obtained products. Under normal conditions the divider should not be connected. If connected (and not equal to 0), the elements internal to the matrix are summed and then divided by this normalization factor. Image Src is the image reference source. It must be an 8-bit or RGB image. Image Mask is an 8-bit image that specifies the region in the image to modify. Only pixels in the original image that correspond to the equivalent pixel in the mask are replaced by the values in the lookup table (provided that the value in the mask is not 0). All pixels not corresponding to this criteria keep their original value. The complete image is modified if Image Mask is not connected. Image Dst is the reference of the image destination. If it is connected, it must be the same type as the Image Src. Kernel is a 2D array that contains the convolution matrix to be applied to the image. The size of the convolution is fixed by the size of this array. The array can be generated by using standard G programming techniques or the VIs IMAQ GetKernel or IMAQ BuildKernel. If the dimensions (XY) produced by this array are not greater than 3, the filter is considered null and the output image is identical to the input image. error in (no error) is a cluster that describes the error status before this VI executes. For more information about this control, see the section IMAQ VI Error Clusters in Chapter 9, VI Overview and Programming Concepts. IMAQ Vision for G Reference Manual 17-2 © National Instruments Corporation Chapter 17 Filter VIs Image Dst Out is the reference to the destination (output) image which receives the processing results of the VI. If the Image Dst is connected, then Image Dst Out is the same as Image Dst. Otherwise, Image Dst Out refers to the image referenced by Image Src. error out is a cluster that describes the error status after this VI executes. For more information about this indicator, see the section IMAQ VI Error Clusters in Chapter 9, VI Overview and Programming Concepts. Any image connected to the input Image Dst must be the same image type connected to Image Src. The image type connected to the input Image Mask must be an 8-bit image. The connected source image must have been created with a border capable of supporting the size of the convolution matrix. A 3 × 3 matrix must have a minimum border of 1, a 5 x 5 matrix must have a minimum border of 2, and so forth. The border size of the destination image is not important. A convolution matrix must have odd-sized dimensions so that it contains a central pixel. The function does not take into account the odd boundary, furthest out on the matrix, if one of the Kernel dimensions is even. For example, if the input Kernel is 6 × 4 (X = 6 and Y = 4), the actual convolution is 5 × 3. Both the sixth line and the fourth are ignored. Remember, the second dimension in a G array is the vertical direction (Y ). Calculations made with an 8-bit or 16-bit Image Src input are made in integer mode provided that the kernel contains only integers. Calculations made with a 32-bit floating-point Image Src input are made in floating-point mode. Note that the processing speed is correlated with the size of the kernel. A 3 × 3 convolution processes nine pixels while a 5 × 5 convolution processes 25 pixels. IMAQ GetKernel Reads a predefined kernel. This VI uses the contents of a convolution catalog (imaqknl.txt). This VI outputs a specified kernel after reading the kernel-associated code. This code consists of three separate units: Kernel Family, Kernel Size, and Kernel Number. If you already know the code, you can enter it directly with Kernel Code. © National Instruments Corporation 17-3 IMAQ Vision for G Reference Manual Chapter 17 Filter VIs Kernel Family determines the type of matrix. The valid values are between 1 and 4, each associated with a particular type. This value corresponds to the thousandth unit in the researched code. 1 Gradient 2 Laplacian 3 Smoothing 4 Gaussian Kernel Size (3,5,...) determines the horizontal and vertical matrix size. The values are 3, 5, and 7, corresponding to the convolutions 3 × 3, 5 × 5, and 7 × 7 supplied in the matrix catalog. This value corresponds to the hundredth unit in the researched code. Kernel Number is the matrix family number. It is a two-digit number, between 0 and n, belonging to a family and a size. A number of predefined matrices are available for each type and size. Kernel Code is a code that permits direct access to a convolution matrix cataloged in the file imaqknl.txt. Each code specifies a specific convolution matrix. This input is used under the conditions that it is connected and is not 0. The kernel located in the file then is transcribed into a 2D G array that is available from the output Kernel. The user can use the codes to specify a predefined kernel as well as to create new user-coded kernels. The coding syntax is simple to employ and is broken down in he following manner. FSnn, where F is the kernel family (1 to 4), S is the kernel size (3,5, and so forth), and nn is the kernel number (based on the family and size of the kernel). error in (no error) is a cluster that describes the error status before this VI executes. For more information about this control, see the section IMAQ VI Error Clusters in Chapter 9, VI Overview and Programming Concepts. Divider is the normalization factor associated with the retrieved kernel. IMAQ Vision for G Reference Manual 17-4 © National Instruments Corporation Chapter 17 Filter VIs Kernel is the resulting matrix. It corresponds to a kernel encoded by a code specified from the inputs Kernel Family, Kernel Size, and Kernel Number or a from a code directly passed through the input Kernel Code. This output can be connected directly to the input Kernel in IMAQ Convolute. Kernel code indicates the code that was used to retrieve the kernel. error out is a cluster that describes the error status after this VI executes. For more information about this indicator, see the section IMAQ VI Error Clusters in Chapter 9, VI Overview and Programming Concepts. Example For the kernel code 1300, the kernel family is gradient, the kernel size is 3 × 3, and the kernel number (nn) is 00. The matrix is –1 –1 –1 0 0 0 1 1 1 IMAQ BuildKernel Constructs a convolution matrix by converting a string. This string can represent either integers or floating-point values. Kernel String is a string listing the coefficients forming the matrix. error in (no error) is a cluster that describes the error status before this VI executes. For more information about this control, see the section IMAQ VI Error Clusters in Chapter 9, VI Overview and Programming Concepts. © National Instruments Corporation 17-5 IMAQ Vision for G Reference Manual Chapter 17 Filter VIs Kernel is the resulting matrix converted from the input string. This output can be connected directly to the input Kernel in IMAQ Convolute. error out is a cluster that describes the error status after this VI executes. For more information about this indicator, see the section IMAQ VI Error Clusters in Chapter 9, VI Overview and Programming Concepts. The column separator can be either a comma, a semi-colon, or a blank space. The line separator is a hard return. For example, the string 1 1 1 1 1 1 1 1 1 produces a 3 × 3 matrix with all coefficients set to 1. IMAQ EdgeDetection Extracts the contours (detects edges) in gray-level values. Any image connected to the input Image Dst must be the same image type connected to Image Src. The image type connected to the input Image Mask must be an 8-bit image. The connected source image must have been created with a border capable of supporting the size of the processing matrix. For example, a 3 × 3 matrix has a minimum border size of 1. The border size of the destination image is not important. Threshold Value is the minimum pixel value to appear in the resulting image. It is rare to use a value greater than 0 for this type of processing because the results from this processing are usually very dark and are not very dynamic. The default is 0. Image Src is the image reference source. Image Mask is an 8-bit image that specifies the region in the image to modify. Only pixels in the original image that correspond to the equivalent pixel in the mask are replaced by the values in the lookup table (provided that the value in the mask is not 0). All pixels not IMAQ Vision for G Reference Manual 17-6 © National Instruments Corporation Chapter 17 Filter VIs corresponding to this criteria keep their original value. The complete image is modified if Image Mask is not connected. Image Dst is the reference of the image destination. If it is connected, it must be the same type as the Image Src. Method specifies the type of edge-detection filter to use. The following table lists some of the available filters. Note: 0 Differentiation (Default) Processing with a 2 × 2 matrix 1 Gradient Processing with a 2 × 2 matrix 2 Prewitt Processing with a 3 × 3 matrix 3 Roberts Processing with a 2 × 2 matrix 4 Sigma Processing with a 3 × 3 matrix 5 Sobel Processing with a 3 × 3 matrix See the Nonlinear Filters section of Chapter 5, Spatial Filtering, for more information about these filters. error in (no error) is a cluster that describes the error status before this VI executes. For more information about this control, see the section IMAQ VI Error Clusters in Chapter 9, VI Overview and Programming Concepts. Image Dst Out is the reference to the destination (output) image which receives the processing results of the VI. If the Image Dst is connected, then Image Dst Out is the same as Image Dst. Otherwise, Image Dst Out refers to the image referenced by Image Src. error out is a cluster that describes the error status after this VI executes. For more information about this indicator, see the section IMAQ VI Error Clusters in Chapter 9, VI Overview and Programming Concepts. © National Instruments Corporation 17-7 IMAQ Vision for G Reference Manual Chapter 17 Filter VIs IMAQ NthOrder Orders (or classifies) the pixel values surrounding the pixel being processed. The data is placed into an array and the pixel being processed is set to the Nth pixel value, the Nth pixel being the ordered number. Size & Order # is a cluster that specifies the following variables. X Size is the size of the horizontal matrix axis. The default is 3. Y Size is the size of the vertical matrix axis. The default is 3. Order # is the order number chosen after classing the values. The default is 4. Image Src is the image reference source. Image Mask is an 8-bit image that specifies the region in the image to modify. Only pixels in the original image that correspond to the equivalent pixel in the mask are replaced by the values in the lookup table (provided that the value in the mask is not 0). All pixels not corresponding to this criteria keep their original value. The complete image is modified if Image Mask is not connected. Image Dst is the reference of the image destination. If it is connected, it must be the same type as the Image Src. error in (no error) is a cluster that describes the error status before this VI executes. For more information about this control, see the section IMAQ VI Error Clusters in Chapter 9, VI Overview and Programming Concepts. IMAQ Vision for G Reference Manual 17-8 © National Instruments Corporation Chapter 17 Filter VIs Image Dst Out is the reference to the destination (output) image which receives the processing results of the VI. If the Image Dst is connected, then Image Dst Out is the same as Image Dst. Otherwise, Image Dst Out refers to the image referenced by Image Src. error out is a cluster that describes the error status after this VI executes. For more information about this indicator, see the section IMAQ VI Error Clusters in Chapter 9, VI Overview and Programming Concepts. Note: See the Nonlinear Filters section of Chapter 5, Spatial Filtering, for more information about the Nth order filter. Any image connected to the input Image Dst must be the same image type connected to Image Src. The image type connected to the input Image Mask must be an 8-bit image. The connected source image must have been created with a border capable of supporting the size of the convolution matrix. A 3 × 3 matrix must have a minimum border of 1, a 5 x 5 matrix must have a minimum border of 2, and so forth. The border size of the destination image is not important. The default for this VI is a 3 × 3 Median operation with X = 3, Y = 3, and Order = 4. To change to a 5 × 5 Median operation, the cluster must take the values X = 5, Y = 5, and Order = 12. In this last example, the order number is determined by calculating the central pixel number in the array. For a 5 × 5 convolution, Order = 12 (the thirteenth pixel) because that pixel is the center pixel number for a 2D array of 25 pixels. A lighter image results when using a higher order number (such as 7 in a 3 × 3 matrix). Darker images result when using a lower order number (such as 1 in a 3 × 3 matrix). A median (center-pixel) operation is advantageous because it standardizes the gray-level values without significantly modifying the form of the objects or the overall brightness in the image. If the order value that is entered is 0, then the image obtained is representative of the local minimum from the source image. If the order value that is passed is equal to [(X Size × Y Size) – 1], then the obtained image is representative of the local maximum from the source image. © National Instruments Corporation 17-9 IMAQ Vision for G Reference Manual Chapter 17 Filter VIs IMAQ LowPass Calculates the inter-pixel variation between the pixel being processed and those pixels surrounding it. If the pixel being processed has a variation greater than a specified percentage, it is set to the average pixel value as calculated from the neighboring pixels. Size & Tolerance is a cluster that specifies the following variables. X Size is the size of the horizontal matrix axis. The default is 3. Y Size is the size of the vertical matrix axis. The default is 3. % Tolerance is the maximum variation authorized. The default is 40%. Image Src is the image reference source. Image Mask is an 8-bit image that specifies the region in the image to modify. Only pixels in the original image that correspond to the equivalent pixel in the mask are replaced by the values in the lookup table (provided that the value in the mask is not 0). All pixels not corresponding to this criteria keep their original value. The complete image is modified if Image Mask is not connected. Image Dst is the reference of the image destination. If it is connected, it must be the same type as the Image Src. error in (no error) is a cluster that describes the error status before this VI executes. For more information about this control, see the section IMAQ VI Error Clusters in Chapter 9, VI Overview and Programming Concepts. IMAQ Vision for G Reference Manual 17-10 © National Instruments Corporation Chapter 17 Filter VIs Image Dst Out is the reference to the destination (output) image which receives the processing results of the VI. If the Image Dst is connected, then Image Dst Out is the same as Image Dst. Otherwise, Image Dst Out refers to the image referenced by Image Src. error out is a cluster that describes the error status after this VI executes. For more information about this indicator, see the section IMAQ VI Error Clusters in Chapter 9, VI Overview and Programming Concepts. Note: See the Nonlinear Filters section of Chapter 5, Spatial Filtering, for more information about the lowpass filter. Any image connected to the input Image Dst must be the same image type connected to Image Src. The image type connected to the input Image Mask must be an 8-bit image. The connected source image must have been created with a border capable of supporting the size of the convolution matrix. A 3 × 3 matrix must have a minimum border of 1, a 5 x 5 matrix must have a minimum border of 2, and so forth. The border size of the destination image is not important. IMAQ Correlate Computes the normalized cross correlation between the source image and the template image. Optional Rectangle defines an array (four elements) containing the coordinates (Left / Top / Right / Bottom) of the region in the source image that is used for the correlation process. Correlation is applied to the entire image if the input is empty or not connected. Image Src is a reference to the source image. The normalized cross correlation is performed between this image and the template image. This image must be an 8-bit image. © National Instruments Corporation 17-11 IMAQ Vision for G Reference Manual Chapter 17 Filter VIs Image Template is a reference to a template image. This image must be an 8-bit image. For the correlation, the center of the template image is used as the origin. Image Dst is the reference of the image destination. If it is connected, it must be the same type as the Image Src. error in (no error) is a cluster that describes the error status before this VI executes. For more information about this control, see the section IMAQ VI Error Clusters in Chapter 9, VI Overview and Programming Concepts. Image Dst Out is an 8-bit image that contains the cross-correlation values normalized to lie in the range [0, 255]. A value of 255 indicates a very high correlation and a value of 0 indicates no correlation. error out is a cluster that describes the error status after this VI executes. For more information about this indicator, see the section IMAQ VI Error Clusters in Chapter 9, VI Overview and Programming Concepts. Note: Correlation is a time-intensive operation. You can reduce the time required to perform a correlation by keeping the template size small and reducing the search area in the source image by using the optional rectangle. IMAQ Vision for G Reference Manual 17-12 © National Instruments Corporation Chapter 18 Morphology VIs This chapter describes the Morphology VIs in IMAQ Vision. The morphological transformations are divided into two groups: binary morphology and gray-level morphology. In binary morphology, the pixels are considered to exist in either of two states. The pixels are present (for pixel values other than 0) or absent (for pixel values equal to 0). The two types of binary processing available, primary and advanced, perform one of two actions: They activate and deactivate pixels. However, with gray-level morphology, a pixel is compared to those pixels surrounding it, to keep those pixel values that are the smallest (erosion) or the largest (dilation). VIs responsible for binary morphological transformations only accept an 8-bit image while the VI for gray-level morphological transformations (using IMAQ GrayMorphology) accepts 8-bit 16-bit, or 32-bit floating-point images. An image is considered to be binary after it has undergone a threshold (IMAQ Threshold, IMAQ AutoBThreshold, and so forth). Binary morphology is divided into two groups in IMAQ Vision. The primary operations are all performed by a single VI (IMAQ Morphology). This VI performs erosions, dilations, openings, closings, and contour extractions. The advanced operations are performed by multiple VIs, each responsible for a single type of operation. These types of operations include the separation of particles, removing either small or large particles, filling holes in particles, removing particles that touch the boundary of the image border, and creating the skeleton of particles. Morphological transformations are performed using an object known as a structuring element. This structuring element allows you to control the effect of the functions on the shape and the boundary of object. In IMAQ Vision, the structuring element is a 2D array that specifies, by its size and contents, which pixels are to be processed and which pixels are to be left unchanged. A structuring element must have a center pixel and therefore must contain an odd-sized axis. The contents of the structuring element are also considered to be binary (0 or not 0). The most often used structuring element is 3 × 3 and contains only values of 1. This is usually the default model for binary and gray-level © National Instruments Corporation 18-1 IMAQ Vision for G Reference Manual Chapter 18 Morphology VIs morphological transformations. You need at least a basic understanding of structuring elements before experimenting with user-chosen sizes and contents. The majority of the VIs for advanced morphology do not possess an input for structuring element because only the standard 3 × 3 default is useful. The connected source image for a morphological transformation must have been created with a border capable of supporting the size of the structuring element. A 3 × 3 structuring element requires a minimal border of 1, a 5 × 5 structuring element requires a minimal border of 2, and so forth. The input Square/Hexa is available for certain VIs that perform morphological transformations. This concept introduces a variable for the perception of an image frame (aligned or shifted), which has an influence on the decision to include or not include pixels in the processing. The figure shown below illustrates the difference between a 3 × 3 and 5 × 5 structuring element in a square frame and a hexagonal frame. Square 3 × 3 Hexagonal 3 × 3 Square 5 × 5 Hexagonal 5 × 5 When processing in hexagonal mode, the elements [2, 0] and [2, 2] from the 3 × 3 structuring element are not used. The same holds true for the elements [0, 0], [4, 0], [4, 1], [4, 3], [0, 4] and [4, 4] if the transformation is made with a 5 × 5 structuring element. IMAQ Vision for G Reference Manual 18-2 © National Instruments Corporation Chapter 18 Morphology VIs The input Connectivity 4/8 (default is 8) is used for the advanced morphology VIs: IMAQ RemoveParticle, IMAQ RejectBorder, and IMAQ FillHole. These VIs use this input to determine whether or not a neighboring pixel is considered to be part of same particle. The difference is illustrated below. Connectivity 4 Connectivity 8 IMAQ Morphology Performs primary morphological transformations. All source images must be 8-bit binary images. The connected source image for a morphological transformation must have been created with a border capable of supporting the size of the structuring element. A 3 × 3 structuring element requires a minimal border of 1, a 5 × 5 structuring element requires a minimal border of 2, and so forth. The border size of the destination image is not important. Square/Hexa (Square) specifies whether the pixel frame is treated as square or hexagonal during the transformation. The default is square. Image Src is the reference to the source (input) image. Image Dst is the reference to the destination image. If it is connected, it must be the same type as the Image Src. © National Instruments Corporation 18-3 IMAQ Vision for G Reference Manual Chapter 18 Morphology VIs Operation specifies the type of morphological transformation procedure to use. The default is 0. 0 AutoM (Default) Auto median 1 Close Dilation followed by an erosion 2 Dilate Dilation (the opposite of an erosion) 3 Erode Erosion that eliminates isolated background pixels 4 Gradient Extraction of internal and external contours of a particle 5 Gradient out Extraction of exterior contours of a particle 6 Gradient in Extraction of interior contours of a particle 7 Hit miss Elimination of all pixels that do not have the same pattern as found in the structuring element 8 Open Erosion followed by a dilation 9 PClose A succession of 7 closings and openings 10 POpen A succession of 7 openings and closings 11 Thick Activation of all pixels matching the pattern in the structuring element 12 Thin Activation of all pixels matching the pattern in the structuring element Structuring Element is a 2D array that contains the structuring element to be applied to the image. The size of the structuring element (the size of this array) determines the processing size. A structuring element of 3 × 3 is used if this input is not connected. error in (no error) is a cluster that describes the error status before this VI executes. For more information about this control, see the section IMAQ VI Error Clusters in Chapter 9, VI Overview and Programming Concepts. IMAQ Vision for G Reference Manual 18-4 © National Instruments Corporation Chapter 18 Morphology VIs Image Dst Out is the reference to the destination (output) image which receives the processing results of the VI. If the Image Dst is connected, then Image Dst Out is the same as Image Dst. Otherwise, Image Dst Out refers to the image referenced by Image Src. error out is a cluster that describes the error status after this VI executes. For more information about this indicator, see the section IMAQ VI Error Clusters in Chapter 9, VI Overview and Programming Concepts. A structuring element must have odd-sized dimensions so that it contains a central pixel. The function does not take into account the odd boundary, furthest out on the matrix, if one of the dimensions for the structuring element is even. For example, if the input structuring element is 6 × 4 (X = 6 and Y = 4), the actual processing is performed at 5 × 3. Both the sixth line and the fourth row are ignored. Recall that the second dimension in a G array is the vertical direction (Y ). The processing speed is correlated with the size of the structuring element; for example, a 3 × 3 convolution processes nine pixels while a 5 × 5 convolution processes 25 pixels. IMAQ GrayMorphology Performs morphological transformations that can be directly applied to gray-level images. All source and destination image types must be the same. The connected source image for a morphological transformation must have been created with a border capable of supporting the size of the structuring element. A 3 × 3 structuring element requires a minimal border of 1, a 5 × 5 structuring element requires a minimal border of 2, and so forth. The border size of the destination image is not important. Square/Hexa (Square) specifies whether the pixel frame is treated as square or hexagonal during the transformation. The default is square. Image Src is the reference to the source (input) image. © National Instruments Corporation 18-5 IMAQ Vision for G Reference Manual Chapter 18 Morphology VIs Image Dst is the reference to the destination image. If it is connected, it must be the same type as the Image Src. Operation specifies the type of morphological transformation procedure to use. The default is 0. 0 AutoM (Default) Auto median 1 Close Dilation followed by an erosion 2 Dilate Dilation 3 Erode Erosion 4 unused 5 unused 6 unused 7 unused 8 Open Erosion followed by a dilation 9 PClose A succession of 7 closings and openings 10 POpen A succession of 7 openings and closings Structuring Element is a 2D array that contains the structuring element to be applied to the image. The size of the structuring element (the size of this array) determines the processing size. A structuring element of 3 × 3 is used if this input is not connected. error in (no error) is a cluster that describes the error status before this VI executes. For more information about this control, see the section IMAQ VI Error Clusters in Chapter 9, VI Overview and Programming Concepts. IMAQ Vision for G Reference Manual 18-6 © National Instruments Corporation Chapter 18 Morphology VIs Image Dst Out is the reference to the destination (output) image which receives the processing results of the VI. If the Image Dst is connected, then Image Dst Out is the same as Image Dst. Otherwise, Image Dst Out refers to the image referenced by Image Src. error out is a cluster that describes the error status after this VI executes. For more information about this indicator, see the section IMAQ VI Error Clusters in Chapter 9, VI Overview and Programming Concepts. A structuring element must have odd-sized dimensions so that it contains a central pixel. The function does not take into account the odd boundary, farthest out on the matrix, if one of the dimensions for the structuring element is even. For example, if the input structuring element is 6 × 4 (X = 6 and Y = 4), the actual processing is performed at 5 × 3. Both the sixth line and the fourth row are ignored. Recall that the second dimension in a G array is the vertical direction (Y). The processing speed is correlated with the size of the structuring element. For example, a 3 × 3 convolution processes nine pixels while a 5 × 5 convolution processes 25 pixels. IMAQ Distance Encodes a pixel value of a particle as a function of the location of that pixel in relation to the distance to the border of the particle. The source image must have been created with a border size of at least 1 and must be an 8-bit binary image. This function requires the creation of a temporary memory space that is twice the size of the source image. Image Src is the reference to the source (input) image. Image Dst is the reference to the destination image. If it is connected, it must be the same type as the Image Src. error in (no error) is a cluster that describes the error status before this VI executes. For more information about this control, see the section IMAQ VI Error Clusters in Chapter 9, VI Overview and Programming Concepts. © National Instruments Corporation 18-7 IMAQ Vision for G Reference Manual Chapter 18 Morphology VIs Image Dst Out is the reference to the destination (output) image which receives the processing results of the VI. If the Image Dst is connected, then Image Dst Out is the same as Image Dst. Otherwise, Image Dst Out refers to the image referenced by Image Src. error out is a cluster that describes the error status after this VI executes. For more information about this indicator, see the section IMAQ VI Error Clusters in Chapter 9, VI Overview and Programming Concepts. IMAQ Danielsson Returns a distance map based on the algorithms of Danielsson. The Danielsson distance map produces images and data that are similar to IMAQ Distance but are much more accurate. In most cases it is recommended that you use this function instead of IMAQ Distance. Image Src is the reference to the source (input) image. Image Dst is the reference to the destination image. If it is connected, it must be the same type as the Image Src. error in (no error) is a cluster that describes the error status before this VI executes. For more information about this control, see the section IMAQ VI Error Clusters in Chapter 9, VI Overview and Programming Concepts. Image Dst Out is the reference to the destination (output) image which receives the processing results of the VI. If the Image Dst is connected, then Image Dst Out is the same as Image Dst. Otherwise, Image Dst Out refers to the image referenced by Image Src. error out is a cluster that describes the error status after this VI executes. For more information about this indicator, see the section IMAQ VI Error Clusters in Chapter 9, VI Overview and Programming Concepts. IMAQ Vision for G Reference Manual 18-8 © National Instruments Corporation Chapter 18 Morphology VIs IMAQ RemoveParticle Eliminates or keeps particles resistant to a specified number of 3 × 3 erosions. The particles that are kept are exactly the same as those found in the original source image. The source image must be an 8-bit binary image. This function requires the creation of a temporary memory space that is twice the size of the source image. Connectivity 4/8 (8) specifies how the algorithm determines whether an adjacent pixel is the same or different particle. The default is 8. Square/Hexa (Square) specifies whether the pixel frame is treated as square or hexagonal during the transformation. The default is square. Image Src is the reference to the source (input) image. Image Dst is the reference to the destination image. If it is connected, it must be the same type as the Image Src. Number of Erosion specifies the number of 3 × 3 erosions to apply to the image. The default is 2. Low Pass/High Pass (Low) specifies whether the objects resistant to n erosions are discarded or kept (default). error in (no error) is a cluster that describes the error status before this VI executes. For more information about this control, see the section IMAQ VI Error Clusters in Chapter 9, VI Overview and Programming Concepts. Image Dst Out is the reference to the destination (output) image which receives the processing results of the VI. If the Image Dst is connected, then Image Dst Out is the same as Image Dst. Otherwise, Image Dst Out refers to the image referenced by Image Src. © National Instruments Corporation 18-9 IMAQ Vision for G Reference Manual Chapter 18 Morphology VIs error out is a cluster that describes the error status after this VI executes. For more information about this indicator, see the section IMAQ VI Error Clusters in Chapter 9, VI Overview and Programming Concepts. IMAQ FillHole Fills the holes found in a particle. The holes are filled with a pixel value of 1. The source image must be an 8-bit binary image. This operation requires the creation of a temporary memory space that is equal to the size of the source image. Image Src is the reference to the source (input) image. Image Dst is the reference to the destination image. If it is connected, it must be the same type as the Image Src. error in (no error) is a cluster that describes the error status before this VI executes. For more information about this control, see the section IMAQ VI Error Clusters in Chapter 9, VI Overview and Programming Concepts. Image Dst Out is the reference to the destination (output) image which receives the processing results of the VI. If the Image Dst is connected, then Image Dst Out is the same as Image Dst. Otherwise, Image Dst Out refers to the image referenced by Image Src. error out is a cluster that describes the error status after this VI executes. For more information about this indicator, see the section IMAQ VI Error Clusters in Chapter 9, VI Overview and Programming Concepts. IMAQ Vision for G Reference Manual 18-10 © National Instruments Corporation Chapter 18 Morphology VIs In the following example, the central empty portion is a hole and therefore is filled with a connectivity of 8. With a connectivity of 4, this function leaves the hole unchanged. Note: The holes found in contact with the image border are never filled because it is impossible to determine whether these holes are part of a particle or not. IMAQ RejectBorder Eliminates particles that touch the border of an image. The source image must be an 8-bit binary. This operation requires the creation of a temporary memory space that is equal to the size of the source image. Image Src is the reference to the source (input) image. Image Dst is the reference to the destination image. If it is connected, it must be the same type as the Image Src. error in (no error) is a cluster that describes the error status before this VI executes. For more information about this control, see the section IMAQ VI Error Clusters in Chapter 9, VI Overview and Programming Concepts. Image Dst Out is the reference to the destination (output) image which receives the processing results of the VI. If the Image Dst is connected, then Image Dst Out is the same as Image Dst. Otherwise, Image Dst Out refers to the image referenced by Image Src. © National Instruments Corporation 18-11 IMAQ Vision for G Reference Manual Chapter 18 Morphology VIs error out is a cluster that describes the error status after this VI executes. For more information about this indicator, see the section IMAQ VI Error Clusters in Chapter 9, VI Overview and Programming Concepts. IMAQ Convex Calculates a convex envelope for particles that are labeled in an image. You need to execute IMAQ Label prior to this VI in order to label the objects in the image. Image Src is the reference to the source (input) image. Image Dst is the reference to the destination image. If it is connected, it must be the same type as the Image Src. error in (no error) is a cluster that describes the error status before this VI executes. For more information about this control, see the section IMAQ VI Error Clusters in Chapter 9, VI Overview and Programming Concepts. Image Dst Out is the reference to the destination (output) image which receives the processing results of the VI. If the Image Dst is connected, then Image Dst Out is the same as Image Dst. Otherwise, Image Dst Out refers to the image referenced by Image Src. error out is a cluster that describes the error status after this VI executes. For more information about this indicator, see the section IMAQ VI Error Clusters in Chapter 9, VI Overview and Programming Concepts. IMAQ Vision for G Reference Manual 18-12 © National Instruments Corporation Chapter 18 Morphology VIs IMAQ Circles Separates overlapping circular objects and classifies them based on their radius, surface area, and perimeter. Starting from a binary image, it finds the radius and center of the circular objects even when multiple circular objects overlap. In addition, this VI can trace the circles in the destination image. It constructs and uses a Danielsson distance map to determine the radius of each object. Note: IMAQ Circles works correctly only for circles that have a radius less than or equal to 256 pixels. Image Src is the reference to the source (input) image. Image Dst is the reference to the destination image. If it is connected, it must be the same type as the Image Src. Min Radius is the smallest radius (in pixels) that is detected. Circles possessing a radius smaller than this value do not appear in the destination image and have a negative radius value in the output Circles Data. The default is 1. Max Radius (default 10) is the largest radius (in pixels) that is detected. Circles possessing a radius larger than this value do not appear in the destination image and have a negative radius value in the output Circles Data. The default is 10. error in (no error) is a cluster that describes the error status before this VI executes. For more information about this control, see the section IMAQ VI Error Clusters in Chapter 9, VI Overview and Programming Concepts. Image Dst Out is the reference to the destination (output) image which receives the processing results of the VI. If the Image Dst is connected, then Image Dst Out is the same as Image Dst. Otherwise, Image Dst Out refers to the image referenced by Image Src. © National Instruments Corporation 18-13 IMAQ Vision for G Reference Manual Chapter 18 Morphology VIs Nb Circles returns the number of detected circles in the image Note: Circles with a radius outside the limits of Min Radius or Max Radius also are included in this number. Circles Data returns an array of measurements for all detected circles. Each element in the array has a structure containing the following elements: Pos. X is the horizontal position (in pixels) of the center of the circle. Pos. Y is the vertical position (in pixels) of the center of the circle. Radius is the radius of the circle (in pixels). Circles with a radius outside the limits of Min Radius or Max Radius contain negative radius values. Core Area is the surface area (in pixels) of the nucleus of the circle as defined by the Danielsson distance map. error out is a cluster that describes the error status after this VI executes. For more information about this indicator, see the section IMAQ VI Error Clusters in Chapter 9, VI Overview and Programming Concepts. IMAQ Segmentation Starting from a labeled image, calculates the zones of influence between particles. Each labeled particle grows until the particles reach their neighbors, at which time this growth is stopped. The source image must have a border greater than or equal to 1. Image Src is the reference to the source (input) image. IMAQ Vision for G Reference Manual 18-14 © National Instruments Corporation Chapter 18 Morphology VIs Image Dst is the reference to the destination image. If it is connected, it must be the same type as the Image Src. error in (no error) is a cluster that describes the error status before this VI executes. For more information about this control, see the section IMAQ VI Error Clusters in Chapter 9, VI Overview and Programming Concepts. Image Dst Out is the reference to the destination (output) image which receives the processing results of the VI. If the Image Dst is connected, then Image Dst Out is the same as Image Dst. Otherwise, Image Dst Out refers to the image referenced by Image Src. error out is a cluster that describes the error status after this VI executes. For more information about this indicator, see the section IMAQ VI Error Clusters in Chapter 9, VI Overview and Programming Concepts. IMAQ Skeleton Starting from a binary image, calculates a skeleton from particles within an image or the lines delineating the zones of influence (skeleton of an inverse image). The source image must have a border greater than or equal to 1. Mode specifies the type of skeleton to perform. The default is 0. 0 © National Instruments Corporation Skeleton L uses this type structuring element: 18-15 IMAQ Vision for G Reference Manual Chapter 18 Morphology VIs 1 Skeleton M uses this type structuring element: 2 Skiz is an inverse skeleton (Skeleton L on an inverse image). Image Src is the reference to the source (input) image. Image Dst is the reference to the destination image. If it is connected, it must be the same type as the Image Src. error in (no error) is a cluster that describes the error status before this VI executes. For more information about this control, see the section IMAQ VI Error Clusters in Chapter 9, VI Overview and Programming Concepts. Image Dst Out is the reference to the destination (output) image which receives the processing results of the VI. If the Image Dst is connected, then Image Dst Out is the same as Image Dst. Otherwise, Image Dst Out refers to the image referenced by Image Src. error out is a cluster that describes the error status after this VI executes. For more information about this indicator, see the section IMAQ VI Error Clusters in Chapter 9, VI Overview and Programming Concepts. IMAQ Vision for G Reference Manual 18-16 © National Instruments Corporation Chapter 18 Morphology VIs IMAQ Separation Separates touching particles, particularly small isthmuses found between particles. It performs n erosions (n = Nb of erosions) and then reconstructs the final image based on the results of the erosion. If during the erosion process an existing isthmus has been broken or removed, then the particles are reconstructed without the isthmus. The reconstructed particles, however, have the same size as the initial particles except that they are separated. If during the erosion process no isthmus has been broken, then the particles are reconstructed as they were initially found (no changes are made). The source image must be an 8-bit binary image. The source image must have a border greater than or equal to 1. Square/Hexa (Square) specifies whether the pixel frame is treated as square or hexagonal during the transformation. The default is square. Image Src is the reference to the source (input) image. Image Dst is the reference to the destination image. If it is connected, it must be the same type as the Image Src. Nb of Erosion specifies the number of erosions that are used to separate the particles. The default is 1. Structuring Element is a 2D array that contains the structuring element to be applied to the image. The size of the structuring element (the size of this array) determines the processing size. A structuring element of 3 × 3 is used if this input is not connected. error in (no error) is a cluster that describes the error status before this VI executes. For more information about this control, see the section IMAQ VI Error Clusters in Chapter 9, VI Overview and Programming Concepts. © National Instruments Corporation 18-17 IMAQ Vision for G Reference Manual Chapter 18 Morphology VIs Image Dst Out is the reference to the destination (output) image which receives the processing results of the VI. If the Image Dst is connected, then Image Dst Out is the same as Image Dst. Otherwise, Image Dst Out refers to the image referenced by Image Src. error out is a cluster that describes the error status after this VI executes. For more information about this indicator, see the section IMAQ VI Error Clusters in Chapter 9, VI Overview and Programming Concepts. The following graphic illustrates the processing performed with this function. Source Image IMAQ Vision for G Reference Manual Resulting Image 18-18 © National Instruments Corporation Chapter 19 Analysis VIs This chapter describes the Analysis VIs in IMAQ Vision. IMAQ Histogram Calculates the histogram of an image. Image is the input source image used for calculating the histogram. Image Mask is an 8-bit image specifying the region in the image to use for calculating a histogram. Only pixels in the original image that correspond to the equivalent pixel in the mask are used for calculating the histogram (provided that the value in the mask is not 0). A histogram on the complete image occurs if the Image Mask is not connected. Number of Classes specifies the number of classes used to classify the pixels. The number of obtained classes differs from the specified amount in a case in which the minimum and maximum boundaries are overshot in the Interval Range. It is advised to specify an even number of classes (for example, 2, 4, or 8) for 8-bit or 16-bit images. The default value is 256, which is designed for 8-bit images. This value gives a uniform class distribution or one class for each pixel in a 8-bit image. Interval Range is a cluster specifying the minimum and maximum boundaries for the histogram calculation. Only pixels having a value that falls in this range are taken into account by the histogram calculation. This cluster is composed of the following elements. © National Instruments Corporation 19-1 IMAQ Vision for G Reference Manual Chapter 19 Analysis VIs Minimum is the minimum interval value. The default value of (0, 0) insures that the real minimum value is determined by the source image, as described in the following table. Image Type Minimum Value Used (0, 0) Minimum pixel value found in the image Minimum pixel value found in the image Maximum is the maximum interval value. The default value of (0, 0) insures that the real maximum value is determined by the source image, as described in the following table. Image Type Maximum Value Used 255 Maximum pixel value found in the image Maximum pixel value found in the image error in (no error) is a cluster that describes the error status before this VI executes. For more information about this control, see the section IMAQ VI Error Clusters in Chapter 9, VI Overview and Programming Concepts. Histogram Report is a cluster that returns the histogram values. This cluster contains the following elements. Histogram returns the histogram values in an array. The elements found in this array are the number of pixels per class. The nth class contains all pixel values belonging to the interval [(Starting Value + (n – 1) × Interval Width), (Starting Value + n × (Interval Width – 1))]. IMAQ Vision for G Reference Manual 19-2 © National Instruments Corporation Chapter 19 Analysis VIs Minimal Value returns the smallest pixel value used in calculating the histogram. Maximal Value returns the largest pixel value used in calculating the histogram. Starting Value returns the smallest pixel value from the first class calculated in the histogram. It can be equal to the Minimal value from the Interval Range or the smallest value found for the image type connected. Interval Width returns the length of each class. Mean Value returns the mean value of the pixels used in calculating the histogram. Standard Deviation returns the standard deviation from the histogram A higher value corresponds to a better distribution of the values in the histogram and the image. Area (pixels) returns the number of pixels used in the histogram calculation. This is influenced by the values specified in Interval Range and the contents of Image Mask. error out is a cluster that describes the error status after this VI executes. For more information about this indicator, see the section IMAQ VI Error Clusters in Chapter 9, VI Overview and Programming Concepts. IMAQ Histograph Calculates the histogram from an image. This VI returns a data type (cluster) compatible with a LabVIEW or BridgeVIEW graph. Image is the input source image used for calculating the histogram. © National Instruments Corporation 19-3 IMAQ Vision for G Reference Manual Chapter 19 Analysis VIs Image Mask is an 8-bit image specifying the region in the image to use for calculating a histogram. Only pixels in the original image that correspond to the equivalent pixel in the mask are used for calculating the histogram (provided that the value in the mask is not 0). A histogram on the complete image occurs if the Image Mask is not connected. Number of Classes specifies the number of classes used to classify the pixels. The number of obtained classes differs from the specified amount in a case in which the minimum and maximum boundaries are overshot in the Interval Range. You are advised to specify an even number of classes (for example, 2, 4, or 8) for 8-bit or 16-bit images. The default value is 256, which is designed for 8-bit images. This value gives a uniform class distribution or one class for each pixel in a 8-bit image. Interval Range is a cluster specifying the minimum and maximum boundaries for the histogram calculation. Only pixels having a value that falls in this range are taken into account by the histogram calculation. This cluster is composed of the following elements. Minimum is the minimum interval value. The default value of (0, 0) insures that the real minimum value is determined by the source image, as described in the following table. Image Type Minimum Value Used 0 Minimum pixel value found in the image Minimum pixel value found in the image IMAQ Vision for G Reference Manual 19-4 © National Instruments Corporation Chapter 19 Analysis VIs Maximum is the maximum interval value. The default value of (0, 0) insures that the real maximum value is determined by the source image, as described in the following table. Image Type Maximum Value Used 255 Maximum pixel value found in the image Maximum pixel value found in the image error in (no error) is a cluster that describes the error status before this VI executes. For more information about this control, see the section IMAQ VI Error Clusters in Chapter 9, VI Overview and Programming Concepts. Histogram Graph is a cluster that returns the histogram values. This cluster contains the following elements. Starting Value returns the smallest pixel value from the first class calculated in the histogram. It can be equal to the Minimal value from the Interval Range or the smallest value found for the image type connected. Incremental Value returns the incrementing value that specifies how much to add to Starting Value in calculating the median value of each class from the histogram. The median value xn from the nth class is xn = Starting Value + n × Incremental Value. Histogram returns the histogram values in an array. The elements found in this array are the number of pixels per class. The nth class contains all pixel values belonging to the interval [(Starting Value + (n – 1) × Interval Width), (Starting Value + n × (Interval Width – 1))]. Mean Value returns the mean value of the pixels used in calculating the histogram. © National Instruments Corporation 19-5 IMAQ Vision for G Reference Manual Chapter 19 Analysis VIs Standard Deviation returns the standard deviation from the histogram. The higher this value, the better the distribution of the values in the histogram and the image. error out is a cluster that describes the error status after this VI executes. For more information about this indicator, see the section IMAQ VI Error Clusters in Chapter 9, VI Overview and Programming Concepts. The following figure shows the interval for calculating a histogram, where n is the number of pixels and c is the indexing number. IMAQ LineProfile Calculates the profile of a line of pixels. This VI returns a data type (cluster) compatible with a LabVIEW or BridgeVIEW graph. The relevant pixel information is taken from the specified vector (line). Image is the input source image used for calculating the line profile. Line Coordinates are an array specifying the pixel coordinates that form the end-points of the line. IMAQ Vision for G Reference Manual 19-6 © National Instruments Corporation Chapter 19 Note: Analysis VIs A line with the coordinates [0, 0, 0, 255] is formed from 256 pixels. Any pixels designated by the Line Coordinates found outside the actual image are set to 0 in Line Graph. error in (no error) is a cluster that describes the error status before this VI executes. For more information about this control, see the section IMAQ VI Error Clusters in Chapter 9, VI Overview and Programming Concepts. Line Graph is a cluster that contains the line profile with an X origin at 0 and an increment of 1. The cluster contains the following elements. x0 always returns 0. dx always returns 1. Pixels Line returns the line profile calculated in an array in which elements represent the pixel values belonging to the specified vector. Line Information is a cluster containing relevant information about the pixels found in the specified vector. This cluster contains the following elements. Min returns the smallest pixel value found in the line profile. Max returns the largest pixel value found in the line profile. Mean returns the mean value of the pixels found in the line profile. Var returns the standard deviation from the line profile. Count found in the line profile. Global Rectangle is a cluster that contains the coordinates of a bounding rectangle for the line in the image. The following elements are included in the cluster. x1Left indicates the coordinates for the upper-left corner of the rectangle. © National Instruments Corporation 19-7 IMAQ Vision for G Reference Manual Chapter 19 Analysis VIs y1Top indicates the coordinates for the top-left corner of the rectangle. x2Right indicates the coordinates for the lower-right corner of the rectangle. y2Bottom indicates the coordinates for the bottom-right corner of the rectangle. error out is a cluster that describes the error status after this VI executes. For more information about this indicator, see the section IMAQ VI Error Clusters in Chapter 9, VI Overview and Programming Concepts. IMAQ LinearAverages Computes the average pixel intensity (mean line profile) on whole or part of the image. Image Src is the reference to the source (input) image. Optional Rectangle defines an array (four elements) containing the coordinates (Left / Top / Right / Bottom) of the region to extract. The operation is applied to the entire image if the input is empty or not connected. error in (no error) is a cluster that describes the error status before this VI executes. For more information about this control, see the section IMAQ VI Error Clusters in Chapter 9, VI Overview and Programming Concepts. X Axis Averages is the linear average along each column in the image. Y Axis Averages is the linear average along each row in the image. IMAQ Vision for G Reference Manual 19-8 © National Instruments Corporation Chapter 19 Analysis VIs X + Y Axis Averages is the linear average along each diagonal running from bottom-left to top-right. X - Y Axis Averages is the linear average along each diagonal running from top-left to bottom-right. error out is a cluster that describes the error status after this VI executes. For more information about this indicator, see the section IMAQ VI Error Clusters in Chapter 9, VI Overview and Programming Concepts. IMAQ Quantify Quantifies the contents of an image or the regions within an image. The region definition is performed with a labeled image mask. Each mask has a single unique value. Image is the input source image. Image Mask is an 8-bit image specifying the regions to quantify in the image. Only pixels in the original image that correspond to the equivalent pixel in the mask are used for the quantification. Each pixel in this image (mask) indicates, by its value, which region belongs the corresponding pixel in Image. 255 different regions can be quantified directly from the Image. A quantification is performed on the complete image if the Image Mask is not connected. error in (no error) is a cluster that describes the error status before this VI executes. For more information about this control, see the section IMAQ VI Error Clusters in Chapter 9, VI Overview and Programming Concepts. Global Report is a cluster containing the quantification data relative to all the regions within an image (or the entire image if the Image Mask is not connected). The following elements are contained in this cluster. © National Instruments Corporation 19-9 IMAQ Vision for G Reference Manual Chapter 19 Analysis VIs Mean Value of the pixels is returned. Standard Deviation of the pixel values is returned. It indicates the distribution of the values in relation to the average. The higher this value, the better the distribution of the pixel values. Minimal Value returns the smallest pixel value. Maximal Value returns the largest pixel value. Area (calibrated) returns the analyzed surface area in user-units. Area (pixels) returns the analyzed surface area in pixels. % returns the percentage of the analyzed surface in relation to the complete image. Region Reports is a cluster containing the quantification data relative to each region within an image (or the entire image if the Image Mask is not connected). The nth element in this array contains the data regarding the nth region. The size of this array is equal to the largest pixel value in Image Mask. The returned data is identical to the data in Global Report. error out is a cluster that describes the error status after this VI executes. For more information about this indicator, see the section IMAQ VI Error Clusters in Chapter 9, VI Overview and Programming Concepts. IMAQ Centroid Computes the energy center of the image. IMAQ Vision for G Reference Manual 19-10 © National Instruments Corporation Chapter 19 Analysis VIs Image is the reference to the image whose centroid has to be calculated. Image Mask is an 8-bit image specifying the region in the image to use for calculating a centroid. Only pixels in the original image that correspond to the equivalent pixel in the mask are used for calculating the centroid (provided that the value in the mask is not 0). A centroid on the complete image occurs if the Image Mask is not connected. error in (no error) is a cluster that describes the error status before this VI executes. For more information about this control, see the section IMAQ VI Error Clusters in Chapter 9, VI Overview and Programming Concepts. Centroid is a cluster containing the X and Y coordinates of the centroid of the image. error out is a cluster that describes the error status after this VI executes. For more information about this indicator, see the section IMAQ VI Error Clusters in Chapter 9, VI Overview and Programming Concepts. IMAQ BasicParticle Detects and measures particles. This VI returns the area and position of particles in a binary image. Image is the input source image used for calculating the matrices. The image must be binary. A particle is considered to consist of pixels that do not contain a null (0) value. The source image must have been created with a border size of at least 2. Connectivity 4/8 specifies the type of connectivity used by the algorithm for particle detection. The connectivity mode directly © National Instruments Corporation 19-11 IMAQ Vision for G Reference Manual Chapter 19 Analysis VIs determines whether an adjacent pixel belongs to the same particle or a different particle. The default is 8. The following values are possible: TRUE Connectivity 8 FALSE Connectivity 4 (Default) Particle detection is performed in connectivity mode 8. Particle detection is performed in connectivity mode 4. error in (no error) is a cluster that describes the error status before this VI executes. For more information about this control, see the section IMAQ VI Error Clusters in Chapter 9, VI Overview and Programming Concepts. Basic Reports is an array that returns a set of measurements from the detected particles. This cluster contains the following elements. Area (pixels) indicates the surface area of a particle in number of pixels. Area (calibrated) indicates the surface area of a particle in user-defined units. Global Rectangle is a cluster that contains the coordinates of a bounding rectangle for a particle. The following elements are included in the cluster. x1Left indicates the coordinates for the upper-left corner of the rectangle. y1Top indicates the coordinates for the top-left corner of the rectangle. x2Right indicates the coordinates for the lower-right corner of the rectangle. y2Bottom indicates the coordinates for the bottom-right corner of the rectangle. Number of Particles returns the number of pixels detected in a particle. IMAQ Vision for G Reference Manual 19-12 © National Instruments Corporation Chapter 19 Analysis VIs error out is a cluster that describes the error status after this VI executes. For more information about this indicator, see the section IMAQ VI Error Clusters in Chapter 9, VI Overview and Programming Concepts. IMAQ ComplexParticle Detects and measures particles. This VI returns a set of measurements made from particles in a binary image. Image is the input source image used for calculating the matrices. The image must be binary. A particle is considered to consist of pixels that do not contain a null (0) value. The source image must have been created with a border size of at least 2. Connectivity 4/8 specifies the type of connectivity used by the algorithm for particle detection. The connectivity mode directly determines whether an adjacent pixel belongs to the same particle or a different particle. The default is 8. The following values are possible. TRUE Connectivity 8 (Default) Particle detection is performed in connectivity mode 8. FALSE Connectivity 4 Particle detection is performed in connectivity mode 4. error in (no error) is a cluster that describes the error status before this VI executes. For more information about this control, see the section IMAQ VI Error Clusters in Chapter 9, VI Overview and Programming Concepts. Complex Reports is an array that returns a set of measurements from the detected particles. This cluster contains the following elements. © National Instruments Corporation 19-13 IMAQ Vision for G Reference Manual Chapter 19 Analysis VIs Area (pixels) indicates the surface area of a particle in number of pixels. Area (calibrated) indicates the surface area of a particle in user-defined units. Perimeter is the perimeter size in user units. Number of Holes is the number of holes in the particle. Hole’s Area (pixels) is the total surface area of all the holes in a particle (in pixels). Hole’s Perimeter is the total perimeter size calculated from all the holes in a particle (in user units). Global Rectangle is a cluster that contains the coordinates of a bounding rectangle for a particle. The following elements are included in the cluster. x1Left indicates the coordinates for the upper-left corner of the rectangle. y1Top indicates the coordinates for the top-left corner of the rectangle. x2Right indicates the coordinates for the lower-right corner of the rectangle. y2Bottom indicates the coordinates for the bottom-right corner of the rectangle ∑ x is the sum of the X-axis for each pixel of the particle. ∑ y is the sum of the Y-axis for each pixel of the particle. ∑ xx is the sum of the X-axis squared for each pixel of the particle. ∑ xy is the sum of the X-axis and Y-axis for each pixel of the particle. ∑ yy is the sum of the Y-axis squared for each pixel of the particle. IMAQ Vision for G Reference Manual 19-14 © National Instruments Corporation Chapter 19 Analysis VIs Longest Segment Length is the longest segment length of the particle. Longest Segment Coordinates are the coordinates of the left most pixel in the Longest Segment Length of the particle. The top-most segment coordinates are used in a case in which more than one Longest Segment Length exist. This cluster contains the following parameters. x is the x-axis (coordinate) of the pixel the furthest left in the Longest Segment Length in the particle. y is the y-axis (coordinate) of the pixel the furthest left in the Longest Segment Length in the particle. Projection x is half the sum of the horizontal segments in a particle that do not overlap another adjacent horizontal segment. Projection y is half the sum of the vertical segments in a particle that do not overlap another adjacent vertical segment. Number of Particles returns the number of detected particles. error out is a cluster that describes the error status after this VI executes. For more information about this indicator, see the section IMAQ VI Error Clusters in Chapter 9, VI Overview and Programming Concepts. IMAQ ComplexMeasure Calculates the coefficients of all detected particles. This VI returns an array of coefficients whose measurements are based on the results sent from IMAQ ComplexParticle. © National Instruments Corporation 19-15 IMAQ Vision for G Reference Manual Chapter 19 Analysis VIs Image is the same input source image that is used to measure the particle coefficients by IMAQ ComplexParticle. Complex Reports is the output array of measurements from IMAQ ComplexParticle. The measurements stored in each element of this array are described in the IMAQ ComplexParticle section. Complex Report is an extraction of the output array of measurements from IMAQ ComplexParticle. The measurements stored in each element of this array are described in the IMAQ ComplexParticle section. This input is used only in a case in which Complex Reports is not connected, thereby specifying that the measurements are to be made on a single particle. Parameters is an array specifying a descriptor list of the coefficients that the user wants to calculate. The user can calculate one or more coefficients for one or more particles. The descriptor list is described in the table for the Parameter control. Parameter is an array specifying a descriptor list of the coefficients that the user wants to calculate. The user can calculate one or more coefficients for one or more particles. This input is used only in a situation in which the input Parameters is not connected. The descriptor list is described in the following table. 0 Area (pixels) surface area of particle in pixels 1 Area (calibrated) surface area of particle in user units 2 Number of holes number of holes 3 Hole's Area surface area of the holes in user units 4 Total area total surface area (holes and particles) in user units 5 Scanned Area surface area of the entire image in user units 6 Ratio Area/ Scanned Area % percentage of the surface area of a particle in relation to the Scanned Area 7 Ratio Area/ Total Area % percentage of a particle's surface area in relation to the Total Area IMAQ Vision for G Reference Manual 19-16 © National Instruments Corporation Chapter 19 Analysis VIs 8 Center of mass (X) X coordinate of the center of gravity 9 Center of mass (Y) Y coordinate of the center of gravity 10 Left column (X) left X coordinate of bounding rectangle 11 Upper row (Y) top Y coordinate of bounding rectangle 12 Right column (X) right hand X coordinate of bounding rectangle 13 Lower Row (Y) bottom Y coordinate of bounding rectangle 14 Width width of bounding rectangle in user units 15 Height height of bounding rectangle in user units 16 Longest segment length length of longest horizontal line segment 17 Longest segment left column(X) left-most X coordinate of longest horizontal line segment 18 Longest segment row (Y) Y coordinate of longest horizontal line segment 19 Perimeter length of outer contour of particle in user units 20 Hole's Perimeter perimeter of all holes in user units 21 SumX sum of the X-axis for each pixel of the particle 22 SumY sum of the Y-axis for each pixel of the particle 23 SumXX sum of the X-axis squared, for each pixel of the particle 24 SumYY sum of the Y-axis squared, for each pixel of the particle 25 SumXY sum of the X-axis and Y-axis for each pixel of the particle © National Instruments Corporation 19-17 IMAQ Vision for G Reference Manual Chapter 19 Analysis VIs 26 Corrected projection X projection corrected in x 27 Corrected projection Y projection corrected in y 28 Moment of inertia Ixx inertia matrix coefficient in xx 29 Moment of inertia Iyy inertia matrix coefficient in yy 30 Moment of inertia Ixy inertia matrix coefficient in xy 31 Mean chord X mean length of horizontal segments 32 Mean chord Y mean length of vertical segments 33 Max intercept length of longest segment 34 Mean intercept perpendicular mean length of the chords in an object perpendicular to its max intercept 35 Particle orientation direction of the longest segment 36 Equivalent ellipse minor axis total length of the axis of the ellipse having the same area as the particle and a major axis equal to half the max intercept. 37 Ellipse major axis total length of major axis having the same area and perimeter as the particle in user units 38 Ellipse minor axis total length of minor axis having the same area and perimeter as the particle in user units 39 Ratio of equivalent ellipse axis fraction of major axis to minor axis 40 Rectangle big side length of the large side of a rectangle having the same area and perimeter as the particle in user units 41 Rectangle small side length of the small side of a rectangle having the same area and perimeter as the particle in user units 19-18 © National Instruments Corporation IMAQ Vision for G Reference Manual Chapter 19 Analysis VIs 42 Ratio of equivalent rectangle sides ratio of rectangle big side to rectangle small side 43 Elongation factor max intercept / mean perpendicular intercept 44 Compactness factor particle area (breadth × width) 45 Heywood circularity factor particle perimeter / perimeter of circle having same area as particle 46 Type Factor a complex factor relating the surface area to the moment of inertia. 47 Hydraulic Radius particle area / particle perimeter 48 Waddel disk diameter diameter of the disk having the same area as the particle in user units 49 Diagonal diagonal of an equivalent rectangle in user units error in (no error) is a cluster that describes the error status before this VI executes. For more information about this control, see the section IMAQ VI Error Clusters in Chapter 9, VI Overview and Programming Concepts. Coefficients (2D) is a 2D array containing the specified measurements. This array is used only when the user has specified multiple coefficients (measurements) for each particle. The data is stored by particle followed by the coefficients. Coefficients (1D) is a 1D array containing the specified measurements. This array is used only when the user has specified either multiple coefficients (measurements) for a single particle or a single coefficient for multiple particles. Coefficient is the measurement specified for a single particle. error out is a cluster that describes the error status after this VI executes. For more information about this indicator, see the section IMAQ VI Error Clusters in Chapter 9, VI Overview and Programming Concepts. © National Instruments Corporation 19-19 IMAQ Vision for G Reference Manual Chapter 19 Analysis VIs The output from this VI can be in one of three forms: Coefficients (2D), Coefficients (1D), or Coefficient. The final type of output is dependent on the connected inputs, as shown in the following table. Possible Inputs Resulting Type of Output Complex Reports and Parameters Coefficients (2D) Complex Reports and Parameter Coefficients (1D) Complex Report and Parameters Coefficients (1D) Complex Report and Parameter Coefficient IMAQ ChooseMeasurements Returns a selection of particle measurements that are sent from IMAQ BasicParticle or IMAQ ComplexParticle based on a minimum and maximum criteria. With this VI, you choose which measurements you want to obtain from a particle detection process. Reject Border? (No) determines whether particles touching the border should be measured. If set to TRUE, the measurements for particles touching the border are rejected. In this case the input image source must be connected to the input Image. The default is FALSE. Image is the same input source image that is used to measure the particle coefficients by IMAQ BasicParticle or IMAQ ComplexParticle. This input is used only in a case in which particles touching the border are discarded for measurement calculations (Reject Border? is set to TRUE). IMAQ Vision for G Reference Manual 19-20 © National Instruments Corporation Chapter 19 Analysis VIs Basic Reports is the output array of measurements from IMAQ BasicParticle. The measurements stored in each element of this array are described in the IMAQ BasicParticle section. Complex Reports is the output array of measurements from IMAQ ComplexParticle. The measurements stored in each element of this array are described in the IMAQ ComplexParticle section. Selection Values is an array of selection criteria. Each criteria is composed of the following elements. Parameter is an indicator that determines the coefficient (measurement) to be selected. Parameter can have values compatible to those described in IMAQ ComplexMeasure. The validity of these values depends on the type of measurements passed as input (for example, through Basic Reports or Complex Reports). Note: Only the particle measurements that respond to the selection criteria are selected. The coefficient values must be contained in the interval between Lower Value and Upper Value. The following values are possible for selecting basic measurements (from Basic Reports). 0 Area (pixels) surface area of particle in pixels 1 Area (calibrated) surface area of particle in user units 2–9 unused 10 Left column (X) left X coordinate of bounding rectangle 11 Upper row (Y) top Y coordinate of bounding rectangle 12 Right column (X) right X coordinate of bounding rectangle 13 Lower row (Y) bottom Y coordinate of bounding rectangle 14 – 27 unused © National Instruments Corporation 19-21 IMAQ Vision for G Reference Manual Chapter 19 Analysis VIs The following values are possible for selecting complex measurements (from Complex Reports). 0 Area (pixels) surface area of particle in pixels 1 Area (calibrated) surface area of particle in user units 2 Number of holes number of holes 3 Hole’s area (pixels) surface area of the holes in pixels 4–9 unused 10 Left column (X) left X coordinate of bounding rectangle 11 Upper row (Y) top Y coordinate of bounding rectangle 12 Right column (X) right X coordinate of bounding rectangle 13 Lower row (Y) bottom Y coordinate of bounding rectangle 14 – 15 unused 16 Longest segment length length of longest horizontal line segment 17 Longest segment left column (X) left-most X coordinate of longest horizontal line 18 Longest segment top row (Y) Y coordinate of longest horizontal line segment 19 Perimeter length of outer contour of particle 20 Hole's Perimeter perimeter of all holes 21 SumX sum of the X-axis for each pixel of the particle 22 SumY sum of the Y-axis for each pixel of the particle 23 SumXX sum of the X-axis squared for each pixel of the particle 24 SumYY sum of the Y-axis squared for each pixel of the particle 25 SumXY sum of the X-axis and Y-axis for each pixel of the particle IMAQ Vision for G Reference Manual 19-22 © National Instruments Corporation Chapter 19 26 Corrected projection x projection corrected in x 27 Corrected projection y projection corrected in y Analysis VIs Lower Value is the minimum value (boundary) for the values to be selected. Upper Value is the maximum value (boundary) for the values to be selected. Selection Value is a selection criteria. This value is used only if the array of selection criteria is not connected to Selection Values. The selection criteria possess the same structure as each element in the array Selection Values. The default value for Parameter is –1, which specifies that all measurements are made (no selection). error in (no error) is a cluster that describes the error status before this VI executes. For more information about this control, see the section IMAQ VI Error Clusters in Chapter 9, VI Overview and Programming Concepts. Basic Reports Out is an output containing an array of the basic measurements selected. Number of Basic Particles is an output containing the number of basic measurements selected. Complex Reports Out is an output containing an array of the complex measurements selected. Number of Complex Particles is an output containing the number of complex measurements selected. error out is a cluster that describes the error status after this VI executes. For more information about this indicator, see the section IMAQ VI Error Clusters in Chapter 9, VI Overview and Programming Concepts. © National Instruments Corporation 19-23 IMAQ Vision for G Reference Manual Chapter 20 Geometry VIs This chapter describes the Geometry VIs in IMAQ Vision. IMAQ 3DView Displays an image using an isometric view. Each pixel from the image source is represented as a column of pixels in the 3D view. The pixel value corresponds to the altitude. 3D Options is a cluster containing the elements alpha, beta, border, background, and plane. alpha defines the angle between the horizontal and the base line (see figure). The value can be between 0° and 45°. The default value is 30°. beta defines the angle between, the horizontal and the second baseline. The value can be between 0 ° and 45°. The default value is 30°. border defines the border size in the 3D view. The default value is 20. background defines the background color for the 3D view. The default is 85. © National Instruments Corporation 20-1 IMAQ Vision for G Reference Manual Chapter 20 Geometry VIs plane specifies the view to display if the image is complex. There are four possible planes that can be visualized from a complex image. For complex images, the default is the magnitude. 0 real 1 imaginary 2 (Default) magnitude 3 phase Direction (NW) defines the viewing orientation shown for the 3D view. Four viewing angles are possible. The default is North-West. 0 (Default) North-West 1 South-West 2 South-East 3 North-East Image Src is the reference to the source (input) image. Image Dst must be an 8-bit image. Size reduction is a factor applied to the source image to calculate the final dimensions of the 3D view image. This factor is a divisor that is applied to the source image when determining the final height and width of the 3D view image. A factor of 1 uses all of the pixels of the source image when determining the 3D view image. A factor of 2 uses every other line and every other column of the pixels of the source image to determine the 3D view image. The default is 2. Maximum height defines the maximum height of a pixel from the image source that is drawn in 3D. This value is mapped from a maximum of 255 (from the source image) in relation to the baseline in the 3D view. A value of 255, therefore, gives a one-to-one correspondence between the intensity value in the source image and the display in 3D view. The default value of 64 results in a reduction of IMAQ Vision for G Reference Manual 20-2 © National Instruments Corporation Chapter 20 Geometry VIs 4-fold between the original intensity value of the pixel in the source image and the final displayed 3D image. error in (no error) is a cluster that describes the error status before this VI executes. For more information about this control, see the section IMAQ VI Error Clusters in Chapter 9, VI Overview and Programming Concepts. Image Dst Out is the reference to the destination (output) image which receives the processing results of the VI. If the Image Dst is connected, then Image Dst Out is the same as Image Dst. Otherwise, Image Dst Out refers to the image referenced by Image Src. error out is a cluster that describes the error status after this VI executes. For more information about this indicator, see the section IMAQ VI Error Clusters in Chapter 9, VI Overview and Programming Concepts. The following graphic illustrates the cardinal coordinates of an image. © National Instruments Corporation 20-3 IMAQ Vision for G Reference Manual Chapter 20 Geometry VIs The North-West direction and the South-West direction are depicted in the following graphic. North-West South-West IMAQ Rotate Rotates an image. Color Replace Value is a cluster containing the Alpha, Red, Green, and Blue channel values used for filling a color image. The default is 0. Image Src is the reference to the source (input) image. Image Dst is the reference of the image destination. If it is connected, it must be the same type as the Image Src. Angle (degrees) defines the angle (in degrees) to rotate. The default is 0. IMAQ Vision for G Reference Manual 20-4 © National Instruments Corporation Chapter 20 Geometry VIs Replace Value defines the filling value created by the rotation. The default is 0. error in (no error) is a cluster that describes the error status before this VI executes. For more information about this control, see the section IMAQ VI Error Clusters in Chapter 9, VI Overview and Programming Concepts. Image Dst Out is the reference to the destination (output) image which receives the processing results of the VI. If the Image Dst is connected, then Image Dst Out is the same as Image Dst. Otherwise, Image Dst Out refers to the image referenced by Image Src. error out is a cluster that describes the error status after this VI executes. For more information about this indicator, see the section IMAQ VI Error Clusters in Chapter 9, VI Overview and Programming Concepts. IMAQ Shift Translates an image based on a horizontal and vertical offset. Replace Value defines the filling value created by the shift. The default is 0. Image Src is the reference to the source (input) image. © National Instruments Corporation 20-5 IMAQ Vision for G Reference Manual Chapter 20 Geometry VIs Image Dst is the reference of the image destination. If it is connected, it must be the same type as the Image Src. XOffset is the horizontal offset added to the image. The default is 0. YOffset is the vertical offset added to an image. The default is 0. error in (no error) is a cluster that describes the error status before this VI executes. For more information about this control, see the section IMAQ VI Error Clusters in Chapter 9, VI Overview and Programming Concepts. Image Dst Out is the reference to the destination (output) image which receives the processing results of the VI. If the Image Dst is connected, then Image Dst Out is the same as Image Dst. Otherwise, Image Dst Out refers to the image referenced by Image Src. error out is a cluster that describes the error status after this VI executes. For more information about this indicator, see the section IMAQ VI Error Clusters in Chapter 9, VI Overview and Programming Concepts. The following graphic illustrates the functionality of this VI. IMAQ Vision for G Reference Manual 20-6 © National Instruments Corporation Chapter 20 Geometry VIs IMAQ Symmetry Transforms an image through its symmetry. Type of Symmetry specifies the symmetry used. The default is 0. 0 Horizontal (Default) Based on the horizontal axis of the image 1 Vertical Based on the vertical axis of the image 2 Central Based on the center of the image 3 1st Diagonal Based on the first diagonal of the image (the image must be square) 4 2nd Diagonal Based on the second diagonal of the image (the image must be square) Image Src is the reference to the source (input) image. Image Dst is the reference of the image destination. If it is connected, it must be the same type as the Image Src. error in (no error) is a cluster that describes the error status before this VI executes. For more information about this control, see the section IMAQ VI Error Clusters in Chapter 9, VI Overview and Programming Concepts. Image Dst Out is the reference to the destination (output) image which receives the processing results of the VI. If the Image Dst is connected, then Image Dst Out is the same as Image Dst. Otherwise, Image Dst Out refers to the image referenced by Image Src. © National Instruments Corporation 20-7 IMAQ Vision for G Reference Manual Chapter 20 Geometry VIs error out is a cluster that describes the error status after this VI executes. For more information about this indicator, see the section IMAQ VI Error Clusters in Chapter 9, VI Overview and Programming Concepts. IMAQ Vision for G Reference Manual 20-8 © National Instruments Corporation Chapter 21 Complex VIs This chapter describes the Complex VIs. Frequency processing is another technique for extracting information from an image. Instead of using the location and direction of light intensity variations, frequency processing allows you to manipulate the frequency of the occurrence of these variations in the spatial domain. This new component is called the spatial frequency, which is the frequency with which the light intensity in an image varies as a function of spatial coordinates. Spatial frequencies of an image are computed with the Fast Fourier Transform (FFT). The FFT is calculated in two steps: a one-dimensional transform of the rows, followed by a one-dimensional transform of the columns of the previous results. The complex numbers that compose the FFT plane are encoded in a 64-bit floating-point image (called a complex image): 32 bits for the real part and 32 bits for the imaginary part. IMAQ Vision can read and write complex images through IMAQ ReadFile and IMAQ WriteFile. In an image, details and sharp edges are associated with high spatial frequencies because they introduce significant gray-level variations over short distances. Gradually varying patterns are associated with low spatial frequencies. Filtering spatial frequencies allows you to remove, attenuate, or highlight the spatial components to which they relate. You can use a lowpass frequency filter to attenuate or remove (truncate) high frequencies present in the FFT plane. This filter suppresses information related to rapid variations of light intensities in the spatial image. An inverse FFT after a lowpass frequency filter produces an image in which noise, details, texture, and sharp edges are smoothed (IMAQ ComplexAttenuate or IMAQ ComplexTruncate). A highpass frequency filter attenuates or remove (truncates) low frequencies present in the FFT plane. This filter suppresses information related to slow variations of light intensities in the spatial image. In this case, an inverse FFT after a highpass frequency filter produces an image © National Instruments Corporation 21-1 IMAQ Vision for G Reference Manual Chapter 21 Complex VIs in which overall patterns are sharpened and details are emphasized (IMAQ ComplexAttenuate or IMAQ ComplexTruncate). A mask frequency filter removes frequencies contained in a mask specified by the user (IMAQ Mask). The display of complex images is handled by IMAQ WindDraw. This VI displays an image by inverting the high and low frequencies and then dividing their values by a size factor. This size factor m is calculated from the following formula. m = f (w + h) = f (32.2n) = 2.4n, where w is the width of the image and h is the height. IMAQ FFT Computes the FFT of an image. Image Src is the handle of the source image. The image must have a resolution of 2n × 2m. Image Dst is the handle of the complex image that contains the resulting FFT image. This input can accept only a complex image (2 × 32-bit floating point), which is an image created with IMAQ Create using type 3. The complex image is resized to the Image Src. error in (no error) is a cluster that describes the error status before this VI executes. For more information about this control, see the section IMAQ VI Error Clusters in Chapter 9, VI Overview and Programming Concepts. Image Dst Out is the reference to the destination (output) image which receives the processing results of the VI. If the Image Dst is connected, then Image Dst Out is the same as Image Dst. Otherwise, Image Dst Out refers to the image referenced by Image Src. IMAQ Vision for G Reference Manual 21-2 © National Instruments Corporation Chapter 21 Complex VIs error out is a cluster that describes the error status after this VI executes. For more information about this indicator, see the section IMAQ VI Error Clusters in Chapter 9, VI Overview and Programming Concepts. Note: The FFT that is calculated is not normalized; you can use IMAQ Complex Divide to normalize the complex image. The FFT is a complex image in which high frequencies are grouped at the center, while low frequencies are located at the edges. IMAQ InverseFFT Computes the inverse FFT of a complex image (2 × 32-bit floating point). Image Src is the handle of the source image. This input can accept only a complex image. The image must have a resolution of 2n × 2m. Image Dst is the handle of the 8-bit, 16-bit, or 32-bit floating-point image that contains the resulting spatial image. error in (no error) is a cluster that describes the error status before this VI executes. For more information about this control, see the section IMAQ VI Error Clusters in Chapter 9, VI Overview and Programming Concepts. Image Dst Out is the reference to the destination (output) image which receives the processing results of the VI. If the Image Dst is connected, then Image Dst Out is the same as Image Dst. Otherwise, Image Dst Out refers to the image referenced by Image Src. © National Instruments Corporation 21-3 IMAQ Vision for G Reference Manual Chapter 21 Complex VIs error out is a cluster that describes the error status after this VI executes. For more information about this indicator, see the section IMAQ VI Error Clusters in Chapter 9, VI Overview and Programming Concepts. Note: This VI uses a buffer equal to the size of the complex image. An 8-bit image with a resolution of 256 × 256 pixels uses 64 KB of memory. The FFT associated with this image requires eight times the memory, or 64 × 8 = 512KB. The calculation of the inverse FFT also requires a temporary buffer of 512 KB. Therefore, the total memory necessary for this operation is 1080 KB. IMAQ ComplexFlipFrequency Transposes the complex components of an FFT image of a complex image. The high and low frequency components of an FFT image are inverted to produce a central symmetric representation of the spatial frequencies. Image Src is the handle of the source image for the image to be transposed. This input can accept only a complex image. Image Dst is the handle of the complex image that contains the resulting FFT image. This input can accept only a complex image. error in (no error) is a cluster that describes the error status before this VI executes. For more information about this control, see the section IMAQ VI Error Clusters in Chapter 9, VI Overview and Programming Concepts. Image Dst Out is the reference to the destination (output) image which receives the processing results of the VI. If the Image Dst is connected, then Image Dst Out is the same as Image Dst. Otherwise, Image Dst Out refers to the image referenced by Image Src. IMAQ Vision for G Reference Manual 21-4 © National Instruments Corporation Chapter 21 Complex VIs error out is a cluster that describes the error status after this VI executes. For more information about this indicator, see the section IMAQ VI Error Clusters in Chapter 9, VI Overview and Programming Concepts. IMAQ ComplexConjugate Computes the conjugate of a complex image. This VI converts the complex pixel data z = a + ib of an FFT image into z′ = a – ib. Image Src is the handle of the source image for the image that is used to measure the conjugate. This input can accept only a complex image. Image Dst is the handle of the complex image that contains the resulting FFT image. This input can accept only a complex image. error in (no error) is a cluster that describes the error status before this VI executes. For more information about this control, see the section IMAQ VI Error Clusters in Chapter 9, VI Overview and Programming Concepts. Image Dst Out is the reference to the destination (output) image which receives the processing results of the VI. If the Image Dst is connected, then Image Dst Out is the same as Image Dst. Otherwise, Image Dst Out refers to the image referenced by Image Src. error out is a cluster that describes the error status after this VI executes. For more information about this indicator, see the section IMAQ VI Error Clusters in Chapter 9, VI Overview and Programming Concepts. © National Instruments Corporation 21-5 IMAQ Vision for G Reference Manual Chapter 21 Complex VIs IMAQ ComplexAttenuate Attenuates the frequencies of a complex image. Low pass/High pass (Low pass) determines which frequencies are attenuated. Choose low pass (F) to attenuate the high frequencies or high pass (T) to attenuate the low frequencies. The default is FALSE, which specifies lowpass. Image Src is the image reference source. Image Dst is the reference of the image destination. error in (no error) is a cluster that describes the error status before this VI executes. For more information about this control, see the section IMAQ VI Error Clusters in Chapter 9, VI Overview and Programming Concepts. Image Dst Out is the reference to the destination (output) image which receives the processing results of the VI. If the Image Dst is connected, then Image Dst Out is the same as Image Dst. Otherwise, Image Dst Out refers to the image referenced by Image Src. error out is a cluster that describes the error status after this VI executes. For more information about this indicator, see the section IMAQ VI Error Clusters in Chapter 9, VI Overview and Programming Concepts. IMAQ Vision for G Reference Manual 21-6 © National Instruments Corporation Chapter 21 Complex VIs IMAQ ComplexTruncate Truncates the frequencies of a complex image. Low pass/High pass (Low pass) determines which frequencies are truncated. Choose low pass (F) to remove the high frequencies or high pass (T) to remove the low frequencies. The default is FALSE, which specifies lowpass. Image Src is the image reference source. It must be an 8-bit or RGB image. Image Dst is the reference of the image destination. If it is connected, it must be the same type as the Image Src. Truncation Frequency % is the percentage of the frequencies that are retained within a Fourier-transformed image. This percentage is expressed with respect to the length of the diagonal of the FFT image and the Boolean Low pass/High pass (Low pass). The default value is 10. error in (no error) is a cluster that describes the error status before this VI executes. For more information about this control, see the section IMAQ VI Error Clusters in Chapter 9, VI Overview and Programming Concepts. Image Dst Out is the reference to the destination (output) image which receives the processing results of the VI. If the Image Dst is connected, then Image Dst Out is the same as Image Dst. Otherwise, Image Dst Out refers to the image referenced by Image Src. error out is a cluster that describes the error status after this VI executes. For more information about this indicator, see the section IMAQ VI Error Clusters in Chapter 9, VI Overview and Programming Concepts. © National Instruments Corporation 21-7 IMAQ Vision for G Reference Manual Chapter 21 Complex VIs For example, the defaults Low pass (F) and 10 result in retaining 10 percent of the frequencies starting from the center (low frequencies). The selection of High pass (T) and 10 results in retaining 10 percent of the frequencies starting from the outer periphery. IMAQ ComplexAdd Adds two images where the first is a complex image, or adds a complex image and a complex constant. Constant is the complex constant added to the input Image Src A for image-constant operations. The default is 0. Image Src A is the handle of the first source image and must be a complex image. Image Dst is the handle of the complex image that contains the resulting FFT image. This input can accept only a complex image. Image Src B is the handle of the second source image. This input can accept an 8-bit, 16-bit, 32-bit floating-point, or complex image. If the image is not a complex image, then the imaginary part of the Image Dst is equal to Image Src A. error in (no error) is a cluster that describes the error status before this VI executes. For more information about this control, see the section IMAQ VI Error Clusters in Chapter 9, VI Overview and Programming Concepts. Image Dst Out is the reference to the destination (output) image which receives the processing results of the VI. If the Image Dst is connected, then Image Dst Out is the same as Image Dst. Otherwise, Image Dst Out refers to the image referenced by Image Src A. error out is a cluster that describes the error status after this VI executes. For more information about this indicator, see the section IMAQ VI Error Clusters in Chapter 9, VI Overview and Programming Concepts. IMAQ Vision for G Reference Manual 21-8 © National Instruments Corporation Chapter 21 Complex VIs An operation between an image and a constant occurs when the input Image Src B is not connected. The two possibilities are distinguished in the following equations. Dst(x, y) = SrcA(x, y) + SrcB(x, y), or Dst(x, y) = SrcA(x, y) + Constant. The different image type combinations supported by this VI are described in the following table, where I is the resulting image that is connected to the output Image Dst. Image Connected to Image Src A Image Connected to Image Src B a complex image: Ic an 8-bit, 16-bit, or 32-bit floating-point image: I8-bit, I16-bit, or I32-bit Real(I) = Real(Ic) + (I8-bit, I16-bit, or I32-bit) another complex image: Ic2. Real(I) = Real(Ic1) + Real(Ic2) a complex image: Ic1 Equations Imaginary(I) = Imaginary(Ic) Imaginary(I) = Imaginary(Ic1) + Imaginary(Ic2) IMAQ ComplexSubtract Subtracts two images where the first is a complex image, or subtracts a complex constant from a complex image. Constant is the complex constant subtracted from the input Image Src A for image-constant operations. The default is 0. Image Src A is the handle of the first source image and must be a complex image. Image Dst is the handle of the complex image that contains the resulting FFT image. This input can accept only a complex image. © National Instruments Corporation 21-9 IMAQ Vision for G Reference Manual Chapter 21 Complex VIs Image Src B is the handle of the second source image. This input can accept an 8-bit, 16-bit, 32-bit floating-point, or complex image. If the image is not a complex image, then the imaginary part of the Image Dst is equal to Image Src A. error in (no error) is a cluster that describes the error status before this VI executes. For more information about this control, see the section IMAQ VI Error Clusters in Chapter 9, VI Overview and Programming Concepts. Image Dst Out is the reference to the destination (output) image which receives the processing results of the VI. If the Image Dst is connected, then Image Dst Out is the same as Image Dst. Otherwise, Image Dst Out refers to the image referenced by Image Src A. error out is a cluster that describes the error status after this VI executes. For more information about this indicator, see the section IMAQ VI Error Clusters in Chapter 9, VI Overview and Programming Concepts. An operation between an image and a constant occurs when the input Image Src B is not connected. The two possibilities are distinguished in the following equations. Dst(x, y) = SrcA(x, y) – SrcB(x, y), or Dst(x, y) = SrcA(x, y) – Constant. The different image type combinations supported by this VI are described below. The first column describes the image connected to Image Src A and the second column describes the image type connected to Image Src B. The third column describes the image type that should be connected to the output Image Dst. The different image type combinations supported by this VI are described in the following table, where I is the resulting image that is connected to the output Image Dst. Image Connected to Image Src A a complex image: Ic Image Connected to Image Src B an 8-bit, 16-bit, or 32-bit floating-point image: I8-bit, I16-bit, or I32-bit IMAQ Vision for G Reference Manual 21-10 Equations Real(I) = Real(Ic) – (I8-bit, I16-bit, or I32-bit) Imaginary(I) = Imaginary(Ic) © National Instruments Corporation Chapter 21 Image Connected to Image Src A Image Connected to Image Src B a complex image: Ic1 another complex image: Ic2. Complex VIs Equations Real(I) = Real(Ic1) – Real(Ic2) Imaginary(I) = Imaginary(Ic1) – Imaginary(Ic2) IMAQ ComplexMultiply Multiplies two images where the first is a complex image, or multiples a complex image and a complex constant. Constant. The input Image Src A is multiplied by this complex constant for image-constant operations. The default is 0. Image Src A is the handle of the first source image and must be a complex image. Image Dst is the handle of the complex image that contains the resulting FFT image. This input can accept only a complex image. Image Src B is the handle of the second source image. This input can accept an 8-bit, 16-bit, 32-bit floating-point, or complex image. error in (no error) is a cluster that describes the error status before this VI executes. For more information about this control, see the section IMAQ VI Error Clusters in Chapter 9, VI Overview and Programming Concepts. Image Dst Out is the reference to the destination (output) image which receives the processing results of the VI. If the Image Dst is connected, then Image Dst Out is the same as Image Dst. Otherwise, Image Dst Out refers to the image referenced by Image Src A. © National Instruments Corporation 21-11 IMAQ Vision for G Reference Manual Chapter 21 Complex VIs error out is a cluster that describes the error status after this VI executes. For more information about this indicator, see the section IMAQ VI Error Clusters in Chapter 9, VI Overview and Programming Concepts. An operation between an image and a constant occurs when the input Image Src B is not connected. The two possibilities are distinguished in the following equations. Dst(x, y) = SrcA(x, y) × SrcB(x, y), or Dst(x, y) = SrcA(x, y) × Constant. The different image type combinations supported by this VI are described in the following table, where I is the resulting image that is connected to the output Image Dst. Image Connected to Image Src A a complex image: Ic a complex image: Ic1 Image Connected to Image Src B Equations an 8-bit, 16-bit, or 32-bit floating-point image: I8-bit, I16-bit, or I32-bit Real(I) = Real(Ic) × (I8-bit, I16-bit, or I32-bit) another complex image: Ic2. Real(I) = Real(Ic1) × Real(Ic2) – Imaginary(Ic1) × Imaginary(Ic2) Imaginary(I) = Imaginary(Ic) × (I8-bit, I16-bit, or I32-bit) Imaginary(I) = Imaginary(Ic1) × Real(Ic2) + Real(Ic1) × Imaginary(Ic2) IMAQ ComplexDivide Divides one image by another where the first is a complex image, or divides a complex image by a complex constant. IMAQ Vision for G Reference Manual 21-12 © National Instruments Corporation Chapter 21 Complex VIs Constant. The input Image Src A is divided by this complex constant for image-constant operations. The default is 0. Note: Division by 0 is not allowed. If the constant is 0 it automatically is replaced by 1. If one of the two source images is empty, the result is a copy of the other. Image Src A is the handle of the first source image and must be a complex image. Image Dst is the handle of the complex image that contains the resulting FFT image. This input can accept only a complex image. Image Src B is the handle of the second source image. This input can accept an 8-bit, 16-bit, 32-bit floating-point, or complex image. error in (no error) is a cluster that describes the error status before this VI executes. For more information about this control, see the section IMAQ VI Error Clusters in Chapter 9, VI Overview and Programming Concepts. Image Dst Out is the reference to the destination (output) image which receives the processing results of the VI. If the Image Dst is connected, then Image Dst Out is the same as Image Dst. Otherwise, Image Dst Out refers to the image referenced by Image Src A. error out is a cluster that describes the error status after this VI executes. For more information about this indicator, see the section IMAQ VI Error Clusters in Chapter 9, VI Overview and Programming Concepts. © National Instruments Corporation 21-13 IMAQ Vision for G Reference Manual Chapter 21 Complex VIs An operation between an image and a constant occurs when the input Image Src B is not connected. The two possibilities are distinguished in the following equations. Dst(x, y) = SrcA(x, y) ÷ SrcB(x, y), or Dst(x, y) = SrcA(x, y) ÷ Constant. The different image type combinations supported by this VI are described in the following table, where I is the resulting image that is connected to the output Image Dst. Image Image Connected to Connected to Image Src A Image Src B a complex image: Ic an 8-bit, 16-bit, or 32-bit floating-point image: I8-bit, I16-bit, or I32-bit a complex image: Ic1 another complex image: Ic2. Equations Real(I) = Real(Ic) ÷ (I8-bit, I16-bit, or I32-bit) Imaginary(I) = Imaginary(Ic) ÷ (I8-bit, I16-bit, or I32-bit) Real ( I c1 ) × Real ( I c2 ) + Imaginary ( I c1 ) × Imaginary ( I c2 ) Real ( I ) = ---------------------------------------------------------------------------------------------------------------------------------------2 2 Real ( I c2 ) + Imaginary ( I c2 ) Imaginary ( I c1 ) × Real ( I c2 ) + Real ( I c1 ) × Imaginary ( I c2 ) Imaginary ( I ) = ---------------------------------------------------------------------------------------------------------------------------------------2 2 Real ( I c2 ) + Imaginary ( I c2 ) IMAQ ComplexImageToArray Extracts the pixels from a complex image (2 × 32-bit floating point) into a 2D complex array ([CSG]). IMAQ Vision for G Reference Manual 21-14 © National Instruments Corporation Chapter 21 Complex VIs Image is the reference to the complex image. Optional Rectangle specifies a rectangular region of the complex image to be extracted. The operation is applied to the entire image if the input is empty or not connected. error in (no error) is a cluster that describes the error status before this VI executes. For more information about this control, see the section IMAQ VI Error Clusters in Chapter 9, VI Overview and Programming Concepts. Image Pixels (Complex) is a 2D array (Line, Column) containing all the pixel values that comprise the image. The first index corresponds to the vertical axis and the second to the horizontal index. The final size of the array is equal to the size of the image or to the size of the optional rectangle. error out is a cluster that describes the error status after this VI executes. For more information about this indicator, see the section IMAQ VI Error Clusters in Chapter 9, VI Overview and Programming Concepts. IMAQ ArrayToComplexImage Creates a complex image, starting from a complex 2D array ([CSG]). Image is the reference to the complex image to be created. Image Pixels (Complex) is the complex 2D array (Line, Column) containing all the pixel values that form the image. The first index corresponds to the vertical axis and the second to the horizontal index. The final size of the image is equal to the size of the array. The image passed in the input Image is forced to the same size as the complex 2D array encoded by Input Pixels. © National Instruments Corporation 21-15 IMAQ Vision for G Reference Manual Chapter 21 Complex VIs error in (no error) is a cluster that describes the error status before this VI executes. For more information about this control, see the section IMAQ VI Error Clusters in Chapter 9, VI Overview and Programming Concepts. Image Out is the reference to the destination (output) image. error out is a cluster that describes the error status after this VI executes. For more information about this indicator, see the section IMAQ VI Error Clusters in Chapter 9, VI Overview and Programming Concepts. IMAQ ComplexPlaneToArray Extracts the pixels from the real part, imaginary part, magnitude, or phase from a complex image into a floating-point 2D array. Plane indicates which component of the complex image is extracted into an array. The following values are valid: 0 (Default) Real 1 Imaginary 2 Magnitude 3 Phase Image is the reference to the input complex image. Optional Rectangle specifies a rectangular region of the complex image to be extracted. The operation is applied to the entire image if the input is empty or not connected. IMAQ Vision for G Reference Manual 21-16 © National Instruments Corporation Chapter 21 Complex VIs error in (no error) is a cluster that describes the error status before this VI executes. For more information about this control, see the section IMAQ VI Error Clusters in Chapter 9, VI Overview and Programming Concepts. Image Pixels (float) is a 2D floating-point array (Line, Column) containing all the pixel values that comprise the image. The first index corresponds to the vertical axis and the second to the horizontal index. The final size of the array is equal to the size of the image or to the size of the optional rectangle. error out is a cluster that describes the error status after this VI executes. For more information about this indicator, see the section IMAQ VI Error Clusters in Chapter 9, VI Overview and Programming Concepts. IMAQ ArrayToComplexPlane Replaces the real part or the imaginary part of a complex image, starting from a 2D array of floating-point values. Plane specifies which component of the complex image is replaced with the values encoded in the array of floating points Image Pixels. The following values are valid: 0 (Default) Real 1 Imaginary Image is the reference to the input complex image. Image Pixels (Float) is a 2D floating-point array (Line, Column) containing all the pixel values that form the image. The first index corresponds to the vertical axis and the second to the horizontal index. © National Instruments Corporation 21-17 IMAQ Vision for G Reference Manual Chapter 21 Complex VIs The final size of the image is equal to the size of the array. The image passed in the input Image is forced to the same size as the array encoded by Input Pixels. error in (no error) is a cluster that describes the error status before this VI executes. For more information about this control, see the section IMAQ VI Error Clusters in Chapter 9, VI Overview and Programming Concepts. Image Out is the reference to the destination (output) image. error out is a cluster that describes the error status after this VI executes. For more information about this indicator, see the section IMAQ VI Error Clusters in Chapter 9, VI Overview and Programming Concepts. IMAQ ComplexPlaneToImage Extracts the pixels from the real part, imaginary part, magnitude, or phase from a complex image (2 × 32-bit floating point) into an 8-bit, 16-bit, or 32-bit floating-point image. Plane indicates which component of the complex image is extracted. The following values are valid: 0 (Default) Real 1 Imaginary 2 Magnitude 3 Phase IMAQ Vision for G Reference Manual 21-18 © National Instruments Corporation Chapter 21 Complex VIs Image Src must be a complex image. Image Dst must be an 8-bit, 16-bit, or 32-bit floating-point image. error in (no error) is a cluster that describes the error status before this VI executes. For more information about this control, see the section IMAQ VI Error Clusters in Chapter 9, VI Overview and Programming Concepts. Image Dst Out is the reference to the destination (output) image which receives the processing results of the VI. It is the same as Image Dst. error out is a cluster that describes the error status after this VI executes. For more information about this indicator, see the section IMAQ VI Error Clusters in Chapter 9, VI Overview and Programming Concepts. IMAQ ImageToComplexPlane Extracts the pixels from an 8-bit, 16-bit, or 32-bit floating-point image into the real part or imaginary part of a complex image (2 × 32-bit floating point). Plane specifies which component of the complex image is replaced. The following values are valid: 0 (Default) Real 0 Imaginary Image Src must be an 8-bit, 16-bit, or 32-bit floating-point image. Image Dst must be a complex image. © National Instruments Corporation 21-19 IMAQ Vision for G Reference Manual Chapter 21 Complex VIs error in (no error) is a cluster that describes the error status before this VI executes. For more information about this control, see the section IMAQ VI Error Clusters in Chapter 9, VI Overview and Programming Concepts. Image Dst Out is the reference to the destination (output) image which receives the processing results of the VI. If the Image Dst is connected, then Image Dst Out is the same as Image Dst. Otherwise, Image Dst Out refers to the image referenced by Image Src. error out is a cluster that describes the error status after this VI executes. For more information about this indicator, see the section IMAQ VI Error Clusters in Chapter 9, VI Overview and Programming Concepts. IMAQ Vision for G Reference Manual 21-20 © National Instruments Corporation Chapter 22 Color VIs This chapter describes the Color VIs in IMAQ Vision. An RGB-chunky image (standard color) is a color image coded in three parts: red, green, and blue. A pixel encoded in 32 bits is actually four channels: alpha channel (not used) red channel green channel blue channel A color pixel encoded as an unsigned 32-bit integer control can be decomposed as shown in the following graphic. A color image always is encoded in memory in the form (R, G, B). However, there are a number of other coding models such as (H, S, L) and (H, S, V). The (H, S, L) model is composed as hue, saturation, and lightness, and the (H, S, V) model as hue, saturation, and value. To recuperate the values for hue, saturation, lightness, or value a measurement is made from the red, green, and blue components. Note that these measurements require time, depending on the values to extract. These extractions are not completely objective. In effect, a color converted between two of the different color models (for instance, RGB to HSL) and then reconverted back to the original color model, does not have exactly the same values as the original image. This difference is because of the 8-bit encoding of the image planes, which causes some loss of data. © National Instruments Corporation 22-1 IMAQ Vision for G Reference Manual Chapter 22 Color VIs The principal operations that can be performed on color images are: • Extraction or replacement of a color image plane (R, G, B, H, S, L, V) • Application of a threshold to a color image based on one of the three color models (RGB, HSL, or HSV) • Performance of a histogram on a color image based on one of the three color models (RGB, HSL, or HSV) The other VIs are auxiliary VIs that enable the user to extract or replace a pixel, a line, or a part of an image, convert the image from one color model to another, and convert the image to and from an array of data. Color Planes Inversion [PC] Prior to version 4.0, color pixels (RGB_CHUNKY) were organized the same way across all platforms: All Platforms [0] Alpha [1] Red [2] Green [3] Blue When processing the pixels as 32 bits with the Color.llb library, there was a difference in the 32 bits value depending on the host machine: IMAQ Vision for G Reference Manual 22-2 © National Instruments Corporation Chapter 22 Color VIs From the 4.0 version on, a new memory organization is used. The pixel bytes are stored according to the CPU logic, but the 32-bit access register order is constant across all platforms: Macintosh 68k, Power PC, and SUN Windows [0] Alpha [0] Blue [1] Red [1] Green [2] Green [2] Red [3] Blue [3] Alpha The following graphic describes a color pixel for all platforms: This solution offers many advantages, including the ability to write real multi-platform applications using the Color.llb library. For color image transfer from an image grabber to the host memory, use DMA direct or BlockMove instructions can be used for better performance. Note that this change does not improve color images display speed under LabVIEW or BridgeVIEW because of overhead processing needed to organize display data as 24-bit triplets. © National Instruments Corporation 22-3 [0] Red [1] Green [2] Blue IMAQ Vision for G Reference Manual Chapter 22 Color VIs IMAQ ExtractColorPlanes Extracts the three planes (RGB, HSV, or HSL) from an image. Color Mode defines the image color format to use for the operation. The default is 0, which specifies RGB. 0 (Default) RGB 1 HSL 2 HSV Image Src (RGB) is the reference to an image that has its three planes extracted: RGB, HSV or HSL. It must be an RGB-chunky image. Red (or Hue) Plane is the reference to the destination image. It contains the first color plane. This plane can be either the red plane (Color Mode 0) or the hue plane (Color Mode 1 or 2). It must be an 8-bit image. The color plane is not extracted if the input is not connected. Green (or Sat) Plane is the reference to the destination image. It contains the second color plane. This plane can be either the green plane (Color Mode 0) or the saturation plane (Color Mode 1 or 2). It must be an 8-bit image. The color plane is not extracted if the input is not connected. Blue (or Light or Val) Plane is the reference to the destination image. It contains the third color plane. This plane can be either the blue plane (Color Mode 0), the lightness plane (Color Mode 1), or the value plane (Color Mode 2). It must be an 8-bit image. The input must be connected for the color plane to be extracted. IMAQ Vision for G Reference Manual 22-4 © National Instruments Corporation Chapter 22 Color VIs error in (no error) is a cluster that describes the error status before this VI executes. For more information about this control, see the section IMAQ VI Error Clusters in Chapter 9, VI Overview and Programming Concepts. Red (or Hue) Plane out is the reference to the image containing the red (or hue) plane of the source (input) image. Green (or Sat) Plane out is the reference to the image containing the green (or saturation) plane of the source (input) image. Blue (or Light or Val) Plane out is the reference to the image containing the blue (or lightness or value) plane of the source (input) image. error out is a cluster that describes the error status after this VI executes. For more information about this indicator, see the section IMAQ VI Error Clusters in Chapter 9, VI Overview and Programming Concepts. IMAQ ReplaceColorPlane Replaces one or more image planes from a color image (RGB, HSL, or HSV). Only the planes connected at the input are replaced. If all three planes are connected then the input Image Src is not necessary and only the Image Dst is used. The image is resized to the dimensions of the planes passed on input; therefore their size must be identical. If one or two planes are connected, then the planes must have the same dimension as the source image. © National Instruments Corporation 22-5 IMAQ Vision for G Reference Manual Chapter 22 Color VIs Color Mode defines the image color format to use for the operation. The default is 0, which specifies RGB. 0 (Default) RGB 1 HSL 2 HSV Image Src (RGB) is the reference to an image that has its three color planes replaced. It must be an RGB-chunky image. This image is not necessary if the destination image and the three color planes are connected. Image Dst (RGB) is the reference to the destination image. It must be an RGB-chunky image. Red (or Hue) Plane is the reference to the first color plane. This plane can be either the red plane (Color Mode 0) or the hue plane (Color Mode 1 or 2). It must be an 8-bit image. The color plane is not replaced if the input is not connected. Green (or Sat) Plane is the reference to the second color plane. This plane can be either the green plane (Color Mode 0) or the saturation plane (Color Mode 1 or 2). It must be an 8-bit image. The color plane is not replaced if the input is not connected. Blue (or Light or Val) Plane is the reference to the third color plane. This plane can be either the blue plane (Color Mode 0), the lightness plane (Color Mode 1), or the value plane (Color Mode 2). It must be an 8-bit image. The color plane is not replaced if the input is not connected. error in (no error) is a cluster that describes the error status before this VI executes. For more information about this control, see the section IMAQ VI Error Clusters in Chapter 9, VI Overview and Programming Concepts. Image Dst Out (RGB) is the reference to the output RGB image that is obtained by replacing one or more planes of the source color image. error out is a cluster that describes the error status after this VI executes. For more information about this indicator, see the section IMAQ VI Error Clusters in Chapter 9, VI Overview and Programming Concepts. IMAQ Vision for G Reference Manual 22-6 © National Instruments Corporation Chapter 22 Color VIs IMAQ ColorHistogram Calculates the histograms extracted from the three planes of an image. This VI can function in one of three modes corresponding to the three color models (RGB, HSL, or HSV). IMAQ ColorHistograph, a variant of the IMAQ ColorHistogram VI, has the advantage that its output data is directly compatible with a LabVIEW or BridgeVIEW graph. Color Mode defines the image color format to use for the operation. The default is 0, which specifies RGB. 0 (Default) RGB 1 HSL 2 HSV ImageRGB (RGB) is the input source image used for calculating the histogram. It must be an RGB-chunky image. Image Mask, if connected, must be an 8-bit image. Number of Classes specifies the number of classes used to classify the pixels. The default is 256. error in (no error) is a cluster that describes the error status before this VI executes. For more information about this control, see the section IMAQ VI Error Clusters in Chapter 9, VI Overview and Programming Concepts. Red (or Hue) Histogram Report is a cluster that returns the detailed results from a histogram calculated on a red or hue plane (depending on the Color Mode). This cluster is the same as the cluster used by IMAQ Histogram. It contains the following elements. © National Instruments Corporation 22-7 IMAQ Vision for G Reference Manual Chapter 22 Color VIs Histogram returns the histogram values in an array. The elements found in this array are the number of pixels per class. The nth class contains all pixel values belonging to the interval [Starting Value + (n – 1) × Interval Width, Starting Value + n × Interval Width – 1]. Minimal Value returns the smallest pixel value used in calculating the histogram. Maximal Value returns the largest pixel value used in calculating the histogram. Starting Value is always equal to 0 here. It returns the smallest pixel value from the first class calculated in the histogram. It can be equal to the Minimal value from the Interval Range or the smallest value found for the image type connected. Interval Width returns the length of each class. Mean Value returns the mean value of the pixels used in calculating the histogram. Standard Deviation returns the standard deviation from the histogram. A higher value corresponds to a better distribution of the values in the histogram and the image. Area (pixels) returns the number of pixels used in the histogram calculation. This is influenced by the contents of Image Mask. Green (or Sat) Histogram Report is a cluster that returns the detailed results from a histogram calculated on the green or saturation plane (depending on the Color Mode). It has the same elements as found in Red (or Hue) Histogram Report. Blue (or Light or Val) Histogram Report is a cluster that returns the detailed results from a histogram calculated on the blue, lightness, or value planes (depending on the Color Mode). It has the same elements as found in Red (or Hue) Histogram Report. error out is a cluster that describes the error status after this VI executes. For more information about this indicator, see the section IMAQ VI Error Clusters in Chapter 9, VI Overview and Programming Concepts. IMAQ Vision for G Reference Manual 22-8 © National Instruments Corporation Chapter 22 Color VIs IMAQ ColorHistograph Calculates the histograms extracted from the three planes of an image. This VI can function in one of three modes corresponding to the three color models (RGB, HSL, or HSV). The output from this VI is directly compatible with a LabVIEW or BridgeVIEW graph. Color Mode defines the image color format to use for the operation. The default is 0, which specifies RGB. 0 RGB (default) 1 HSL 2 HSV ImageRGB (RGB) is the RGB-chunky input source image used for calculating the histogram. Image Mask, if connected, must be an 8-bit image. Number of Classes specifies the number of classes used to class the pixels. The default is 256. error in (no error) is a cluster that describes the error status before this VI executes. For more information about this control, see the section IMAQ VI Error Clusters in Chapter 9, VI Overview and Programming Concepts. Red (or Hue) Histogram Graph is a cluster that returns the detailed results from a histogram calculated on a red or hue plane (depending on the Color Mode). This cluster is the same as the cluster used by IMAQ Histograph. It contains the following elements. © National Instruments Corporation 22-9 IMAQ Vision for G Reference Manual Chapter 22 Color VIs Starting Value is always equal to 0 here. This parameter is returned in the type Histogram Report, as in the VI IMAQ Histograph. Incremental Value returns the incrementing value that specifies how much to add to Starting Value in calculating the median value of each class from the histogram. The median value xn from the nth class is xn = Starting Value + n × Incremental Value. Histogram returns the histogram values in an array. The elements found in this array are the number of pixels per class. the nth class contains all pixel values belonging to the interval [Starting Value + (n – 1) × Interval Width, Starting Value + n × Interval Width – 1]. Green (or Sat) Histogram Graph is a cluster that returns the detailed results from a histogram calculated on the green or saturation plane (depending on the Color Mode). It has the same elements as found in Red (or Hue) Histogram Graph. Blue (or Light or Val) Histogram Graph is a cluster that returns the detailed results from a histogram calculated on the blue, lightness, or value planes (depending on the Color Mode). It has the same elements as found in Red (or Hue) Histogram Graph. error out is a cluster that describes the error status after this VI executes. For more information about this indicator, see the section IMAQ VI Error Clusters in Chapter 9, VI Overview and Programming Concepts. IMAQ Vision for G Reference Manual 22-10 © National Instruments Corporation Chapter 22 Color VIs IMAQ ColorThreshold Applies a threshold to the three planes of an RGB-chunky image and places the result into an 8-bit image. A test is performed with each range (Red (or Hue) Range, Green (or Sat) Range, and Blue (or Light or Val) Range), to determine whether the corresponding pixel from the Image Src is set to the value specified in Replace Value. If a pixel from the Image Src does not have corresponding pixel values specified in all three ranges, then the corresponding pixel in Image Dst Out is set to 0. Note: By default the pixels in the Image Dst Out take the new value specified by ReplaceValue as all three ranges are set for 0 to 255. Therefore you easily can apply a threshold to one of the three ranges without having to set the values of the other two ranges. Replace Value specifies the value applied to the destination image when the corresponding pixel from the Image Src is found in all three ranges. The default is 1. Color Mode defines the image color format to use for the operation. The default is 0, which specifies RGB. 0 (Default) RGB 1 HSL 2 HSV Image Src (RGB) is the reference to the image to threshold. It must be an RGB-chunky image. Image Dst must be connected and must be an 8-bit image. © National Instruments Corporation 22-11 IMAQ Vision for G Reference Manual Chapter 22 Color VIs Red (or Hue) Range is a cluster used to determine the thresholding range for the red or hue plane (depending on the Color Mode). Any pixel values not included in this range are reset to zero in the destination image. The pixel values included in this range are altered depending on the status of the Replace input. By default, all pixel values are included (0, 255). Lower Value is the minimal pixel value in the red or hue plane that is used for the threshold. The default is 0. Upper Value is the maximal pixel value in the red or hue plane that is used for the threshold. The default is 255. Green (or Sat) Range is a cluster used to determine the thresholding range for the green or saturation plane (depending on the Color Mode). Any pixel values not included in this range are reset to zero in the destination image. The pixel values included in this range are altered depending on the status of the Replace input. By default, all pixel values are included (0, 255). Green (or Sat) Range has the same elements as found in Red (or Hue) Range. Blue (or Light or Val) Range is a cluster used to determine the thresholding range for the blue, lightness, or value plane (depending on the Color Mode). Any pixel values not included in this range are reset to zero in the destination image. The pixel values included in this range are altered depending on the status of the Replace input. By default, all pixel values are included (0, 255). Blue (or Light or Val) Range has the same elements as found in Red (or Hue) Range. error in (no error) is a cluster that describes the error status before this VI executes. For more information about this control, see the section IMAQ VI Error Clusters in Chapter 9, VI Overview and Programming Concepts. Image Dst Out is the reference to the destination (output) image which receives the processing results of the VI. Image Dst Out is the same as Image Dst. error out is a cluster that describes the error status after this VI executes. For more information about this indicator, see the section IMAQ VI Error Clusters in Chapter 9, VI Overview and Programming Concepts. IMAQ Vision for G Reference Manual 22-12 © National Instruments Corporation Chapter 22 Color VIs IMAQ ColorUserLookup Applies a lookup table (LUT) to each color plane. Image Mask, if connected, must be an 8-bit image. Color Mode defines the image color format to use for the operation. The default is 0, which specifies RGB. 0 (Default) RGB 1 HSL 2 HSV Image Src (RGB) is the reference to the source image. It must be an RGB-chunky image. Image Dst (RGB) is the reference to the destination image. If connected, it must be an RGB-chunky image. Red (or Hue) Lookup Table is the LUT applied to the first color plane (depending on the Color Mode). This array can contain a maximum of 256 elements. The array is filled automatically when less than 256 elements are specified. This procedure does not change pixel values that are not explicitly specified from the values of the LUT given by the user on input. By default this array is empty and no replacement occurs on this plane. © National Instruments Corporation 22-13 IMAQ Vision for G Reference Manual Chapter 22 Color VIs Green (or Sat) Lookup Table is the LUT applied to the second color plane (depending on the Color Mode). This array can contain a maximum of 256 elements. The array is filled automatically when less than 256 elements are specified. This procedure does not change pixel values that are not explicitly specified from the values of the LUT given by the user on input. By default this array is empty and no replacement occurs on this plane. Blue (or Light or Val) Lookup Table is the LUT applied to the third color plane (depending on the Color Mode). This array can contain a maximum of 256 elements. The array is filled automatically when less than 256 elements are specified. This procedure does not change pixel values that are not explicitly specified from the values of the LUT given by the user on input. By default this array is empty and no replacement occurs on this plane. error in (no error) is a cluster that describes the error status before this VI executes. For more information about this control, see the section IMAQ VI Error Clusters in Chapter 9, VI Overview and Programming Concepts. Image Dst Out (RGB) is the reference to the output RGB image that is obtained by applying the color LUT to the source image. error out is a cluster that describes the error status after this VI executes. For more information about this indicator, see the section IMAQ VI Error Clusters in Chapter 9, VI Overview and Programming Concepts. For example, you can use IMAQ ColorUserLookup to inverse the lightness plane for an RGB-chunky image. Each level n is replaced by the value (255 – n), resulting in an inverse of the lightness plane. IMAQ Vision for G Reference Manual 22-14 © National Instruments Corporation Chapter 22 Color VIs IMAQ ColorEqualize Equalizes a color image. This VI equalizes either the lightness plane (default) or all three planes (red, green, and blue). Light / R,G,B (Light) specifies whether the operation is performed on the lightness plane or on all three planes (red, green, blue). An equalization on the lightness plane conserves the hue and saturation from the color image. An equalization of the three planes (red, green, blue), gives a stronger contrast but changes the hue and saturation of the color image. The default is FALSE. Image Src (RGB) is the reference to the source image. It must be an RGB-chunky image. Image Dst (RGB) is the reference to the destination image. If connected, it must be an RGB-chunky image. error in (no error) is a cluster that describes the error status before this VI executes. For more information about this control, see the section IMAQ VI Error Clusters in Chapter 9, VI Overview and Programming Concepts. Image Dst Out (RGB) is the reference to the output RGB image that is obtained after equalization of the source color image. error out is a cluster that describes the error status after this VI executes. For more information about this indicator, see the section IMAQ VI Error Clusters in Chapter 9, VI Overview and Programming Concepts. © National Instruments Corporation 22-15 IMAQ Vision for G Reference Manual Chapter 22 Color VIs IMAQ GetColorPixelValue Reads the pixel values from a color image. This VI returns the pixel value as an unsigned 32-bit integer indicator. This indicator can be converted into a cluster containing three elements possessing either (R, G, B), (H, S, L), or (H, S, V) using the VI IMAQ IntegerToColorValue. Image must be an RGB-chunky image. X Coordinate is the horizontal position of the pixel. Y Coordinate is the vertical position of the pixel error in (no error) is a cluster that describes the error status before this VI executes. For more information about this control, see the section IMAQ VI Error Clusters in Chapter 9, VI Overview and Programming Concepts. Pixel Value (U32) returns the pixel value as an unsigned 32-bit integer indicator. error out is a cluster that describes the error status after this VI executes. For more information about this indicator, see the section IMAQ VI Error Clusters in Chapter 9, VI Overview and Programming Concepts. The following graphic illustrates the use of this VI. IMAQ Vision for G Reference Manual 22-16 © National Instruments Corporation Chapter 22 Color VIs The red, green, and blue values also can be manipulated with the following sequence. IMAQ SetColorPixelValue Changes the pixel value for a color image. This VI receives the pixel value as an unsigned 32-bit integer control. The values (R, G, B), (H, S, L), or (H, S, V) can be converted into an unsigned 32-bit integer control using the VI IMAQ ColorValueToInteger. Image must be an RGB-chunky image. X Coordinate is the horizontal position of the pixel. Y Coordinate is the vertical position of the pixel. Pixel Value (U32) contains the pixel value as an unsigned 32-bit integer control. error in (no error) is a cluster that describes the error status before this VI executes. For more information about this control, see the section IMAQ VI Error Clusters in Chapter 9, VI Overview and Programming Concepts. Image Out is the reference to the destination (output) image. © National Instruments Corporation 22-17 IMAQ Vision for G Reference Manual Chapter 22 Color VIs error out is a cluster that describes the error status after this VI executes. For more information about this indicator, see the section IMAQ VI Error Clusters in Chapter 9, VI Overview and Programming Concepts. The following graphic illustrates the use of this VI. The red, green, and blue values also can be manipulated with the following sequence. IMAQ GetColorPixelLine Extracts a line of pixels from a color image. This VI returns an array of unsigned 32-bit integer indicators. This array can be converted into an array of clusters coding the three color values as either (R, G, B), (H, S, L), or (H, S, V) using the VI IMAQ IntegerToColorValue. Image must be an RGB-chunky image. IMAQ Vision for G Reference Manual 22-18 © National Instruments Corporation Chapter 22 Color VIs Line Coordinates is an array specifying the two endpoints of the line to extract. Note: A line designated by the coordinates [0, 0, 0, 255] consists of 256 pixels. The output Pixels Line contains the values specified by this line. Any pixel values outside the image automatically is set to 0 in Pixels Line. error in (no error) is a cluster that describes the error status before this VI executes. For more information about this control, see the section IMAQ VI Error Clusters in Chapter 9, VI Overview and Programming Concepts. Pixels Line (U32) returns the pixel values as a 1D array of unsigned 32-bit integer indicators. error out is a cluster that describes the error status after this VI executes. For more information about this indicator, see the section IMAQ VI Error Clusters in Chapter 9, VI Overview and Programming Concepts. The following graphic illustrates the use of this VI. An array of red, green, and blue values also can be modified with the following sequence. © National Instruments Corporation 22-19 IMAQ Vision for G Reference Manual Chapter 22 Color VIs IMAQ SetColorPixelLine Changes a line of pixels from a color image. This VI receives an array of unsigned 32-bit integer controls. An array of clusters coding the color three values (R, G, B), (H, S, L), or (H, S, V) can be converted into an array of pixels (unsigned 32-bit integer controls) using the VI IMAQ IntegerToColorValue. Line Coordinates is an array specifying the two endpoints of the line to modify. Any pixels designated by the Line Coordinates found outside the actual image are not replaced. Image must be an RGB-chunky image. Pixels Line(U32) contains the pixel values as a 1D array of unsigned 32-bit integer controls. error in (no error) is a cluster that describes the error status before this VI executes. For more information about this control, see the section IMAQ VI Error Clusters in Chapter 9, VI Overview and Programming Concepts. Image Out is the reference to the destination (output) image. error out is a cluster that describes the error status after this VI executes. For more information about this indicator, see the section IMAQ VI Error Clusters in Chapter 9, VI Overview and Programming Concepts. The following graphic illustrates the use of this VI. IMAQ Vision for G Reference Manual 22-20 © National Instruments Corporation Chapter 22 Color VIs An array of red, green, and blue values also can be modified with the following sequence. IMAQ ColorImageToArray Extracts the pixels from a color image, or from part of a color image, into a 2D array. This VI returns the values as a 2D array of unsigned 32-bit integer indicators. This 2D array can be converted into a 2D array of clusters coding the three color values as either (R, G, B), (H, S, L), or (H, S, V) using the VI IMAQ IntegerToColorValue. Image must be an RGB-chunky image. Optional Rectangle designates a rectangular region (Left / Top / Right / Bottom) within an image in which the pixels are to be changed. If this array is empty the entire image is changed. error in (no error) is a cluster that describes the error status before this VI executes. For more information about this control, see the section IMAQ VI Error Clusters in Chapter 9, VI Overview and Programming Concepts. Image Pixels (U32) returns the pixel values as a 2D array of unsigned 32-bit integer indicators. © National Instruments Corporation 22-21 IMAQ Vision for G Reference Manual Chapter 22 Color VIs error out is a cluster that describes the error status after this VI executes. For more information about this indicator, see the section IMAQ VI Error Clusters in Chapter 9, VI Overview and Programming Concepts. The following graphic illustrates the use of this VI. An array of red, green, and blue values also can be modified with the following sequence. IMAQ ArrayToColorImage Creates a color image from a 2D array. This VI receives the values as a 2D array of unsigned 32-bit integer controls. A 2D array of clusters coding the three color values as either (R, G, B), (H, S, L), or (H, S, V) can be converted into a 2D array of pixels (unsigned 32-bit integer controls) using the VI IMAQ ColorValueToInteger. Image must be an RGB-chunky image. Image Pixels (U32) contains the pixel values as a 2D array of unsigned 32-bit integer controls. error in (no error) is a cluster that describes the error status before this VI executes. For more information about this control, see the section IMAQ VI Error Clusters in Chapter 9, VI Overview and Programming Concepts. IMAQ Vision for G Reference Manual 22-22 © National Instruments Corporation Chapter 22 Color VIs Image Out is the reference to the destination (output) image. error out is a cluster that describes the error status after this VI executes. For more information about this indicator, see the section IMAQ VI Error Clusters in Chapter 9, VI Overview and Programming Concepts. The following graphic illustrates the use of this VI. A 2D array of red, green, and blue values also can be modified with the following sequence. IMAQ RGBToColor Converts an RGB color value into another format (HSL or HSV). Color Mode defines the image color format conversion to perform. The default is 0, which specifies no change. 0 RGB (Default) no change 1 HSL Convert to HSL 2 HSV Convert to HSV © National Instruments Corporation 22-23 IMAQ Vision for G Reference Manual Chapter 22 Color VIs Red value is the input red value. Green value is the input green value. Blue value is the input blue value. error in (no error) is a cluster that describes the error status before this VI executes. For more information about this control, see the section IMAQ VI Error Clusters in Chapter 9, VI Overview and Programming Concepts. Red (or Hue) value is the output value for the first color plane (depending on the Color Mode) chosen. Green (or Sat) value is the output value for the second color plane (depending on the Color Mode) chosen. Blue (or Light or Val) value is the output value for the third color plane (depending on the Color Mode) chosen. error out is a cluster that describes the error status after this VI executes. For more information about this indicator, see the section IMAQ VI Error Clusters in Chapter 9, VI Overview and Programming Concepts. IMAQ IntegerToColorValue Converts colors in the form of an unsigned 32-bit integer control into a cluster composed of the three colors in mode (R, G, B), (H, S, L), or (H, S, V). These colors can be entered as a single value, a 1D array, a 2D array, or a combination of the above. IMAQ Vision for G Reference Manual 22-24 © National Instruments Corporation Chapter 22 Color VIs Color Mode defines the image color format to use for the output. The default is 0, which specifies that the input and output values are the same. 0 RGB (Default) no change 1 HSL Convert to HSL 2 HSV Convert to HSV U32 value a color value encoded as an unsigned 32-bit integer control. 1D U32 array a set of color values encoded as a 1D array of unsigned 32-bit integer controls. 2D U32 array a set of color values encoded as a 2D array of unsigned 32-bit integer controls. error in (no error) is a cluster that describes the error status before this VI executes. For more information about this control, see the section IMAQ VI Error Clusters in Chapter 9, VI Overview and Programming Concepts. Color Value is a cluster containing the color value resulting from the input U32 Value. This cluster can contain the values (R, G, B), (H, S, L), or (H, S, V), depending on the status of the set Color Mode. The cluster is composed of the following elements. Red (or Hue) Value is the first color plane value (depending on the Color Mode). Green (or Sat) Value is the second color plane value (depending on the Color Mode). Blue (or Light or Val) Value is the third color plane value (depending on the Color Mode). 1D Color value array is a 1D array containing the color value resulting from the input 1D U32 Array. This array can contain the values (R, G, B), (H, S, L), or (H, S, V), depending on the status of the set Color Mode. © National Instruments Corporation 22-25 IMAQ Vision for G Reference Manual Chapter 22 Color VIs 2D Color value array is a 2D array containing the color value resulting from the input 2D U32 Array. This array can contain the values (R, G, B), (H, S, L), or (H, S, V), depending on the status of the set Color Mode. error out is a cluster that describes the error status after this VI executes. For more information about this indicator, see the section IMAQ VI Error Clusters in Chapter 9, VI Overview and Programming Concepts. IMAQ ColorValueToInteger Converts clusters composed of three colors in mode (R, G, B), (H, S, L), or (H, S, V) into colors encoded in the form of an unsigned 32-bit integer control. The elements of these clusters can contain single values, 1D arrays, 2D arrays, or a combination of the above. Color Mode defines the image color format to use for the output. The default is 0, which specifies that the input and output values are the same. 0 RGB (Default) no change 1 HSL Convert to HSL 2 HSV Convert to HSV Color Value is a cluster containing a color in (R, G, B), (H, S, L), or (H, S, V) (depending on the Color Mode). Red (Hue) Value is the first color plane value (depending on the Color Mode). Green (Sat) Value is the second color plane value (depending on the Color Mode). IMAQ Vision for G Reference Manual 22-26 © National Instruments Corporation Chapter 22 Color VIs Blue (Light,Val) Value is the third color plane value (depending on the Color Mode). 1D Color value array is a 1D array of clusters containing the color values. The values are in (R, G, B), (H, S, L), or (H, S, V) depending on the status of the set Color Mode. These clusters are the same type as Color Value. 2D Color value array is a 2D array of clusters containing the color values. The values are in (R, G, B), (H, S, L), or (H, S, V) depending on the status of the set Color Mode. These clusters are the same type as Color Value. error in (no error) is a cluster that describes the error status before this VI executes. For more information about this control, see the section IMAQ VI Error Clusters in Chapter 9, VI Overview and Programming Concepts. U32 value receives the color value resulting from the input Color Value and it is encoded as an unsigned 32-bit integer control. 1D U32 array receives the color value resulting from the input 1D Color Value Array and it is encoded as a 1D array of unsigned 32-bit integer controls. 2D U32 array receives the color value resulting from the input 2D Color Value Array and it is encoded as a 2D array of unsigned 32-bit integer controls. error out is a cluster that describes the error status after this VI executes. For more information about this indicator, see the section IMAQ VI Error Clusters in Chapter 9, VI Overview and Programming Concepts. © National Instruments Corporation 22-27 IMAQ Vision for G Reference Manual Chapter 23 External Library Support VIs This chapter describes the External Library Support VIs in IMAQ Vision. This set of VIs allows G programmers who have a good understanding of DLLs (Windows) or Shared Libraries (Macintosh) to write their own image grabber device VIs. These VIs give you additional functionalities that are not provided by LabVIEW or BridgeVIEW when using an external library. These VIs allow you to do the following actions: • Get a pointer in the pixel space of an image • Copy the data of a char* type pointer to a G programming language string • Copy a memory block addressed by a pointer to a G programming language string • Change the border size of an image • Modify the pixel values at the border of an image • Interlace or separate images IMAQ GetImagePixelPtr Obtains a pointer on the pixels of an image. This VI also returns information on the organization of the image pixels in memory. © National Instruments Corporation 23-1 IMAQ Vision for G Reference Manual Chapter 23 External Library Support VIs Function has three modes: 0 Map Pixel Pointer Obtains the pointer on a pixel of an image and obtains information related to the organization of the pixels of this image in memory. 1 Unmap Pixel Pointer Frees the pointer and related information previously obtained using Map Pixel Pointer. 2 Get Pixel Info Obtains information related to the organization of the pixels of an image in memory without mapping a pointer. Image is the reference of the image on which the pointer is obtained. Pixel Pointer in is only used in the Unmap Pixel Pointer mode (see the Function description). When the VI is executed to obtain a pointer (using the Map Pixel Pointer function), some information regarding the pointer that is required to unmap the pixel pointer is recorded. Note: You need to give this pointer to the VI to retrieve this information when executing the Unmap Pixel Pointer function. X Coordinate allows you to select the X coordinate of the pixel in the image on which the pointer is required. This parameter is not used in the mode Unmap Pixel Pointer mode. The default is 0. Y Coordinate allows you to select the Y coordinate of the pixel in the image on which the pointer is required. This parameter is not used in the mode Unmap Pixel Pointer mode. The default is 0. error in (no error) is a cluster that describes the error status before this VI executes. For more information about this control, see the section IMAQ VI Error Clusters in Chapter 9, VI Overview and Programming Concepts. Image border size is the border size of the image. IMAQ Vision for G Reference Manual 23-2 © National Instruments Corporation Chapter 23 External Library Support VIs Pixel Pointer Out is the pointer on the pixels of the image. This pointer is obtained only in the Map Pixel Pointer mode. The following table gives the pointer type for different platforms. Platform Pointer Type IMAQ Vision for LabVIEW 4 for Windows 3.1 16-bit FAR Other platforms 32-bit flat LineWidth (Pixels) returns the total number of pixels in a horizontal line in the image. This is the sum of the X size of the image, the borders of the image, and the left and right alignments of the image, as shown in the following image. This number may not match the horizontal size of the image. Pixel Size (Bytes) returns the size in bytes of each pixel in the image. This value multiplied with the LineWidth gives the number of bytes occupied by a line of the image in memory. © National Instruments Corporation 23-3 IMAQ Vision for G Reference Manual Chapter 23 External Library Support VIs Transfer Max Size returns the number of bytes from the pixel pointer to the end of the image. This size represents the maximum size of bytes that can be transferred. For example, for an 8-bit image of size 256 × 256 and border 1, the line width is 272 and the maximum transfer size from pixel (0, 0) is 69632 bytes. error out is a cluster that describes the error status after this VI executes. For more information about this indicator, see the section IMAQ VI Error Clusters in Chapter 9, VI Overview and Programming Concepts. Example The following graphic illustrates a typical implementation scheme for IMAQ GetImagePixelPtr. This VI receives an image and a rectangle. The transfer call needs five parameters: destination address, X and Y start coordinates, and the X and Y size of the transfer. This VI uses the following steps: • From the image rectangle, computes the image size. • Resizes the image and obtains a pixel pointer on the coordinates [0, 0] of the image. • Verifies that the maximum transfer size is compatible with the parameters needed by the called library. • If everything is correct, begins transferring. • Unmaps the pixel pointer. Note: The transfer call, as it is shown above, only supports images with a border width of zero that have a horizontal size aligned on a multiple of 8. This restriction exists because no passed parameter discriminates between the number of pixels per line and the memory address increment to the next line. IMAQ Vision for G Reference Manual 23-4 © National Instruments Corporation Chapter 23 External Library Support VIs The following code uses IMAQ GetImagePixelPtr to apply a function f on the pixels of a floating-point image. The pointer on the pixel (0, 0) of the image (FirstPixelPtr) has been retrieved from the VI. In the following C code, xSize, ySize, and LineWidth have been obtained from other VIs. int xSize; // is the x size of the image. int ySize; // is the y size of the image (Given by IMAQ GetImageSize or IMAQ GetImageInfo) int LineWidth; // is the line width of the image (Given by IMAQ GetImagePixelPtr) float *FirstPixelPtr; // Given by IMAQ GetImagePixelPtr float *TempPixelPtr; int i, j; for (j = 0; j < ySize; j++) // for each line of the image { TempPixelPtr = FirstPixelPtr; for (i = 0; i < xSize; i++)// for each pixel of the line { *TempPixelPtr = f (*TempPixelPtr);// apply the function TempPixelPtr++;// pixel increment } FirstPixelPtr += LineWidth;// line increment } © National Instruments Corporation 23-5 IMAQ Vision for G Reference Manual Chapter 23 External Library Support VIs IMAQ CharPtrToString Copies a C character string to a G programming language string. In LabVIEW 4.0 and BridgeVIEW 1.0, the Call Library function does not directly support entry points returning a character pointer (char*). This VI allows the use of a char* pointer to get the associated string. char* is the C character string pointer. The end of the character string is marked with a 0 (\00) value. The following table gives the pointer type for different platforms. Platform Pointer Type IMAQ Vision for LabVIEW 4 for Windows 3.1 16-bit FAR Other platforms 32-bit flat (universal type) The copied string size is limited to 65536 bytes. error in (no error) is a cluster that describes the error status before this VI executes. For more information about this control, see the section IMAQ VI Error Clusters in Chapter 9, VI Overview and Programming Concepts. G programming language string is a G programming language string containing all characters before \00 (end of string mark in C). error out is a cluster that describes the error status after this VI executes. For more information about this indicator, see the section IMAQ VI Error Clusters in Chapter 9, VI Overview and Programming Concepts. IMAQ Vision for G Reference Manual 23-6 © National Instruments Corporation Chapter 23 External Library Support VIs The following graphic illustrates a typical implementation scheme for IMAQ CharPtrToString. IMAQ MemPeek Copies a memory zone in a G programming language string. In LabVIEW 4.0 and BridgeVIEW 1.0 the Call Library function does not directly manipulate a C structure; this VI provides this function. void* is the pointer on the memory zone to be copied. The following table gives the pointer type for different platforms. Platform Pointer Type IMAQ Vision for LabVIEW 4 for Windows 3.1 16-bit FAR Other platforms 32-bit flat (universal type) The size of the memory zone is not limited. Bytes count is the number of bytes to be copied in the G programming language string. error in (no error) is a cluster that describes the error status before this VI executes. For more information about this control, see the section IMAQ VI Error Clusters in Chapter 9, VI Overview and Programming Concepts. © National Instruments Corporation 23-7 IMAQ Vision for G Reference Manual Chapter 23 External Library Support VIs Data string is the G programming language string containing the bytes of the specified memory zone. error out is a cluster that describes the error status after this VI executes. For more information about this indicator, see the section IMAQ VI Error Clusters in Chapter 9, VI Overview and Programming Concepts. Example In this example, a function returning a pointer on a structure has the following description: typedef struct theStruct{ unsigned long a; long b; short c; } theStruct; It is possible to find this structure using the following diagram: LabVIEW and BridgeVIEW map flat data in BigEndian mode, so the bytes need to be inverted when using Windows. IMAQ Vision for G Reference Manual 23-8 © National Instruments Corporation Chapter 23 External Library Support VIs IMAQ Interlace Extracts odd and even fields from an interlaced image or builds an image using two field images. Interlace/Separate (Interlace). The default is the interlace mode, which specifies that an interlaced image is built using two field images (Image even and Image odd). In the separate mode, the odd and even fields from an interlaced image (Image frame) are extracted. Image frame is the reference to the image in which odd and even fields have to be extracted. Image even is the reference to the image that forms the even lines of the interlaced image. Image odd is the reference to the image that forms the odd lines of the interlaced image. error in (no error) is a cluster that describes the error status before this VI executes. For more information about this control, see the section IMAQ VI Error Clusters in Chapter 9, VI Overview and Programming Concepts. Image Frame Out contains the interlaced image. Image even Out contains the even lines of the input image. Image odd Out contains the odd lines of the input image. © National Instruments Corporation 23-9 IMAQ Vision for G Reference Manual Chapter 23 External Library Support VIs error out is a cluster that describes the error status after this VI executes. For more information about this indicator, see the section IMAQ VI Error Clusters in Chapter 9, VI Overview and Programming Concepts. Note: When two fields are interlaced, the first line in the resulting frame comes from the even field and the second comes from the odd field. IMAQ ImageBorderOperation Fills the border of an image. Image in is the reference to the image that has to be modified. Function indicates the method used to fill the border of the image. This parameter has three possible values: 0 Border Mirror Repeats the pixel values of the image near the border into the border by symmetry. 1 Border Copy Sets the value of the border pixels to the value of the image pixel near the border. 2 Border Clear Sets all border pixels to 0. error in (no error) is a cluster that describes the error status before this VI executes. For more information about this control, see the section IMAQ VI Error Clusters in Chapter 9, VI Overview and Programming Concepts. Image Out is the reference to the destination (output) image. IMAQ Vision for G Reference Manual 23-10 © National Instruments Corporation Chapter 23 External Library Support VIs error out is a cluster that describes the error status after this VI executes. For more information about this indicator, see the section IMAQ VI Error Clusters in Chapter 9, VI Overview and Programming Concepts. IMAQ ImageBorderSize Sets the border size of the image and determines the current border size of the image. Get/Set Status (Get) determines whether the image border size is changed to the Image border size value (Set) or the current image border size value is retrieved (Get). Image in is the reference to the image that has to be modified. Image border size in determines the new border size of the image. error in (no error) is a cluster that describes the error status before this VI executes. For more information about this control, see the section IMAQ VI Error Clusters in Chapter 9, VI Overview and Programming Concepts. Image Out is the reference to the destination (output) image. Image border size out is the border size of the image. error out is a cluster that describes the error status after this VI executes. For more information about this indicator, see the section IMAQ VI Error Clusters in Chapter 9, VI Overview and Programming Concepts. © National Instruments Corporation 23-11 IMAQ Vision for G Reference Manual Appendix Customer Communication A For your convenience, this appendix contains forms to help you gather the information necessary to help us solve your technical problems and a form you can use to comment on the product documentation. When you contact us, we need the information on the Technical Support Form and the configuration form, if your manual contains one, about your system configuration to answer your questions as quickly as possible. National Instruments has technical assistance through electronic, fax, and telephone systems to quickly provide the information you need. Our electronic services include a bulletin board service, an FTP site, a fax-on-demand system, and e-mail support. If you have a hardware or software problem, first try the electronic support systems. If the information available on these systems does not answer your questions, we offer fax and telephone support through our technical support centers, which are staffed by applications engineers. Electronic Services Bulletin Board National Instruments has BBS and FTP sites dedicated for 24-hour support with a collection of files and documents to answer most common customer questions. From these sites, you can also download the latest instrument drivers, updates, and example programs. For recorded instructions on how to use the bulletin board and FTP services and for BBS automated information, call (512) 795-6990. You can access these services at: United States: (512) 794-5422 Up to 14,400 baud, 8 data bits, 1 stop bit, no parity United Kingdom: 01635 551422 Up to 9,600 baud, 8 data bits, 1 stop bit, no parity France: 01 48 65 15 59 Up to 9,600 baud, 8 data bits, 1 stop bit, no parity FTP Support To access our FTP site, log on to our Internet host, ftp.natinst.com, as anonymous and use your Internet address, such as [email protected], as your password. The support files and documents are located in the /support directories. © National Instruments Corporation A-1 IMAQ Vision for G Reference Manual Fax-on-Demand Support Fax-on-Demand is a 24-hour information retrieval system containing a library of documents on a wide range of technical information. You can access Fax-on-Demand from a touch-tone telephone at (512) 418-1111. E-Mail Support (currently U.S. only) You can submit technical support questions to the applications engineering team through e-mail at the Internet address listed below. Remember to include your name, address, and phone number so we can contact you with solutions and suggestions. [email protected] Telephone and Fax Support National Instruments has branch offices all over the world. Use the list below to find the technical support number for your country. If there is no National Instruments office in your country, contact the source from which you purchased your software to obtain support. Telephone Australia Austria Belgium Canada (Ontario) Canada (Quebec) Denmark Finland France Germany Hong Kong Israel Italy Japan Korea Mexico Netherlands Norway Singapore Spain Sweden Switzerland Taiwan United States U.K. 03 9879 5166 0662 45 79 90 0 02 757 00 20 905 785 0085 514 694 8521 45 76 26 00 09 725 725 11 01 48 14 24 24 089 741 31 30 2645 3186 03 5734815 02 413091 03 5472 2970 02 596 7456 5 520 2635 0348 433466 32 84 84 00 2265886 91 640 0085 08 730 49 70 056 200 51 51 02 377 1200 512 794 0100 01635 523545 Fax 02 9874 4455 0662 45 79 90 19 02 757 03 11 905 785 0086 514 694 4399 45 76 26 02 09 725 725 55 01 48 14 24 14 089 714 60 35 2686 8505 03 5734816 06 57284309 03 5472 2977 02 596 7455 5 520 3282 0348 430673 32 84 86 00 2265887 91 640 0533 08 730 43 70 056 200 51 55 02 737 4644 512 794 8411 01635 523154 Technical Support Form Photocopy this form and update it each time you make changes to your software or hardware, and use the completed copy of this form as a reference for your current configuration. Completing this form accurately before contacting National Instruments for technical support helps our applications engineers answer your questions more efficiently. If you are using any National Instruments hardware or software products related to this problem, include the configuration forms from their user manuals. Include additional pages if necessary. Name __________________________________________________________________________ Company _______________________________________________________________________ Address ________________________________________________________________________ _______________________________________________________________________________ Fax ( ___ )___________________ Phone ( ___ )________________________________________ Computer brand ________________ Model ________________ Processor___________________ Operating system (include version number) ____________________________________________ Clock speed ______MHz RAM _____MB Mouse ___yes ___no Display adapter ___________________________ Other adapters installed _______________________________________ Hard disk capacity _____MB Brand _____________________________________________ Instruments used _________________________________________________________________ _______________________________________________________________________________ National Instruments hardware product model __________ Revision ______________________ Configuration ___________________________________________________________________ National Instruments software product ____________________________ Version ____________ Configuration ___________________________________________________________________ The problem is: __________________________________________________________________ _______________________________________________________________________________ _______________________________________________________________________________ _______________________________________________________________________________ _______________________________________________________________________________ List any error messages: ___________________________________________________________ _______________________________________________________________________________ _______________________________________________________________________________ The following steps reproduce the problem:____________________________________________ _______________________________________________________________________________ _______________________________________________________________________________ _______________________________________________________________________________ _______________________________________________________________________________ IMAQ Vision for G Hardware and Software Configuration Form Record the settings and revisions of your hardware and software on the line to the right of each item. Complete a new copy of this form each time you revise your software or hardware configuration, and use this form as a reference for your current configuration. Completing this form accurately before contacting National Instruments for technical support helps our applications engineers answer your questions more efficiently. National Instruments Products DAQ hardware __________________________________________________________________ Interrupt level of hardware _________________________________________________________ DMA channels of hardware ________________________________________________________ Base I/O address of hardware _______________________________________________________ Programming choice ______________________________________________________________ BridgeVIEW or LabVIEW _________________________________________________________ Other boards in system ____________________________________________________________ Base I/O address of other boards ____________________________________________________ DMA channels of other boards _____________________________________________________ Interrupt level of other boards ______________________________________________________ Other Products Computer make and model ________________________________________________________ Microprocessor __________________________________________________________________ Clock frequency or speed __________________________________________________________ Type of video board installed _______________________________________________________ Operating system version __________________________________________________________ Operating system mode ___________________________________________________________ Programming language ___________________________________________________________ Programming language version _____________________________________________________ Other boards in system ____________________________________________________________ Base I/O address of other boards ____________________________________________________ DMA channels of other boards _____________________________________________________ Interrupt level of other boards ______________________________________________________ Documentation Comment Form National Instruments encourages you to comment on the documentation supplied with our products. This information helps us provide quality products to meet your needs. Title: IMAQ™ Vision for G Reference Manual Edition Date: June 1997 Part Number: 321379B-01 Please comment on the completeness, clarity, and organization of the manual. _______________________________________________________________________________ _______________________________________________________________________________ _______________________________________________________________________________ _______________________________________________________________________________ _______________________________________________________________________________ _______________________________________________________________________________ _______________________________________________________________________________ If you find errors in the manual, please record the page numbers and describe the errors. _______________________________________________________________________________ _______________________________________________________________________________ _______________________________________________________________________________ _______________________________________________________________________________ _______________________________________________________________________________ _______________________________________________________________________________ _______________________________________________________________________________ Thank you for your help. Name _________________________________________________________________________ Title __________________________________________________________________________ Company _______________________________________________________________________ Address ________________________________________________________________________ _______________________________________________________________________________ Phone ( ___ )__________________________ Fax ( ___ ) ________________________________ Mail to: Technical Publications National Instruments Corporation 6504 Bridge Point Parkway Austin, TX 78730-5039 Fax to: Technical Publications National Instruments Corporation (512) 794-5678 Glossary Numbers/Symbols 1D One-dimensional. 2D Two-dimensional. 3D Three-dimensional. 3D view Displays the light intensity of an image in a three-dimensional coordinate system, where the spatial coordinates of the image form two dimensions and the light intensity forms the third dimension. A AIPD National Instruments’ internal image format used for saving calibration information associated with an image and for saving complex images. area threshold Detects objects based on their size, which can fall within a user-specified range. arithmetic operators The image operations multiply, divide, add, subtract, and remainder. auto-median function A function that uses dual combinations of opening and closing operations to smooth the boundaries of objects. B binary image An image containing objects usually represented with a pixel intensity of 1 (or 255) and the background of 0. binary morphology Functions that perform morphological operations on a binary image. © National Instruments Corporation G-1 IMAQ Vision for G Reference Manual BMP Image format commonly used for 8-bit images on PCs. border function Removes objects (or particles) in a binary image that touch the image border. C circle function Detects circular objects in a binary image. closing A dilation followed by an erosion. A closing fills small holes in objects and smooths the boundaries of objects. color images Images containing color information, usually encoded in the RGB form. color lookup table Table for converting the value of a pixel in an image into a red, green, and blue (RGB) intensity. complex images Save information obtained from the FFT of an image. The complex numbers which compose the FFT plane are encoded in 64-bit floating-point values: 32 bits for the real part and 32 bits for the imaginary part. connectivity Defines which of the surrounding pixels of a given pixel constitute its neighborhood. connectivity-4 Only pixels adjacent in the horizontal and vertical directions are considered as neighbors. connectivity-8 All adjacent pixels are considered as neighbors. convex function Computes the convex regions of objects in a binary image. convolution See linear filter. convolution kernel Simple 3 × 3, 5 × 5, or 7 × 7 matrices (or templates) used to represent the filter in the filtering process. The contents of these kernels are a discrete two-dimensional representation of the impulse response of the filter that they represent. D Danielsson function IMAQ Vision for G Reference Manual Similar to the distance functions, but with more accurate results. G-2 © National Instruments Corporation density function For each gray level in a linear histogram, it gives the number of pixels in the image that have the same gray level. differentiation filter Extracts the contours (edge detection) in gray level. digital image An image f (x, y) that has been converted into a discrete number of pixels. Both spatial coordinates and brightness are specified. dilation Increases the size of an object along its boundary and removes tiny holes in the object. distance calibration Determination of the physical dimensions of a pixel by defining the physical dimensions of a line in the image. distance function Assigns to each pixel in an object a gray-level value equal to its shortest Euclidean distance from the border of the object. E Equalize function See histogram equalization. erosion Reduces the size of an object along its boundary and eliminates isolated points in the image. exponential and gamma corrections Expand the high gray-level information in an image while suppressing low gray-level information. Exponential function Decreases the brightness and increases the contrast in bright regions of an image, and decreases contrast in dark regions. F Fast Fourier Transform A method used to compute the Fourier transform of an image. FFT Fast Fourier Transform. Fourier spectrum The magnitude information of the Fourier transform of an image. Fourier Transform Transforms an image from the spatial domain to the frequency domain. frequency filters Counterparts of spatial filters in the frequency domain. For images, frequency information is in the form of spatial frequency. © National Instruments Corporation G-3 IMAQ Vision for G Reference Manual G G The graphical programming language used to develop LabVIEW and BridgeVIEW applications. Gaussian filter A filter similar to the smoothing filter, but using a Gaussian kernel in the filter operation. The blurring in a Gaussian filter is more gentle than a smoothing filter. gradient convolution filter See gradient filter. gradient filter Extracts the contours (edge detection) in gray-level values. Gradient filters include the Prewitt and Sobel filters. gray level The brightness of a point (pixel) in an image. gray-level dilation Increases the brightness of pixels in an image that are surrounded by other pixels with a higher intensity. gray-level erosion Reduces the brightness of pixels in an image that are surrounded by other pixels with a lower intensity. gray-level images Images with monochrome information. gray-level morphology Functions that perform morphological operations on a gray-level image. H highpass attenuation Inverse of lowpass attenuation. highpass FFT filter Removes or attenuates low frequencies present in the FFT domain of an image. highpass filter Emphasizes the intensity variations in an image, detects edges (or object boundaries), and enhances fine details in an image. highpass frequency filter Attenuates or removes (truncates) low frequencies present in the frequency domain of the image. A highpass frequency filter suppresses information related to slow variations of light intensities in the spatial image. highpass truncation Inverse of lowpass truncations. IMAQ Vision for G Reference Manual G-4 © National Instruments Corporation histogram Indicates the quantitative distribution of the pixels of an image per gray-level value. histogram equalization Transforms the gray-level values of the pixels of an image to occupy the entire range (0 to 255 in an 8-bit image) of the histogram, increasing the contrast of the image. hit-miss function Locates objects in the image similar to the pattern defined in the structuring element. hole filling function Fills all holes in objects that are present in a binary image. HSL Color encoding scheme in Hue, Saturation, and Lightness. HSV Color encoding scheme in Hue, Saturation, and Value. I image A two-dimensional light intensity function f (x, y), where, x and y denote spatial coordinates and the value f at any point (x, y) is proportional to the brightness at that point. image file A file containing image information and data. image processing Encompasses various processes and analysis functions which you can apply to an image. image visualization The presentation (display) of an image (image data) to the user. inner gradient Finds the inner boundary of objects. intensity calibration Assigning user-defined quantities such as optical densities or concentrations to the gray-level values in an image. intensity range Defines the range of gray-level values in an object of an image. intensity threshold Characterizes an object based on the range of gray-level values in the object. If the intensity range of the object falls within the user specified range, it is considered as an object; otherwise it is considered as part of the background. © National Instruments Corporation G-5 IMAQ Vision for G Reference Manual L labeling The process by which each object in a binary image is assigned a unique value. This process is useful for identifying the number of objects in the image and giving each object a unique identity. Laplacian filter Extracts the contours of objects in the image by highlighting the variation of light intensity surrounding a pixel. line profile Represents the gray-level distribution along a line of pixels in an image. linear filter A special algorithm that calculates the value of a pixel based on its own pixel value as well as the pixel values of its neighbors. The sum of this calculation is divided by the sum of the elements in the matrix to obtain a new pixel value. logarithmic and inverse gamma corrections Expand low gray-level information in an image while compressing information from the high gray-level ranges. Logarithmic function Increases the brightness and contrast in dark regions of an image, and decreases the contrast in bright regions of the image. Logic operators The image operations AND, NAND, OR, XOR, NOR, difference, mask, mean, max, and min. lookup table Table containing values used to transform the gray-level values of an image. For each gray-level value in the image, the corresponding new value is obtained from the lookup table. lowpass attenuation Applies a linear attenuation to the frequencies in an image, with no attenuation at the lowest frequency and full attenuation at the highest frequency. lowpass FFT filter Removes or attenuates high frequencies present in the FFT domain of an image. lowpass filter Attenuates intensity variations in an image. You can use these filters to smooth an image by eliminating fine details and blurring edges. lowpass frequency filter Attenuates high frequencies present in the frequency domain of the image. A lowpass frequency filter suppresses information related to fast variations of light intensities in the spatial image. IMAQ Vision for G Reference Manual G-6 © National Instruments Corporation lowpass truncation Removes all frequency information above a certain frequency. L-skeleton function Uses an L-shaped structuring element in the Skeleton function. M mask Isolates parts of an image for further processing. mask filter Removes frequencies contained in a mask (range) specified by the user. mask image An image containing a value of 1 and values of 0. Pixels in the source image with a corresponding mask image value of 1 are processed, while the others are left unchanged. mechanical action Specifies how a zone is activated. In the Switch mode, the first click on a zone turns the zone to TRUE and a second click turns it to FALSE. In the Latch mode, a click causes the zone to be temporarily TRUE. median filter A low pass filter that assigns to each pixel the median value of its neighbors. This filter effectively removes isolated pixels without blurring the contours of objects. morphological transformations Extract and alter the structure of objects in an image. You can use these transformations for expanding (dilating) or reducing (eroding) objects, filling holes, closing inclusions, or smoothing borders. They mainly are used to delineate objects and prepare them for quantitative inspection analysis. M-skeleton Uses an M-shaped structuring element in the skeleton function. N neighborhood operations Operations on a point in an image that take into consideration the values of the pixels neighboring that point. nonlinear filter Replaces each pixel value with a nonlinear function of its surrounding pixels. nonlinear gradient filter A highpass edge-extraction filter that favors vertical edges. © National Instruments Corporation G-7 IMAQ Vision for G Reference Manual nonlinear Prewitt filter A highpass edge-extraction filter that favors horizontal and vertical edges in an image. nonlinear Sobel filter A highpass edge-extraction filter that favors horizontal and vertical edges in an image. Nth order filter Filters an image using a nonlinear filter. This filter orders (or classifies) the pixel values surrounding the pixel being processed. The pixel being processed is set to the Nth pixel value, where N is the order of the filter. O opening An erosion followed by a dilation. An opening removes small objects and smoothes boundaries of objects in the image. operators Allow masking, combination, and comparison of images. You can use arithmetic and logic operators in IMAQ Vision. optical representation Contains the low-frequency information at the center and the highfrequency information at the corners of an FFT-transformed image. outer gradient Finds the outer boundary of objects. P palette The gradation of colors used to display an image on screen, usually defined by a color lookup table. PICT Image format commonly used for 8-bit images on Macintosh and Power Macintosh platforms. picture element An element of a digital image. pixel Picture element. pixel calibration Directly calibrating the physical dimensions of a pixel in an image. pixel depth The number of bits used to represent the gray level of a pixel. Power 1/Y function Similar to a logarithmic function but with a weaker effect. Power Y function See exponential function. IMAQ Vision for G Reference Manual G-8 © National Instruments Corporation Prewitt filter Extracts the contours (edge detection) in gray-level values using a 3 × 3 filter kernel. probability function Defines the probability that a pixel in an image has a certain gray-level value. proper-closing A finite combination of successive closing and opening operations that you can use to fill small holes and smooth the boundaries of objects. proper-opening A finite combination of successive opening and closing operations that you can use to remove small particles and smooth the boundaries of objects. Q quantitative analysis Obtaining various measurements of objects in an image. R region of interest An area of the image that is graphically selected from a window displaying the image. This area can be used focus further processing. Reverse function Inverts the pixel values in an image, producing a photometric negative of the image. RGB Color image encoding using red, green, and blue colors. RGB chunky Color encoding scheme using red, green and blue (RGB) color information where each pixel in the color image is encoded using 32 bits: 8 bits for red, 8 bits for green, 8 bits for blue, and 8 bits for the alpha value (unused). Roberts filter Extracts the contours (edge detection) in gray level, favoring diagonal edges. ROI Region of interest. © National Instruments Corporation G-9 IMAQ Vision for G Reference Manual S segmentation function Fully partitions a labeled binary image into non-overlapping segments, with each segment containing a unique object. separation function Separates objects that touch each other by narrow isthmuses. Sigma filter A highpass filter that outlines edges. skeleton function Applies a succession of thinning operations to an object until its width becomes one pixel. skiz Obtains lines in an image that separate each object from the others and are equidistant from the objects that they separate. smoothing filter Blurs an image by attenuating variations of light intensity in the neighborhood of a pixel. Sobel filter Extracts the contours (edge detection) in gray-level values using a 3 × 3 filter kernel. spatial calibration Assigning physical dimensions to the area of a pixel in an image. spatial filters Alter the intensity of a pixel with respect to variations in intensities of its neighboring pixels. You can use these filters for edge detection, image enhancement, noise reduction, smoothing, and so forth. spatial resolution The number of pixels in an image, in terms of the number of rows and columns in the image. Square function See exponential function. Square Root function See logarithmic function. standard representation Contains the low-frequency information at the corners and high-frequency information at the center of an FFT-transformed image. structuring element A binary mask used in most morphological operations. A structuring element is used to determine which neighboring pixels contribute in the operation. IMAQ Vision for G Reference Manual G-10 © National Instruments Corporation T thickening Alters the shape of objects by adding parts to the object that match the pattern specified in the structuring element. thinning Alters the shape of objects by eliminating parts of the object that match the pattern specified in the structuring element. threshold Separates objects from the background by assigning all pixels with intensities within a specified range to the object and the rest of the pixels to the background. In the resulting binary image, objects are represented with a pixel intensity of 255 and the background is set to 0. threshold interval Two parameters, the lower threshold gray-level value and the upper threshold gray-level value. TIFF Image format commonly used for encoding 8-bit and 16-bit images and color images on both Macintosh and PC platforms. truth table A table associated with a logic operator which describes the rules used for that operation. Z zones © National Instruments Corporation Areas in a displayed image that respond to user clicks. You can use these zones to control events which can then be interpreted within LabVIEW or BridgeVIEW. G-11 IMAQ Vision for G Reference Manual 11Index.fm Page 1 Monday, July 7, 1997 12:09 PM Index Numbers Arithmetic Operator VIs, 15-1 to 15-9 IMAQ Add, 15-1 to 15-2 IMAQ Divide, 15-5 to 15-6 IMAQ Modulo, 15-8 to 15-9 IMAQ MulDiv, 15-7 to 15-8 IMAQ Multiply, 15-4 to 15-5 IMAQ Subtract, 15-2 to 15-4 arithmetic operators, 4-2 auto-median function gray-level morphology, 7-38 primary binary morphology, 7-21 to 7-22 axes. See chord and axis parameters. axis of symmetry, of gradient kernel, 5-6 3D view, 2-8. See also IMAQ 3DView VI. A Addition operator (table), 4-2 advanced binary morphology functions. See binary morphology functions. AIPD format, gray-level image, 1-3 alpha channel, 1-3 Analysis VIs, 19-11 to 19-23 IMAQ BasicParticle, 19-11 to 19-13 IMAQ Centroid, 19-10 to 19-11 IMAQ ChooseMeasurements, 19-20 to 19-23 IMAQ ComplexMeasure, 19-15 to 19-20 IMAQ ComplexParticle, 19-13 to 19-15 IMAQ Histograph, 19-3 to 19-6 IMAQ History, 19-1 to 19-3 IMAQ LinearAverages, 19-8 to 19-9 IMAQ LineProfile, 19-6 to 19-8 IMAQ Quantify, 19-9 to 19-10 AND operator. See also Logic Operator VIs. equation (table), 4-2 truth table, 4-4 area parameters, 8-5 to 8-7 holes’ area, 8-6 number of holes, 8-6 number of pixels, 8-5 particle area, 8-5 particle number, 8-5 ratio, 8-6 scanned area, 8-6 total area, 8-6 to 8-7 area threshold, 8-4 © National Instruments Corporation B B&W (gray) palette, 2-2 binary morphology functions advanced, 7-22 to 7-32 border function, 7-22 circle function, 7-30 to 7-31 convex function, 7-31 to 7-32 Danielsson function, 7-29 to 7-30 distance function, 7-29 highpass filters, 7-24 to 7-25 hole filling function, 7-22 labeling function, 7-23 lowpass filters, 7-23 to 7-25 segmentation function, 7-27 to 7-29 separation function, 7-25 to 7-26 skeleton functions, 7-26 to 7-27 primary, 7-9 to 7-22 auto-median function, 7-21 to 7-22 closing function, 7-12 to 7-13 dilation function, 7-9 to 7-11 erosion function, 7-9 to 7-11 I-1 IMAQ Vision for G Reference Manual Index IMAQ ColorEqualize, 22-15 IMAQ ColorHistogram, 22-7 to 22-8 IMAQ ColorHistograph, 22-9 to 22-10 IMAQ ColorImageToArray, 22-21 to 22-22 IMAQ ColorThreshold, 22-11 to 22-12 IMAQ ColorUserLookup, 22-13 to 22-14 IMAQ ColorValuetoInteger, 22-26 to 22-27 IMAQ ExtractColorPlanes, 22-4 to 22-5 IMAQ GetColorPixelLine, 22-18 to 22-19 IMAQ GetColorPixelValue, 22-16 to 22-17 IMAQ IntegerToColorValue, 22-24 to 22-26 IMAQ ReplaceColorPlane, 22-5 to 22-6 IMAQ RGBTocolor, 22-23 to 22-24 IMAQ SetColorPixelLine, 22-20 to 22-21 IMAQ SetColorPixelValue, 22-17 to 22-18 overview, 22-1 to 22-2 compactness factor, shape-feature parameters, 8-15 complex images, number of bytes per pixel (table), 1-4 Complex VIs, 21-1 to 21-20 IMAQ ArrayToComplexImage, 21-15 to 21-16 IMAQ ArrayToComplexPlane, 21-17 to 21-18 IMAQ ComplexAdd, 21-8 to 21-9 IMAQ ComplexAttenuate, 21-6 IMAQ ComplexConjugate, 21-5 IMAQ ComplexDivide, 21-12 to 21-14 IMAQ ComplexFlipFrequency, 21-4 to 21-5 IMAQ ComplexImageToArray, 21-14 to 21-15 IMAQ ComplexMultiply, 21-11 to 21-12 IMAQ ComplexPlaneToArray, 21-16 to 21-17 external edge function, 7-13 to 7-14 hit-miss function, 7-14 to 7-16 internal edge function, 7-13 to 7-14 opening function, 7-12 to 7-13 proper-closing function, 7-21 proper-opening function, 7-20 thickening function, 7-18 to 7-20 thinning function, 7-17 to 7-18 binary palette, 2-4 BMP format, gray-level image, 1-3 border function, advanced binary morphology, 7-22 B&W (gray) palette, 2-2 C center of mass X and center of mass Y, coordinates, 8-8 chord and axis parameters, 8-9 to 8-11 max chord length, 8-10 max intercept, 8-10 mean chord X, 8-10 mean chord Y, 8-10 mean intercept perpendicular, 8-10 particle orientation, 8-10 to 8-11 circle function, advanced binary morphology, 7-30 to 7-31. See also IMAQ Circles VI. closing function gray-level morphology, 7-35 to 7-36 primary binary morphology, 7-12 to 7-13 clustering, automatic thresholding, 7-3 to 7-5 color images histogram of, 2-6 number of bytes per pixel (table), 1-4 processing, 1-5 to 1-6 thresholding, 7-3 color lookup table (CLUT) transformation, 1-2 Color VIs, 22-1 to 22-27 color planes inversion [PC], 22-2 to 22-23 IMAQ ArrayToColorImage, 22-22 to 22-23 IMAQ Vision for G Reference Manual I-2 © National Instruments Corporation Index D IMAQ ComplexPlaneToImage, 21-18 to 21-19 IMAQ ComplexSubtract, 21-9 to 21-11 IMAQ ComplexTruncate, 21-7 to 21-8 IMAQ FFT, 21-2 to 21-3 IMAQ ImageToComplexPlane, 21-19 to 21-20 IMAQ InverseFFT, 21-3 to 21-4 overview, 21-1 to 21-2 connectivity connectivity-4, 8-4 connectivity-8, 8-3 overview, 8-3 connectivity 4/8 input, 9-15, 18-3 contour extraction and highlighting, Laplacian filters, 5-14 to 5-15 contour thickness, Laplacian filters, 5-15 to 5-16 Conversion VIs, 14-1 to 14-6 IMAQ Cast, 14-2 to 14-3 IMAQ Convert, 14-1 to 14-2 IMAQ ConvertByLookup, 14-4 to 14-5 IMAQ Shift16to8, 14-5 to 14-6 convex function, advanced binary morphology, 7-31 to 7-32. See also IMAQ Convex VI. convolution, defined, 5-3, 17-1 convolution filters. See linear filters or convolution filters. convolution kernel, defined, 5-3 convolution matrix, 17-1 coordinates, 8-8 to 8-9 center of mass X and center of mass Y, 8-8 max chord X and max chord Y, 8-9 min(X, Y) and max(X, Y), 8-9 creating images. See image creation. cumulative histogram, 2-6 customer communications, xxii, A-1 to A-2 © National Instruments Corporation Danielsson function, advanced binary morphology, 7-29 to 7-30. See also IMAQ Danielsson VI. densitometry parameters, 8-18 to 8-19 destroying images. See IMAQ Dispose VI. Difference operator, equation (table), 4-2 differentiation filter, 5-25 digital image processing, 1-1 digital images. See images. digital object definition, 8-2 to 8-5 area threshold, 8-4 to 8-5 connectivity, 8-2 to 8-4 intensity threshold, 8-2 dilation function gray-level morphology, 7-33 to 7-34 primary binary morphology, 7-9 to 7-11 Display VIs Display (Basics), 12-2 to 12-10 IMAQ GetPalette, 12-8 to 12-9 IMAQ PaletteTolerance (Macintosh/ Power Macintosh only), 12-9 to 12-10 IMAQ WindClose, 12-4 to 12-5 IMAQ WindDraw, 12-2 to 12-4 IMAQ WindMove, 12-6 IMAQ WindShow, 12-5 IMAQ WindSize, 12-7 to 12-8 Display (Special), 12-34 to 12-46 IMAQ GetLastKey, 12-46 IMAQ GetScreenSize, 12-37 to 12-38 IMAQ GetUserPen, 12-42 to 12-43 IMAQ SetupBrush, 12-43 to 12-45 IMAQ SetUserPen, 12-40 to 12-42 IMAQ WindDrawRect, 12-37 IMAQ WindGetMouse, 12-35 to 12-36 IMAQ WindRoiColor, 12-36 IMAQ WindSetup, 12-34 to 12-35 IMAQ WindXYZoom, 12-38 to 12-40 I-3 IMAQ Vision for G Reference Manual Index E Display (Tools), 12-10 to 12-23 IMAQ WindGrid, 12-22 to 12-23 IMAQ WindLastEvent, 12-18 to 12-21 IMAQ WindToolsClose, 12-18 IMAQ WindToolsMove, 12-17 IMAQ WindToolsSelect, 12-14 to 12-16 IMAQ WindToolsSetup, 12-12 to 12-14 IMAQ WindToolsShow, 12-16 to 12-17 IMAQ WindZoom, 12-21 to 12-22 Display (User), 12-29 to 12-34 IMAQ WindUserClose, 12-33 IMAQ WindUserEvent, 12-33 to 12-34 IMAQ WindUserMove, 12-32 IMAQ WindUserSetup, 12-29 to 12-30 IMAQ WindUserShow, 12-31 to 12-32 IMAQ WindUserStatus, 12-30 to 12-31 Regions of Interest, 12-23 to 12-28 IMAQ MaskToROI, 12-28 IMAQ ROIToMask, 12-27 to 12-28 IMAQ WindEraseROI, 12-26 IMAQ WindGetROI, 12-24 IMAQ WindSetROI, 12-25 to 12-26 disposing of images. See IMAQ Dispose VI. distance calibration, 8-1 distance function, advanced binary morphology, 7-29. See also IMAQ Distance VI. diverse tool VIs. See Tools (Diverse) VIs. diverse-measurement parameters, 8-19 Division operator (table), 4-2 documentation conventions used in manual, xxi organization of manual, xix to xx related documentation, xxii IMAQ Vision for G Reference Manual edge extraction, gradient filters, 5-7 to 5-9 edge highlighting, gradient filters, 5-7 to 5-9 edge thickness, gradient filters, 5-9 electronic support services, A-1 to A-2 ellipse major axis, 8-12 to 8-13 ellipse minor axis parameter, 8-13 ellipse ratio parameter, 8-13 elongation factor parameter, 8-15 entropy, automatic thresholding, 7-6 Equalize function. See also IMAQ Equalize VI. example 1, 3-4 to 3-5 example 2, 3-5 purpose and use, 3-4 transfer function and effect (table), 3-3 equivalent ellipse minor axis parameter, 8-12 erosion function gray-level morphology, 7-33 to 7-34 primary binary morphology, 7-9 to 7-11 error clusters, 9-4 to 9-5 error management. See IMAQ Error VI. exponential and gamma correction, 3-9 to 3-11 Exponential function exponential and gamma correction, 3-9 transfer function and effect (table), 3-4 external edge function, primary binary morphology, 7-13 to 7-14 External Library Support VIs, 23-1 to 23-11 IMAQ CharPtrToString, 23-6 to 23-7 IMAQ GetImagePixelPtr, 23-1 to 23-5 IMAQ ImageBorderOperation, 23-10 to 23-11 IMAQ ImageBorderSize, 23-11 IMAQ Interlace, 23-9 to 23-10 IMAQ MemPeek, 23-7 to 23-8 I-4 © National Instruments Corporation Index F G Fast Fourier Transform. See also frequency filters. complex images, 1-3 definition of Fourier Transform function, 6-3 to 6-4 FFT display, 6-4 to 6-7 optical representation, 6-6 to 6-7 standard representation, 6-6 File VIs, 11-1 to 11-6 IMAQ GetFileInfo, 11-4 to 11-5 IMAQ ReadFile, 11-1 to 11-4 IMAQ WriteFile, 11-5 to 11-6 Filter VIs, 17-1 to 17-12. See also Complex VIs. IMAQ BuildKernel, 17-5 to 17-6 IMAQ Convolute, 17-2 to 17-3 IMAQ Correlate, 17-11 to 17-12 IMAQ EdgeDetection, 17-6 to 17-7 IMAQ GetKernel, 17-3 to 17-5 IMAQ LowPass, 17-10 to 17-11 IMAQ NthOrder, 17-8 to 17-9 filtering. See spatial filtering. Fourier Transform function, 6-3 to 6-4 frequency filters, 6-1 to 6-12. See also Complex VIs. definition, 6-3 to 6-4 FFT display, 6-4 to 6-7 optical representation, 6-6 to 6-7 standard representation, 6-6 highpass FFT filters, 6-9 to 6-12 attenuation, 6-10 overview, 6-2 truncation, 6-10 to 6-12 lowpass FFT filters, 6-6 to 6-9 attenuation, 6-7 to 6-8 overview, 6-2 truncation, 6-8 to 6-9 mask FFT filters, overview, 6-3 overview, 6-1 to 6-3 frequency processing, 21-1 Gaussian convolution filter, 5-20 Gaussian filters, 5-20 to 5-22 definition, 5-20 example, 5-20 to 5-21 kernel definition, 5-21 predefined Gaussian kernels, 5-21 to 5-22 Geometry VIs, 20-1 to 20-8 IMAQ 3DView, 20-1 to 20-4 IMAQ Rotate, 20-4 to 20-5 IMAQ Shift, 20-5 to 20-6 IMAQ Symmetry, 20-7 to 20-8 gradient convolution filter, 5-5 gradient filter, 5-4 to 5-12 definition, 5-4 edge extraction and edge highlighting, 5-7 to 5-9 edge thickness, 5-9 example, 5-5 filter axis and direction, 5-6 to 5-7 kernel definition, 5-5 to 5-6 nonlinear, 5-25 predefined gradient kernels, 5-10 to 5-12 Prewitt filters, 5-10 Sobel filters, 5-11 to 5-12 gradient palette, 2-3 gray (B&W) palette, 2-2 gray-level images number of bytes per pixel (table), 1-4 types of, 1-3 gray-level morphology, 7-32 to 7-38. See also IMAQ GrayMorphology VI. auto-median function, 7-38 closing function, 7-35 to 7-36 dilation function, 7-33 to 7-34 erosion function, 7-33 to 7-34 opening function, 7-34 to 7-36 proper-closing function, 7-37 proper-opening function, 7-36 to 7-37 gray-level value, 1-1 © National Instruments Corporation I-5 IMAQ Vision for G Reference Manual Index H cumulative, 2-6 definition, 2-4 to 2-5 interpretation, 2-6 line profile, 2-7 to 2-8 linear, 2-5 scale of histogram, 2-7 Image Mask input, 9-11 to 9-12 image pixel frame, 1-6 to 1-8 hexagonal frame, 1-8 neighborhood size (table), 1-7 rectangular frame, 1-7 Image Src input, 9-10, 9-12 to 9-13 image tool VIs. See Tools (Image) VIs. image-type icons, 9-2 to 9-3 image visualization, 12-1 images color images, 1-3 complex images, 1-3 to 1-4 definition, 1-1, 9-1 gray-level images, 1-3 image definition, 1-2 number of planes, 1-2 processing color images, 1-5 to 1-6 programming concepts, 9-9 to 9-17 arithmetic or logical operations, 9-13 combinations of input and output, 9-11 connectivity 4/8, 9-15 creating images, 9-10 Image Dst input, 9-10 to 9-13 Image Mask input, 9-11 to 9-12 Image Src input, 9-10, 9-12 to 9-13 image structure, 9-9 line entity, 9-14 overview, 9-1 to 9-2 rectangle entity, 9-14 Square/Hexa input, 9-16 to 9-17 structuring element, 9-16 table of pixels, 9-15 properties of digitized image, 1-1 to 1-2 resolution, 1-1 types and formats, 1-3 to 1-4 IMAQ 3DView VI, 20-1 to 20-4 hexagonal frame, 1-8. See also Square/Hexa input. Heywood circularity factor, shape-feature parameters, 8-15 highpass FFT filters, 6-9 to 6-12 attenuation, 6-10 overview, 6-2 truncation, 6-10 to 6-12 highpass filters advanced binary morphology functions, 7-24 to 7-25 classification summary (table), 5-3 definition, 5-1 histogram. See also image histogram. definition, 2-4 histogram VIs IMAQ Histogram, 19-1 to 19-3 IMAQ Histograph, 19-3 to 19-6 hit-miss function, primary binary morphology, 7-14 to 7-16 concept and mathematics, 7-15 example 1, 7-15 example 2, 7-16 hole filling function, advanced binary morphology, 7-22 HSL (hue, saturation, and lightness) component, 1-5 hydraulic radius, shape-feature parameters, 8-15 to 8-16 I image creation IMAQ Create VI, 10-1 to 10-2 IMAQ Create&LockSpace VI, 10-3 to 10-4 programming concepts, 9-10 Image Dst input, 9-10 to 9-13 image files, 1-5 image histogram, 2-4 to 2-8 3D view, 2-8 of color images, 2-6 IMAQ Vision for G Reference Manual I-6 © National Instruments Corporation Index IMAQ ComplexPlaneToImage VI, 21-18 to 21-19 IMAQ ComplexSubtract VI, 21-9 to 21-11 IMAQ ComplexTruncate VI, 21-7 to 21-8 IMAQ Convert VI, 14-1 to 14-2 IMAQ ConvertByLookup VI, 14-4 to 14-5 IMAQ Convex VI, 18-12 IMAQ Convolute VI, 17-2 to 17-3 IMAQ Copy VI, 13-1 to 13-2 IMAQ Correlate VI, 17-11 to 17-12 IMAQ Create VI, 10-1 to 10-3 IMAQ Create&LockSpace VI, 10-3 to 10-4 IMAQ Danielsson VI, 18-8 IMAQ Dispose VI, 10-4 to 10-5 IMAQ Distance VI, 18-7 to 18-8 IMAQ Divide VI, 15-5 to 15-6 IMAQ Draw VI, 13-26 to 13-27 IMAQ DrawText VI, 13-27 to 13-30 IMAQ EdgeDetection VI, 17-6 to 17-7 IMAQ Equalize VI, 16-11 to 16-12 IMAQ Error VI, 10-5 to 10-6 IMAQ Expand VI, 13-5 to 13-7 IMAQ Extract VI, 13-4 to 13-5 IMAQ ExtractColorPlanes, 22-4 to 22-5 IMAQ FFT VI, 21-2 to 21-3 IMAQ FillHole VI, 18-10 to 18-11 IMAQ FillImage VI, 13-31 to 13-32 IMAQ GetCalibration VI, 13-11 to 13-12 IMAQ GetColorPixelLine VI, 22-18 to 22-19 IMAQ GetColorPixelValue VI, 22-16 to 22-17 IMAQ GetFileInfo VI, 11-4 to 11-5 IMAQ GetImagePixelPtr VI, 23-1 to 23-5 IMAQ GetImageSize VI, 13-2 IMAQ GetKernel VI, 17-3 to 17-5 IMAQ GetLastKey VI, 12-46 IMAQ GetOffset VI, 13-7 to 13-8 IMAQ GetPalette VI, 12-8 to 12-9 IMAQ GetPixelLine VI, 13-18 IMAQ GetPixelValue VI, 13-16 IMAQ GetRowCol VI, 13-19 IMAQ GetScreenSize VI, 12-37 to 12-38 IMAQ GetUserPen VI, 12-42 to 12-43 IMAQ Add VI, 15-1 to 15-2 IMAQ And VI, 15-10 to 15-11 IMAQ ArrayToColorImage VI, 22-22 to 22-23 IMAQ ArrayToComplexImage VI, 21-15 to 21-16 IMAQ ArrayToComplexPlane VI, 21-17 to 21-18 IMAQ ArrayToImage VI, 13-23 to 13-24 IMAQ AutoBThreshold VI, 16-4 to 16-5 IMAQ AutoMThreshold VI, 16-5 to 16-7 IMAQ BuildKernel VI, 17-5 to 17-6 IMAQ Cast VI, 14-2 to 14-3 IMAQ Centroid VI, 19-10 to 19-11 IMAQ CharPtrToString VI, 23-6 to 23-7 IMAQ ChooseMeasurements VI, 19-20 to 19-23 IMAQ Circles VI, 18-13 to 18-14 IMAQ ClipboardToImage VI, 13-25 IMAQ ColorEqualize VI, 22-15 IMAQ ColorHistogram, 22-7 to 22-8 IMAQ ColorHistograph VI, 22-9 to 22-10 IMAQ ColorImageToArray VI, 22-21 to 22-22 IMAQ ColorThreshold VI, 22-11 to 22-12 IMAQ ColorUserLookup VI, 22-13 to 22-14 IMAQ ColorValuetoInteger VI, 22-26 to 22-27 IMAQ Compare VI, 15-15 to 15-16 IMAQ ComplexAdd VI, 21-8 to 21-9 IMAQ ComplexAttenuate VI, 21-6 IMAQ ComplexConjugate VI, 21-5 IMAQ ComplexDivide VI, 21-12 to 21-14 IMAQ ComplexFlipFrequency VI, 21-4 to 21-5 IMAQ ComplexImageToArray VI, 21-14 to 21-15 IMAQ ComplexMeasure VI, 19-15 to 19-20 IMAQ ComplexMultiply VI, 21-11 to 21-12 IMAQ ComplexParticle VI, 19-13 to 19-15 IMAQ ComplexPlaneToArray VI, 21-16 to 21-17 © National Instruments Corporation I-7 IMAQ Vision for G Reference Manual Index IMAQ Segmentation VI, 18-14 to 18-15 IMAQ Separation VI, 18-17 to 18-18 IMAQ SetCalibration VI, 13-12 to 13-13 IMAQ SetColorPixelLine VI, 22-20 to 22-21 IMAQ SetColorPixelValue VI, 22-17 to 22-18 IMAQ SetImageSize VI, 13-3 IMAQ SetOffset VI, 13-9 IMAQ SetPixelLine VI, 13-20 IMAQ SetPixelValue VI, 13-17 IMAQ SetRowCol VI, 13-21 to 13-22 IMAQ SetupBrush VI, 12-43 to 12-45 IMAQ SetUserPen VI, 12-40 to 12-42 IMAQ Shift VI, 20-5 to 20-6 IMAQ Shift16to8 VI, 14-5 to 14-6 IMAQ Skeleton VI, 18-15 to 18-16 IMAQ Status VI, 10-6 to 10-7 IMAQ Subtract VI, 15-2 to 15-4 IMAQ Symmetry VI, 20-7 to 20-8 IMAQ Threshold VI, 16-1 to 16-2 IMAQ UserLookup VI, 16-7 to 16-8 IMAQ Vision programming concepts. See programming concepts. IMAQ WindClose VI, 12-4 to 12-5 IMAQ WindDraw VI, 12-2 to 12-4 IMAQ WindDrawRect VI, 12-37 IMAQ WindEraseROI VI, 12-26 IMAQ WindGetMouse VI, 12-35 to 12-36 IMAQ WindGetROI VI, 12-24 IMAQ WindGrid VI, 12-22 to 12-23 IMAQ WindLastEvent VI, 12-18 to 12-21 IMAQ WindMove VI, 12-6 IMAQ WindRoiColor VI, 12-36 IMAQ WindSetROI VI, 12-25 to 12-26 IMAQ WindSetup VI, 12-34 to 12-35 IMAQ WindShow VI, 12-5 IMAQ WindSize VI, 12-7 to 12-8 IMAQ WindToolsClose VI, 12-18 IMAQ WindToolsMove VI, 12-17 IMAQ WindToolsSelect VI, 12-14 to 12-16 IMAQ WindToolsSetup VI, 12-12 to 12-14 IMAQ WindToolsShow VI, 12-16 to 12-17 IMAQ WindUserClose VI, 12-33 IMAQ GrayMorphology VI, 18-5 to 18-7 IMAQ Histograph VI, 19-3 to 19-6 IMAQ History VI, 19-1 to 19-3 IMAQ ImageBorderOperation VI, 23-10 to 23-11 IMAQ ImageBorderSize VI, 23-11 IMAQ ImageToArray VI, 13-22 to 13-23 IMAQ ImageToClipboard VI, 13-24 to 13-25 IMAQ ImageToComplexPlane VI, 21-19 to 21-20 IMAQ ImageToImage VI, 13-14 to 13-15 IMAQ IntegerToColorValue VI, 22-24 to 22-26 IMAQ Interlace VI, 23-9 to 23-10 IMAQ InverseFFT VI, 21-3 to 21-4 IMAQ Label VI, 16-13 to 16-14 IMAQ LinearAverages VI, 19-8 to 19-9 IMAQ LineProfile VI, 19-6 to 19-8 IMAQ LogDiff VI, 15-13 to 15-14 IMAQ LowPass VI, 17-10 to 17-11 IMAQ MagicWand VI, 13-30 to 13-31 IMAQ Mask VI, 15-17 IMAQ MaskToROI VI, 12-28 IMAQ MathLookup VI, 16-8 to 16-10 IMAQ MemPeek VI, 23-7 to 23-8 IMAQ Modulo VI, 15-8 to 15-9 IMAQ Morphology VI, 18-3 to 18-5 IMAQ MulDiv VI, 15-7 to 15-8 IMAQ Multiply VI, 15-4 to 15-5 IMAQ MultiThreshold VI, 16-2 to 16-4 IMAQ NthOrder VI, 17-8 to 17-9 IMAQ Or VI, 15-11 to 15-12 IMAQ PaletteTolerance (Macintosh/Power Macintosh only) VI, 12-9 to 12-10 IMAQ Quantify VI, 19-9 to 19-10 IMAQ ReadFile VI, 11-1 to 11-4 IMAQ RejectBorder VI, 18-11 to 18-12 IMAQ RemoveParticle VI, 18-9 to 18-10 IMAQ ReplaceColorPlane VI, 22-5 to 22-6 IMAQ Resample VI, 13-10 to 13-11 IMAQ RGBTocolor VI, 22-23 to 22-24 IMAQ ROIToMask VI, 12-27 to 12-28 IMAQ Rotate VI, 20-4 to 20-5 IMAQ Vision for G Reference Manual I-8 © National Instruments Corporation Index edge extraction and edge highlighting, 5-7 to 5-9 edge thickness, 5-9 example, 5-5 filter axis and direction, 5-6 to 5-7 kernel definition, 5-5 to 5-6 predefined gradient kernels, 5-10 to 5-12 Prewitt filters, 5-10 Sobel filters, 5-11 to 5-12 Laplacian filters, 5-12 to 5-17 contour extraction and highlighting, 5-14 to 5-15 contour thickness, 5-15 to 5 to 16 example, 5-12 to 5-13 kernel definition, 5-13 predefined kernels, 5-16 to 5-17 overview, 5-3 to 5-4 linear histogram, 2-5 logarithmic and inverse gamma correction, 3-7 to 3-9 Logarithmic function logarithmic and inverse gamma correction, 3-7 transfer function and effect (table), 3-3 Logic Operator VIs, 15-10 to 15-17 IMAQ And, 15-10 to 15-11 IMAQ Compare, 15-15 to 15-16 IMAQ LogDiff, 15-13 to 15-14 IMAQ Mask, 15-17 IMAQ Or, 15-11 to 15-12 IMAQ Xor, 15-12 to 15-13 logic operators, 4-2 to 4-7 example 1, 4-5 to 4-6 example 2, 4-6 to 4-7 list of operators (table), 4-2 truth tables, 4-4 uses, 4-3 lookup table transformations, 3-1 to 3-11. See also Processing VIs. definition, 3-1 equalization, 3-4 to 3-5 example, 3-2 to 3-3 IMAQ WindUserEvent VI, 12-33 to 12-34 IMAQ WindUserMove VI, 12-32 IMAQ WindUserSetup VI, 12-29 to 12-30 IMAQ WindUserShow VI, 12-31 to 12-32 IMAQ WindUserStatus VI, 12-30 to 12-31 IMAQ WindXYZoom VI, 12-38 to 12-40 IMAQ WindZoom VI, 12-21 to 12-22 IMAQ WriteFile VI, 11-5 to 11-6 IMAQ Xor VI, 15-12 to 15-13 intensity calibration, 8-2 intensity range, 8-2 intensity threshold, 8-2 interclass variance, automatic thresholding, 7-6 internal edge function, primary binary morphology, 7-13 to 7-14 L L-skeleton function, 7-26 labeling function, advanced binary morphology, 7-23. See also IMAQ Label VI. Laplacian convolution filter, 5-13 Laplacian filters, 5-12 to 5-17 contour extraction and highlighting, 5-14 to 5-15 contour thickness, 5-15 to 5 to 16 definition, 5-12 example, 5-12 to 5-13 kernel definition, 5-13 predefined kernels, 5-16 to 5-17 length parameters, 8-7 to 8-8 breadth, 8-7 height, 8-8 holes' perimeter, 8-7 particle perimeter, 8-7 line entity, 9-14 line profile, 2-7 to 2-8 linear filters, defined, 5-2 linear filters or convolution filters, 5-3 to 5-22 gradient filter, 5-4 to 5-12 © National Instruments Corporation I-9 IMAQ Vision for G Reference Manual Index MMX compatibility of IMAQ Vision for G, 9-3 to 9-4 Intel MMX technology, 9-3 MMX icon, 9-4 overview of MMX features, 9-4 moments of inertia IXX, IYY, IXY, shape-feature parameters, 8-14 moments technique, automatic thresholding, 7-6 morphology analysis, 7-1 to 7-38 advanced binary morphology functions, 7-22 to 7-32 border function, 7-22 circle function, 7-30 to 7-31 convex function, 7-31 to 7-32 Danielsson function, 7-29 to 7-30 distance function, 7-29 highpass filters, 7-24 to 7-25 hole filling function, 7-22 labeling function, 7-23 lowpass filters, 7-23 to 7-25 segmentation function, 7-27 to 7-29 separation function, 7-25 to 7-26 skeleton functions, 7-26 to 7-27 gray-level morphology, 7-32 to 7-38 auto-median function, 7-38 closing function, 7-35 to 7-36 dilation function, 7-33 to 7-34 erosion function, 7-33 to 7-34 opening function, 7-34 to 7-36 proper-closing function, 7-37 proper-opening function, 7-36 to 7-37 overview, 7-1 primary binary morphology functions, 7-9 to 7-22 auto-median function, 7-21 to 7-22 closing function, 7-12 to 7-13 dilation function, 7-9 to 7-11 erosion function, 7-9 to 7-11 external edge function, 7-13 to 7-14 hit-miss function, 7-14 to 7-16 internal edge function, 7-13 to 7-14 exponential and gamma correction, 3-9 to 3-11 logarithmic and inverse gamma correction, 3-7 to 3-9 overview, 3-1 to 3-2 predefined lookup tables, 3-3 to 3-4 Reverse function, 3-6 to 3-7 lowpass FFT filters, 6-6 to 6-9 attenuation, 6-7 to 6-8 overview, 6-2 truncation, 6-8 to 6-9 lowpass filters advanced binary morphology functions, 7-23 to 7-25 classification summary (table), 5-3 definition, 5-1 nonlinear, 5-26 LUT. See lookup table transformations. M M-skeleton function, 7-27 Management VIs, 10-1 to 10-7 IMAQ Create, 10-1 to 10-3 IMAQ Create&LockSpace, 10-3 to 10-4 IMAQ Dispose, 10-4 to 10-5 IMAQ Error, 10-5 to 10-6 IMAQ Status, 10-6 to 10-7 manual. See documentation. mask FFT filters, overview, 6-3 masking images, with operators, 4-1 max chord length parameter, 8-10 max chord X and max chord Y, coordinates, 8-9 max intercept parameter, 8-10 mean chord X parameter, 8-10 mean chord Y parameter, 8-10 mean intercept perpendicular parameter, 8-10 median filter, 5-27 metric technique, automatic thresholding, 7-6 min(X, Y) and max(X, Y), coordinates, 8-9 IMAQ Vision for G Reference Manual I-10 © National Instruments Corporation Index median filter, 5-27 Nth order filter, 5-27 to 5-28 Prewitt filter, 5-23 Roberts filter, 5-25 Sigma filter, 5-26 Sobel filter, 5-23 NOR operator equation (table), 4-2 truth table, 4-4 normalization factor, 5-3 NOT operator, truth table, 4-4 Nth order filter, 5-27 to 5-28 opening function, 7-12 to 7-13 proper-closing function, 7-21 proper-opening function, 7-20 thickening function, 7-18 to 7-20 thinning function, 7-17 to 7-18 structuring element, 7-7 to 7-8 thresholding, 7-1 to 7-7 automatic, 7-3 to 7-7 clustering, 7-3 to 7-5 color image, 7-3 entropy, 7-6 example, 7-2 to 7-3 interclass variance, 7-6 metric, 7-6 moments, 7-6 Morphology VIs, 18-1 to 18-18 IMAQ Circles, 18-13 to 18-14 IMAQ Convex, 18-12 IMAQ Danielsson, 18-8 IMAQ Distance, 18-7 to 18-8 IMAQ FillHole, 18-10 to 18-11 IMAQ GrayMorphology, 18-5 to 18-7 IMAQ Morphology, 18-3 to 18-5 IMAQ RejectBorder, 18-11 to 18-12 IMAQ RemoveParticle, 18-9 to 18-10 IMAQ Segmentation, 18-14 to 18-15 IMAQ Separation, 18-17 to 18-18 IMAQ Skeleton, 18-15 to 18-16 overview, 18-1 to 18-3 Multiplication operator (table), 4-2 O object measurements, 8-5 to 8-18 areas, 8-5 to 8-7 chords and axes, 8-9 to 8-11 coordinates, 8-8 to 8-9 lengths, 8-7 to 8-8 shape equivalence, 8-11 to 8-14 shape features, 8-14 to 8-18 opening function gray-level morphology, 7-34 to 7-36 primary binary morphology, 7-12 to 7-13 operators. See also Arithmetic Operator VIs; Logic Operator VIs. arithmetic, 4-2 concepts and mathematics, 4-1 logic, 4-2 to 4-7 example 1, 4-5 to 4-6 example 2, 4-6 to 4-7 list of operators (table), 4-2 truth tables, 4-4 optical representation, FFT display, 6-6 to 6-7 OR operator. See also Logic Operator VIs. equation (table), 4-2 truth table, 4-4 N NAND operator equation (table), 4-2 truth table, 4-4 nonlinear filters, 5-22 to 5-28 classification summary (table), 5-3 definition, 5-2, 5-22 differentiation filter, 5-25 example, 5-24 gradient filter, 5-25 lowpass filter, 5-26 © National Instruments Corporation I-11 IMAQ Vision for G Reference Manual Index P IMAQ MultiThreshold, 16-2 to 16-4 IMAQ Threshold, 16-1 to 16-2 IMAQ UserLookup, 16-7 to 16-8 programming concepts, 9-1 to 9-17. See also VIs. manipulation of images, 9-9 to 9-17 arithmetic or logical operations, 9-13 combinations of input and output, 9-11 connectivity 4/8, 9-15 creating images, 9-10 Image Dst input, 9-10 to 9-13 Image Mask input, 9-11 to 9-12 Image Src input, 9-10, 9-12 to 9-13 image structure, 9-9 line entity, 9-14 overview, 9-1 to 9-2 rectangle entity, 9-14 Square/Hexa input, 9-16 to 9-17 structuring element, 9-16 table of pixels, 9-15 MMX compatibility, 9-3 to 9-4 proper-closing function gray-level morphology, 7-37 primary binary morphology, 7-21 proper-opening function gray-level morphology, 7-36 to 7-37 primary binary morphology, 7-20 palettes, 2-1 to 2-4, 2-1 to 2-8 binary palette, 2-4 B&W (gray) palette, 2-2 definition, 2-1 gradient palette, 2-3 image histogram, 2-4 overview, 2-1 to 2-2 rainbow palette, 2-3 temperature palette, 2-3 particle orientation parameter, 8-10 to 8-11 PICT format, gray-level image, 1-3 pixel calibration, 8-1 pixel depth, 1-2 pixel frame. See image pixel frame. pixel tool VIs. See Tools (Pixel) VIs. pixels, table of, 9-15 planes. See also Color VIs. color planes inversion [PC], 22-2 to 22-23 planes, number of, 1-2 Power 1/Y function example, 3-8 logarithmic and inverse gamma correction, 3-7 transfer function and effect (table), 3-3 Power Y function example, 3-10 exponential and gamma correction, 3-9 transfer function and effect (table), 3-4 predefined gradient kernels, 5-11 to 5-12 predefined lookup tables, 3-3 to 3-4 Prewitt filters nonlinear, 5-23 predefined gradient kernels, 5-10 primary binary morphology functions. See binary morphology functions. Processing VIs, 16-1 to 16-14 IMAQ AutoBThreshold, 16-4 to 16-5 IMAQ AutoMThreshold, 16-5 to 16-7 IMAQ Equalize, 16-11 to 16-12 IMAQ Label, 16-13 to 16-14 IMAQ MathLookup, 16-8 to 16-10 IMAQ Vision for G Reference Manual Q quantitative analysis, 8-1 to 8-19 definition of digital object, 8-2 to 8-5 area threshold, 8-4 to 8-5 connectivity, 8-2 to 8-4 intensity threshold, 8-2 densitometry, 8-18 to 8-19 diverse measurements, 8-19 intensity calibration, 8-2 object measurements, 8-5 to 8-18 areas, 8-5 to 8-7 chords and axes, 8-9 to 8-11 coordinates, 8-8 to 8-9 I-12 © National Instruments Corporation Index separation function, advanced binary morphology, 7-25 to 7-26. See also IMAQ Separation VI. shape-equivalence parameters, 8-11 to 8-14 ellipse major axis, 8-12 to 8-13 ellipse minor axis, 8-13 ellipse ratio, 8-13 equivalent ellipse minor axis, 8-12 rectangle big side, 8-13 rectangle ratio, 8-14 rectangle small side, 8-14 shape-feature parameters, 8-14 to 8-18 compactness factor, 8-15 elongation factor, 8-15 Heywood circularity factor, 8-15 hydraulic radius, 8-15 to 8-16 moments of inertia IXX, IYY, IXY, 8-14 Waddel disk diameter, 8-16 to 8-18 definitions of primary measurements, 8-16 derived measurements (table), 8-17 to 8-18 Sigma filter, 5-26 skeleton functions, 7-26 to 7-27. See also IMAQ Skeleton VI. L-skeleton, 7-26 M-skeleton, 7-27 skiz, 7-27 skiz function compared with segmentation function, 7-28 to 7-29 purpose and use, 7-27 smoothing convolution filter, 5-18 smoothing filter, 5-17 to 5-20 definition, 5-17 example, 5-17 to 5-18 kernel definition, 5-18 to 5-19 predefined smoothing kernels, 5-19 to 5-20 Sobel filters, nonlinear, 5-23 spatial calibration, 8-1 spatial filtering, 5-1 to 5-28 categories, 5-1 lengths, 8-7 to 8-8 shape equivalence, 8-11 to 8-14 shape features, 8-14 to 8-18 spatial calibration, 8-1 R rainbow palette, 2-3 RASTR format, gray-level image, 1-3 rectangle big side, shape-equivalence parameters, 8-13 rectangle entity, 9-14 rectangle ratio, shape-equivalence parameters, 8-14 rectangle small side, shape-equivalence parameters, 8-14 rectangular frame, 1-7 Regions of Interest, 12-23 to 12-28 IMAQ MaskToROI, 12-28 IMAQ ROIToMask, 12-27 to 12-28 IMAQ WindEraseROI, 12-26 IMAQ WindGetROI, 12-24 IMAQ WindSetROI, 12-25 to 12-26 Remainder operator (table), 4-2 resolution of images, 1-1 spatial, 1-1 Reverse function example, 3-6 to 3-6 purpose and use, 3-6 transfer function and effect (table), 3-3 RGB chunky image type, 1-3, 9-1 Roberts filter, 5-25 S scale of histogram, 2-7 segmentation function. See also IMAQ Segmentation VI. advanced binary morphology, 7-27 to 7-29 compared with skiz function, 7-28 to 7-29 © National Instruments Corporation I-13 IMAQ Vision for G Reference Manual Index spatial resolution, 1-1 Square function example, 3-10 exponential and gamma correction, 3-9 transfer function and effect (table), 3-4 Square Root function example, 3-8 logarithmic and inverse gamma correction, 3-7 transfer function and effect (table), 3-3 Square/Hexa input, 9-16 to 9-17, 18-2 standard representation, FFT display, 6-6 status. See IMAQ Status VI. structuring element, 7-7 to 7-8 definition, 7-7 dilation function example, 7-12 erosion function example, 7-11 morphological transformation, 7-7 to 7-8 programming concepts, 9-16 classification summary (table), 5-3 definition, 5-1 Gaussian filters, 5-20 to 5-22 example, 5-20 to 5-21 kernel definition, 5-21 predefined Gaussian kernels, 5-21 to 5-22 gradient filter, 5-4 to 5-12 edge extraction and edge highlighting, 5-7 to 5-9 edge thickness, 5-9 example, 5-5 filter axis and direction, 5-6 to 5-7 kernel definition, 5-5 to 5-6 predefined gradient kernels, 5-10 to 5-12 Prewitt filters, 5-10 Sobel filters, 5-11 to 5-12 Laplacian filters, 5-12 to 5-17 contour extraction and highlighting, 5-14 to 5-15 contour thickness, 5-15 to 5 to 16 example, 5-12 to 5-13 kernel definition, 5-13 predefined kernels, 5-16 to 5-17 linear filters or convolution filters, 5-3 to 5-22 nonlinear filters, 5-22 to 5-28 differentiation filter, 5-25 example, 5-24 gradient filter, 5-25 lowpass filter, 5-26 median filter, 5-27 Nth order filter, 5-27 to 5-28 Prewitt filter, 5-23 Roberts filter, 5-25 Sigma filter, 5-26 Sobel filter, 5-23 smoothing filter, 5-17 to 5-20 example, 5-17 to 5-18 kernel definition, 5-18 to 5-19 predefined smoothing kernels, 5-19 to 5-20 IMAQ Vision for G Reference Manual T table of pixels entity, 9-15 technical support, A-1 to A-2 temperature palette, 2-3 thickening function, primary binary morphology, 7-18 to 7-20 thinning function, primary binary morphology, 7-17 to 7-18 3D view, 2-8. See also IMAQ 3DView VI. threshold interval, 8-2 thresholding, 7-1 to 7-7. See also Processing VIs. automatic, 7-3 to 7-7 clustering, 7-3 to 7-5 entropy, 7-6 interclass variance, 7-6 metric, 7-6 moments, 7-6 color image, 7-3 example, 7-2 to 7-3 with operators, 4-1 overview, 7-1 to 7-2 I-14 © National Instruments Corporation Index V TIFF format, gray-level image, 1-3 tools and utilities. See image histogram; palettes. Tools (Diverse) VIs, 13-24 to 13-32 IMAQ ClipboardToImage, 13-25 IMAQ Draw, 13-26 to 13-27 IMAQ DrawText, 13-27 to 13-30 IMAQ FillImage, 13-31 to 13-32 IMAQ ImageToClipboard, 13-24 to 13-25 IMAQ MagicWand, 13-30 to 13-31 tools for display. See Display VIs, Display (Tools). Tools (Image) VIs IMAQ Copy, 13-1 to 13-2 IMAQ Expand, 13-5 to 13-7 IMAQ Extract, 13-4 to 13-5 IMAQ GetCalibration, 13-11 to 13-12 IMAQ GetImageSize, 13-2 IMAQ GetOffset, 13-7 to 13-8 IMAQ ImageToImage, 13-14 to 13-15 IMAQ Resample, 13-10 to 13-11 IMAQ SetCalibration, 13-12 to 13-13 IMAQ SetImageSize, 13-3 IMAQ SetOffset, 13-9 Tools (Pixel) VIs, 13-16 to 13-24 IMAQ ArrayToImage, 13-23 to 13-24 IMAQ GetPixelLine, 13-18 IMAQ GetPixelValue, 13-16 IMAQ GetRowCol, 13-19 IMAQ ImageToArray, 13-22 to 13-23 IMAQ SetPixelLine, 13-20 IMAQ SetPixelValue, 13-17 IMAQ SetRowCol, 13-21 to 13-22 truth tables for logic operators, 4-2 VIs in advanced version of IMAQ Vision (table), 9-7 to 9-9 Analysis, 19-11 to 19-23 IMAQ BasicParticle, 19-11 to 19-13 IMAQ Centroid, 19-10 to 19-11 IMAQ ChooseMeasurements, 19-20 to 19-23 IMAQ ComplexMeasure, 19-15 to 19-20 IMAQ ComplexParticle, 19-13 to 19-15 IMAQ Histograph, 19-3 to 19-6 IMAQ History, 19-1 to 19-3 IMAQ LinearAverages, 19-8 to 19-9 IMAQ LineProfile, 19-6 to 19-8 IMAQ Quantify, 19-9 to 19-10 Arithmetic Operators, 15-1 to 15-9 IMAQ Add, 15-1 to 15-2 IMAQ Divide, 15-5 to 15-6 IMAQ Modulo, 15-8 to 15-9 IMAQ MulDiv, 15-7 to 15-8 IMAQ Multiply, 15-4 to 15-5 IMAQ Subtract, 15-2 to 15-4 in base and advanced versions of IMAQ Vision (table), 9-6 to 9-7 Color, 22-1 to 22-27 color planes inversion [PC], 22-2 to 22-23 IMAQ ArrayToColorImage, 22-22 to 22-23 IMAQ ColorEqualize, 22-15 IMAQ ColorHistogram, 22-7 to 22-8 IMAQ ColorHistograph, 22-9 to 22-10 IMAQ ColorImageToArray, 22-21 to 22-22 IMAQ ColorThreshold, 22-11 to 22-12 IMAQ ColorUserLookup, 22-13 to 22-14 U utilities. See image histogram; palettes. © National Instruments Corporation I-15 IMAQ Vision for G Reference Manual Index IMAQ ImageToComplexPlane, 21-19 to 21-20 IMAQ InverseFFT, 21-3 to 21-4 overview, 21-1 to 21-2 Conversion, 14-1 to 14-6 IMAQ Cast, 14-2 to 14-3 IMAQ Convert, 14-1 to 14-2 IMAQ ConvertByLookup, 14-4 to 14-5 IMAQ Shift16to8, 14-5 to 14-6 Display (Basics), 12-2 to 12-10 IMAQ GetPalette, 12-8 to 12-9 IMAQ PaletteTolerance (Macintosh/ Power Macintosh only), 12-9 to 12-10 IMAQ WindClose, 12-4 to 12-5 IMAQ WindDraw, 12-2 to 12-4 IMAQ WindMove, 12-6 IMAQ WindShow, 12-5 IMAQ WindSize, 12-7 to 12-8 Display (Special), 12-34 to 12-46 IMAQ GetLastKey, 12-46 IMAQ GetScreenSize, 12-37 to 12-38 IMAQ GetUserPen, 12-42 to 12-43 IMAQ SetupBrush, 12-43 to 12-45 IMAQ SetUserPen, 12-40 to 12-42 IMAQ WindDrawRect, 12-37 IMAQ WindGetMouse, 12-35 to 12-36 IMAQ WindRoiColor, 12-36 IMAQ WindSetup, 12-34 to 12-35 IMAQ WindXYZoom, 12-38 to 12-40 Display (Tools), 12-10 to 12-23 IMAQ WindGrid, 12-22 to 12-23 IMAQ WindLastEvent, 12-18 to 12-21 IMAQ WindToolsClose, 12-18 IMAQ WindToolsMove, 12-17 IMAQ WindToolsSelect, 12-14 to 12-16 IMAQ ColorValuetoInteger, 22-26 to 22-27 IMAQ ExtractColorPlanes, 22-4 to 22-5 IMAQ GetColorPixelLine, 22-18 to 22-19 IMAQ GetColorPixelValue, 22-16 to 22-17 IMAQ IntegerToColorValue, 22-24 to 22-26 IMAQ ReplaceColorPlane, 22-5 to 22-6 IMAQ RGBTocolor, 22-23 to 22-24 IMAQ SetColorPixelLine, 22-20 to 22-21 IMAQ SetColorPixelValue, 22-17 to 22-18 overview, 22-1 to 22-2 Complex, 21-1 to 21-20 IMAQ ArrayToComplexImage, 21-15 to 21-16 IMAQ ArrayToComplexPlane, 21-17 to 21-18 IMAQ ComplexAdd, 21-8 to 21-9 IMAQ ComplexAttenuate, 21-6 IMAQ ComplexConjugate, 21-5 IMAQ ComplexDivide, 21-12 to 21-14 IMAQ ComplexFlipFrequency, 21-4 to 21-5 IMAQ ComplexImageToArray, 21-14 to 21-15 IMAQ ComplexMultiply, 21-11 to 21-12 IMAQ ComplexPlaneToArray, 21-16 to 21-17 IMAQ ComplexPlaneToImage, 21-18 to 21-19 IMAQ ComplexSubtract, 21-9 to 21-11 IMAQ ComplexTruncate, 21-7 to 21-8 IMAQ FFT, 21-2 to 21-3 IMAQ Vision for G Reference Manual I-16 © National Instruments Corporation Index IMAQ Shift, 20-5 to 20-6 IMAQ Symmetry, 20-7 to 20-8 image-type icons, 9-2 to 9-3 Logic Operators, 15-10 to 15-17 IMAQ And, 15-10 to 15-11 IMAQ Compare, 15-15 to 15-16 IMAQ LogDiff, 15-13 to 15-14 IMAQ Mask, 15-17 IMAQ Or, 15-11 to 15-12 IMAQ Xor, 15-12 to 15-13 Management VIs, 10-1 to 10-7 IMAQ Create, 10-1 to 10-3 IMAQ Create&LockSpace, 10-3 to 10-4 IMAQ Dispose, 10-4 to 10-5 IMAQ Error, 10-5 to 10-6 IMAQ Status, 10-6 to 10-7 Morphology, 18-1 to 18-18 IMAQ Circles, 18-13 to 18-14 IMAQ Convex, 18-12 IMAQ Danielsson, 18-8 IMAQ Distance, 18-7 to 18-8 IMAQ FillHole, 18-10 to 18-11 IMAQ GrayMorphology, 18-5 to 18-7 IMAQ Morphology, 18-3 to 18-5 IMAQ RejectBorder, 18-11 to 18-12 IMAQ RemoveParticle, 18-9 to 18-10 IMAQ Segmentation, 18-14 to 18-15 IMAQ Separation, 18-17 to 18-18 IMAQ Skeleton, 18-15 to 18-16 overview, 18-1 to 18-3 Processing, 16-1 to 16-14 IMAQ AutoBThreshold, 16-4 to 16-5 IMAQ AutoMThreshold, 16-5 to 16-7 IMAQ Equalize, 16-11 to 16-12 IMAQ Label, 16-13 to 16-14 IMAQ MathLookup, 16-8 to 16-10 IMAQ MultiThreshold, 16-2 to 16-4 IMAQ WindToolsSetup, 12-12 to 12-14 IMAQ WindToolsShow, 12-16 to 12-17 IMAQ WindZoom, 12-21 to 12-22 Display (User), 12-29 to 12-34 IMAQ WindUserClose, 12-33 IMAQ WindUserEvent, 12-33 to 12-34 IMAQ WindUserMove, 12-32 IMAQ WindUserSetup, 12-29 to 12-30 IMAQ WindUserShow, 12-31 to 12-32 IMAQ WindUserStatus, 12-30 to 12-31 error clusters, 9-4 to 9-5 External Library Support, 23-1 to 23-11 IMAQ CharPtrToString, 23-6 to 23-7 IMAQ GetImagePixelPtr, 23-1 to 23-5 IMAQ ImageBorderOperation, 23-10 to 23-11 IMAQ ImageBorderSize, 23-11 IMAQ Interlace, 23-9 to 23-10 IMAQ MemPeek, 23-7 to 23-8 File VIs, 11-1 to 11-6 IMAQ GetFileInfo, 11-4 to 11-5 IMAQ ReadFile, 11-1 to 11-4 IMAQ WriteFile, 11-5 to 11-6 Filter, 17-1 to 17-12 IMAQ BuildKernel, 17-5 to 17-6 IMAQ Convolute, 17-2 to 17-3 IMAQ Correlate, 17-11 to 17-12 IMAQ EdgeDetection, 17-6 to 17-7 IMAQ GetKernel, 17-3 to 17-5 IMAQ LowPass, 17-10 to 17-11 IMAQ NthOrder, 17-8 to 17-9 Geometry, 20-1 to 20-8 IMAQ 3DView, 20-1 to 20-4 IMAQ Rotate, 20-4 to 20-5 © National Instruments Corporation I-17 IMAQ Vision for G Reference Manual Index W IMAQ Threshold, 16-1 to 16-2 IMAQ UserLookup, 16-7 to 16-8 Regions of Interest, 12-23 to 12-28 IMAQ MaskToROI, 12-28 IMAQ ROIToMask, 12-27 to 12-28 IMAQ WindEraseROI, 12-26 IMAQ WindGetROI, 12-24 IMAQ WindSetROI, 12-25 to 12-26 Tools (Diverse), 13-24 to 13-32 IMAQ ClipboardToImage, 13-25 IMAQ Draw, 13-26 to 13-27 IMAQ DrawText, 13-27 to 13-30 IMAQ FillImage, 13-31 to 13-32 IMAQ ImageToClipboard, 13-24 to 13-25 IMAQ MagicWand, 13-30 to 13-31 Tools (Image) IMAQ Copy, 13-1 to 13-2 IMAQ Expand, 13-5 to 13-7 IMAQ Extract, 13-4 to 13-5 IMAQ GetCalibration, 13-11 to 13-12 IMAQ GetImageSize, 13-2 IMAQ GetOffset, 13-7 to 13-8 IMAQ ImageToImage, 13-14 to 13-15 IMAQ Resample, 13-10 to 13-11 IMAQ SetCalibration, 13-12 to 13-13 IMAQ SetImageSize, 13-3 IMAQ SetOffset, 13-9 Tools (Pixel), 13-16 to 13-24 IMAQ ArrayToImage, 13-23 to 13-24 IMAQ GetPixelLine, 13-18 IMAQ GetPixelValue, 13-16 IMAQ GetRowCol, 13-19 IMAQ ImageToArray, 13-22 to 13-23 IMAQ SetPixelLine, 13-20 IMAQ SetPixelValue, 13-17 IMAQ SetRowCol, 13-21 to 13-22 IMAQ Vision for G Reference Manual Waddel disk diameter, 8-16 to 8-18 definitions of primary measurements, 8-16 derived measurements (table), 8-17 to 8-18 windows management. See Display VIs. X XOR operator, equation (table), 4-2. See also Logic Operator VIs. I-18 © National Instruments Corporation