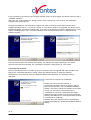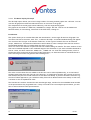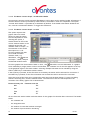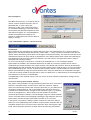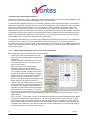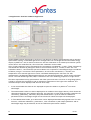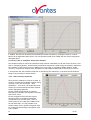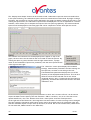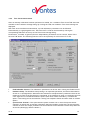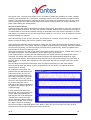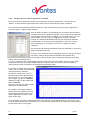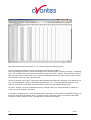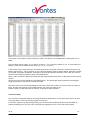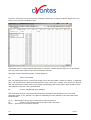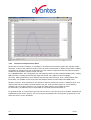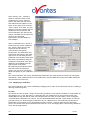
1
AVASOFT for AvaSpec-USB2 version 7.5 USER’S MANUAL December 2009 Sunrise Dec-09 Avantes www.avantes.com [email protected] 0 AVASOFT INSTALLATION 4 0.1 Installation program 4 0.2 Bluetooth installation 6 0.3 Launching the software 10 1 QUICK START: MEASURING AND SAVING A SPECTRUM 11 2 MAIN WINDOW 12 2.1 Menu bar 12 2.2 Button bar 12 2.3 Edit bar 15 2.4 Graphical region 16 2.5 Status bar 17 2.6 Find peaks or valleys by CTRL or SHIFT + left mouse button click 18 3 MENU OPTIONS 19 3.1 File Menu 3.1.1 File Menu: Start New Experiment 3.1.2 File Menu: Load Dark 3.1.3 File Menu: Load Reference 3.1.4 File Menu: Load Experiment 3.1.5 File Menu: Save Dark 3.1.6 File Menu: Save Reference 3.1.7 File Menu: Save Experiment 3.1.8 File Menu: Print 3.1.9 File Menu: Black and White printer 3.1.10 File Menu: Display Saved Graph 3.1.11 File Menu: Display 3D Graph 3.1.12 File Menu: Convert Graph – Include ASCII Header 3.1.13 File Menu: Convert Graph - to ASCII 3.1.14 File Menu: Convert Graph - to ASCII Equi distance 3.1.15 File Menu: Convert Graph - to J-CAMP 3.1.16 File Menu: Convert Graph - to Excel 3.1.17 File Menu: Save Graph to .RTF 3.1.18 File Menu: Exit 19 19 20 20 20 20 20 21 22 24 24 26 30 30 31 32 32 34 34 3.2 Setup Menu 3.2.1 Setup Menu: Hardware 3.2.2 Setup Menu: Wavelength Calibration Coefficients 3.2.3 Setup Menu: Smoothing and Spline 35 35 36 36 Dec-09 Avantes 1 www.avantes.com [email protected] 3.2.4 Setup Menu: Use 16bit ADC in 14bit mode (HW rev 1D and later) 3.2.5 Setup Menu: Correct for Dynamic Dark 3.2.6 Setup Menu: Subtract Saved Dark 3.2.7 Setup Menu: Strobe Enable 3.2.8 Setup Menu: PWM (AvaLight-LED) control 3.2.9 Setup Menu: Options 3.2.9.1 Setup Menu: Options – Check on Saturation 3.2.9.2 Setup Menu: Options – Full Width Half Max 3.2.9.3 Setup Menu: Options - Integrals 3.2.9.4 Setup Menu: Options – Autosave Spectra Periodically 3.2.9.5 Setup Menu: Options - Correct for Drift 3.2.9.6 Setup Menu: Options - Automatic Save Dark by TTL shutter 3.2.9.7 Setup Menu: Options - External Trigger Setting 3.2.9.8 Setup Menu: Options - Auto configure Integration time 3.2.9.9 Setup Menu: Options – Use Custom Reflection Reference 3.2.9.10 Setup Menu: Options – Suppress Save Comments 3.2.9.11 Setup Menu: Options – View Reflectance instead of Transmittance 3.2.9.12 Setup Menu: Options – Battery Voltage Monitoring 3.2.9.13 Setup Menu: Options – Merge Channel Settings 38 38 39 39 39 40 40 42 44 45 46 47 47 48 48 49 49 49 52 3.3 View Menu 3.3.1 View Menu: Scope Mode 3.3.2 View Menu: Absorbance Mode 3.3.3 View Menu: Transmittance/Reflectance Mode 3.3.4 View Menu: Irradiance Mode 3.3.5 View Menu: Change Graph Scale 3.3.6 View Menu: Graphic Reset 3.3.7 View Menu: Autoscale Y-axis 3.3.8 View Menu: Goto Preset Scale 3.3.9 View Menu: Grid Enable 3.3.10 View Menu: Progress Bar Enable 4 61 61 61 61 61 63 63 63 63 64 64 APPLICATIONS 65 4.1 Applications: History Channel Functions 4.1.1 History Application: Function Entry 4.1.2 History Application: Start Measuring 4.1.3 History Application: Display Saved History Graph 65 65 71 72 4.2 Applications: Wavelength Calibration 4.2.1 Calibrate Wavelength Application: Perform New Calibration 4.2.2 Calibrate Wavelength Application: Restore Original Calibration 74 74 75 4.3 Applications: Color Measurement 4.3.1 Color of an Object - Background 4.3.2 Menu option: Color Measurement 4.3.2.1 LABChart 4.3.2.2 Time Series 76 76 77 78 82 4.4 Applications: Absolute Irradiance Application 4.4.1 Background 4.4.2 Quick Start 4.4.3 Load Intensity Calibration 86 87 95 96 2 Avantes Dec-09 www.avantes.com [email protected] 4.4.4 4.4.4.1 4.4.4.2 4.4.5 4.4.5.1 4.4.5.2 4.4.6 4.4.7 4.4.7.1 4.4.7.2 Perform Intensity Calibration Start Intensity Calibration Save Intensity Calibration Irradiance Chart Irradiance Chart Settings Irradiance Chart Display Time Series Measurement Auto Adjust Integrationtime Auto Adjust Integrationtime Settings Measuring with Auto Adjust Integrationtime 97 98 99 100 100 103 107 111 111 112 4.5 Applications: Process Control Application 4.5.1 Digital Output signals 4.5.2 Analog Output signals 4.5.3 Using the Process Control Application in AvaSoft 113 113 113 114 4.6 Applications: Excel Output 4.6.1 Select Source Data 4.6.2 Enable Excel Output 4.6.3 Settings 4.6.4 Start Output 4.6.5 Stop Output 4.6.6 Limitations and Optimization Notes 116 116 116 117 121 121 122 4.7 Applications: Chemometry 4.7.1 Quick Start: How to make concentration measurements with AvaSoft-Chem 4.7.2 Calibration Settings 4.7.2.1 Start New Calibration 4.7.2.2 Modifying a calibration 4.7.3 Enabling the application 123 123 124 124 126 127 4.8 Applications: Laser Induced Breakdown Spectroscopy (AvaSpec-2048/2048L/3648*) 4.8.1 Libs Settings 4.8.2 Enabling and running the application 129 130 132 4.9 Applications: Store To Ram 4.9.1 Introduction 4.9.2 Quick Start 4.9.3 Main Window 133 133 135 135 5 HELP APPENDIX A 138 TROUBLESHOOTING 140 How to rectify an incorrect (USB) installation APPENDIX B ERROR MESSAGES 141 Dec-09 Avantes 140 3 www.avantes.com [email protected] 0 AvaSoft Installation Before you connect the AvaSpec spectrometer to the USB port of your computer, you need to install the AvaSoft software first. AVASOFT version 7 is a 32-bit application and can be installed under the following operating systems: • Windows 95/98/Me • Windows NT/2000 • XP/Vista/Windows7 x32 (32-bit O/S) • XP/Vista/Windows7 x64 (64-bit O/S) If the operating system is Windows 95 or Windows NT4.0, use a standard RS-232 cable (with male and female DB-9 connectors) to connect the AvaSpec to the serial port of the computer. 0.1 Installation program With each new spectrometer system, an AVANTES PRODUCT CD-ROM is included. One of the options in the main menu which is shown after the CD-ROM is inserted in the CD-ROM drive, is to install AvaSoft software. After selecting this option, a submenu is displayed in which the spectrometer configuration can be selected. The AvaSpec-USB2 group of spectrometers should be selected to install AvaSoft7 for one of the following spectrometer types: AvaSpec-102/128/256/1024/2048/2048L/2048x14/3648/NIR256-USB2. Instructions below are for the AvaSpec-USB2 spectrometers, -Bluetooth® instructions are found in section 0.2. Installation Dialogs The setup program will check the system configuration of the computer. If no problems are detected, the first dialog is the “Welcome” dialog with some general information. In the next dialog, the destination directory for the AvaSoft software can be changed. The default destination directory is C:\AVASOFT7USB2. If you want to install the software to a different directory, click the Browse button, select a new directory and click OK. If the specified directory does not exist, it will be created. 4 Avantes Dec-09 www.avantes.com [email protected] In the next dialog, the name for the program manager group can be changed. The default name for this is “AVANTES Software”. After this, the “Start Installation” dialog is shown. After clicking the “next” button, the installation program starts installing files. During this installation, the installation program will check if the most recent USB driver has been installed already at the PC. If no driver is found, or if the driver needs to be upgraded, the Device Driver Installation Wizard is launched automatically, click Next. If the Operating System is Windows Vista, it will display a message that it can’t verify the publisher of the driver software, select “Install this driver software anyway”. After the drivers have been installed successfully, the dialog at the right is displayed, click Finish. After all files have been installed, the “Installation Complete” dialog shows up. Click Finish. Connecting the hardware Connect the USB connector to a USB port on your computer with the supplied USB cable. Windows will display the “Found New Hardware” dialog. Select the (default) option to install the software automatically, and click next. After the Hardware Wizard has completed, the following dialog is displayed: Click Finish to complete the installation. Please note that if the spectrometer is Connected to another USB port to which it has not been connected before, the “Found New Hardware Wizard” will need to install the software for this port as well. For this reason, this Wizard will run “NrOfChannel” times for a multichannel AvaSpecUSB2 spectrometer system. This, because inside the housing, the USB ports for each spectrometer channel is connected to a USB-Hub. Windows Vista will install the driver automatically, without displaying the “Found New Hardware Wizard” dialogs Dec-09 Avantes 5 www.avantes.com [email protected] 0.2 Bluetooth installation The AvaSpec spectrometers with Bluetooth® wireless data transfer support are shipped with a Bluesoleil BS001 USB dongle. The Bluetooth® drivers can be installed from the Avantes product CD-ROM. This section describes how to setup Bluetooth® data communication with the AvaSpec-BT spectrometer. Install AvaSoft for USB2 spectrometers from the Avantes Product CD-ROM Insert the Avantes Product CD-ROM in the CD drive of your PC, select “Software Installation” and install AvaSoft. Install Bluetooth® drivers The option to install the Bluesoleil Bluetooth Drivers can also be found in the “Software Installation” section of the Avantes Product CD-ROM. Click this option to install the Bluetooth drivers for the BS001 USB dongle. After the installation has been completed you will be asked to restart the computer. After the restart, insert the BS001 USB dongle. The “Bluetooth Places” Window in the figure below can be opened by double clicking the bluetooth icon at the desktop. In this window, go to the Bluetooth menu and select “Display Classic View” A shortcut to setup the Classic View is to right click the Bluetooth icon in the taskbar which shows the same option 6 Avantes Dec-09 www.avantes.com [email protected] Connect the 12 VDC external power supply or batterypack to the AvaSpec-BT First make sure that the Batterypack is completely charged, if not connect the batterypack to the charger and let it charge until the LED on the charger starts to flicker (trickle-charge mode). Now connect the batterypack to the AvaSpec-BT and switch on the batterypack (switch on the frontside) and switch on the AvaSpec-BT to external power. In the Classic View, the AvaSpec will initially be displayed as a Bluetooth Device. The icon is a question mark. By double clicking the question mark icon, the serial port icon will be high lighted: Dec-09 Avantes 7 www.avantes.com [email protected] By double clicking the Serial Port icon, the connection will be established and a virtual serial port number will be assigned: This serial port number (COM21 in this example) will be needed later on in AvaSoft. The color of the Bluetooth Device icon changes to green, and a dotted line with moving red dot between the PC (yellow bowl in the center) and the Bluetooth Device (AvaSpec) illustrates that the connection has been established successfully 8 Avantes Dec-09 www.avantes.com [email protected] Starting AvaSoft AvaSoft can be started after data communication has been established. The first time that AvaSoft is started for the Bluetooth spectrometer, it will show the dialog below. Click the option: “Retry to establish communication through RS-232 or Bluetooth”. A list with available comports will be displayed. In our example, COM21 has been selected for the Bluetooth® data communication. Select the right COM port from the list and click OK. AvaSoft will now read the configuration data from the spectrometer (this can take about 15 seconds), after which measurements can be started. Dec-09 Avantes 9 www.avantes.com [email protected] 0.3 Launching the software AvaSoft can be started from Windows Start Menu. Under Start-programs, the group “AVANTES Software” has been added. This group contains two icons. With the red “V” icon, AvaSoft is started. The AvaSoft Help icon can be used to activate the AvaSoft helpfiles (these helpfiles can also be activated from the Help menu after starting AvaSoft). After starting the AvaSoft 7 software, all connected spectrometers will be recognized automatically. The number of detected spectrometers and their status will be displayed in the welcome dialog. After a few seconds, the main window will be displayed and the spectrometer names (default serialnr) will appear in the legend at the right hand of the screen. More detailed information about the spectrometer(s) is shown after clicking the menu option Setup-Hardware. In this dialog, a user defined name can be defined for each spectrometer. After clicking the start button, the spectra for all connected spectrometers will be displayed in the main window. After clicking the OK button, the main window is displayed. Refer to section 2 for a description about the main window components. A “Quick Start” can be found in section 1, if you want to start measuring immediately. Detailed information about the menu options is found in section 3. Depending on the AvaSoft version (Basic or Full) and the extra add-on modules that were ordered for your spectrometer, up to nine applications are available in AvaSoft, which are described in sections 4.1 to 4.9: • History (standard in AvaSoft FULL) • Wavelength Calibration (standard in AvaSoft FULL) • Color Measurement (add-on module) • Irradiance Measurement (add-on module) • Process Control (add-on module) • Excel Output (add-on module) • Chemometry (add-on module) • Laser Induced Breakdown Spectroscopy (LIBS, standard in AvaSoft FULL) • Store to RAM (standard in AvaSoft FULL) 10 Avantes Dec-09 www.avantes.com [email protected] 1 Quick Start: Measuring and saving a spectrum 1. After starting AvaSoft, the green Start button needs to be clicked to start measuring. 2. Connect a fiber or probe to the light source and to the spectrometer input port(s) and set up the experiment for taking a reference spectrum. 3. Optimal smoothing is preset and stored on board in the EEPROM. 4. Now turn on the light source. Usually some sort of spectrum may be seen on the screen, but it is possible that too much or too little light reaches the spectrometer at the present data collection settings. Too much light means that, over a certain wavelength range, the signal is saturated shown as a straight line at the maximum counts and the appearance of the label “saturated” in the statusbar of the spectrometer channel. This can usually be solved by a shorter integration time. The integration time can be changed in the main window, in the white box below the start/stop button or the Autoconfigure Integration time button can be used (see 2.1). The new integration time can be entered in the box, and will take effect once you press the ‘Enter’ key or leave the box. Try to adjust the integration time, such that the maximum count over the wavelength range is around 90% of the full ADC scale (14750 counts for the 14bit ADC, 59000 counts for the 16bit ADC). When at minimum integration the signal is still too high, an attenuator, a neutral density filter or fibers with a smaller diameter may be used. When not enough light reaches the spectrometer, likewise a longer integration time should be entered. 5. When a good spectrum is displayed, turn off the light source. 6. Now save the Dark data. This is be done by File-Save-Dark from the menu or by clicking the black square on the left top of the screen with the mouse. Always use Save Dark after the integration time has been changed. 7. Turn on the light source again. Save the present spectrum as a reference by choosing File SaveReference from the menu or by clicking at the white square (next to the black one). Always use Save Reference after the integration time has been changed. Now the Transmittance/reflectance (T/R button) or Absorbance (A button) spectra can be obtained online. To have a better look at the amplitude versus wavelength, the cursor button can be clicked. A vertical line is displayed in the graph. If the mouse cursor is placed nearby this line, the shape of the mouse cursor changes from an arrow to a ‘drag’ shape. If this shape is displayed, the left mouse button can be used to drag (keep left mouse button down) the line with the mouse towards a new position. Moving this line shows the corresponding values of wavelength and amplitude in the main screen. By clicking the red stop button, the data acquisition is stopped and the last acquired spectrum is shown in static mode. The data acquisition can be started again by clicking the same button, which now shows a green ‘Start’. 8. To save the spectrum (in the mode chosen before), choose File-Save-Experiment from the menu, or click the Save Experiment button from the button bar. 9. To improve the Signal/Noise ratio, a number of spectra may be averaged. To do this, the value in the white average box in the main window (next to integration time) can be increased. The new value will take effect when you press the ‘Enter’ key or leave the box. Dec-09 Avantes 11 www.avantes.com [email protected] 2 Main Window 2.1 Menu bar The menus and submenus are described in section 3. 2.2 Button bar Start/Stop button The Start/Stop button can be used to display data real-time or to take a snapshot Cursor button After clicking the cursor button, a vertical line is displayed in the graph. If the mouse cursor is placed nearby this line, the shape of the mouse cursor changes from an arrow to a ‘drag’ shape. If this shape is displayed, the left mouse button can be used to drag (keep left mouse button down) the line with the mouse towards a new position. Moving this line shows the corresponding values of wavelength and amplitude in the main screen. As an alternative for dragging the line, the small step and big step arrow buttons may be used, or the left and right arrow keys on the keyboard. The step size for the arrow buttons can be changed by holding down the CTRL-key while clicking at a (single or double) arrow button. Save reference and dark buttons The reference button is the white button at the left top of the screen. It needs to be clicked to save the reference data. The same result can be achieved with the option File-Save Reference. The dark button is the black button at the left top of the screen. It needs to be clicked to save the dark data. The same result can be achieved with the option File-Save Dark. 12 Avantes Dec-09 www.avantes.com [email protected] Save experiment button By clicking the Save Experiment button an experiment is saved. The same result can be achieved with the option File-Save Experiment. Print button By clicking the Print button a graph that is displayed on the monitor will be printed. The same result can be achieved with the option File-Print. Scope button By clicking the S button, the data will be presented in Scope Mode. The same result can be achieved with the option View-Scope Mode. Absorbance button By clicking the A button, the data will be presented in Absorbance Mode. The same result can be achieved with the option View-Absorbance Mode. Transmission button By clicking the T button, the data will be presented in Transmittance Mode. The same result can be achieved with the option View-Transmittance Mode. Irradiance button By clicking the I button, the data will be presented in Irradiance Mode. The same result can be achieved with the option View-Irradiance Mode. Dec-09 Avantes 13 www.avantes.com [email protected] Autoscale Y-axis button By clicking this button, the graph will be rescaled on-line. A maximum signal will be shown at about 75% of the vertical scale. The same result can be achieved with the option View-Autoscale Y-axis Change Graph Scale button By clicking this button, a dialog will be shown in which the range can be changed for both X- and Y-axis. This range can be saved as well and restored any time by clicking the Goto Preset Scale button (see below). The menu option with the same functionality is View-Change Graph Scale. Goto Preset Scale button By clicking this button, the scale for X- and Y-axis will be set to a range that has been set before. The same result can be achieved with the menu option View-Goto Preset Scale Graphic Reset button By clicking this button, the X- and Y-axis will be reset to their default values. The same result can be achieved with the option View-Graphic Reset Auto Configure Integration time button After this button is clicked, AvaSoft starts searching for an optimal integration time. Depending on the maximum counts in the last scan, the integration time will be increased/decreased automatically until a scope signal of about 90% of the full scale is measured. During the search routine, the changes in integration time can be followed in the integration time edit box in the edit bar. A dialog will display the new integration time if the search is ready. The routine can be aborted by clicking the button again before the search has ended. H.C.F. button The History Channel Function button allows you to switch directly to the history channel function screen to start measuring immediately. Of course first the functions need to be defined. 14 Avantes Dec-09 www.avantes.com [email protected] The two buttons below are available only if AvaSoft has been ordered together with the color application add-on: Color Chart button The Color Chart button allows you to switch directly to the Color Chart screen and starts measuring immediately. Color of Object versus Time button The Color of Object versus time button allows you to switch directly to the time measurement of color parameters and starts measuring immediately. 2.3 Edit bar -single channel -multi channel The edit bar shows the following parameters: Integration time[ms] This option changes the CCD readout frequency and therefore the exposure- or integration time of the CCD detector. The longer the integration time, the more light is exposed to the detector during a single scan, so the higher the signal. If the integration time is set too long, too much light reaches the detector. The result is that, over some wavelength range, the signal extends the maximum counts (65535 for the 16bit ADC, 16383 for the 14bit ADC) or in extreme case shows as a straight line at any arbitrary height, even near zero. Entering a shorter integration time can usually solve this. Try to adjust the integration time, such that the maximum count over the wavelength range is around 90% of the full ADC scale (14750 counts for the 14bit ADC, 59000 counts for the 16bit ADC). When at minimum integration the signal is still too high, an attenuator, a neutral density filter or fibers with a smaller diameter may be used. When not enough light reaches the spectrometer, likewise a longer integration time should be entered. It’s also possible to let AvaSoft search for a good integration time by clicking the ‘∫AC’ button, or by using the menu option Setup-Options-Auto Configure Integration time. If measurements are done in a mode in which reference and dark data are required (all modes except Scope mode), then new reference and dark spectra need to be saved after the integration time has been changed. Average With this option, the number of scans to average can be set. A spectrum will be displayed after every # scans. This spectrum is the average of the # scans. Dec-09 Avantes 15 www.avantes.com [email protected] Wavelength [nm] The wavelength shows the position of the cursor, which becomes visible if the cursor button is down. The amplitude of the signal, which is given in the statusbar at the bottom of the main window, is the amplitude at the wavelength shown in this field. Multichannel only For multichannel spectrometers the integration time and averaging can be set for all channels at the same value by clicking to All. If the dashed box is clicked, different integration time and averaging can be set per channel . 2.4 Graphical region The graphical region displays the data in an XY-diagram, with at the X-axis the wavelength in nanometers, and at the Y-axis the detector counts. After loading or saving a reference and dark spectrum, other units can be selected at the Y-axis: Absorbance Units, Percentage Transmittance, or Relative Irradiance. Display saved Graph and Line style editor By clicking on the legend with the right mouse button, multiple spectra, that were saved earlier can be displayed. New in AvaSoft 7 is that displayed graphs can be deleted or properties of the displayed graphs, such as line style or color or comments can be changed. This is done by clicking with the right mouse button on the line in the graphical display. A small line edit box will appear. Now the line can be deactivated or the line properties can be changed as depicted in the border editor or the comments can be edited. 16 Avantes Dec-09 www.avantes.com [email protected] Zoom features Zoom in: select a region to be expanded to the full graph. To select this region, click the left mouse button in the white graphical region and drag it downwards and to the right. After releasing the left mouse button within the graphic display, both the X- and Y-axis will be rescaled to the new values of the selected region. Zoom out: drag with the left mouse button within the white rectangle, but in stead of dragging the mouse downwards and to the right, drag it in another direction. After releasing the mouse button, both the Xand Y-axis will be reset to their default values. Move X-Y: dragging with the right mouse button results in moving the complete spectrum up or down and to the left or right. Move-Y: if a mouse-wheel is available on the mouse being used, then the spectrum can be moved up or down by moving the mouse wheel. 2.5 Status bar For each selected spectrometer channel, a statusbar at the bottom of the main window shows the name label of the connected spectrometer channel, the file to which the data will be saved, amplitude at current wavelength, the current settings for the smoothing and spline parameters, the line color and style in the graphical display, the real integration time and averages per channel and final the number of scans taken since the start button was clicked. The field at the right is used to indicate that the spectrometer is receiving too much light at a certain wavelength range (=16383 counts with the spectrometer boards rev 1B and rev 1C and 65535 counts for the spectrometer boards rev 1D and later. These ADC counts are before correcting for dynamic dark, smoothing or averaging), in which case the label “saturated” will become visible. Dec-09 Avantes 17 www.avantes.com [email protected] 2.6 Find peaks or valleys by CTRL or SHIFT + left mouse button click This option can be used in all modes (Scope, Absorbance, Transmittance or Irradiance) and for all displayed graphics. When the left mouse button is clicked in the graphical region, while the CTRL key is down, AvaSoft will follow the following procedure to run to the closest peak: 1. The wavelength is determined from the position the mouse click occurred. 2. The data from closest pixel is retrieved 3. The direction to search for the peak is determined from the neighbor pixels. If both neighbor pixels have a lower value at the Y-axis than the current pixel, the current pixel is already a peak. If only one of the neighbor pixel values is higher than the current pixel value, the peak will be searched in the direction of this higher pixel. If both neighbor pixels have a higher value at the Y-axis than the current pixel, the current pixel is in a valley. The peak will in this case be searched in the direction of this neighbor pixel with the highest value. 4. The cursor starts moving in the direction, as determined under 3), until it reaches a pixel of which the value is not higher than the last one evaluated. At this pixel the cursor stops. By holding down the SHIFT key instead of the CTRL key, the same procedure will be used to move to the closest valley. If more than one spectrum is being displayed, a dialog, as shown at the right, pops up in which the spectrum for which the peakfinder needs to be activated can be selected out of all displayed spectra. 18 Avantes Dec-09 www.avantes.com [email protected] 3 Menu Options In sections 3.1 to 3.3 the main menu options (File, Setup and View Menu) and their submenu's are described in detail. 3.1 File Menu 3.1.1 File Menu: Start New Experiment After selecting this option, a dialog box appears in which a new experiment name can be entered. The experiment name will be saved as a filename with the extension *.kon. This extension does not need to be entered. After clicking the save button, the current filename will be built up from the experiment name that has been entered, and a sequence number, starting at 0001. Example: if the experiment name is “test”, the first graphic file that will be saved in scope mode, will be called test0001.ROH, the sequence number will be automatically incremented, so the next file that will be saved in scope mode will be called test0002.ROH etc. For detailed information on graphic filenames, see File-Save Experiment. Note that the dialog allows you to select different folders or drives to save the experiments to, as well as creating a new folder name for the new experiment. For USB2 platform the default directory is “data”. After closing the dialog box by clicking the save button, the new experiment name, followed by its sequence number, is displayed in the lower left of the status bar. By clicking the cancel button, the old experiment name will be restored. Dec-09 Avantes 19 www.avantes.com [email protected] 3.1.2 File Menu: Load Dark With this option, dark data can be loaded, that have been saved before. If AvaSoft is in static mode, the dark data that will be loaded are shown on the screen first. 3.1.3 File Menu: Load Reference With this option, reference data can be loaded, that have been saved before. If AvaSoft is in static mode, the reference data that will be loaded are shown on the screen first. 3.1.4 File Menu: Load Experiment With this option, an experiment can be loaded, that has been used before. This way more spectra can be saved to an existing experiment. An experiment name has the file extension "*.kon". After choosing this option, a dialog box shows all experiments that were saved earlier in the current experiment directory. If the experiment name that needs to be loaded is in this directory, select it and click the save button. If the experiment name that needs to be loaded is in another drive and/or directory, move to this directory by clicking the behind the current foldername. For detailed information on graphic filenames, see File-Save Experiment. 3.1.5 File Menu: Save Dark With this option, dark data are saved. The name of the dark data file is "serialnr.drk". The dark data files will be saved in the experiment directory that has been picked by the option File-LoadExperiment or File-Start New-Experiment. 3.1.6 File Menu: Save Reference With this option, reference data are saved. The name of the reference data file is "serialnr.ref". The reference data files will be saved in the experiment directory that has been picked by the option FileLoad-Experiment or File-Start New-Experiment 20 Avantes Dec-09 www.avantes.com [email protected] 3.1.7 File Menu: Save Experiment With this option, spectral data is saved. All graphic files will be saved in the experiment directory that has been picked by the option File-Load-Experiment or File-Start New-Experiment. Saving graphic files if one spectrometer channel is enabled First, a window appears in which a line of comments can be entered to the saved graph. Next, two files will be saved: the first file contains the saved spectrum data. The name of this first file starts with the experiment name, directly followed by the sequence number of the saved spectrum. The extension of this first file depends on the current measuring mode, as shown below: Extension Mode ROH Scope Mode ABS Absorbance TRM Transmittance/Reflectance IRR Irradiance The second file contains the line of comments, which may have been added to this graph. The name of this second file is, except for the extension, the same as the name of the first file (experiment name and sequence number). The extension of this second file also depends on the measuring mode, as shown below: Extension Mode RCM Scope Mode ACM Absorbance TCM Transmittance/Reflectance ICM Irradiance Example: suppose the name of our experiment is "avantes". Then, saving one spectrum in scope mode, one in absorbance mode and two in transmittance mode results in the following files: avantes0001.roh: spectrum data in scope mode avantes0001.rcm: comments for the spectrum saved in avantes0001.roh avantes0001.abs: spectrum data in absorbance mode avantes0001.acm: comments for the spectrum saved in avantes0001.abs avantes0001.trm: spectrum transmittance mode avantes0001.tcm: comments for the spectrum saved in avantes0001.trm avantes0002.trm: spectrum data in transmittance mode avantes0002.tcm: comments for the spectrum saved in avantes0002.trm Dec-09 Avantes 21 www.avantes.com [email protected] After leaving the application and opening AvaSoft the next time, saving graphics in scope, absorbance and transmittance mode, will then result in respectively the data-files avantes0002.roh, avantes0002.abs and avantes0003.trm, as well as the comment files avantes0002.rcm, avantes0002.acm and avantes0003.tcm. Before saving, the name of the graphic file is displayed in the statusbar at the bottom of the screen. After saving, the sequence number is automatically incremented by one. Saving graphic files if multiple spectrometer channels have been enabled If graphic files are saved while more than one channel is viewed at the same time (see option ViewChannel), then the graphic filename for each channel that is displayed gets a different sequence number. For example, the result of saving one experiment in triple view mode is three graphic data files and three comment files, for instance: avantes0002.roh: spectrum data in scope mode (e.g. spectrometer 1 or Master Channel) avantes0003.roh: spectrum data in scope mode (e.g. spectrometer 2 or Slave1 Channel) avantes0004.roh: spectrum data in scope mode (e.g. spectrometer 3 or Slave2 Channel) avantes0002.rcm: comments for the spectrum saved in avantes0002.roh avantes0003.rcm: comments for the spectrum saved in avantes0003.roh avantes0004.rcm: comments for the spectrum saved in avantes0004.roh For each channel a different comment line can be entered. To make it easier to select the graphic files later on with the option File-Display Saved Graph, all comment lines start with a short name for the channel at which the graph has been saved: M for Master, S1 for Slave1 and so on. After saving, the sequence numbers in this example (triple view mode) will automatically have been increased to 0005, 0006 and 0007, for resp. Master, Slave1 and Slave2. Starting with version 7.4, the spectra from multiple spectrometer channels with consecutive wavelength ranges can (under certain conditions) be merged and saved to one file. Consult section 3.2.9.13 for details. 3.1.8 File Menu: Print After selecting the print menu option, the background colors in the graphical region will become white. If the menu option “Black and White printer” (see next section) has been marked, the line style for the spectra will also change from colored to black. A dialog will be shown in which the title for the printout can be entered. In the next window, the printer settings can be changed (e.g. portrait or landscape printing, printing quality etc.). After clicking OK in the printer settings dialog, the graph will be printed, and the original graph colors will be restored on the 22 Avantes Dec-09 www.avantes.com [email protected] monitor. Dec-09 Avantes 23 www.avantes.com [email protected] 3.1.9 File Menu: Black and White printer The default setting in AvaSoft is to print the spectra in the same color as they appear on the monitor. However, if a color printer is not available, the menu option “Black and White printer” can be enabled. If this option is enabled, different line styles will be printed if more than one spectrum is displayed, e.g. dash-dash, dot-dot, dash-dot. To enable this option, click the menu option and a checkmark appears in front of it. 3.1.10 File Menu: Display Saved Graph This option requires that graphic files were saved earlier by using the option File-Save Experiment. After choosing this option, a window shows all files in the current measure mode. In the example at the right, the measure mode is “scope”, so the extension of the earlier saved spectra is *.roh. To select graphic files that were saved in another measure mode, e.g. absorbance, click behind the Graph - …Mode, and pick the desired measure mode. To select graphic files from another folder or drive, click behind the current foldername. If a graphic file is marked by a (single) mouse click on the filename, the comment line for this file appears at the top of the graphical region in the main window. Selecting multiple filenames can be realized by using the CTRL or SHIFT key in combination with the mouse. If the CTRL key is pressed, all the files that are clicked by the mouse will be selected for displaying. If the SHIFT key is pressed, all the files in between two clicked files will be selected for displaying. Select the name of the file(s) to be displayed and click the Open button. To leave this dialog without displaying graphic files, click the CANCEL button. 24 Avantes Dec-09 www.avantes.com [email protected] In the figure at the right, two graphic files were selected in scope mode. The comments that were saved with these graphs are displayed at the top of the graphical region, together with information about amplitude at current wavelength (amp), integration time (it) and smoothing (s) settings at the moment that the file was saved and the name of the graphic file. If the active spectrometer channels (e.g. Master) have not been unselected with the View Channel option, the actual data for the activated channel(s) will be displayed in the same graph as the selected graphic files. By clicking the green start button, the online measurements can be compared directly to the graphics that were saved before. New in AvaSoft 7 is that displayed graphs can be deleted or properties of the displayed graphs, such as line style or color or comments can be changed. This is done by clicking with the right mouse button on the line in the graphical display. A small line edit box will appear. Now the line can be deactivated or the line properties can be changed as depicted in the border editor or the comments can be edited. The menu option File-Display Saved Graph is preceded by a checkmark as long as the earlier saved graphics are displayed. To clear these earlier saved graphics, select again the menu option File-Display Saved Graph, after which the checkmark disappears, and only the spectra for the active spectrometer channel(s) will be displayed. Starting with version 7.4, so-called merged files can be displayed. These contain spectra from multiple channels, combined in a single graph. Consult section 3.2.9.13 for details. Dec-09 Avantes 25 www.avantes.com [email protected] 3.1.11 File Menu: Display 3D Graph The 3D Graph option allows you to load a large number of existing AvaSoft graphs into a 3D view. You can view the 3D graph from different sides and zoom in on a section of the graph. The manipulation of the 3D graph is done indirectly, with two separate 2D graphs. The graphs can be saved as 3 JPEG files, embedded in a single .RTF file. This file can be loaded into Microsoft Word, for text editing, extraction of the JPEG files, resizing etc. Introduction This option allows you to visualize data that was saved earlier, with a single 3D and two 2D graphs. You can select the files in the menu, with ‘File’, ‘Load into 3D Graph’. A standard windows dialog will appear. You can select the file type in the bottom combo box, all four types of AvaSoft files can be selected (Scope, Absorbance, Transmittance/Reflectance and Irradiance). Select multiple files with the mouse in the standard Windows way, by holding down the Shift or Ctrl key. There is a limit to the amount of input files that the windows dialog can handle. The exact number of files that can be handled depends on the combined length of the filenames. If you want to handle thousands of files at a time, use short names like ‘a00001.roh’, ‘a00002.roh’ etc. With this naming scheme, which is the shortest that can be used in the Store To Ram application, we have been able to read 2520 files at a time. Selecting more files will generate the following error: The order in which these files are added to the 3D view can be either alphabetically, or on the basis of the date/time stamp that each file has in the directory. A complication with the last criterion is the fact that windows only has a 2 second resolution in this date/time stamp. If you have saved the files with e.g. the Store To Ram application, you could have many files with an identical date/time stamp. In that case, it is better to use an alphabetical order. The files that are read are checked for their wavelength range, and also for the embedded serial number of the spectrometer they originated from. If they are found to be from multiple spectrometers, you will have to select between these spectrometers. 26 Avantes Dec-09 www.avantes.com [email protected] You cannot display spectra from multiple spectrometers in the same 3D graph. The handling of the graphs is patterned after the one in the Store To Ram application: The view of the 3D graph can be adjusted by inverting the Depth axis and the X axis. These axes can also be transposed, which enables a side view of the graph. The Y axis is auto scaled by default, this can be undone by unchecking the option in the ‘Adjust View’ box. The 2D graphs both have a scrollbar, which allows you to change the third dimension. It is also possible to display the position of each 2D graph in the 3D graph by displaying a separate highlighted line that sections the 3D graph. This feature is turned on and off with the ‘3D’ checkbox at the top-right position of each 2D graph. The amount of data in the 3D graph and the second 2D graph (Counts vs. Measurement #) has been limited to prevent computer overload. If more data is present, only one out a calculated number of scans or pixels is shown. Zooming the graphs will reveal more detail. The fraction of the data that is shown is indicated in the title of the relevant axis. E.g. ‘Measurement # (1/10)’ means that only one out of every 10 scans is shown. Note that the first 2D graph (Counts vs. Wavelength) always shows all of the data present. It is therefore possible to show this graph as a highlighted line in the 3D graph that shows more detail than the 3D graph itself shows. Zooming in will show more detail in the 3D graph, which will eventually correct the discrepancy. The 3D graph does not allow direct manipulation with the mouse. You can zoom both 2D graphs and the 3D graph will zoom to the selected range. The selected range will then also be shown in the manual selection boxes described below. Unzooming the 2D graphs will also unzoom the 3D graph. Note that zooming and unzooming the 2D graphs is performed the same way as in the main screen of AvaSoft: You zoom the graph by clicking the top-left corner of your area to select, hold down the left mouse button, then draw a rectangle and release the mouse button at the lower-right corner of the area to select. You unzoom the graph by clicking anywhere on the graph, hold down the left mouse button, then drag a rectangle towards the top and left and release the mouse button at any position. You can pan the 2D graphs by holding down the right mouse button. It is also possible to manually select the ranges by entering values in the ‘Select Measurement # Range’, ‘Select Wavelength Range’ and ‘Select Counts Range’ boxes, and pressing the ‘Zoom’ button. Note that changing the ‘Select Counts Range’ will only have an effect if the ‘Autoscale Y-axis’ option is unchecked. The ‘Unzoom’ button will undo all your changes. You can save the graphs to disk by pressing the ‘Save Graphs’ button. You can first enter a comment line, which will be included on the page. Next, you can enter the filename that will be used to save the graphs. The three graphs will be saved in JPEG format, embedded in a single, one page .RTF file. You can open this file with Microsoft Word, edit it, extract the graphs, change the size of the graphs, etc. Dec-09 Avantes 27 www.avantes.com [email protected] Quick Start 1. 2. 3. 4. 5. Select the input file sort order in the upper right corner. Select ‘File’, ‘Load into 3D Graph’ in the menu. Select the files to show in the standard Windows dialog. Inspect the data by zooming the 2D graphs with your mouse. Scroll the 2D graphs with their scrollbars, see where the line is located in the 3D graph by selecting the 3D checkbox in either 2D graph. The data that is changed when scrolling the 2D graphs with their respective scrollbars is also shown in the boxes to the right of each 2D graph. Save the graphs by pressing the ‘Save Graphs’ button in the upper right corner. Main Window The upper right of the window is used to select the Input File Sort Order, to adjust the view of the 3D graph, and to manually make a selection from the scans. The Input File Sort Order selects the way the input files selected from the input dialog are sorted. You can select between alphabetical sort order and file date/time sort order. Windows only offers a resolution of 2 seconds in the file date/time stamp. Especially when you save files with the Store To Ram application, many files will have an identical date/time stamp. Be sure to select alphabetical order in that case. The Adjust View checkboxes allow viewing the 3D graph from all sides. The Autoscale Y axis button is checked by default. Unselecting it will only yield a satisfactory image if the Y range is positioned at an edge of the graph, otherwise there will be other readings filling the entire screen behind the selected lines. Manually change the scan selections by changing the values in the ‘Select Range’ fields and pressing the ‘Zoom’ button. ‘Unzoom’ will undo any change made. Note that manually changing the ‘Select Count Range’ will only have an effect if the ‘Autoscale Y Axis’ box is unchecked. The 2D graphs each have a scrollbar that changes the respective third dimension. The position of the scrollbar is reflected in the boxes to the right of each 2D graph. Change the scrollbar in the standard Windows ways: Clicking the arrows will cause a change of a single unit, clicking between the arrows and the thumb will change 10 units, dragging the thumb will select a new position in the readings relative to the position of the thumb. You can also use the keyboard to change the scrollbar, the Up and Down keys will give a single unit change, the PageUp and PageDown keys will give a change of 10 units, the Home and End keys will move to the first and last reading. Checking the 3D boxes in the upper right corner of each graph will show the graph as a highlighted line in the 3D graph. 28 Avantes Dec-09 www.avantes.com [email protected] The Measurement # axis of the right 2D graph has a maximum number of points. If this is exceeded, only one out of a calculated number of points will be shown. This ratio is added to the title of the axis, e.g. ‘Measurement # (1/10)’ means that only one out of 10 points is shown. In this case, zooming the right 2D graph will reveal more detail. Zooming the 2D graphs with the mouse can also be used to select a wavelength and measurement # range. The selection will also be shown in the 3D graph. Zooming and Unzooming is done in the regular AvaSoft way. You can also pan the graph by dragging the mouse while holding the right mouse key down. This has no effect on the 3D graph. The 3D graph cannot be manipulated directly. It is redrawn after the 2D graphs are zoomed, or after the ranges are manually changed, and the ‘Zoom’ button is pressed. The view of the graph can be changed in a basic number of ways, to allow a view of all sides. A highlighted line can be shown in the 3D graph for both 2D lines. Dec-09 Avantes 29 www.avantes.com [email protected] 3.1.12 File Menu: Convert Graph – Include ASCII Header Converting the spectra to ASCII and ASCII-Equidistance can be done with or without header information. If the ASCII files are further processed by other software, the header is often not compatible. The option “Include ASCII Header” is preceded by a checkmark by default. If the header information should be left out, click the “Include ASCII Header” to toggle the checkmark. 3.1.13 File Menu: Convert Graph - to ASCII This option requires that graphic files were saved earlier by using the option File-Save Experiment. After choosing this option, a window shows all files in the current measure mode. In the example at the right, the measure mode is “scope”, so the extension of the earlier saved spectra is *.roh. To select graphic files that were saved in another measure mode, e.g. absorbance, click behind the Graph - …Mode, and pick the desired measure mode. behind the current foldername. If a graphic To select graphic files from another folder or drive, click file is marked by a (single) mouse click on the filename, the comment line for this file appears at the top of the graphical region in the main window. Selecting multiple filenames can be realized by using the CTRL or SHIFT key in combination with the mouse. If the CTRL key is pressed, all the files that are clicked by the mouse will be selected for conversion. If the SHIFT key is pressed, all the files in between two clicked files will be selected for conversion. Select the name of the file(s) to be converted to ASCII and click the Open button. To leave this dialog without converting files, click the CANCEL button. The extension of the text files depends on the extension of the binary graphic file as shown below: Extension binary file Extension text-file ROH TRT ABS TAT TRM TTT IRR TIT All text files start with a header with information for the graphic file that has been converted. The header shows: - the comment line - the integration time - the number of scans that has been averaged - the number of pixels used for smoothing 30 Avantes Dec-09 www.avantes.com [email protected] - the serial number of the spectrometer that was used to save the data The data in a *.TRT file is given in two columns. The first column gives the wavelength in nanometers, the second one the scope data. The data in the *.TAT, *.TTT files is presented in five columns. The first column gives the wavelength in nanometers. The second to fourth column give respectively the dark, reference and scope data. The fifth column shows the calculated value for absorbance (in a *.TAT file) or transmittance (in a *.TTT file). The format for the irradiance text files (*.TIT) depends on the availability of AvaSoft-IRRAD. The absolute irradiance text file that will be generated if AvaSoft-IRRAD is available shows six columns. The first two columns are the wavelength and dark data. The third column is the transfer function from counts to microwatts. The fourth column contains the measured counts. In column five and six, the calculated irradiance values are given in microwatts per square centimeter (column 5) and in photon counts (column 6). The relative irradiance text file that will be generated if AvaSoft-IRRAD is not available shows five columns. The first column gives the wavelength in nanometers. The second to fourth column give respectively the dark, reference and scope data. The fifth column shows the calculated value for relative irradiance. Starting with version 7.4, so-called merged files can be converted. These contain spectra from multiple channels, combined in a single graph. Consult section 3.2.9.13 for details. 3.1.14 File Menu: Convert Graph - to ASCII Equi distance This option requires that graphic files were saved earlier by using the option File-Save Experiment. After selecting the option “File/ Convert Graph/To ASCII – Equi distance”, the wavelength range for which the data should be converted, and the distance between two successive data points can be entered in the dialog as shown at the right. After clicking the OK button, you can select the files which need to be converted. Selecting these files is the same as for converting to ASCII without the equi distance feature (section 3.1.13). Also the information in the header file is the same as for converting to ASCII without the equi distance feature. The data in the *.TRT, *.TAT, *.TTT and *.TIT files is presented in two columns. The first column gives the equally spaced wavelength in nanometers. The second column shows the interpolated value for scopedata (in a *.TRT file), absorbance (in a *.TAT file), transmittance (in a *.TTT file) or irradiance (in a *.TIT file). Starting with version 7.4, so-called merged files can be converted. These contain spectra from multiple channels, combined in a single graph. Consult section 3.2.9.13 for details. Dec-09 Avantes 31 www.avantes.com [email protected] 3.1.15 File Menu: Convert Graph - to J-CAMP JCAMP-DX is a standard file format for exchange of spectra between different spectrometer systems and computers. A JCAMP-DX spectrum is a text file, which can be viewed, corrected and annotated with a text editor. A lot of other elaborate spectrometer software programs, like Grams32 and OPUS, are capable of importing files in JCAMP-DX format. The J-Camp format requires an equal distance between the data points at the X-axis (wavelength). Converting the CCDpixels to wavelength points is not a linear function, so before writing to the J-Camp format, the data points are linearized first. This option requires that graphic files were saved earlier by using the option File-Save Experiment. After choosing this option, a window shows all files in the current measure mode. In the example at the right, the measure mode is “scope”, so the extension of the earlier saved spectra is *.roh. To select graphic files that were saved in another measure mode, e.g. absorbance, click Graph - …Mode, and pick the desired measure mode. behind the If a graphic file is marked by a (single) mouse click on the filename, the comment line for this file appears at the top of the graphical region in the main window. Selecting multiple filenames can be realized by using the CTRL or SHIFT key in combination with the mouse. If the CTRL key is pressed, all the files that are clicked by the mouse will be selected for conversion. If the SHIFT key is pressed, all the files in between two clicked files will be selected for conversion. Select the name of the file(s) to be converted to J-Camp and click the Open button. To leave this dialog without converting files, click the CANCEL button. The text files in J-Camp format require an extension DX. If, for example a file AVANTES0001.trm and another file AVANTES0001.abs are both converted to JCamp, the result will be AVANTES0001.dx in both cases. Starting with version 7.4, so-called merged files can be converted. These contain spectra from multiple channels, combined in a single graph. Consult section 3.2.9.13 for details. 3.1.16 File Menu: Convert Graph - to Excel This option requires that graphic files were saved earlier by using the option File-Save Experiment. After choosing this option, a window shows all files in the current measure mode. In the example below, the measure mode is “scope”, so the extension of the earlier saved spectra is *.roh. To select graphic files that were saved in another measure mode, e.g. absorbance, click Graph - …Mode, and pick the desired measure mode. behind the If a graphic file is marked by a (single) mouse click on the filename, the comment line for this file appears at the top of the graphical region in the main window. Selecting multiple filenames can be realized by using the CTRL or SHIFT key in combination with the mouse. If the CTRL key is pressed, all the files that are clicked by the mouse will be selected for conversion. If the SHIFT key is pressed, all the files in between two clicked files will be selected for conversion. 32 Avantes Dec-09 www.avantes.com [email protected] Select the name of the file(s) to be converted to Excel and click the Open button If not already open, Excel will be opened by AvaSoft and the conversion will be done in 2 steps: • In step1 all files that have been selected will be sorted into groups with the same serial number AND wavelength calibration coefficients. For example, in a 4 channel system, there will generally be 4 groups. • In step2, a sheet will be created in Excel for each group with the name of the serial number and the data of all selected files that belong to this sheet is written to Excel. The first six rows in each Excel sheet are reserved for: Filename, Mode/Unit, Integration Time, NrOfAverages, Smoothing, and comments (the comments that were saved with the file) The first column represents the wavelength, the other columns the data. If for a certain channel the wavelength calibration is changed, then the data does not fit into the same sheet with the old wavelength calibration (because there is only one column with wavelength). In that case a new sheet is generated with serialnumber with suffix _1 (e.g. 0706005U1_1), after a next change _2, etc... Since the AvaSpec spectrometers have a very stable wavelength calibration, which normally does not need to be changed, the _1 etc.. will not often show up. Irradiance files: files that have been saved in the irradiance chart (absolute irradiance application) can have a number of different units. During the conversion to Excel, the unit is read and the calculated data for that unit (emitted/received power or energy, photons etc..) is written to Excel. The unit is displayed in the second row. An absolute irradiance file that is saved in the main window is always in uwatts/cm2. Without the AvaSoft-IRRAD, the unit in irradiance mode will be relative irradiance. Limitations: An Excel sheet includes 256 columns. Therefore, a maximum of 255 files (1 column for wavelength) can be transferred into one sheet. Starting with version 7.4, so-called merged files can be converted. These contain spectra from multiple channels, combined in a single graph. Consult section 3.2.9.13 for details. Dec-09 Avantes 33 www.avantes.com [email protected] 3.1.17 File Menu: Save Graph to .RTF This menu option allows you to save the main screen to disk. The graph will be saved in JPEG format, embedded in a one page .RTF file. You can open this file with Microsoft Word, edit it, extract the graph, change the size of the graph, etc. 3.1.18 File Menu: Exit Closes AvaSoft. The measurement settings are saved to EEProm before the software is closed. During the process of saving it is very important that the spectrometer is not powered off. A dialog as shown at the right will become visible as long as data are saved (< 1 sec for USB2), about 8 sec for RS232/bluetooth connection. 34 Avantes Dec-09 www.avantes.com [email protected] 3.2 Setup Menu 3.2.1 Setup Menu: Hardware This option shows all connected spectrometers and allows you to change the name of the channel and to deactivate and activate spectrometers. For synchronization of scans a master sync spectrometer needs to be dedicated, in Multichannel platforms usually the spectrometer from the left as seen from the front is assigned as master sync by Avantes. For the NIR2.2/2.5 and the TE Cooled USB2 spectrometers, the Setpoint temperature can be entered at which the detector will be held constant. AvaSpec-3648 mode The Toshiba detector, as implemented in the AvaSpec-3648, can be used in 2 different control modes: 1. The Prescan mode (default mode). In this mode the Toshiba detector will generate automatically an additional prescan for every request from the PC, the first scan contains non-linear data and will be rejected, the 2nd scan contains linear data and will be showed on the screen and/or saved. This prescan mode is default and should be used in most applications, like with averaging (only one prescan is generated for a nr of averages), with the use of an AvaLight-XE (one or more flashes per scan) and with multichannel spectrometers. The advantage of this mode is a very stable and linear spectrum. The disadvantage of this mode is that a minor (<5%) image of the previous scan (ghostspectrum) is included in the signal. This mode cannot be used for fast external trigger and accurate timing, since the start of the scan is always delayed with the integration time (min. 3.7 ms). 2. The Clear-Buffer mode. In this mode the Toshiba detector buffer will be cleared, before a scan is taken. This clear-buffer mode should be used when timing is important, like with fast external triggering. The advantage Dec-09 Avantes 35 www.avantes.com [email protected] of this mode is that a scan will start at the time of an external trigger, the disadvantage of this mode is that after clearing the buffer, the detector will have a minor threshold, in which small signals (<500 counts) will not appear and with different integration times the detector is not linear. 3.2.2 Setup Menu: Wavelength Calibration Coefficients After clicking this option, a dialog is shown in which the wavelength calibration coefficients can be changed manually. Background The wavelength λ that corresponds to a pixel number (pixnr) in the detector in the spectrometer can be calculated by the following equation: λ = Intercept + X1*pixnr + X2*pixnr2 + X3*pixnr3 + X4*pixnr4 in which Intercept and X1 to X4 correspond to Intercept and First to Fourth Coefficient in the figure at the right. For example, if we want to calculate the wavelength at pixel number 1000, using the numbers in the figure at the right, the wavelength becomes: λ= 384,054 + 0,136492*1000 + -6,71259E-6*1E6 + -5,66234E-10*1E9 = 513,267 nm. The ‘Restore Factory Settings’ button restores for all spectrometer channels the original wavelength calibration coefficients that were saved to the EEPROM during factory calibration. The “Process data only when in following wavelength range” option can be used to transfer only a limited number of pixels from the spectrometer to the PC. This can significantly speed up the transfer time (e.g. for the AvaSpec-2048 from 30 ms at full wavelength range down to 14 ms for a small selection of 10 pixels). A second advantage is data reduction, because only the spectral data will be saved at the pixels for which the wavelength is in the specified wavelength range. 3.2.3 Setup Menu: Smoothing and Spline The Cubic Spline Interpolation Algorithm can be applied to get a better estimation for the spectral data between the pixels on the detector array. Smoothing is a procedure, which averages the spectral data over a number of pixels on the detector array. For example, if the smoothing parameter is set to 2, the spectral data for all pixels xn on the detector array will be averaged with their neighbor pixels xn-2, xn-1, xn+1 and xn+2. 36 Avantes Dec-09 www.avantes.com [email protected] Cubic Spline Interpolation In the figure at the right, the effect of spline interpolation is illustrated. The Master data shows the AD counts for 4 pixels, connected by a straight line (linear interpolation). The Slave1 data is for these 4 pixels exactly the same as for the Master data, but this time the cubic spline interpolation algorithm has been applied, resulting in data which is smooth in the first derivative and continuous in the second derivative. The spline interpolation can be useful for applications in which the output of line sources, like laser diodes is displayed, or for other applications, which require a high resolution. Note that for the AvaSpec-2048 with 2048 pixels, the effect of spline interpolation is not visible if the data is shown at full scale. The monitor resolution is much less than 2048 pixels. The effect of spline interpolation can only be visualized if the number of detector pixels that are displayed is smaller than the number of monitor pixels at the x-axis. Smoothing To get a smoother spectrum without losing information it is important to set in the software the right smoothing parameter. The optimal smoothing parameter depends on the distance between the pixels at the detector array and the light beam that enters the spectrometer. For the AvaSpec-2048, the distance between the pixels on the CCD-array is 14 micron. With a 200 micron fiber (no slit installed) connected, the optical pixel resolution is about 14.3 CCD-pixels. With a smoothing parameter set to 7, each pixel will be averaged with 7 left and 7 right neighbor pixels. Averaging over 15 pixels with a pitch distance between the CCD pixels of 14 micron will cover 15*14 = 210 micron at the CCD array. Using a fiber diameter of 200 micron means that we will lose resolution when setting the smoothing parameter to 7. Theoretically the optimal smoothing parameter is therefore 6. The formula is ((slit size/pixel size) – 1)/2 In the table below, the recommended smoothing values for the AvaSpecs spectrometer are listed as function of the light beam that enters the spectrometer. This light beam is the fiber core diameter, or if a smaller slit has been installed in the spectrometer, the slit width. Note that this table shows the optimal smoothing without losing resolution. If resolution is not an important issue, a higher smoothing parameter can be set to decrease noise against the price of less resolution. Dec-09 Avantes 37 www.avantes.com [email protected] Slit or Fiber AvaSpec-102 AvaSpec-128 10µm 25µm Pixel 77 µm n.a. n.a. 50µm AvaSpec-3648 AvaSpecNIR256 Pixel 63.5 µm Pixel 25 µm n.a. n.a. n.a. 0 AvaSpec-2048 AvaSpec-2048L AvaSpec-2048x14 Pixel 14 µm 0 0-1 Pixel 8 µm 0 1 Pixel 50 µm n.a. n.a. 0 0 0-1 1-2 2-3 0 100µm 0-1 0-1 1-2 3 5-6 0-1 200µm 1 1 3-4 6-7 12 1-2 400µm 2 2-3 7-8 13-14 24-25 3-4 500µm 3 3-4 9-10 17 31 4-5 600µm 3-4 4 11-12 21 37 5-6 3.2.4 AvaSpec-256 AvaSpec-1024 Setup Menu: Use 16bit ADC in 14bit mode (HW rev 1D and later) The 14bit AD Converter used with the as5216 boards revision 1B and 1C inside the AvaSpec-USB2 has been replaced by a 16bit ADC since the release of the as5216 board revision 1D. Therefore, the default range in Scope Mode for an AvaSpec-USB2 has changed from a 14bit range (0..16383) to 16bit (0..65535). If the menu option “Use 16bit ADC in 14bit mode” is enabled (preceded by a checkmark), the 16bit range AD Counts will be converted to a 14bit range by the as5216.dll (divide by 4.0). This option has been added for customers who have been already working with earlier versions of the AvaSpec-USB2 with 14bit ADC, and want to be able to compare the data in scope mode between both spectrometers. Note that by setting the 16bit ADC into 14bit mode, you will not lose resolution because the numbers are not truncated or rounded to integer numbers, e.g. 5 counts in 16bit mode will become 1.25 counts in 14-bit mode. If multiple AvaSpec-USB2 spectrometers are connected simultaneously and one or more devices do not support the 16bit ADC (rev 1B or rev 1C as5216 board), all spectrometers will be set automatically to 14bit mode (range 0..16383 AD counts). 3.2.5 Setup Menu: Correct for Dynamic Dark The pixels of the detector are thermally sensitive, which causes a small dark current, even without exposure to light. To get an approximation of this dark current, the signal of some optical black pixels of the detector can be taken and subtracted from the raw scope data. This will happen if the correct for dynamic dark option is enabled. As these optical black pixels have the same thermal behaviour as the active pixels, the correction is dynamic. Some detector types (AvaSpec-2048/2048L/3648/2048x14) include dedicated optical black pixels. New in AvaSoft 7.5 is the dynamic dark correction support for the NIR256-2.0/2.2/2.5. For these detectors, a few datapixels can be blackened during fabrication of the optical bench. These blackened pixels can then be used for dynamic dark correction. 38 Avantes Dec-09 www.avantes.com [email protected] For spectrometers with dedicated optical black or blackened pixels, the correct for dynamic dark option can be switched on or off by clicking this menu option. The option is on if the menu option is preceded by a checkmark which is the default state. If the connected spectrometers don’t have optical black or blackened pixels, the correct for dynamic dark menu option will not be available. Note that this option is different from the dark current that needs to be saved before any transmittance or absorbance measurements can be taken (File-Save Dark). If the correct for dynamic dark option has been changed, it will be necessary to save a new dark and reference spectrum because the raw data has been changed. 3.2.6 Setup Menu: Subtract Saved Dark This option is used to subtract the dark spectrum that has been saved (File-Save Dark) from the raw scope data. After starting AvaSoft, this menu option is always unselected, because a dark spectrum needs to be saved or loaded before it can be subtracted. If this menu option is preceded by a checkmark, the scope data is corrected with the saved dark. 3.2.7 Setup Menu: Strobe Enable This option can be used to enable or disable an external strobe (e.g. the AvaLight-XE) attached to an AvaSpec spectrometer. The measured light intensity of the AvaLight-XE is independent of the integration time in AvaSoft. To increase light intensity, the number of pulses per integration interval should be increased. The maximum frequency at which the AvaLight-XE operates is 100 Hz. This means that the minimum integration time for 1 pulse per scan is 10 ms. When setting the number of pulses e.g. to 3, the minimum integration time becomes 30 ms. It is recommended to keep the integration time as low as possible to avoid unnecessary increase of noise. Strobe (AvaLight-XE) Control The AvaLight-XE needs to be attached to AvaSpec-USB2 by connecting an IC-DB26-2 interface cable between the high density 26 pole Sub-D connectors at the AvaSpec-USB2 and the 15-pole DB connector of the AvaLight -XE. If used with a multichannel system, make sure that the AvaLight-XE is connected to the master sync spectrometer, only the number of flashes per scan set for the master synch spectrometer will determine flash rate. To disable the strobe, simply enter 0 under the NrOfFlashes. 3.2.8 Setup Menu: PWM (AvaLight-LED) control The AvaLight-LED needs to be attached to a AvaSpecUSB2 by connecting an IC-DB26-2 interface cable between the high density 26 pole Sub-D connectors at the AvaSpec-USB2 and the 15-pole DB connector of the AvaLight –LED (DO1 – pin11). The frequency can be set between 500 Hz and 300 kHz, the duty cycle between 0 and 100%. If used with a multichannel system, all channels can have their own independent PWM setting for both frequency and duty cycle. To disable the PWM output, simply enter 0 under the Duty Cycle. Dec-09 Avantes 39 www.avantes.com [email protected] 3.2.9 Setup Menu: Options All options described in this section are standard included in AvaSoft FULL version. In AvaSoft BASIC, these features are not available. 3.2.9.1 Setup Menu: Options – Check on Saturation The 14-bit A/D converter in AvaSpec-USB2 HW rev 1B and 1C results in raw Scope pixel values between 0 and 16383 counts. If the value of 16383 counts is measured at one or more pixels, then these pixels are called to be saturated or overexposed. The range for the 16-bit A/D converter in the AvaSpec-USB2 HW rev 1D and later results in Scope pixel values between 0 and 65535. In this case the pixels are saturated at 65535 counts (see also section 3.2.4 about the 16bit ADC mode). Since saturated pixels can disturb the measurement results, a lot of attention has been given in AvaSoft (and the driver packages AS161.DLL/AS-5216.DLL) to detect saturation and to notify the user if a measurement contains saturated pixels. This notification is done in such a way that the user can always decide to ignore the saturation, for example if the saturation happens at pixels that are not in the wavelength range where the user is interested in. Saturation can usually be solved by selecting a shorter integration time. When at minimum integration the signal is still too high, an attenuator, a neutral density filter or fibers with a smaller diameter may be used. In AvaSoft, different levels of saturation detection can be set, as shown in the figure at the right. Saturation detection levels The default level of saturation detection is “Detect Saturated Pixels at saturation level”. Only for AvaSpec-2048 spectrometers, the third (autocorrect inverted pixels) level is available. The reason for this is that if the detector type in the AvaSpec-2048 (Sony-ILX554) is heavily saturated (at a light intensity of approximately 5 times the intensity at which saturation starts), it will return values < saturation level. The other detector types in the AvaSpec-102, 256, 1024 and 3648 do not show this effect, so no correction is needed. Normally, you don’t need to use this third level for the AvaSpec2048, but when measuring a peaky spectrum with 40 Avantes Dec-09 www.avantes.com [email protected] some heavily saturated peaks, the autocorrect can be used. To illustrate this, a strong peak from the AvaLight-CAL calibration line source was heavily saturated at 435.84 nm. This caused the most heavily saturated pixels to return inverted (<16383 counts) pixel values (figure below at the left). In the right figure, the saturation detection has been set to the third level, which will not only detect the saturated pixels at 16383 counts, but also detect and correct the inverted saturated pixels. Disadvantage of the autocorrect detection level is that processing the saturated scans by the application takes more time. Saturation Notification If the saturation detection has not been switched off, the spectrometer channel statusbar will show the text label “saturated” as long as one or more pixels of that spectrometer channel are saturated: This is useful for measurements in transmittance, absorbance and irradiance mode, because in these modes saturation can not be observed by looking at the number of counts, like in scope mode. But even in scope mode, a spectrum can contain saturated pixels also when this is not directly obvious from the graph. Examples are: • Smoothing. The maximum pixel value of a peak can be saturated, but is averaged with neighbor pixels which may not be saturated. • The correct for dynamic dark algorithm subtracts the dark values that are measured at the optical black pixels from the spectral data. Therefore, the saturation level of 16383 (65535 in 16 bit mode) counts will never be reached with correct for dynamic dark ON. The saturation detection in AvaSoft is done before the data is corrected for dynamic dark, so it will also detect saturation with dynamic dark ON. • Monitor resolution. The CCD contains 2048/3648 pixels which is a lot more than the monitor pixels in the graph. Since not each CCD pixels can be drawn at the monitor, a sharp peak at one CCD pixel can be saturated although this is not visible at the monitor. Use the zoom function if you want to verify if this is the cause of saturation. • Zoomed in. Saturation can also happen at a wavelength range that is not visible because the graph is not at full scale. Under all these circumstances, the “saturation” label will be shown in the statusbar of the spectrometer channel for which one or more pixels are saturated. During time series measurements (History Channel Functions, color versus time, irradiance versus time) the saturation detection will be done only for the relevant wavelength range. The relevant wavelength range in color measurements is from 380 to 780 nm. For History Channel Functions, the relevant wavelength range is set by the user. For example, when monitoring an integral between 500 and 505 nm, saturation detection and notification will be done only for this range. If saturated, the saturation label will become visible in the History Channel output. If the time series measurements are saved online to Excel, the font color in Excel will be red for a history channel as long as the output for that channel is saturated. Dec-09 Avantes 41 www.avantes.com [email protected] 3.2.9.2 Setup Menu: Options – Full Width Half Max The Full Width Half Maximum of a peak is the bandwidth (in nanometers) for which the intensity is higher than half of the maximum intensity of that peak. The FWHM can be calculated in Scope or Irradiance Mode. This utility is used mostly measuring the output of laser diodes. During FWHM calculations, the intensity needs to be corrected for the dark data. Therefore it is recommended to enable the option Subtract Saved Dark. The FWHM can be displayed in two different ways: Show all FWHM and Peaks in Table This option allows you to open the table in which Wavelength, Intensity and FWHM are displayed and updated after each scan (see figure below). 42 Avantes Dec-09 www.avantes.com [email protected] The results can be saved any time by clicking the Save As button. The file is a textfile with the file extension .fwm. It can be opened with any texteditor, e.g. notepad. The channel selector at the top of the FWHM dialog can be useful if there are multiple spectrometers connected, and you want to switch between channels. The cursor (vertical green line which is enabled/disabled by the cursor button) will be positioned automatically on a peak if one of the peaks in the FWHM dialog is clicked with the left mouse button. The cursor needs to be enabled by clicking the cursor button Display FWHM in Graph after selection The dialog at the right appears when clicking this option. After clicking the OK button, the Full Width Half Max values are calculated for a number of peaks. To mark a peak for which the FWHM values need to be calculated, press the ALT key, and click with the left mouse button on this peak. If only one spectrometer channel is enabled, and there are no earlier saved graphs being displayed, then the FWHM value of the marked peak will be shown directly on top of the peak. Furthermore, this peak will be yellow marked over the width of the FWHM value (it may be necessary to zoom in on the peak to be able to view that the peak is marked). If more than one spectrum is being displayed, a dialog, as shown at the right, pops up in which the spectrum for which the FWHM needs to be activated can be selected out of all displayed spectra. In the figure below, 2 peaks have been selected for FWHM calculation. The FWHM values are given in the same color the spectrum is drawn in. To disable the FWHM calculation, the menu option (which is marked as long as the FWHM is enabled), needs to be reselected. Dec-09 Avantes 43 www.avantes.com [email protected] 3.2.9.3 Setup Menu: Options - Integrals This utility can be used for measuring the total amount of energy coming into the spectrometer. Up to 10 integrals can be displayed simultaneously. The integral calculations are enabled after they have been defined in the dialog that is shown at the right. This dialog is displayed after activating the menu option SetupOptions-Integrals. In the example at the right, two integrals have been defined (the first 2 are marked by the “Enable” checkbox in the first column). In the second column, a spectrum can be chosen out of all spectra that are at that moment displayed in the main window in AvaSoft. A full list of the spectra to choose from (this includes earlier saved spectra like integral 2 in the example) is displayed after clicking on the arrow button at the right side of the second column. In the third and fourth column, the wavelength range can be entered over which the integral should be calculated. Finally, a multiplication factor can be entered for scaling purpose. After clicking the OK button, the integral values are given as shown in the figure below. To disable the integral calculation, the menu option (which is marked as long as the Integrals are enabled), needs to be reselected. To measure the integral versus time, up to 8 different functions can be entered in the History application. 44 Avantes Dec-09 www.avantes.com [email protected] 3.2.9.4 Setup Menu: Options – Autosave Spectra Periodically With this option complete spectra will be saved automatically in time. The following parameters can be set: • Time delay before first scan needs to be entered in seconds. After clicking the OK button, AvaSoft waits for this number of seconds, before the first scan is saved. • Time delay between scans needs to be entered in seconds. This defines the time between saving two subsequent spectra. If this number is set to zero, AvaSoft will save the spectra as fast as possible. • Number of scans to save: the number of spectra that needs to be saved can be entered. On top of the parameters that appear at the right, a checkbox shows: Save As Fast As Possible (no screen updates). If the white checkbox in front of this text line is marked, the Automatic Save option will always save the number of scans that have been entered as fast as possible. To do so, the time delay between scans is automatically changed to 0 milliseconds at the moment the checkbox is clicked. With this option selected, the spectra will be saved 5 to 10 times faster, compared to if this option is not selected. This speed increase has been achieved by mainly two reasons: 1) During the saving of the number of scans that has been entered, the screen update, which is very time-consuming, is not activated. Instead, the main window is temporarily minimized, and the number of scans to save is counted down in a new dialog. 2) No comment files will be generated. Other factors that have a positive effect on the speed of the data acquisition, and which can be set in AvaSoft are: • Smoothing parameters. • Integration time. • Averaging. • Number of pixels to transfer (section 3.2.2) Furthermore, it is recommended to keep the number of files in your experiment directory small (a few hundred maximum), because a large number of files in the same experiment directory have a negative effect on the system speed If the automatic saving needs to be aborted before all spectra have been saved, the “Autosave Spectra Periodically” menu option can be selected again and the value 0 can be entered for the number of spectra to be saved. Note that with the Store to RAM application (section 4.9), the fastest data acquisition can be achieved. AvaSoft Store To Ram allows you to measure a fixed amount of scans in scope mode as fast as possible, without the overhead of USB communications. The scans are stored in the internal memory of the AS5216, and the results are only sent to the computer after the last measurement has been made. Dec-09 Avantes 45 www.avantes.com [email protected] Save on Digital In The DB26 connector pins 7, 16 and 24 may be used to connect external switches, such as photoswitches, to save a spectrum, reference or dark. This is especially useful for automated sampling in a process control environment with periodical updates of dark and reference signals. It is recommended to enable the Automatic save dark by TTL shutter in combination with the save dark on digital in setting. 3.2.9.5 Setup Menu: Options - Correct for Drift Introduction When measuring the reflectance of a white reference tile or the transmittance of a reference solution against time, the output should theoretically remain 100% +/- noise. In practice the output value will not remain exactly fluctuating round 100%, but the signal can slowly drift away. The cause for this drift in the measurement system can be a change in temperature in the optical bench which causes micro bending of the components that focus the light at the detector, but also a drift in the light source that is used to illuminate the reference sample. To correct for the drift in the system, it needs to be measured first. If a 2-or multiple-channel spectrometer is available, the measured deviation from 100% at a reference channel can be used to compensate the measured data at the sample channel. The sample and reference data can be measured simultaneously and the measured data at the reference sample can be used directly to correct the sample data. Disadvantage of the “correct for drift by spectrometer channel” is that the data for reference and sample are measured by using two optical benches which may react differently on temperature changes. If the drift is mainly caused by the light source (such as a difference in flash intensity of the AvaLight-XE), this method of correction is recommended. A disadvantage of this method is that it will not correct for drift caused by temperature changes of the optical bench. Correct for Drift by Spectrometer Channel This option is only available if the spectrometer system has one or more slave channels. One spectrometer channel will be used as a reference channel, which will continuously measure the reference spectrum (e.g. the white tile in reflectance measurements or the cuvette holding the reference solution in transmittance measurements). Changes in this reference signal, e.g. because of drift in the lightsource, will be used to correct the data of the other (selected) spectrometer channels. The wavelength range over which the data can be corrected will be the overlapping wavelength range between reference spectrometer channel and the spectrometer channel to be corrected. If this option is activated, a dialog is shown in which the reference channel and one or more (depending on the number of spectrometer channels that are available) channels to be corrected can be selected. After selecting the right setup, and clicking the OK button, AvaSoft shows the following information: 46 Avantes Dec-09 www.avantes.com [email protected] Turn on your light source, choose the right integration time and save reference. Then turn off the light source and save dark. After clicking OK, AvaSoft enables the spectrometer channels that are relevant in the correct for drift application. After saving the reference and dark files, a message dialog shows that the data will be corrected for drift. The menu option will be preceded by a checkmark. To disable the correct for drift option, the menu option (if preceded by a checkmark) needs to be clicked. 3.2.9.6 Setup Menu: Options - Automatic Save Dark by TTL shutter To use the automatic save dark option, an interface cable needs to be connected from the spectrometer to the light source with shutter (AvaLight-HAL-S, AvaLight-DHc, AvaLight-D(H)-S-(DUV) ). The interface cable between TTL-shutter and spectrometer is a 26 pin to 15 pin cable (IC-DB26-2). The TTL switch at the lightsource needs to be in TTL-position. In AvaSoft, the menu option ‘save automatic dark by TTL shutter’ needs to be enabled in the menu setup-options. If this option is enabled, the TTL will close the shutter of the light source at the moment the dark data is saved. After the dark has been saved, the shutter will be opened automatically. 3.2.9.7 Setup Menu: Options - External Trigger Setting If the external trigger setting is enabled the spectrometer will wait until a TTL signal at pin 6 of the DB26 connector gets high and will then start the integration time. The delay between the rising edge of the TTL pulse and the start of the integration time cycle depends on the spectrometer type, as shown in the table below. Spectrometer Type Minimum Delay [µs] Maximum Delay [µs] AvaSpec-128-USB2 9 60 AvaSpec-256-USB2 0.80 0.84 AvaSpec-1024-USB2 0.80 0.84 AvaSpec-2048-USB2 1.28 1.30 AvaSpec-2048L-USB2 3.28 3.30 AvaSpec-3648-USB2 (clearbuffer mode) 0.28 0.30 AvaSpec-NIR-256 0 600 AvaSpec-2048x14-USB2 0 2170 Dec-09 Avantes 47 www.avantes.com [email protected] NrOfScans If a number of scans is set to a value higher than 1, the spectrometer will accumulate multiple scans on every rising edge of the external TTL trigger. This setting is overruled when level triggered is enabled. Save Spectrum If this box is checked, the scans that the spectrometer will accumulate will be saved to the hard disk. If NrOfScans>1 the datasaving will be done as fast as possible without screen updates. Edge Triggered When this mode is selected the one or multiple scans will be started at the rising edge of a TTL pulse at pin 6 of the DB26 connector. The delay between the rising edge and the actual start of the integration time can be found in the table above. Level Triggered When this mode is selected the spectrometer will start to accumulate data (take scans at the selected integration time) at the rising edge of the TTL pulse and will continue to do so as long as the TTL signal remains high. When the signal becomes low, the average of the accumulated data (except for the last scan) will be displayed or saved. This mode is especially useful for conveying belt applications, when a product needs to be scanned, independent of the transport speed. 3.2.9.8 Setup Menu: Options - Auto configure Integration time After this menu option is clicked, AvaSoft starts searching for an optimal integration time. Depending on the maximum counts in the last scan, the integration time will be increased/decreased automatically until an optimal signal is measured. The changing values of the actual integration time during the search can be followed in the integration time field at the edit bar. If the auto configure integration time routine needs to be aborted before an optimal integration time has been found, click the ‘∫AC’ button (which is in the down position during the search), or reselect the menu option Setup-Options-Auto Configure Integration time. When the maximum peak is around 90% of the full ADC scale (14750 counts for the 14bit ADC, 59000 counts for the 16bit ADC), the new integration time is displayed. Since the integration time has changed, new reference and dark spectra need to be saved, before switching to transmittance or absorbance mode is possible. For this reason this option is only available in scope mode. 3.2.9.9 Setup Menu: Options – Use Custom Reflection Reference In Transmittance/Reflectance Mode, the transmittance/reflectance at pixel n is calculated using the current sample, reference and dark data sets in the following equation: samplen − dark n Tn = C n * ref n − dark n Cn is the Custom Reflectance Reference factor at pixel n. In earlier versions of AvaSoft, this factor was set to 100 for each pixel and could not be modified. In AvaSoft version 6 and later, the custom reflectance reference factor is default set to 100, but can be set to different values if needed. If the reflectance spectrum of a “white” calibration tile is known, the data can be read from a file, or entered in a table in AvaSoft. The resulting custom reference data can be saved and loaded under a user defined filename. Click the “Enable Custom Standard” radio button, and then OK in the Custom Reflectance Settings dialog to use the customized reference data in AvaSoft. 48 Avantes Dec-09 www.avantes.com [email protected] The status of this option is shown in the button bar by the addition of a green border to the white button. If the border is absent, 100% reflectance will be assumed for the reference tile. If the border is present, like in the figure above, customized reflectance values will be used for all calculations. 3.2.9.10 Setup Menu: Options – Suppress Save Comments This option, if preceded by a checkmark, disables the appearance of the comments dialog box if an experiment is saved as described in section 3.1.7. By default this option is OFF. After clicking the menu option it will be enabled (preceded by a checkmark). 3.2.9.11 Setup Menu: Options – View Reflectance instead of Transmittance Although mathematically equivalent, the experimental setup for a measurement in reflectance or transmittance mode is different, and therefore the possibility to select the name “Reflectance” instead of “Transmittance” is implemented. By default the option is not preceded by a checkmark, meaning the program will use Transmittance mode. By clicking the menu option, a checkmark will appear and the program will use the name Reflectance instead of Transmittance. The effect of the change is twofold: • • In Reflectance/Transmittance mode, the Reflectance name will shown at the Y-Axis The Caption at the Reflectance/Transmittance button will change from T to R, and the corresponding menu option under View will change from “Transmittance mode” to “Reflectance mode”. 3.2.9.12 Setup Menu: Options – Battery Voltage Monitoring This option enables you to monitor the voltage level of a battery pack that is used with the AvaSpec. Two voltage threshold levels for up to eight spectrometers are saved on disk. The program will issue a warning level when the first threshold level is passed. When the second threshold level is passed, the program will stop scanning, besides issuing a warning. Introduction The 12/24V battery packs for use with AvaSpecs and AvaLights need to be recharged if the battery voltage becomes too low. The battery voltage monitoring option will help in reminding you when it is time to recharge the battery pack. Dec-09 Avantes 49 www.avantes.com [email protected] The option uses one of the analog inputs of the AvaSpec to monitor the battery voltage. Two alarm levels are maintained per spectrometer, an Alarm trigger level and a Shutdown trigger level. You can select between the spectrometer that are attached in the drop-down box at the upper left of the form. The default trigger levels are 94.17 and 90.00 % of full charge. You can edit these levels if necessary, and the levels can be saved to disk in a .ini file. Press the ‘Save Settings’ button to save the levels and status, before closing the form or selecting another spectrometer in the drop-down box. The monitoring can be switched on and off per spectrometer with the ‘Alarm Status’ radiobutton. It can be started and stopped altogether with the ‘Start/Stop Voltage Monitoring’ button. When the measured voltage is lower than the alarm trigger level, both a visual and audio warning will be issued. At this moment, you can disable the monitoring if you want to, by selecting ‘Off’ in the ‘Alarm Status’, and pressing the ‘Save Settings’ button, or by pressing the ‘Stop Voltage Monitoring’ button. When you continue measuring with the voltage monitoring switched on, eventually the measured voltage will be lower than the shutdown trigger level. An error message will be issued, and the program will stop scanning. Quick Start 1. 2. 3. 4. 5. 6. Connect the monitoring cable of the battery pack to the HD26 plug of your AvaSpec. Select ‘Setup’, ‘Options’, ‘Battery Voltage Monitoring’ Check if the Alarm Status for your spectrometer is set to ‘On’ Press the ‘Save Settings’ button Press the ‘Start Voltage Monitoring’ button Press the ‘Close Form’ button 50 Avantes Dec-09 www.avantes.com [email protected] Main Window Select the spectrometer with which you want to monitor the battery voltage in the drop-down box at the upper left of the form. The monitoring can be switched on and off per channel with the ‘Alarm Status’ radio button at the upper right of the form. The current battery voltage is displayed in the first box in the middle of the form. The trigger levels can be edited in the other boxes in the middle. Save the settings per spectrometer by pressing the ‘Save Settings’ button. Save your settings before you switch to another spectrometer. Start or Stop the voltage monitoring altogether by pressing the ‘Start/Stop Voltage Monitoring’ button Close the form by pressing the ‘Close Form’ button. Dec-09 Avantes 51 www.avantes.com [email protected] 3.2.9.13 Setup Menu: Options – Merge Channel Settings 3.2.9.13.1. Introduction Merging spectra in a multichannel spectrometer system Multichannel spectrometer systems are often setup to achieve a high resolution over a wide range, e.g. Master: UE 230 to 310 nm Slave1: UE 303 to 410 nm Slave2: VE 401 to 490 nm Slave3: VE 485 to 555 nm Another example is the UV/VIS/NIR range (e.g. 200-2500nm) which requires at least two different detectors and therefore different channels. In both examples, there is an overlapping wavelength range between consecutive channels for which the results should be the same, especially when measurements are taken in absorbance, transmittance, reflectance or irradiance mode. In the application software, it would be convenient if the spectral data in the overlapping range could be handled as a single spectrum. It is possible to define a group of spectrometer channels that are combined into a single spectrum (in abs, trm, irr – mode). The combined spectrum will replace the individual spectra. It is now also possible to save this combined spectrum, and display it in AvaSoft. Export to ASCII, Excel and J-Camp is also supported. 3.2.9.13.2. Merge settings and requirements In the 4-channel example above, it is easy to identify the overlapping ranges (303-310nm, 401-410nm, and 485-490nm). But if e.g. a 5th channel would be added with the range 200-700nm, the data for this channel should clearly not be merged with the high resolution channels. Also, if a 4-channel-spectrometer system holds 2xUV/VIS (200-1100nm) and 2xNIR (1000-2200nm) channel, we need to define which spectrometer channels should be merged into one spectrum. In this example, two merged UV/VIS/NIR spectra are required. In AvaSoft, we have created the option to define for each channel whether it should be treated as an individual channel, or be placed in one of the (max 2) merge groups. For the examples mentioned above, the spectrometer channels can be allocated as shown in the following tables: Example1: Channel 1 2 3 4 5 Wavelength Range 200-700 230-310 303-410 401-490 485-555 Individual X O O O O Group1<name1> Group2 <name2> O O X O X O X O X O Example2: Channel 1 2 3 4 Wavelength Range 200-1100 200-1100 1000-2200 1000-2200 Individual O O O O Group1 <name1> X O X O 52 Avantes Group2 <name2> O X O X Dec-09 www.avantes.com [email protected] In AvaSoft, the Merge Spectrometer Channels Settings dialog will be displayed after clicking the menu option: “Setup – Options – Merge Channel Setting”: It is required to run the spectrometer channels in SYNC mode, if channels need to be merged. If a red warning shows up like in the figure above, enter the “Setup-Hardware” menu options and make sure the checkmark “Synchronize scans between all spectrometers” is enabled: Sync mode requires that the spectrometer channels are connected to each other with sync cables which would always be the case in a dedicated AvaSpec multichannel system. However, when setting up your own multiple channel system by combining a number of single channel systems, make sure that all channels are connected with sync cables. If all spectrometer channels need to be merged into a single spectrum, select all checkmarks in the same merge group in the merge spectrometer channels settings dialog (merge1 or merge2). Other selections, like in the example1 and example2 tables at the previous page are possible as well, but there are a few requirements that should be met: Dec-09 Avantes 53 www.avantes.com [email protected] 1. There should not be a “gap” in the wavelength range of the merged spectrum. For example, the full ranges for the two channels in the settings dialog are 165.4-730.3nm for channel 1 and 184.1 to 1100.0nm for channel 2. To illustrate merging, the start wavelength for the 2nd channel will be set to 700nm (under Setup-Wavelength Calibration Coefficients), resulting in a 30nm overlap range. If channel 2 starts e.g. at 740nm, there would be a 10nm gap between the channels which is not allowed. 2. A merge group can be empty (e.g. merge2 in the example above), or it should hold 2 or more spectrometer channels. A single spectrometer channel in a merge group is not allowed. If a spectrometer should be processed individually, place it into the “Individual” column. 3. If more than two spectrometer channels are placed into the same merge group, each overlapping wavelength range should hold the data for two spectrometer channels. For example, if the 4channel system with 2 UV/VIS (200-1100nm) and 2 NIR channels (1000-2200nm) are all placed in merge1, the data for all 4 channels is available in the overlapping range from 1000-1100nm, which is not allowed (and also not desirable!). If all channels should be merged into a single spectrum in a 3-channel system with e.g. the ranges 200-500nm, 300-600nm and 400-700nm, part of the overlap range (400-500nm) would hold data for all 3 channels. If this hypothetical situation occurs, it can be solved by using only channel 1 and 3 for merging (and place channel 2 in the individual column), or by changing the start/stop wavelength for one or more channels, such that only 2 channels are available in each overlap range. AvaSoft will check if the requirements mentioned above are met, and it will display an error message and the cause of the error if wrong settings are entered. The merge spectrometer channels dialog allows you to enter a virtual “combined channel” name for each merge group. This name can be used as an identifier when displaying saved graphs, or converting the graphs to ASCII, Excel or JCAMP. The “Apply merging also in Scopemode” checkmark can be enabled if you also want to merge the raw data in scopemode. Due to different sensitivity of gratings, detectors, mirrors, fiber optics and possibly other settings (e.g. integration time), the raw data in scopemode will probably not match in the overlapping wavelength range, and therefore merging data in scopemode does not make much sense. However for some applications, like LIBS, it is more important to identify the location of the spectral peaks than the peak intensity. In such applications, multichannel systems are often used because of the higher peak resolution, and it is convenient to merge these channels into a single spectrum, also in scopemode. It is recommended in this case to save a dark spectrum for all channels and use the option “Subtract Saved Dark” to let the spectrum start at a baseline near zero. Of course “Apply merging also in Scopemode” can also be selected to do a quick test to see how merging affects the raw spectra in the overlapping range(s) in scopemode. Finally, make sure the “Enable” checkbox is marked in the “Merge Spectrometer Channel Settings” dialog and click the OK button to save the settings and start measuring in merge mode. 3.2.9.13.3. Processing scans in merge mode The AvaSpec-USB2 spectrometer channels can all be setup for different integration time and averages. In Sync mode, the start of a measurement cycle is the same for each channel. The arrival of the scans is sequential. (The as5216 DLL will signal the application that new data is available with special Windows messages.) If the system is not in merge mode, each channel will process new data immediately after AvaSoft receives a dataready message from the DLL. In merge mode, recalculating the intensity in the overlapping range can only be done if the data for all channels since the last synchronized measurement started is available in the application. Therefore, data processing in merge mode is only done after the data for all channels has been received by the application. 54 Avantes Dec-09 www.avantes.com [email protected] In merge mode, all individual channels are still visible and the processed scans will be displayed over the range specified by the start- and stop wavelength for each channel (under setup – wavelength calibration coefficients). The line properties (color, style) for each spectrometer channel can still be set per channel, and saving reference and dark has not change either. There are only two main changes when comparing the processed scans in merge mode and the traditional non-merged measurements: 1) Recalculating the intensity in the overlapping wavelength range(s) 2) Saving the spectra of all spectrometer channels in the same merge group into a single file 3.2.9.13.3.1 Recalculating the intensity in the overlapping wavelength range(s) Under perfect conditions, recalculation of the intensity in the overlapping range should not be needed in absorbance, transmittance or irradiance mode, because the intensities measured by both channels in the overlapping range should be the same. However, due to small imperfections like second order effects, stray light, nonlinearity effects and/or temperature drift, minor discontinuities between the intensity of the two channels in the overlapping range may occur. AvaSoft will recalculate the intensity in such a way that a smooth transition between the overlapping channels will take place. An example of such a discontinuity in irradiance mode is shown in the figure below. Dec-09 Avantes 55 www.avantes.com [email protected] In merge mode, the discontinuity in the overlap range is removed as shown in the figure below: Note that the overlap range is determined by the start- and stop wavelength for each spectrometer channel. To minimize recalculation of the intensity, select the start- and stop wavelength such that only a small overlap range remains. The quality of the signal in terms of signal/noise should be used to decide for which spectrometer channel the wavelength range should be reduced. An example is a dual channel UV/VIS/NIR spectrometer system with a 200-1100nm range at channel 1 and 1000-2200nm range at channel 2. The full range for the 200-1100nm channel (UA grating) is probably 200 to 1300nm, but the factory setting for the stop wavelength is only1100nm, because the CCD is insensitive at wavelengths over 1100nm. It is not a good idea to use the signal between 1100 and 1300nm when merging this channel with the NIR channel, as this signal is of poor quality. The remaining overlap range between 1000nm (start of NIR channel) and 1100nm can be reduced further. If the quality of channel 1 between 1050 and 1100nm is lower than the quality of the NIR channel, set the stop wavelength for channel 1 to 1050nm. Likewise, if the contribution of the NIR channel around 1000nm should be reduced, increase the start wavelength for channel 2. When leaving the overlap range between 1000 and 1100nm, the data for both channels in this range will be merged such that the intensity gradually changes from channel 1 to channel 2, using the data from both channels in the overlap range as input. 56 Avantes Dec-09 www.avantes.com [email protected] The figure below illustrates how merging handles a huge discontinuity between two overlapping channels. Since this screenshot was taken in scopemode, such a discontinuity is normal (see section 3.2.9.13.2). The only purpose for merging these spectra in scopemode is to illustrate how the two channels (blue and red) are merged into a single spectrum (purple). 3.2.9.13.3.2 Saving the spectra of all spectrometer channels in the same merge group into one file In merge mode, the spectra of all spectrometer channels in the same merge group are saved in the same file. Files that are saved in merge mode can be recognized by the addition of an ‘X’ to the file extension: .ROHX, .ABSX, .TRMX, IRRX. If merge mode is not enabled, the traditional file format and extensions (without ‘X’) are used. Also spectrometer channels that are placed in the individual column in the merge settings dialog are saved as merged files. The status bar for each spectrometer channel shows the name of the file the next scan will be saved in. Before AvaSoft 7.4 (and also when not in merge mode) the filename for each spectrometer channel needed to be unique which was realised by auto incrementing the sequence number in the filename. In merge mode, the spectra of spectrometer channels in the same merge group will have the same filename, as shown in the figure below: Dec-09 Avantes 57 www.avantes.com [email protected] In a 4-channel system, in which two merge groups have been defined, saving the spectra should result in two files, each holding the data for two spectrometer channels: In the example above, the spectrometer channels 0610063U1 and 0802555U1 are in merge group merge1, and channels 0807017U1 and 0707083U1 are in merge group merge2. When saving merged files, the data for all pixels of all channels are saved. An 8-channel AvaSpec-3648 for which all channels are in the same merge group and set to their full range will yield files with 29184 data points! The main reason for developing the merge utility was the ability to analyze the spectra of a multichannel system as a single spectrum. Therefore, when analyzing the saved spectra (displaying, comparing with other spectra, converting to ASCII, Excel, Jcamp etc..) the file is handled as a single spectrum. Detailed information about the data origin (which channels and settings were used when saving the file) can still be obtained and displayed, but the spectral data will always be represented as a single spectrum (wavelength + intensity). A detailed description about displaying and converting the graphs saved in merge mode can be found below in section 3.2.9.13.4 and 3.2.9.13.5. 3.2.9.13.4. Displaying merged spectra The (merged) spectra to be displayed can be selected after clicking the menu option “File-Display Saved Graph”. New in AvaSoft 7.4 is that the merged files (with an additional ‘X’ in their file extension) will also be listed in the Open Dialog that shows up. Multiple non-merged and merged files can be selected and will be displayed after clicking the “Open” button. A small difference between the displayed non-merged and merged graphic files is that in the non-merged files the graph title already displays the main measurement parameters settings such as integration time (it), averaging (av) and smoothing (s). Since merged spectra can hold different settings for up to 8 channels, there is too much information to be displayed in the graph title. Therefore, detailed information about these settings can be viewed in a separate information dialog which will be displayed after selecting “Show Info” from the popup menu that shows up when right-clicking the spectral line of interest. 58 Avantes Dec-09 www.avantes.com [email protected] 3.2.9.13.5. Converting merged spectra to ASCII, ASCII-equidistance, Excel and Jcamp-DX Converting the merged spectra to ASCII and ASCII-Equidistance can be done with or without header information. If the ASCII files are further processed by other software, the header is often not compatible. The option “Include ASCII Header” is preceded by a checkmark by default. If the header information should be left out, click the “Include ASCII Header” to toggle the checkmark. The “To ASCII” and “To ASCII – Equidistance” menu options can then be clicked to export the data to an ASCII file. To distinguish the merged ASCII files from the non-merged, an ‘X’ is added to the file extension for the merged ASCII files. An overview of the file extensions in the different measure modes is given in the table below: Measure mode Scopemode Absorbance Transmittance Irradiance Binary file Not Merged ROH ABS TRM IRR Binary file Merged ROHX ABSX TRMX IRRX Text file Not Merged TRT TAT TTT TIT Text file Merged TRTX TATX TTTX TITX The header in a merged ASCII file includes the following information The data for all measure modes is given in two columns, separated by a semi-colon(;). The first column holds the wavelength in nm, the second column holds the intensity. Dec-09 Avantes 59 www.avantes.com [email protected] Converting merged spectra to Excel Converting a merged file to Excel is similar to a non-merged conversion to Excel. The header is more comprehensive, because it includes the main parameter settings for all spectrometer channels, but the data format is the same. All the selected files that share the same merge group name (e.g. merge2) and wavelength data (first column) will be exported to the same tab sheet in Excel. However, if the same merge group name is found in different files, but the wavelength data between those files is different, then a new tab sheet is created with the merge group name appended with a sequence number like merge1_1 in the figure above. The reason for different wavelength data in the same merge group can be a change in spectrometer channels in the merge group, a change in start/stop wavelength in one or more channels, or e.g. a new wavelength calibration. Individually processed channels yield files in the merged file format which include only 1 spectrometer channel. (They were placed in the individual column in the merge settings). These files are exported to the tab sheet <serialnr> followed by an x, like 0610063U1x in the figure above. Converting merged spectra to JCAMP The JCAMP-DX format requires a .dx file extension which can become troublesome if files with the same filename but with different file extensions are converted to Jcamp. For example AVANTES0001.ABS and AVANTES0001.ABSX or AVANTES0001.TRM will all be converted to AVANTES0001.dx and this file will then only contain the last conversion. DX files have a fixed format and the wavelength column is linearized in the conversion. 60 Avantes Dec-09 www.avantes.com [email protected] 3.3 View Menu 3.3.1 View Menu: Scope Mode The display is set to Scope Mode, showing a real time raw data signal, with on the Y-axes the read out of the AD-converter and on the X-axes the calculated wavelength. 3.3.2 View Menu: Absorbance Mode In Absorbance Mode, the absorbance at pixel n is calculated using the current sample, reference and dark data sets in the following equation: samplen − dark n An = − log ref n − dark n 3.3.3 View Menu: Transmittance/Reflectance Mode In Transmittance Mode, the transmittance at pixel n is calculated using the current sample, reference and dark data sets in the following equation: samplen − dark n Tn = 100 * ref n − dark n As described in section 3.2.9.9, the reference (white) percentage of 100 can be customized. The percentage of transmittance is mathematically equivalent to the percentage of reflectance and can also be used for reflectance experiments (see also section 3.2.9.11). 3.3.4 View Menu: Irradiance Mode If the Absolute Irradiance Measurements Module has been ordered with AvaSoft, this option will show the absolute energy output in µWatt/cm2/nm. An elaborate description about the experimental setup in case of absolute irradiance can be found in section 4.4. Dec-09 Avantes 61 www.avantes.com [email protected] If the absolute irradiance application is not available, a light source of known color temperature is needed as a reference, for example the AvaLight-HAL with color temperatures of 2850K at default jumper setting. The relative radiance energy at wavelength λ is then calculated using the current sample, the reference and the dark data sets: S λ = Bλ * (sampleλ − dark λ ) Where Bλ is the computed component of the spectral distribution of the blackbody radiant emmittance (at user selected temperature in degrees Kelvin), divided by the current reference data at wavelength λ How to take relative irradiance measurements with AvaSoft 1. Start the AvaSoft software, and click the Start button in the main window. 2. Connect a fiber to the Spectrometer input port. 3. Adjust the Smoothing Parameters in the Setup menu to optimize smoothing for the Fiber/Slit diameter that is used. 4. Set up the experiment such that the other end of the fiber points at the sample of light to be determined (use a fixture for the best results). Usually some sort of spectrum may be seen on the screen, but it is possible that too much or too little light reaches the spectrometer at the present data collection settings. Too much light means that, over a certain wavelength range, the signal is overloaded shown as a straight line at any arbitrary height, even near zero. This can usually be solved by a shorter integration time. The integration time can be changed in the main window, in the white box below the start/stop button. If AvaSoft is collecting data, the start/stop button shows a red ‘stop’ and the integration time box is gray, indicating that it cannot be changed. After clicking the ‘stop’ button the data acquisition stops and the integration time can be changed. The result of the changed integration time can be viewed after clicking the green ‘start’ button. Try to adjust the integration time, such that the maximum count over the wavelength range is around 90% of the full ADC scale (14750 counts for the 14bit ADC, 59000 counts for the 16bit ADC). When at minimum integration the signal is still too high, fibers with a smaller diameter can be used. When not enough light reaches the spectrometer, likewise a longer integration time should be entered. 5. When a good spectrum is displayed, turn off the light source. 6. Now save the Dark data. This is done by File-Save Dark from the menu or by clicking the black square on the left top of the screen with the mouse. 7. Turn on the reference light source of known color temperature (2850K for AvaLight-HAL with default jumper setting) and set up the fiber end that is not connected to the spectrometer, so that a good spectrum is displayed on the screen. Note that the integration time or fiber type may not be changed while measuring the reference data. If there is too much light, adjust the focusing of the light source, so less light is coupled into the fiber. As long as only light from the reference light source and no ambient light is coupled into the fiber, this will not influence the spectral distribution, only its height. Try to set up the fiber such that the maximum count over the wavelength range is around 90% of the full ADC scale, which is 14750 counts for the 14bit ADC, 59000 counts for the 16bit ADC). 8. Save the Reference data. This is done by File-Save Reference from the menu or by clicking the white square on the left top of the screen with the mouse. 9. Note that the whole operation of saving a reference file does not need to be carried out each time a new experiment is started. The reference data are saved in a file called ref*.dat and can be loaded next time by choosing the option File-Load Reference. After saving or loading reference and dark the irradiance mode can be chosen by clicking the ‘I’ button or by the menu option ViewIrradiance mode. First a message box appears in which the value of the color temperature in Kelvin 62 Avantes Dec-09 www.avantes.com [email protected] of the light source that has been used as a reference can be entered. If light from the reference light source is viewed, the Planck-curve for the color temperature of the reference light source is displayed. The maximum of the reference Planck-curve has been set to 100. 3.3.5 View Menu: Change Graph Scale After selecting this option, a dialog is shown in which the range for both X- and Y-axis can be changed. To switch to the full scale, the View-Graphic Reset option, or the mouse zoom-out feature can be used. By clicking the Save button in this dialog, the settings for X-axis and Y-Axis will be saved to a file and can be restored in the future by selecting the menu option “View-Goto Preset Scale” or by clicking the corresponding button in the button bar. 3.3.6 View Menu: Graphic Reset When selecting this option, the graph will be reset to the default X- and Y-axes. 3.3.7 View Menu: Autoscale Y-axis By using this option, the graph will be rescaled on-line. A maximum signal will be shown at about 75% of the vertical scale. 3.3.8 View Menu: Goto Preset Scale By clicking this menu option, the scale for X- and Y-axis will be set to a range that has been set before. The same result can be achieved by clicking the Goto Preset Scale Button in the button bar. Dec-09 Avantes 63 www.avantes.com [email protected] 3.3.9 View Menu: Grid Enable With the Grid Enable option activated, a grid will be displayed in the graph as shown in the figure below. 3.3.10 View Menu: Progress Bar Enable If using long integration times or a high number of averages, it can take a few or more seconds before a new scan is received by the application. To get an indication about how much time it will take until the next scan arrives, a progress bar can be displayed. After enabling the progress bar by clicking the menu option, it will be displayed after the next scan has arrived. The progress bar will be shown only if the time between scans is more than one second. The time between scans is roughly the integration time, multiplied with the number of averages. However, if the number of averages is high, the time between scans can get longer because of the overhead time that is spent on transmitting the high number of average spectra to the PC. 64 Avantes Dec-09 www.avantes.com [email protected] 4 Applications 4.1 Applications: History Channel Functions 4.1.1 History Application: Function Entry With the History Application, the output of self defined functions or integrals can be followed in a graph against time. Up to 8 functions can be followed simultaneously. The functions are defined in the dialog at the right, which is shown after the History-Function Entry option has been chosen. The functions F1 to F8 can be selected by clicking the corresponding TAB sheet at the top of this dialog. Furthermore, a number of general (function independent) parameters can be entered, below of the function TAB sheets. Function Type The first time that the Function Entry dialog is activated, all 8 functions are not activated (Function Type = None). To define a function, the Function Type radio button needs to be changed from None to: Integral, User Defined , View Spectrum or Peak. After defining the function type, the Measure Mode, Function Definition and Function Display Settings can be set. Dec-09 Avantes 65 www.avantes.com [email protected] Measure Mode The four possible modes (Scope, Absorbance, Transmittance or Irradiance) are described in section 3.3.1 to 3.3.4. Note that if the selected measure mode is Absorbance, Transmittance or Irradiance a reference and dark spectrum needs to be saved or loaded before the History Channel Measurements can be started. Function Definition The parameters that need to be entered in the Function Definition Box depend on the Function Type that has been chosen: Integral, User Defined, View Spectrum or Peak. Function Definition-Integral In case a function is defined to display the integral versus time, the following parameters can be set: Spectrometer Channel. The default is Master, but in case more channels are available, this can be changed to Slave1, Slave2…..up to Slave7. The “from” and “to” edit boxes may be changed to specify the wavelength range in nanometer over which the integral needs to be calculated. Finally, a multiplication factor can be entered. The value entered here is multiplied with the calculated integral. Function Definition-User Defined If you want to display the output of a self defined function against time, a function needs to be defined first. You can either enter a user defined input function in the dialog box, or assign a script to the history channel. Input Functions: A comprehensive example of an input function is given in the dialog, but it illustrates only a few of the functions AvaSoft can handle. A list of allowed operators and functions is given below: Operators: *, /, +,Functions: log(x) = natural log log10(x) = log base 10 exp(x) = e to the power of x sqrt(x) = square root Additionally, the wavelength signal for master and slave channel(s) can be entered by: m(wavelength in nm) = master s1(wavelength in nm) = slave1, s2(wavelength in nm) = slave2, etc. 66 Avantes Dec-09 www.avantes.com [email protected] For example: the function that needs to be entered to follow the intensity of the HG peak against time at the second slave channel is: s2(253.65) Scripts: A scripting feature has been added to allow you to use more complicated calculations with many more mathematical and logical functions. Scripts will also allow you to combine the results of several history channels. AvaSoft uses the Microsoft VBScript language that comes with your copy of Windows. We have included a help file for VBScript for your reference. You can reach it from the main menu by selecting ‘Help’, ‘VBScript’. It lists among other things all available operators and functions. When you edit a script, either the previous script for the channel will be shown, or a new starter script will be generated if there is no previous script. AvaSoft includes a simple script editor. The scripts are plain ASCII files, named Fx_script.txt, where x is the history channel number, from 1 to 8. A starter script has the following contents: Function F2(value) F2=0 End Function You can elaborate on this function, as long as there is a value assigned to F2 in the end. In this case, F2 will be assigned the value 0. You can refer to the other history channels with the predefined variables F1 to F8. If you want to use data from the spectrometer, you will need to assign other history channels to e.g. wavelength values or integrals. The following script defines the function value for F3 as the quotient of F1 and F2. Function F3(value) F3=F1/F2 End Function Please do not refer to the function value for the script itself. You can also not refer to other functions, if these are themselves assigned to a script. This will result in a scripting run-time error. If you want to use code from another script, please copy the necessary lines from that script into the one your working with. Please understand that a script is executed by an interpreter, on a line by line basis. If you make a syntax error in your script, it will usually only show at the moment the line with the error is executed, as a runtime error. Nothing will stop you, for instance, from entering the following script for function 3: Function F3(value) F3=F1/0 End Function Running this script will result in the run-time error at the right: Dec-09 Avantes 67 www.avantes.com [email protected] If you refer to channels that are undefined (Function Type ‘None’), they will be handled as uninitialized variables by VBScript, with value 0. This is the case for all uninitialized variables you might use in your scripts. Finally, a small example to monitor the integral of a peak between 522 nm and 550 nm, in which an offset is subtracted. The offset area is the area below of the straight line between the output at 522 nm and the output at 550 nm. F1 is defined as a user defined input function: m(522) F2 is defined as a user defined input function: m(550) F3 is defined as the zero-based integral between 522 nm and 550 nm. The script for function F4 can then be written as: Function F4(value) If F1 > F2 Then offset = 28*(F2 + (0.5*(F1-F2))) Else offset = 28*(F1 + (0.5*(F2-F1))) End If F4 = F3 - offset End Function Function Definition-View Spectrum The View Spectrum function does not display function output against time. Instead, the wavelength range that has been entered in the Function Definition Box will be displayed at the X-axis. The spectrum for the selected spectrometer channel will be displayed in the selected measure mode. In combination with AvaSoft-XLS, the View Spectrum mode can also be used to export the spectra online to Excel (section 4.6) If the History Channel Functions are used to track the intensity or wavelength of a peak (see below for the Function Definition – Peak), a graphical feature can be used to visualize the peak changes in a spectrum. The number of peaks to display in the spectrum can be entered. This number (between 0 and 100) is the number of vertical lines that will be drawn in the spectrum, each vertical line representing one of the detected peaks in the past. • The height of the vertical line is equal to the peak intensity. • The wavelength at which the vertical line is drawn in the spectrum corresponds to the wavelength of the detected peak. • The color of a vertical line represents the oldness of the peak: Most recent peak is red, going back in time followed by orange, green and blue. All older peaks are gray colored, from light gray (oldest peak) to dark gray (one peak older than blue). The time interval at which the vertical lines are updated is the same as the time interval at which the function output is saved (to be entered under Save every x Seconds under Save Function Output). 68 Avantes Dec-09 www.avantes.com [email protected] For example, suppose the function output will be saved every 3 seconds, and the Nr of peaks to display has been set to 10 in function F1. After starting the History Channel Measurements, the peak in the spectrum drawn for F1, will be marked by a red vertical line immediately. In the next 3 seconds, the spectral peak may vary in height or position but the red vertical line remains at the same place and height. After 3 seconds, the red vertical line becomes orange, and a new red line will be drawn at the position and with the height of the peak detected at that moment (t=3). After 6 seconds another line is drawn and the colors are shifted again, so that red is most recent, then orange, then green. At t=27 seconds, the 10th vertical line is drawn, again red for the most recent, the oldest is now represented by a light gray color. At t=30 seconds, the oldest peak is removed from the list (since in this example the Nr of peaks to display is 10), a new one is added and the colors are shifted according to the definition etc…. Function Definition-Peak In case a function is defined to display a peak versus time, the following parameters can be set: The Spectrometer Channel. The default is Master, but in case more channels are available, this can be changed to Slave1, Slave2….. up to Slave7. The “from” and “to” edit boxes may be changed to specify the wavelength range in nanometer, which will be evaluated in the peak search. Finally, a selection can be made to define the Peak Output: Wavelength or Intensity. If both wavelength and intensity need to be followed against time, one of the functions (F1..F8) can be used to follow the peak wavelength, and another function to follow the peak intensity. To visualize the peak changes, a third function can be set to “View Spectrum” with e.g. the wavelength range set to 455457 as well and the nr of peaks to display set to 10. In the figure above, the resulting output will be the wavelength of the highest peak between 455 and 457 nanometer. If the intensity button had been selected, the function output would have been the intensity of the highest peak between 455 and 457 nanometer. Function Display Setting For Integral, User Defined and Peak functions, the output can be displayed graphically against time. The amount of time that will be displayed at the X-axis can be set manually by clicking the Fixed radiobutton. If set to Auto, the time axis will be set to 1 minute. This option is not available if the View Spectrum Function Type has been selected, because the X-axis range is in that case in nanometers, and determined by the wavelength range as described above. The Y-Axis can also be set to Fixed or to Auto. The Auto option will set the Y-axis range to the minimum and maximum function values that are in the list of measured datapoints. Dec-09 Avantes 69 www.avantes.com [email protected] Function Independent Parameters Function Independent Parameters - Display no graphics to speed up data processing Below the TAB sheets for function definition an option can be enabled or disabled to speed up data processing by not displaying the graphics during the measurements. If an application requires fast data processing (e.g. more than 10 scans per second), this option should be enabled. If saved to an output file, the data can be displayed graphically after the time series experiment has been ended, as described in section 4.1.3: History-Display Saved History Graph. Function Independent Parameters - Save Function Output The results of a time series experiment will be saved to an ASCII-file if the radio button “Save Function Output” has been selected. A number of seconds between saving can be entered for data reduction, in case measurements are carried out over long periods. Entering a value of zero results in saving every scan. The name of the file to which the data will be saved, can be changed after clicking the “Change Output File…” button. Last option in the “Save Function Output” box is to enable or disable the possibility to create a backup file during the measurements. If this option is enabled, AvaSoft will create a backup file with the same filename, but with the extension *.bak (also in ASCII). This backup file is updated every scan and can be used in case the filename that has been selected has failed to save the data, for instance because of a power failure during the measurements. Save HCF…/Load HCF buttons AvaSoft automatically saves all parameters (function definition, save options) to the file hcf.ini, and restores these parameters, the next time AvaSoft is started. With the Save HCF… and Load HCF… buttons, it’s also possible to save these parameter settings to (and load from) a file with the extension *.hcf. With this feature it is possible to save for each experiment a different HCF file, so it can be loaded a next time the same settings are required. The left figure below shows the dialog in which the name of the hcf file can be entered after clicking the save HCF… button. The right figure below, which is displayed after clicking the Load HCF… button, illustrates how to select an earlier saved HCF file. 70 Avantes Dec-09 www.avantes.com [email protected] After the definition of one or more functions, the OK button is clicked to confirm, the CANCEL button to leave the dialog without changes. If the OK button is clicked, AvaSoft performs a number of checks on the data that has been entered. If no warnings show up, the parameters that have been entered are accepted, and the measurement can be started by the History – Start Measuring menu option. 4.1.2 History Application: Start Measuring This option displays the output against time for the history functions that have been defined in the History Channel Function Entry dialog box. If the option “Display no graphics to speed up data processing” has been marked in the function entry dialog, the function output will be shown by numbers only, which are updated each time a new scan is saved to the output file. There are six buttons at the top of this window: an Exit button, a Pause/Start button, a Save Reference button, a Save Dark button, an Info button and a Print button. If the red Exit button is clicked, the time measurements are ended and the main window and menu is activated again. The yellow Pause button can be used to stop the time measurements temporarily. After clicking the Pause button, data acquisition stops and the text on the button changes to a green Start. If the Start button is clicked, data acquisition is activated again and the text changes back to the yellow Pause again. The Save Reference and Save Dark buttons have the same functionality as in the main window. The Info button shows the Function Entry dialog, in which all parameters can be viewed (not edited) while the measurement is running. By clicking the Print button, the graphics that are displayed can be printed during the run. First the printer specific dialog shows up in which the print options can be set. For example, if only one graph of the four in the figure above need to be printed, this graph can be selected by the page(s) radiobutton. All graphics are printed full size on a different page. Zoom features In each graph the same zoom features apply as in the main window (except for scaling the Y-axis with the mouse wheel). However, zooming in over the X-axis while the measurement is running and the X-axis is already scrolling will not be possible, because in that case the X-axis is updated with each new scan. Clicking the pause button to take a snapshot will solve this problem. Zoom in: select a region to be expanded to the full graph. To select this region, click the left mouse button in the white graphics region and drag it downwards and to the right. After releasing the left mouse button, both the X- and Y-axis will be rescaled to the new values of the selected region. Dec-09 Avantes 71 www.avantes.com [email protected] Zoom out: drag with the left mouse button within the white graphics region, but in stead of dragging the mouse downwards and to the right, drag it into another direction. After releasing the mouse button, both the X- and Y-axis will be reset to their default values. Move X-Y: dragging with the right mouse button results in moving the complete spectrum up or down and to the left or right. 4.1.3 History Application: Display Saved History Graph If time measurement data have been saved, the resulting ASCII file can be displayed graphically by selecting this file in the dialog that is shown after clicking the “Display Saved History Graph” menu option. After clicking the “Open” button, the function output of the functions with function type “Integral” or “User Defined” is displayed against time. Both X- and Y-axis are set to their full scale, which is determined by the minimum and maximum values in the list. The zoom features, as described in section 4.1.2, can be applied, to zoom in on an interesting time interval. A description for the print button can also be found in section 4.1.2. Since the History Channels Output file is in ASCII, this file can be easily imported in a spreadsheet program like Microsoft Excel. The data in the file can also be viewed with a text editor, like Microsoft Word, or with Notepad. An example of the file format is given on the next page: 72 Avantes Dec-09 www.avantes.com [email protected] History Channel Functions Measurement Report Measurements started at 29/06/01 Time: 15:06:29 Integration time: 3 ms Average : 1 scans Description of the Functions: FUNCTION 1: User Defined Function: m(400). Scope Mode. FUNCTION 2: User Defined Function: m(500). Absorbance Mode. FUNCTION 3: User Defined Function: m(600). Transmittance Mode. FUNCTION 4: User Defined Function: m(700). Irradiance Mode. FUNCTION 5: Integral Master Channel, between 380,0 and 780,0 nm. Multiplied with: 1,000. Transmittance Mode. FUNCTION 6: View Spectrum in Transmittance Mode. No Data Saved FUNCTION 7:Not Activated FUNCTION 8:Not Activated Time SecondsF1 F2 15:06:29 0,62 79,79 15:06:30 0,77 15:06:30 F3 F4 F5 -2,294E-3 100,8 74,11 40192 81,84 -2,059E-3 100,9 74,17 40236 0,92 81,79 -3,756E-3 100,2 73,77 40201 15:06:30 1,07 84,69 -3,209E-3 101,0 73,43 40202 15:06:30 1,22 82,19 -7,877E-4 100,3 74,11 40188 Dec-09 Avantes 73 www.avantes.com [email protected] 4.2 Applications: Wavelength Calibration Please refer to section 3.2.2 for a description about the polynomial that converts the pixelnumber on the detector into the corresponding wavelength at the X-axis in AvaSoft. If a Wavelength Calibration light source is available, together with suitable optical fibers, an automatic wavelength calibration can be performed. The peaks for the Mercury-Argon calibration source (AvaLightCAL) are by default loaded in AvaSoft. It’s also possible to import the peaks that will be used in the calibration from file by selecting the “File” radio button at the right of the “Find Peaks” button. This option also allows you to import peaks from different calibration sources such as the Avalight-CAL-NEON or AvaLight-CAL-AR. The files that can be imported are in ASCII format and can be edited with any text editor, e.g. Notepad. The extension for these files is “.lit” and the data is presented in three columns: <wavelength in nm> <intensity in arbitrary units> <peak order> An important precondition for a successful auto calibration is the absence of saturation. The easiest way to assure this is to select the ‘check on saturation’ option (section 3.2.9.1). If the spectrometer is saturated at minimum integration time, a fiber with smaller core diameter (e.g. FC-IR008-2) needs to be used. As an alternative, the incoming light can be attenuated e.g. by using an attenuator (FOA-Inline) or neutral density filter. 4.2.1 Calibrate Wavelength Application: Perform New Calibration The procedure to perform an auto calibration is as follows: - Connect the fiber to the AvaLight-CAL light source and to the spectrometer channel to be calibrated. - Choose a suitable integration time so as not to saturate the detector. The peaks can be seen in scope mode. - Select the menu option ‘Wavelength Calibration-Perform New Calibration’. - The auto calibration routine will now search for a number of peaks; initially it will look for 5 peaks in the data from the Master channel. - The spectrometer channel and the number of peaks to look for can be altered. A new search can be performed by pressing the ‘Find Peaks’ button. The peaks are shown in 3 columns. The first column shows the position of the peaks found. The second column shows the position of a suggested standard peak, if available. The last column lists the difference between the first two columns. You can edit the values of the second column by selecting them with the mouse. - Select the polynomial order. In most cases a third order polynomial will show an excellent fit (see figure above) - The “include 2nd order peaks” option can be enabled if second or third order peaks should be added to the list of available literature peaks (e.g. 507.30 nm as second order peak for 253.65). In most spectrometers, the second order effects are eliminated by filters or coatings, but if these options have not been added to the spectrometer, and second order peaks are available, then these can be included in the calibration. The central column cells will be marked green if a second order peak is found and yellow if a third order peak is found. 74 Avantes Dec-09 www.avantes.com [email protected] - Press the ‘Calculate’ button. If your calibration is successful, you will be asked to confirm new coefficients. Select ‘OK’ and the new calibration will be applied immediately. At least 3 peaks are needed to successfully complete a new calibration. Try to calibrate with more peaks. Selecting too many peaks can however lead to peaks that cannot be matched with standard wavelengths. 4.2.2 Calibrate Wavelength Application: Restore Original Calibration This option enables the user to restore the calibration coefficients to their original values, i.e. the values that AvaSoft was shipped with. If a new calibration was performed with a limited number of peaks, or over a limited wavelength range, the results could be less favorable. This option allows the user to undo unwanted changes to the calibration. Dec-09 Avantes 75 www.avantes.com [email protected] 4.3 Applications: Color Measurement The AvaSoft Color Application has been developed to perform on-line color measurements with a spectrometer system. It can be used for reflective color measurements, in earlier versions of AvaSoft called “color of object measurements”. The CIE 1976 L*a*b* color parameters are calculated, as well as other frequently used parameters, like Hue, Chroma and X, Y, Z. These parameters can be displayed in a CIELAB chart or in a graph versus time. It’s also possible to save the measured L*a*b* values online to a database and use one of the products from the database as a reference color. By comparing the measured L*a*b* values to the stored database values, color differences (∆ELab, ∆L*, ∆a*, or ∆b*) can be measured as well. Emissive color measurements can be done to measure the color of a light source (e.g. LED’s). These measurements require an irradiance spectrum to calculate the color parameters x, y and z. With AvaSoft’s Irradiance application, it is possible to perform irradiance measurements with a lot higher accuracy than when using the relative irradiance mode (which assumes a perfect blackbody light source with known color temperature). For this reason the emissive color or “color of light” calculation is one of the features in the Irradiance Application. 4.3.1 Color of an Object - Background The color of an object can be expressed by the CIE 1976 (L*a*b*) color space. L* describes the lightness of the color. A positive value of a* describes the redness of the color, a negative a* the greenness. Similarly, yellowness or blueness is expressed by coordinate b*, which is positive for yellow and negative for blue. The L*a*b* values are derived from the CIE tristimulus values X, Y and Z of the sample (object) and the standard illuminant tristimulus values Xn, Yn and Zn. The standard illuminant tristimulus values for Xn, Yn, and Zn are constant and depend only on the type of standard illuminant that has been chosen. The CIE tristimulus values X, Y and Z of the color of an object are obtained by multiplying the relative power P of a standard illuminant, the reflectance R (or the transmittance) of the object, and the CIE standard observer functions xλ, yλ and zλ (2 degrees or 10 degrees angle). The integral of these products over all the wavelengths in the visible spectrum (380 to 780 nm with a 5 nm interval) gives the tristimulus values. 76 Avantes Dec-09 www.avantes.com [email protected] The chromaticity coordinates x, y and z are obtained by taking the ratios of the tristimulus values (X, Y and Z) to their sum: x= X (X + Y + Z ) y= Y (X + Y + Z ) z= Z (X + Y + Z ) Another well known way to present the color parameters a* and b* is by their hue angle (h*) and Chroma (C*). Hue angle is measured in degrees starting with h*=0 in the red direction (+a*) and increasing counterclockwise: h * = arctan b* a* Chroma is defined as the length of the line from the point a*=b*=0 to the sample point: 2 C * = a* + b* 2 To describe color differences, a well known parameter is ∆ELab, which is defined as: ∆E Lab = (∆L*) 2 + (∆a*) 2 + (∆b*) 2 In which, ∆L*, ∆a* and ∆b* represent the difference in L*a*b* values between the reference color and the actual measured L*a*b* values. 4.3.2 Menu option: Color Measurement After selecting the menu option “Applications-Color Measurement” a dialog is displayed in which the input parameters can be set. The dialog shows two tabbed pages: one is called “LABChart” and shows the input parameters for displaying the color measurements in a color chart; the other one is called “Time Series” and shows all input parameters for displaying up to eight color parameters in a graph versus time. The input parameters will be described in detail in sections 4.3.2.1 (LABChart) and 4.3.2.2 (Time Series). The color measurements are started by clicking the OK button. AvaSoft returns to the main window if the Cancel button is clicked. Dec-09 Avantes 77 www.avantes.com [email protected] 4.3.2.1 LABChart The color measurements in the LABChart are started by clicking the OK button in the figure above. The following parameters can be set before the measurements are started: • Spectrometer Channel. If the spectrometer system contains one or more slave spectrometer channels, the spectrometer channel on which the color will be measured can be selected from the drop down box at the upper left corner (showing by default “Master”). Make sure white reference and dark spectra have been saved before for the selected spectrometer channel. • Illuminant. The CIE Standard sources A, B or C or one of the illuminants D50, D55, D65 or D75 can be selected by clicking one of the radio buttons. The default is D65, which is the most widely used illuminant. It represents the power distribution of average daylight, with a correlated color temperature of 6500K. The D50, D55 and D75 have correlated color temperatures of 5000K, 5500K and 7500K. The CIE Standard sources A, B or C represent respectively: Incandescent light (2854K blackbody), Simulated noon sunlight and Simulated overcast sky daylight. Note that there is no relation between the illuminant chosen here and the light source that is used for measuring the color of an object. The selected illuminant is used in calculation of the color parameters. These color parameters will be different if for example A will be selected instead of D65, just as the color of an object will look different in average daylight or in incandescent light (2854K blackbody). • CIE Standard Observer. The original CIE standard observer functions xλ, yλ and zλ were defined in 1931, and are known as the 2 degrees standard observer values. The 2 degrees corresponds with the angle of vision that was used in the experiments to determine these standard observer values. In 1964, the CIE recommended the use of different observer values for a higher correlation with visual perception for large samples. These are known as the 1964 supplementary standard observer, or 10 degrees observer values. Both standards are still in use, and in AvaSoft, the CIE standard observer can be selected by clicking one of the radiobuttons. The default is 2 degrees. 78 Avantes Dec-09 www.avantes.com [email protected] • Display settings. The measurement results can be displayed graphically in 3 charts: 1) the LABChart in which a* and b* are shown by a moving dot in a CIELAB graph 2) the Measured Color Panel, which displays the color which is being measured. Note that the displayed color on the monitor may not match exactly the color of the object (depends on monitor), but it will give a good impression. 3) The Reference Color Panel, which displays the reference color that has been selected under the “reference color” setting. The graphical display can be enabled or disabled by a mouse click for each graph separately. • Display following Color Parameters. The values of the color parameters that are enabled will be displayed below of the charts during the measurements • Save Settings. The color parameters can be saved to an ASCII file during the measurements. The current name and location of this ASCII file is shown under save setting. This filename (and path) can be changed by clicking the “Change Output File” button. The next dialog will be displayed: To start a new file for saving the color parameters, enter a filename that does not already exists (AvaSoft will add the .txt extension), and click Open. If an existing file is selected, the color parameters that will be saved are appended to this file. This way experiments that were saved before can be proceeded, using the same output file. • Reference Color The reference color can be set to compare the L*, a* and b* color parameters during the online measurements with the LREF, aREF and bREF of the reference color. The color differences can be shown during the measurements by dL (=L*-LREF), da (=a*-aREF), db (=b*-bREF) and/or dE (=√ (dL2+da2+db2)). The reference color can be entered manually under “Current Reference Color” in the figure above, or it can be selected from a database file. The database file is a list of reference colors that were saved before to this file, all with a unique ProductID. By default the name of the database file is “empty.pct”. By clicking the DB button, a different database file can be selected, or a new file can be created. Dec-09 Avantes 79 www.avantes.com [email protected] To start a new database file for saving reference colors, enter a filename that does not already exists (AvaSoft will add the .pct extension), and click Open. To open an existing file simply double click on the filename, or select it and click the Open button. The file example.pct can be found in AvaSoft’s main directory and contains a few measured reference colors. To select a reference color from the database file, click the select button, below of the DB button. The contents of the database file will be displayed as shown in the figure below: To select one of the products from the list, click on one of the numbers (1..11) in the first (gray) column. To delete a product from the list, select it and click the delete key on the keyboard. To search for a certain productID or number, click the Find button. To sort the records by ProductID, L-REF, a-REF or b-REF, click on the corresponding column header. A yellow marked ‘1’ will be shown in the column header. By clicking again at the header which is already marked, the sorting direction will be converted. By clicking the Cancel button, the selected product will not be moved to the current reference color in the LABChart settings dialog, and changes (e.g. deleting a product from the list) will be ignored. By clicking the OK button, the current reference color in the LABChart settings dialog is changed to the color which has been selected. To add the current reference color (specified in the LABChart settings dialog) to the database file, the Add button (below of the select button) can be clicked. If the ProductID already exists, a dialog will be shown in which the choice can be made to overwrite the old color parameters with the new ones, or to keep the old values for this productID. As an alternative, a reference color can be added to the database during the online measurements. This can be done only if in the LABChart settings dialog, the option “Add new reference colors to DB when measuring” is enabled. 80 Avantes Dec-09 www.avantes.com [email protected] After all settings are filled in correctly the measurements can be started by clicking the OK button, or using the Enter key on the keyboard. A shortcut to start measuring with LABChart directly (omitting the settings dialog) is clicking the LABChart button in AvaSoft’s main window. The figure at the right shows all color parameters and all 3 charts were enabled. The measurements in the figure are performed with the Master spectrometer channel and illuminant D65 has been selected. The color parameters are calculated with the 2 degrees CIE standard observer values. The filename to which data will be saved can be found in the lower left corner. The button bar in the LABChart shows the following buttons: • The Exit button is clicked to stop the color measurements and return to AvaSoft’s main window. • The white and dark reference buttons have the same functionality as in AvaSoft’s main window. • The “Save as reference color” button is used to update the current reference color. After clicking this button, a dialog is displayed in which a name for the ProductID needs to be entered. If the productID already exists in the database file and if the option “Add new reference colors to DB when measuring” is enabled in the LABChart settings dialog, then a dialog will be shown in which the choice can be made to overwrite the old color parameters with the new ones, or to keep the old values for this productID (see figure at the right). • The select button can be used to select a new reference color from the database, as described in detail on the previous page. • Each time the Save button is clicked, a new record is added to the Filename in the lower left corner. One record contains the following fields: Date, Time, Comments, L, a, b, h, c, X, Y, Z, RefProductID, Lref, aRef, bRef, dL, da, db, dE, Channel, Illuminant and Observer. The Comments field contains the text that is entered in the dialog that is shown after clicking the Save button. Dec-09 Avantes 81 www.avantes.com [email protected] 4.3.2.2 Time Series With time series color measurements, up to 8 color parameters or color differences can be followed simultaneously in a graph against time. The time series settings are defined in the dialog above, which is shown after clicking the Time Series TAB page. The functions F1 to F8 can be selected by clicking the corresponding TAB sheet at the top of this dialog. Furthermore, a number of general (function independent) parameters can be entered, below of the function TAB sheets. The following features can be set separately for all functions F1 to F8: • Spectrometer Channel. If the spectrometer system contains one or more slave spectrometer channels, the spectrometer channel on which the color will be measured can be selected from the drop down box at the upper left corner (showing by default “Master”). Make sure white reference and dark spectra have been saved before for the selected spectrometer channel. • Illuminant. The CIE Standard sources A, B or C or one of the illuminants D50, D55, D65 or D75 can be selected by clicking one of the radio buttons. The default is D65, which is the most widely used illuminant. It represents the power distribution of average daylight, with a correlated color temperature of 6500K. The D50, D55 and D75 have correlated color temperatures of 5000K, 5500K and 7500K. The CIE Standard sources A, B or C represent respectively: Incandescent light (2854K blackbody), Simulated noon sunlight and Simulated overcast sky daylight. Note that there is no relation between the illuminant chosen here and the light source that is used for measuring the color of an object. The selected illuminant is used in calculation of the color parameters. These color parameters will be different if for example A will be selected instead of D65, just as the color of an object will look different in average daylight or in incandescent light (2854K blackbody). • CIE Standard Observer. The original CIE standard observer functions xλ, yλ and zλ were defined in 1931, and are known as the 2 degrees standard observer values. The 2 degrees corresponds with the angle of vision that was used in the experiments to determine these standard observer values. In 1964, the CIE recommended the use of different observer values for a higher correlation with visual perception for large samples. These are known as the 1964 supplementary standard observer, or 10 degrees observer values. Both standards are still in use, and in AvaSoft, the CIE standard observer can be selected by clicking one of the radiobuttons. The default is 2 degrees. 82 Avantes Dec-09 www.avantes.com [email protected] • Function display settings. For each function, one of the color parameters can be selected. Functions for which the color parameter has been set to “None” will be disabled. If one of the color difference parameters (dL, da, db or dE) is selected, the reference color to which the measured color needs to be compared needs to be defined as well. Therefore the reference color definition box (figure below) will be displayed if dL, da, db or dE is clicked. For each function, a different reference color can be selected. A detailed description about the DB, Select and Add button can be found in the previous section. The color parameters that have been set in the functions can be displayed graphically against time. The amount of time that will be displayed at the X-axis can be set manually by clicking the Fixed radiobutton (see figure below). If set to Auto, the time axis will be set to 1 minute. The Y-Axis can also be set to Fixed or to Auto. The Auto option will set the Y-axis range to the minimum and maximum function values that are in the list of measured datapoints. Function Independent Parameters Function Independent Parameters - Display no graphics to speed up data processing Below the TAB sheets for function definition an option can be enabled or disabled to speed up data processing by not displaying the graphics during the measurements. If an application requires fast data processing, this option should be enabled. If saved to an output file, the data can be displayed graphically after the time series experiment has been ended, as described in section 4.1.3: History-Display Saved History Graph. Function Independent Parameters - Save Function Output The results of a time series color experiment will be saved to an ASCII-file if the radio button “Save Function Output” has been selected. A number of seconds between saving can be entered for data Dec-09 Avantes 83 www.avantes.com [email protected] reduction, in case measurements are carried out over long periods. Entering a value of zero results in saving every scan. The name of the file to which the data will be saved, can be changed after clicking the “Change Output File…” button. Last option in the “Save Function Output” box is to enable or disable the possibility to create a backup file during the measurements. If this option is enabled, AvaSoft will create a backup file with the same filename, but with the extension *.bak (also in ASCII). This backup file is updated every scan and can be used in case the filename that has been selected has failed to save the data, for instance because of a power failure during the measurements. Save Setting/Load Settings buttons AvaSoft automatically saves all parameters (color parameters, save options) to the file cootime.ini, and restores these parameters, the next time AvaSoft is started. With the Save Settings and Load Settings buttons, it’s also possible to save these parameter settings to (and load from) a file with the extension *.coo. With this feature it is possible to save for each experiment a different *.coo file, so it can be loaded a next time the same settings are required. The left figure below shows the dialog in which the name of the file can be entered after clicking the Save Settings button. The right figure below, which is displayed after clicking the Load Settings button, illustrates how to select an earlier saved *.coo file. After the definition of one or more functions, the OK button is clicked to start measuring, the CANCEL button to leave the dialog and return to AvaSoft’s main window. After starting the color measurements by clicking OK, the output of the selected color parameters will be displayed against time. If the option “Display no graphics to speed up data processing” has been marked in the function entry dialog, the function output will be shown by numbers only, which are updated each time a new scan is saved to the output file. There are six buttons at the top of this window (see figure below): an Exit button, a Pause/Start button, a Save Reference button, a Save Dark button, an Info button and a Print button. If the red Exit button is clicked, the time measurements are ended and the main window and menu is activated. The yellow Pause button can be used to stop the time measurements temporarily. After clicking the Pause button, data acquisition stops and the text on the button changes to a green Start. If the Start button is clicked, data acquisition is activated again and the text changes back to the yellow Pause again. The Save Reference and Save Dark buttons have the same functionality as in the main window. The Info button shows the dialog, in which all parameters can be viewed (not edited) while the measurement is running. 84 Avantes Dec-09 www.avantes.com [email protected] By clicking the Print button, the graphics that are displayed can be printed during the run. First the printer specific dialog shows up in which the print options can be set. For example, if only one graph of the four in the figure above need to be printed, this graph can be selected by the page(s) radiobutton. All graphics are printed full size on a different page. At the right top of each graph, a color indicator panel shows the color of the sample being measured. If the function output is a color difference value, like dE in the figure above, then a second color indicator panel is shown for the reference color. If time measurement data have been saved, the resulting ASCII file can be displayed graphically by selecting this file in the dialog that is shown after clicking the menu option: Application-History-Display Saved History Graph. After clicking the “Open” button in this dialog, the function output is displayed against time. Both X- and Y-axis are set to their full scale, which is determined by the minimum and maximum values in the list. Zoom features In each graph the same zoom features apply as in the main window (except for scaling the Y-axis with the mouse wheel). However, zooming in over the X-axis while the measurement is running and the X-axis is already scrolling will not be possible, because in that case the X-axis is updated with each new scan. Clicking the pause button to take a snapshot will solve this problem. Zoom in: select a region to be expanded to the full graph. To select this region, click the left mouse button in the white graphics region and drag it downwards and to the right. After releasing the left mouse button, both the X- and Y-axis will be rescaled to the new values of the selected region. Zoom out: drag with the left mouse button within the white graphics region, but in stead of dragging the mouse downwards and to the right, drag it into another direction. After releasing the mouse button, both the X- and Y-axis will be reset to their default values. Move X-Y: dragging with the right mouse button results in moving the complete spectrum up or down and to the left or right. Dec-09 Avantes 85 www.avantes.com [email protected] 4.4 Applications: Absolute Irradiance Application AvaSoft-IRRAD has been developed to perform on-line absolute irradiance measurements with an Avantes spectrometer system. A calibrated light source AvaLight-HAL-CAL or AvaLight-DH-CAL with known energy output (in µWatt/cm2/nm) is used as a reference. Also the calibration of an Avantes spectrometer system can be done in our calibration lab, after which this calibration can be loaded. Color of light parameters can be expressed by the chromaticity coordinated x, y and z. These chromaticity coordinates are obtained by taking the ratios of the tristimulus values (X, Y and Z) to their sum. The tristimulus values X, Y and Z and the spectral irradiance are computed in a wavelength range from 380 nm to 780 nm, using a 1 nm interval. These parameters, as well as the coordinates u, v and the color temperature of an external light source can be calculated and displayed in real-time. For LED measurements, the Dominant Wavelength and Purity are interesting parameters, which can be calculated as well. The Color Rendering Index (CRI) is a measure of the color rendering properties of a light source. The same experimental set up (spectrometer with fiber optics and cosine corrector or integrating sphere) is used to calculate the photometric and/or radiometric parameters of the light to be measured. The calculated output can be displayed and saved in three ways: • In the main Window the data can be displayed as spectral irradiance in µWatt/cm2/nm versus wavelength. • The measurement results can also be displayed in an irradiance chart (figure above), which shows the chromaticity diagram, the irradiance spectrum, the spectrum in scope mode and many parameters for colorimetry, photometry, radiometry and peak measurements. Up to 10 different radiometric parameters and/or wavelength ranges can be selected for which the output will be displayed. • In Time Measurement mode, up to 8 functions can be displayed simultaneously against time. For each function, a different radiometric, photometric, color coordinate or peak output parameter and/or wavelength range may be selected, as well as a different spectrometer channel. 86 Avantes Dec-09 www.avantes.com [email protected] 4.4.1 Background Before irradiance measurements can be done, an intensity calibration is required. The intensity calibration contains the data transfer function for each pixel. The data transfer function is used to convert the scope data (A/D Counts) into irradiance data (in µWatt/cm2) . To be able to calculate the transfer function, a calibrated light source, with known output (in µWatt/cm2/nm) needs to be available. When saving the A/D Counts with the reference light source on and off, we know the relation between the A/D Counts and µWatt/cm2: Caldata n refcal n − darkcal n Caldatan refcaln darkcaln = Intensity of the calibrated light source at pixel n (in µWatt/cm2) from lampfile = A/D Counts at pixel n that were saved with the reference light source on = A/D Counts at pixel n that were saved with the reference light source off When measuring the A/D counts received from a light source different from the calibrated light source (but of course with the same fiber optic cable and diffuser), this relation can be used to measure the intensity at every pixel n (in µWatt/cm2). If samplen is the measured A/D counts at pixel n when looking at the sample light source, and darkn is the measured A/D Counts with the sample light source off, then the equation for intensity In (in µWatt/cm2) becomes: samplen − dark n I n = Caldata n * refcal n − darkcal n If during the intensity calibration a different integration time was used (e.g. 100ms) from the integration time during the sample measurements (e.g. 2 ms), a factor needs to be added to the equation to compensate for this. In the example the factor is 100/2 = 50. Calculating the intensity (in µWatt/cm2) from the measured sample spectrum (in A/D Counts) can therefore be done by the following equation: samplen − dark n * factor I n = Caldata n * refcal darkcal − n n From the irradiance spectrum (in µWatt/cm2), a lot of light output parameters can be calculated: colorimetric, photometric and radiometric. Below, short background information is given about the colorimetric, radiometric and photometric parameters. We also describe the definition of the peak parameters that can be measured as well. Dec-09 Avantes 87 www.avantes.com [email protected] Colorimetry The color of light can be expressed by the chromaticity coordinates x, y and z. These chromaticity coordinates are obtained by taking the ratios of the tristimulus values (X, Y and Z) to their sum: x= X (X + Y + Z ) y= Y (X + Y + Z ) z= Z (X + Y + Z ) The tristimulus values X, Y and Z are computed by: X = k * ∑ I λ * xλ Y = k * ∑ I λ * yλ Z = k * ∑ I λ * zλ where: k = constant (= 1/(Σyλ ) = 0.00934 Iλ = Spectral irradiance at wavelength λ xλ, yλ, zλ = CIE 1931 or 1964 Standard Observer value (2 or 10 degrees angle) at wavelength λ The tristimulus values X, Y and Z and the spectral irradiance are computed in a wavelength range from 380 nm to 780 nm, using a 1 nm interval. The CIE1960 UCS color coordinates u and v are calculated by: u= 4x (− 2 x + 12 y + 3) v= 6y (− 2 x + 12 y + 3) The equation that is used for calculating the color temperature is empirical and assumes a black body radiator: p = ((x-0.332)/(y-0.1858)) Color Temp =5520.33-(6823.3*p)+(3525*p2)-(449*p3) The Color Rendering Index (CRI) is a measure of the color rendering properties of a light source. The CIE has defined 14 standard color samples and the CRI is defined as the mean value of the color rendering values of the first 8 of these standard CIE samples. A CRI of 100 indicates that the sample sources have identical color coordinates under the light source to be tested and the reference light source. A CRI value of 50 is assigned to the CIE standard warm white fluorescent lamp. The CRI calculation method used is based on the CIE 13.3-1995 standard. A reference light source is calculated on the basis of the color temperature of the light source to be tested. The color temperature calculation is done with the McCamy algorithm described above. For color temperatures under 5000K, a standard Planckian radiator is calculated with a color temperature that equals the color temperature of the sample light source. For color temperatures between 5000K and 25000K, a standard daylight distribution is calculated, again with an identical color temperature. The 14 standard CIE samples are then ‘illuminated’ with both light sources, and from the difference in chromaticity values the 14 Special Rendering Indices are calculated, the first 8 of which yield the CRI. 88 Avantes Dec-09 www.avantes.com [email protected] In LED measurements, the Dominant Wavelength and Purity (also known as HelmHoltz coordinates) are often used to describe a color. The Dominant Wavelength can be calculated for a measured sample point S with chromaticity coordinates (Sx,Sy) by drawing a straight line from the midpoint in the chromaticity diagram (E with x=y=0.333) through S towards the edge of the Chromaticity Diagram (spectrum locus). The points at the spectrum locus correspond with a wavelength and the interception of the straight line through E and S with the locus is called the Dominant Wavelength. Purity, is the distance from the midpoint (E) to the sample point (S), divided by that from the midpoint (E) to the spectrum locus (DW): Purity = (E-S) / (E-DW) The method described above is used for all colors with a Dominant Wavelength from 380 to 699 nanometer. If the x,y coordinates are in the triangle area encompassed by the 3 points E, A and B, then the Dominant Wavelength can not be calculated because the interception point through E and S with the spectrum locus (between A and B) does not correspond with a wavelength. In that case the Complementary Dominant Wavelength (CDW) is used. The line from E through S is extended backward in order to determine the Complementary Dominant Wavelength (CDW). DW S E B A Dec-09 Avantes 89 www.avantes.com [email protected] Peak Measurements A typical spectral power distribution of a (green) LED is shown in the figure at the right. A number of peak parameters can be calculated from this spectrum: FWHM and Center Wavelength The Full Width Half Maximum of a peak is the bandwidth (in nanometers) for which the intensity is higher than half of the maximum intensity of that peak. The Center Wavelength is the wavelength halfway between the left and right wavelength where the intensity is half of the maximum intensity. Peak Wavelength Wavelength at the maximum spectral power Centroid Wavelength The total spectral power left and right from the centroid wavelength (integral) is the same. 90 Avantes Dec-09 www.avantes.com [email protected] Radiometry The radiometric parameters can be grouped into three categories: • Radiant Flux [µWatt]: The radiant flux is the total optical power emitted from a source in all directions. The best way to measure the power emitted by a source is to measure the source inside an integrating sphere. This is often done when measuring LED’s. It is also possible to calculate the flux of a source by measuring the irradiance at the surface of the diffuser (cosine corrector or integrating sphere sample port) at a certain distance from a light source. An important assumption in this calculation is that the source should be isotropic and the distance between diffuser and source should be greater than five times the largest dimension of the source (approximation of point source). • Radiant Intensity [µWatt/sr]: The radiant intensity is the optical power per unit solid angle. It is used to quantify the optical power that is emitted by a source into a certain direction. Radiant intensity is calculated from the measured irradiance by multiplication with the square of the distance between source and diffuser surface. It is assumed that the source is a pointsource. • Irradiance [µWatt/cm2]: Irradiance is used to measure the power that is received by a surface. Radiometric measurement can be done in different setups, like with fiber optic cosine corrector or integrating sphere. Both setups can be used to measure the irradiance spectrum received at the surface of the diffuser (cosine corrector or integrating sphere sample port) at a certain distance from a light source. When measuring at a certain distance from the source, the radiant intensity and flux can be calculated as described above. When measuring a light source inside an integrating sphere, the radiant flux can be measured, but radiant intensity and irradiance parameters cannot be measured. Radiometric parameters calculated from the power distribution The power distribution can be easily converted in an energy distribution by multiplying the power with the integration time. The result is the amount of energy that has been emitted or received during one integration time cycle. Another radiometric parameter that can be calculated from the irradiance spectrum, is the number of photons that is received by a surface. Since the number of photons per nanometer is a huge number (even with very low light intensity), the number of Avogadro is used to express the number of photons in mols, or as in our application in µmols. The number of photons per nanometer can be calculated from the wavelength dependent photon energy, and the absolute light energy that is measured. A detailed description how this is done can be found at the next page. The photon count distribution [µMol/(s.m2.nm)] shows the photon flux received per square meter. Other photon count units that can be calculated from this are: • [µMol/(s.nm)] photon flux received at diffuser surface • [µMol/( m2.nm)] photons received per square meter during one integration cycle • [µMol/nm] photons received at diffuser surface during one integration cycle Dec-09 Avantes 91 www.avantes.com [email protected] How to convert a power distribution [µWatt/(cm2.nm)] into a photon count distribution [µMol/(s.m2.nm)] Photon energy E(λ) = h.c/λ e Where: h = Planck´s constant 6,626 068 76 x10-34 c = velocity of light 2,998 x108 m/s λ = wavelength in meters For example, the photon energy at 250 nm and at 1000 nm is: E(250) = (6,626 x 10-34. 2,998 x 108)/ 250.10-9 = 7,946 x10-19 (Joule/photon) E(1000)= (6,626 x 10-34. 2,998 x 108)/ 1000.10-9 = 1,986 x10-19 (Joule/photon) (1) (2) 1eV = 1,60207 x 10⁻¹⁹ Joule, so the photon energy expressed in eV/photon becomes: E(250) = 7,946 x10-19 /1,60207 x 10-19 = 4,9592 (eV/photon) E(1000)= 1,986 x10-19 /1,60207 x 10-19 = 1,2398 (eV/photon) (3) (4) Suppose we measure 20 µWatt/cm2 at a certain wavelength 20 µWatt/cm2 = 20 µJoule/s/cm2 = 0.2 Joule/s/m2 = 0.2/(1,60207 x 10-19 ) eV/s/m2 = 1,248 . 1018 eV/s/m2 (5) Knowing the photon energy at 250 nm and at 1000 nm from (3) and (4), the number of photons that correspond with 20 µWatt/cm2 at 250 nm and at 1000 nm can be calculated from (5) by: for 250 nm for 1000 nm : #photons = 1,248 . 1018 / 4,9592 = 2,517 . 1017 photons/s/m2 : #photons = 1,248 . 1018 / 1,2398 = 1,007 . 1018 photons/s/m2 With 1 mol = 6,02308 x10²³ (Number of Avogadro) 1 µmol = 6,02308 x10¹⁷ So, the number of photons, expressed in µmol/s/m2, when measuring 20 µWatt/cm2 at wavelength 250 nm and also 20 µWatt/cm2 at 1000 nm becomes: for 250 nm : 2,517 . 1017 / 6,02308 .1017 = 0,418 µmol/s/m2 for 1000 nm : 1,007 . 1018 / 6,02308 .1017 = 1,672 µmol/s/m2 . In the table below, the radiometric parameters that can be measured in AvaSoft are listed. Note that a wavelength range needs to be specified over which the parameter spectral output will be integrated. In the first column (Hardware setup), “inside sphere” refers to measurements that are done with the light source inside an integrating sphere, while “outside sphere or cc” refers to measurements that are done with a light source at a certain distance from the sphere or with a cosine corrector 92 Avantes Dec-09 www.avantes.com [email protected] Hardware Setup Parameter Unit Description inside sphere Radiant Flux (Power emitted) µWatt Total optical power emitted from a source inside sphere Energy emitted µJoule Total optical energy emitted from a source, calculated by multiplication of the power with the integration time outside sphere or cc Radiant Flux (Power emitted) µWatt Total optical power emitted from a source, calculated by multiplication of radiant intensity with the solid angle of the light source outside sphere or cc Energy emitted µJoule Total optical energy emitted from a source, calculated by multiplication of the power with the integration time outside sphere or cc Radiant Intensity µWatt/sr Optical power per unit solid angle, calculated by multiplication of irradiance with the square distance between point source and diffuser surface outside sphere or cc Radiant Energy µJoule/sr Total optical energy emitted from a source, calculated by multiplication of the radiant intensity with the integration time outside sphere or cc Power received µWatt Power received at diffuser surface outside sphere or cc Energy received µJoule Energy received at diffuser surface, calculated by multiplication of the power with the integration time outside sphere or cc Irradiance µWatt/cm2 Power received per square centimeter outside sphere or cc Energy/cm2 µJoule/cm2 Energy received per square centimeter, calculated by multiplication of irradiance with the integration time outside sphere or cc Photon Flux/m2 µMol/(s.m2) Photons received per second and per square meter, see for calculation previous page outside sphere or cc Photon Flux µMol/s Photons received per second at diffuser surface outside sphere or cc Photons/m2 µMol/m2 Photons received per square meter during one integration time cycle outside sphere or cc Photons µMol Photons received at diffuser surface during one integration time cycle Photometry Photometry is the measurement of visible light. Unlike radiometry, it is not a purely physical measurement and is calculated considering a 'standard' human visual perception. This is attained by multiplying the radiometric data by the luminous efficacy curve (see figure below) and integrating the product over the visible range (380 – 780 nm). Dec-09 Avantes 93 www.avantes.com [email protected] Luminous efficacy curve 700 Luminous efficacy [lumens/watt] 600 500 400 300 200 100 0 380 430 480 530 580 630 680 730 780 Wavelength [nm] The three categories that were defined for the radiometric parameters can also be used for the photometric parameters. • The photometric equivalent for the Radiant Flux [µWatt] is the Luminous Flux, expressed in Lumens. • The photometric equivalent for the Radiant Intensity [µWatt/sr] is the Luminous Intensity, expressed in Lumens/sr. This unit is equal to Candela. • The photometric equivalent for Irradiance [µWatt/cm2] is called Illuminance, expressed in Lumens/m2. This unit is equal to Lux. Since the geometry of the three categories is the same for radiometry and photometry, the same can be written about the hardware setup: luminous flux can be measured inside an integrating sphere. When measuring a source at a certain distance from the integrating sphere or cosine corrector, the luminous flux can be calculated, assuming that the source is an isotropic point source. The Luminous Intensity [Candela] and Illuminance [Lux] of a sphere can be measured outside the integrating sphere or with a cosine corrector. 94 Avantes Dec-09 www.avantes.com [email protected] 4.4.2 Quick Start Quick Start (1): Perform absolute irradiance measurements using a calibrated lamp 1. Start the AvaSoft software, and click the Start button in the main window. 2. Connect a fiber to the Spectrometer input port. 3. Start the Absolute Irradiance Application software by clicking the menu option: Application/Absolute Irradiance. Click the “Perform Intensity Calibration” button. 4. Select the spectrometer channel that will be calibrated, the calibration lamp file and enter the diameter of the fiber/cosine corrector or integrating sphere sample port that is used, as described in section 4.4.4. 5. Turn on the reference light source (e.g. AvaLight-HAL-CAL or AvaLight-HAL-CAL-ISP). If a cosine corrector is used at the end of the fiber, mount it directly on the reference light source. If an integrating sphere is used at the end of the fiber, put the integrating sphere sample port over the light output port. 6. Verify that the calibration lamp is ON for at least 15 minutes, and click the “Start Intensity Calibration” button. Try to adjust the integration time while looking at the reference light, such that the maximum count over the wavelength range is around 90% of the full ADC scale, which is 14750 counts for the 14bit ADC, 59000 counts for the 16bit ADC. It’s also possible to let AvaSoft search for an optimal integration time by clicking the ‘∫AC’ button. 7. Adjust the Smoothing Parameter to optimize smoothing for the Fiber/Slit diameter that is used. 8. If a good reference signal is displayed, click the white “Save Reference” button. A white line will mark the reference spectrum. Then switch off the calibration lamp, wait until the spectrum becomes flat, near the bottom of the scale, and click the black button to save a dark spectrum. A black line will mark the dark spectrum. 9. Click the “Save Intensity Calibration” button. A dialog shows up in which the current settings in this intensity calibration are shown. If the calibration has been performed with diffuser, the intensity calibration data will be saved to an ASCII file with extension *.dfr, with bare fiber this extension will be *.fbr. The name of the intensity calibration file can be entered after clicking the “Save As” button. With USB2 spectrometers, the intensity calibration can also be saved to EEProm by clicking the “Save to EEProm” button. Click the Close button to Close the dialog. 10. Switch to the Irradiance Chart TAB to enter the hardware setup and select the colorimetric, radiometric, photometric and/or peak parameters of interest (see section 4.4.5.1) . Then click OK. 11. Measure the output parameters in the experiment. If needed, change the integration time, such that the maximum in Scope Mode is around 90% of the full ADC scale, which is 14750 counts for the 14bit ADC, 59000 counts for the 16bit ADC). Block the light path to the spectrometer, and save a dark spectrum. If the (ir)radiance of the light to be measured needs to be displayed against time, click the time measurement TAB in the settings dialog as described in section 4.4.6. 12. The intensity calibration as performed under point 9 can be loaded in future experiments by selecting the option “Load Intensity Calibration”, as described below under Quick Start (2). For the USB2 spectrometers, the intensity calibration that has been stored in the EEProm is loaded automatically during the initialization of AvaSoft. After loading an intensity calibration, a dark spectrum needs to be saved before switching to Irradiance mode. Dec-09 Avantes 95 www.avantes.com [email protected] Quick Start (2): Perform absolute irradiance measurements by loading an intensity calibration 1. Start the AvaSoft software, and click the Start button in the main window. 2. Connect the same fiber (and diffuser or integrating sphere) that was used during the intensity calibration that will be loaded to the Spectrometer input port. 3. Start the Absolute Irradiance Application software by clicking the menu option: Application/Absolute Irradiance. If an intensity calibration has been stored in EEProm before, this will be autoloaded at AvaSoft program initialization. Click the “Load Intensity Calibration” button. A dialog shows up in which the intensity calibration file can be selected. Select the file and click the open button. 4. Switch to the Irradiance Chart TAB to enter the hardware setup and select the colorimetric, radiometric, photometric and/or peak parameters of interest (see section 4.4.5.1) . Then click OK. 5. Measure the output parameters in the experiment. If needed, change the integration time, such that the maximum in Scope Mode is around around 90% of the full ADC scale (14750 counts for the 14bit ADC, 59000 counts for the 16bit ADC). Block the light path to the spectrometer, and save a dark spectrum. If the (ir)radiance of the light to be measured needs to be displayed against time, click the time measurement TAB in the settings dialog as described in section 4.4.6. 4.4.3 Load Intensity Calibration By selecting the menu option ApplicationAbsolute Irradiance Measurement, a window is shown in which the intensity calibration that was saved before can be loaded by clicking the “Load” button. An intensity calibration file contains the data which is necessary to convert the Scope data to Irradiance data. If the spectrometer system has one or more slave channels, it is important to know that the calibration data for each spectrometer channel are saved in a separate file. To measure irradiance data at more spectrometer channels simultaneously, the calibration files for each spectrometer channels needs to be loaded first. After loading an intensity calibration file, a graph is displayed which shows the data transfer function for the loaded channel. The irradiance spectrum is calculated by multiplying the measured scope data (from which a saved dark spectrum is subtracted) with this data transfer function. The intensity calibration is by default loaded from Eeprom. However, if multiple calibrations are available for a spectrometer, the eeprom calibration can be overruled by loading a calibration from file. The filename that holds the intensity calibration needs to include the serialnumber of the spectrometer channel. 96 Avantes Dec-09 www.avantes.com [email protected] If the intensity calibration has been loaded, the “Irradiance Chart” and “Irradiance Time Series” tabs will be enabled. The “Auto Adjust Integrationtime TAB will become available as well. Clicking the irradiance chart or time series tabs allows you to change the settings, before the measurements are started by clicking the OK button. The irradiance chart and time series settings will be described in sections 4.4.5 and 4.4.6. The Auto Adjust Integrationtime Settings tab can be clicked to enable the Auto Adjust Integrationtime feature and to set the parameters that control the change of integration time. A detailed description about this feature can be found in section 4.4.7. 4.4.4 Perform Intensity Calibration If a calibrated light source such as the AvaLight-HAL-CAL or AvaLight-DH-CAL is available, an intensity calibration can be performed. By selecting the menu option Application-Absolute Irradiance Measurement, a window is shown in which the settings for the intensity calibration become visible after clicking the “Perform Intensity Calibration” button. The following settings need to be entered before starting the intensity calibration: • Spectrometer channel • Calibration Lampfile • CC-UV/VIS, Fiber or AvaSphere sample port diameter For a single channel spectrometer, the spectrometer channel will always be set to “Master”. For multichannel spectrometer systems, the spectrometer channel for which the intensity calibration will be performed can be selected from the list (Master, Slave1…). Calibration Lamp The energy output (in µWatt/cm2/nm) for the calibration lamp that will be used can be found in a file with the extension *.lmp. This file needs to be selected by clicking the “Select” button. After the calibration file has been selected, the data can be viewed, edited and/or saved under a different filename by clicking the “View/Edit Lamp Data” button. A dialog with the intensity versus wavelength values for the selected calibration light source is shown, as well as a graph in which the intensity is displayed versus wavelength: Dec-09 Avantes 97 www.avantes.com [email protected] If needed, the data can be edited and saved under another filename by clicking the Save As… button. Before the changed data takes effect, the new filename needs to be loaded with the Select lamp option described above. CC-UV/VIS, Fiber or AvaSphere sample port diameter The hardware setup for which the calibration lamp has been calibrated (CC-UV/VIS cosine corrector, bare fiber or integrating sphere), should match the hardware setup that is used during the intensity calibration. The diameter of the cosine corrector (3900 micron), bare fiber, or AvaSphere (6000, 10000 or 15000 micron for respectively AvaSphere-30, AvaSphere-50 and AvaSphere-80) needs to be entered in micron. It is important that the hardware setup that is used during the calibration, is the same as the hardware setup in the (ir)radiance measurements. 4.4.4.1 Start Intensity Calibration Verify that the calibration is ON for at least 15 minutes, and that the hardware has been setup correctly. Then click the button “Start Calibration”. As a result, the Scope data (A/D Counts) for the selected spectrometer channel will be displayed graphically. Set the smoothing parameter to optimize smoothing for the fiber/slit diameter used (see also section 3.2.3). Set the integration time such that a good reference signal is measured (maximum around 90% of the full ADC scale, which is 14750 counts for the 14bit ADC, 59000 counts for the 16bit ADC). It’s also possible to let AvaSoft search for an optimal integration time by clicking the AutoConfigure Integration time (‘∫AC’) button. 98 Avantes Dec-09 www.avantes.com [email protected] Set the number of scans to Average to a high number to reduce the noise during the intensity calibration. If a good reference signal is displayed, click the white “Save Reference” button in the dialog above. A white line will mark the reference spectrum. Then switch off the calibration lamp, wait until the spectrum becomes flat, near the bottom of the scale, and click the black button to save a dark spectrum. A black line will mark the dark spectrum. 4.4.4.2 Save Intensity Calibration If reference and dark data have been saved in the figure above, the intensity calibration can be saved by clicking the “Save Calibration” button. A dialog shows up in which the current settings in this intensity calibration are shown. If the calibration has been performed with diffuser, the intensity calibration data will be saved to an ASCII file with extension *.dfr, with bare fiber this extension will be *.fbr. The name of the intensity calibration file can be entered after clicking the “Save As” button. The intensity calibration can be saved to Eeprom by clicking the Save To EEPROM button. When saving an intensity calibration to file, make sure to include the serialnr into the filename. The following data will be saved to the intensity calibration file: • Name of light source calibration file (*.lmp) • Spectrometer channel (0=Master, 1=Slave1 etc..) • Integration time in milliseconds • Diameter of diffuser surface in microns • TOTAL_PIXELS (=2048 for AvaSpec-2048) values, which represent the dynamic range (reference minus dark data) at each pixel during the intensity calibration, divided by the intensity of the calibrated light source that was used. • Setting for the Smoothing parameter during the intensity calibration. After an intensity calibration has been performed, a graph is displayed which shows the data transfer function for the spectrometer channel. The irradiance spectrum is calculated by multiplying the measured scope data (from which a saved dark spectrum is subtracted) with this data transfer function. Dec-09 Avantes 99 www.avantes.com [email protected] If the intensity calibration has been performed, the “Irradiance Chart” and “Irradiance Time Series” tabs will be enabled. Clicking one of these tabs allows you to change the settings for the irradiance chart or time series measurements, after which the measurements can be started by clicking the OK button. The irradiance chart and time series settings will be described in sections 4.4.5 and 4.4.6. 4.4.5 Irradiance Chart 4.4.5.1 Irradiance Chart Settings After an intensity calibration has been performed or loaded, the “Irradiance Chart TAB” becomes available in the Irradiance Settings dialog. By clicking the TAB, the Irradiance Chart settings are displayed. The figure at the right shows the settings for Spectrometer Channel, Hardware Setup, Parameter group, Graphics and Save Settings. The Spectrometer Channel setting can be changed, if for a multichannel spectrometer system calibrations have been performed or loaded for more than one channel. The Hardware setup setting is an important parameter, because as described in section 4.4.1 (background) it determines the radiometric and photometric parameters that can be measured, as well as the way these are calculated. If an AvaSphere is used, it is important to know if the light source is measured inside the sphere (like often is done with LED’s), or outside the sphere. This setting can be entered after clicking the AvaSphere button and then inside or outside sphere. The Parameter group setting determines which parameters will be shown in the irradiance chart. By clicking one of the group parameters, the detailed settings for this group become visible. A description about these parameters and how they are calculated can be found in section 4.4.1. By default, only the Colorimetric parameters are enabled. The parameters that are enabled in the figure above will be displayed in the Irradiance Chart. The detailed setting for the radiometric parameters is done while measuring, in the irradiance chart dialog. If the hardware setup is not “source inside sphere”, you can already select if you want to measure only radiometric parameters received at the diffuser surface, or also calculate the power and/or energy emitted by the source. An important assumption when calculating the emitted power or energy is that the source should be an isotropic point source. 100 Avantes Dec-09 www.avantes.com [email protected] If the hardware setup is “source inside sphere”, the detailed setting for the radiometric parameters (emitted power in µWatt or emitted energy in µJoule) is done while measuring, in the irradiance chart dialog. The same difference in hardware setup determines which photometric parameters can be measured. If the hardware setup is not “source inside sphere”, the Illuminance in Lux can be measured. The Luminous flux (the photometric equivalent of radiometric Power) can be measured at the diffuser surface, but it can also be calculated how much lumens are emitted by the source. An important assumption is that the source should be an isotropic point source. In this setup the Luminous Intensity in Candela can be measured as well. If the hardware setup is “source inside sphere”, only the Lumens emitted by the source can be measured. The peak parameter group allows you to enable/disable the following peak information. Detailed settings, like the wavelength range and the radiometric output parameter for which the peak(s) are calculated can be done in the Irradiance chart dialog. The Graphics setting determines which graph will be displayed in the irradiance chart dialog. The Save Settings are used to enter the name of the textfile to which the results of the irradiance chart measurements will be saved. By default this name is irrchart.txt, but by clicking the “Change Output File” button, this filename can be changed. By enabling the “Save Irradiance Spectrum” option, a complete irradiance spectrum will be saved together with the parameter results. The name of the irradiance spectrum file will start with the filename that has been entered (irrchart in the figure at the right), followed by a sequence number and the extension *.irr. The irradiance spectrum files can be saved and loaded from the irradiance chart dialog. Likewise, the complete irradiance chart window can be saved as a Dec-09 Avantes 101 www.avantes.com [email protected] picture together with the parameter results. The name of the picture will start with the filename that has been entered (irrchart in the figure at the right), followed by a sequence number and the extension *.jpg. If all settings have been entered, the measurements can be started by clicking the OK button. To be able to measure the right A/D counts (corrected for the dark spectrum), a warning will be displayed if a dark spectrum has not been saved: 102 Avantes Dec-09 www.avantes.com [email protected] 4.4.5.2 Irradiance Chart Display The irradiance chart displays the graphics and output parameters that were selected in the settings dialog. Moreover, up to ten radiometric parameters can be selected, each with a user defined wavelength range. The measurement results can be saved, and earlier saved spectra can be graphically displayed and compared to the measured spectrum. The integration time and number of scans to average can be changed to optimize the AD Counts for each sample. The figure at the right shows the result for a typical LED measurement inside an Avasphere. If the light source is measured outside the sphere or with a cosine corrector, and the radiant flux [µWatt], radiant intensity [µWatt/sr], luminous flux [Lumens] or luminous intensity [Candela] need to be calculated, then the distance (in meter) and geometry of the lamp (in steradians) can be entered in the irradiance chart window as well. The geometry of the point source is default 4π steradians and is needed only for the radiant and luminous flux calculations. In this section, the following items from the irradiance chart window will be described: • Add/Edit radiometric parameters • Graphics • Button bar The other output parameters are displayed according to the settings in the irradiance chart settings dialog. Background information about all output parameters can be found in section 4.4.1. Add/Edit radiometric parameters There are two ways to monitor the radiometric parameters. The first one is by defining up to ten different parameters or wavelength ranges in the radiometry box at the right side of the irradiance chart window. The second one is by selecting a radiometric parameter in the graph after which the spectrum for the selected parameter will be displayed (see below under graphics). To define an output parameter at one of the ten lines in the radiometry box, simply double click the line or click the Edit button on top and enter the line number. A dialog will be shown in which the radiometric parameter and wavelength range can be specified. Dec-09 Avantes 103 www.avantes.com [email protected] The wavelength range is the spectral range over which the radiometric output will be integrated. For example, by specifying the UV-C, UV-B and UV-A wavelength ranges at three different lines, the irradiance for these spectral ranges can me measured simultaneously (assuming the spectrometer wavelength range includes the specified ranges and has also been calibrated for these ranges). Note that the available parameters depend on the settings in the irradiance chart settings dialog. For example, to be able to measure the radiant intensity, the “Calculate Power and/or Energy emitted by a source” option should be enabled. Graphics Chromaticity diagram Radiometric Graph Scope Data Graph The chromaticity diagram is used to visualize the colorimetric measurements. According to what has been selected in the irradiance chart settings dialog, it will display the locus for the 2 or 10 degrees standard observer. The measured (x,y) coordinates will be displayed in the diagram and a line will be drawn from the midpoint (x=y=1/3) through the measured (x,y) to the edge of the locus, which represents the dominant wavelength. The scope data graph displays the raw A/D counts that are received from the spectrometer. This graph can be used to determine if a good integration time has been set. If the integration time is too low, the radiometric spectrum will be noisy, if the integration time is set too high, the spectrometer detector can be saturated, in which case a saturated label will appear in the Scope Data Graph. The radiometric graph displays the spectrum for the selected radiometric parameter. Just like with selecting the radiometric parameter in the radiometry box, the available parameters depend on the settings in the irradiance chart settings dialog. In the figure at the right, an LED is measured inside an integrating sphere, in which case only the Radiant Flux (emitted power in µWatt) and the emitted energy during one integration cycle (in µJoule) can be selected. See also the radiometric table in section 4.4.1. The selected parameter in the radiometric graph is also used to determine the peaks in the peak measurement box. 104 Avantes Dec-09 www.avantes.com [email protected] The radiometric spectra can be saved and loaded by the “Save” and “Open Saved Graph” buttons (see below under button bar). Button bar The Exit button will close the irradiance chart and return to the AvaSoft main Window. The Pause button will stop data processing to be able to take a snapshot at the spectrum and/or output parameters. The Info button shows information about the current settings, as shown in the dialog below: The last line in this dialog: “Save irradiance spectrum?: Yes” refers to the save setting in section 4.4.5.1. If this option is enabled then all (displayed) parameters will be saved in this example to irrchart2.txt and the spectrum for the selected parameter in the radiometric graph will be saved to irrchart2xxxx.irr, in which xxxx represents the sequence number. If the “Save irradiance spectrum” option is not enabled, only the displayed output parameters will be saved. By clicking the save dark (black) button, a new dark spectrum will be saved. It is recommended to save a new dark spectrum each time after changing the integration time. Clicking the save data button will add the measured data to the textfile. A user comment can be added to the saved data. If a radiometric spectrum and/or irradiance chart picture (.jpg) have been saved with the output parameters, the name of these/this file is also saved in the textfile. Dec-09 Avantes 105 www.avantes.com [email protected] The “Display Saved Graph” button can be clicked to load a radiometric spectrum that was saved before. In the open file dialog, the radiometric spectra that were saved before will be listed. By single clicking a file name, the comment for this file will be displayed in the graph. By double clicking the file name, or by clicking the Open button, the radiometric spectrum will be displayed. This can be repeated for a second filename, which allows you to compare the output of the two spectra graphically. The online measured spectrum will be displayed in the same graph and can be compared to earlier saved spectra as well. The filename and comments for the displayed spectra appear on top of the graph, the text colors are the same as the colors used to draw the spectra. By clicking the (blue or green) filename with the right mouse button, a popup menu for this radiometric spectrum is presented, with the menu options shown in the figure at the right: The “Show Info” menu option displays the hardware settings, measurement parameters and save settings for the spectrum, as shown in the dialog at the left. The Measurement parameters displays the unit of the intensity of the displayed saved spectrum. This can be a different unit than the selected unit for the online measured spectra. Also, if comparing two saved spectra graphically, be aware that these were saved in the same radiometric unit. The other menu options in the popup menu, “Convert to ASCII” and “Convert to Excel” can be used to export the data from the (binary) file with extension *.IRR to a textfile (*.txt) or to a file that can be opened with Excel (*.xls). The “Remove from Chart” menu option clears the saved spectrum. At the right side of the button bar, the integration time and number of scans to average can be changed. The Auto Configure Integration time button can be used to let AvaSoft search for integration time such that the maximum output in scope mode (A/D Counts) is around 90% of the full ADC scale (14750 counts for the 14bit ADC, 59000 counts for the 16bit ADC). 106 Avantes Dec-09 www.avantes.com [email protected] 4.4.6 Time Series Measurement After an intensity calibration has been performed or loaded, the “Irradiance Time Series TAB” becomes available in the Irradiance Settings dialog. By clicking the TAB, the Irradiance Time Series settings are displayed. With time series irradiance measurements, up to 8 radiometric parameters can be followed simultaneously in a graph against time. The functions F1 to F8 can be selected by clicking the corresponding TAB sheet at the top of the Time Series settings dialog. Furthermore, a number of general (function independent) parameters can be entered, below of the function TAB sheets. The following features can be set separately for all functions F1 to F8: • • • Enable/Disable function. The radiometric parameters can be set after clicking the Enable button. Hardware Setup. The Hardware setup setting is an important parameter, because as described in section 4.4.1 (background) it determines the radiometric and photometric parameters that can be measured, as well as the way these are calculated. If an AvaSphere is used, it is important to know if the light source is measured inside the sphere (like often is done with LED’s), or outside the sphere. This setting can be entered after clicking the AvaSphere button and then inside or outside sphere. Spectrometer Channel. If the spectrometer system contains one or more slave spectrometer channels, for which also an intensity calibration has been loaded or performed, the spectrometer channel on which the output parameter will be measured can be selected from the drop down box at the left (showing by default “Master”). Dec-09 Avantes 107 www.avantes.com [email protected] • Parameter. The number of available parameters and the way these are calculated depend on the hardware setup. The figure above shows the settings that are available when measuring with a cosine corrector, or with an integrating sphere at a certain distance from the light source. For each function F1..F8, one of the 35 available parameters can be selected. See section 4.4.1 for background information about these parameters. The colorimetric parameters can be calculated by using the 2 degrees standard observer values or the 10 degrees. If one of the radiometric parameters is selected, the wavelength range needs to be specified. The wavelength range is the spectral range over which the radiometric output will be integrated. If the source is not inside an integrating sphere, the radiant intensity (in µWatts/sr) and radiant energy (in µJoule/sr) can be calculated if the distance from source to diffuser surface has been specified. The radiant flux (µWatts emitted) and emitted energy (µJoule e.) can be calculated if the geometry of the lamp (in steradians) is specified. Distance and Geometry can be entered if the parameter is selected for which these data entries are relevant. If one of the peak parameters is selected, the wavelength range needs to be entered over which the (highest) peak will be calculated. Moreover, the radiometric parameter should be specified to determine a peak parameter. Photometric parameters do not need a wavelength range because for these parameters the range is always from 380 to 780 nm. However, since emitted Lumens and Candela are the photometric equivalent of radiant flux and radiant intensity, the geometry (for emitted Lumens) and distance (for emitted Lumens and Candela) needs to be specified if the source is not measured inside an integrating sphere. If a source is measured inside an integrating sphere, the radiometric parameters that can be measured are limited to radiant flux (µWatts emitted) and emitted energy (µJoule e.), and the photometric parameter that can be measured in this hardware setup is emitted Lumen. • Function display settings. The parameters that have been set in the functions can be displayed graphically against time. The amount of time that will be displayed at the X-axis can be set manually under the X-axis setting. The Y-Axis can be set to a fixed range or to Autoscale. The Autoscale option will set the Y-axis range to the minimum and maximum function values that are in the list of measured datapoints. Function Independent Parameters Function Independent Parameters - Display no graphics to speed up data processing Below the TAB sheets for function definition an option can be enabled or disabled to speed up data processing by not displaying the graphics during the measurements. If an application requires fast data processing, this option should be enabled. If saved to an output file, the data can be displayed graphically after the time series experiment has been ended, as described in section 4.1.3: History-Display Saved History Graph. Function Independent Parameters - Save Function Output The results of a time series color experiment will be saved to an ASCII-file if the radio button “Save Function Output” has been selected. A number of seconds between saving can be entered for data reduction, in case measurements are carried out over long periods. Entering a value of zero results in saving every scan. The name of the file to which the data will be saved, can be changed after clicking the “Change Output File…” button. 108 Avantes Dec-09 www.avantes.com [email protected] Last option in the “Save Function Output” box is to enable or disable the possibility to create a backup file during the measurements. If this option is enabled, AvaSoft will create a backup file with the same filename, but with the extension *.bak (also in ASCII). This backup file is updated every scan and can be used in case the filename that has been selected has failed to save the data, for instance because of a power failure during the measurements. Save ICF/Load ICF buttons AvaSoft automatically saves all parameters (irradiance parameters, save options) to the file irrtime62.ini, and restores these parameters, the next time AvaSoft is started. With the Save ICF and Load ICF buttons, it’s also possible to save these parameter settings to (and load from) a file with the extension*.icf. With this feature it is possible to save for each experiment a different *.icf file, so it can be loaded a next time the same settings are required. After the definition of one or more functions, the OK button is clicked to start measuring, the CANCEL button to leave the dialog and return to AvaSoft’s main window. After starting the irradiance measurements by clicking OK, the output of the selected parameters will be displayed against time. If the option “Display no graphics to speed up data processing” has been marked in the function entry dialog, the function output will be shown by numbers only, which are updated each time a new scan is saved to the output file. There are six buttons at the top of this window (see figure below): an Exit button, a Pause/Start button, a Save Reference button, a Save Dark button, an Info button and a Print button. If the red Exit button is clicked, the time measurements are ended and the main window and menu is activated. The yellow Pause button can be used to stop the time measurements temporarily. After clicking the Pause button, data acquisition stops and the text on the button changes to a green Start. If the Start button is clicked, data acquisition is activated again and the text changes back to the yellow Pause again. The Save Reference and Save Dark buttons have the same functionality as in the main window. The Info button shows the dialog, in which all parameters can be viewed (not edited) while the measurement is running. By clicking the Print button, the graphics that are displayed can be printed during the run. First the printer specific dialog shows up in which the print options can be set. For example, if only one graph of the four in the figure above need to be printed, this graph can be selected by the page(s) radiobutton. All graphics are printed full size on a different page. If time measurement data have been saved, the resulting ASCII file can be displayed graphically by selecting this file in the dialog that is shown after clicking the menu option: Application-History-Display Saved History Graph. After clicking the “Open” button in this dialog, the function output is displayed against time. Both X- and Y-axis are set to their full scale, which is determined by the minimum and maximum values in the list. Dec-09 Avantes 109 www.avantes.com [email protected] Zoom features In each graph the same zoom features apply as in the main window (except for scaling the Y-axis with the mouse wheel). However, zooming in over the X-axis while the measurement is running and the X-axis is already scrolling will not be possible, because in that case the X-axis is updated with each new scan. Clicking the pause button to take a snapshot will solve this problem. Zoom in: select a region to be expanded to the full graph. To select this region, click the left mouse button in the white graphics region and drag it downwards and to the right. After releasing the left mouse button, both the X- and Y-axis will be rescaled to the new values of the selected region. Zoom out: drag with the left mouse button within the white graphics region, but in stead of dragging the mouse downwards and to the right, drag it into another direction. After releasing the mouse button, both the X- and Y-axis will be reset to their default values. Move X-Y: dragging with the right mouse button results in moving the complete spectrum up or down and to the left or right. 110 Avantes Dec-09 www.avantes.com [email protected] 4.4.7 Auto Adjust Integrationtime Introduction In Irradiance mode, the integration time should be selected such that the maximum intensity of the ADC Counts is around 90% of the full scale. In experiments where the light intensity varies slowly during a long period of time (e.g. solar measurements over 24 hours), it is possible to setup the software in such a way that the integration time is autoadjusted if the maximum of the measured intensity in the previous scan is outside certain limits. Normally, when changing the integration time manually, it is always recommended to save a new dark spectrum. If the integration time is automatically changed, the dark spectrum at the new integration time can also be different. To avoid recording a new dark spectrum after each change of integration time, a dark calibration can be done at minimum integration time and long integration time. This dark calibration can be saved to EEProm for all pixels. During the measurements, the dark data is then calculated by interpolating the saved dark spectra at different integration times. 4.4.7.1 Auto Adjust Integrationtime Settings The Settings window as displayed in the figure below is activated by clicking the “Auto Adjust Integrationtime Settings” TAB in the Irradiance settings dialog. Dec-09 Avantes 111 www.avantes.com [email protected] The Auto Adjust Integrationtime feature can be switched on or off by clicking the “Apply” checkbox at the top of the Settings windows. In the limits box, you can change the percentages at which the integration time will be changes. For example, if the full scale is 65535 ADC Counts, and the switching limits are 80% and 90% like in the figure above, the integration time will be increased for the next scan if the maximum Counts measured is lower than 0.80*65535 = 52428. Likewise, if the maximum is more than 0.90*65535 = 58982 Counts, the integration time will be decreased in the next scan. The maximum integrationtime setting will be applied if the calculated integration time for the next scan is longer than this user specified value. This is a useful setting e.g. in a 24 hours/day solar measurements in which case the calculated integration time would otherwise become many minutes during the night. The user specified maximum integration time will also serve as “long” integration time setting during the dark calibration (see below). If the “Recalculate Averages” checkbox is enabled, the number of averages will be recalculated after each change of integration time. The number of averages will be set such that at the new integration time, the total scan duration is close to the user specified duration time (e.g. 10 averages if the calculated integration time is 100ms and the scan duration is 1000ms). The Dark Calibration is needed to calculate a dark spectrum after each change of integration time. The currently available dark calibration spectra and integration times can be displayed in the graph. In the figure above, the dark spectra at 1.10ms and 1000ms (dynamic dark correction ON) for channel 0807040U2 are displayed. A new dark calibration can be done for all channels (in a multichannel system) simultaneously by clicking the Start Dark Calibration button. A reminder will be displayed to block light input for all connected spectrometer channels. Then, a few scans are taken at minimum integration time, followed by a few scans at the integration time that has been entered in the maximum integration time edit box. During the calibration, a counter will be updated after each scan in the dark calibration status box, and the measured dark scans are displayed in the graph for each channel. The dark calibration can always be aborted during the calibration by clicking the Abort Dark Calibration button (e.g. if the light input for one or more channels was not blocked). If the dark calibration is ready, the dialog at the right will be displayed. By clicking Yes, the new dark spectra and corresponding integration times are saved to eeprom and will be used to calculate a new dark spectrum after each change of integration time if the Auto Adjust Integration time feature is enabled 4.4.7.2 Measuring with Auto Adjust Integrationtime If the Auto Adjust Integrationtime option is enabled, and a valid dark calibration has been saved to EEProm, the maximum ADC Counts will be evaluated after each scan and compared against the limits that have been entered in the settings dialog. In Absolute Irradiance mode (main window) and when measuring in the Absolute Irradiance Application (irradiance chart and time series measurement) the integration time will be adjusted if the maximum ADC Counts level is not inside the user specified range. See also the example given in the description of the limits settings above. 112 Avantes Dec-09 www.avantes.com [email protected] 4.5 Applications: Process Control Application Avasoft Process Control allows you to operate digital outputs corresponding with preset levels of your history channels. You can use all eight history channels, as well as the output functions of the Time Series from both the Color and the Irradiance applications. The output of two History Channel Functions can be converted to analog output signals (0..5V). 4.5.1 Digital Output signals AvaSoft supports 8 built-in digital outputs on the AvaSpec, one per history channel. The output pins on the High Density 26-pole Sub-D connector which are used for the process control application are listed in the table below. HD DB26 pins used by AvaSoft Process Control HCF# connector pin 1 2 2 20 3 3 4 21 5 13 6 4 7 22 8 25 GND 4.5.2 8 Analog Output signals Pin 17 and 26 of the HD DB26 connector can be used to convert maximal two History Channel Function output signals into a 0-5V signal. The analog output resolution is 8-bit (0.02V steps) Dec-09 Avantes 113 www.avantes.com [email protected] 4.5.3 Using the Process Control Application in AvaSoft The Process Control application needs to be activated by selecting ‘Application’, ‘Process Control’, ‘Enable’. A checkmark will appear before the menu entry to show that the option is enabled. To set minimum and maximum threshold values for each of the History functions, select ‘Application’, ‘Process Control’, ‘Digital Output Settings’. The box shows 16 values, corresponding with a minimum and maximum threshold value for the 8 history channels. All 16 values can be edited by clicking them with the mouse. In addition, in the third column, you can select whether or not to invert the signal that is output. For each channel, the minimum threshold value may not exceed the maximum threshold value. You cannot leave fields blank, in that case, enter 0. After selecting OK, the settings are written to a binary file called ‘digital.ini’. The minimum and maximum threshold values are indicated in the history graphs with horizontal lines. If ‘Invert’ is not selected, the corresponding output pin will be set high if the history channel output value lies between the minimum and maximum value. It will be set low if the history channel output value exceeds the maximum value OR is smaller than the minimum value. If ‘Invert’ is selected, the corresponding output pin will be set high if the history channel output value exceeds the maximum value OR is smaller than the minimum value. It will be set low if the history channel output value lies between the minimum and maximum value. If you want to monitor both threshold values, you can assign two (identically configured) history channels. To monitor a single level, set one threshold value to the desired level, and the other one to a value that is out of range, e.g. Min to –99999999 and Max to 1000, or Min to 2000 and Max to 99999999. That way, you will only need a single channel per threshold value. An example of running the History Channel functions together with the digital output signals in the Process Control application is shown in the figure at the right. In this example, two History Channel functions were defined. The threshold values for function F1 were set at 99.5 and 100.5 percent transmittance, for function F5 at 0 and 58. These values are represented by the horizontal lines in the graphs. 114 Avantes Dec-09 www.avantes.com [email protected] To specify the History Channel Function range(s) that should be converted into a 0-5V analog output signal, select ‘Application’, ‘Process Control’, ‘Analog Output Settings’. Two analog output signals can be assigned to any history channel. The Chan-0 output is sent to pin 17, and the Chan-1 output to pin 26 of the HD DB26 connector The calculated voltage will be printed between parentheses after the function value in the History Channel and Time Series (color and irradiance application) screens: In this example, with the Min and Max Function Range settings according to the Analog Settings dialog above, the voltage at pin 17 and pin 26 are calculated by: F1: Output = 62.943, corresponds to 5.0*(62.943 - 50.0)/(100.0 - 50.0) = 1.29V F2: Output = 69.192, corresponds to 5.0*(69.192- -100.0)/(100.0- -100.0) = 4.23V Dec-09 Avantes 115 www.avantes.com [email protected] 4.6 Applications: Excel Output AvaSoft XLS is an add-on application that enables Avasoft Full to output history channel data and/or complete spectra to Microsoft Excel. It uses OLE-Automation, which is a technology that enables AvaSoft to remotely control Excel, opening sheets and copying data into cells. On modern hardware, we have been able to copy complete 2048 pixel spectra to Excel with as little as 50 msec. overhead per scan. 4.6.1 Select Source Data Besides enabling Excel output, you will have to select your source data. This is done in the same way it would be done without the Excel output option, with the input screens you use to define History Channel Functions, and Time Series in the Color and Irradiance applications. The only difference is the ‘Save Function Output’ box, which is not used by the Excel Output option. This part is replaced by a separate dialog, which will be described under ‘Settings’. 4.6.2 Enable Excel Output Enable the option by selecting ‘Application’, ‘Excel Output’, ‘Enable’. A checkmark will appear before the menu entry ‘Enable’ to show the status of the option. 116 Avantes Dec-09 www.avantes.com [email protected] 4.6.3 Settings AvaSoft will write the data to three differently formatted sheets, depending on user input in History Channel Function Entry and the Settings dialog. You can enter the Settings dialog by selecting ‘Application’, ‘Excel Output’, ‘Settings’. First, select the mode you want. Export mode You can select Export Mode by selecting the top radio button. In this mode, a predefined number of scans will be logged to new worksheets that Excel will open. Depending on your choice of history channel, one of two formats of sheet (or both) will be opened by Excel. If you select regular history channels, without selecting ‘View Spectrum’, the sheet will be formatted horizontally, with the program adding a new row for each measurement written. Dec-09 Avantes 117 www.avantes.com [email protected] The sheet will be called ‘AvaSoft Data’, the columns contain the following data: Column A contains a data/time value, formatted as ‘dd:mm:yyyy hh:mm:ss’. This is a floating point value, in which the integer part is the day number, starting at January 1, 1900 with day 1. The fractional part represents a decimal time value, where 0.5 is 12:00 h. noon and 0.75 is 18:00 h. This way, differences in date/time can be readily calculated by subtracting values, which would be much more difficult if this was a text representation. Column B contains a time value, representing the elapsed milliseconds since midnight. This value does not have a one millisecond resolution. Remember that Windows is not a real-time operating system. It can, however, be used as a reasonably accurate indicator of the time that passes between scans. Columns C through J contain the 8 different History Channel values. For unselected History Channels, a value of 0 will be entered in the sheet. If you select ‘View Spectrum’ in your choice of History Channels, the sheet will be formatted vertically. As Excel only offers 256 columns per sheet, we need to write a spectrum (which can hold more than 2000 pixels) in a column instead of a row, and add more columns as time passes. 118 Avantes Dec-09 www.avantes.com [email protected] Since there is a maximum of 256 columns per sheet, new sheets will be added after column 256 (‘IV’) is filled. The first sheet will be called ‘F1’ for history channel 1, ‘F2’ for history channel 2, etc. If extra sheets are added, a suffix will be added to this name, e.g. F1_01, F1_02 etc. If the function type “View Spectrum” has been selected for more than one History Channel Function (e.g. Master channel for F1, Slave1 channel for F2), then the different history channel sheets (named F1 and F2) are located in separate workbooks, and must be saved under separate filenames. This is also the case for the sheet with 8 History Channel values, described before. Rows 1 and 2 contain the date/time stamp and the elapsed millisecond value, as described in the previous section. Column A of the first sheet holds the wavelength scale. The wavelength range matches the wavelength range as specified in the History Channel Functions. The lower left half of the Settings dialog can be used to enter the number of scans you want to export to Excel, and the time interval (in seconds) between two scans you want to log. Default values are 1000 scans and no interval, meaning as fast as possible. Continuous Mode You can select Continuous Mode by selecting the bottom radio button. In this mode, data will be written to a single sheet, each scan overwriting the previous one. In the lower right part of the Settings dialog, you can select the workbook the sheet will be added to, thereby enabling you to use your own calculations and graphs in Excel on live data from AvaSoft. Dec-09 Avantes 119 www.avantes.com [email protected] Press the ‘Select File’ button to select the workbook. Please save an empty workbook using Excel if you don’t have a previous workbook to open. AvaSoft will check if a sheet named ‘AvaSoft Data’ is present, and will add this sheet if it is not present. This way, links to the sheet can be preserved between sessions. The sheet contains the following data, at fixed positions: A3 : Date / Time stamp This is a floating point value, in which the integer part is the day number, starting at January 1, 1900 with day 1. The fractional part represents a decimal time value, where 0.5 is 12:00 h. noon and 0.75 is 18:00 h. This way, differences in date/time can be readily calculated by subtracting values, which would be much more difficult if this was a text representation. B3 : Time in milliseconds after midnight This value does not have a one millisecond resolution. Remember that Windows is not a real-time operating system. It can, however, be used as a reasonably accurate indicator of the time that passes between scans. C5-C*** : Wavelength scale (in nm) for first History Channel spectrum D3 : Value for first History Channel (0 if spectrum is selected) D5-D*** : Spectrum for first History Channel. 120 Avantes Dec-09 www.avantes.com [email protected] E5-E*** : Wavelength scale (in nm) for second History Channel spectrum (empty if spectrum is not selected) F3 : Value for second History Channel F5-F*** : Spectrum for second History Channel (empty if spectrum is not selected) etc. *** : depends on the wavelength range selected. 4.6.4 Start Output You start the output the usual way, with ‘Application’, ‘History’, ‘Start measuring’. You can also use the corresponding button on the Button Bar. Please do not perform large alterations of the worksheet, while data is being transmitted. An error ‘Call was rejected by callee’ will be issued if Excel is too busy. Moving around the worksheet should not pose any problems. Save any alterations to your worksheet before starting the transfer to Excel. You do not have to close the worksheet or close Excel. 4.6.5 Stop Output If you want to stop the transfer to Excel give focus to AvaSoft and press ‘Exit’. It may take a few seconds before the buttons appear. Excel will not be closed by AvaSoft. Save your work and close Excel the same way you would when working with Excel manually. We have included a sample worksheet, called ‘Continuous.xls’, which demonstrates linking to the ‘AvaSoft Data’ sheet. In this case, two graphs are drawn from the columns for Channel 1 and 2. The graph and data are continuously updated while data is being transferred to Excel. Dec-09 Avantes 121 www.avantes.com [email protected] 4.6.6 Limitations and Optimization Notes As all scans are stored in memory, it is possible to overflow internal memory with scans in Export mode. Therefore, a limit to the number of scans to store in Excel has been built in. Before a new sheet is added, the amount of memory Excel uses is determined. If this number is larger than half the physical memory installed in the machine, output to Excel will stop. On a 128 MB machine, this corresponds with 7-8 complete sheets (of 256 columns and 2000 rows), roughly 2000 full scans. Limiting the wavelength range will extend your range of scans accordingly. Of course, adding more Ram to your machine will also help raise this limit. On a 3.5 GB machine with Excel 2003, it is possible to save more than 100 complete sheets (of 256 columns and 2000 rows). We have, however, seen limitations in the amount of memory that Excel can use. It looks like there is an internal limit that is hit before internal memory runs out. After this Excel issues an ‘Out of Memory’ message and is no longer functional. E.g. saving your data to disk is not possible anymore. For this reason, an absolute limit to the number of cells used has also been built in. For greatest speed, it is important to give the focus to Excel. If you set the focus to AvaSoft, Windows will dramatically lower Excel’s priority. You can verify this by looking at the ‘Filling Cells’ progress bar in the lower left corner of your worksheet. 122 Avantes Dec-09 www.avantes.com [email protected] 4.7 Applications: Chemometry AvaSoft-Chem was developed to enable on-line concentration measurements with a spectrometer system. According to Lambert-Beer’s law, there is a linear relationship between absorbance and concentration. A = ε*c*l Where A is the absorbance (or extinction), ε is the extinction coefficient of the compound to be measured, c is the concentration and l is the optical path length. In practice, this relationship is only linear at reasonably low absorbance levels (say less than 2). The wavelength at which the absorbance is measured must of course be kept constant. To take concentration measurements, you will need a spectrometer with either a cuvette-holder or a dipprobe and a suitable light source. If you use cuvettes, remember that glass cuvettes will absorb UV light. If your wavelength is in the UV range, use quartz or polystyrene ones instead. AvaSoft-Chem can display and save the calculated concentration in two ways: - The concentration can be displayed and saved on-line in a separate display window, for up to eight spectrometer channels (if available). You can select up to eight history channels that can display and save concentration values against time. This application can be combined with the Excel and Process-Control applications. 4.7.1 Quick Start: How to make concentration measurements with AvaSoft-Chem 1. Start the AvaSoft software and click the Start button in the main window. 2. Set up the absorbance experiment with a cuvette holder or a dip-probe measuring the sample with the lowest concentration, usually your reference. Switch on the light source. 3. Adjust the integration time to get a good reference signal with a maximum around 14500 counts. The easiest way to do this is by using the “AutoConfigure Integration time” option. 4. Adjust the number of averages. The higher the better, however the time for a single absorbance reading must remain practical. If you want to change it, first press the Stop button, and press the Start button again after changing the Average value in the Edit-bar. 5. Switch off the light source and save a dark spectrum, switch it back on and save a reference. 6. Change to Absorbance mode by clicking the ‘A’ button in the button bar. Measure the absorbance of a sample with a high concentration to find the wavelength and bandwidth of an absorbance peak to use (most of the time, the wavelength with the highest absorbance is used. 7. Calibrate your absorbance readings in the ‘Chemometry Settings’ form (section 4.7.2). You can also just use a previous calibration line, as it can be saved to disk under a user defined filename and reloaded at the start of the application. 8. Enable the Concentration measurements by selecting ‘Application’, ‘Chemometry’, ‘Enable’ from the main menu. After the application is enabled, it is also possible to select ‘Chem’ as a History Channel function. Dec-09 Avantes 123 www.avantes.com [email protected] 4.7.2 Calibration Settings The dialog at the right is shown after selecting ‘Application’, ‘Chemometry’, ‘Settings’ for the first time. An example calibration file (example0.cal) has been created in the folder “chem”, which holds the data that is presented in the dialog. Note that the example is only illustrative. You need to measure a number of samples with known concentration to create your own calibration file(s), as described in section 4.7.2.1. After a calibration has been saved, it will be loaded automatically the next time the application is started. Once a calibration has been saved, it can be loaded later on and modified if needed. Section 4.7.2.2 describes how to modify a previous saved calibration file. 4.7.2.1 Start New Calibration A new calibration is started by clicking the “Start New Calibration (Clear Data)” button. All data fields for the selected spectrometer channel will be cleared. Enter the wavelength for the measurements in the ‘Peak at’ field and the width of the peak that will be used in the ‘Width’ field. The program will integrate the absorbance values from “Peak minus Width” to “Peak plus Width” and uses this integral as the absorbance value in the concentration calculations. The unit of concentration can be entered in the ‘Conc. Unit’ field. This is just a text, no adjustments will be made if you change this value. Enter the known concentration values for the available standards in the central column of the calibration points table. You can include the reference sample with zero concentration in these measurements. 124 Avantes Dec-09 www.avantes.com [email protected] After this, the dialog contains for example the data shown in the figure at the right. If the zero concentration (reference) sample is included, like in the example at the right, set up the experiment to measure this reference. Use the keyboard or mouse to point out the row in the table for which sample the absorbance value will be measured. When moving through the rows in the table, the text in the button “Read Absorbance for point x”, will be updated for the sample that will be measured. In the example, we start with measuring the absorbance of point 1, which is the reference sample. Click the “Read Absorbance for point 1” button to import the measured absorbance into the left column in the table. If the reference is measured, the value should be very close to 0.000. The measured absorbance and corresponding concentration will be visualized as a new point in the graph. Now move the cursor in the table to the second row, setup the experiment for measuring the sample of known concentration for point 2 (30 mmol/l in the example above), and click the “Read Absorbance for point 1” button to import the measured absorbance into the left column in the table for point 2. Repeat these steps for the other samples of known concentration. For a linear calibration line, at least two samples are needed, but the more points added, the more reliable the calibration line will be. After the samples have been measured, click the “Calculate New Calibration Line” button. As a result, a red line will be fit through the measured data, and you will be asked to save the calibration or not. The figure at the right shows that the calibration line fits very well through the measured points, so we click yes to confirm that we want to save the calibration. If during the measurements an incorrect calibration point was measured, for example because of mixing up the samples or measuring the concentration at the wrong row, this will become clear from the graph. You can then select either directly the “No” button, or select the “Yes” button and modify the calibration line later on. Dec-09 Avantes 125 www.avantes.com [email protected] After clicking “Yes”, a dialog is shown in which the name of the calibration file can be entered. Type in the name you will use for this calibration line (MyFirst in the figure at the right), then click the “Save” button. As a result, the file MyFirst.cal will be created, and the calibration line will become the actual calibration line that will be used to calculate the concentration levels for the specified spectrometer channel (Master in this example). After a calibration line is saved, it will become the actual calibration line, which is blue colored. This actual line will be used for concentration calculations. Furthermore, the Calibration Line coefficients are shown in the lower right corner of the dialog and the predicted concentration values that have been calculated by using the calibration coefficients, have been added for the standards into the right column of the table. By comparing the predicted values with the actual concentration values, you can get an impression about the quality of your calibration line. The actual calibration line will be automatically loaded the next time AvaSoft is started. By clicking the Load button, other calibrations that were saved before can be loaded after which the loaded calibration line becomes the actual line. 4.7.2.2 Modifying a calibration The actual calibration line can be modified by changing the fit order of the calibration line or by adding or deleting calibration points. Fit order The default fit order is linear. Using a second order (parabolic curve) makes it possible to compensate for non-linearity in e.g. your dip-probe. To illustrate this, the calibration from the previous section was loaded (MyFirst.cal), and the fit order was changed from first order to second order. After clicking the “Calculate New Calibration Line” button, the new standard deviation showed a much better fit then the previous (linear) fit. After saving this calibration line to “MySecond.cal” the predicted concentrations showed also a much better fit for the quadratic model. However, certainly with this few calibration points, the second order option should be used with care, as it will happily draw a well fitting calibration curve also through outliers. 126 Avantes Dec-09 www.avantes.com [email protected] Adding/deleting calibration points Adding and deleting calibration points from/to the actual calibration line is very simple and very well visualized in the graphical display. To add new calibration points to a calibration, just load the calibration file, move the cursor to the next row in the table (row 5 in our example), fill in the sample concentration in the center column and read the absorbance into the first column by clicking the “Read Absorbance for point 5” button. A new red point will mark the calibration point in the graph. New points can be added up to 30 standard samples. The “Calculate New Calibration Line” will display a new red line next to the actual blue calibration line before raising the dialog with the question if the new calibration data should be saved or not. This may be helpful to see if the new points are correctly measured, or that one or more new points induce a strong increase of the standard deviation. For example, in the figure at the right the error was caused by typing in the value of 60 in the center column instead of the correct value of 40. To delete one or more calibration points from the actual calibration, just delete the value for that point in the left or second column. 4.7.3 Enabling the application Enable the application by selecting ‘Application’, ‘Chemometry’, ‘Enable’ from the main menu. A checkmark will appear before the menu entry to show that the option is enabled. A separate Concentration display will appear, for each spectrometer channel enabled. By clicking the “Save Concentration” button in the upper left corner, a new line (record) will be added to the chem output file (text file, ascii format) that is displayed in the box below of the save button (newout.txt in the figure above). This box also displays the current number of records that have been saved to this file before. A new Filename for saving the output can be selected by clicking the “New Filename” button. If a filename is entered that does not yet exist, then you will start with an empty file (header only) with 0 records. If a filename is selected that already exists, the nr of records in this file will be displayed and new measurements will be added to the existing ones. The following information will be saved with each click on the Save Concentration Button: Date Time Comments Concentration Unit CalibrationFilename SpectrometerName - Current Date - Current Time - Comment line, entered by user (right from Save button) - Unit entered in the CHEM Settings, during the CHEM calibration - Name of the calibration filename that is used in the calculation - Name of the Spectrometer used when saving the concentration The columns in the textfile are separated by blanks (not TABS), so if you want to open the textfile in Excel, you can select “blanks” when Excel asks how the columns are separated. The file can always be opened with any text editor, for example “Notepad”. Dec-09 Avantes 127 www.avantes.com [email protected] After enabling the chemometry application, you can select ‘Chem’ as a function type in the Function Entry dialog of the History application. 128 Avantes Dec-09 www.avantes.com [email protected] 4.8 Applications: Laser Induced Breakdown Spectroscopy (AvaSpec-2048/2048L/3648*) The start of the integration time can be delayed in relation to an event like a laser pulse or flash light. This feature can be used for Laser Induced Breakdown Spectroscopy. Programmable delay: -21 nanosec to +89 seconds in 21 nanosec steps, jitter = 0 This portion of the plasma emission is not included in the integration time In LIBS measurements, the laser light should not be included in the integration time cycle. Instead, the integration time starts a user programmable delay after the laser pulse. There are two ways in which the LIBS measurements can be setup: 1) The AvaSpec spectrometer controls the timing for the laser. In this mode, the spectrometer sends a TTL Output signal to fire the laser and the integration time delay is synchronized with this output signal. 2) The timing is controlled by the laser or external pulse generator and synchronized with the AvaSpec spectrometer by running the spectrometer in external trigger mode. In this mode, the spectrometer receives a TTL-input signal from the laser, or simultaneously with the laser. The integration time delay is synchronized with this input signal. Advantage of using the TTL-output signal from the spectrometer to fire the laser are: • No jitter between TTL-Output and start of integration time. The output signal and start of the Integration time cycle are both synchronized with the 48 MHz FPGA clock in the spectrometer. However, if there is a large jitter in the laser between receiving the TTL signal from the spectrometer and firing the laser pulse, there is no advantage in the zero jitter at the spectrometer. If the timing is controlled by the laser, the jitter between the asynchronized external trigger input and the start of the integration time will be 21 ns. • The integration time delay can be set very short or even negative (in which case the integration time cycle starts before the laser is fired). If the timing is controlled by the laser or pulse generator, there will be a minimum integration delay which depends on the spectrometer type: the minimum delay for the AvaSpec-3648-USB2*, AvaSpec-2048-USB2 and AvaSpec-2048L-USB2 is respectively 0.28, 1.28 and 3.28 µs. The hardware setup and other settings will be described in section 4.8.1. After enabling the LIBS application (section 4.8.2), the specified number of measurements can be started. * AvaSpec-3648-USB2 in clear-buffer mode only, for advantages/disadvantages, see section 3.2.1 Dec-09 Avantes 129 www.avantes.com [email protected] 4.8.1 Libs Settings The LIBS settings dialog is displayed after clicking the menu option “Application – LIBS – Settings”. The following settings can be entered: The Hardware Setup refers to the two options to setup a LIBS measurement, as described at the previous page. The General Settings include: • Number of Measurements. One measurement includes NrOfAverage scans. The average parameter is set in the main windows edit bar. For example, if 10 measurements are required and the average parameter is set to 16, a total of 160 scans will be done. • Fixed/Variable integration time delay. If the “Use Variable Integrationtime Delay” box is checked, the integration time during the first and last measurement need to be entered. The integration time delay for all measurements in between will be linearly interpolated. Leave the “Use Variable Integrationtime Delay” box unchecked if the measurements should be performed at fixed integration time delay, and enter the required fixed Integration time delay. • AutoSave Spectra. If this box is checked, the spectra will be saved after each measurement and can be displayed afterwards with the menu option File-Display Saved Graph. • Disable Graphical Output for high speed measurements. The graphical output is the most time consuming event at short integration times, so if high speed measurements are required, check this box to process the data without updating the graphics during the measurements. 130 Avantes Dec-09 www.avantes.com [email protected] The LIBS settings in the lower box of the window, as shown in the figure above and described below, are only relevant if the TTL-Out at pin 23 is used to trigger the laser. The Pulse Width parameter is the pulse width in microseconds for the TTL-Out at pin 23. When using the TTL-Out at pin 23, there are three possibilities how to start and control a sequence of measurements: Software controlled A measurement sequence can be fully controlled by software if the spectrometer is not setup in hardware trigger mode (“Setup – Options – External Trigger Setting” is not Enabled), and the checkbox in the LIBS Settings above: “In Hardware Trigger Mode, perform one SingleScan…” is left blank. The frequency of the TTL-Out at pin 23 is determined by the “Time Between Scans [ms]” parameter. A measurement sequence is started by clicking the Start button in the LIBS progress dialog as described in section 4.8.2 Start First Scan on Hardware Trigger, every next scan by software A measurement sequence can be setup such that the first scan is started after the spectrometer receives an external hardware trigger at pin 6. Then every next scan in the measurement sequence is started by the software, using the “Time between Scans [ms]” parameter to determine the frequency of the TTL-Out at pin 23. To use this mode, enable the hardware trigger mode (“Setup – Options – External Trigger Setting” is Enabled), and the checkbox in the LIBS Settings above: “In Hardware Trigger Mode, perform one SingleScan…” is left blank. A measurement sequence is started by clicking the Start button in the LIBS progress dialog as described in section 4.8.2, followed by an external trigger at pin 6 to start the sequence. Start Every Scan on Hardware Trigger, optionally use the Laser Delay parameter By selecting the checkbox in the LIBS Settings above: “In Hardware Trigger Mode, perform one SingleScan…”, the spectrometer will be setup in external trigger mode and requires one external trigger input at pin 6 for each scan, so totally NrOfMeasurement*NrOfAverage trigger signals to complete the sequence. The “Time Between scans [ms]” parameter becomes irrelevant when using this setting, because the frequency will be determined by the frequency of the trigger pulses received at pin 6. An additional parameter called “LaserDelay [µs]” can be specified when using this mode. The LaserDelay parameter is the time in microseconds between receiving the external trigger at pin 6 and sending out the Laser pulse at pin 23 to fire the laser. A measurement sequence is started by clicking the Start button in the LIBS progress dialog as described in section 4.8.2, followed by external trigger pulses at pin 6 for each scan in the measurement sequence. Dec-09 Avantes 131 www.avantes.com [email protected] 4.8.2 Enabling and running the application The LIBS application is started by clicking the menu option “Application – LIBS – Settings”. The LIBS Progress window at the right will be displayed. The buttons in the dialog have the same functionality as in the main window. Access to the main window is not possible during the LIBS measurements. After clicking the Start button in this dialog, the LIBS measurements are started. If the spectrometer controls the timing by the TTL-Out at pin 23, the spectrometer starts sending these signals to the laser and starts its integration time cycle the user specified Integration Delay period after each TTL-Out. If the timing is controlled by the laser or external pulse generator, the spectrometer will wait for the external trigger pulse and it will start the integration time cycle the user specified Integration Delay period after receiving the external trigger input. Then it will wait again for the next external trigger pulse to arrive. After each scan, the “Performed Nr of Average” number is updated, and after Nr of Average scans, the “Performed Nr of Measurements” number as well as the graphical output is updated. 132 Avantes Dec-09 www.avantes.com [email protected] 4.9 Applications: Store To Ram 4.9.1 Introduction This application requires an AvaSpec-USB2 spectrometer, with firmware version 0.20 or later. A firmware upgrade utility can be downloaded from our website. As the application is rather demanding on your computer, it is advisable to use a recent model PC with good graphics performance, preferably with a dedicated graphics card. AvaSoft Store To Ram allows you to measure a fixed amount of scans as fast as possible, without the overhead of USB communications. The scans are stored in the internal memory of the AS5216, and the results are only sent to the computer after the last measurement has been made. You can, for example, store as much as 19784 full pixel scans with the AvaSpec 102, which has 102 pixels and a fastest integration cycle of 0.1 msec. By limiting the wavelength range in the measurement (‘Setup’, ‘Wavelength Calibration Coefficients’, change the ‘Start at’ and ‘Stop at’ fields) you can extend the number of scans to a maximum of 65504 scans. When you use a spectrometer with more pixels, the number of full pixel scans is proportionally less: For example, with the AvaSpec-2048-USB2, the number of full pixel scans is 1013, and the fastest integration cycle is 1.1 msec. If you enter more scans, the application will return the maximum amount that could be made with the selected wavelength range, and change the number in the edit field. All spectrometers allow you to extend the amount of Store To Ram scans by limiting the wavelength range. Note that the time needed to transport the data to the computer, after the measurement has been made, can be as long as 50 seconds, if you select a very large number of scans. After the scans have been sent to the computer, the AvaSoft Store To Ram application allows you to make a range selection in the scans, and save the selected scans to .ROH files on disk. These files can then be processed further in AvaSoft, or easily read into Excel and processed there. The data are visualized with a single 3D and two 2D graphs. The view of the 3D graph can be adjusted by inverting the Depth axis and the X axis. These axes can also be transposed, which enables a side view of the graph. The Y axis is auto scaled by default, this can be undone by unchecking the option in the ‘Adjust View’ box. The 2D graphs both have a scrollbar, which allows you to change the third dimension. It is also possible to display the position of each 2D graph in the 3D graph by displaying a separate highlighted line that sections the 3D graph. This feature is turned on and off with the ‘3D’ checkbox at the top-right position of each 2D graph. The amount of data in the 3D graph and the second 2D graph (Counts vs. Time) has been limited to prevent computer overload. If more data is present, only one out a calculated number of scans or pixels is shown. Zooming the graphs will reveal more detail. The fraction of the data that is shown is indicated in the title of the relevant axis. E.g. ‘Time [ms] (1/10)’ means that only one out of every 10 scans is shown. Note that the first 2D graph (Counts vs. Wavelength) always shows all of the data present. It is therefore possible to show this graph as a highlighted line in the 3D graph that shows more detail than the 3D graph Dec-09 Avantes 133 www.avantes.com [email protected] itself shows. Zooming in will show more detail in the 3D graph, which will eventually correct the discrepancy. The 3D graph does not allow direct manipulation with the mouse. You can zoom both 2D graphs and the 3D graph will zoom to the selected range. The selected range will then also be shown in the manual selection boxes described below. Unzooming the 2D graphs will also unzoom the 3D graph. Note that zooming and unzooming the 2D graphs is performed the same way as in the main screen of AvaSoft: You zoom the graph by clicking the top-left corner of your area to select, hold down the left mouse button, then draw a rectangle and release the mouse button at the lower-right corner of the area to select. You unzoom the graph by clicking anywhere on the graph, hold down the left mouse button, then drag a rectangle towards the top and left and release the mouse button at any position. You can pan the 2D graphs by holding down the right mouse button. It is also possible to manually select the ranges by entering values in the ‘Select Time Range’, ‘Select Wavelength Range’ and ‘Select Counts Range’ boxes, and pressing the ‘Zoom’ button. Note that changing the ‘Select Counts Range’ will only have an effect if the ‘Autoscale Y-axis’ option is unchecked. The ‘Unzoom’ button will undo all your changes. After your selection is made, you can save the scans to disk by pressing the ‘Save’ button. Each scan will result in two files written to disk. The .ROH file contains the spectrometer setup and the data from the scan itself. The .RCM file contains the timestamp from the scan, as a microsecond offset value from the first scan. If you save the .ROH files to Excel, using AvaSoft ‘File’-‘Convert Graph’-‘to Excel’, the timestamp values from the .RCM files will be written into Excel in row 6 of each data column, allowing you to use these timestamp values in calculations. The files are numbered consecutively, a five digit number is affixed to the filename you enter in the dialog. The starting number of the sequence is the lower limit of the range of selected scans. Only the presence of a previous version of this file will trigger an overwrite warning in the dialog. All consecutive scans will silently overwrite previous versions with the same filename. Note that the scans that are saved in the .ROH files are all full scans, only the values entered in ‘Select Time Range’ have an effect here. If you want to limit the wavelength range in the .ROH files, you will have to do this in the AvaSoft setup screen, as described above. Although it is possible to use the Store To Ram application to measure huge amounts of scans with a limited wavelength range, we strongly advise you to save only a limited amount of scans. If you select 50000 scans to save, the huge number of small files to save will bring your computer to a near standstill. For this reason, a warning has been built in when you want to save more than 2500 scans. You can save the graphs to disk by pressing the ‘Save Graphs’ button. You can first enter a comment line, which will be included on the page. Next, you can enter the filename that will be used to save the graphs. The three graphs will be saved in JPEG format, embedded in a single, one page .RTF file. You can open this file with Microsoft Word, edit it, extract the graphs, change the size of the graphs, etc. 134 Avantes Dec-09 www.avantes.com [email protected] 4.9.2 Quick Start 1. Select wavelength range and integration time in AvaSoft. (Averaging is not possible with Store To Ram measurements, this setting has no effect.) Adjust your light source and take some readings to check whether the signal level is satisfactory. Stop the regular AvaSoft readings. (The Start/Stop button should read ‘Start’) 2. Start the Store To Ram application by selecting it in the menu with ‘Application’, ‘Store To Ram’. 3. Select the channel (if you have more than one) and enter the number of scans to read. This value is set to 100 by default. The integration time setting in the Store To Ram form is automatically copied from the main AvaSoft form. You can change this value here, but it will only be used in the Store To Ram application. 4. Press the ‘Start’ button. After the measurement has been made, the readings are transmitted to the PC and the graphs will be drawn. Depending on the duration of an integration cycle and the number of readings, this can take anywhere between a second and many minutes. The ‘Stop’ button can be pressed whenever you want to stop a pending measurement with a long integration time. 5. Make a selection from the readings by zooming the 2D graphs with your mouse. Only the time range selection will be reflected in the saved output. Scroll the 2D graphs with their scrollbars, see where the line is located in the 3D graph by selecting the 3D checkbox in either 2D graph. 6. Save your selection to disk by pressing the ‘Save Scans’ button. 7. When needed, save the graphs to disk by pressing the ‘Save Graphs’ button. 8. Load a single scan into AvaSoft with ‘File’, ‘Display Saved Graph’. 9. Look at a 3D display of the saved graphs with ‘File’, ‘Display 3D Graph’. 10. Load multiple scans into Excel with ‘File’, ‘Convert Graph’, ‘To Excel’. 4.9.3 Main Window The upper left of the window is used to control the measurement Dec-09 Avantes 135 www.avantes.com [email protected] The upper right of the window is used to adjust the view of the 3D graph, and to manually make a selection from the scans. The Adjust View checkboxes allow viewing the 3D graph from all sides. The Autoscale Y axis button is checked by default. Unselecting it will only yield a satisfactory image if the Y range is positioned at an edge of the graph, otherwise there will be other readings filling the entire screen behind the selected lines. Manually change the scan selections by changing the values in the ‘Select Range’ fields and pressing the ‘Zoom’ button. ‘Unzoom’ will undo any change made. Note that manually changing the ‘Select Count Range’ will only have an effect if the ‘Autoscale Y Axis’ box is unchecked. The 2D graphs each have a scrollbar that changes the respective third dimension. The position of the scrollbar is reflected in the boxes underneath each 2D graph. Change the scrollbar in the standard Windows ways: Clicking the arrows will cause a change of a single unit, clicking between the arrows and the thumb will change 10 units, dragging the thumb will select a new position in the readings relative to the position of the thumb. You can also use the keyboard to change the scrollbar, the Up and Down keys will give a single unit change, the PageUp and PageDown keys will give a change of 10 units, the Home and End keys will move to the first and last reading. Checking the 3D boxes in the upper right corner of each graph will show the graph as a highlighted line in the 3D graph. The Time axis of the right 2D graph has a maximum number of points. If this is exceeded, only one out of a calculated number of points will be shown. This ratio is added to the title of the axis, e.g. ‘Time [ms] 136 Avantes Dec-09 www.avantes.com [email protected] (1/10)’ means that only one out of 10 points is shown. In this case, zooming the right 2D graph will reveal more detail. Zooming the 2D graphs with the mouse can also be used to select a wavelength and time range. The selection will also be shown in the 3D graph. Zooming and Unzooming is done in the regular AvaSoft way. You can also pan the graph by dragging the mouse while holding the right mouse key down. This has no effect on the 3D graph. The 3D graph cannot be manipulated directly. It is redrawn after the 2D graphs are zoomed, or after the ranges are manually changed, and the ‘Zoom’ button is pressed. The view of the graph can be changed in a basic number of ways, to allow a view of all sides. A highlighted line can be shown in the 3D graph for both 2D lines. Dec-09 Avantes 137 www.avantes.com [email protected] 5 Help After clicking the Help-Contents menu option, the AvaSoft FULL manual will be displayed in HTML format. At the left side the Help Contents displays all sections to which the user can browse to a specific topic. Instead of browsing through the contents to a specific topic, the search TAB can be selected, as illustrated in the figure below. After typing in a keyword (e.g. concentration), and clicking the List Topics button, a list of all topics containing this keyword is shown. By selecting a topic at the left (double click), the information is displayed at the right, in which the keyword is marked in the text. 138 Avantes Dec-09 www.avantes.com [email protected] As described in section 4.1.1, the History Channel Functions have been extended with the possibility to define a function with the support of a VB Script. We have included a help file for VBScript for your reference. You can reach it from the main menu by selecting ‘Help’, ‘VBScript’. It lists among other things all available operators and functions: Finally, the third Help submenu is the About Box which shows some information about the AvaSoft version that is being used, the serial numbers of the spectrometers that are connected, detector types, firmware and FPGA versions, the Windows version of the computer and the available memory: Dec-09 Avantes 139 www.avantes.com [email protected] Appendix A Troubleshooting How to rectify an incorrect (USB) installation Any USB device requires that the USB drivers need to be installed before the device is connected to the computer. If you accidentally connected the AvaSpec spectrometer to the USB port of your PC before installing AvaSoft, the USB drivers cannot be found, and the spectrometer cannot be found by the (later installed) software. To rectify an incorrect installation follow these steps: 1. Navigate to the Device Manager. For Windows2000/XP systems, right click on My Computer, select Properties (or open the system icon from the Control Panel). Then select Hardware tab and click on Device Manager button. 2. Scroll down until you see Other devices 3. Under Other devices you will see USB device with a large question mark, right click the USB device and select the uninstall option. 4. A warning box will appear to ask if it is OK to remove the device, click OK. 5. Unplug the AvaSpec spectrometer from your PC and reinstall the AvaSoft software. 6. Now you can plug the AvaSpec spectrometer to the USB port again. Windows will display the “Found New Hardware” (USB device) dialog. Proceed with the installation as described in section 0.1 under “Connecting the Hardware” 7. The AvaSoft software can now be started and will detect the spectrometer at the USB port. If not, please have a look at the Device Manager, which should contain the Avantes Spectrometers Class, as illustrated in the figure below. The figures shows that 4 USB ports are connected to an AvaSpec spectrometer: one AvaSpec-USB1, and three AvaSpecUSB2 spectrometers Don’t hesitate to contact us if the problem remains unsolved. 140 Avantes Dec-09 www.avantes.com [email protected] Appendix B Error Messages AvaSoft can display error messages containing a number. The following table lists these numbers and a description of the error: Error code -1 -2 -3 -4 -5 -6 -7 -8 -9 -10 -11 -12 -13 -14 -15 -16 -17 -18 -19 -20 -21 -100 -101 -102 -110 -111 -112 -113 -114 -115 Description Function called with invalid parameter Function called to use 16bit ADC mode, with 14bit ADC hardware Opening communication failed or time-out during communication occurred AvsHandle is unknown in the DLL Function is called while result of previous function is not received yet No answer received from device Reserved No measurement data is received at the point AVS_GetScopeData is called Allocated buffer size too small Measurement preparation failed because pixel range is invalid Measurement preparation failed because integration time is invalid for selected sensor Measurement preparation failed because of invalid combination of parameters (e.g. integration time > 600 seconds or averages > 5000) Reserved Measurement preparation failed because no measurement buffers are available Unknown error reason received from spectrometer Error in communication occurred No more spectra available in RAM, all read or measurement not started yet DLL version information can not be retrieved Memory allocation error in the DLL Function called before AVS_Init is called Function failed because AS5216 is in wrong state (e.g. AVS_StartMeasurement while measurement is pending) NrOfPixel in Device data incorrect Gain Setting Out of Range Offset Setting Out of Range Use of Saturation Detection Level 2 is not compatible with the Averaging function Use of Averaging is not compatible with the StoreToRam function Use of the Synchronize setting is not compatible with the StoreToRam function Use of Level Triggering is not compatible with the StoreToRam function Use of Saturation Detection Level 2 Parameter is not compatible with the StoreToRam function The StoreToRam function is only supported with firmware version 0.20.0.0 or later Dec-09 Avantes 141 www.avantes.com [email protected]