1
1
Reactor Safety Design and Safety Analysis
prepared by
Dr. Victor G. Snell
Summary:
The chapter covers safety design and safety analysis of nuclear reactors. Topics include concepts
of risk, probability tools and techniques, safety criteria, design basis accidents, risk assessment,
safety analysis, safety-system design, general safety policy and principles, and future trends. It
makes heavy use of case studies of actual accidents both in the text and in the exercises.
Table of Contents
1
2
3
4
5
Introduction ............................................................................................................................ 6
1.1 Overview ............................................................................................................................. 6
1.2 Learning Outcomes ............................................................................................................. 8
1.3 Risk ...................................................................................................................................... 8
1.4 Hazards from a Nuclear Power Plant ................................................................................ 10
1.5 Types of Radiation in a Nuclear Power Plant .................................................................... 12
1.6 Effects of Radiation ........................................................................................................... 12
1.7 Sources of Radiation ......................................................................................................... 14
1.8 Risk .................................................................................................................................... 15
1.9 Problems ........................................................................................................................... 17
Design Basis Accidents .......................................................................................................... 18
2.1 Top-Down Approach ......................................................................................................... 19
2.2 Bottom-Up Approach ........................................................................................................ 20
2.3 Probabilistic Safety Analysis .............................................................................................. 21
2.4 Experience......................................................................................................................... 22
2.5 Canadian Approach to DBAs ............................................................................................. 22
2.6 Other Design Basis Events ................................................................................................. 25
2.7 Problems ........................................................................................................................... 25
Experience............................................................................................................................. 31
3.1 Criticality Accidents and Power Excursions....................................................................... 32
3.2 Loss of Cooling / Heat Removal ........................................................................................ 45
3.3 Problems ........................................................................................................................... 53
Safety Goals and Risk Assessment ........................................................................................ 54
4.1 Safety Goals....................................................................................................................... 54
4.2 Risk Assessment ................................................................................................................ 58
4.3 Problems ........................................................................................................................... 74
Mitigating systems ................................................................................................................ 76
5.1 Defence-in-Depth .............................................................................................................. 76
5.2 Shutdown Systems ............................................................................................................ 77
Reactor Safety Design and Safety Analysis
2
The Essential CANDU
5.3 Heat-Removal Systems...................................................................................................... 86
5.4 Emergency Core Cooling System....................................................................................... 91
5.5 Containment ..................................................................................................................... 94
5.6 Monitoring ........................................................................................................................ 98
5.7 Problems ........................................................................................................................... 98
6 Safety Analysis – Accident Phenomenology ....................................................................... 100
6.1 Accidents by Phenomena................................................................................................ 100
6.2 Margins ........................................................................................................................... 101
6.3 Major Computer Analysis Tools Required for DBAs ........................................................ 103
6.4 Code Validation and R&D ................................................................................................ 105
6.5 Selection of Initial Conditions ......................................................................................... 111
6.6 Accident Walk-Through: Large LOCA .............................................................................. 115
6.7 Accident Walk-Through: Small LOCA .............................................................................. 124
6.8 Accident Walk-Through: Single-Channel Event............................................................... 125
6.9 Accident Walk-Through: Loss of Reactivity Control ........................................................ 126
6.10 Accident Walk-Through: Loss of Forced Circulation ....................................................... 127
6.11 Accident Walk-Through: Loss of Secondary-Side Heat Removal .................................... 127
6.12 Accident Walk-Through: Fuel-Handling Accident ........................................................... 128
6.13 Accident Walk-Through: Loss of Moderator Inventory or Heat Removal ....................... 129
6.14 Severe Accidents ............................................................................................................. 129
6.15 Problems ......................................................................................................................... 134
7 Safety Analysis – Mathematical Models ............................................................................. 135
7.1 Reactor Physics................................................................................................................ 135
7.2 Decay Power.................................................................................................................... 136
7.3 Fuel .................................................................................................................................. 137
7.4 Heat-Transport System.................................................................................................... 141
7.5 Fuel Channels .................................................................................................................. 143
7.6 Moderator ....................................................................................................................... 145
7.7 Containment ................................................................................................................... 145
7.8 Fission Products, Atmospheric Dispersion, and Dose ..................................................... 146
7.9 Problems ......................................................................................................................... 149
8 Safety of Operation ............................................................................................................. 150
8.1 Safety Culture .................................................................................................................. 150
8.2 International Nuclear and Radiological Event Scale ....................................................... 152
8.3 Safety Aspects of Future Designs .................................................................................... 154
8.4 Problems ......................................................................................................................... 158
9 Review ................................................................................................................................. 159
10 References ........................................................................................................................... 159
11 Further Reading .................................................................................................................. 168
12 Glossary ............................................................................................................................... 169
13 Appendix 1 – Basic Rules of Boolean Algebra ..................................................................... 171
13.1 Operators ........................................................................................................................ 171
13.2 Basic Principles ................................................................................................................ 172
Reactor Safety Design and Safety Analysis
Reactor Safety Design and Safety Analysis
3
13.3 Theorems ........................................................................................................................ 172
13.4 Combining Probabilities .................................................................................................. 174
14 Appendix 2 – Common-Cause Failures – An Example ........................................................ 177
15 Appendix 3 – Why a Reactor Cannot Explode Like an Atomic Bomb ................................. 177
16 Acknowledgments............................................................................................................... 178
List of Figures
Figure 1 Chapter concept map ........................................................................................................ 7
Figure 2 Risk optimization ............................................................................................................. 10
Figure 3 Examples of radiation dose ............................................................................................. 12
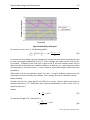
Figure 4 Fuel element cross section showing location of fission products .................................. 14
Figure 5 Simplified top-down approach........................................................................................ 20
Figure 6 Simplified bottom-up example ....................................................................................... 21
Figure 7 Criticality experiment ...................................................................................................... 26
Figure 8 SES-10 .............................................................................................................................. 27
Figure 9 ZED-2 cutaway ................................................................................................................. 29
Figure 10 ZED-2 top view .............................................................................................................. 30
Figure 11 Learning and forgetting ................................................................................................. 31
Figure 12 SL-1 cutaway ................................................................................................................. 34
Figure 13 NRX fuel cross section ................................................................................................... 36
Figure 14 NRX elevation ................................................................................................................ 37
Figure 15 RBMK schematic diagram ............................................................................................. 41
Figure 16 RBMK reactor ................................................................................................................ 43
Figure 17 Reverse shutdown in RBMK ......................................................................................... 44
Figure 18 RBMK building cross section ......................................................................................... 45
Figure 19 TMI schematic ............................................................................................................... 46
Figure 20 TMI core end state ........................................................................................................ 47
Figure 21 Fukushima Dai-ichi before earthquake ......................................................................... 49
Figure 22 BWR Mark 1 containment ............................................................................................. 50
Figure 23 Design basis versus actual flood level ........................................................................... 51
Figure 24 Typical λ(t) versus time ................................................................................................. 64
Figure 25 Reliability for constant λ................................................................................................ 66
Figure 26 Availability with repair .................................................................................................. 67
Figure 27 Simple pumped system ................................................................................................. 69
Figure 28 Sample fault tree with labels ........................................................................................ 70
Figure 29 Simple event tree .......................................................................................................... 72
Figure 30 Contributors to SCDF for CANDU 6 ............................................................................... 74
Figure 31 Simple fault-tree exercise ............................................................................................. 75
Figure 32 Defence-in-depth: barriers............................................................................................ 76
Figure 33 CANDU shutdown systems............................................................................................ 79
Figure 34 Xenon transient after shutdown and start-up .............................................................. 81
Figure 35 2/3 logic......................................................................................................................... 85
Figure 36 SDS2 testing .................................................................................................................. 86
Reactor Safety Design and Safety Analysis
4
The Essential CANDU
Figure 37 Bundle power after shutdown ...................................................................................... 88
Figure 38 Shutdown cooling system ............................................................................................. 89
Figure 39 Moderator and shield cooling ....................................................................................... 90
Figure 40 ECC layout ..................................................................................................................... 92
Figure 41 Three phases of ECC ...................................................................................................... 93
Figure 42 Single-unit containment ................................................................................................ 95
Figure 43 Vacuum containment concept ...................................................................................... 96
Figure 44 Margins ....................................................................................................................... 102
Figure 45 Safety analysis codes ................................................................................................... 105
Figure 46 Code validation process .............................................................................................. 106
Figure 47 RD-14M schematic ...................................................................................................... 107
Figure 48 Contact boiling tests.................................................................................................... 108
Figure 49 Heat-transfer regimes on outside of calandria tube ................................................... 109
Figure 50 Large-scale containment facility ................................................................................. 110
Figure 51 Large-scale vented combustion facility ....................................................................... 110
Figure 52 Containment test facility ............................................................................................. 111
Figure 53 HTS layout ................................................................................................................... 116
Figure 54 Core flow vs. break size for a group of channels ........................................................ 117
Figure 55 Typical LBLOCA timescale ............................................................................................ 118
Figure 56 Containment pressure transient for 100% ROH LOCA ................................................ 119
Figure 57 Response of PWR and CANDU to reactivity increase ................................................. 122
Figure 58 Importance of reactivity effects .................................................................................. 123
Figure 59 Sources of water near the fuel .................................................................................... 130
Figure 60 Channel collapse in severe core-damage accident ..................................................... 131
Figure 61 Core collapse ............................................................................................................... 131
Figure 62 Mechanistic model of channel collapse ...................................................................... 132
Figure 63 Debris heating transient.............................................................................................. 133
Figure 64 Heat flux on calandria wall .......................................................................................... 133
Figure 65 Temperature distribution across a fuel pin ................................................................. 139
Figure 66 Node/link structure ..................................................................................................... 142
Figure 67 Heat transfer to pressure tube.................................................................................... 143
Figure 68 Atmospheric dispersion .............................................................................................. 148
Figure 69 AND gate ..................................................................................................................... 171
Figure 70 OR gate ........................................................................................................................ 171
Figure 71 NOT gate...................................................................................................................... 171
Figure 72 Probability of both of two events ............................................................................... 175
Figure 73 Probability of either of two events ............................................................................. 176
Reactor Safety Design and Safety Analysis
Reactor Safety Design and Safety Analysis
5
List of Tables
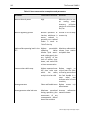
Table 1 Single / dual failure limits ................................................................................................. 23
Table 2 Consultative document C-6 limits .................................................................................... 24
Table 3 Dose limits ........................................................................................................................ 24
Table 4 SL-1 chronology ................................................................................................................ 35
Table 5 Bayes’ theorem example .................................................................................................. 62
Table 6 Reliability terms and relationships ................................................................................... 65
Table 7 Levels of defence in depth ................................................................................................ 77
Table 8 Typical trip signals for CANDU .......................................................................................... 83
Table 9 Grouping and separation example ................................................................................... 85
Table 10 Operating pressure of decay heat-removal systems ...................................................... 91
Table 11 Some conservative assumptions and parameters ........................................................ 112
Table 12 Reactivity effects in PWR and CANDU .......................................................................... 123
Table 13 Examples of reactivity response to accidents for PWR and CANDU ............................ 124
Table 14 Typical core inventory of volatile fission products ..................................................... 147
Table 15 Stages of organizational decline ................................................................................... 152
Table 16 INES event scale ............................................................................................................ 153
Table 17 Categories of passive safety characteristics ................................................................. 156
Reactor Safety Design and Safety Analysis
6
The Essential CANDU
1 Introduction
The purpose of this chapter is to describe the safety characteristics of nuclear reactors and how
their safety performance is predicted and verified.
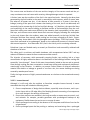
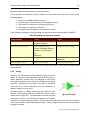
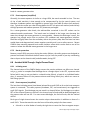
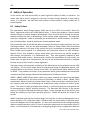
1.1 Overview
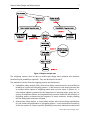
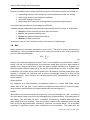
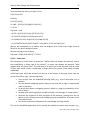
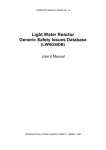
Figure 1 summarizes the chapter concepts and their logical relationship. We describe each box
in turn.
Section 0 (this section) defines risk. The type of risk depends on the activity. Most people want
their activities and surroundings to be “safe”. However, this is a meaningless ideal, and impossible to achieve in absolute terms, because every activity imposes some risk. Fortunately, risk
can be quantified. Then society can set acceptable levels of risk in a reasonably objective
manner.
The risk from nuclear reactors comes from accidental release of radioactive material. Most of
the radioactive material is in the reactor fuel. Therefore, one can postulate accidents which
might allow radioactivity to escape and then design systems (called mitigating systems or safety
systems) to prevent or control such accidents. These design basis accidents1 (DBA) are covered
in Section 2. As well, much knowledge about the risk from nuclear reactors comes from actual
experience in both small research and large power reactors. Case histories of the most important events which influenced the development of nuclear power reactor safety are covered in
Section 3. Lessons learned from these were extracted in the form of specific deterministic
requirements, which described the accidents that had to be designed for and the assumptions
used in showing the safety systems were effective. These accidents also became design basis
accidents.
This approach limits risk, but does not lend itself to quantifying risk because the deterministic
requirements and the design basis accidents were chosen “conservatively”, i.e., to be worse
than what would happen in reality, and with little regard to frequency. In addition, descriptions
of these accidents were not complete. A parallel approach is to start off by setting numerical
risk targets for the plant as a whole (safety goals). Possible accidents are identified and classified using a frequency-based approach. This probabilistic approach is covered in Section 4. It
leads to another list of accidents which overlaps with, but is different from, the list of design
basis accidents.
1
We bow to common practice in using this term. The term was not used in Canada until recently, but has been
used for a long time in the United States. It originally implied that as long as the plant was designed to withstand
“design basis” accidents, all would be well. The accidents at Three Mile Island and Chernobyl showed the weakness
of this concept. At Fukushima, the design basis was wrong (and was known to be – see [IAEA, 2011] p. 75). This
means that design basis accidents do not define a strong boundary between possible and “incredible”. “Beyond
design basis” accidents are now of much interest—indeed, although infrequent, they are the only ones which
could have significant consequences.
Reactor Safety Design and Safety Analysis
Reactor Safety Design and Safety Analysis
7
Figure 1 Chapter concept map
The mitigating systems must be able to handle both design basis accidents and accidents
identified by the probabilistic approach. They are described in Section 5.
The methods to confirm that the mitigating systems are effective are:
Probabilistic safety analysis (PSA), which drives design requirements for, and verifies the
reliability of, normal and mitigating systems. It also ensures to the extent practical that
an accident which requires a mitigating system does not also impair it (Section 4). It
uses Boolean algebra to determine the frequencies of initiating events, given the frequency of component failures, and mathematically combines these with the reliability of
mitigating systems to determine the frequency of severe accidents, thereby showing
that the safety goals have been achieved.
Deterministic safety analysis, or simply safety analysis, which drives design requirements
for, and verifies the performance of, mitigating systems. It uses mathematical models of
all the key systems in a plant to predict (ultimately) how much radioactive material will
Reactor Safety Design and Safety Analysis
8
The Essential CANDU
escape from the fuel and where it will be transported. It shows that the deterministic
requirements have been met. Section 6 describes the phenomenology of accidents, and
Section 7 summarizes the mathematical tools used to predict how they evolve.
Ultimately, the safety of a plant, however well-designed, depends on the people who run it.
Section 8 covers safety aspects of operation, including safety culture. A brief summary of
innovative designs which promise to deliver increased safety wraps up Section 8.
Section 9 summarizes the key points of the Chapter. Section 10 gives the references used in this
Chapter, and Section 11 lists other sources of information on reactor safety. A Glossary in
Section 12 is a ready reference for the abbreviations used in this Chapter. Each subsection
includes problems for further self-study and the occasional worked example.
1.2 Learning Outcomes
The goal of this Chapter is for the student to develop:
An understanding of the approach to nuclear reactor safety concepts and safety design
Familiarity with the hazards involved in nuclear power reactors
Knowledge of the concepts of risk, risk quantification, and risk optimization
An understanding of the root causes of key real-world accidents, leading to “respect
for the reactor core”
The ability to develop systematically a list of credible accidents for a nuclear power
plant design
The ability to understand and create simple fault trees and event sequence diagrams
Familiarity at an overview level with the physical and mathematical models used in
safety analysis.
It is assumed that the reader is generally familiar with the material in prior chapters.
1.3 Risk
Risk involves three key ideas:
all technologies involve risk,
every endeavour involves a risk/benefit trade-off, and
risk can be quantified and reduced to an acceptably low level.
Nuclear reactors, hydro dams, and fossil-fuel electrical generating stations are all inherently
dangerous. The nature of the hazard in each case is quite different. Hazards can be sudden
(acute) or delayed. For hydro dams, an acute hazard is rupture of the dam, causing massive
floods downstream. A delayed hazard is build-up of toxic mercury in the water behind the dam
due to leaching from the rocks. For natural-gas plants, there is a local acute hazard due to
explosion and a global delayed hazard due to climate change from the release of combustion
products (greenhouse gases) to the atmosphere. Coal plants are likewise a major source of
greenhouse gases and in addition can cause respiratory disease from the combustion and
release of toxic chemicals in the coal; see [Inhaber, 1978] and [Rogers, 2004] for Canadian
examples. Some coal plants emit more radioactive material to atmosphere in normal operation
Reactor Safety Design and Safety Analysis
Reactor Safety Design and Safety Analysis
9
than a nuclear power plant. For a nuclear power plant, the hazard of most interest is the
release of radioactive material in accidents. Unlike a coal plant, an inadvertent rise in power in
a nuclear plant (if it is not stopped) can both drive the release of radioactive material out of the
fuel and rapidly cause damage to the reactor and its containment structure.
We “accept” hazards of technologies when they have a benefit which is perceived to offset the
risk. Sometimes this decision is made on an individual basis: you may go sky-diving (an activity
so objectively risky that you cannot get insurance coverage for it) because you believe that the
unique thrill is worth the risk. You accept the hazards of electrical shock and fires for the
convenience of using electric lights and appliances. Nothing that we do on a day-to-day basis is
as risky as hurtling down a narrow strip of levelled ground at 100 km/h in a thin metal container
containing 60 litres of explosive liquid towards someone else in a similar device, using a painted
strip as a guide to avoid collision. Yet almost all people believe the benefits of driving are worth
the risk.
Sometimes the decision is made on a societal basis: if you live in a city, you cannot easily choose
to accept or reject risks such as being hit by a car (even if you choose not to drive one), breathing polluted air, or getting mugged. Activities which pose an involuntary risk are often regulated
by law. In our three examples, the respective regulatory devices would be traffic laws, emission
controls, and the criminal laws.
The benefits of nuclear power include production of clean electricity. In Ontario, over half the
electricity comes from nuclear power; in countries such as France, as much as 80%. Other
benefits of nuclear technology are medical and industrial applications, insect control, environmental protection, and scientific research. Canada is the source of much of the world’s production of medical isotopes, largely originating from the NRU reactor at Chalk River.
This chapter is concerned with risk to humans. Many technologies also pose risk to other living
organisms. For nuclear technology, in general, if radiation risk to humans is acceptable, the risk
to other living things will also be acceptable because they are less susceptible to radiation (e.g.,
they do not live as long (and therefore do not develop cancer as easily) or are inherently more
resistant to radiation damage (e.g., insects)). Radioactive elements and compounds can be
concentrated as they move up the food chain, and therefore these pathways must be modelled
to provide a scientific basis to show that humans are limiting this risk.
Safety can be thought of as the complement to risk; however, usually it is risk that is quantified,
and we shall focus on risk in this Chapter.
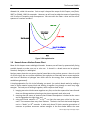
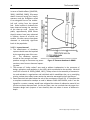
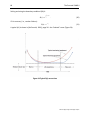
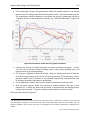
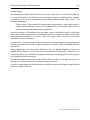
Because risk cannot be eliminated, it must ideally be optimized. This means a cost/benefit
analysis, although such an analysis often looks only at the risk of a technology, without factoring
in benefits. At a risk optimum, the additional resources used to provide additional risk reduction would come at a disproportionate cost, and any resources removed from risk reduction
would cause a disproportionate increase in risk. This situation is shown in Figure 2. This optimum is never achieved in practice. This is partly because the risk from nuclear power is perceived to be greater than that of other technologies, even if the numerical risk is the same, due
to social factors such as unfamiliarity with the technology and its association with atomic
weapons and cancer. Hence, regulation of nuclear power often includes a penalty on the
Reactor Safety Design and Safety Analysis
10
The Essential CANDU
allowed risk, called risk aversion. Such a topic is beyond the scope of this Chapter; see [Slovic,
1987] or [Siddall, 1981] for examples. However, we still need an objective means of quantifying
risk in terms of frequency and consequences. We start with the latter—what are the consequences of a nuclear accident?
Figure 2 Risk optimization
1.4 Hazards from a Nuclear Power Plant
Most of this chapter covers radiological hazards. However, we will start by systematically listing
possible hazards to make sure not to miss one. A hazard in a broad sense can be physical,
chemical, biological, or radiological.
Nuclear power plants do not pose a physical hazard due to the nuclear process—there is no risk
of off-site injury due to a nuclear explosion (the explosion at Chernobyl was a steam explosion
and that at Fukushima a hydrogen one—both with far less energy than a nuclear explosion
would have generated).
A simple explanation for this is the following: an atomic (or nuclear) bomb works by making a
mass of fissile material supercritical and holding it together long enough to reach very large
energies. The hard part is holding it together, which requires three things:
1. banging two sub-critical masses together very fast, so that the supercritical mass formed
does not disintegrate due to heating as the pieces approach each other, and
2. ensuring that the source of neutrons that initiates the explosion is located at the centre
and is triggered at the right time, and
3. using pure fissile material—U235 or Pu239—so that the mass goes critical on fast neutrons. Fast neutrons have very short lifetimes. The basic time unit that bomb designers
use is a “shake”, or 10-8 seconds. It takes only about 50 chain-reaction generations of
neutrons to produce enormous nuclear energies in the few shakes before the mass
Reactor Safety Design and Safety Analysis
Reactor Safety Design and Safety Analysis
11
blows apart and the chain reaction stops.
Most power reactors, however, slow down the neutrons to thermal energies, and thermal
neutrons have lifetimes of milliseconds. (In fact, as covered in Chapter 4, a power plant is
critical on delayed thermal neutrons, with lifetimes of the order of tenths of seconds to several
seconds.) This means that if you somehow made a power reactor (e.g., a CANDU) supercritical,
the energy doubling time would be the order of hundreds of milliseconds. This is slow enough
to stop with mechanical or hydraulic devices, but if these failed, the thermal energy build-up
would destroy the fuel and the reactor geometry before the power rose above perhaps ten
times normal, ending the chain reaction. The result is not minor (as at Chernobyl), but is not a
nuclear bomb. For further detail, assuming you have read the physics Chapter, see Appendix 3 –
Why a Reactor Cannot Explode Like an Atomic Bomb.
Most people do not think of a nuclear power plant as posing a chemical hazard, but thermal
power plants need a large supply of cooling water. Approximately one-half to two-thirds of the
energy produced by any thermal power plant is wasted because of the second law of thermodynamics; the waste energy is rejected to a lake, river, sea, or the atmosphere. For many sites
near large bodies of water, most of the cooling water is used in once-through mode in the main
condenser, and in many plants (fossil-fuel as well as nuclear), it is chlorinated to avoid growth of
biological material such as zebra mussels in the plant equipment. It follows that such plants
have relatively large tanks of chlorine somewhere on-site. The consequences of rupture of
these tanks can be severe off-site contamination (as in the Mississauga train derailment in 1979
[Liverman, 1979], [OMSC, 1981]).
There is no biological hazard associated with a nuclear plant because these plants do not
contain or produce bacteria2 or viruses.
A summary of radiological hazards is provided in Chapter 15. Key points will be summarized
here. The effects can be somatic—affecting the living individual who is exposed to radiation—
or genetic—appearing in the yet-to-be conceived offspring of that person or in later generations.
Somatic effects can occur:
o soon after the exposure (acute, or prompt, or early, or non-stochastic effects—
these terms all mean the same thing) or
o later (delayed or latent or stochastic effects). The word stochastic means random
and reflects the fact that if many individuals are exposed to a moderately “high”
dose of radiation (above about 0.2 Sv each), one can predict the number of such
individuals who will one day get cancer as a result of the exposure, but one cannot predict which individuals will be affected.
o in the fetus of a woman who is exposed while pregnant (teratogenic).
Genetic or hereditary effects have been observed in animals, but not in people.
2
There could be a small biological hazard if the plant uses cooling towers and does not keep them clean, in which
case they could become a source of bacterial growth.
Reactor Safety Design and Safety Analysis
12
The Essential CANDU
[UNSCEAR, 2001].
1.5 Types of Radiation in a Nuclear Power Plant
The radiation in a nuclear power plant comes from fission fragments and from the activation of
non-radioactive material. It therefore includes:
alpha rays, or helium nuclei,
beta rays, or electrons, and
gamma rays, or photons.
Neutrons are not normally a concern to the public in reactor accidents because they slow down
very rapidly in the reactor structures; however, they can be a concern to workers if local shielding is inadequate, or in non-reactor facilities in case of inadvertent criticality.
1.6 Effects of Radiation
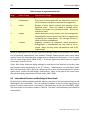
The biological effect of radiation is measured in Sieverts (Sv), a unit which combines the energy
deposited in tissue and the effectiveness of that particular form of radiation in causing damage
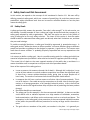
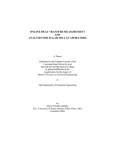
to cells. Chapter 15 provides more detail on this topic. Figure 3 gives a perspective on the
range of actual doses, from normal activities to severe accidents. Sources: [CNSC, 2011],
[Talbot, 2003], [Lewis, 1999], [TEPCO, 2011], [UNSCEAR, 2000].
Figure 3 Examples of radiation dose
Below about 0.1 Sv per person in a large human population, there are no observable stochastic
effects. Therefore, even the most exposed staff members at Fukushima during the accident are
not expected to show symptoms of exposure. One Sv individual dose marks the onset of acute
symptoms, and above 5 Sv, as received by the firefighters at Chernobyl, severe illness and death
may ensue.
Reactor Safety Design and Safety Analysis
Reactor Safety Design and Safety Analysis
13
1.6.1 Linear Hypothesis
As discussed in Chapter 15, the linear hypothesis is used to extrapolate the observed effects on
human populations exposed to high doses of radiation (as in Japanese atomic bomb survivors)
to low doses. For large doses in the stochastic range, the linear hypothesis states that [ICRP,
1990]:
100 person-Sv will produce about 5 fatal cancers in the exposed (general) population.
Sample Problem
Rank the magnitude of the following risks to a group of people (express the answers numerically
and explain your reasoning):
a. A collective dose of 1000 person-Sv given to 1,000,000 people
b. A collective dose of 1000 person-Sv given to 100,000 people
c. A collective dose of 1000 person-Sv given to 100 people
d. A collective dose of 1000 person-Sv given to 5000 people.
Answer:
According to the linear hypothesis, a collective dose of 1000 person-Sv should result in 50 fatal
cancers. However, one must be careful of the range of applicability. For each case in turn:
a) The average dose is 0.001 Sv, which is so small that there is no evidence that the linear
hypothesis applies. Incidentally, this is also less than the annual dose in North America
from natural background radiation.
b) The average dose is 0.01 Sv, and therefore the linear hypothesis is likely inapplicable.
c) The average dose is 10 Sv, which would cause prompt injury or death, and therefore the
linear hypothesis is inapplicable.
d) The average dose is 0.2 Sv, and therefore the linear hypothesis may be used and would
predict 50 fatal cancers over time in the exposed population.
1.6.2 Hormesis
The difficulty with the linear hypothesis is that the effects of radiation on humans at low doses
(below 0.1 Sv) are so small (or even beneficial—the hormesis hypothesis) that the models are
very difficult to validate. At the moment, for better or worse, the linear hypothesis is used
internationally as the basis for setting regulations for radiation protection. However, the
Fukushima accident has led to a rethinking of overly conservative regulations because there is a
real risk in evacuating people unnecessarily, which may be greater in some cases than the risk of
radiation exposure. Moreover, ICRP has taken great pains to distinguish a priori theoretical risks
from a posteriori predictions of “real” health effects resulting from low radiation doses to many
people; see, e.g., [Gonzales, 2013], from which the following is quoted: “Following exposure to
low radiation doses below about 100 mSv, an increase of cancer has not been convincingly or
consistently observed in epidemiological or experimental studies and will probably never be
observed because of overwhelming statistical and biasing factors.”
Reactor Safety Design and Safety Analysis
14
The Essential CANDU
For more details on hormesis, see, e.g., [Cuttler, 2009]. As an example [Chen, 2007], steel
containing Co60 was used in the construction of 1700 apartments in Taiwan, resulting in an
average dose of 0.4Sv to the 10,000 occupants. What was observed was a significant decrease,
rather than an increase, in cancer deaths.
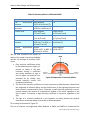
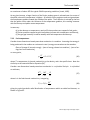
1.7 Sources of Radiation
Because this chapter will now focus on the radiological hazards of
nuclear power plants, we need to know where the radioactive
material is normally and how it can escape. There are several
repositories of radioactive material (we use CANDU here as an
example):
Most of the radioactive material (fission products) is in the
fuel in the core.
Large quantities of long-lived radioactive isotopes are in the
spent fuel, located either in wet pools or in dry shielded
concrete containers.
Tritium (T) is produced in the heavy-water moderator and coolant (about twenty times
more in the former) through activation of deuterium (D) by neutrons:
12 yr
D(n, p) n T (2n, p) He(n,2 p) e .
(1)
Tritium is radioactive, with a half-life of about 12 years, and decays to helium with emission of
an electron. It is hazardous if inhaled or ingested or if it comes in contact with skin, but little
shielding is needed to protect a person: beta particles can be stopped by a sheet of plastic.
Carbon-14 is produced by neutron bombardment of dissolved nitrogen in the moderator.
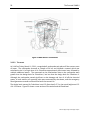
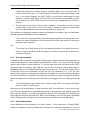
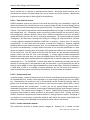
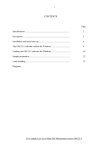
In terms of public safety, the fission products in the fuel are by far the most significant hazard
due to their quantity and their potential to be made mobile or volatile. In normal operation,
the radioactive material in the fuel consists of:
fission products trapped within the ceramic UO2, and
fission product gases in bubbles or interlinked spaces within
the fuel ceramic, or free between the fuel and the sheath.
Figure 4 Fuel element cross
section showing location of
fission products
These exist in the ratio of about 9:1 for the highest-powered fuel element in a CANDU reactor,
as shown in [Ionescu, 2009].
Therefore, accidents which cause perforation of the fuel sheath (but which do not damage the
UO2) have the potential to release only somewhat less than 10% of the gaseous fission products. Sheaths can be damaged mechanically (in fuel-handling accidents) or by overheating: if
the sheath overheats from its normal temperature of 300°C to about 600°C–800°C, it will
plastically deform because of the pressure of the fission product gases it contains, and eventually rupture. To drive out the remaining gaseous fission products and the solid fission products
such as cesium and strontium, the fuel temperature has to be raised to close to the melting
point (2840°C) or the fuel itself must be heavily oxidized by direct exposure to air or steam.
Reactor Safety Design and Safety Analysis
Reactor Safety Design and Safety Analysis
15
Therefore, accidents which release significant amounts of radioactive material are initiated by:
overheating the fuel in the core due to a mismatch between power and cooling
leaks or pipe breaks in the coolant or moderator
mechanical damage to the fuel
overheating of the spent fuel in storage due to a power/cooling mismatch.
All accident analyses reduce to these categories of failures.
It follows that the fundamental safety functions that must be carried out after an accident are:
Control the fission reaction (and shut down the reactor)
Cool the fuel (remove the decay heat)
Contain any release of radioactive material
Monitor the state of the plant.
In summary, control / cool / contain / monitor is the essence of safety design.
1.8 Risk
Safety concerns are ultimately expressed in terms of risk. The risk of a system, which must be
specified (e.g., risk of a component failure, of an activity, of a nuclear reactor, of the nuclear fuel
cycle) is customarily defined as:
Risk fi ci
i
,
(2)
where fi is the expected frequency of event i and ci is its consequence; the summation is over all
events. Like the risk of betting money, this summation makes sense only for a large number of
systems over a long period of time; it does not apply to a single machine (or a single bet), for
which the event outcome is binary (e.g., for one bet, you either win or lose). In nuclear safety,
probabilistic risk analysis can be used to quantify the risk posed by a nuclear power plant; more
typically, it calculates risk indicators such as severe core-damage frequency or large off-site
release frequency. Such indicators can identify potential plant improvements to reduce risk
where practical.
Sample problem
The frequency of a (fully-contained) core-damage accident in a certain 1000 MWe nuclear
power plant is 10-7 per year. If your insurance conglomerate were asked to insure the plant,
what premium would you have to charge to break even over the long term?
Answer:
We need to use a common measure of comparison, in this case average cost / year. A contained
core melt would require removal of the damaged core, decontamination, and replacement of
the reactor. This could take ten years. In addition, the electricity formerly generated by the
plant would have to be replaced. Since the accident is stated to be contained, we do not add
costs for off-site decontamination, evacuation, relocation, nor health effects – for an accident
resulting in a significant release, these would have to be considered. This means that the
Reactor Safety Design and Safety Analysis
16
The Essential CANDU
average cost / year is (using rough ballpark values—the problem can easily be made very
complex if greater sophistication and accuracy is needed):
{[$5 × 10⁹ for decommissioning / decontamination + $5 × 10⁹ for rebuilding the plant] +
[106 kW × $0.06 /kW-hour × 24 hours / day × 365 days / year × 10 years]} × [10-7 / year]
= [$1000 + $526] / year or ~$1500 /year.
Note the importance of the replacement electricity cost.
Because accidents cannot be prevented in any significant human endeavour, the broad goals of
reactor safety analysis are to:
Show that the frequency and consequences of accidents are within acceptable limits
and/or
Show that the frequency of an accident is too small to consider.
Acceptable limits are defined (broadly) with respect to the event frequency. For example,
frequent occurrences (minor faults such as loss of electrical power) should not stress the
system, damage fuel, or invoke protective systems. Very infrequent events, like a large loss of
coolant, are permitted to push the physical systems into plastic deformation or damage fuel, but
not to allow radioactive release beyond a prescribed limit. Severe accidents may damage the
core, but should not fail the containment building. This approach may, but does not necessarily,
address the direct economic costs of a severe accident, which can be huge, even if the public
safety impact is minimal, e.g., Fukushima.
This framework implies that:
1. We have to know what the possible accidents are.
2. We have to be able to predict their frequency.
3. We have to be able to predict their consequences.
Safety analysis is carried out at several stages in the plant life cycle:
During preliminary design (design assist), to ensure that the design concepts meet safety
requirements.
During final design, to confirm that safety requirements are met and to include the results as part of the applications for the licences required to construct and operate the
plant (see Chapter 16).
For an operating plant, to incorporate the effects of any changes in the plant, in fundamental knowledge, in operating experience, and in safety analysis methodology.
Three safety-analysis methods are used during some or all of these stages. These are complementary, not mutually exclusive, and in practice all three are used:
1. Rule - e.g., use the ASME code for pressure-vessel design. It is implied that following the
code or the standard reduces the likelihood of failure of the material to a very low level.
This is largely based on long experience, testing, and more recently, analysis.
2. Deterministic safety analysis - i.e., assess a prescribed list of failures which are selected
based on past experience and judgement. Sometimes these are called “design basis acReactor Safety Design and Safety Analysis
Reactor Safety Design and Safety Analysis
17
cidents”, as discussed in Section Error! Reference source not found.. Each accident sequence is chosen to be severe enough that the consequences of a “real” accident should
be less; this means that only a subset of possible accidents is analyzed. For example, the
Emergency Core Cooling (ECC) system is sized to provide enough flow to refill the core
after a break in the heat-transport system that is up to twice the flow area of the largest
pipe and on a time scale that prevents excessive fuel damage. The consequences of
these stylized accidents are predicted and compared against analysis limits. Such analysis limits can be loosely based on frequency.
3. Probabilistic safety analysis - i.e., assess the frequency and consequences of failures,
optimizing to deal with the high-risk contributors. PSAs therefore proceed using the following methodology:
a. define risk-based criteria,
b. generate a set of accidents to consider,
c. predict the frequency and consequences of each event,
d. show that the criteria are met.
Much of the rest of this Chapter covers these three methods.
1.9 Problems
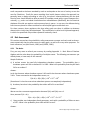
1.
International bodies set limits for the dose an individual should receive from all manmade sources. A number of issues exist behind this framework. Discuss the following four
questions and draw reasoned conclusions:
a. How should exposure from radiation used for medical purposes be controlled
(i.e., what factors should determine whether or not, and how much, radiation
should be used)?
b. Should large power reactors have the same dose limits as small research reactors
such as the McMaster Nuclear Reactor (which also produces medical isotopes)?
Why?
c. You are a safety expert and have been asked to approve a smoke detector. Assume that the smoke detectors give a whole-body dose [USNRC, 2001] of 10-5
mSv per year to each of the 35,000,000 people in Canada. What would your decision be, and why? What factors would you look at in normal operation of the
detector? What is the most severe accidental exposure that can happen with a
smoke detector, and how would you assess its acceptability on a risk basis?
d. What dose would you accept for voluntary lifesaving (i.e., your colleague is
trapped in a very high radiation field and you are asked to go in and save him)?
Give reasons.
2.
A nuclear designer is trying to optimize his design. He knows of an accident with a
frequency of 10-7 per year which leads to a contained core melt and causes the following
effects:
a. Permanent damage to the plant (i.e., cannot be recovered)
b. Evacuation of nearby people (5,000) for three days
Reactor Safety Design and Safety Analysis
18
The Essential CANDU
c. No prompt fatalities
d. A collective dose to the closest population of 100 Sv.
He can reduce the frequency (but not the consequences) of this accident by a factor of ten by
putting in an extra heat-removal system costing M$10 in capital costs and an extra $100,000 per
year in maintenance and operating costs. How would you make this decision in a quantitative
way? Hint: Consider expressing all accident consequences in terms of dollars. Then calculate
the total average annual costs in each scenario. Some organizations assign a cost per Sv of
dose—find out typical values. This problem will take you some time.
3.
A massive spontaneous failure (i.e., due to a material flaw, not as a result of a core melt)
in an LWR pressure vessel would simultaneously breach all the physical barriers which prevent
radioactive material from escaping: the fuel, the primary-coolant pressure boundary, and the
containment. Research and describe the approach taken by LWR designers to show that this is
“incredible”. Does this issue apply in any way to CANDU?
4.
A nuclear regulator is considering a high-level safety goal for new nuclear power plants
in Canada. He proposes two requirements:
a. The risk to an individual close to the nuclear power plant of dying immediately
from an accident must be less than 10-6 per year.
b. The risk to an individual close to the nuclear power plant of getting cancer from
an accident must be less than 10-5 per year.
Two nuclear power plants apply for a licence. Each has done an accident analysis, and the
results are as follows:
1. For plant 1, no significant releases occur for any accident above a frequency of
10-7 per year. However, there is a core melt at that frequency which fails containment and gives a dose of 10 Sv to each individual in the nearby population.
2. For plant 2, two accidents are the major contributors to risk. One causes severe
fuel damage, but prevents core melt. It occurs at a frequency of 10-4 per year
and gives a dose of 0.25 Sv to a number of individuals in the nearby population.
The other is a core melt, but it is contained—it occurs at a frequency of 10-6 per
year and gives a dose of 1 Sv to a number of individuals in the nearby population.
Determine numerically whether these plants meet either or both safety goals or neither one.
Hint: consider converting average dose to risk.
2 Design Basis Accidents
In Section 1.8, the concept of stylized accidents (design basis accidents) that could be used in
designing parts of the plant was introduced. This section shows how to go about defining these.
More specifically, design basis accidents are the set of accidents for which the designer makes
explicit provision (defence), while remembering that more severe or peculiar accidents can
occur and ensuring that his/her design has some capability to deal with them.
Unfortunately, there is no way of identifying possible accidents beforehand (in any large-scale
Reactor Safety Design and Safety Analysis
Reactor Safety Design and Safety Analysis
19
engineering field) that is guaranteed to be complete. The history of any technology is replete
with unpleasant surprises, especially at the beginning—just think of the Hindenburg disaster,
the Flixborough cyclohexane explosion [Venart, 2004], and of course the Titanic. Technologies—if we are fortunate—have their accidents early on, when the scale is small and the lessons
learned can be applied to commercial applications.
The best way to obtain a “nearly complete” list of accidents, apart from experience, is to use
more than one technique. In the next few subsections, we describe several such techniques.
2.1 Top-Down Approach
One technique is called the “top-down” approach, which starts by specifying an undesired
outcome and then asks what the direct and immediate causes of that outcome could be. Then
one looks at each cause in turn and asks what are its direct and immediate causes, and so on.
After a few such cycles, one has generated a list of accidents, from which design basis accidents
can be selected.
For a power reactor, the top event could be taken as “unwanted movement of radioactive
materials”. Because most radioactive materials are in the fuel, the coolant, the moderator, or
the spent-fuel bay, we then ask how in each of these cases they could become mobile, i.e.,
airborne or waterborne. Radioactive material could be released from the fuel by overheating or
mechanical damage; from the coolant and moderator, by pipe breaks or overheating (which
later then releases the liquid or steam through relief valves); and from the spent-fuel bay, also
by overheating. Fuel overheating in the core (power-cooling mismatch) can be caused by loss of
heat removal from the coolant (loss of heat sink), loss of the coolant itself, coolant flow impairment, or a loss of reactor reactivity control which causes the power to rise.
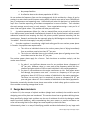
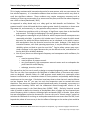
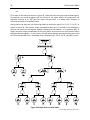
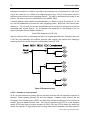
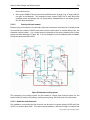
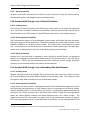
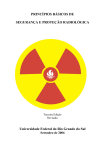
Figure 5 illustrates the event-generation sequence graphically. Events in ovals represent possible end-points of the chain, where further detailed decomposition would not add much more
information, i.e., the ovals are potential design basis accidents. Once we have reached this
reasonable level of resolution, we can sort the events into design basis accidents and beyond
design basis accidents (BDBAs), using expected likelihood, and possibly consequences, as
criteria. Note that the figure is both highly simplified and incomplete, with a number of undeveloped branches.
Reactor Safety Design and Safety Analysis
20
The Essential CANDU
Figure 5 Simplified top-down approach
2.2 Bottom-Up Approach
Another approach is to look at each component of the nuclear power plant and ask what is the
Reactor Safety Design and Safety Analysis
Reactor Safety Design and Safety Analysis
21
consequence if this component fails. If systems exist which are supposed to protect the reactor
against such a failure, what are they, and what happens if they also fail? Eventually, if the power
plant is well designed, one gets to a very low frequency and draws the boundary between
design basis and beyond design basis accidents again. This is called a “bottom-up approach”.
Another term is FMEA, which stands for “failure modes and effects analysis”, although this
approach tends to be more limited because it stops after the first failure.
Sample Problem: Do a bottom-up analysis of the feed-water system in a nuclear power plant.
(The reader is assumed to be familiar with CANDU design—if not, please consult the earlier
Chapters in this book.)
Answer: The feed-water system can fail in a number of ways: power to the pumps may fail, or a
feed-water line may break, or the feed-water valve(s) may inadvertently close. Taking each
feed-water system component in turn and assuming that it fails, we then identify the systems
which are there to protect against such failures—e.g., the auxiliary feed-water system, the
shutdown cooling system, and the emergency water system (these are described in Section 5).
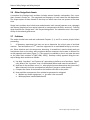
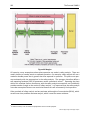
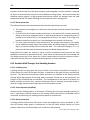
We then look at the failure of each of these mitigating systems. From these results, using
judgment to determine frequencies, we can select likely candidates for DBAs, shown in ovals in
Figure 6. The un-terminated arrows represent further development of the diagram.
Figure 6 Simplified bottom-up example
A combination of the top-down and the bottom-up methods will give a large number of accidents which cover most possible events. However, the treatment of frequency is not very
precise.
2.3 Probabilistic Safety Analysis
Probabilistic safety analysis (PSA) is a rigorous tool for identifying accidents and assigning
Reactor Safety Design and Safety Analysis
22
The Essential CANDU
frequencies to them. PSA uses a top-down approach to generate the failure frequencies of
operating systems and the failure probabilities of safety systems (fault trees). It then combines
failure of each operating system with successive failures of the required safety systems to obtain
a long list of accidents and their frequencies (event trees). One can also select design basis
accidents from this list if they have not already been picked up by other techniques. This topic
is covered in more detail in Section 4.
2.4 Experience
Design basis accidents may also be added because of experience.
For example, Canadian practice requires that each design basis accident be analyzed assuming
complete failure of one shutdown system, no matter how low the frequency. The reason goes
back to 1952, when the core of the NRX research reactor in Chalk River, Ontario, was damaged
in an accident ([Lewis, 1953] [Hurst, 1953]) in which the power increased and the shutdown
system was impaired. One of the causes was a complex control/shutdown system design; the
shut-off rods were hydraulically driven, and their performance was sensitive to dirt in the
system. The accident resulted in a large subsequent emphasis on shutdown-system reliability,
testability, and robustness, to the extent that, even though the shutdown systems in CANDU
bear no resemblance to those in NRX (lessons having since been learned about shutdownsystem design), the CANDU reactor had to be designed to survive an accident even if the
shutdown system failed. Although one could show that the most severe accident without
shutdown (a large LOCA) would not release enough energy to break containment, the designers
decided (eventually) to add another, fully independent shutdown system, so that even if one
shutdown system failed completely, the other could be credited.
The accident at Fukushima in 2011 [JNTI, 2011] is a recent example of a poor choice of the
parameters for a design basis accident. Although the plant had a Design Basis Flood level, it was
clearly inadequate, and since the accident, all operating plants have had to change their provisions for both Design Basis Floods and Beyond Design Basis Floods. We shall cover key historical
events in more detail in Section 3.
2.5 Canadian Approach to DBAs
We do not have space to cover the entire historical development of the Canadian approach to
DBAs. See [Snell, 1978] for an overview. Instead, we shall describe the basis for selection of
DBAs for currently operating CANDUs and planned future plants.
2.5.1 Siting guide
In 1972, D. G. Hurst and F. C. Boyd of the Atomic Energy Control Board (AECB) — the name at
the time of the nuclear regulator (now CNSC) — laid the ground rules for the deterministic
licensing guidelines under which all large operating CANDU plants up to but excluding Darlington have been licensed [Hurst, 1972]. The spectrum of possible design basis accidents was
collapsed into two broad categories: single failures, or the failure of any one process system in
the plant, and dual failures, a much less likely event defined as a single failure coupled with the
unavailability of either a shutdown system, or containment, or the emergency core cooling
Reactor Safety Design and Safety Analysis
Reactor Safety Design and Safety Analysis
23
system: these constituting the so-called special safety systems. For each category, a frequency
and a consequence limit was chosen that had to be satisfied. In addition, to deal with the siting
of a reactor (Pickering A) next to a major population centre (Toronto), population dose limits
were defined for each category of accident.
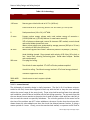
The limits were as follows (sometimes this is called the Siting Guide):
Table 1 Single / dual failure limits
Accident
Single Failure
Maximum
quency
1 per 3 years
Dual Failure
1 per 3000 years
Fre- Individual Dose Limit
0.005 Sv
0.03 Sv thyroid
0.25 Sv
2.5 Sv thyroid
Population Dose
Limit
102 Sv
102 Sv thyroid
104 Sv
104 Sv thyroid
For example, loss of reactivity control, loss of Class IV power, and a loss-of-coolant accident are
all single failures; loss of coolant plus failure of the ECC, or loss of coolant with failure of the
containment isolation dampers to close, are dual failures. In this framework, both single and
dual failures are design basis accidents.
Safety-system demand unavailability can be inferred from the frequency limits in this table:
because a dual failure is a single failure plus unavailability of a safety system and must occur no
more often than one in 3000 years, each safety system must fail no more often than 1 in 1000
times, and therefore the demand unavailability is 0.001.
This approach had a number of deficiencies, such as lumping events with widely differing
frequencies into the same class—e.g., a large pipe break or a loss-of-coolant accident (LOCA)
and loss of off-site power both fell into the single-failure category. Combinations of higherfrequency events were also not addressed.
2.5.2 Consultative Document C-6
To address some of the deficiencies in the single-dual failure methodology for design-basis
accidents, the AECB issued document C-6 in June 1980 [AECB, 1980]. This retained the concept
of classes of events, five in this case. As with the Siting Guide, the classes roughly grouped
events based on frequency, but the assignment of events to classes was done by AECB staff
based on their beliefs about the likelihood of the event. Design basis accidents included, for
example:
Class 1: failure of reactivity or pressure control; failure of normal electrical power; loss of feedwater flow; loss of service-water flow; loss of instrument air; and a number of other events that
one might expect to occur occasionally.
Class 2: feeder-pipe failure; pressure-tube failure; channel-flow blockage; pump-seal failure;
other events that would not be expected to occur more than once (if that) in a plant lifetime.
Class 3: large LOCA; earthquakes and other events that are rare and could damage the fuel or
Reactor Safety Design and Safety Analysis
24
The Essential CANDU
portions of the plant.
Class 4: Class 1 events + unavailability of a special safety system
Class 5: Class 2 or 3 events + unavailability of a special safety system, e.g., LOCA plus ECC
impairment.
Dose limits were defined for individual members of the public only (see Table 2).
Table 2 Consultative document C-6 limits
Event
Class
Thyroid Dose (Sv)
1
Expected
Frequency Whole-Body Dose (Sv)
per reactor-y [Charak,
1995]3
> 10-2
0.0005
2
10-2 to 10-3
0.005
0.05
3
10-3 to 10-4
0.03
0.3
4
10-4 to 10-5
0.1
1
5
< 10-5
0.25
2.5
0.005
2.5.3 RD-337
As the nuclear industry has become more international and more competitive, the Canadian
Nuclear Safety Commission (CNSC) has understood the need to align its requirements, especially for new builds, more closely with international ones and has therefore developed toplevel design requirements [CNSC, 2008] which align more closely with IAEA standards [IAEA,
2000] and are less technology-specific. Events are divided into three classes: anticipated
operational occurrences (AOOs), which are expected to occur at least once in the plant lifetime;
design basis accidents; and beyond design basis accidents (BDBAs), including event sequences
that may lead to a severe accident. The limits are from [CNSC, 2008] and [CNSC, 2008a].
Table 3 Dose limits
Event
Frequency
Dose Limit (Sv)
Anticipated Operational Occurrence
10-2 / reactor-year
0.0005
Design Basis Accident
10-2 to 10-5 / reactor-year
0.020
There are no dose limits for BDBAs, but there are numerical safety goals and specific system
design requirements; see Section 4.
3
Expected frequency ranges are not part of C-6; they were used by Ontario Hydro in the licensing of Darlington to
classify events not listed in C-6.
Reactor Safety Design and Safety Analysis
Reactor Safety Design and Safety Analysis
25
2.6 Other Design Basis Events
A complete list of design basis accidents includes external hazards: earthquakes, fires, tornadoes, tsunamis, floods, etc. The magnitude and frequency of each hazard are site-dependent.
The unique aspect of these hazards is that they can affect more than one system at the same
time.
Design basis accidents also include man-made hazards, both internal (operator error, sabotage)
and external (explosions from nearby industrial or transportation facilities, terrorism). Defining
what should be the “design basis” and “beyond design basis” for malevolent acts is the responsibility of the national government.
2.7 Problems
The reader should have read and understood Chapters 3, 4, and 5 on reactor physics before
proceeding.
1.
A laboratory experiment has been set up to determine the critical mass of enriched
uranium. Two hemispheres of U235 metal are supported in an unshielded facility by one scientist. Other scientists are in the same room, observing. A screwdriver is used to slowly push one
hemisphere closer to the other, while a neutron detector measures the increase in neutron flux
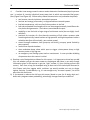
as they approach each other (Figure 7). (This scenario is modelled on, but is not quite the same
as, the Lewis Slotin accident in 1946 [LANL, 2000]). Develop a safety approach using the concept of design basis accidents as follows:
a) Use both “top-down” and “bottom-up” approaches to define a set of accidents. Specifically: What is the “top event” that is to be avoided? What could cause the accidents?
b) How fast do the accidents occur (i.e., what physical process determines the time scale)?
What inherently limits the consequences (why don’t you get a nuclear bomb)?
c) Compare the nature of the hazard to the scientists with that to the public.
d) How could the consequence of an accident be prevented or mitigated:
Without any further equipment, i.e., just after it has occurred?
With equipment installed beforehand?
Reactor Safety Design and Safety Analysis
26
The Essential CANDU
Figure 7 Criticality experiment
2.
Calculate the “risk” in Sv/year to an individual at the site boundary from a (not very
good) reactor designed and operated so it exactly meets the dose limits in:
a)
b)
c)
The two classes of accidents in the single/dual failure approach
Event classes 1 to 5 inclusive from Consultative Document C-6
The AOO and DBA limits from RD-337.
What conclusions can you draw (if you think the comparison is not meaningful, explain). What
relative contribution do the more severe accidents make to the risk?
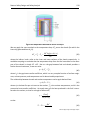
3.
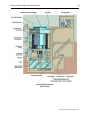
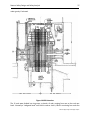
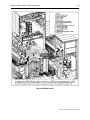
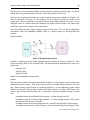
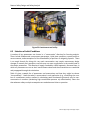
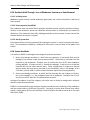
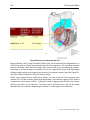
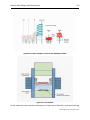
Consider the small reactor for urban district heating shown in Figure 8 [Snell, 1989]. It is
intended to be located in urban areas in buildings such as hospitals or universities [Currie,
1985]. Salient safety-related characteristics are:
pool reactor, natural circulation, atmospheric pressure
double-walled pool (350,000 litres) with a purification system (small pump and ionexchange resins, outside the pool)
10 MW(th) output
forced-flow secondary side, with a heat exchanger immersed in the pool
tertiary heat exchanger connected to the heating grid (why?)
negative reactivity feedback from fuel temperature, coolant temperature, and coolant void (e.g., an increase in coolant temperature decreases the reactivity)
active reactor-control devices (rods) with limits on rate (a few mk/hour, compared
to, say, CANDU, which can go up to several mk/minute) and worth (no rod in excess
of a couple of mk).
low fuel temperatures, so that there are no free fission products in the fuel
two shutdown systems—one passive system actuated by a signal (drops the control
rods) and one fully passive system (rods within the core which are thermally activated: the absorber material inside the rods, normally above the core, melts and fall
Reactor Safety Design and Safety Analysis
Reactor Safety Design and Safety Analysis
27
into the core on high coolant outlet temperature)
a confinement boundary (not shown in the figure) covering the pool top; however,
the building is conventional
no emergency core cooling system (why?)
a licensed operator is not required to be in the control room. Any upset sounds an
alarm which notifies a local attendant (who can shut the reactor down, but not restart it). Licensed operators can remotely monitor the reactor, but not control it.
Develop a set of design basis accidents for this reactor. It is important to show how you did this,
not whether you get the same answer as the designer did (there is not really enough information given in the exercise to get the “right” answer—it’s your thinking process that counts). If
you are getting design basis accidents which seem inconsistent with an urban location, how
could they be made impossible?
Figure 8 SES-10
Reactor Safety Design and Safety Analysis
28
The Essential CANDU
4.
Consider a low-energy research reactor used to determine fundamental physics parameters. It consists of a vertical cylindrical heavy-water tank in which are suspended fuel assemblies (Figure 9 and Figure 10). Salient safety-related characteristics are (somewhat simplified):
pool reactor, natural circulation, atmospheric pressure
nominal zero energy (a few watts), no engineered heat-removal systems
low fuel temperatures, with very few fission products in the fuel
fuel rods suspended from hangars which can be arranged manually into different lattice pitches and geometries. Fuel rods are stored beside the pool.
capability to use fuel with a large range of enrichment ratios (but not highly irradiated fuel)
provision for insertion of a few channels consisting of fuel inside a pressure tube
containing electrically heated coolant at high pressure and high temperature inside a
calandria tube (but still nominally ~zero nuclear power)
control through moderator level (pump-up and drain); pump-up speed limited by
pump capacity
manual start-up and shutdown
three redundant dump valves which open to trigger a heavy-water dump on high
neutron power or high log rate
no emergency core-cooling system and no containment. A cover provides shielding
of operators when the reactor is critical.
a) Develop a set of design basis accidents for this reactor. It is important to show how you did
this, not whether you get the same answer as the designer did (there is not really enough
information given in the exercise to get the “right” answer, it’s your thinking process that
counts). Start from a long list developed using at least two of the techniques discussed in
this Chapter and then suggest which accidents you would consider too rare to design
against, and why. Provide details, e.g., it is not enough to say “increase in power”; list all the
ways that this could occur.
b) If you wanted to reduce the risk from this reactor (based on your list of design basis accidents and a judgment about probability), what design changes would you make first?
Reactor Safety Design and Safety Analysis
Reactor Safety Design and Safety Analysis
29
Figure 9 ZED-2 cutaway
[AECL, 2011]
Reactor Safety Design and Safety Analysis
30
The Essential CANDU
Figure 10 ZED-2 top view
Reactor Safety Design and Safety Analysis
Reactor Safety Design and Safety Analysis
31
3 Experience
Current power reactor safety design has been powerfully influenced by accidents that happened during the development of the technology. In this Section, we describe a few of them—
space constraints do not permit an exhaustive study.
Real accidents almost never follow the simple assumptions in design basis safety analysis. Most
real accidents tend to be very complex, have more than one contributing factor, have a high
component of human error and extraordinary human recovery, and often leave one wondering,
“How did all these things happen together?”
The answer is, of course, that if they didn’t happen together, there would be no accident. It is a
poorly designed nuclear power plant where a single failure or error causes a catastrophic
accident. Most accidents are the end-point of a chain of events, prevention of any one of which
would have stopped the accident from happening. We will discuss this later in Section 5.1
(Defence-in-depth).
Figure 11 Learning and forgetting
The fact that such chains have occurred provides powerful lessons learned for future designs
and current operation.
In general, when any new technology is introduced, its characteristics are not fully known, and
there is an early peak in the accident rate. As people learn from mistakes in design and operation, the accident rate declines, as shown in Figure 11. See also [Ott, 1981] for a more detailed
discussion. The decline does not, however, account for organizational forgetting, and if nothing
is done to preserve corporate or industrial memory, the rate will start to rise again. One of the
purposes of case studies is to ensure that past mistakes are not repeated.
What you are expected to obtain from this section is the ability to dissect an accident. What
Reactor Safety Design and Safety Analysis
32
The Essential CANDU
was its nature? What were the root causes? What were the lessons learned for design? For
operation? The exercises at the end of the chapter give you some additional actual incidents to
assess.
You should have read and understood Chapters 3, 4, and 5 on reactor physics before proceeding.
Each of the case studies described below gives a brief description of the facility, the event, and
lessons learned. These are all of necessity very abbreviated. In particular, of the dozens of
lessons learned, only the few most important are listed. The reader should consult the references for more detail.
3.1 Criticality Accidents and Power Excursions
The earliest accidents in nuclear reactors were criticality accidents. This is not surprising
because most early reactors were research reactors, which were small enough that if the
reactor was shut down, the decay heat could be removed by the water and by structures
surrounding the core for long periods of time. Loss of heat sink was not a major issue. Therefore, the main safety concern was avoiding unwanted criticality and shutting down quickly if it
occurred. This concern was emphasized by the large worth of some of the reactivity-control
devices: because reactors were small, space for control rods was limited, and refueling was
infrequent, the control rods had to compensate for burnup and tended to have high reactivity
worth.
A number of reactivity accidents have taken place when the reactor was supposed to be shut
down. An initially sub-critical reactor is not as safe as it sounds. The power is fairly constant
and proportional to the number of source neutrons divided by the absolute value of the (negative) reactivity [Cameron, 1996]:
Nf
Se
,
(3)
where:
Nf is the number of neutrons,
Se is the source term (neutrons produced per unit of time, either from spontaneous fission, fission product decay, photoneutrons or an artificial neutron source), and
ρ is the reactivity, negative in this case.
However, the reactor is not under active “control”. Detectors are insensitive, and indications
that the reactor might be near-critical are not very obvious. In some cases, the reason for the
shutdown is to do maintenance on the control or shutdown systems, which means that they are
not available. Then safety depends on ensuring an adequate shutdown margin (net negative
reactivity) by procedural means, i.e., inserting a number of absorber rods, or removing fuel, or
adding a liquid absorber to the moderator or coolant, or removing the neutron reflector surrounding the core. Safety also depends on maintaining the shutdown margin over time. This is
the reason for the guaranteed shutdown state in CANDUs: to have a large enough negative
margin that the reactor is resistant to operator mistakes or equipment failures. It is also good
Reactor Safety Design and Safety Analysis
Reactor Safety Design and Safety Analysis
33
practice, as we shall see from the case studies, to have an additional means of shutdown always
poised, even during shutdown.
You may want to think about whether it is safer to refuel a reactor while it is critical or during a
shutdown.
3.1.1 SL-1
3.1.1.1 Description
This summary uses material from [USAEC, 1962], [USAEC, 1962a], [USAEC, 1962b], [Stacy, 2000],
and [Thompson, 1965].
The SL-1 (Stationary Low Power Reactor No. 1) was a natural-recirculation pressurized boilingwater military reactor with a thermal power of 3 MW. It was located at the Atomic Energy
Commission National Reactor Testing Station in Idaho Falls, Idaho. Figure 12 shows a cutaway of
the reactor vessel. At the time of the accident, on January 3, 1961, there were 40 fuel assemblies and 5 control rods in the core.
3.1.1.2 The event
Three operators were engaged in reassembling one of the control-rod drive mechanisms while
the reactor was shut down. Part of the assembly process required raising the shaft of the rod a
limited amount by hand. This was done by unclamping the rod and raising it; the rod was then
re-clamped, and the only remaining task was to unclamp and lower the rod. For some unknown
reason, the rod was instead raised rapidly, making the reactor super-prompt critical. The
pressure vessel jumped up nine feet, with the chain reaction being compensated for (probably)
initially by the negative feedback due to heating of the fuel and moderator and then by the
melting and vaporization of the fuel itself.
Two operators were standing on the lid at the moment of the accident. One was thrown to one
side as the vessel rose. The other was impaled on a shield plug ejected from the top of the
reactor and was carried up to the roof of the reactor room, where he remained suspended. The
third man was killed by radiation and flying debris. Table 4 gives a chronology of the events.
Reactor Safety Design and Safety Analysis
34
The Essential CANDU
Figure 12 SL-1 cutaway
Reactor Safety Design and Safety Analysis
Reactor Safety Design and Safety Analysis
35
Table 4 SL-1 chronology
Time
Event
-500 msec
Central control-rod withdrawal starts.
-120 msec
Reactor goes critical with rod at 16.7 in. (40.6 cm).
Central rod at 20 in. (50.8 cm), period = 3.9 ±0.5 msec, (2.4 ± 0.3)% Δk.
0
Peak power burst (1.9 ± 0.4) × 104 MW.
~2 msec
34 msec
Prompt nuclear energy release ends; total nuclear energy of excursion =
(133±10) MW-sec [+(24 ±10) MW-sec in metal-water reaction].
20% of plate area destroyed; centre 16 elements 50% melted; central shroud
and control blade ejected from core.
Water column above core accelerated by average pressure (500 psi or 35 atm)
to a velocity of 160 ft/sec (49 m/sec).
Water slams against lid of vessel. Maximum pressure ≈10,000 psi (~700 atm).
160 msec
Head shielding ejected. Plugs ejected with velocity of 85 ft/sec (26 m/sec) or
less. Vessel rises, shearing connecting pipes. Guide tubes collapse. Nozzles
and vessel expand.
First plug hits ceiling.
Two-thirds of water expelled. 5%–10% of fission products expelled.
Vessel hits ceiling. Total kinetic energy involved ~1% of total energy released.
Insulation ripped from vessel.
2000–4000
msec
Vessel comes to rest in support cylinder.
3.1.1.3 Lessons learned
The philosophy of reactivity design is vitally important. The fuel in SL-1 had boron strips attached to the fuel; these were supposed to burn up with the fuel to keep the core reactivity
within the control range of the control rods. These strips had burned up faster than planned,
and in addition, pieces of boron had fallen off the fuel during operation. The net result was that
the core became more reactive to the point that it could be made critical with four rods fully in
the core and the central one partially withdrawn. The criticality position of the central rod at
the time of the accident was 16.7 inches withdrawn; the extra 4 inches that the rod was withdrawn above this value added more than four times the delayed neutron fraction β, giving a
reactor period of 4 msec. Clearly, once the transient had started, no operator action and no
Reactor Safety Design and Safety Analysis
36
The Essential CANDU
shutdown system could stop it in time.
Many lessons were learned from SL-1; here we summarize the major ones concerning reactivity
control:
1. It should be impossible for a reactor to be made critical by withdrawing the single most
effective rod. Conversely, it should always be possible to shut down a reactor with the
single most effective rod stuck in its outermost position. This so-called “single-rod rule”
has been followed ever since in safe reactor design.
2. It should not be possible to withdraw a high-worth rod quickly. It is still unknown why
the operator withdrew the rod. In any case, the lesson is that if a reactor requires highworth rods, there must be mechanical means to prevent their rapid withdrawal.
3. In a reactor where large amounts of reactivity can be added in short times, there must
be inherently fast negative reactivity feedback, for example from fuel temperature, so
that the transient is stopped short of reactor damage. This lesson was later applied in
commercial light-water reactors.
Note that the total worth of reactivity devices in CANDU is quite low because on-power refueling means that the movable control devices do not have to compensate for burnup. Moreover,
the dispersed CANDU core enables the reactivity worth to be spread among many individual
reactivity devices.
3.1.2 NRX
3.1.2.1 Description
This summary uses material from [Lewis, 1953], [Hurst, 1953], [Larson, 1961], and [Cross, 1980].
NRX was Canada’s first large research
reactor, built in 1947 with a thermal power
of 30MW. The moderator was heavy water
contained in a cylindrical calandria. Cooling was once-through, light-water, taken
from and returning to the Ottawa River.
Passing through the calandria were vertical
tubes open to the air at top and bottom.
Each fuel rod, made from metallic uranium
sheathed in aluminum, had its own cooling
jacket (Figure 13); each rod, with its cooling
jacket, was located in one of the vertical
Figure 13 NRX fuel cross section
tubes (Figure 14). A stream of air passed
between each fuel rod and its calandria
tube. Twelve boron shut-off rods passed through 12 of these tubes. Start-up was achieved by
removing half these rods, after which the reactor was controlled by varying moderator level.
The shut-off rods could be raised by compressed air and were then held up by an electromagnet. They could be driven back in using high-pressure air, although they would fall more slowly
Reactor Safety Design and Safety Analysis
Reactor Safety Design and Safety Analysis
37
under gravity if released.
Figure 14 NRX elevation
The 12 rods were divided into six groups, or banks, of rods, ranging from one to four rods per
bank. Normally a “safeguard bank” was held in reserve: that is, bank 1 containing four rods was
Reactor Safety Design and Safety Analysis
38
The Essential CANDU
the first to be removed during a start-up and was designed to overcome any reactivity added if
the reactor should go inadvertently critical on removal of any of the remaining banks of rods.
Removal of the safeguard bank was prohibited by limit switches on each rod unless all other
rods were down; however, the switches had been giving trouble and had been disabled.
To ensure fast start-up after a shutdown (and avoid xenon poison-out), it was possible to drive
up the first four rods, worth 30 mk, in a few seconds.
There were four pushbuttons on the control panel. Pushbutton 4 charged air to the heads of
the shut-off rods; release of this air drove the rods down. Pushbutton 3 temporarily increased
the current in the electromagnet and ensured that the rods were properly seated. Pushbutton
1 raised the safeguard bank, and Pushbutton 2 raised the remaining banks in automatic sequence. Normal operation was to press Pushbutton 3 along with 4, 1, and 2. If 3 was not
pressed with 4, air might leak from the head system; if 3 was not pressed with 1 and 2, the shutoff rods might not be drawn fully home, and the safety circuits would prevent start-up from
proceeding.
The void reactivity was positive and large; that is, removal of all the light-water coolant would
result in an increase in reactivity of 25 mk.
3.1.2.2 The event
At the time of the accident, the reactivity of certain fuel rods was being measured at low power.
The cooling to these rods was reduced, and one was being cooled only by air.
The following sequence of events is taken from [Cross, 1980]:
“The accident occurred during a start-up procedure. Just as the first group of shut-off
rods was about to be removed, an operator in the basement of the building (who had
nothing to do with the start-up) mistakenly turned some air-valves which caused several
shut-off rods to rise. This was immediately shown by the indicator lights in the control
room. The reactor supervisor phoned the operator to stop and went down to the basement himself to make sure that the valves were properly reset. When this was done the
rods should have gone down into the reactor. In fact, they went down only partway, but
far enough that the lights in the control room indicated that they were down.”
This failure to reinsert is not explained in any of the published reports. Cross continues:
“The supervisor in the basement phoned the control room and told his assistant to press
two numbered buttons. He gave the wrong number for one of the buttons, and when it
was pressed, instead of resetting the air pressure as was intended, it raised four more
shut-off rods. If the first group of shut-off rods had been down, as their lights indicated
they were, raising four rods was a reasonable thing to do, so the mistake was not recognized.”
Specifically, the supervisor asked the assistant to press buttons 4 and 1. This would charge the
air to the heads and raises the safeguard bank. He had meant to say 4 and 3, which charges the
air to the heads and seats the rods. However, because button 3 was not pressed, the air to the
heads brought up by button 4 leaked away, and the safeguard bank (which appeared to have
Reactor Safety Design and Safety Analysis
Reactor Safety Design and Safety Analysis
39
been up already) was raised. The supervisor realized his mistake, but the assistant in the
control room had to leave the phone to use both hands to push the two buttons.
From [Cross, 1980]:
“It was soon apparent from instruments in the control room that the reactor was above
critical and the power level was rising. This was surprising, but not alarming, since the
reactor could easily be turned off by dropping the shut-off rods just raised. However,
when after 20 seconds, the button was pressed to do this, only one of the four rods actually went down. The power level continued to climb and, after some discussion in the
control room, it was decided to dump the moderator into a storage tank. Within less
than 30 seconds, the power-level metres were back on scale and the power dropped
rapidly to zero.”
The removal of the safeguard bank made the reactor supercritical by about 6 mk and started a
power rise to about 100 kW. The lone shut-off rod started to fall in at this point, but the power
kept rising to about 17 MW. Boiling then occurred in some of the temporarily cooled rods,
expelling the light water and increasing the reactivity by another 2.5 mk. Power continued to
rise to 60–90 MW, when it was stopped by dumping the moderator.
The power surge melted a number of fuel rods and caused a number of calandria tubes to fail.
Eventually, in a major operation, the reactor calandria was removed and buried; the building
was decontaminated, and the reactor was replaced.
3.1.2.3 Lessons learned
1. Some negative reactivity should always be held in reserve (safeguard bank). Before a
reactor is made critical, the safeguard bank is removed and poised, so that if anything goes
wrong, it can be quickly reinserted. In CANDU, both shutdown systems 1 and 2 are poised
before the reactor is allowed to go critical using the control devices.
2. The shut-off rods must be of a simple design. After NRX, designers mistrusted shut-off rods
as a safety shutdown mechanism; hence, NPD and Douglas Point used moderator dump as
their emergency shutdown system and had no safety rods. Pickering had a few safety rods
which acted in conjunction with the moderator dump. Only by the time of Bruce A were
shut-off rods restored as a primary shutdown mechanism. They were, of course, very different from those in NRX: they consisted of a rod on a cable, which was wound around a
pulley and held in place by an electromagnetic clutch. On a shutdown signal, current to the
clutch was cut off, and a spring assisted the rod to drop by gravity. It was, and is, a simple
and reliable design with large clearances.
3. The control and shutdown systems should be separated and independent, with the latter
devices being used only for shutdown and held outside the reactor during critical operation.
4. An accident, even with a shutdown failure, should not be a public-health disaster. This
meant that either the reactor containment had to withstand the energy released, or (much
later on) two shutdown systems would have to be provided so that failure to shut down after an accident would be a very low-probability event.
Reactor Safety Design and Safety Analysis
40
The Essential CANDU
3.1.3 Chernobyl
This summary uses material from [USSR, 1986], [USDOE, 1986], [Howieson, 1987], [Chan, 1987],
[Rogers, 1987], and [INSAG, 1992].
3.1.3.1 Description
Chernobyl unit 4 was of the RBMK type (Реактор Большой Мощности Канальный, or HighPower Channel-Type Reactor) and the most recent of the 1,000 MW(e) series. It was a graphitemoderated, boiling-light-water-cooled, vertical-pressure-tube design using enriched (2% U235)
UO2 fuel with on-power refueling. It used a direct cycle to produce electricity from twin turbines (Figure 15, from [INSAG, 1992]). The reactor cutaway is shown in Figure 16, from [Semonov, 1983].
There are two independent primary coolant circuits, each containing about 830 fuel channels,
two steam separators, and four pumps (with one normally on stand-by). Refueling is done
during operation from the top of the core. A containment structure encloses the inlet piping in
the lower portion of the reactor and provides pressure relief to a water pool located beneath
the reactor (Figure 18). Control and shutdown are performed by movable absorbing rods in
lattice positions. Emergency core cooling is provided for pipe breaks through a system consisting of a combination of pressurized-water accumulators and electric pumps.
The reactor has a void coefficient which varies from negative to positive according to the
operating state. It is limited in normal operation through control of operating conditions.
The containment is a pressure-suppression type (see Section 5) and is compartmentalized
(Figure 18). All inlet pipes are enclosed in leak-tight compartments which connect to a bubbler
pond or suppression pool below the reactor. Steam discharged from a pipe break is directed to
the bubbler pond, where it condenses. Each channel is accessible (for refueling) from the top
through a large cover plate, to which its extension is welded (Figure 16). The (small) outlet
pipes above the core are in an enclosure designed for a rupture of up to two channels or their
outlet pipes, because rupture of more than one was believed to be highly improbable. As noted
in [INSAG, 1992], “Simultaneous failure of a greater number of fuel channels would generate a
pressure high enough to fail the containment function by lifting the cover plate, in the process
severing the remainder of the fuel channels”.
3.1.3.2 The event
The accident resulted from a test to show that after a main pump trip, the small amounts of
steam generated from the low residual reactor power could provide enough electricity through
the turbine generators to extend the rundown time of the main coolant pumps. The test was to
be done while the reactor was critical. However, shortly after pump trip, the reactor power
started to increase rapidly, could not be terminated, and caused the violent destruction of the
reactor.
The test was supposed to have been done at a starting power of 700 MW(th). However, it was
initiated at a power level of 200 MW(th). The reasons are somewhat lengthy, but during the
transfer from the local power control system to the main range automatic power, an unplanned
Reactor Safety Design and Safety Analysis
Reactor Safety Design and Safety Analysis
41
drop to zero neutron power occurred and lasted for four to five minutes. The operator, instead
of aborting the test, then attempted to recover power, but because of xenon decay, had to raise
the control rods so that most of them were out of the core. In the end, the reactor never
reached the planned initial power level.
Key: 1: graphite reactor core; 2: fuel channel; 3: in-core instrumentation tube; 4: feedwater
pipe; 5: steam separator drum; 6: downcomer; 7: intake header; 8: main circulating pump; 9:
bypass; 10: high-pressure header; 11: stop valve; 12: distribution group header; 13: steam
header; 14: steam dump valve; 15: accident localization system; 16: ECCS water reserve tank;
17: pressure controller; 18: turbogenerator; 19: condenser; 20: moisture separator/reheater;
21: condensate pump; 22: preheater; 23: deaerator; 24: emergency electric feedwater pump;
25: electric feedwater pump; 26: mixing preheater; 27: condensate collecting tank; 28: moisture
separator/reheater condensate pump; 29: level controller; 30: ECCS hydraulic accumulator; 31:
ECCS pump; 32: ECCS header; 33: ECCS fast-acting valve; 34: leak limiter.
Figure 15 RBMK schematic diagram
Reactor Safety Design and Safety Analysis
42
The Essential CANDU
In the immediate aftermath of the accident, the Soviets [USSR, 1986] placed much blame on the
operators for not following test procedures and performing the test in an unauthorized reactor
configuration. The initial cause of the power rise was stated to be the increase in void reactivity
as coolant boiling increased following pump trip. It was implied that because most of the dual
control/safety rods were withdrawn, the reactor trip was ineffective in stopping the power rise.
Later analysis ([Chan, 1987] and [INSAG, 1992]) indicated that a major cause of the accident was
the unexpected behaviour of the shut-off rods, which actually caused an increase in reactor
power rather than shutting the reactor down. This surprising design aspect requires more
detailed explanation. The absorber rods have graphite displacers or followers attached to their
lower ends which are designed to increase the absorber reactivity worth. As they are inserted,
the absorber rods move into the high-flux region in the centre of the core, which was previously
occupied by the graphite, so that the absorber-rod effectiveness is enhanced (see Figure 17). If
no graphite were present, the rod would displace water—also an absorber—in which case the
change in reactivity with insertion would not be as great.
However, during the accident, most of the absorbers were well removed from the core, which
was an abnormal configuration. The flux was peaked at the top and bottom, where most of the
reactor power was being generated. Therefore, when absorber insertion first started, the water
in the high-flux region at the bottom of the core was first displaced by the graphite follower,
leading to a reactivity increase. Therefore, operating the plant in an abnormal condition resulted in an unusually large hold-up of void reactivity, which combined with a deficient shutdown-system design, led to the large power excursion and the resulting core damage. [INSAG,
1992] indicates that this deficiency was known by designers before the event.
The power rise failed a number of fuel channels; the resulting steam release blew off the top
cover and severed the remaining fuel channels, effectively exposing the core to the environment and by-passing the containment.
The core damage rendered it subcritical, although to make sure this was the case, the Soviets
used helicopters to dump boron into the open reactor structure. The graphite moderator, when
exposed to air and heated by the fuel fragments, began to burn and did so for several days until
it was smothered by a combination of sand dropped onto the core pit and liquid nitrogen
pumped in from underneath. The core melted and flowed into the rooms below the reactor
vault, although this was not realized until some years afterwards, when the reactor cavity was
inspected remotely and found to be empty. A temporary cover (the sarcophagus) was rapidly
built over the damaged structure to prevent radioactive material from escaping and is currently
being replaced by a more permanent cover.
Reactor Safety Design and Safety Analysis
Reactor Safety Design and Safety Analysis
43
Figure 16 RBMK reactor
Reactor Safety Design and Safety Analysis
44
The Essential CANDU
In terms of health effects ([UNSCEAR,
2000], [UNSCEAR, 2008]), 28 prompt
deaths occurred among the reactor
operators and the firefighters called
in to extinguish fires on the turbinehall roof, arising from the ejected
fuel. Some increase in leukemia has
been observed among the members
of the clean-up crew. Among the
public, approximately 6,000 excess
thyroid cancers have been observed
in children, almost all of which are
curable. No other cancers have been
observed at statistically significant
levels in the population.
3.1.3.3 Lessons learned
1. The effectiveness of shutdown
systems should never be impaired
by the operating state of the reactor.
The shutdown systems
should be fast enough and independent enough to overcome any power
Figure 17 Reverse shutdown in RBMK
transient, even from an abnormal operating state.
2. The concept of “safety culture” was used to address inadequacies in the processes of
design, operations, and regulation in the USSR, which contributed to the accident. We shall
cover this in Section 8. Briefly [INSAG, 1991], “Safety culture is that assembly of characteristics and attitudes in organizations and individuals which establishes that, as an overriding
priority, nuclear plant safety issues receive the attention warranted by their significance.”
3. Some discussion took place about the role of the containment (Figure 18). It is possible that
a complete containment envelope as used in Western PWRs and CANDUs, even if not designed for a reactor runaway, would have mitigated the release of radioactive material, but
this has not been demonstrated. At the very least, one can conclude that the upper confinement design basis (rupture of two channels) was not robust in terms of defence-indepth.
Reactor Safety Design and Safety Analysis
Reactor Safety Design and Safety Analysis
45
Figure 18 RBMK building cross section
3.2 Loss of Cooling / Heat Removal
Shutting down a power reactor does not eliminate the hazard; the decay heat in the fuel, if not
removed, will eventually cause the fuel to melt. We now look at two such events: Three Mile
Island and Fukushima Dai-ichi.
3.2.1 Three Mile Island
This summary uses material from [Kemeny, 1979], [Yaremy, 1979], [Rogovin, 1980], and [Brooks,
1980].
3.2.1.1 Description
The Three Mile Island reactor was a conventional pressurized-water reactor; a flow-sheet is
shown in Figure 19. The reactor core is inside a large pressure vessel; unlike most CANDUs and
BWRs, the coolant is highly sub-cooled and kept so by a pressurizer connected to the pressure
vessel. A pressure relief valve on top of the pressurizer provides overpressure protection for the
reactor coolant system (RCS).
Reactor Safety Design and Safety Analysis
46
The Essential CANDU
Figure 19 TMI schematic
3.2.2 The event
On March 28, 1979, a maintenance error resulted in loss of feed water to the steam generators
when the reactor was on power. Because there was no heat sink for the primary coolant, the
coolant pressure began to rise, and the pressurizer relief valve opened to limit the pressure, as
it was supposed to do, following which the reactor tripped (shut down automatically). As the
pressure fell, the emergency core cooling system activated to make up for lost water, again as
designed. The pressurizer relief valve should have re-closed, but did not. This led to a small and
continuing loss of coolant through the open valve, which went unrecognized for hours. The
result was that the loss of inventory uncovered the core, leading to a partial core melt, hydrogen production from oxidation of the fuel sheaths at very high temperatures, a hydrogen burn
inside containment, and a partial melt-through of the pressure-vessel wall at the bottom.
However, the wall remained intact. Finally, the failed valve was recognized and then isolated by
closing a blocking valve, the main pumps were turned back on to re-pressurize the system, and
high-pressure make-up water was added to refill it. Figure 20 shows the end state of the core
[Smithsonian, 2004].
Reactor Safety Design and Safety Analysis
Reactor Safety Design and Safety Analysis
47
A stuck-open pressure-relief valve (PRV) is
uncommon, but not rare. What converted
this operating transient into a partial core
melt was that the operators did not realize
that the valve had stuck open, partly because
the valve indicator in the control room was
derived from the valve actuating signal, not
the actual valve-stem position, and partly
because the pressurizer level was rising due
to the loss of coolant from the top—the
opposite of what one would expect for loss of
coolant elsewhere in the RCS. The operators
had been trained when operating a “solid”
system (no boiling) to use pressurizer level as
a measure of circuit inventory, and they came
to the erroneous conclusion that there was
too much water in the system. If water is
added to a sub-cooled system, the pressure
can rise very fast indeed when the steam
Figure 20 TMI core end state
space in the pressurizer is filled up, and the
operators were trying to avoid this. Their actions over the next several hours were complex and
confused, clearly indicating that they did not understand what was happening and did not have
the training or the tools to do so.
The containment did its job. Small amounts of noble gases and iodine were released through a
leakage recovery system (which could not be isolated because that would also stop primary
pump seal cooling) and by venting the make-up tank to control its pressure. It is a credit to the
containment design concept that a partial core melt resulted only in very small releases.
In addition, this was a “wet” accident, i.e., the radioactive material had the opportunity to
interact with quantities of water in the reactor vessel and containment. This is in contrast to
Chernobyl, where the moderator caught fire. Fission products such as iodine and cesium
combine when released from overheated fuel to form cesium iodide (an aerosol). However,
when CsI meets water, it dissociates:
CsI Cs I ,
and is thereafter very difficult to remove (compare this to trying to remove chlorine after
dissolving table salt (NaCl) in water). TMI taught that in terms of public safety, “wetter is
better”.
The lifetime health effects on the surrounding population were predicted to be effectively zero.
3.2.2.1 Lessons learned
1. A number of obvious improvements were needed to valve position indicators, event logging, and alarm prioritization (the printers were swamped by the number of alarms,
Reactor Safety Design and Safety Analysis
48
The Essential CANDU
running far behind the event), as well as provision of diagnostic aids to the operators.
2. The prescriptive approach to reactor safety in the United States, which was based on
regulatory-driven lists of design basis accidents, had focused attention on too narrow a
range of accidents, not just because it omitted severe accidents, but also because it focused on bounding design basis accidents and treated superficially the supposedly lesssevere DBAs such as a small LOCA.
3. PSA became far more important and more widely used to define and therefore prevent
possible severe accidents.
4. Sharing of prior experience with other plants was poor. TMI led to the establishment of
the Institute of Nuclear Power Operations (INPO) for industry-wide cooperation in operations and training.
3.2.3 Fukushima Dai-ichi
Much of this material is taken from official reports or presentations by the Japanese Government [Japan, 2011], the Tokyo Electric Power Company (TEPCO) [TEPCO, 2011a], the Japan
Nuclear and Industrial Safety Agency (NISA) [NISA, 2011], the International Atomic Energy
Agency (IAEA) [IAEA, 2011], and the United States Nuclear Regulatory Commission (USNRC)
[USNRC, 2011]. Vast amounts of detailed material exist on this event—it is probably the most
photographed accident in history—and many details are still unclear or unknown, e.g., the exact
state of the cores in Units 1, 2, and 3 and the containment status.
3.2.3.1 Description
There are six nuclear power reactors at the Fukushima I (Dai-Ichi) site. All are boiling-water
reactors (BWRs). There are four more BWR reactors nearby at Fukushima II (Dai-Ini). Figure 21
(from [USNRC, 2011]) shows the overall station layout of Fukushima Dai-Ichi.
Mark 1 type BWRs have an “inverted light-bulb” containment (the drywell) connected to a
toroidal suppression pool or chamber (the wetwell), as can be seen in Figure 22. The purpose
of the suppression pool is to condense any steam released inside the containment in an accident, such as a loss-of-coolant accident, and also to act as a temporary or permanent heat sink
for decay power in case the main heat-removal mechanisms are unavailable. If the suppression
chamber (S/C) is to act as a long-term heat sink, it must be cooled by an external circuit, e.g., for
Unit 1 (which we shall use as the example), the isolation condenser.
Reactor Safety Design and Safety Analysis
Reactor Safety Design and Safety Analysis
49
Figure 21 Fukushima Dai-ichi before earthquake
The containment vessel is surrounded by a reactor building, which, among other things, contains and supports the elevated spent-fuel pool. The reactor building is not designed to withstand significant pressure.
The IAEA [IAEA, 2011] notes that:
“In Unit 1, the Isolation Condenser (IC) is designed to operate through gravity driven
natural circulation of coolant from the reactor pressure vessel (RPV) through a heat exchanger immersed in a large tank of water in the reactor building at an elevation above
the core. The Unit 1 IC was designed to have a decay heat-removal capacity of about
eight hours. A valve must be manipulated to bring the IC into service.”
Reactor Safety Design and Safety Analysis
50
The Essential CANDU
Figure 22 BWR Mark 1 containment
3.2.3.2 The event
At 14:46 on Friday, March 11, 2011, a magnitude 9 earthquake took place off the eastern coast
of Japan. The earthquake occurred at a depth of 24 km and initiated a tsunami which was
estimated to be 14 m high when it hit Fukushima approximately 40 minutes later, followed by
multiple additional waves. The measured on-site accelerations due to the earthquake were
greater than the design basis for Fukushima I, but less than the design basis for Fukushima II.
Although the earthquake caused significant on-site damage and loss of all off-site electrical
power, in both stations, all operating units were automatically shut down, and the emergency
diesel generators started and functioned until the tsunami hit.
The design basis tsunami for Fukushima I was O.P. (base level) +5.7m; the actual height was O.P.
+14–15 metres. Figure 23 shows a cross section of the station and the flood level.
Reactor Safety Design and Safety Analysis
Reactor Safety Design and Safety Analysis
51
Figure 23 Design basis versus actual flood level
The emergency diesel generators at Fukushima I (which are cooled by sea-water) were all
disabled by the flood; because off-site AC power was already lost, the result was a total loss of
all AC power at Fukushima I, units 1 through 5; hence, all motor-operated pumps became
inoperable. In addition, lighting in the main control room was lost. The sea-water system (used
to reject heat to the ultimate heat sink) was likewise inoperable. Unit 6 had one functioning aircooled diesel generator, which was cross-tied after the flood, with some effort, to Unit 5 and
was instrumental in achieving cold shutdown in those units with no fuel damage. In addition,
because the emergency batteries could no longer be charged, control and instrumentation
power in Units 1–4 was eventually also lost, crippling the ability to monitor the reactor state or
to operate motorized valves.
Taking Unit 1 as an example (the sequence of events in other units was similar, but the timing
was somewhat prolonged), the isolation condenser was initially used to remove decay heat.
However, the isolation condenser stopped operating fairly soon thereafter. With no core heat
sink, the water in the vessel began to boil away, with the steam condensing in (and heating up)
the suppression pool and the level in the reactor vessel falling, eventually exposing fuel. As the
fuel overheated in a steam environment, the zirconium cladding oxidized and produced hydrogen.
The challenges were then:
to restore water over the fuel
to prevent containment failure due to over-pressure
to control and release the hydrogen.
About 15 hours after the earthquake (March 12 at 05:46), the operators managed to inject fresh
water using fire pumps, followed about 13 hours later (March 12 ~19:00–20:00) by direct seawater injection. To control containment pressure, the primary containment vessel (PCV) was
apparently vented on March 12 at 10:17. This appears to have allowed the hydrogen in containment to migrate to and accumulate in the reactor building; it exploded at 15:36 on March
12, destroying much of the superstructure of the building.
It appears from analyses done with severe accident codes that the fuel in Units 1, 2, and 3
melted a few hours after being uncovered and may have penetrated the reactor vessel and the
primary containment. (This could also be deduced from fairly simple bounding calculations.)
Reactor Safety Design and Safety Analysis
52
The Essential CANDU
The current state and location of the core and the integrity of the reactor vessel and the primary containment are not known with certainty, although damage to both is expected.
A further issue was the condition of the fuel in the spent-fuel pools. Normally, the decay heat
generated by the fuel bundles in the pools is removed by active systems, which of course were
lost when all AC power was lost. In the absence of heat removal, or if water is lost due to
leakage, heating of the spent fuel is slower than heating of the core, but if not addressed, will
eventually lead to uncovering of the fuel and fuel damage. In Fukushima, the spent-fuel bays
are located high in the reactor building to facilitate transfer of fuel assemblies from the core.
Spent-fuel cooling was made more difficult by the elevation (and inaccessibility) of the spentfuel bays, and concerns were voiced about their structural integrity following the earthquake.
In the early phases after the accident, water was added manually to the bays (initially from
helicopters and later from cranes); stable cooling has since been restored to all pools. Inspection of the bays shows debris from the damaged reactor buildings; TEPCO has stated, “Most
spent fuels estimated to be undamaged” based on the radioactive contents of the pool water
and remote inspection. As of December 2013, fuel in the Unit 4 pool is now being removed.
Fukushima II was not flooded nearly as severely as Fukushima I and successfully achieved cold
shutdown of all units.
The safety goal is to achieve cold stable shutdown, with temperatures below 100°C and any
releases of radioactive materials from containment under control.
The injection of sea-water, while presumably stopping further core melting, led to a large
accumulation of highly radioactive water in the basement of the buildings because cooling was
essentially “once-through”. Some of this water intermittently leaked to the sea and to ground.
Once-through cooling was later converted to closed-loop cooling and continuously decontaminated using on-line filtration. In addition, to prevent further release of airborne radioactive
material from debris or leakage to ground or sea from rain, the reactor buildings are being
covered by weatherproof covers.
Finally the large amounts of highly contaminated water on site have to be treated and securely
stored.
3.2.3.3 Lessons learned
Although it is still early after the accident to formulate complete lessons learned, it seems
reasonable that they will include the following issues:
1. Ensure completeness of design basis accidents, especially external events, and in particular those with a cliff-edge effect like flooding (dramatic worsening of consequences
for a small change in the severity of the event).
2. Ensure that resources are available in the long term after a severe event to control, cool,
and maintain: for example, portable generators with pre-designed hookups to key
equipment, flexible hoses that can be run to sources of water.
3. Ensure prolonged core cooling in the absence of off-site power and failure of on-site diesel generators.
4. Ensure prolonged spent-fuel bay cooling or make-up and monitoring after a prolonged
Reactor Safety Design and Safety Analysis
Reactor Safety Design and Safety Analysis
53
loss of power.
5. Prevent loss of monitoring (e.g., design the station emergency batteries to last for a significant length of time, protect them against external events, and provide recharging capability). Maintain on-site and off-site communications.
5. Provide facilities on site to deal with physical destruction and high radiation fields (e.g.,
bulldozers to clear debris).
6. Review lessons learned about institutional behaviour, e.g., the role of the regulator. See
Chapter 16 for a case study.
7. Examine the impact on accident evolution of having multiple units at one site.
3.3 Problems
1. Browns Ferry Fire, 1975:
a. Locate (as a minimum) the following source material (try the USNRC web site):
Fire at Browns Ferry Nuclear Plant; Tennessee Valley Authority; March 22, 1975 Final Report of Preliminary Investigating Committee, May 7, 1975.
b. Assess the Browns Ferry fire in terms of threats to the ability to control, cool,
contain, and monitor.
c. Indicate lessons learned. Describe how you derived these lessons learned. Do
not just copy official lessons learned.
d. Comment on the robustness of the design and indicate whether design or operating changes should have been considered (and why).
2. Tokai-Mura, 1999:
a. Locate (as a minimum) the following material: International Atomic Energy
Agency, Report on the Preliminary Fact Finding Mission Following the Accident at
the Nuclear Fuel Processing Facility in Tokaimura, Japan; IAEA report, 1999.
b. Assess the accident in terms of threats to the ability to control, cool, contain, and
monitor.
c. Indicate lessons learned. Describe how you derived these lessons learned. Do
not just copy official lessons learned.
d. Comment on the robustness of the facility design and operation, and indicate
whether design or operating changes should have been considered (and why).
Reactor Safety Design and Safety Analysis
54
The Essential CANDU
4 Safety Goals and Risk Assessment
In this section, we expand on the concept of risk introduced in Section 1.8. We start off by
defining numerical safety goals, which are a means of quantifying risk, and then present some
probabilistic safety assessment tools that can be used to calculate whether or not the plant
meets the safety goals.
4.1 Safety Goals
A safety goal partially answers the question “how safe is safe enough?” In this sub-section, we
will develop a worked example of how a safety goal might be derived and then compare it to
safety goals adopted by other organizations. We shall also point out some of the pitfalls of
using a safety goal as the only safety criterion. The intent of this section is that the reader
should be able to understand how safety goals are derived, what their limitations are, and how
they are used in design.
To enable meaningful decisions, a safety goal should be expressed in quantitative terms. A
safety goal such as “Make the reactor as safe as possible” will mean different things to different
people and provides no guidance to the designer or operator. A goal such as “The reactor must
never have a severe accident” is probably physically impossible and sets up expectations that
cannot be met.
It is not easy to define a safety goal. Here is a possible starting point for a safety goal which has
numerical requirements (and which is often used as the basis for regulatory decision-making):
“The annual risk of death to the most exposed member of the public due to accidents in a
reactor should be small in comparison to his/her total risk of premature death.”
Some of the aspects of this safety goal are:
It uses a common risk measure (annual risk of death). Although this is objective, it may
not be all that relevant to nuclear accidents: experience has shown that significant public dose from a severe accident develops slowly, giving time to move people out of
harm’s way. The results of real events have shown few public health effects.
It compares the risk from a nuclear reactor to all other risks of premature death. This is
not at all obvious. One could set up the comparison to all other risks of electricity generation, or all energy generation, or all (average) industrial activity. In fact, the first two
would be much more logical because they compare risks of producing the same product
(energy).
No relative benefits are mentioned.
The safety goal (in this example) is for the most exposed individual. It does not consider
social effects such as radiation exposure to a large number of individuals, evacuation,
land contamination, and effects on the environment such as on animals and plants. The
assumption in this safety goal is that protection of the most exposed individual member
of the public also provides sufficient protection for society at large and for the environment.
The goal refers to members of the public, not workers in the plant. It is generally acReactor Safety Design and Safety Analysis
Reactor Safety Design and Safety Analysis
55
cepted that people will implicitly accept a somewhat higher risk to life and limb if it
comes as part of their job, i.e., if a direct benefit is obtained. Attempts have been made
(e.g., in the United Kingdom, see [HSE, 2006]) to set (nuclear) safety goals for plant
workers in nuclear power plants, but the risk to such workers is dominated by conventional industrial risk, which itself turns out to be less than in comparable non-nuclear industries.
The goal refers to the risk of nuclear power in isolation. Just as there is a risk to having
nuclear power, there is also a risk to not having it, because the electricity would then
have to be generated from other sources with greater (or lesser) risk.
The goal does not distinguish between prompt and delayed risk of death. We can break down
the safety goal proposed above into two sub-goals:
“The annual risk of prompt death to the most exposed member of the public due to accidents in a reactor should be small in comparison to his/her total annual risk of prompt
death due to all accidents”,
and
“The annual risk of fatal cancer to the most exposed member of the public due to accidents in a reactor should be small in comparison to his/her total annual risk of fatal cancer due to all causes.”
4.1.1 Risk of prompt death
In Canada in 2009, accidents were the fifth leading cause of death over the whole population, at
a rate of 30.4 deaths for every 100,000 people [StatsCan, 2009]. This means that the average
person’s risk of death from an accident is ~3 × 10⁻⁴ per year (note that the rate for males is 50%
higher than that for females). We could then say that the risk from a nuclear power plant of
premature death to an individual should be small compared to 3 × 10⁻⁴ per year, say by a factor
of 100 (this may be too conservative, but we will use it for illustration), or 3 × 10⁻⁶ per year.
Because the only way of causing prompt fatalities to the public in a nuclear accident is through a
core melt and failure of containment, and even that will likely not cause prompt public fatalities
(given the experience of Chernobyl and Fukushima), this suggests that our safety goal should
be:
“The likelihood of a large release from a nuclear power plant in an accident should be
less than 3 per 106 reactor years”.
(Note that to risk prompt deaths, a large release by itself is not sufficient; it must also be sudden, otherwise people can be evacuated beforehand.) These changes have yielded a goal that
can be used in design: it is relatively straightforward using PSA to calculate the likelihood of a
large rapid release (core melt plus early failure of containment), to see (if the goal is exceeded)
where the dominant contributors are, and to fix them if needed to meet the safety goal.
4.1.2 Risk of delayed death
Cancer fatalities can be considered in a similar fashion. In the same year in Canada (2009),
malignant neoplasms were the leading cause of death over the whole population, at a rate of
Reactor Safety Design and Safety Analysis
56
The Essential CANDU
211 deaths per 100,000 people. Therefore, the average person’s risk of dying from cancer is 2.1
× 10-3 per year (or about 16% over a 75-year lifetime). Recall from Chapter 1 that 100 person-Sv
will produce about five fatal cancers in the exposed population, or a risk of 5 × 10⁻² fatal cancers
per Sv. Therefore, using the linear dose-effect hypothesis, 211 cancer deaths per 100,000
people would be induced by a collective dose D calculated as follows:
D(Sv) × 5 × 10⁻² (cancers / Sv) = 211 cancer fatalities,
(4)
which means that D = 4220 Sv, or an average individual dose of 42 mSv. However, the linear
dose-effect hypothesis is not applicable to such low doses. Regardless, if we divide by 100 again,
then the maximum time-averaged individual dose from accidents should be less than 0.4 mSv
per year, averaged over a group of people, or about 25% of natural background radiation in
Toronto (1.6 mSv / year). The paradox with this safety goal is that it would make nuclear power
safer than natural background radiation.
This is not as useful a safety goal as the previous one because it does not tell us anything about
the frequency distribution of accidents. However, it can likewise be validated by summing all
the events in a PSA which cause a release of radioactive material.
At a more basic level, summing low doses over large numbers of people is incorrect, and a
safety goal derived this way is fundamentally flawed.
4.1.3 Safety goals in Canada
The CNSC has recently published safety goals, for new reactors built in Canada. The rationale is
similar to our sample case. Specifically, CNSC states [CNSC, 2008]:
“A limit is placed on the societal risks posed by nuclear power plant operation. For this
purpose, the following two qualitative safety goals have been established:
1. Individual members of the public are provided a level of protection from the consequences of nuclear power plant operation such that there is no significant additional risk
to the life and health of individuals; and
2. Societal risks to life and health from nuclear power plant operation are comparable to
or less than the risks of generating electricity by viable competing technologies, and
should not significantly add to other societal risks.”
These are developed into design goals:
1. “Core Damage Frequency: The sum of frequencies of all event sequences that can lead
to significant core degradation is less than 10-5 per reactor year
2. Low Release Frequency: The sum of frequencies of all event sequences that can lead to a
release to the environment of more than 1015 Becquerel of iodine-131 is less than 10-5
per reactor year. A greater release may require temporary evacuation of the local population.
3. High Release Frequency: The sum of frequencies of all event sequences that can lead to
a release to the environment of more than 1014 Becquerel of cesium-137 is less than 10-6
per reactor year. A greater release may require long term relocation of the local population.”
Reactor Safety Design and Safety Analysis
Reactor Safety Design and Safety Analysis
57
This is largely consistent with international practice for new reactors, with one new concept: the
low release frequency. It is intended to address those accident scenarios which may result in
small but significant releases. These accidents may require emergency measures such as
sheltering or short-term evacuation of an area around the plant, and the low release frequency
sets a limit on these [Rzentkowski, 2013].
An approach to safety based only on a safety goal has both benefits and limitations. The
greatest benefit is that risk-based decisions require greater levels of protection on those areas
of greatest risk, and conversely, i.e., they optimize safety resources. Some limitations are:
To determine compliance with a risk target, all significant events have to be identified
and summed. This might be challenging in the early phases of a design.
Safety goals are meaningful only for events for which frequencies and consequences are
reasonably calculable. In practice, this includes most “internal” events for which actual
data exist, for which the failure combinations can be calculated, or for which a reasonable extrapolation from the historical record can be made. However, if the design has
innovative features, with little operating experience, it may be difficult to support the
reliability values and hard to spot the cross-links4. Passive safety systems pose a particular challenge in this regard because they can be difficult to test, and therefore it is
hard to build up a reliability database.
Not all (rare) events can be assigned a frequency and consequence with confidence, for
example:
o massive structural failure
o massive failure of pressure vessels
o very low-frequency, high-consequence external events such as earthquakes beyond historical record-keeping
o sabotage, terrorism, and war.
The approach to the first two is usually to design to accepted engineering codes and standards.
Then one can infer from experience the likelihood of sudden failure of structures and components so designed. Massive failure of a LWR pressure vessel would be a catastrophic event
because it would lead to an immediate release of fission products and probably would damage
containment at the same time. Calculations have been done to show that such massive failures
are less frequent than 10-8 per year, but such low frequencies must be treated with some
skepticism. Rare events can happen by unanticipated sneak paths; for example, a precursor to a
pressure-vessel boundary failure was the undetected almost-through-wall erosion of the
reactor pressure vessel in the Davis-Besse plant [USNRC, 2002]. Similarly, historical records
make it possible to define the intensity of earthquakes down to about the ten-thousand-year
return frequency, which is taken as the design basis earthquake (DBE) in Canada. More severe
but rarer earthquakes are hard to characterize. One can carry out a “seismic margin” analysis to
calculate the likelihood of surviving an earthquake somewhat more severe than the DBE; much
beyond that, about all one can say is that the effects of damage to the nuclear plant would be
4
A cross-link is a failure that affects more than one system or component, e.g. a common supply of instrument air.
Reactor Safety Design and Safety Analysis
58
The Essential CANDU
small compared to the havoc wreaked by such an earthquake on the rest of society, as was the
case for Fukushima. Finally for events resulting from hostile human actions, the approach has
generally been to design according to rules (e.g., the plant’s inherent defences plus the local
security force should be able to delay an attack of x people armed with y type of weapons for z
minutes); x, y, and z are indeed chosen based on reasonableness (likelihood), but the historical
database of hostile acts against nuclear power plants is sparse. In any case, the defences being
built into new plants for severe accidents are also helpful against malevolent acts.
For these reasons, those regulators that have safety goals use them in addition to whatever
deterministic criteria they have developed. This combination is called a risk-informed approach,
in which the quantified risk provides a powerful rationality check.
4.2 Risk Assessment
This section summarizes the probabilistic safety assessment concepts and tools used to demonstrate numerically that the plant meets its safety goals, as well as for many other purposes. For
basic references, see [McCormick, 1981] and [USNRC, 1981].
4.2.1 The basics
First, you may want to refresh your memory by reading Appendix 1 – Basic Rules of Boolean
Algebra and the rules about the probability of multiple events. The following text assumes you
already know, or have read, all this material.
Sample Problems:
a) A nuclear reactor has two fully independent shutdown systems. The probability that a
shutdown system will fail on demand is 1 in 1000. What is the probability that they will both
fail in an accident?
Answer:
Let A1 be the event where shutdown system 1 fails and A2 be the event where shutdown system
2 fails. These are stated to be independent events, so:
P(A1 A2) = P(A1) P(A2) = 10-3 × 10-3 = 10-6.
(Sometimes it is hard to ensure that redundant systems are completely independent).
b) As above, but what is the probability that either will fail in an accident?
Answer:
We can use the rare events approximation because P(A1) and P(A2) are <<1.
Here, we want P(A1 + A2):
P(A1 + A2) P(A1) + P(A2) = 10-3 + 10-3 = 2 × 10⁻³.
c)
Now consider two independent diesel generators, each with a probability of failure to start
of 15%. What is the probability that either will fail to start?
Answer:
Reactor Safety Design and Safety Analysis
Reactor Safety Design and Safety Analysis
59
We cannot really use the rare events approximation here, so:
P(A1 + A2) = P(A1) + P(A2) - P (A1A2) = 0.15 + 0.15 – (0.15)*(0.15) = 0.28.
4.2.2 Bayes equation
The Bayes equation is typically used in nuclear power applications to predict the likelihood of a
rare event given the history of few (or no) such events. We will prove it first and then give some
examples which make it clearer.
Given an event or hypothesis, B, and An mutually exclusive events or hypotheses (n=1, 2....N):
P( An B) P( An ) P( B | An ) P( B) P( An B)
,
(5)
P( B | An )
P( An | B) P( An )
.
P( B)
(6)
Because the events An are mutually exclusive,
N
P( A
n
n 1
| B) 1 .
(7)
Multiplying by P(B):
N
N
n 1
n 1
P( B ) P( B ) P( An | B ) P( An ) P( B | An )
.
(8)
Substituting (8) into (6)
P( An | B)
P( An ) P( B | An )
N
P( A ) P( B | A )
m 1
m
.
(9)
m
This is Bayes’ theorem. Therefore, if we know P(B|An), we can calculate P(An|B). A couple of
examples will make this clearer.
Sample Problems
Pipe Inspection
Suppose that you are radiographing a Class I pipe for a defect. You know from past experience
that the likelihood of a defect is one per 100,000 radiographs. You also know that the likelihood
that the instrument indicates a defect when there is no defect (false positive) is 1%, and the
likelihood that the instrument indicates a defect when a defect in fact exists is 99%. Your test
indicates a defect. What is the probability that the pipe actually has a defect when the instrument says it does?
Answer:
Apply Bayes’ theorem to two events:
Reactor Safety Design and Safety Analysis
60
The Essential CANDU
A: pipe has a defect, therefore P(A) = 0.00001
B: instrument says that pipe has a defect, therefore P(B)=0.011
B|A: instrument says pipe has a defect when it has a defect, therefore P(B|A) = 0.99
What we want is P(A|B), the probability that the pipe actually has a defect when the instrument
says it has one.
Using Bayes’ theorem:
P(A|B) = P(B|A)[P(A)/P(B)]
= 0.99 × 0.00001 / 0.01
= 0.00099
because the denominator in Equation (9) is just P(B), which in this case is known. The result
seems counterintuitive and suggests that the test is not very good in detecting defects, despite
the instrument’s high accuracy rate. However, the fact that the defect is so rare (we need about
a hundred thousand samples before we have a good chance of seeing a real positive) magnifies
the small false positive rate, so that most positive tests are false positives.
This is quite important in medical tests; even a very accurate test for a rare cancer will often
give far more false positives than real ones.
4.2.2.1 Failure rate estimation when no failures have occurred
We can use Bayes’ equation to glean information from non-events as well [Kaplan, 1979].
Large LOCA
There have been 14,800 reactor years of experience without a large break LOCA. What is an
upper estimate of the frequency?
Answer
Let B = 14,800 reactor years of experience without a large break LOCA (LBLOCA).
What we do now is take (say) six cases, in each of which we hypothesize the value of the LLOCA
frequency. We then use Bayes’ theorem to test how good our hypotheses are (i.e., calculate the
probability that each hypotheses is correct). We label our hypotheses A1 to A6.
1
This is a slight simplification using the fact that P(A) is small. Actually
P(B) = P(B|A) P(A) + P(B|Ᾱ) P(Ᾱ)
= 0.99 × .00001 + 0.01 × 0.99999
= 0.0100098
or approximately 0.01 as stated.
In words, the first term is the 99% chance of detecting the defect in the one pipe in 100,000 that has the defect;
the second term is the 1% chance of indicating a false positive in the remaining 99,999 pipes out of 100,000.
Reactor Safety Design and Safety Analysis
Reactor Safety Design and Safety Analysis
61
A1 = LBLOCA probability = 10-2 / year
A2 = LBLOCA probability = 10-3 / year
A3 = LBLOCA probability = 10-4 / year
A4 = LBLOCA probability = 10-5 / year
A5 = LBLOCA probability = 10-6 / year
A6 = LBLOCA probability = 10-7 / year
If A1 were true, then:
P(B|A1) = (1 – 10-2)14800 = 2.5 × 10-65.
Because we can assume that each reactor-year of experience is independent, the probability of
each reactor-year without a LBLOCA is 1 – 10-2, and P(B|A1) is just the intersection of 14,800
events.
Likewise, we find that:
P(B|A2) = (1-10-3)14800 = 3.7 × 10⁻⁷
P(B|A3) = (1-10-4)14800 = 0.2276
P(B|A4) = (1-10-5)14800 = 0.8624
P(B|A5) = (1-10-6)14800 = 0.9853
P(B|A6) = (1-10-7)14800 = 0.9985
If we knew P(A1),...,P(A6), we could calculate P(An|B), or the probability that our statement An is
actually true. But we don’t know. Instead, we can make an assumption, called an a priori
probability: let’s just assume that P(An) = 1/N = 1/6, which is the case labelled “uniform prior” in
Table 5, i.e., that each hypothesis is equally likely. Then, using Bayes’ theorem, we find that
P(A1|B) = 8.14 × 10-66 , i.e., A1 is not very likely. From Table 5, we see that A2 is more likely than
A1, but that A4 to A6 are even more likely. If we use these results to postulate a more likely
series of P(An), labelled “non-uniform prior” in the table, we can see that P(An|B) is further
adjusted, and we can conclude that the LLOCA frequency is significantly less than 10 -3. The
practical application of this is in assigning a reasonable upper limit to a frequency in a probabilistic safety analysis, when no such events have actually occurred and all we have is the number
of reactor-years of experience.
Note that one of the criticisms of Bayes’ Theorem when used this way is that the answer
depends on the appropriateness of the initial hypotheses. If few data are available and you put
in strange hypotheses, you get back strange answers. Note also that if no events have occurred,
Bayes’ Theorem does not give information about the lower limit of the frequency.
Reactor Safety Design and Safety Analysis
62
The Essential CANDU
Table 5 Bayes’ theorem example
n
1
2
3
4
5
6
An
10-2 / year 10-3 / year 10-4 / year 10-5 / year 10-6 / year 10-7 / year
P(B|An)
2.5 x 10-65
3.7 x 10⁻⁷
0.2276
0.8624
0.9853
0.9985
P(An)
0.1667
0.1667
0.1667
0.1667
0.1667
0.1667
P(An|B)
8.14 x 10-66 1.20 x 10⁻⁷ 0.0741
0.281
0.321
0.325
P(An)
0.001
0.4
0.4
0.089
P(An|B)
2.27 x 10-66 3.36 x 10⁻⁹ 0.0251
0.358
0.394
0.0808
Uniform Prior
Non-Uniform Prior
0.01
0.1
4.2.3 Probability distributions
We will now develop the theory behind failure probabilities, failure rates, and reliability.
Let p(x)dx be the probability that an event occurs in an interval x to x+dx—the probability
density function. Let P(X) be the cumulative probability that the event occurs somewhere
between xmin and X. Then
X
P( X )
p( x)dx P( x X ) ,
(10)
xmin
where p(x) is the probability density function. If p(x) is a constant, po, then P(X) = po(X-xmin), as
expected.
There are two types of systems:
1)
2)
Those that operate on demand (i.e., safety systems)
Those that operate continuously (i.e., process systems).
4.2.3.1 Demand Systems
We define:
Dn
= nth demand
P(Dn) = probability of success on demand n
_
P( Dn ) = probability of failure on demand n
Wn
= case where system works for each demand up to and including demand n
What is the probability that it works for n-1 demands and fails on demand n?
Reactor Safety Design and Safety Analysis
Reactor Safety Design and Safety Analysis
63
P(Wn 1 ) P( D1D2 ...Dn 1 )
,
(11)
P( DnWn1 ) P( Dn | Wn1 ) P(Wn1 ) .
(12)
Therefore,
P( D1 D2 ...Dn 1 Dn )
P( Dn | Wn 1 ) P(Wn 1 )
P( Dn | D1 D2 ...Dn 1 ) P( Dn 1 | D1 D2 ...Dn 2 ) ... P( D2 | D1 ) P( D1 ) .
(13)
If all demands are alike and independent, this reduces to:
P( D1D2 ...Dn1Dn ) P( D)[1 P( D)]n1 .
(14)
4.2.3.2 Failure dynamics
Failures can be time-dependent.
Let:
f(t)dt = probability of failure at time t in the time interval dt
F (t )
cumulative failure probability
t
.
f ( )d
(15)
0
Assuming that the device eventually fails, the reliability, R(t) is defined as
R(t )
1 F (t )
t
0
0
f ( )d f ( )d .
(16)
f ( )d
t
Therefore,
f (t )
dR(t ) dF (t )
.
dt
dt
(17)
Let λ(t) dt = probability of failure at time t given successful operation up to time t (i.e., the
conditional failure rate); then:
f (t )dt (t )dtR(t )
or
f (t ) (t ) R(t )
,
(18)
dR(t )
dt
and hence
dR (t )
(t ) R (t ) .
dt
(19)
Reactor Safety Design and Safety Analysis
64
The Essential CANDU
Solving and using the boundary condition R(0)=1:
t
R (t ) e
( ) d
0
.
(20)
If λ is constant, (i.e., random failures):
R (t ) e t .
(21)
A typical λ(t) is shown in [McCormick, 1981], page 26—the “bathtub” curve (Figure 24).
Figure 24 Typical λ(t) versus time
Reactor Safety Design and Safety Analysis
Reactor Safety Design and Safety Analysis
65
Table 6 summarizes the relationships among these quantities.
Table 6 Reliability terms and relationships
Description
Hazard rate
Symbol
λ(t)
=
Reliability
R(t)
Cumulative failure probability F(t)
=
1 dR
R dt
f ( )d
t
t
f (t )
1 F (t )
1-F(t)
4.2.3.2.1
f(t)
t
f ( )d
1-R(t)
dF (t )
dt
( ) d
e
0
t
1 e
0
Failure probability density
=
f (t )
R(t )
dR (t )
dt
( ) d
0
λ(t) R(t)
Mean time to failure (MTTF)
This is simply the time-weighted average over all time of the failure probability density:
f ( )d
MTTF=
0
f ( )d
f ( )d
0
(22)
0
since
f ( )d 1
(a component will eventually fail).
0
If λ is constant, then
MTTF e d
0
4.2.3.2.2
1
.
(23)
Availability, A(t)
Availability is the proportion of the time that a system is in a functioning condition. If no repairs
have been made, it is the same as reliability. If a system has been repaired, then its availability
will satisfy:
R(t) ≤ A(t) ≤1.
Assume random failures. This implies that λ = constant, and therefore
R(t) = e-λt = reliability,
as illustrated in Figure 25. Eventually, the reliability goes to zero for long times.
Conversely, the failure probability is
F(t) ≡ 1 - R(t) = 1 - e-λt,
as illustrated in Figure 25, and goes asymptotically to one for long times.
Reactor Safety Design and Safety Analysis
66
The Essential CANDU
Let repair occur at some time interval, τ. This resets the failure probability to zero each time the
component is repaired, assuming that the repair is perfect and restores the component to its
original condition. Then F(t) is a sawtooth curve, as illustrated in Figure 26.
If τ << λ, then
F (t ) 1 (1 t
2t 2
2
...) t for t< in any interval ,
(24)
with t measured after the time of last repair.
Hence:
F
,
2
(25)
i.e., the failure probability is half the test interval times the failure rate.
Figure 25 Reliability for constant λ
Reactor Safety Design and Safety Analysis
Reactor Safety Design and Safety Analysis
67
Figure 26 Availability with repair
For constant λ, but τ not << λ, the following applies:
0
0
F F (t )dt (1 e t )dt
e 1
.
(26)
A common task is to design a system (composed of components that have a known failure rate)
to meet some target unavailability (1-A) or Ᾱ. Given a design, the repair interval is the remaining variable. A frequent repair cycle (low τ) gives a low Ᾱ, but such frequent repair may be
impractical due to excessive cost, radiation exposure, or wearout (i.e., repair does not restore
the equipment to an as-built state). In such a situation, alternative designs would have to be
considered.
Often repair may not be required to return F to zero. It may be sufficient simply to test the
components to ensure that they are available. This is usually the case for “demand” systems.
Sample Problem
Consider the case of a single shut-off rod (SOR) for a reactor. Given a failure rate based on
previous experience of λ = 0.002/year and a required unavailability of ≤10 -3, what is the required test period, τ?
Answer:
0.001 .
2
(27)
103
1 year .
0.001 / yr
(28)
A
To meet the Ᾱ target of 10-3, we solve for τ:
Reactor Safety Design and Safety Analysis
68
The Essential CANDU
4.2.3.3 System Unavailability
Of course, a real shutdown system has many more rods, say, N in total. Let En be the event
where all rods except for n drop successfully. The system as a whole is designed to meet its
requirements for the cases of E0, E1, E2—i.e., if zero, one, or two rods fail to drop. Hence, the
system unavailability Ᾱ is the sum of all the failure probabilities:
N
2
k 3
k 0
A P( Ek ) 1 P( Ek ) .
(29)
The conversion to the second term makes the calculation much easier because there are fewer
terms to sum. Assuming that the rods fail independently and that the failure rate is λ, then the
probability of a given rod failing on average is:
F
p for conciseness
2
(30)
as before. The success probability is 1-p. In general, the probability of event Ek is
P( Ek )
N!
(1 p) n k p k .
( N k )!k !
(31)
N!
gives the number of possible ways for the event to happen, the factor
( N k )!k !
(1-p)n-k is the probability that N-k rods all successfully drop, and the factor pk is the probability
that k all fail to drop.
The factor
4.2.3.4 Fault trees
A more systematic way of calculating system unavailability is through fault trees. One starts at
the top with the event of interest, usually a system failure. Then one determines each and
every immediate cause of such an outcome. If either of several immediate causes is sufficient
to cause the top event, then they are joined by an OR gate (please review Appendix 1 – Basic
Rules of Boolean Algebra—for a refresher on probability theory).
Conversely, if all of several immediate causes must occur to cause the “top” event, then they
are joined by an AND gate. Both AND and OR gates can have more than two inputs.
In more detail, the steps in drawing and then calculating a fault tree are:
Start (at the top) from the undesired event, e.g., loss of feed water.
Carefully define the boundaries of the system to be evaluated.
Using the principle of immediate cause, draw the tree downwards using AND, OR,
etc. Boolean logic.
Stop at basic events for which we can no longer decompose the event or when we
arrive at a point where we know the probability of failure, e.g., failure of a relay.
Assign probabilities to each event in the tree.
Calculate the Boolean algebra to determine the numerical probability of failure of
the top event.
Reactor Safety Design and Safety Analysis
Reactor Safety Design and Safety Analysis
69
The last step is not conceptually difficult, but the amount of arithmetic can be huge. It is almost
always done using special-purpose codes for all but the simplest of fault trees.
One test of a properly drawn fault tree is that causality cannot pass through an OR gate—if it
does, an AND gate is missing. For an OR gate, the input faults are never the causes of the
output fault—they are identical to the output, but more specifically defined as to cause. For an
AND gate, there is a causal relationship between the inputs and the output—the input faults
collectively represent the causes of the output fault.
There are additional types of gates which we will not cover here. The U.S. Nuclear Regulatory
Commission Fault Tree Handbook [USNRC, 1981] is a superb source for learning fault-tree
analysis.
Sample Problem
Figure 27 Simple pumped system
Consider a simple (and rather badly designed) pumped system as shown in Figure 27. Each
pump can supply 100% of the necessary flow. The demand failure probabilities for each component are:
Pump (P): 0.01
Valve (V): 0.01
Signal (S): 0.001
What is the unavailability of the system?
Answer
The first step is to define the system boundaries carefully. For this example, we will exclude the
water tank and the reactor. That means that we will not consider failure modes for the tank
(e.g., water freezing, tank drained, line opening blocked); in a real application, these would
need to be covered. We also have to define the failure criterion: less than 100% flow to the
reactor. We can then draw the fault tree. It may help to think the problem through in words
first:
Immediate cause of insufficient flow to reactor = no flow through valve V3
Immediate cause of no flow through valve V3 = no flow through valves V1 OR no flow
through valve V2 OR valve V3 closed
Immediate cause of no flow through valve V2 = pump P2 fails OR valve V2 fails to open
Immediate cause of valve V2 fails to open = valve V2 mechanically fails OR signal S fails,
Reactor Safety Design and Safety Analysis
70
The Essential CANDU
etc.
This results in the fault tree shown in Figure 28. Note that there are many ways of drawing this;
for example, one could recognize that the failure of the signal affects all components and
therefore could be in an “OR” gate just under the top event. It is always safer, however, to
follow the principle of immediate cause.
Having drawn the fault tree, we now assign labels to each basic event (V1, V2, V3, S, P1, P2), as
shown in Figure 28. We can also assign intermediate labels (A, B, C) to help in the calculations.
Now we can write out the Boolean algebra, starting from the bottom. It is important NOT to
assign numerical values immediately to the basic events and work out the final answer before
doing the Boolean algebra. In many cases, this will lead to double counting because terms such
as S+S will be counted twice. Remember that in Boolean logic, S+S=S, not 2S, and S●S=S, not S2.
Figure 28 Sample fault tree with labels
Reactor Safety Design and Safety Analysis
Reactor Safety Design and Safety Analysis
71
Let us calculate the chain up to point C first:
C=(S+P1)+(S+V1).
Similarly,
D=(S+P2)+(S+V2),
B = C●D = ((S+P1)+(S+V1))●((S+P1)+(S+V1)),
A = S+V3.
Top event = A+B
= (S+V3) + [((S+P1)+(S+V1)) ● ((S+P2)+(S+V2))]
= S+V3+(S+P1+V1)●(S+P2+V2) because S+S=S
= S+V3+S●(S+P2+V2)+ P1●(S+P2+V2)+V1●(S+P2+V2)
= S+V3+P1●P2+P1●V2+P2●V1+V1●V2 -- using S●S=S, S+S=S and S● (S+x)=S.
We can see immediately (as is obvious from the diagram) that S and V3 are single points of
failure for this poorly designed system.
Now we can plug in the numbers:
Top event = 0.001+0.01+4(0.01)2 = 0.0114.
4.2.3.5 Event trees
The companion to a fault tree is an event tree. While a fault tree answers the question “what is
the unavailability or failure rate of this system?”, an event tree answers the question “what
happens after the system fails?” The end result of an event tree is that the plant ends up in one
of three main states: stable, core damage, or large release (in practice, these states are often
subdivided).
Unlike fault trees, which are written from the top to the bottom of the page, event trees are
written from left to right. Here are the steps:
Start (at left) from the undesired initiating event (e.g., loss of feed water, loss of
coolant).
List the relevant mitigating systems along the top from left to right, in approximate
order of actuation.
At each branch where a mitigating system is called on, assign the probability of success or failure.
Develop each branch logically to a stable end state, core damage, or a large release.
Calculate the frequency of each end-point of the branches, starting from the frequency of the initiating event and multiplying by the probabilities of success or failure at each branch.
Sum these to obtain the frequencies for core damage and large release.
This is a very simplified explanation, and in practice the methods are much more complex—e.g.,
Reactor Safety Design and Safety Analysis
72
The Essential CANDU
they have to account for a failure in the fault tree (example, loss of instrument air) also occurring in the event tree, or a failure of a mitigating system (e.g., loss of service water) which is
common to the failure of other mitigating systems. This topic is well beyond the scope of this
section. For more on common-cause failures, see [USNRC, 1981].
A simple example, which should be self-explanatory, is shown in Figure 29, where P1, P2, P3,
etc. are the probabilities of success for each mitigating system. Note that if the failure probabilities (1 – Pi) are small, the success probabilities can be assumed to be equal to one when
calculating each success branch. So, for example, the frequency of core damage in the sequence just below the box labelled “Stable” is:
Small LOCA frequency x (1-P3) x P4,
and one could set P4=1 in calculating this branch, as a good approximation. Note also that even
if ECC fails, the moderator will maintain pressure tube integrity and prevent fuel melting by
removing heat from the fuel channel, as described in Section 5.3.2.3.
Figure 29 Simple event tree
4.2.3.6 Dormant vs. active systems
So far, we have focused on systems that are normally dormant and are required to operate on
demand. Safety systems generally fall into this category. However, some systems, like the
Emergency Core Cooling System (ECCS), are required to activate on demand and to continue to
function for some defined mission time. The normal response of the ECCS to a heat-transport
system (HTS) break (loss-of-coolant accident or LOCA) is for the ECCS to detect the event and
initiate the injection of high-pressure (HP) cooling water (strictly speaking, the water-injection
Reactor Safety Design and Safety Analysis
Reactor Safety Design and Safety Analysis
73
function of ECC is called ECI, or Emergency Coolant Injection, because ECC also has other
functions such as steam generator cooldown and loop isolation 1). Then, after the HTS has been
depressurized, medium-pressure and finally low-pressure water is injected. The HP water is
supplied, for example, from a water tank (accumulator) pressurized by huge gas cylinders.
Medium-pressure cooling water can be supplied from a water tank by ECC pumps, and lowpressure water is retrieved from the sumps in the reactor-building basement, cooled, and
pumped back into the HTS. For CANDU reactors, an ECC mission time of one to three months
has been set2. The ECCS is consequently divided into two separate fault trees for the purposes
of analysis: dormant ECC and long-term ECC (designated DECC and LTECC respectively). The
DECC fault tree focuses on failure to detect the LOCA event, failure to initiate high-pressure (HP)
cooling water, failure to distribute the flow, and failure to provide medium- and low-pressure
water. The LTECC fault tree focuses on failure to provide long-term low-pressure cooling due to
pump failure, valve failure, flow blockage, loss of electrical power, or loss of coolant supply.
4.2.4 Typical results
We have now summarized fault trees and event trees. A PSA is the integrated collection of
these across an entire plant. There are three recognized levels of PSA, which can be defined as
follows (see, e.g., [IAEA, 2010]):
Level 1 – identifies the sequences of events that can lead to core damage and calculates the
core-damage frequency.
Level 2 – uses the information from Level 1 to calculate the magnitude and frequency of releases to the environment of radioactive material.
Level 3 – uses the information from Level 2 to calculate health effects and other consequences
such as contamination of food and land.
In practice, Level 1 is used to assess the design and operation of the plant, Level 2 is used to
assess the effectiveness of containment, and Level 3 is used in off-site emergency planning.
As an example, we summarize the results of a Level 1 PSA done for an operating CANDU 6 plant
[Santamaura, 1998]. The summed severe core-damage frequency (SCDF) was predicted to be
6.1 × 10⁻⁶ per year. We have already discussed the underlying reasons that this number is low:
redundant shutdown systems mean that accidents with failure to shut down occur at very low
frequency, and the moderator, if available, is effective in preventing or arresting severe core
damage. Moreover a severe core-damage accident (after shutdown) at high pressure is not
possible because failure of a limited number of pressure tubes converts the event inherently to
a low-pressure accident. Note that [Santamaura, 1998] covered internal events only; typically,
inclusion of external events doubles this value. Also note that accidents in shutdown states
1
Such a distinction is made in Canada, but most other places just use ECC.
2
The mission time is defined here as the time beyond which the decay heat can be removed from the fuel to the
moderator without any water in the fuel channel, so as to prevent any further fuel failures due to overheating. It is
a calculated number.
Reactor Safety Design and Safety Analysis
74
The Essential CANDU
were excluded.
The contributors to the SCDF are shown in Figure 30. Note that it is the high-frequency initiating events, including many AOOs, that dominate the SCDF; the bounding accidents such as large
LOCAs contribute very little and hence are much less risk-significant.
Figure 30 Contributors to SCDF for CANDU 6
4.3 Problems
1.
What can you say quantitatively about the probability of a pressure-tube/calandria tube
failure in a CANDU, based on that fact that only one has occurred? You will need to calculate the
number of reactor-years of experience with CANDU operation. Use Bayes’ Theorem.
2.
Two 100% electrical motor-driven auxiliary feed-water pumps are located in the turbine
building and depend on recirculated cooling water and two independent power supplies. They
have the flow capability to mitigate steam- and feed water-line breaks. Identify common mode
and common-cause failures. The utility wants to extend the life of the plant and is planning
refurbishment. What mitigation features or modifications would you include to reduce or
eliminate these failures?
3.
Develop a set of high-level safety goals for a military-use nuclear submarine. They can
be, but do not have to be, numerical. The most important part of your answer is to explain and
justify it, not whether or not it matches someone else’s “official” goals. Consider any differences due to docked versus at-sea and peacetime versus war.
4.
Small reactors could be used in remote northern communities for heating and electricity
production. They would replace very expensive diesel generators, the fuel for which has to be
flown in, whereas the reactor could be designed to be refueled once in twenty years. Small
reactors have also been used for powering unattended remote military installations. Propose
Reactor Safety Design and Safety Analysis
Reactor Safety Design and Safety Analysis
75
safety goals for each case, with reasons.
5.
Assuming that the small LOCA frequency is 10-2 per year, work out the frequency of core
damage in Figure 29. Use P1=P2=P3=10-3.
6.
Simple fault tree
a. A system consists of two redundant trains as shown in Figure 31 (i.e., 2 × 100%,
connected in parallel). If the probability that each component P1, P2, V1, V2
works successfully is 0.9, what is the reliability of the system? Write out the Boolean algebra in full. To achieve a reliability of 0.99, what would the reliability of
each component (assumed to be all the same) have to be? List any assumptions.
b. Now do the same calculation without the cross-tie.
c. The cross-tie looks like an obvious thing to do. Think of some engineering disadvantages to the cross-tie. Hint: what might happen if one pump fails to start?
How would you fix the design? What impact would your fix have on reliability?
Figure 31 Simple fault-tree exercise
Reactor Safety Design and Safety Analysis
76
The Essential CANDU
5 Mitigating systems
In previous sections, we have referred to the four safety functions required in a nuclear reactor:
shut down the reactor
remove decay heat
contain any radioactive material
monitor the state of the plant.
In this section, we shall describe the major systems that perform these functions. We shall
concentrate on CANDU for our examples, although other reactor types have similar systems.
First, however, we need to ask how much redundancy and independence we need for each
safety function. This concept is called defence-in-depth and is a fundamental underpinning of
nuclear safety.
5.1 Defence-in-Depth
The concept of defence-in-depth was developed for military purposes. At one level, it consists
of a series of physical barriers, so that breaching any one barrier (or even more) does not lead
to disaster. The Krak Castle in Syria is one such example, where an (ancient) intruder would
have to breach the moat, the outer wall, the inner wall, and the keep to capture the ruler. More
generally, defence in depth requires that a defender deploy his resources, such as fortifications,
field works, and military units both at and well behind the front line, so that a breach in the
front line does not lead directly to defeat.
Figure 32 Defence-in-depth: barriers
The analogy for a nuclear power plant involves the physical barriers to release of radioactive
material from the fuel, namely the fuel matrix itself (which we have seen is highly resistant to
release of fission products except at melting temperatures), the fuel sheath (which prevents the
gaseous fission products in the fuel-sheath gap from escaping), the heat-transport system, the
containment, and the exclusion zone (which provides dilution rather than a physical barrier);
see Figure 32.
A complementary approach to defence in depth is to define a series of five successive levels:
Prevent abnormal operation and system failures.
Reactor Safety Design and Safety Analysis
Reactor Safety Design and Safety Analysis
77
Control abnormal operation and detect further failures.
Control accidents within the design basis.
Control severe accidents.
Apply off-site emergency response.
These are objectives rather than physical barriers. Note that the last is largely independent of
reactor design. There are various formulations of these concepts; see [INSAG, 1996], from
which the following summary Table 7 is extracted.
Table 7 Levels of defence in depth
Levels of defence
in depth
Level 1
Level 2
Level 3
Level 4
Level 5
Objective
Essential means
Prevention of abnormal operation and Conservative design and high
failures
quality in construction and
operation
Control of abnormal operation and detec- Control, limiting, and protection of failures
tion systems and other
surveillance features
Control of accidents within the design Engineered safety features
basis
and accident procedures
Control of severe plant conditions, includ- Complementary
measures
ing prevention of accident progression and and accident management
mitigation of the consequences of severe
accidents
Mitigation of radiological consequences of Off-site emergency response
significant releases of radioactive materials
Defence-in-depth is fundamental to the achievement of nuclear safety; try Problem 1 in this
section.
5.2 Shutdown Systems
Typically, a reactor has one or more systems for each of the four safety functions (control, cool,
contain, monitor). Defence-in-depth influences the amount of redundancy provided. For each
system, its performance is specified by design requirements. These in turn arise from listing and
evaluating the challenges that the system must overcome, which make up the design basis.
Shutdown is one of the most important safety functions in a reactor because it reduces the
amount of energy that has to be removed from the fuel after an accident. It is usually accomplished through rapid insertion of a neutron-absorbing material into the core. Another way is to
remove from the core material which is essential to the chain reaction, e.g., the moderator.
More radical engineered concepts are possible in principle, such as removing fuel or changing
the core geometry, but they are not in widespread use for fast shutdown.
The design bases of the shutdown systems are typically set by those accidents developed using
Reactor Safety Design and Safety Analysis
78
The Essential CANDU
the various approaches in Section 2, e.g., large loss-of-coolant accident, loss of reactivity
control, loss of Class IV power, etc. Each of these accidents contributes to answering the
following questions, and the limiting value in each case becomes a design requirement for the
shutdown system:
How is negative reactivity inserted into the core?
How fast does the system have to act once it receives a signal?
How much reactivity depth must it have (how many negative milli-k?)
How reliable must it be?
What are the analysis limits that describe effectiveness?
What sorts of signals are available and practical to trigger the shutdown system for
each accident?
What sort of environment must the shutdown system be designed to withstand?
How do we ensure that a fault does not affect both the control system and a shutdown system? Or both shutdown systems?
How do we know that the systems will work as designed?
How does the operator know that the system has been required and that it has
worked?
We shall cover these topics in turn. Many of these questions are common to other safety
systems, and therefore we shall explore them in detail the first time and simply refer to them
later.
5.2.1 Mechanical design
The most basic part of shutdown design is inserting a neutron absorber into the core. Because
modern power reactors are large, a single absorbing device is generally not sufficient. Almost
all reactor types use some form of absorber rod, multiples of which are inserted vertically into
the core. In most reactors in the world, the rods do double duty, being driven in and out of the
core for control purposes, and being driven or dropped in rapidly for shutdown purposes.
CANDU, however, separates the control rods from the shut-off rods, as one of the lessons
learned from the NRX accident.
The first CANDU shutdown system was moderator dump: large valves at the base of the calandria would open, and the moderator would drain out of the calandria vessel under the action of
gravity, somewhat like the ZED-2 design. The system would be re-poised by closing the valves
and pumping the moderator back into the calandria. NPD, Douglas Point, and Pickering A used
this system. Pickering A also used a few shut-off rods which fell in by gravity. The moderator
dump system was (and is) highly reliable, but is somewhat slow compared to shut-off rods,
especially for larger cores, and in addition removes a source of water surrounding the fuel
channels, which could be used in an emergency (we will discuss this later).
Modern CANDUs have two separate shutdown systems: rods and poison injection (Figure 33,
from [AECL, 2005]). Specifically, Shutdown System 1 for CANDU consists of 26 or 28 shut-off
rods, normally suspended above the core and released on a signal. They act in the moderator,
between the rows of pressure tubes, as can be seen in Figure 33. They fall in by gravity and are
Reactor Safety Design and Safety Analysis
Reactor Safety Design and Safety Analysis
79
spring-loaded, which accelerates them over the first few feet of travel. Mechanically, the rod is
suspended on a cable running over a pulley, which is released by a clutch and wound back up by
a motor. The rod itself falls into a perforated guide tube within the moderator; the purpose of
the guide tube is to make sure that the rod falls straight in and does not tip over or snag.
Figure 33 CANDU shutdown systems
Shutdown System 2 consists of a liquid neutron absorber (gadolinium nitrate) which is injected
directly into the moderator water through perforated metal tubes. The liquid is accelerated by
gas pressure from a common helium tank which pressurizes one poison tank per nozzle, as
shown in Figure 33. The system is actuated by opening the fast-acting valves connecting the
helium tank to the poison tanks. A disadvantage of this system (in case of a spurious trip) is that
because it injects poison into the moderator water, the poison must all be removed chemically
(by ion exchange) before the reactor can start up again, a process that takes almost two days.
Note that there are no normally closed valves between the poison tanks and the moderator for
reliability reasons. As a consequence of this, however, poison gradually diffuses toward the
core down the pipe and must be back-flushed from time to time to drive the diffusion front
away from the moderator.
Reactor Safety Design and Safety Analysis
80
The Essential CANDU
5.2.2 Speed
The required speed is set by the fastest accident. In CANDU, this is the large loss-of-coolant
accident, where the break is assumed to grow to full size instantaneously—a very pessimistic
assumption and inconsistent with what we know of pipe dynamics [Tregoning, 2008]. Core
voiding for such a case inserts positive reactivity at a rate of approximately 4 mk/sec. One of
the main safety requirements during this phase is to prevent melting of the central part of any
fuel pin due to overpower, because significant amounts of molten fuel could risk failure of the
nearby pressure tube. As long as the net positive reactivity is kept below approximately 6 mk,
depending on the design and the assumptions, the energy is not sufficient to melt the centre of
the fuel. This then suggests that the shutdown system has to start to bite (insert negative
reactivity) in approximately one second, and that the initial reactivity insertion rate has to
overcome the 6 mk already inserted, as well as turning the transient over by 1.5 seconds—in
other words, tens of (negative) mk/sec.
5.2.3 Reactivity depth
Reactivity depth means the total negative reactivity inserted once the shutdown system has
fully operated. For shut-off rods, this occurs when the rods have been fully inserted; for poison
injection, when the poison has been fully injected and mixed with the moderator. The reactivity
depth requirement is set by the accident which inserts the greatest positive reactivity. For
CANDU, this is not the large LOCA, but a small LOCA, specifically a pressure-tube break followed
by an assumed calandria-tube rupture. Why? When a reactor is operating at full power, negative reactivity load is present due to xenon, a neutron absorber which is formed from the decay
of iodine, which in turn is formed from the fission product tellurium as follows:
135
Te ⇒<1min ⇒ 135I ⇒6.7h ⇒ 135Xe ⇒9.2h ⇒ 135Cs ⇒ 135Ba (stable),
where the times represent half-lives. The xenon load in a CANDU at full power is approximately
-25 mk and has to be compensated for by positive reactivity from the fuel to keep the reactor
critical. When the reactor is suddenly shut down, the xenon decays more slowly than the
iodine, so that the absorption due to xenon initially increases to about -40 mk, then decreases
as the iodine decays away (Figure 34).
Reactor Safety Design and Safety Analysis
Reactor Safety Design and Safety Analysis
81
Figure 34 Xenon transient after shutdown and start-up
After a long shutdown, the xenon load is small, so that poison is added to the moderator to
compensate for the absent xenon load (because the normal control system does not have the
required negative range). As the reactor comes back to power again, the iodine and therefore
the xenon gradually build up, and the poison can be chemically removed from the moderator
(or a burnable poison is used, i.e., one which is made into a less absorptive species over time by
neutron absorption, typically gadolinium). If a pressure-tube break with assumed failure of the
surrounding calandria tube occurs during start-up, then the “poisoned” heavy-water moderator
can be replaced by non-poisoned heavy-water coolant. The amount of positive reactivity that
can be added in, say, the first 15 minutes is dependent on:
coolant void in the fuel channels, from the fraction of coolant that is lost through the
break.
fuel temperature, due to cooldown of the fuel after trip.
“clean” coolant displacing “poisoned” moderator.
increase in moderator temperature (albeit small and slow) due to mixing of the hot
discharging coolant with cold moderator.
decay after shutdown of any xenon that has been formed during on-power operation.
Offsetting this is the negative reactivity due to the shutdown systems and eventually the very
large negative reactivity due to injection of emergency-coolant light water. The last effect is not
credited in licensing analysis for CANDU (although in LWR licensing analysis, the reactivity effect
of borated ECC must be credited [Westinghouse, 2011a]). For CANDU, the analysis of the
reactivity balance is usually done 15 minutes after the first clear signal of a pressure-tube break,
when the operator can be assumed to supplement the shutdown-system reactivity (e.g., by
manual poison addition). One then designs the shutdown depth of the shutdown system to
achieve an adequate shutdown margin (the net result of the reactivity balance) using conservative assumptions. Physically, one achieves greater shutdown depth by adding more rods (new
designs), by putting rods preferentially in the high-flux region of the core, etc. There is a practical space limit, however, on the number and location of rods. The typical shutdown depth for
existing CANDU shutdown systems is -70 mk for the shut-off rods and < -200 mk for poison
injection. Hence, shutdown margins for the rods are smaller, -5 to -10 mk for existing CANDUs,
under the most pessimistic conditions (e.g., assuming that the two most effective rods are
unavailable).
5.2.4 Availability
Demand unavailability is expressed in dimensionless units, although it is also written as
hours/year or years/year. The required unavailability is set primarily by the safety goals applied
to the reactor by the regulator, and for current CANDUs, it is at most one failure per 1000
demands (10-3 per demand) for safety systems. Experience has shown that the shutdown
systems normally meet approximately 10-4 per demand. Unavailability values much lower than
this are possible, but are usually not credited for a single system because of:
Reactor Safety Design and Safety Analysis
82
The Essential CANDU
the number of tests that would be needed to establish such an unavailability;
the suspicion that unknown cross-link effects and common-cause failures impose a
lower limit on the unavailability of a single system.
If each shutdown system has an unavailability of 10-3 per demand, then one is tempted to say
that the unavailability of both systems together is 10-6 per demand. This is true only if the
systems are sufficiently independent and diverse that they are not subject to common-cause
failures. See Section 13.
Recent CANDUs have used software for both SDS1 and SDS2. Software can be more reliable
than relay logic, but its failure modes can be subtle, so that while testing in operation is important, much more emphasis must be placed on software design to avoid subtle and commoncause failures. Methods include a rigorous development process, diversity in development tools
and platforms, simple programming logic, and strict independence between the software
engineers responsible for designing each shutdown system. In CANDU, the control-system
software is completely independent of and separate from the shutdown-systems software, and
in current CANDUs, they run on independent hardware platforms.
5.2.5 Analysis limits
Analysis limits are used to judge the effectiveness of shutdown. Trip signals are chosen to
reduce the challenge to the fuel and to downstream safety systems—in other words, to prevent
or postpone consequences. For example, for accidents which are expected to happen perhaps
once or more in the plant lifetime, i.e., anticipated operational occurrences or AOOs, the
shutdown systems should act early enough to prevent fuel-sheath failure, thus avoiding any
challenge to the HTS and containment as well as the cost of clean-up. This category includes,
among others, loss of Class IV power, a very small LOCA, or a failure in the reactivity-control
system. In turn, prevention of fuel-sheath failure generates a number of secondary criteria,
which we will cover in Section 6. For loss of heat sink accidents, a subsidiary requirement is that
the shutdown systems should act soon enough to give the operator adequate time to bring in a
backup heat sink—typically 15 to 30 minutes, although new designs aim for at least eight hours
before operator action is required. For rare accidents such as a large LOCA, one should limit
(but not necessarily prevent) fuel damage (to reduce the challenge to containment) and ensure
that the fuel is not made so brittle from the Zircaloy-steam reaction that it forms debris and
cannot be cooled by ECC; see Section 6. Limiting fuel damage in a large LOCA is a task shared
between shutdown and ECC: the job of the shutdown system is to deliver the fuel to the ECC in
reasonable condition so that ECC can remove decay heat from a known fuel geometry. Finally,
in any accident, shutdown systems should act early enough so that there is no risk to the
pressure boundary (or at least no risk in addition to that from the initiating event).
5.2.6 Signals
A shutdown system must detect an accident soon enough that the analysis limits are met.
Some of the commonly used trip signals are listed in Table 8 (this list is illustrative rather than
complete).
Manual trip is credited if the time scales are long—typically fifteen minutes from the first clear
Reactor Safety Design and Safety Analysis
Reactor Safety Design and Safety Analysis
83
signal of the accident in the main control room—and if there is no practical alternative.
Table 8 Typical trip signals for CANDU
Accident
Symptoms
Loss of reactor Reactor power rises
power control Reactor power rises rapidly
Heat-transport system pressure
rises
Loss of forced Coolant flow drops
circulation
HTS pressure rises
Typical Trip Signals
High neutron flux
High log rate of neutron flux
High heat-transport system pressure
Reactor power rises
Medium
to Reactor power rises
large loss of Reactor power rises rapidly
coolant
Containment pressure rises
Coolant flow drops
Coolant pressure drops
High neutron flux
High neutron flux
High log rate of neutron flux
High containment pressure
Low heat-transport system flow
Low heat-transport system pressure
Small loss of Pressurizer level drops
coolant
Coolant flow drops
Containment pressure rises
Moderator level rises (in-core
break)
Coolant pressure drops
Loss of feed HTS pressure rises
water
Feed-water flow drops
Steam generator level falls
Large
steam HTS pressure falls
main failure
Pressurizer level falls
Steam generator level falls
Feed-water pressure falls
Reactor power decreases
Containment pressure rises5
Low pressurizer level
Low heat-transport system flow
High containment pressure
High moderator level
Low heat-transport system flow
Low core pressure drop
High heat-transport system pressure
Low heat-transport system pressure
High heat-transport system pressure
Low feed-water flow
Low steam generator level
Low HTS pressure
Low pressurizer level
Low steam generator level
Low feed-water pressure
High containment pressure
5.2.7 Operating environment
A safety system must be able to function in, or be protected from, the conditions caused by an
5
For plants where portions of the steam mains are within containment
Reactor Safety Design and Safety Analysis
84
The Essential CANDU
accident. If it is not possible to meet this requirement, then a redundant system is needed. For
example, a major fire in or near the main control room would require shutdown (because it
could affect the control computers) and at the same time would possibly damage some of the
components of Shutdown System 1 so that it would not respond (although it would very likely
fail safe)—and therefore SDS2 (which does not depend on the integrity of the main control
room) is used as a back-up to perform this safety function.
The shutdown mechanisms in CANDU act mostly within the moderator, which protects them
from some of the effects of accidents—but not all. For example, we must design so that:
no high-energy pipes are within striking distance of the reactivity mechanisms deck
on top of the reactor, where the shut-off rod clutches and pulleys are located.
an in-core break cannot disable shut-off rods to the extent that the system does not
meet its reactivity depth requirements (it is not possible to protect all the guide
tubes and rods from pipe whip and jet forces from an in-core break).
shutdown-system cables and instruments are separated to the extent practical so
that a local fire will not incapacitate both shutdown systems.
steam, high temperatures, water, and high radiation fields from an accident must not
prevent a shutdown system from firing when needed (once it has fired, however,
such protection is no longer needed).
shaking due to an earthquake must not prevent the shutdown system from actuating
nor slow it down so severely that it cannot meet its analysis limits.
5.2.8 Common-cause failures
We gave an example earlier where a single cause (fire) could disable more than one system.
This is a serious challenge to the protection provided by seemingly independent systems.
Known common-cause failures can be “designed out”, but to cover the possibility that we
cannot anticipate them all, a two-group philosophy is followed in CANDU. In summary, this
philosophy is:
for each failure, ensure that there are at least two ways of performing the required
safety function.
separate these two ways geometrically (so that they are not subject to local damaging hazards such as fire, turbine missiles, or aircraft crash).
use diverse equipment and diverse means of operation.
protect equipment against the environmental results of the failure.
qualify or protect at least one of the two systems against plant-wide external events
such as tornadoes and earthquakes.
The practical application involves many trade-offs: diversity is not always possible, and there is
only so much space within which systems can be separated. Whereas ideally one would like to
route control system cables separate from SDS1 cables and SDS2 cables, it would be almost
impossible from a plant layout point of view, and therefore grouping of control system and SDS1
cables is allowed, but they must be separated from SDS2. However, all three logic channels (see
Section 5.2.9) within any given group must be separated, so that a local cable fire cannot
Reactor Safety Design and Safety Analysis
Reactor Safety Design and Safety Analysis
85
generally disable all three channels of any one system.
If a compromise in separation must be made, then one must show that one or more of the
following applies:
there is no credible hazard in the area
another system outside the area will mitigate the event
the system or component is protected by a barrier
the system or component is fail-safe
the component is designed to withstand the hazard.
Table 9 shows an example of how grouping and separation were implemented on CANDU 6.
Table 9 Grouping and separation example
Safety Function
Shutdown
Contain Radioactive Material
Group 1
Reactor
Control
System
Shutdown System 1
Heat Transport System
Steam & Feedwater Systems
Shutdown Cooling System
ECC
Moderator
Reactor building air coolers
Monitoring & Control
Main Control Centre
Heat Removal From Fuel
Group 2
Shutdown System 2
Emergency Water System
Containment & containment
subsystems
Secondary Control Area
Most safety systems need services such as air, water, and power. These must also be grouped
and separated.
5.2.9 Testing
Section 4.2.3.3 discussed the link between testing and availability. It is not practical to test safety systems fully during onpower operation; instead, they are designed to have their
components tested in such a way as to preclude actual system
operation. Specifically, the testing of the logic is separated
from that of the final mechanism, and the mechanism is
tested in stages, not all at once.
All safety systems in CANDU have three logic channels, with
two out of three being sufficient to initiate the trip or safetyFigure 35 2/3 logic
system action (Figure 35). The requirement that two channels
must both vote for a trip reduces the likelihood of spurious
trips due to a single component failure. On the other hand, the reactor will still trip if required
even if one channel is unavailable (failed unsafe). Finally, a single channel can be tested without
tripping the reactor.
Reactor Safety Design and Safety Analysis
86
The Essential CANDU
The shut-off rods are designed to be partially dropped individually in a test. In other words,
shortly after the clutch has released and the rod begins to fall, the clutch can be re-energized
and the rod “caught” before it enters the core. This proves that the rod is not stuck in the first
part of its travel. Typically, each rod is partially dropped about once a week.
For Shutdown System 2, Figure 36 shows one way of testing each logic channel and each valve
without firing the system, while any two channels which trip will fire the system. Testing any
single logic channel opens two valves, but does not allow (much) poison to leak into the moderator.
Performance testing is usually done by
measuring the speed of actuation of one or
more components. Therefore, on a partial
rod drop, one can determine how long it
takes the rod to reach the point when it is
caught, or one can test the valve opening
times on SDS2. Before a scheduled shutdown, a full actuation test of the shutdown
system measures the rod drop versus time
and the actual power rundown.
5.2.10 Human interface
An operator must:
Figure 36 SDS2 testing
Be notified that the shutdown system has tripped
Be able to confirm that it has actuated correctly
Have procedures to follow in case it has not.
Normally, notification consists of an alarm window on the SDS panel, showing (for each channel) that a trip parameter has passed its trip set-point and a window showing that the SDS has
fired. The latter is not sufficient to establish that the system has indeed worked, and an operator will have supplementary information available such as shut-off rod position; he will also
check the neutron power measurement to ensure that it is consistent with a shut-down reactor.
Finally, should these latter measurements suggest that the system has not fired, he will have
and will follow backup procedures such as manually tripping the shutdown system, manually
firing the second shutdown system, or dropping the mechanical control absorbers (manual
stepback).
We have now covered all the high-level design requirements and design bases of the shutdown
systems. Our in-depth example can be extended to the systems responsible for heat removal,
containment, and monitoring, but we will cover these more briefly.
5.3 Heat-Removal Systems
The high-level design requirements of the heat-removal systems are determined by the answers
to the following:
Reactor Safety Design and Safety Analysis
Reactor Safety Design and Safety Analysis
87
How much heat must they remove (full power, decay heat, decay heat after x minutes, etc.)?
Where are they connected (primary side, secondary side, etc.)?
How are they initiated?
Under what conditions can they operate (pressure, temperature)?
What is their reliability?
5.3.1 Heat-removal capability
Heat removal at high power is performed by the primary coolant flowing through the fuel
channels and transporting the fuel heat to the steam generators. Coolant is transferred across
the steam-generator tubes to the main steam and feed-water systems. The case of a sudden
loss of heat removal from the secondary side (e.g., turbine trip with loss of condenser vacuum)
must be provided for, so that a capability for 100% steam dump to atmosphere is provided. This
is accomplished by banks of main steam-safety valves (MSSVs) on the main steam lines. Full
steam flow is needed only until shortly after the reactor has tripped.
For economic reasons, another subsystem is provided which can dump up to 60% steam directly
from the steam generators to the condenser. This is used for poison prevention—that is, if the
turbine trips, but the operator thinks that he can restart it reasonably soon, instead of shutting
the reactor down, he can set back the reactor power to a level just sufficient to prevent a
poison-out due to xenon build-up. The heat must still be removed, however, and therefore the
design makes it possible to dump the steam directly to the condenser, by-passing the turbine.
Because (unlike steam dump to atmosphere) the secondary water is recycled from the condenser back to the steam generators, it is possible to do this for considerable periods of time.
This is a big advantage in the case of a prolonged loss of electrical grid power; if the reactor can
avoid a trip when the grid is lost (e.g., through stepback to 60% power) and is kept running, it
remains ready to supply power as soon as grid stability is restored.
This capability was demonstrated after the power blackout of Thursday, August 14, 2003. When
the grid failed at 16:10, all operating reactors in Ontario tripped. The four Bruce Power units
and Darlington unit 3 were quickly put into poison-prevent mode, operating at about 60% of full
reactor power and by-passing steam to the condensers. These reactors were able to start
providing power within a few hours as grid restoration began. For details, see [Rogers, 2004a].
The maximum decay heat immediately after shutdown is approximately 6%. However, we can
sometimes design to remove less if the heat sink can be brought on-line later. Figure 37 shows
the variation of decay heat with time after shutdown.
The desired end-point of an accident is a stable cold shutdown—i.e., the reactor is well subcritical, the decay heat generated by the fuel is being removed, no further release of radioactive
material from the fuel is taking place, and the reactor is depressurized and “cold” (i.e., ~100°C
or less). Therefore, in addition to removing the decay heat from the fuel as it is generated,
there must be some additional heat-removal capability to cool the reactor down.
Reactor Safety Design and Safety Analysis
88
The Essential CANDU
5.3.2 Location of heat removal
Heat can be removed from the secondary cooling system and from the primary cooling system.
Figure 37 Bundle power after shutdown
5.3.2.1
Secondary-side heat removal
The secondary cooling system is used under the following conditions:
If all components and systems on the secondary side are working, the main feed-water
pumps provide water to the steam generators. The condenser removes heat from the
steam and provides a continuous source of cooled water to the feed-water pumps. This
relies on the availability of Class IV electrical power to run the main feed-water pumps.
Alternatively, the task can be undertaken by one or more auxiliary feed-water pumps,
sized to remove decay heat. These feed-water pumps are typically powered by Class III
electrical power, or directly by a diesel engine, or by a steam turbine connected to the
steam generators. It is not necessary to size them for 6% power because they are not
needed until some of the water already in the steam generators has boiled away. This
takes about half an hour, so that the heat-removal capability of the auxiliary feed-water
pumps is typically about 4%. Note that if Class IV power is unavailable, the steam cannot
be condensed, and the heat is removed by steaming to atmosphere from the steam
generators, either through the atmospheric steam discharge valves (ASDVs), with a capacity of about 10% of full-power steam flow, or through the main steam-safety valves
(MSSVs), with a capacity of about 115% of full-power steam flow. After an hour or more,
the water in the feed-water train will be used up, and the operator will have to establish
another heat sink.
In some CANDUs, the dousing tank located in the top portion of the containment can
supply a long-term source of water by gravity to the steam generators. In others, an elevated tank outside containment (the boiler emergency cooling system, or BECS) perReactor Safety Design and Safety Analysis
Reactor Safety Design and Safety Analysis
5.3.2.2
89
forms this function.
Most recent CANDUs have a seismically qualified source of water (e.g., a large pond) for
use after an earthquake. This emergency water system (EWS) has its own seismically
qualified power and pumps and can supply water independently to the steam generators for about three days.
Primary-side heat removal
Because many of the options for secondary-side heat removal are valid only for a limited period
of time after an accident, CANDUs also have a primary-side system to remove decay heat, the
shutdown cooling system. It is a closed system connected to the reactor headers with its own
pumps and heat exchangers (Figure 38). It can be brought on-line immediately after shutdown
at high temperature and pressure.
Figure 38 Shutdown cooling system
The emergency core cooling system can be viewed as a decay heat-removal system for the
special case of a break in the primary cooling system piping. We shall cover this system later.
5.3.2.3 Moderator and shield tank
The moderator surrounding the fuel channels can be used in a severe accident (LOCA with loss
of ECC) to remove decay heat. This heat-removal pathway is efficient enough to prevent fuel
Reactor Safety Design and Safety Analysis
90
The Essential CANDU
melting, but will not prevent extensive fuel damage and distortion of the fuel channels (Figure
39).
The shield tank surrounding the calandria (see also Figure 39) has its own heat-removal system
(pumps and heat exchangers) and can be used in a severe core-damage accident, e.g., if a LOCA
plus loss of ECC plus loss of moderator heat removal all occur. In current CANDUs, the shield
tank does not have enough heat-removal capability (0.3%) to match that being generated by the
fuel; in addition, the causes for the failure of ECC and moderator cooling may also have disabled
the heat-removal capability of the shield
tank (e.g., loss of electrical power, loss of
service water). However, several current
CANDUs and all new ones, have installed
gravity-driven makeup to the shield tank
and/or the calandria to provide a much
longer-term heat-removal capability.
5.3.3 Initiation of decay heat removal
Decay heat-removal systems can be either
automatic or manual, based on when
they are needed. Typically, if they are not
needed for 15–30 minutes, they can be
manually initiated (e.g., shutdown cooling
system, EWS); if they are needed sooner,
they must be automatic (e.g., ECC,
auxiliary feed-water system).
5.3.4 Operating pressure
A key design choice is the operating
pressure of the heat-removal system.
Table 10 summarizes the advantages and
disadvantages of high vs. low pressure. In
many cases, the pressure is determined
by the nature of the design (e.g., the
moderator).
Figure 39 Moderator and shield cooling
Reactor Safety Design and Safety Analysis
Reactor Safety Design and Safety Analysis
91
Table 10 Operating pressure of decay heat-removal systems
Operating
Pressure
High
Low
Advantages
Disadvantages
Can be brought in at any stage of an
accident
Components tend to be smaller due
to more efficient heat removal
(larger ΔT)
More easily automated
Can be simpler and cheaper
Can be made more passive
More stringent requirements on code
class of piping and components
Need to ensure that it is tolerant if
brought on-line when system is at low
pressure (e.g., risk of pump cavitation)
Requires previous depressurization of
the system (i.e., depends on another
system)
5.3.5 Reliability
Unlike the case of shutdown systems, the mission time of decay heat-removal systems can
extend to days or months, and therefore we need to determine both the demand availability
(reliability to start) and the running reliability once the system has started. A typical active
decay heat-removal system consists of pumps, which require electrical power, and heat exchangers, which require a source of cooling water, which in turn requires electrical power.
Unavailabilities in the range of 10-2 to 10-3 to start and 10-1 to 10-2 over a specified mission time
are typical. Therefore, redundancy in decay heat-removal systems is necessary.
5.4 Emergency Core Cooling System
The functions of the ECCS are to refill the core and to remove decay heat after a LOCA. We now
discuss high-level design requirements.
5.4.1 Performance requirements
Sudden large primary pipe breaks have never occurred in a Western nuclear reactor; the probability is less than 10-5 per reactor year. A modern CANDU reactor has between 360 and 480
fuel channels and therefore 720 and 960 feeder pipes. The probability of a small pipe break is
about 10-2 per reactor year based on experience, which is an issue not only for safety but also
for plant investment protection. Therefore, the ECCS has safety requirements for both large and
small breaks, and in addition, investment protection requirements for small breaks only.
The ECC safety requirements for all breaks are to:
meet public dose limits by limiting the extent of fuel damage,
prevent pressure-tube failure,
ensure that the fuel in the fuel channels retains a coolable geometry,
and for small breaks, in addition, to:
prevent sheath failure.
Reactor Safety Design and Safety Analysis
92
The Essential CANDU
5.4.2 Location of water injection
The CANDU ECC injects light water into the reactor inlet and outlet headers in both heattransport system loops (for reactors which have two loops): eight headers in all in CANDU 6
(Figure 40). Because each channel is connected to two headers and the headers are above the
core, this provides a water pathway to every channel in the core. The disadvantages of this
scheme are:
water injected near or at the break discharges without removing heat from the fuel
(depending on the break size and location). The design must provide sufficient pressure and water volume that flow of water out of the injection point at or near the
break is accounted for.
the (feeder) pipe to each channel is fairly small in diameter and contains a large
amount of stored heat, and the injection water may have to flow countercurrent to
the steam exiting the channel as it refills.
Light-water injection also ensures long-term shutdown in CANDU, but is not credited with this
function in safety analysis.
Figure 40 ECC layout
5.4.3 Injection pressure and flow rate
The current design (using CANDU 6 as a model) is a three-stage ECC:
Reactor Safety Design and Safety Analysis
Reactor Safety Design and Safety Analysis
93
A high-pressure initial injection phase limits fuel overheating for small breaks and forces
early cooling for large breaks (to limit pressure-tube deformation and early fuel damage).
Typical injection pressure is 5.3 MPa. In CANDU 6, high-pressure injection comes from two
water tanks which are pressurized by gas at the time of a LOCA signal. In some multi-unit
CANDU plants, this high-pressure phase is supplied by electrically driven pumps because the
reliability of Class IV power tends to be very high (it can be obtained from other operating
units as well as the grid).
Medium-pressure injection takes over when the high-pressure water tanks are nearly empty.
It uses medium-pressure (~1 MPa) pumps and draws cold water from the dousing tank or a
similar reservoir. It pumps this water into the same locations (all headers) as the highpressure ECC. The medium-pressure phase ensures that enough water has collected in the
basement of the containment building before the next (recovery) phase starts.
In recovery injection, the medium-pressure ECC pumps are switched over to take water from
the sump in the basement. They pump this water through dedicated ECC heat exchangers
before returning it to the heat-transport system. This phase is the long-term heat sink.
Figure 41 shows the three phases schematically for a large LOCA.
Figure 41 Three phases of ECC
5.4.4 Other Functions
There are two further functions that ECC must perform: loop isolation and crash cooldown.
Loop isolation simply closes the valves connecting the two heat-transport system loops (for
some CANDUs which have two loops). It limits (most of) a LOCA to one loop. In addition, for a
LOCA with loss of ECC injection, loop isolation (which is an independent signal) limits the
possible source of hydrogen.
Reactor Safety Design and Safety Analysis
94
The Essential CANDU
Crash cooldown is more significant. If a break is small, less than, say, a feeder failure, it is not
able to depressurize the heat-transport system down to ECC pressure or to keep it below ECC
pressure once injection begins. Crash cooldown opens all the MSSVs on all the steam lines and
blows down the steam-generator secondary side to near atmospheric pressure over about 15
minutes. Because the steam generators are still a heat sink for the primary coolant in a small
LOCA, this forces the primary-side pressure down over the same time scale. Therefore, it
ensures that ECC is not blocked by the heat-transport pressure “hanging up” at secondary-side
pressure and that the unfailed loop will also be refilled by ECC. Some CANDUs (Darlington) use
high-pressure pumps for a small LOCA and are not as dependent on crash cooldown for this
purpose.
5.4.5 Initiation Signals
Clearly, ECC initiation must be automated. The basic signal is low heat-transport system pressure. By itself, this is not unique to a LOCA, and a spurious injection is costly due to heavy-water
downgrading, and therefore it is conditioned (ANDed) by one or more of high building pressure,
sustained low heat-transport system pressure, and high moderator level (the last is for an incore break). A separate signal isolates the loops (in some designs) on low pressure. Crash
cooldown is part of the ECC signal; however, because of its importance, recent designs have two
independent crash cooldown signals.
5.4.6 Reliability
As a safety system, the ECC must meet a demand unavailability of 10-3 or less. A running
unreliability of 10-2 over the three-month mission time has been used as a design target.
Availability will be better because fuel will heat up more slowly in the longer term if interruptions in ECC occur; hence, there may be time to repair the fault in ECC before further fuel
damage occurs.
5.5 Containment
The important aspects of containment are the following:
1.
2.
3.
4.
5.
6.
What is the design pressure?
What is the leak rate at design pressure?
How is pressure controlled? How is heat removed?
How is containment isolation ensured?
What is the containment reliability?
What other functions must containment perform?
5.5.1 Design pressure and leak rate
Containment is an envelope around those systems containing or potentially containing significant amounts of fission products and is designed to prevent their escape to the environment.
Of course any structure will leak, and the leak rate will increase with internal pressure. Typically, containment surrounds at least the reactor core and the primary heat-transport system.
The design pressure is chosen to be greater than the maximum pressure reached in any accident
Reactor Safety Design and Safety Analysis
Reactor Safety Design and Safety Analysis
95
for which a predictable degree of containment leak-tightness is a requirement. To determine
the design pressure, all design basis accidents which release significant radioactive material into
containment are analyzed, and the peak pressure reached in any one, plus some margin, is
chosen to be the design pressure. The important aspect of design pressure is that the leak rate
at the design pressure is known. In addition, for severe accidents [CNSC, 2008]:
“Containment maintains its role as a leak-tight barrier for a period that allows sufficient
time for the implementation of off-site emergency procedures following the onset of
core damage. Containment also prevents uncontrolled releases of radioactivity after this
period.”
This requirement may also affect the design pressure.
Leak rate is generally not selected independently in advance, but results from the construction
technique. If very low leak rates are required (≤0.2% / day at design pressure), a steel liner is
used.
Figure 42 Single-unit containment
For CANDU 6, for example (Figure 42), the design pressure is 124 kPa(g), and the leak rate at the
design pressure is 0.5% of the contained volume per day. Vacuum containments have lower
design pressures (because the vacuum building terminates the pressure rise), and (after the
initial short-term overpressure), leak rates are negative (inward) for several days; see Section
5.5.2. For the Darlington containment, for example, the design pressure is +96 kPa(g). The
normal operating pressure for the vacuum building is -96 kPa(g) [Huterer, 1984]. Typically, the
design pressure is set by the large LOCA because this both causes high short-term pressure and
has the potential to release fission products into the containment. The leakage rate at design
pressure is confirmed by proof testing before the plant is operational and by periodic testing
thereafter.
Reactor Safety Design and Safety Analysis
96
The Essential CANDU
Should the pressure exceed the design pressure, the building will not explode (typical safety
margins on massive failure of the building are a factor of about three over the design pressure;
see [Rizkalla, 1984], [Rizkalla, 1986]). However, the leak rate is harder to predict because the
leak area may increase. In particular the leak-tightness of any penetrations and seals above
design pressure is dependent on their detailed design and will need to be determined on a caseby-case basis. In any event, for an epoxy-lined containment, leakage would increase through
penetrations and cracks before the internal pressure reached failure pressure, and therefore it
would be very unlikely for the building to fail catastrophically.
5.5.2 Pressure control and heat removal
Without some means of removing heat, the containment pressure in an accident such as a pipe
break will rise rapidly as the broken system discharges steam and empties, then more slowly as
the decay heat is steamed into containment. It is possible to build a high-pressure containment
to withstand this, at least for some time. To date, CANDU containments have had some means
of short-term pressure suppression and/or some means of long-term heat removal to provide
for these two phases of an accident: the addition of pressure suppression enables a lower
containment design pressure.
Figure 43 Vacuum containment concept
Large nuclear stations in Ontario use multi-unit containment in which parts of the containment
envelope are shared among four or eight units. The individual reactor containment buildings
are all connected to a common vacuum building kept at very low pressure. Inside the vacuum
building is an elevated water tank; when a LOCA occurs, the vacuum valves open (self-actuated
on pressure differential), thereby connecting the vacuum building to the reactor building(s), and
the contents of the water tank are sprayed over the vacuum-building volume (Figure 43, from
Reactor Safety Design and Safety Analysis
Reactor Safety Design and Safety Analysis
97
[Morison, 1987]). The sprays are likewise self-actuated on the pressure differential caused by
the LOCA. The water sprays condense the steam and reduce the internal pressure. The containment pressure quickly goes sub-atmospheric and remains so for several days after an
accident, meaning that leakage is inward, not outward.
The single-unit CANDU 6 also uses pressure suppression (Figure 42). The sprays and the elevated water tank are located in the reactor building. There are six spray arms, each with spray
valves, arranged as two valves in series on each spray arm (to avoid a spurious douse). The
valves on three spray arms are pneumatically operated, and for diversity, the valves on the
other three are electrically operated. The containment building is made of pre-stressed, posttensioned concrete with an epoxy liner for leak-tightness. Dousing cycles on and off for small
breaks, but for large breaks, it remains on until the dousing water is used up and is all on the
basement floor of the reactor building. Dousing does not control pressure in the long term
because it is used up in the early part of an accident.
In the longer term, heat can be removed by containment air coolers. These require both water
and electrical power. Alternatively, low-flow sprays can also be used, with heat being removed
from the spray water by heat exchangers and the cooled water pumped back up to the spray
arms.
5.5.3 Isolation
In normal operation, containment is not a sealed system. Many fluid lines penetrate the building (e.g., steam lines, feed-water lines, service water lines, instrument lines). For CANDUs, the
building is normally ventilated for atmospheric temperature control, especially because personnel access to parts of the building is possible and required during operation. Some penetrations, particularly ventilation, could be pathways for release of radioactive material if an accident should occur, and therefore, on an accident signal, these are automatically isolated.
Steam, feed-water, and service-water lines are not isolated immediately in CANDU practice
because continuing to use a running system is more reliable than stopping it and starting up
another one. For LWRs, the opposite approach is taken due to a different philosophy of containment isolation [USNRC, 2013] and partly due to the reactivity increase on a steam-line break
in LWRs. However, main steam isolating valves (MSIVs) are used in recent CANDUs to prevent
leakage to the environment through a pre-existing steam-generator tube failure after an accident, but they are manually operated and slow. Feed water and service water are not normally
isolated.
5.5.4 Reliability
As a special safety system, the containment must meet a demand unavailability of 10 -3
years/year or less. Containment leak-tightness is tested every few years by pressurizing the
building and measuring the leak rate. This is an invasive and expensive test, and if the leak rate
exceeds the requirement, one must assume that a containment impairment has existed for half
the interval between tests. Therefore, on-line leakage monitoring systems are being deployed
in existing reactors. The containment isolation system is likewise tested during operation to
prove that its unavailability target is not being exceeded.
Reactor Safety Design and Safety Analysis
98
The Essential CANDU
5.5.5 Other functions
Containment also acts as a barrier to protect reactor systems from external events (tornadoes,
turbine missiles, aircraft crashes, and malevolent acts). These may impose additional design
requirements on the structure.
Hydrogen can build up in containment after an accident. After a LOCA, hydrogen is formed
slowly by radiolysis of the water circulating through the core. A severe accident such as a LOCA
plus loss of emergency core cooling can also produce hydrogen early on because of the chemical reaction between the hot fuel sheaths and the steam in the fuel channels (cf. Sections 3.2.2
and 3.2.3.2). The containment building promotes some mixing of hydrogen due to natural
circulation. Air cooler fans provide forced mixing. In addition, igniters are placed in various
rooms to burn any local hydrogen concentration before it can detonate. Passive autocatalytic
recombiners can be used for long-term hydrogen control; they do not need electrical power or
controls. They present a catalyst bed to the containment atmosphere, on which the hydrogen
recombines with oxygen. The heat of reaction causes a convection flow through the device,
which helps mix the containment atmosphere.
5.6 Monitoring
For most accidents, the plant state is monitored from the main control room (MCR), and the
safety functions of shutdown, heat removal, and containment can be performed from there.
Some accidents, however, can render the MCR uninhabitable or inoperable: for example,
earthquakes, fire in the MCR, hostile takeover, aircraft strikes, and high radiation fields. A
secondary control area (SCA) is provided for such eventualities; the operators relocate to the
SCA and can perform the required safety functions from there.
5.7 Problems
1.
Select an accident from the case studies discussed in Section 3 and analyze it in terms of
the five levels of defence in depth (both barriers and objectives). Which aspects were present?
Which were missing?
2.
Consider the ZED-2 reactor described in Section 2.7. What elements of defence in depth
are present in this design? What elements are missing? Why might it be acceptable to have
missing or weak levels of defence-in-depth?
3.
Using the SLOWPOKE 10MW heating reactor described in Section 2.7, describe the
possible shutdown-system requirements in terms of design, rate, depth, signals, margins,
environment, and independence. Give reasons—do not simply copy existing material.
4.
Using the ZED-2 zero-power research reactor described in Section 2.7, describe the
possible shutdown-system (moderator dump) requirements in terms of design, rate, depth,
signals, margins, environment, and independence. Give reasons—do not simply copy existing
material.
5.
Look up (e.g., from the USNRC web site) the design of either the EPR or AP1000 decay
heat-removal systems. Summarize them and discuss advantages and disadvantages compared
Reactor Safety Design and Safety Analysis
Reactor Safety Design and Safety Analysis
99
to the CANDU decay heat-removal systems (choose one CANDU plant for your comparison). If
you do not have access to CANDU information, simply compare EPR and AP1000 decay heat
removal systems.
6.
What are the options for heat removal from containment after a severe accident (core
damage)? What are the pros and cons of each of these options? Feel free to look up what
choices have been made by modern designs.
Reactor Safety Design and Safety Analysis
100
The Essential CANDU
6 Safety Analysis – Accident Phenomenology
This Section provides a high-level discussion of accident phenomena in CANDUs and how the
results are judged. The technical capabilities that computer codes used in CANDU safety
analysis should possess are then described. Severe accident phenomena and analysis are
summarized, followed by a discussion on uncertainty analysis.
6.1 Accidents by Phenomena
In Section 1.4, we described the hazards posed by a nuclear power plant and the broad classes
of events that could cause a release of radioactive material. In Section 2, we discussed how
design basis accidents are identified and selected. Based on these concepts, we can describe
accidents by major phenomena, as follows (grouped by primary or direct cause):
1. Reactivity accidents
Bulk loss of reactivity control
Loss of reactivity control from distorted flux shapes
2. Decrease of reactor coolant flow
Loss of Class IV power
Partial loss of Class IV power
Single pump trip or single pump seizure
3. Increase of reactor coolant pressure
Loss of primary pressure and inventory control (increase)
4. Decrease of reactor coolant inventory
Large heat-transport system LOCA
Small heat-transport system LOCA
- Single-channel events
- Single steam-generator tube rupture
- Multiple steam-generator tube rupture
Loss of primary pressure and inventory control (decrease)
5. Increase of secondary-side pressure
Loss of secondary-side pressure control (increase)
6. Loss of secondary-side heat removal
Main steam-line break
Feed-water line break
Loss of feed-water pumps
Spurious closure of feed-water valves
Loss of secondary-side pressure control (decrease)
Loss of shutdown heat sink
7. Moderator and shield-cooling system failures
Pipe break
Loss of forced circulation
Loss of heat removal
8. Fuel-handling accidents
Reactor Safety Design and Safety Analysis
Reactor Safety Design and Safety Analysis
101
Fueling machine on-reactor
Fueling machine off-reactor
Accidents in the irradiated fuel bay
Loss of heat removal
Loss of water
Severe core-damage accidents involving an initiating event and failure of at least two mitigating
systems fall into a separate category because the phenomena of severe core damage are not
strongly coupled to the initiating event. We will cover these later.
Safety analysis is the method by which we can show that the predicted consequences of a
postulated accident meet regulatory and design goals. It involves mathematical modelling of
the major systems in the plant to predict the behaviour of their components in an accident.
Typically, the focus is on:
Demonstrating that the physical barriers to release of radioactive material are not
further damaged, or have sustained only limited damage, beyond the initiating failure
Predicting on-site doses to ensure that credited operator actions are feasible in the
post-accident environment
Predicting dose to the public.
In general, in traditional safety analysis for CANDU, the mathematical models are best-estimate,
and pessimism is introduced by means of “conservative” assumptions and data. This raises the
issue of margins.
6.2 Margins
A discussion of margins must start by defining the essential physical barriers that need to be
preserved, or their degradation limited, to meet regulatory dose limits with confidence.
Typically, these barriers are the fuel matrix, the fuel sheath, and the heat-transport system
including the pressure tube, the calandria tube, and the calandria shell. To prevent failure of an
essential barrier, physically based quantitative parameter limits are chosen for each failure
mechanism—e.g., Tfuel < 2800°C is a parameter limit (no fuel melting) which will prevent one
mechanism of failure of the pressure-tube barrier through local strain. More conservative
surrogate criteria are chosen if the parameter limit is uncertain. Analysis limits are chosen to
ensure that the parameter limit or surrogate criterion is met. This framework, along with the
use of conservative assumptions and data in the safety analysis, gives the margin to the barrier
failure point, as shown in Figure 44.
Reactor Safety Design and Safety Analysis
102
The Essential CANDU
Figure 44 Margins
Of necessity, many assumptions about plant operation are made in safety analysis. These are
usually chosen to envelop actual or expected operation—for example, safety analysis will use a
maximum bundle power that is greater than that expected in operation. The plant must operate consistently with the assumptions in the safety analysis. The operators therefore define a
safe operating envelope (SOE) of parameters under operational control6. Operating the plant
within this envelope ensures consistency with the safety analysis assumptions and incidentally
provides another margin to the results of safety analysis. It is important that the safety analyst
not make assumptions that are too restrictive because this will unnecessarily limit operation.
Other methods of safety analysis are best estimate with analysis of uncertainties (BEAU), which
we will cover later, and best-estimate analysis, which is used for severe accidents.
6
In other countries, a set of Technical Specifications serves a similar purpose.
Reactor Safety Design and Safety Analysis
Reactor Safety Design and Safety Analysis
103
6.3 Major Computer Analysis Tools Required for DBAs
CANDU safety analysis requires a comprehensive suite of physical models. The mathematical
foundations of these models are presented in simplified form in Section 7. This section lists the
capabilities that these codes should have. A detailed description of individual codes is well
beyond the scope of this chapter; references are given to enable the student to investigate
further any codes of interest.
Reactor physics analysis requires a transient three-dimensional model, especially for larger
CANDU cores. The most demanding application is a large LOCA because the positive void
coefficient leads to relatively fast kinetics and because of the spatial effects associated with flux
tilts and shut-off rod (or liquid absorber) insertion. Three-dimensional effects are also important in slow loss of reactivity control starting from distorted flux shapes. Current codes used
[Roy, 2004] include
WIMS-IST, a two-dimensional lattice-cell code
RFSP-IST, a reactor code for CANDU full-core 3-D static and dynamic analysis
MCNP – a “Monte-Carlo” code which tracks large numbers of individual neutron histories to achieve an answer. The accuracy of the answer is limited only by the number of histories and the quality of the input data from experiments which measure
nuclear cross sections.
The system thermo-hydraulics code is typically a two-fluid, one-dimensional non-equilibrium
network code. The two fluids are water and steam; recent codes also incorporate a third noninteracting fluid, e.g., hydrogen, as produced in severe accidents. One spatial dimension suffices for CANDU because the system consists largely of linear flow in pipes (feeders, channels,
large pipes above the core) and there are no vessels in which complex three-dimensional
behaviour occurs. However, the flow in the headers can be quite complex, and tools based on
visualization tests are being developed to model it more accurately. The thermo-dynamic nonequilibrium aspect is important in modelling fuel rewetting and channel refilling after a LOCA
because the flow can be stratified (steam and water flowing separately due to the effect of
gravity) during that time, and each phase can have its own temperature and flow. Finally, a
network capability is clearly a necessity in CANDU, with its multiple parallel paths (e.g., many
channels are connected to one header, and ECC is connected through parallel paths to each
header). The reactor physics calculations must be coupled with the system thermo-hydraulics
code for a large LOCA because the voiding transient determines the power pulse, which in turn
has a second-order effect on the voiding transient. Current system thermo-hydraulic codes
used are CATHENA [Hanna, 1998] and TUF [Liauw, 1997].
Fuel thermo-mechanical models consist of a code for normal operation, which predicts the
initial fuel conditions before the accident (sheath strain, fuel-to-sheath heat-transfer coefficient,
fission gas release, initial fuel and sheath temperatures, etc.) and a transient thermomechanical code for accidents. The latter includes sub-models for fuel failure mechanisms due
to fuel-sheath strain, beryllium braze penetration, sheath embrittlement due to oxidation,
athermal strain, and excessive fuel energy content. Because of the need to predict the dose for
each accident, the models must be able to estimate the percentage of fuel sheaths that fail in
Reactor Safety Design and Safety Analysis
104
The Essential CANDU
an accident (if any) and the release of fission products to the fuel channel. Codes used include
ELESTRES-IST for initial fuel conditions and ELOCA-IST for transient behaviour [Lewis, 2009].
Under certain circumstances, such as a large LOCA combined with loss of ECC injection, the
pressure tube will overheat and (depending on the internal pressure) sag or strain into contact
with the calandria tube. This requires models of the pressure-tube thermal-mechanical transient behaviour to predict the extent of deformation and the pressure-tube temperature and
internal pressure when or if it contacts the calandria tube. Such models are now part of the
system thermo-hydraulics code.
The behaviour of a channel subsequent to such contact depends on the heat transfer from the
calandria tube to the moderator. Further deformation will not occur if the calandria-tube outer
surface does not dry out, or at least does not go into widespread film boiling. This in turn
depends on the heat transfer coefficient between the pressure tube and the calandria tube, and
the local moderator sub-cooling. For the first, there are theoretical models and comparisons
with experiment – see, e.g., [Currie, 1984] and [Currie, 1986]. For the second, a two- or threedimensional prediction of moderator temperatures (and hence flows) is required. Of most
interest is the steady-state distribution at the time of contact, although transient calculations
are required for in-core breaks. The current industry code is MODTURC-CLAS. See [Xu, 1999]
for a brief description of MODTURC-CLAS and a good summary of thermo-hydraulic codes used
in CANDU.
Following the release of fission products from the fuel, their movement through the heat
transport system to containment and then within containment should be predicted. To date,
CANDU safety analysis has not used models for fission-product transport within the HTS and for
deposition on surfaces such as end fittings and feeder piping, although this is clearly an area
which could be included and has been the subject of intensive R&D over a number of years.
However, the partitioning of fission products between steam and water phases at the break and
within containment has been modelled, as has long-term formation and transport of organic
iodides within and from the water pool. See [Wren, 1999] and [Wren, 2001].
The containment-pressure transient calculation uses the transient energy release from the
break and includes sub-models for dousing, containment air coolers, fission products, hydrogen
transport, and natural and forced circulation. Multi-node, multi-fluid (water, steam, air, hydrogen) three-dimensional containment models are used for this analysis. The GOTHIC international code is used for CANDU; see, e.g., [Andreani, 2010].
The final step is calculation of dose to the public. The atmospheric dispersion model typically
uses a Gaussian plume model to predict exposure as a function of distance from the station; the
input is the predicted transient release of radionuclides from containment for each accident.
See [Boss, 2006] for an example. The weather assumed is traditionally the worst weather
occurring more than 10% of the time at the site. Exposure-to-dose calculations use standard
ICRP-recommended conversion factors ([ICRP, 2010], [ICRP, 2012]).
Figure 45 shows this whole process as a flowchart.
Reactor Safety Design and Safety Analysis
Reactor Safety Design and Safety Analysis
105
Figure 45 Safety analysis codes
6.4 Code Validation and R&D
It is essential that the results of safety analysis codes reflect reality, or at least a version of
reality in which the predictive bias is understood. Extensive R&D is done to support safety
analysis codes, in facilities which range from small- to full-scale. The purpose of R&D is not to
simulate an accident, but to provide the fundamental scientific and engineering data against
which the codes can be validated (i.e., their results compared to experimental data). Experiments generate scientific knowledge relevant to the phenomena in a nuclear reactor accident.
This knowledge is used to build engineering models, which in turn are used in digital computer
codes. The codes are then validated against the knowledge (using different data from those
used to develop the models). The validation can include comparison against small-scale and
integral tests, as well as real nuclear power-plant transients where data are available. The
codes are also independently verified to confirm that the mathematical and engineering models
have been represented correctly in the code language logic. Finally the verified, validated codes
are used to prepare the safety and licensing analysis procedures for planned or operating plants
or to assist in the design of advanced plants. This process is shown schematically in Figure 46.
Reactor Safety Design and Safety Analysis
106
The Essential CANDU
Figure 46 Code validation process
Separate effects must be distinguished from integral tests. The former tend to focus on one
physical mechanism and are generally small-scale. Integral tests combine many phenomena
expected in the reactor and are generally large-scale; however, the interaction among the
phenomena can be complex. Hence, integral tests are used in the later stages of validation of
system models.
It is not possible within the scope of this Chapter to give a full accounting of all the R&D facilities that support CANDU safety technology. A few of the major facilities are discussed briefly.
References are given to enable the student to follow up on any facilities of interest.
6.4.1 Reactor physics
The ZED-2 reactor [AECL, 2011] was described in the problem set in Section 2.7. It is a heavywater tank reactor used for fundamental physics experiments on natural uranium and advanced
CANDU fuels and lattices. It is used for measurements of reactivity coefficients such as coolant
void and temperature, and generates basic data for validation of physics codes. At the other
end of the scale, real plant transients such as shutdowns are used to validate some aspects of
CANDU kinetics at full scale.
6.4.2 Thermo-hydraulics
The major integral facility used for validation of system thermo-hydraulic codes is RD-14M,
shown in Figure 47 [Buell, 2003]. It is a full-elevation model of a typical figure-of-eight CANDU
reactor heat-transport system, at full pressure and temperature conditions, and with ten fulllength electrically heated channels. All HTS components are simulated: channels, end-fittings,
feeders, headers, and steam generators. Mass flux, transit times, and pressure and enthalpy
distributions are similar to CANDU. Tests cover all phases of a large or small LOCA scenario,
including blowdown and refill, natural circulation in single-phase and two-phase, and loss of
Reactor Safety Design and Safety Analysis
Reactor Safety Design and Safety Analysis
107
shutdown cooling.
6.4.3 Fuel
Separate-effects fuel testing is performed out-of-reactor. For integral tests, the NRU reactor has
a vertical in-core loop that can be loaded with CANDU fuel elements and subjected to a LOCA
(Blowdown Test Facility). Fuel behaviour during extended post-dryout operation has also been
studied in the NRU loops.
Figure 47 RD-14M schematic
6.4.4 Moderator thermo-hydraulics
The moderator thermo-hydraulic codes have been validated against a wide variety of tests,
ranging from pseudo-two-dimensional “slices” of a model calandria to in-reactor probes. The
most sophisticated experiments have taken place at Chalk River Laboratories in the Moderator
Test Facility, which is a one-quarter scale CANDU calandria containing 480 heaters to represent
the 480 channels in the Bruce/Darlington design. The facility can measure a grid of local temperatures and local flow velocities in three dimensions.
Reactor Safety Design and Safety Analysis
108
The Essential CANDU
6.4.5 Fuel channel thermo-mechanical behaviour
One of the advantages of the pressure-tube concept is that channels can be tested at full
diameter. The phenomena exhibited during pressure-tube strain to contact the calandria tube
(for large LOCA, or LOCA + LOECC) have been examined using full-diameter channels, in which
the pressure-tube is internally heated and expands under pressure. The entire pressure tube /
calandria tube assembly is immersed in a water environment which represents the moderator
(Figure 48) [Sanderson, 2003].
Figure 48 Contact boiling tests
By controlling the internal pressure, heating rate, and moderator temperature, a map can be
derived of the regions of heat transfer on the outside of the calandria tube just after pressuretube contact (Figure 49), which can be used to validate the channel thermo-mechanical codes.
Reactor Safety Design and Safety Analysis
Reactor Safety Design and Safety Analysis
109
Figure 49 Heat-transfer regimes on outside of calandria tube
6.4.6 Containment thermo-hydraulics
Three large-scale facilities have been used to validate containment codes, particularly hydrogen
behaviour (combustion and detonation characteristics and limits) [Krause, 2007].
The Large-Scale Containment Facility at Chalk River Laboratories has a room height of 10 metres
with a total volume of ~1,575 m3. It is used for studying hydrogen mixing behavior at high
temperature and high humidity, using helium as a hydrogen simulant. It is also used to study
the behaviour of wet aerosols (Figure 50).
The Large-Scale Vented Combustion Facility at Whiteshell (Figure 51) is a rectangular enclosure
with an internal volume of 120 m3 used for studying hydrogen burning in air/steam mixtures at
various temperatures. The combustion chamber can be subdivided into two or three compartments, with vent openings of various sizes between the compartments and the outside.
The Containment Test Facility at Whiteshell has also been used to investigate combustion
phenomena in single and interconnected vessels, including detonation and the transition to
detonation. It consists of a 6 m3 sphere and a 10 m3 cylinder, which can be connected by ducts
(Figure 52).
Reactor Safety Design and Safety Analysis
110
The Essential CANDU
Figure 50 Large-scale containment facility
Figure 51 Large-scale vented combustion facility
Reactor Safety Design and Safety Analysis
Reactor Safety Design and Safety Analysis
111
Figure 52 Containment test facility
6.5 Selection of Initial Conditions
A number of key parameters are chosen in a “conservative” direction for licensing analysis.
These include fundamental core property parameters, initial plant conditions, system performance measures, and assumptions on the unavailability of portions of mitigating systems. There
is no magic formula for doing this: too much conservatism may require unnecessary design
changes or severely limit operation; too little may not cover uncertainties in the models used or
the station parameters. This dilemma is largely resolved by a BEAU approach, discussed later, in
which all parameters are set at their best-estimate values and the uncertainties are combined
and propagated through the calculation.
Table 11 gives a sample list of parameters and assumptions and how they might be chosen
“conservatively”. Note that what is conservative in one application (e.g., minimizing the number of containment coolers credited in calculating peak containment pressure) may be nonconservative in another (calculating high containment-pressure trip effectiveness). Note also
that whatever safety analysis assumptions are made become limits to operation.
Reactor Safety Design and Safety Analysis
112
The Essential CANDU
Table 11 Some conservative assumptions and parameters
Parameter
Conservative Direction Rationale
Reactor thermal power
High
Reactor regulating system
Normal operation or Choose so as to delay
inactive, whichever is reactor trip
worse; setback is
generally not credited
unless it tends to
“blind” the trip
Minimize time to use
up
cooling water
inventory,
minimize
margins to critical heat
flux, etc.
Radionuclide operating load in the Highest
permissible Maximize radionuclide
HTS
operating
iodine release from station
burden (and associ- and public dose
ated noble gases) plus
any “spiking” at the
time of reactor shutdown, and end-of-life
tritium concentration
Pressure-tube radial creep
Steam generators
Steam-generator tube leak rate
Highest expected over
the time scale over
which
the
safety
analysis is to be valid
Reduce margin to
critical heat flux (due
to flow by-pass around
the fuel bundle in a
crept
tube)
and
increase value of void
reactivity
Clean and fouled cases Reduce reactor trip
effectiveness
Maximum permitted Increase radioactive
during operation, plus material release
assessment of any
consequential effects
due to the accident
Reactor Safety Design and Safety Analysis
Reactor Safety Design and Safety Analysis
113
Parameter
Conservative Direction Rationale
HTS flow
Low
Reduce margins
critical heat flux
HTS instrumented channel flow
High
Reduce low-flow trip
effectiveness
Coolant void reactivity coefficient
High;
Maximize
transient;
Low
Delay
HTS
pressure trip
Equilibrium;
Maximize fuel temperatures, radioactive
material releases;
Fuel loading
Fresh
Maximize
transient
to
overpower
high-
overpower
Shutdown system
Back-up trip on less Delay
shutdowneffective
shutdown system effectiveness
system using the last
of three instrumentation channels to trip
SDS2 injection nozzles
Most effective nozzle Reduce
unavailable
system
depth
SDS1 shut-off rods
Two most effective Reduce
shutdown
rods unavailable
system
reactivity
“bite” and depth
Maximum channel/bundle power
High
shutdownreactivity
Earliest time to dryout
and maximize fuel and
sheath temperature
Reactor Safety Design and Safety Analysis
114
The Essential CANDU
Parameter
Conservative Direction Rationale
Reactor decay power
High
Minimize time to use
up
cooling water
inventory
Initial flux tilt
High
Maximize fuel and
sheath temperatures
Moderator initial local maximum Low
sub-cooling
Minimize margin to
critical heat flux on
calandria tube
Number of operating containment Low;
air coolers and other heat sinks
Maximize containment
pressure;
High
Delay
high-pressure
trip and maximize
likelihood of hydrogen
combustion due to
rapid condensation of
steam
Containment leak rate
High (typically 2× to Maximize public dose;
10× design leak rate);
Low
Maximize containment
pressure
Containment by-pass leakage
Pre-existing
steam- Maximize public dose
generator tube leak
Weather
Least
dispersive Maximize public dose
weather
occurring
>10% of the time
Reactor Safety Design and Safety Analysis
Reactor Safety Design and Safety Analysis
115
Parameter
Conservative Direction Rationale
Operator actions
Not credited before 15 Ensure adequate time
minutes after a clear for diagnosis
indication
of
the
event, for actions that
can be done from the
control room; and not
credited before 30
minutes, for actions
that must be done “in
the field”
6.6 Accident Walk-Through: Large LOCA
As an example, we shall walk through the phenomena of a large HTS pipe break. Then we will
cover more briefly a few more accidents which are representative, but not exhaustive.
6.6.1 Initiating event
A large LOCA in a CANDU is conventionally defined as one where the break area is larger than
twice the cross-sectional area of the largest feeder pipe. Therefore, a large LOCA can be located
only in the large piping above the core. There are three representative locations (Figure 53):
reactor inlet header (RIH), reactor outlet header (ROH), and pump suction line (PSH). Other
possible locations are lines connected to the pressurizer, the shutdown cooling lines, and the
header interconnect lines.
It is conventionally assumed that the pipe break is instantaneous, an assumption which bears
little relationship to reality, but is selected to ensure conservatism in that it maximizes the
predicted coolant voiding rate and hence the coolant void-reactivity insertion and reactor
power pulse. This in turn presents the greatest challenge to shutdown-system effectiveness.
Reactor Safety Design and Safety Analysis
116
The Essential CANDU
Steam Generators
HTS Pumps
1) Pump Suction
Feeders
2) Inlet Header
Reactor/Fuel Channels
3) Outlet Header
Figure 53 HTS layout
6.6.2 Event sequence (simplified)
7
A large HTS pipe break is postulated to occur instantaneously.
Steam discharges to containment, causing a rise in containment pressure and temperature.
HTS pressure drops rapidly, causing a rapid decrease in local saturation temperature.
Fuel channels downstream of the break experience flashing (rapid boiling). Fuel sheaths
may dry out.
The reactor power rises quickly due to the positive void coefficient, causing a rapid increase in fuel and sheath temperatures. Note that there are inherent limits to the speed
of voiding, which are set by the subdivision of some CANDUs7 into two separate PHTS
loops, by the fluid inertia in the fuel channels, and by the arrangement of each loop of
the PHTS in a “figure-of-eight” configuration. For further reading on this topic, see
[Popov, 2013].
Flow in the downstream channels falls due to the change in pressure drop across the
channel (the pressure gradient from the pumps is offset by the pressure gradient due to
the break).
The reactor is shut down by either shutdown system (~2 sec).
Containment ventilation paths are isolated.
The fluid inventory in the channels decreases and flow remains low, so that fuel and fuel
sheaths continue to rise in temperature. The rise is limited by steam cooling.
Pickering A and B, CANDU 6, and Darlington
Reactor Safety Design and Safety Analysis
Reactor Safety Design and Safety Analysis
117
Fuel overheating increases the gas pressure inside the sheath relative to the coolant
pressure, which is falling, and can force the sheath to strain. Some fuel sheaths may fail.
The temperature excursion depends on the break size, which is traditionally chosen to
“stagnate” the flow in the downstream channels, e.g., 30%-40% RIH breaks8 in Figure 54.
Figure 54 Core flow vs. break size for a group of channels
Containment dousing is initiated and starts to reduce containment pressure. In multiunit sites with a common vacuum building, valves to the vacuum building open, and
pressure starts to go sub-atmospheric.
ECC injection is signaled at about 20 seconds. Valves on the gas tanks open to drive water from the accumulator tanks into the HTS (or high-pressure ECC pumps start). Steamgenerator rapid (“crash”) cooldown is also initiated automatically, and the MSSVs open
to discharge secondary-side steam to atmosphere.
Fuel temperatures stabilize and fall as the headers, and then the channels, refill.
After the initial injection phase, ECC switches to medium-pressure and then to lowpressure ECC, in which the water from the break is recovered from the building sumps,
cooled, and re-injected. This gives a stable end-state which can last for months.
The time scale is shown in Figure 55.
8
The percentage is twice the cross-sectional area of the pipe; hence, a 100% break is twice the cross-sectional
area, allowing for discharge of coolant from both ends of the broken pipe. Note that other breaks may also
stagnate at different times; which one results in the highest fuel and sheath temperatures is determined by
analysis.
Reactor Safety Design and Safety Analysis
118
The Essential CANDU
Figure 55 Typical LBLOCA timescale
A typical containment-pressure transient for CANDU 6 is shown in Figure 56. The pressure rises
rapidly and is suppressed by dousing sprays. In the long term, the air coolers (and heat removal
by ECC) stabilize the pressure. This is quite different behaviour from a vacuum containment,
which will go sub-atmospheric once the valves to the vacuum building open and will stay subatmospheric for days.
Reactor Safety Design and Safety Analysis
Reactor Safety Design and Safety Analysis
119
Figure 56 Containment pressure transient for 100% ROH LOCA
6.6.3 Barrier protection
For a LBLOCA, recall that some sheaths may fail, but that the amount of failure must be limited.
The fuel barrier may be degraded, but not to the extent that it jeopardizes the pressure-tube
barrier. The pressure-tube barrier and the containment barrier must not fail. Further failures in
the HTS barrier must be prevented. Moreover, systems which protect these barriers must not
fail. This gives rise to the following requirements (simplified—this is not a complete list) for
barrier protection, which the safety analysis must demonstrate:
Fluid from the broken pipe will create jet forces, and reaction forces can cause pipe
whip. The effect of these forces on other HTS pipes, on the shutdown systems, on ECC
pipes, and on containment must not lead to further barrier failures.
Continued fuel heating after reactor trip gives a potential for sheath failure due to excessive sheath strain or sheath embrittlement, and for channel flow area reduction due to
sheath strain. Sheath failures must be limited to meet public dose limits; sheath failure
modes such as embrittlement or severe channel-flow blockage must be prevented to
protect the pressure-tube barrier (i.e., to maintain coolable bundle geometry).
Fuel melting must be prevented to protect the pressure-tube barrier.
Pressure tubes may overheat and strain or sag until they contact the calandria tube.
Failure of the pressure tube before contact with the calandria tube must be prevented.
After contact, heat transfer to the moderator must be sufficient to prevent failure of the
channel barrier.
The containment barrier and its internal structures must not be jeopardized by excessive
internal pressure.
Reactor Safety Design and Safety Analysis
120
The Essential CANDU
These requirements for barrier protection can be translated into analysis limits, as discussed
earlier. A detailed list of analysis limits is outside the scope of this Chapter.
6.6.4 A note on reactivity coefficients
A large LOCA is the limiting accident in terms of shutdown-system speed. This is due to the
positive void coefficient, and more specifically to the rapidity with which void is produced in a
large LOCA. CANDU has sometimes been criticized for its positive void coefficient; by contrast, a
LOCA in an LWR shuts the reactor down due to loss of the common coolant/moderator. However, a broader perspective is more useful. The following discussion is taken from [Popov, 2012]
and [Popov, 2013].
As discussed in Chapters 4 and 5, reactivity coefficients measure the amount of change in
reactivity per unit of change in the parameter of interest, while other parameters are kept
unchanged.
We shall develop three themes:
all reactors have mechanisms to add positive reactivity
reactivity changes can be slow or fast
the reactivity changes of most interest to safety are those that are large and fast.
The sign of a reactivity coefficient is less important because the parameter can always be reversed.
The first theme is readily apparent: addition of positive (and negative) reactivity through control
rods, for example, is essential in power-reactor operation. Inherent reactivity feedback from
fuel temperature, coolant density, moderator density, etc. (see Chapters 4 and 5) can also
introduce positive reactivity, with the details depending on the reactor design and the direction
in which the particular parameter is changing.
As for the second theme: the speed of reactivity feedback in an accident determines the required countermeasures. Slow reactivity changes are relevant for normal operation in different
reactor states and are introduced in the reactor core by: a) burnup and refueling, b) planned
control-device movement, and c) xenon changes in the core during operation. In CANDU,
fueling is done on-line, and therefore the control system does not have to compensate for fuel
burnup. In other words, the reactivity worth of control devices is small (the total worth for all
devices together is 32 mk, and each device is typically worth less than a mk – see Chapters 4
and 5). Reactivity addition from control devices is inherently slow because they are not subject
to pressure-assisted ejection. In PWRs, fueling is done in batch mode (about every 18 months),
and the excess initial reactivity after fueling is suppressed by a combination of poison in the
coolant and fuel, and insertion of control rods. As a result, control rods may have high individual reactivity worth. A typical PWR has a total worth of all control rods of about 110 mk, and
the maximum worth of a single rod (using the Westinghouse Advanced Passive 1000 (AP 1000)
PWR as an example) can be of the order of 7.5 mk under the most pessimistic conditions (hot
zero power in a core just about to be refueled) [Westinghouse, 2011]. This is larger than the
delayed neutron fraction, and therefore rod ejection assisted by coolant pressure can result in
prompt criticality. This means that whereas in normal operation, control rods add reactivity
Reactor Safety Design and Safety Analysis
Reactor Safety Design and Safety Analysis
121
slowly, in an LWR accident, reactivity can be added very quickly.
Fast reactivity changes are of interest in accidents. These are induced by fast changes in parameters such as: a) coolant and moderator volume, temperature, or density, b) fuel temperature, c) location of reactivity devices, or d) reactor core geometry. As discussed in Chapters 4
and 5 and in our “lessons learned” from the SL-1 accident (Section 3.1.1.3), the response to a
large and fast reactivity addition depends on (1) the reactivity added compared to the delayed
neutron fraction , and (2) the prompt neutron lifetime lp. PWRs and CANDUs have similar
delayed neutron fractions: from 0.0054 to 0.0073 mk in a PWR, depending on core burnup, and
0.0053 for an equilibrium-core CANDU. However, the prompt neutron lifetimes are very different. For a PWR, lp is typically 20–30 μs; for a CANDU, lp is about 900 μs, or 30–45 times longer
than in a PWR: because heavy water does not absorb neutrons as much as light water, neutron
lifetime in CANDU reactors is much longer.
Figure 57 shows the relationship between reactivity ρ and reactor period for various values of
prompt neutron lifetime (adapted from [Glasstone, 1994]). For ρ << β, the period for CANDU
and PWR reactors for the same reactivity insertion is approximately the same. As ρ approaches
β, the period for PWR reactors decreases sharply, whereas for CANDU, it also decreases, but
fairly smoothly. For ρ > β, the period for PWR reactors is about 40 times shorter (i.e., faster)
than for CANDU. Figure 57 also shows typical values of reactivity changes during certain accident classes for a PWR and a CANDU reactor, as shown by the coloured areas.
From [Popov, 2012]:
“Consider the fastest reactivity accident in PWR, i.e., rapid ejection of the largest-worth
control rod in a PWR. Using the value of 7.5 mk for “worst” rod worth, the reactor period can be estimated of the order of a hundredth of a second following rod ejection. It
is not practically possible for engineered shutdown systems to stop such a fast rate of
rise in power. For PWRs, it is not necessary to have such fast shutdown system because
of a strong negative fuel temperature coefficient. Hence, PWRs can partly mitigate this
event through negative feedback, but engineered shutdown is still required after the initial transient”.
Consider now the fastest reactivity accident in CANDU: the large LOCA. Since there are
inherent physical limits to the speed and extent of channel voiding, the net result is that
the maximum rate of reactivity addition is approximately 4 mk/sec, and the reactor period is about one second or so. At that rate of reactivity insertion, engineered shutdown
systems can be reliably designed to terminate the power rise.”
Current CANDU safety analysis does not predict prompt criticality for a large LOCA, but even if it
did, the period would not change dramatically. Prompt criticality is not the threshold of a
sudden change in behaviour for a CANDU.
Reactor Safety Design and Safety Analysis
122
The Essential CANDU
Figure 57 Response of PWR and CANDU to reactivity increase
As for the third theme: ideally, all accidents would induce negative reactivity feedback. However, this is not possible because a large negative coefficient in one event can become a large
positive one for the complementary event. In other words, for every physical change that
produces a negative reactivity effect, the opposite change produces positive reactivity. For
example, insertion of a control rod produces negative reactivity; withdrawal (or ejection) of a
control rod produces positive reactivity. Likewise, for a reactor with a positive coolant void (or
density) coefficient, a decrease in coolant density produces a positive reactivity, whereas void
collapse gives a negative reactivity. Conversely, if the coolant void reactivity is negative, a
decrease in coolant density produces negative reactivity, whereas void collapse gives positive
reactivity.
Table 12 compares the size and sign of reactivity coefficients in PWR and CANDU.
Reactor Safety Design and Safety Analysis
Reactor Safety Design and Safety Analysis
123
Table 12 Reactivity effects in PWR and CANDU
Reactivity Effect
Fuel
temperature
increases
Fuel
temperature
decreases
Coolant voids
PWR
Large Negative
(-0.023 to -0.029 mk/oC)
Large Positive
(+0.023 to +0.029 mk/oC
Large Negative
(-2.5 mk/% void)
Coolant void collapses
Positive
(+2.5 mk/% void)
Coolant temperature Negative
increases
(-0.09 mk/°C at BOC to 0.54 mk/°C at EOC)
Coolant temperature Positive
decreases
(+0.09 mk/°C at BOC to
+0.54 mk/°C at EOC)
CANDU
~0
~0
Large Positive
(+0.15 mk/% void)
Negative
(+0.15 mk/% void)
Small Positive
(+0.04 mk/°C)
Small Negative
(-0.04 mk/°C)
We can now summarize the impact on
safety of the speed of reactivity feedback
and the size and sign of reactivity coefficients:
Only reactivity coefficients driven
by fast phenomena are highly important to safety; if the phenomenon driving a coefficient
acts slowly, whatever its sign or
size, its impact can easily be comFigure 58 Importance of reactivity effects
pensated for by reliably engineered reactivity control and
shutdown mechanisms.
The size of the reactivity coefficient is clearly important to safety because it determines
the magnitude of inherent effects and the performance of the engineered systems that
must control or compensate for them. Generally, a small reactivity coefficient is not important because the amount of compensation needed is also small, regardless of the
sign or speed. Conversely, a large reactivity coefficient is important, regardless of the
sign.
The sign of a reactivity coefficient is less important to safety because the physical
mechanism can almost always be reversed, as discussed above.
This concept is illustrated in Figure 58.
The use of inherent and engineered safety defences in PWRs and CANDU is summarized for
Reactor Safety Design and Safety Analysis
124
The Essential CANDU
some typical accidents in Table 13. Relevant coefficients are shown in brackets.
Table 13 Examples of reactivity response to accidents for PWR and CANDU
Accident
Large LOCA
PWR
Power decrease, ECC boration required in
medium term to ensure shutdown
(void reactivity coefficient, fuel temperature
reactivity coefficient)
CANDU
Rapid power increase
terminated by engineered shutdown
(void
reactivity
coefficient)
Cold-Water
Power increase, terminated by a combination Power
decrease
Injection
of inherent feedback and engineered shut- (coolant temperature
down, e.g., boron addition
and void reactivity
(moderator/coolant temperature and fuel coefficients)
temperature reactivity coefficients)
Main Steam-Line Power increase, terminated by a combination Power
decrease,
Break
of inherent feedback and engineered shut- engineered shutdown
down; possible return to criticality termi- required in medium
nated by boron addition
term
(moderator/coolant temperature and fuel (coolant temperature
temperature reactivity coefficients)
and void reactivity
coefficients)
Control-Rod
Rapid power increase with local power Not physically possiEjection
peaking terminated by combination of ble
inherent feedback and engineered shutdown
(delayed neutron fraction, moderator/coolant
temperature, and fuel temperature reactivity
coefficients)
For further information, a detailed and quantitative comparison of power transients in LWRs
and CANDUs has been given by Meneley and Muzumdar in two papers. The first [Meneley,
2009] gives an overview comparison of positive reactivity insertion accidents, whereas the
second [Muzumdar, 2009] looks specifically at large LOCA events in CANDU. These papers are
recommended reading for those wishing to understand further the safety differences and
similarities between the two reactor concepts.
6.7 Accident Walk-Through: Small LOCA
6.7.1 Initiating event
A CANDU has much more small-diameter piping than large-diameter piping because of the large
number of parallel channels, each served by an inlet and outlet feeder. A break in any of these
pipes (or a similar-sized break in the larger pipes) is considered a small LOCA. This includes a
Reactor Safety Design and Safety Analysis
Reactor Safety Design and Safety Analysis
125
break in a steam-generator tube.
6.7.2 Event sequence (simplified)
Generally, the event sequence is similar to a large LOCA, but much extended in time. The rate
of rise of void reactivity is slow enough to be compensated for by the control system, and
therefore shutdown systems are triggered on process trips (see Table 8) rather than neutronic
trips. Typical time scales are a few minutes before the ECC set-points are reached, and similarly
the high-pressure and medium-pressure ECC phases are prolonged.
For a steam-generator tube break, the radionuclides contained in the HTS coolant can be
released outside containment. The break must be isolated in the longer term because the
water lost through the steam generator is unrecoverable. Because the discharge is small, the
operator has enough action time to perform HTS cooldown and steam-generator isolation.
Back-flow of (light) water from the secondary side to the primary side, after the latter has been
cooled down and depressurized, causes negative reactivity and is not a safety concern. Recent
CANDUs have manually operated main steam isolation valves which can be used as one of the
means to isolate the affected steam generator in the longer term.
6.7.3 Barrier protection
Because a small LOCA may occur during the station lifetime, the safety systems are designed to
prevent fuel-sheath failure both before reactor trip (to limit the period of pre-trip overheating
due to dryout as the channels void) and afterwards, during ECC.
6.8 Accident Walk-Through: Single-Channel Event
6.8.1 Initiating event
The channel nature of the CANDU design means that certain accidents can affect one channel
only, e.g., partial or complete flow blockage due to a foreign object in the HTS, a pressure-tube
failure (which may or may not lead to a calandria-tube failure), a break in an individual feeder
pipe, or assumed failure of the pressure-tube-to-end fitting rolled joint, which can cause an
end-fitting ejection.
6.8.2 Event sequence (simplified)
The last three initiating events listed above behave like a small LOCA as far as the heat-transport
system is concerned. The safety systems (shutdown, ECC, and containment) are triggered on
small LOCA signals. Flow blockage may not result in a channel failure; for blockages up to about
95% of the channel flow area, the fuel in the channel may fail and could be badly damaged, but
the pressure tube will not fail. For more severe blockages, the fuel will melt, and the channel
will fail.
Each type of single-channel event has certain unique characteristics in addition to those of a
small LOCA. These characteristics are the focus of the safety analysis for these events.
A break in an inlet feeder of exactly the right size to cause the flow to stagnate tempoReactor Safety Design and Safety Analysis
126
The Essential CANDU
rarily in a channel can result in channel overheating and failure.
Any event which leads to channel failure will cause a discharge of the HTS into the moderator. Besides pressurizing the calandria, the discharge can dilute any poison in the
moderator used for reactivity suppression, as discussed in Section 5.2.3.
The jet and pipe-whip forces from an in-core break can damage a limited number of
shut-off rod guide tubes, as discussed in Section 5.2.7.
A severe flow blockage or feeder stagnation break can also cause discharge of molten
fuel into the moderator.
An end-fitting failure can cause discharge of the fuel in the channel into the reactor vault
(i.e., directly into the containment).
6.8.3 Barrier protection
A fundamental safety requirement of a channel reactor is that a single-channel failure must not
propagate to other channels; otherwise, a relatively benign and moderate-frequency initiating
event could cascade to become a severe core-damage accident. This conclusion has been
supported for CANDU by years of R&D and code development.
Shutdown depth must remain adequate, accounting for damaged shut-off rod guide tubes.
Moderator pressure increases after an in-core break due to the discharge of high-enthalpy fluid
into the moderator. The pressure is relieved by discharge through the four calandria relief
pipes, which are designed to prevent structural failure of the calandria shell. Recent work
continues to support this conclusion even when significant amounts of molten fuel have been
ejected into the moderator after a severe flow blockage.
6.9 Accident Walk-Through: Loss of Reactivity Control
6.9.1 Initiating event
A malfunction in the reactor regulating system (RRS) is assumed to drain zone controllers, drive
out absorber/adjuster rods, or both. Two types of accidents are considered: continued increase
in reactivity at up to the maximum possible rate and to the maximum degree allowed by the
physical configuration of the devices; and a slow power increase from both normal and distorted flux shapes that terminates just below the overpower trip set-points.
6.9.2 Event sequence (simplified)
An increase in reactor power causes a flow/power mismatch which has the potential to damage
the fuel. If the ramp is continuous, shutdown-system bulk overpower trips can be designed to
prevent fuel damage.
However, an increase in power from a distorted flux shape, which is either very slow or stops at
an elevated power, could permit fuel to remain in a dryout condition even if the bulk reactor
power is below the average overpower trip set-point. Analysis of such events determines the
trip set-points for the spatially distributed regional overpower (ROP) flux detectors on each
shutdown system.
Reactor Safety Design and Safety Analysis
Reactor Safety Design and Safety Analysis
127
6.9.3 Barrier protection
As with a small LOCA, because loss of reactivity control may occur during the station lifetime,
the shutdown systems are designed to prevent sheath failure.
6.10 Accident Walk-Through: Loss of Forced Circulation
6.10.1 Initiating event
Loss of Class IV electrical power to the HTS pumps causes them to run down and eventually
stop. Partial loss of forced circulation is also possible; particular cases include a partial loss of
Class IV power (to two HTS pumps), a single HTS pump shaft seizure, and a single pump trip.
6.10.2 Event sequence (simplified)
The flow reduction causes a mismatch between reactor power and coolant flow that can lead to
fuel overheating and HTS pressurization. The power mismatch also causes void formation in the
channels, leading to an increase in reactor power. This initial phase is terminated by a reactor
trip. In the long term, the fuel decay heat is removed by thermo-siphoning to the steam generators until an alternate heat sink (such as shutdown cooling) can be initiated.
6.10.3 Barrier protection
Because this is an event that is expected to occur during the station lifetime, the shutdown
systems are designed to prevent sheath failure and to limit the stress levels in the HTS due to
overpressure. Ideally, the fuel temperature excursion should be limited enough that plant
operation can be resumed without the need for a fuel inspection.
6.11 Accident Walk-Through: Loss of Secondary-Side Heat Removal
6.11.1 Initiating event
We give a particular case as an example: failure of one of the main steam lines inside or outside
the reactor building (or the steam balance header) on the secondary side. This accident is more
limiting than feed-water line failures or loss of feed-water pumps.
6.11.2 Event sequence (simplified)
A large steam line break causes a rapid depressurization of the affected steam generator and of
the remaining steam generators as well because they are connected at the balance header.
Initially, depressurization of the secondary side causes a corresponding depressurization and
cooling of the primary side because of enhanced heat transfer through the steam-generator
tubes; this causes negative reactivity and power decrease and is not a safety concern. The
reactor will trip early in the accident on signals such as high containment pressure (if applicable9), low steam-generator level, or low feed-water line pressure. As the steam generators lose
9
For Bruce and Darlington, the steam line runs entirely outside the containment boundary.
Reactor Safety Design and Safety Analysis
128
The Essential CANDU
inventory, heat removal from the heat-transport system degrades, and the operator is required
to initiate an alternate heat sink such as the shutdown cooling system. Note that because the
shutdown cooling system is a high-pressure heat-removal system, the operator does not need
to depressurize the HTS before initiating this alternate heat sink in emergencies.
6.11.3 Barrier protection
The safety assessment must demonstrate that three key requirements are met:
The operator has enough time to initiate an alternate heat sink and maintain fuel-sheath
integrity.
For main steam-line breaks outside containment, in the turbine hall, one must assess the
design to show that equipment which is required and assumed to mitigate the event (if
located in the turbine hall) is not damaged by the forces, the steam, or the high temperature caused by the break, nor is there damage to the turbine-hall structure.
For main steam-line breaks inside containment, the containment pressure rises rapidly,
and an additional safety aspect is the preservation of building integrity, including the integrity of reactor-building internal structural walls. For new reactor designs, it is a requirement that the peak containment pressure be below design pressure.
Large steam-line breaks are limiting in terms of early containment peak pressure and time
available to introduce an alternate heat sink. Small steam-line breaks test the trip coverage and
(for designs where part of the steam line is within containment) can lead to long-term containment pressurization after the containment dousing water has been exhausted.
6.12 Accident Walk-Through: Fuel-Handling Accident
6.12.1 Initiating event
A fueling machine carrying spent fuel may be either on the reactor (attached to a channel), or
off the reactor (in transit to the spent-fuel port, or attached to the spent-fuel port and discharging fuel). The spent fuel must be kept cooled, and hoses are attached to the fueling machine
through which high-pressure D2O cooling water is pumped. Should one or more hoses fail, the
integrity of the contained fuel is threatened. The consequences to the reactor of a failure of a
fueling machine on-reactor (e.g., spurious detachment from a channel) are broadly similar to
those of a single-channel event, except that more fuel bundles may fail.
6.12.2 Event sequence (simplified)
Assume that the fueling machine is off-reactor. Following loss of coolant through severance of
one or more hoses, the D2O inventory in the fueling machine will boil off, the bundles will be
uncovered, and fuel may fail, releasing fission products to containment.
6.12.3 Barrier protection
A fueling-machine failure when off-reactor cannot be mitigated by reactor shutdown or ECC;
the only relevant safety system is containment, so that the safety analysis focuses on fission
product release from the fuel bundles and containment effectiveness.
Reactor Safety Design and Safety Analysis
Reactor Safety Design and Safety Analysis
129
6.13 Accident Walk-Through: Loss of Moderator Inventory or Heat Removal
6.13.1 Initiating event
Moderator system failures include moderator pipe break, loss of forced circulation, and loss of
heat removal.
6.13.2 Event sequence (simplified)
The moderator does not contain fission products, but does contain activation products (tritium).
Failures in the moderator system can therefore release tritium to containment and cause flux
distortions if the moderator level falls, leading potentially to excess power in some reactor fuel
channels before the reactor is tripped.
6.13.3 Barrier protection
Fuel-sheath failures must be prevented (by tripping the reactor in case of excessive flux distortion). The containment capability is analyzed to show that it can limit dose to the public from
tritium.
6.14 Severe Accidents
It is useful on CANDU to distinguish two categories of severe accidents:
1. Severe fuel-damage accidents in which the core geometry is preserved (fuel may be
damaged, but remains inside intact pressure tubes). Decay heat is removed from the
channels to the moderator. Example: loss of coolant plus loss of ECC with moderator
cooling available. A variant on this is “limited core damage”, in which one or a few fuel
channels fail, but the others remain intact. Either configuration is unique to a channel
reactor where the heat can be removed by the moderator; there is no analogy to this
“half-way” point in LWRs, in which a severe accident implies loss of core geometry.
2. Severe core-damage accidents, in which the fuel channels fail and collapse to the bottom of the calandria, i.e., the moderator heat sink is ineffective. Example: loss of coolant plus loss of ECC plus loss of moderator heat removal.
Analyses of accidents in the first category use similar tools to those for design basis accidents
and will not be discussed further.
CANDU is characterized by large volumes of water around the core, consisting of the moderator
and the reactor vault or shield tank (Figure 59). Even with no active heat removal from either
system, it takes about 20 hours for the water to boil off and for the debris to end up on the vault
floor [Snell, 1988].
Reactor Safety Design and Safety Analysis
130
The Essential CANDU
Figure 59 Sources of water near the fuel
Blahnik [Blahnik, 1991], using the MAAP-CANDU code, has characterized the degradation of a
CANDU core with no cooling and gradual boiling-off of the moderator. The uncovered channels
heat up and slump under their own weight until they are held up by the underlying channels.
Eventually, as successive layers of channels pile up, the supporting channels (still submerged)
collapse, and the whole core slumps to the bottom of the calandria vessel (Figure 60, Figure 61).
See [IAEA, 2008] and [Blahnik, 2012] for further reading.
Details of the channel failure mode are as follows: the axial creep rate of the pressure-tube
material (Zr-2.5% Nb) increases rapidly with temperature, and excessive sagging of the channel
is expected to occur above ~1200°C. In Blahnik’s model, a sagging channel comes into contact
with the next lower row of channels. The lower row of channels may or may not be cooled
adequately by the moderator, depending on whether it is submerged in the moderator.
Reactor Safety Design and Safety Analysis
Reactor Safety Design and Safety Analysis
131
Figure 60 Channel collapse in severe core-damage accident
Figure 61 Core collapse
As the moderator level continues to decrease, the lower row of channels is uncovered and sags
Reactor Safety Design and Safety Analysis
132
The Essential CANDU
under its own weight as well as that of the supported channels [Simpson, 1996]. This process
continues as more channels are uncovered. As sagging increases, channel segments separate
near the bundle junctions by sag-induced local strain. A suspended debris bed is thus formed
which moves downward with the falling moderator level. Because a submerged channel can
support only a certain number of channels, the ends of those channels are expected to fail by
shear. This process will increase the loading on the channels below, leading to progressive
failure of the channels and resulting ultimately in the collapse of the reactor core into the water
pool in the bottom of the calandria vessel.
To address the plant state once the debris has collapsed to the bottom of the calandria, Rogers
et al. [Rogers, 1995] developed an empirically based mechanistic model (Figure 62) of the
collapse process, which showed (assuming that the reactor vault is kept full of water) that the
end-state consists of a bed of dry, solid, coarse debris irrespective of the initiating event and the
core-collapse process. Heating of the debris bed is relatively slow because of the low power
density of the mixed debris and the spatial dispersion provided by the calandria shell, with
melting possibly beginning in the interior of the bed about two hours after the start of bed
Figure 62 Mechanistic model of channel collapse
heating. The upper and lower surfaces of the debris remain well below the melting point
(Figure 63), and heat fluxes to the shield-tank or reactor-vault water are well below the critical
heat flux of 200W/cm2 under existing conditions (Figure 64). The calandria vessel is protected
by a solid crust of material on the inside and by water on the outside, and therefore it can
prevent the debris from escaping. Should the shield tank or reactor vault water not be cooled
or replenished, it will boil off, and the calandria vessel will eventually fail by melt-through, but
this will not occur in less than about a day.
Reactor Safety Design and Safety Analysis
Reactor Safety Design and Safety Analysis
133
Figure 63 Debris heating transient
,
,
Figure 64 Heat flux on calandria wall
In short, compared to a core melt in an LWR, a severe core-damage accident in CANDU is
inherently:
Slow, because of all the passive heat sinks around the core
Incoherent, because the channels fail individually over time, forming a coarse debris,
rather than rapid “candling”
In a favourable geometry, either retained in the calandria shell or, should the shell
Reactor Safety Design and Safety Analysis
134
The Essential CANDU
fail, in the shield tank / reactor vault. Only if these also fail will debris be in contact
with the containment boundary
Subcritical
Amenable to mitigation by adding water to either the moderator or the reactor vault
/ shield tank.
Some validation of CANDU severe-accident phenomena has been carried out at both large and
small scales. Results obtained from the RASPLAV facility in Moscow have been used to support
heat transfer through vessel walls and retention of debris in a vessel: see [Ader, 1998] and
[Rogers, 2002]. See [Mathew, 2004] for a summary.
6.15 Problems
1.
Consider loss of cooling of the spent-fuel bay due to loss of electrical power to the
cooling system. What operating parameters would have the most influence on the outcome,
and how would you select conservative values? What tools would you need to analyze the
accident (i.e., what capabilities would they have to have)?
2.
Estimate the evolution (using hand calculations if necessary) of the following severe
accident in CANDU: small loss of coolant plus loss of ECC (assume that crash cooldown is
available because it is on a redundant signal) plus loss of moderator cooling. Write down the
expected event sequence (based on the list below) and estimate the approximate time of:
reactor trip
start of fuel overheating
failure of first channel
core collapse
shield-tank failure
containment behaviour.
Only an approximate answer is sought (to do this accurately could take weeks). If you cannot
obtain the physical data in some cases, especially for the last item, use symbols to show how
you would do the calculation. One approach is to use heat balance.
3.
Consider a CANDU that has undergone a severe core-damage accident. Assume that the
core has collapsed into a debris bed at the bottom of the calandria and is being cooled by
boiling of the shield-tank water. Calculate the depth of the debris bed in the calandria (assuming zero porosity) and the average heat flux through the calandria wall. Do the calculation at 12
hours after the event. You will need to look up typical CANDU geometry [AECL, 2005] and
calculate the core decay heat. Do not strive for high accuracy.
Reactor Safety Design and Safety Analysis
Reactor Safety Design and Safety Analysis
135
7 Safety Analysis – Mathematical Models
In this Section, we describe the basic science underlying safety analysis and present in simplified
form the types of models used. We shall not derive each model from first principles. The
reader is referred to numerous textbooks and reports for details (see Section 11). We borrow
heavily from lecture notes by D. Meneley, J. T. Rogers, and W. Garland.
We focus on the large LOCA because it covers most of the disciplines used.
7.1 Reactor Physics
The fundamental equations in reactor physics have been presented in Chapters 3 to 5. The
main aspects of physics used in safety analysis are reactor kinetics and diffusion theory. For the
kinetics of a (point) reactor:
dN f (t )
dt
M
k ( )
N f (t ) i Ci ,
lp
i 1
(32)
where:
Nf(t) is the number of neutrons as a function of time t
k is the multiplication factor for an infinite reactor
ρ is the reactivity
is the total delayed neutron fraction
lp is the prompt neutron lifetime
M is the number of delayed neutron groups (chosen by the analyst, typically 6)
i is the decay constant of the ith delayed neutron group
Ci is the number of neutrons of the ith delayed neutron group,
and for each delayed neutron group:
dCi i N f (t )
i Ci ,
dt
l p (1 )
(33)
where i is the delayed neutron fraction of each group i.
However, a CANDU cannot be considered a point reactor in accidents. Strong spatial effects
result from flux tilts (especially for a large LOCA, if only half the core is voided), insertion of
shut-off rods from the top of the reactor, or other events. Therefore, in practice, one must use
three-dimensional diffusion equations in conjunction with point kinetics. The diffusion model
tracks the neutrons as a flow through a medium subject to scattering, absorption, and leakage.
The continuity equation, for uniform systems with a single neutron velocity v, becomes the
neutron diffusion equation:
D 2 a s
1
,
v t
(34)
where:
D is the diffusion coefficient
Reactor Safety Design and Safety Analysis
136
The Essential CANDU
a is the absorption cross-section
is the neutron velocity
(r,t) is the neutron flux.
s(r,t) is the source distribution function, i.e., the number of neutrons emitted per unit
volume per unit time by sources at point r and time t.
This is very similar to the diffusion of heat through a medium, with the addition of a source
term (due to fission).
Transient neutron diffusion plus kinetics is the basis of many of the physics codes used in
accident analysis. These equations are solved using spatial finite-difference methods with the
reactor core broken up into many nodes, in each of which the diffusion equation is applied at
each time step.
For a LOCA, for example, time-dependent cross sections representing coolant voiding transient,
fuel temperature transient, reactor control-system action, and shut-off rod movement are the
driving functions for the transient in the flux. The average power transient for the reactor is
extracted from the calculation, along with peaking factors for the hot channel, hot bundle, and
hot element in the loop being analyzed. The system reactivity as a function of importanceweighted void fraction is also calculated. These data are used as input to a system thermohydraulics code. This code calculates the distribution of coolant void as a function of time from
the pipe break for each pass of the coolant loop. The importance-weighted average void
fraction calculated by the thermo-hydraulics code is combined with the previously calculated
reactivity function, and the cycle is iterated as necessary. The thermo-hydraulics code and the
physics code are combined into one calculation so that manual iteration is not necessary.
7.2 Decay Power
We indicated in Section 3.2 that shutting down a reactor was not sufficient to remove all safety
concerns: the decay heat must be removed. This heat comes from the radioactive decay of
fission fragments and obviously cannot be controlled. In principle, it can be calculated from the
power history: the composition of fission products can be predicted at any time, and their halflives and decay chains are known, so that:
Pd (t ) ni (t )Ei ,
(35)
i
where:
Pd(t) is the power produced by all decaying fission products at time t
ni(t) is the number of atoms decaying per unit time of fission product i at time t
Ei is the average energy produced by the decay of each atom of fission product i.
This is more complex than it seems because ni(t) will depend on the irradiation history, each
fission product may have more than one decay chain (with different energies), and many fission
products are generated. In practice, such a fundamental calculation is done as a reference,
assuming a rapid shutdown after equilibrium operation. In most cases, the evolution of the
accident (because it is short) does not materially change the decay power, so that the results
Reactor Safety Design and Safety Analysis
Reactor Safety Design and Safety Analysis
137
from the fundamental calculation can be fitted using a series of exponentials, and the curve fit
is simply added to the fission power predicted by the physics codes. In exceptional cases, such
as an accident occurring during power manoeuvring, the result will not be very accurate, but as
with any analysis, an upper bound can be assumed (e.g., assuming the decay power appropriate
to prolonged steady-state operation at the maximum operating power level before the accident). Such a trade-off between simplified assumptions which give a conservative bound to an
answer, and more realistic assumptions which require more sophisticated analysis tools, is very
common in safety analysis. Because safety analysis resources, like all other resources, are finite,
part of the art of safety analysis is in judging when to use bounding assumptions and when to
use realistic complex models. The difficulty is, of course, that bounding models may lead to
unnecessary restrictions on operation, as discussed in Section 6.2.
7.3 Fuel
The key safety parameters related to fuel are:
fuel-sheath integrity
fission product inventory in (and release from) the fuel, and
fuel temperature.
Prediction of fuel temperature in CANDU is important because:
it drives sheath temperature and hence sheath integrity;
high fuel temperatures drive pressure-tube deformation rates;
limited fuel melting can lead directly to fuel-sheath failure;
extensive melting can lead to pressure-tube failure;
release of fission products from the fuel increases with fuel temperature;
reactivity feedback from fuel temperature does occur, although it is small in CANDU.
7.3.1 Fission products in the fuel
During normal operating conditions, all fission products are formed within the fuel grains; they
are trapped there (with the exception of a few which recoil directly into inter-grain and gas
gaps) until they are released from the grains by diffusion. Those volatile fission products which
are released form a gas mixture inside the fuel sheath. It is therefore useful to categorize fission
products into three groups: (a) bound inventory, (b) grain boundary inventory, and (c) gap
inventory (recall Section 1.7).
The gap inventory includes the fission product gases in the pellet dishes, in the pellet/sheath
gap, and in the sheath end cap. If the fuel sheath fails, the gap inventory escapes quickly, the
grain boundary inventory much more slowly, and the bound inventory even more slowly. At
relatively low fuel temperatures, these diffusion processes are very slow, so that almost all
isotopes remain in the grains. (An exception to this occurs when uranium dioxide is exposed to
air at moderate temperatures; in this case, oxidation to higher states takes place, and the grain
structure is destroyed. Much of the fission products are then released. Such a circumstance
could occur after failure of an end-fitting and ejection of the channel contents into the reactor
vault). As temperature and fuel burnup increase, the amount of fission gas in the gap increases
Reactor Safety Design and Safety Analysis
138
The Essential CANDU
to a maximum of about 10% for typical CANDU operating conditions [Lewis, 1990].
At any given burnup, a larger fraction of the fission product gases is released near the centre of
the pellet, where the temperature is highest. All volatile fission products tend to migrate down
the temperature gradient toward the outside of the pellet. Their diffusion is assisted by the fact
that the pellet cracks under the influence of the temperature gradient; this cracking increases
with fuel burnup and pellet centre temperature.
In summary:
(a) at low burnup or temperature, nearly all fission products are trapped in fuel grains;
(b) fission products trapped at grain boundaries increase with temperature and burnup;
(c) the gas-gap inventory increases steadily with fuel temperature and burnup.
7.3.2 Fuel temperatures
Consider three-dimensional steady-state heat conduction in a medium. Assuming that energy is
being produced in the medium at a volumetric rate H, energy conservation can be stated as:
(Rate of change of internal energy) = (rate of energy release into medium) - (rate of energy loss from conduction),
or at any point,
c
T
H k 2T ,
t
(36)
where T is temperature, k thermal conductivity, ρ the density, and c the specific heat. Note the
similarity to the neutron diffusion Equation (34).
Consider one-dimensional steady-state heat conduction in a cylindrical fuel pin. In cylindrical
co-ordinates,
d 2T 1 dT
H
,
2
dr
r dr
kF
(37)
where kF is the fuel thermal conductivity. Integrating,
Hr 2
T (r ) T (0)
,
4kF
(38)
giving the typical parabolic radial distribution of temperatures within an oxide fuel element, as
shown in Figure 65.
Reactor Safety Design and Safety Analysis
Reactor Safety Design and Safety Analysis
139
Figure 65 Temperature distribution across a fuel pin
We can apply the same method to the temperature drop ΔTS across the sheath (for which the
internally generated heat Hs=0):
TS TSi TSo
Ha 2 log[(a b) / a]
,
2kS
(39)
where the indices i and o refer to the inner and outer surfaces of the sheath respectively. It
would be tempting to conclude that the temperature drop from the fuel centreline to the outer
part of the sheath is simply ΔTF +ΔTS. Not so—the gap between fuel and sheath provides a
further thermal resistance, so we can write:
q hg (TF TSi )
,
(40)
where hg is the gap heat-transfer coefficient, which is a very complex function of surface roughness, contact pressure, and temperature and is determined by experiment.
The relationship between sheath and coolant temperature can be again derived from:
q h(TSo TC ) ,
(41)
where q is the heat flux per unit area to the coolant, TC is the coolant temperature, and h is the
convective heat-transfer coefficient. At steady state, all the heat produced in the fuel is transferred to the coolant, so that for a length of element ℓ,
q
H a2
,
2 (a b)
(42)
so that
TC TSo
Ha 2
.
2h( a b)
(43)
Reactor Safety Design and Safety Analysis
140
The Essential CANDU
Typical values in CANDU fuel are (see [Page, 1972] for a summary):
kF = 0.004 kW/m.°C
kS = 0.017 kW/m.°C
hg = 7–60 kW/m2.°C
a = 6.07 mm
b = 0.42 mm.
Heat capacity, c, does not enter the steady-state equations, but is important in transients. The
values for uranium dioxide and Zircaloy-4 are respectively 0.5 and 0.4 J/g-°C. The corresponding
heats of fusion are 27 and 42 J/g. The relatively large value of c and the high melting point
(2840°C) for UO2 represent important safety characteristics: typically, one can almost double the
stored energy relative to the normal operating point, inside UO2 before it melts. Metal fuel, on
the other hand, has little heat capacity and melts at a lower temperature, but has much higher
thermal conductivity, typically ten times more than UO2.
7.3.3 Internal gas pressure
CANDU fuel has a “collapsible” fuel sheath, which creeps down plastically onto the pellet during
irradiation due to the excess external coolant pressure. The small enclosed gas space in the
element results in high sensitivity of gas pressure to fuel-sheath geometry. A small amount of
fill gas is added to this space on assembly to achieve the proper sheath stress distribution
during operation. As burnup increases, gas pressure causes the sheath once again to lift off the
fuel; the gap heat-transfer coefficient decreases because the sheath creeps away from the fuel
pellet. This decrease leads to higher peak fuel temperature, greater fission gas release from the
fuel, and finally higher gas pressure. A new equilibrium point is reached. In an accident, gas
pressure is the driving force for sheath strain. Gas pressure can be modelled using the ideal gas
law. The volume depends on the transient behaviour of the gas gap, which results from complex models of sheath and fuel behaviour and is beyond the scope of this Chapter.
7.3.4 Sheath strain – large LOCA example
Consider a large LOCA as an example. One of the objectives in LOCA analysis is to predict the
number of fuel sheaths which fail; this determines the amount of radioactive material released
to the coolant and is input into the calculations of release into containment and public dose.
Because the fuel heats up quickly, the gas pressure inside the sheath increases relative to the
coolant pressure and can force the sheath to strain. A uniform strain of at least 5% will not lead
to sheath failure; however, greater strains can lead to local instability, ballooning, and failure.
The strain-rate equations are complex functions of material composition, material state, temperature, irradiation, and transverse stress and are determined from experiments. Typically,
their form is established as follows.
Define the transverse stress across the sheath as:
Pr
,
w
(44)
Reactor Safety Design and Safety Analysis
Reactor Safety Design and Safety Analysis
141
where:
P is the pressure differential across the tube,
r is the tube radius,
w is the tube thickness.
The strain rate is then expressed in terms similar to the following:
d
A n e k /T B m e
dt
/T
,
(45)
where is strain, A, B, k, l, m, n are determined by experiment, and T is temperature.
7.4 Heat-Transport System
The behaviour of the heat-transport system is predicted by solving the equations of mass,
energy and momentum conservation for non-equilibrium transient two-phase flow in a network
in one dimension. “Two-phase” means that we consider steam and water. “Non-equilibrium”
means that the steam and water phases, even in the same location, can have different pressures, temperatures, and flow rates. “Transient” means that the desired behaviour is a function
of time. Current CANDU thermo-hydraulic codes are one-dimensional, although sometimes
phenomenological two- or three- dimensional models are used for components such as headers
and channels. “Network” means that we model parallel paths (e.g., fuel channels, ECC) and
several components connected together at the same point (e.g., at the headers).
Codes that model the heat-transport system cover:
equations of state for the various phases
component models for steam generators, fuel channels, fuel, headers, secondary
side, valves, pumps, etc.
correlations for pressure drop, heat transfer (including critical heat flux (CHF)), flow
regimes
constitutive relationships: these are equations describing transfers of mass, momentum and energy between the phases. The sets of constitutive relationships depend
on the flow regime.
efficient numerical solution schemes
plant controllers.
Most thermo-hydraulic simulation codes for reactors break the circuit up into nodes containing
mass, and therefore energy, and links joining the nodes, which are characterized by flow, length,
roughness, diameter, etc. Mass and energy conservation equations are written for the nodes,
and the momentum conservation equation is written for the links. We shall show simplified
examples here (one-dimensional flow in a level pipe).
Figure 66 shows two nodes, i and j, connected by a link k.
Reactor Safety Design and Safety Analysis
142
The Essential CANDU
Figure 66 Node/link structure
The mass conservation equation for node i is:
dM i
Wk ,
dt
k
(46)
where the Wk are all the mass flows into and out of node i along links k.
The conservation of momentum equation is applied to link k and is (ignoring gravity):
f k Lk
Wk 2
dWk Ak
,
(
P
P
)
k
i
j
k
2
dt
Lk
Dk
2 g c Ak
(47)
where for the link:
W is the mass flow in link k (in Figure 66, between nodes i and j)
A is the flow area
P is the pressure in the nodes connected to the link
L is the length
D is the hydraulic diameter
f is the friction factor
(fL/D + k) is a pressure-loss coefficient which accommodates changes in flow area, entrance effects, etc.
The first term is simply Newton’s law applied to a fluid to which a pressure difference is applied;
the second term is the loss due to friction plus other effects that cause pressure loss. Terms for
pumps and gravity can be added.
Conservation of energy is applied to each node i as follows:
dU i
Win ein Wout eout Q i ,
dt
(48)
where
Ui is the internal energy of node i
Qi is the heat generated in node i.
The summations are the rates of energies coming into and out of node i due to mass transfer.
These three equations are applied to each phase. There are four unknowns, e.g., mass, momentum, temperature, and pressure. The fourth equation needed is the equation of state for
Reactor Safety Design and Safety Analysis
Reactor Safety Design and Safety Analysis
143
each fluid, typically in the form
f ( P,T ) .
In safety analysis codes, the equation of state is used in the form of massive detailed tables of
water and steam properties or is fitted by correlations.
7.5 Fuel Channels
When we look at the behaviour of fuel channels in accidents, we emphasize three basic disciplines: heat transfer, stress-strain behaviour, and hydrogen chemistry.
7.5.1 Heat transfer
Heat can be transferred from the fluid to the pressure tube by conduction and convection and
from the fuel to the pressure tube by conduction (if the fuel sags into contact with the pressure
tube) (Figure 67).
Figure 67 Heat transfer to pressure tube
At high temperatures, the fuel can transfer heat to the pressure tube by radiation, as characterized by the Stefan-Boltzmann law,
E Tf4 TPT4 ,
(49)
where
ε is emissivity
T is temperature in degrees Kelvin
σ is the Stefan-Boltzmann constant (1.36 × 10⁻⁴ kilo-calories per metre2-second-K)
f refers to fuel and PT to pressure tube.
A similar equation would apply to radiation from the pressure tube and from the steam itself,
although these quantities tend to be small.
In practice, radiation becomes important at sheath temperatures of approximately 800°C or
more and is approximately equal to the decay power in the fuel around 1200°C–1400°C. In
practice, the hard part is working out the geometry: computer codes break the complex fuel
Reactor Safety Design and Safety Analysis
144
The Essential CANDU
bundle and pressure tube into smaller pieces, calculate the “view factor” (how much of the
pressure tube or neighbouring fuel element each piece can “see”) for each piece, and calculate
the radiation heat transfer piece by piece.
Heat can also be transferred from the calandria tube to the moderator, which is significant after
pressure-tube contact (see below). The heat-transfer characteristics follow a pool boiling curve.
Limited patches of film boiling can be tolerated for short periods after contact; lengthy or
extensive dryout will lead to calandria-tube (and pressure-tube) failure.
7.5.2 Strain
The pressure tube can be heated by conductive, convective, and radiative heat transfer from the
coolant and the hot fuel. If the pressure tube heats up beyond 800°C or so, it will start to
deform plastically. If the channel pressure is high (> 6MPa), the strain highly localized, or both,
the pressure tube may burst; if not, it will either strain radially or sag under gravity to contact
the calandria tube and transfer heat to the moderator water. The equations for pressure-tube
strain are, not surprisingly, similar to those for sheath strain.
7.5.3 Hydrogen
At high temperatures, Zircaloy oxidizes in steam to produce heat and hydrogen:
Zr 2 H 2O ZrO2 2 H 2 heat .
(50)
This is a quadruple threat:
hydrogen collects in containment (significant amounts of hydrogen can be produced
quickly only by a LOCA with ECC failure or in a severe core-damage accident) and
can, under the right circumstances, become flammable or detonate; hydrogen can
also be produced slowly over the long term by radiolysis (radiolytic decomposition)
of ECC water as it circulates through the core;
the heat generated by the chemical reaction increases fuel and pressure-tube temperatures;
the presence of a non-condensable gas in large quantities can impede ECC water if
the operator tries to recover from an impairment of ECC by injecting water late10;
and
the formation of zirconium dioxide may embrittle the sheaths so that they may
fragment and block cooling flow if ECC is eventually restored.
Correlations of the reaction rate of steam and Zircaloy therefore form an essential part of fuelchannel codes.
The reaction rate becomes autocatalytic around 1400°C–1500°C, that is, the heat it generates
10
This was the fear behind the “gas bubble” within the reactor vessel during the Three Mile Island accident. The
concern was not burning within the vessel because no oxygen was present. The hydrogen which escaped to
containment, which did contain oxygen, formed a flammable mixture of 9% hydrogen and did indeed burn without
serious consequences [Jaffe, 1979].
Reactor Safety Design and Safety Analysis
Reactor Safety Design and Safety Analysis
145
keeps the chemical reaction going with no further heat input. In light-water reactors, this is a
major concern: the fuel elements are close together, so there is no place to which the heat can
radiate. Regulatory practice in the United States sets a strict limit on sheath temperature in a
design basis accident—namely, 1200oC—which was chosen to allow little possibility of an
autocatalytic reaction. In CANDU, the presence of the colder pressure tube less than a few
centimetres from each fuel element moderates the reaction. Embrittlement is still a concern,
but regulatory practice permits calculation of actual oxidation rates and thicknesses, rather than
setting a criterion based on temperature alone; the particular criterion used in Canada is: “the
oxygen concentration in the cladding must remain below 0.7 wt.% over at least half of the
cladding thickness” (see [Grandjean, 2008] for a broad review).
7.6 Moderator
The modelling requirement for the moderator is to predict the transient local water temperature at each point. The objective is to show that local moderator sub-cooling at any location
where the pressure tube contacts the calandria tube in an accident is sufficient to prevent
prolonged film boiling on the outside of the calandria tube. The physical problem is therefore
solution of three-dimensional fluid flow with heat addition in a porous medium; the medium is
not continuous because of the presence of fuel channels, reactivity devices, etc. The mass,
momentum, and energy equations described above are therefore generalized to three dimensions. Experimental validation is, of course, a must because of the complex geometry.
7.7 Containment
As far as fundamental equations are concerned, containment behaviour is governed by the
same physical phenomena as the heat-transport system, with a few complications:
the containment volume is compartmentalized, and the flow within the larger compartments is three-dimensional;
a number of different fluids coexist: air (the normal contents of containment), steam
and water from a pipe break, and hydrogen if the sheaths are heavily oxidized;
heat is added by steam and hot water and also by radioactive decay of any fission
products carried into the containment atmosphere by the discharging fluid; heat is
removed by water sprays, condensation on containment and equipment surfaces,
containment air coolers, and indirectly by ECC in recovery mode;
pressure can also be influenced by use of the vacuum building (in multi-unit plants),
leakage from containment through cracks, and deliberate venting through filters.
Containment codes usually have sub-models for each of these phenomena.
Many containment codes also track the movement of fission products along with other fluids.
Fission products can exist as:
noble gases, which interact very little with water or surfaces;
tritium oxide (specifically the mixed oxide DTO) from the coolant or moderator.
iodine, cesium, strontium, etc. which interact strongly with water (dissolve and ionize) and tend to plate out on surfaces;
Reactor Safety Design and Safety Analysis
146
The Essential CANDU
actinides such as plutonium. These are released from the fuel in quantity only if the
core is massively destroyed.
Generally, iodine-131 is the significant radioisotope of concern because of its short half-life (8.1
days), high-energy gamma emission, and ability to get into the food chain as described in
Section 7.8.3.
As long as the pH of water inside containment is high, iodine will stay dissolved in the water.
High pH can be engineered through storage of chemicals such as tri-sodium phosphate in areas
likely to flood in an accident. However, a fraction of the iodine will react with organic material
in containment and form methyl iodide, which is volatile, not very soluble, and hard to capture
on filters. In an accident, any iodine-131 which does leak from containment is therefore likely to
be in this chemical form.
7.8 Fission Products, Atmospheric Dispersion, and Dose
7.8.1 Fission-product source term
The fission-product inventory in an operating reactor can be estimated as follows. Suppose that
the reactor has been operating at a power of P MW(th). If the recoverable energy per fission is
assumed to be 200 MeV, the total number of fissions occurring per second is
106 joule fissions
MeV
Fission rate = P(MW)
.
MW sec 200MeV 1.60 1013 joule
(51)
If the cumulative yield of the ith fission product (the yield of the fission product itself plus the
yields of all its short-lived precursors) is γi atoms per fission, then the rate of production of this
nuclide is
Rate of production = 3.13 1016 P i atoms/sec .
(52)
The activity at time t of that fission product while in the core of the reactor is
i 3.131016 P i (1 e t ) disintegrations/sec ,
i
(53)
or in Curies,
i 3.13 1016 P i (1 e t )Bq
i
1Ci
.
3.7 1010 Bq
(54)
If the activity is saturated, that is, if λi >>1, Equation (54) reduces to
i 8.46 105 P Ci .
(55)
Table 14 gives the inventories of the most important noble gases and iodine fission products
computed for a typical 1000 MWe (PWR) plant at the end of a fuel cycle. This example is
illustrative: the time-average inventory would be different in a 1000 MWe CANDU partly because of on-power fueling and lower burnup.
Reactor Safety Design and Safety Analysis
Reactor Safety Design and Safety Analysis
147
7.8.2 Atmospheric dispersion
Consider a reactor containment after an accident in which the concentration of a particular
nuclide is C Bq/m3. Assume a leak rate of V m3/ s into the atmosphere at a height of h metres,
as shown in Figure 68. The release rate Q is given by:
Q( Bq / Sec) C ( Bq / m3 ) V (m3 / sec) .
(56)
This release is dispersed into the surrounding area by the release plume. For given weather
conditions with wind velocity u and other data, the concentration of radioactive material at
some distance and direction from the source can be calculated from the Gaussian dispersion
model [CSA, 2008]:
1/2
2
Q
f
e h
zu x
2
/2 z 2
,
(57)
where (Figure 68):
χ is the sector-averaged long-term concentration in Bq/m3 at a distance of x metres from
the source and will be uniform through the sector
Q is the release rate in Bq/s from a source of height h metres
σz is the vertical diffusion coefficient in metres
θ is the angle subtended by the sector in radians
f is the fraction of the time that the wind blows into the sector
u is the mean wind velocity in m/s.
Table 14 Typical core inventory of volatile fission products
Nuclide*
Half-life†
Fission yield‡
Curies (×10-8§)
85m
Kr
4.4 h
0.0133
0.24
85
Kr
10.76 y
0.00285
0.0056
87
Kr
76 m
0.0237
0.47
88
Kr
2.79 h
0.0364
0.68
133
Xe
5.27 d
0.0677
1.7
135
Xe
9.2 h
0.0672
0.34
131
I
8.04 d
0.0277
0.85
132
I
2.28 h
0.0413
1.2
133
I
20.8 h
0.0676
1.7
134
I
52.3 m
0.0718
1.9
135
I
6.7 h
0.0639
1.5
* Superscript m refers to a nuclide in an isomeric state (see Section 2.8).
†
m = minutes, h = hours, d = days, y = years.
‡
Cumulative yields in atoms per fission; equal to yield of nuclide plus cumulative yield of
precursor. From M. E. Meek and B. F. Rider, “Compilation of Fission Product Yields”, General
Electric Company report NEDO-12154, 1972.
§
From “Reactor Safety Study”, WASH 1400, 1975.
Reactor Safety Design and Safety Analysis
148
The Essential CANDU
Figure 68 Atmospheric dispersion
7.8.3 Dose
Release of radioactive material from containment leads to an external dose to humans (often
called “cloud” dose) which depends on the ambient radiation level and an internal dose which
depends on inhaled species (and, in the longer term, ingestion of contaminated foods). External
dose is a function of exposure time to an ambient radiation level. Internal dose is a function of
radiation uptake and residence time in the body.
For example, the dose from I131 can be delivered through the following route:
released from containment
deposits on grass
eaten by cows
excreted in milk
drunk by people.
Alternatively, I131 can deposit on plants which are eaten directly by people. The external (direct)
dose from atmospheric release of I131 can also be significant.
Detailed tables have been prepared for each radioisotope which make it possible to convert
from external concentration, inhalation, and ingestion to dose. See [ICRP, 2010] for the most
recent tables. However, these are given by type of radiation rather than by radionuclide; for an
older report that does give the conversion factors by radionuclide, see [EPA, 1993].
Sample Problem
Consider a major release of radioactive Ar41 causing an air concentration χ of 108 Bq/m3. A
person is immersed in this cloud for an hour. What is his external dose?
Answer
From [EPA, 1993], Table III.1, we see that the effective dose coefficient hD for air immersion in
Ar41 is 6.5×10⁻¹⁴ Sv/Bq-s-m3. Hence, the dose D for an immersion of t seconds is:
D hD t 6.5 1014 Sv/Bq-s-m3 108 Bq/m3 3600sec 0.23Sv .
(58)
Reactor Safety Design and Safety Analysis
Reactor Safety Design and Safety Analysis
149
Note that this assumes a continuous release because we have not accounted for decay; the halflife of Ar41 is 1.83 hours.
7.9 Problems
1.
Calculate the dose to a person due to the release of 1000 Ci/hour of xenon-133 from a
CANDU. Assume that the release point is 20 m high and the receptor is 1 km distant. Assume
further that the person stays in that location for 15 minutes. Consult CSA-N288.1 for any
models you need. You should be able to find dispersion factors in the (public) annual environmental monitoring reports issued, e.g., by OPG.
2.
How many grams does 1000 Ci of iodine-131 represent? (Hint: remember or look up the
half-life).
3.
Calculate the average volumetric heat generation of the fuel in a 600MW CANDU at
100% power. At what percentage power (assuming the same heat removal from the fuel as in
normal operation) would the centre of the average pin melt?
4.
Do the following:
(a) Calculate the amount of hydrogen produced by oxidation of 25% of the Zircaloy in the
sheaths in a CANDU (this is not atypical of a severe accident such as a LOCA + LOECC);
(b) Calculate the amount of energy released (you will need to look up the heat of reaction)
(c) Assume that this energy is released starting from 30 minutes after the accident and ending
two hours afterwards. Compare the energy to the decay heat produced in the same time.
(d) Now assume that the hydrogen is transported into containment and burns. Calculate the
energy produced by the burn.
Reactor Safety Design and Safety Analysis
150
The Essential CANDU
8 Safety of Operation
In this section, we shall touch briefly on some high-level aspects of safety in operation. No
matter how well a plant is designed, in the end, its safety strongly depends on how, and by
whom, it is operated. We shall then touch briefly on future trends in safety, notably use of
passive systems.
8.1 Safety Culture
The International Atomic Energy Agency (IAEA) was set up in 1957 as the world's “Atoms for
Peace” organization within the United Nations family. It had a dual mandate: if nations would
eschew the path of nuclear weapons development, those countries which already had nuclear
weapons would assist them in developing a civilian nuclear power programme. The objectives
were thus: safeguards, aimed at preventing the proliferation of nuclear weapons, and promotion (including safety), aimed at assisting non-nuclear-weapons states.
The promotional side of the IAEA has been increasingly focussed on safety, especially since the
Chernobyl accident. Early on, the IAEA developed a series of Safety Guides, which enunciated
good safety practices in all areas of the nuclear fuel cycle, from design to waste management.
These Guides were prepared in a collaborative and consensual manner by IAEA members.
Because of this, they tended to contain useful advice, but they were not specific enough to
affect design and operation in a fundamental way. They were generally adopted by both
purchaser and vendor nations. Because safety remains the responsibility of each country, the
Guides have no legal force internationally, but tend to be incorporated informally or adopted
formally as part of each country’s safety regulations.
Chernobyl caused a fundamental rethinking of the effectiveness of the guidance that the IAEA
was offering. The first action taken was by an international group of independent experts, who
provided advice to the Director-General of the IAEA—the International Safety Advisory Group,
or INSAG. They produced a number of key documents which gained widespread international
acceptance and have strongly influenced the development of safety since then.
INSAG-1 [INSAG, 1986] initiated safety culture as a meme; however, this report was withdrawn
because of deficiencies in the Soviet account of Chernobyl, on which it relied. [INSAG, 1992]
entitled Basic Safety Principles for Nuclear Power Plants, tried to set down in one place what its
title implied: what were the underlying and fundamental safety principles of nuclear power
plants. Five levels of safety principles were defined, in a hierarchy going from the general and
all-encompassing to specific technical practices. The document was written in the present
tense, as if all reactors followed the safety principles—a clear message that if they did not, they
should be modifying at least their operating practices. Details are beyond the scope of this
Section.
INSAG recognized implicitly that no plant design is so safe that it cannot be damaged by incompetent operation; this is why plant safety is fundamentally the responsibility of the plant operator, not the designer and not the regulator. It is even more important that an unforgiving design
requires cautious operation, which in case of uncertainty always opts for the prudent course of
action. In this framework, Chernobyl was an unforgiving design run by an organization deficient
Reactor Safety Design and Safety Analysis
Reactor Safety Design and Safety Analysis
151
in safety culture.
The difficulty with safety culture was that it was hard to “get hold of”—like personal character,
one could sense when it was deficient, but it was hard to measure. INSAG therefore hastened
to elaborate on the term in a subsequent report [INSAG, 1991] entitled Safety Culture. The
term was redefined as:
“Safety culture is that assembly of characteristics and attitudes in organizations and individuals which establishes that, as an overriding priority, nuclear plant safety issues receive the attention warranted by their significance”.
The three concepts in this definition are that safety culture is attitudinal as well as structural;
that it relates both to organizations and individuals; and that it matches all safety requirements
with appropriate perceptions and action. Note that it gives safety a priority to the extent
warranted—it is not an absolute.
In simpler terms, the best design and the most carefully written procedures will not help if staff
does not place safety first in their thoughts and actions. See [IAEA, 2002] and [INSAG, 1999] for
more detail.
Other organizations have used variant definitions. The U.S. Nuclear Regulatory Commission
[USNRC, 2011a] defines it as “the core values and behaviors resulting from a collective commitment by leaders and individuals to emphasize safety over competing goals to ensure protection of people and the environment.”
Informal but revealing definitions include “Safety culture is what you do when the boss isn’t
looking”, and “Safety culture is the way we do things around here”.
To assist in recognizing a lack of safety culture, the IAEA has defined the stages of organizational
decline, as shown in Table 15.
Reactor Safety Design and Safety Analysis
152
The Essential CANDU
Table 15 Stages of organizational decline
Stage
1
Name of stage
Over-confidence
Characteristic of stage
Good past performance leading to self-satisfaction
2
Complacency
3
Denial
4
Danger
5
Collapse
Occurrence of minor events that are subjected to minimum
self-assessment, and delay in improvement programmes
Number of minor events increases, with possibly a more
significant event. These are treated as isolated events.
Findings from audits are considered invalid. Root-cause
analysis not used.
Several potentially serious events occur, but management
and employees reject criticism from audits or regulators by
considering their views biased. The oversight function is
afraid to confront management.
Regulator intervenes to implement special evaluations.
Management is overwhelmed and may need to be replaced. Major and very costly improvements need to be
implemented.
Audits by organizations such as INPO (Institute of Nuclear Power Plant Operations, an association of operating organizations) have distilled—through auditing utilities which were subsequently forced into extended plant outages due to management deficiencies—a list of symptoms of a poor safety culture [INPO, 2010]. It is the rare organization which does not recognize
at least part of itself in the list.
Finally, IAEA Safety Guides are being rewritten to make them more detailed, so that they state
the increased safety expectations of the 21st Century. “Requirements” on both design [IAEA,
2012] and operations [IAEA, 2011a] are becoming the de facto minimum standard for nuclear
power plants. Indeed, the IAEA design “requirements” report is the basis of the current Canadian top-level design requirements for new builds [CNSC, 2008].
8.2 International Nuclear and Radiological Event Scale
No discussion of safety would be complete without a summary of the International Nuclear and
Radiological Event Scale (INES). This is a ranking of accidents so that the safety significance of
events in nuclear power plants is reported in a consistent way all over the world [INES, 2008].
The seven levels in the scale are shown in Table 16. The table is self-explanatory, but should be
read carefully.
Reactor Safety Design and Safety Analysis
Reactor Safety Design and Safety Analysis
153
Table 16 INES event scale
Description
and
INES
Level
Major Accident Level 7
People and the environ- Radiological barriers and Defence in depth
ment
controls at facilities
Major release of radioactive material with widespread health and environmental
effects
requiring implementation
of planned and extended
countermeasures.
Serious
Significant release of
Accident Level radioactive material likely
6
to require implementation of planned countermeasures.
Accident with Limited release of radiowider conse- active material likely to
quences
require implementation
Level 5
of some planned countermeasures.
Several deaths from
radiation.
Accident with
local consequences Level
4
Minor release of radioactive material unlikely to
result in implementation
of planned countermeasures other than local
food controls. At least
one death from radiation.
Severe
reactor
core
damage.
Release of large quantities of radioactive material within an installation
with high probability of
significant public exposure. This could arise
from a major criticality
accident or fire.
Fuel melt or damage to
fuel resulting in more
than 0.1% release of core
inventory.
Release of significant
quantities of radioactive
material
within
an
installation with high
probability of significant
public exposure.
Reactor Safety Design and Safety Analysis
154
The Essential CANDU
Description
and
INES
Level
Serious
Incident Level
3
People and the environ- Radiological barriers and Defence in depth
ment
controls at facilities
Exposure in excess of ten
times
the
statutory
annual limit for workers.
Non-lethal deterministic
health effect (e.g., burns)
from radiation.
Exposure rates of more
than 1 SV/h in an operating area.
Severe contamination in
an area not expected by
design, with a low probability of significant public
exposure.
Incident
Level 2
Exposure of a member of
the public in excess of 10
mSv.
Exposure of a worker in
excess of the statutory
annual limits.
Radiation levels in an
operating area of more
than 50 mSv/h.
Significant contamination
within the facility into an
area not expected by
design.
Anomaly
Level 1
Near accident at a
nuclear power plant with
no safety provisions
remaining.
Lost or stolen highly
radioactive
sealed
source.
Misdelivered
highly
radioactive sealed source
without
adequate
radiation procedures to
handle.
Significant failures in
safety provisions, but
with no actual consequences.
Found highly radioactive
sealed orphan source,
device
or
transport
package with safety
provisions intact.
Inadequate packaging of
a
highly
radioactive
sealed source.
Overexposure
of
a
member of the public
above statutory limits.
Minor problems with
safety components with
significant defence in
depth remaining.
Low-activity lost or stolen
radioactive
source,
device
or
transport
package.
No safety significance (Below scale/Level 0)
8.3 Safety Aspects of Future Designs
In the final part of this Section, we shall be discussing some of the safety characteristics of
modern advanced designs. These designs fall into two categories: evolutionary and advanced.
Reactor Safety Design and Safety Analysis
Reactor Safety Design and Safety Analysis
1.
2.
155
Evolutionary designs, as their name suggests, build on operating experience in current
plants and add those improvements which are warranted by experience.
Advanced designs use passive concepts in their operation and particularly with respect
to safety. The original ideas behind the use of passive safety was to:
simplify the design and make it cheaper to build, operate, and maintain
increase the real safety of the plant through systems which were less complex and
more reliable because they used “natural” forces
increase the perceived safety of the plant for the same reasons.
In its broadest sense, passive safety emphasizes the use of “natural” forces (gravity, selfcorrecting neutronic feedback) and de-emphasizes systems which require large amounts of
electricity (pumps), rapid automatic response, complex logic, or high energy. A clear understanding of the meaning of terms such as “passive” and “inherent” is essential; we shall follow
[IAEA, 1991].
8.3.1 Definitions
Inherent safety refers to the achievement of safety through the elimination or exclusion of
inherent hazards through the fundamental conceptual design choices made for the nuclear
plant. This is impossible for practical reactor sizes because it requires elimination of systems
(because they would not be needed) to remove or compensate for decay heat, excess reactivity,
and high energy releases. It is possible to have inherent safety for low-energy pool reactors
such as the 20kW(th) SLOWPOKE-2 research reactor [AECL, 1976]—the total potential reactivity
addition can all be compensated for without fuel damage by the inherent negative feedback
from fuel and coolant temperatures, and the power at which this compensation is achieved can
be absorbed indefinitely by the pool and the surroundings. For larger reactors, elimination of
one or more of these hazards does, however, give a reactor an inherently safe characteristic.
Note that the hazard must be eliminated deterministically, not probabilistically; for example, a
plant is inherently safe against fires if it has no combustible material.
An ideal passive component does not need an external input to operate; a passive system is
composed of passive components and structures. Ideally a passive system has no reliance on
external mechanical or electrical power, signals, or forces. It does rely on “natural” laws,
properties of materials, and internally stored energy. Therefore, heat removal from a reactor by
thermo-siphoning to an elevated tank of water is passive, at least until the water runs out. In
practice, most passive designs do allow active signals because there is usually a need to switch
from the active heat-removal systems used in full-power operation to passive decay-heat
removal systems after an accident. CANDU shutdown systems are passive in this respect: once
they receive a signal, they actuate by gravity or stored energy.
An active component or system is one which is not passive.
Fail-safe means that a given failure leads to a safe condition; the component or system is then
fail-safe with respect to that condition. The fail-safe characteristic is specific to the failure
mode: for example, Shutdown System 2 in CANDU is fail-safe with respect to loss of electrical
power to the valves, but not to loss of gas pressure.
Reactor Safety Design and Safety Analysis
156
The Essential CANDU
Grace period is the period of time during which a safety function is ensured after an accident
without the necessity for human intervention. Colloquially, it used to be called “walk-away
safe” for whatever grace period was involved—this term has unfortunate connotations (operators are not expected to walk away from an accident) and is best not used. A grace period can
be achieved through active or passive means; usually, the first line of defence is assumed to
function properly in determining the grace period. Therefore, the grace period for loss of feed
water in first-generation CANDUs is about 30 minutes because after this period, the operator
must manually valve in an alternate heat sink. For new CANDU designs, the grace period is
extended to days through use of automatic steam-generator depressurization followed by
automatic connection of the elevated reserve water tank to the steam generators. For modern
reactor designs, evolutionary or passive, a grace period of three days for most single failures is
expected.
8.3.2 Categories of Passive Safety
Very few systems are totally passively safe. To recognize the range of possibilities, the IAEA
[IAEA, 1991] defined four categories of passivity, as summarized in Table 17.
Table 17 Categories of passive safety characteristics
Characteristic
Signal Inputs of Intelligence
External power sources
or forces
Moving
mechanical
parts
Moving working fluid
Example
Category A
No
Category B
No
Category C
No
Category D
Yes
No
No
No
No
No
No
Yes
Either
No
Barriers such
as fuel clad,
containment;
core cooling
relying only on
radiation
or
conduction to
outer
structural parts
Yes
Heat removal
by
natural
circulation to
heat exchangers in water
pools,
from
the core or
containment
Yes
Rupture disk
or
springloaded valve
for overpressure protection; accumulator isolated
by check valve
Either
Shutdown
Systems 1 and
2 in CANDU
For many passive designs, even those for which the “execution” is passive, the actuation may
involve an electrical signal. Part of the justification for this is that such signals are highly reliable
and can use backup power from batteries if main power fails. Note that even some valves can
be actuated on battery power. However, details of how this is implemented are being revisited
after Fukushima.
8.3.3 Passive safety desiderata
A passive design strives to ensure that the three major safety functions (other than monitoring)
Reactor Safety Design and Safety Analysis
Reactor Safety Design and Safety Analysis
157
can be carried out in a passive or pseudo-passive manner. Recall that these functions are to
shut down the reactor, to remove decay heat, and to contain any fission products. We describe
in general terms how each of these might be accomplished.
8.3.3.1 Shut down the reactor
CANDU shutdown systems are passive in the sense that once they are actuated by a signal, the
devices themselves are inserted into the core by gravity (shut-off rods) or stored energy (spring
assist to the shut-off rods and gas-driven poison injection). This places them into IAEA Category
D above. More passive approaches could be developed based on change in material properties
with temperature, e.g., a shutdown system consisting of tubes inserted into the reactor, with a
low-melting-point neutron absorber within them, initially located above the core, and which
would melt and insert into the core on increasing temperature. This system needs no external
“intelligence”, but does have a moving fluid, placing it in Category B. Even more basic, fuel with
a strong negative temperature-feedback coefficient is certainly a passive form of reactivity
compensation. If it truly shut down the reactor, it would be in Category A. However, negative
feedback does not shut down the reactor after, say, an inadvertent insertion of positive reactivity (control rod withdrawal); it simply allows the power to rise and then equilibrate at a level
where the negative reactivity due to the higher fuel temperature offsets the reactivity addition
of the control rod. One still needs to be sure that the power can be removed somehow (by
passive means) and that the fuel is not damaged. A strong negative coolant-temperature
feedback works the same way, but raises the added concern that fast insertion of cold water
could cause a rapid power increase before the negative fuel or coolant temperature had time to
compensate for it. The SLOWPOKE 2 reactor dealt with this problem by physically limiting the
amount of reactivity that it was possible to add; an alternative is to limit physically the rate at
which it can be added, so that negative feedback has time to take effect. Removal of moderator
in LWRs after a LOCA is an example of passive shutdown, but the ECC water that replaces it
must be borated to prevent recriticality and therefore is an active means of shutdown.
8.3.3.2 Remove decay heat
In passive designs, removal of decay heat from the fuel is normally done by thermo-siphoning to
an elevated heat sink, usually a heat exchanger in a large supply of water high up in the building. Alternatively, the entire core and its surroundings can be flooded by pouring water by
gravity from an elevated supply; the core heat is then turned to steam, which flows to and is
removed passively from containment. In some, but not all, passive designs decay heat is
removed at low pressure; therefore, some means of depressurizing the heat-transport system is
required first. This is done using a Category “D” device. CANDU offers inherent characteristics
for passive heat removal in severe accidents, as discussed in Section 6.14. Existing and future
CANDUs therefore incorporate the features desired in next-generation reactors: spreading of
core debris so it can be easily cooled (the calandria shell and/or the reactor vault/shield tank)
and passive cooling of the damaged core (moderator and/or reactor vault water).
8.3.3.3 Contain radioactive material
The containment structure is already passive, category A. However, for a number of other
Reactor Safety Design and Safety Analysis
158
The Essential CANDU
containment functions, a passive approach can be taken.
8.3.3.3.1
Ventilation isolation
The building can simply be sealed during operation, or the isolation system can be Category D
(e.g., a spring-loaded valve which fails closed on loss of signal).
8.3.3.3.2
Decay heat removal
This is an extension of core thermo-siphoning. The idea is to move the heat into an elevated
tank of water. To achieve this, heat exchangers can be placed in the building, with the tube side
connected to the tank and the shell side exposed to containment atmosphere. This requires
two natural convection loops: one in the containment atmosphere, transporting heat from the
core (e.g., steaming from a LOCA) to the heat exchangers, and one transporting heated water
from the heat exchangers to the elevated tank. One variation on this idea is used in the
AP1000: the metal shell of the building becomes the heat exchanger, and the elevated tank
trickles water down the outside [Westinghouse, 2011b].
8.3.3.3.3
Hydrogen removal
Here, passive autocatalytic recombiners can be used. These simply offer a catalyst-coated
surface to the containment atmosphere and as the air/steam/hydrogen mixture flows through,
the hydrogen and oxygen are catalytically recombined. An alternative is to inert the containment atmosphere, inherently removing the possibility of hydrogen combustion since there will
be no oxygen.
8.3.4 Summary
This Section has indicated the direction that safety may take in the future. Passive safety is
attractive because of its simplicity, public appeal, and aura of high reliability. Evolutionary
designs have also incorporated safety enhancements while both remaining economical and
posing less of an “innovation” risk to owners and operators. Once adequate (or even more than
adequate) safety is achieved, factors such as economics and proven performance may become
the determinants of the choice of technology, particularly as electricity markets become more
deregulated.
8.4 Problems
1. Place the following accidents on the International Nuclear and Radiological Event Scale,
with brief reasons for your choice. You may need to research some of these if they are
not covered in the text:
1. NRX accident, 1952
2. SL-1 accident
3. Pressure-tube failure in Pickering A (G-16)
4. Fire in Narora plant in India
5. Chernobyl accident (power runaway)
6. Three Mile Island accident (core melt)
7. Fukushima tsunami-induced accident
Reactor Safety Design and Safety Analysis
Reactor Safety Design and Safety Analysis
159
8. Erosion/corrosion of Davis-Besse vessel head
2. If you work for a design organization or a regulator or a nuclear power plant, evaluate
its safety culture in terms of the safety culture framework defined by one or more of
INSAG, IAEA, INPO, etc. Give reasons and evidence, not just opinion.
3. Look up information on any two modern designs (e.g., Enhanced CANDU 6, Westinghouse AP1000, EPR). Compare and contrast them as follows: for each of the systems
performing the fundamental safety functions (shut down, cool, contain radioactive material), categorize them as active or as passive categories A, B, C, or D (give reasons).
9 Review
This Chapter has summarized the basic concepts of safety for nuclear power plants. Starting
with the hazards inherent to nuclear power, it has described tools to identify possible accidents,
in particular the top-down and bottom-up approaches. Real experience has been a powerful
driver in the approach to nuclear safety, and the Chapter has described seminal historical
accidents and lessons learned—and as Fukushima has shown, learning lessons is an ongoing
process. We presented risk assessment, first in terms of safety goals for acceptable safety
performance, and then developing the probabilistic tools used to show that the goals have been
achieved. We then described (for CANDUs) mitigating systems to shut down the plant, remove
decay heat, and contain fission products in response to the needs identified by both deterministic and probabilistic analyses. We looked at accident phenomenology, using a large LOCA as a
model, and extended this discussion to CANDU characteristics in severe core-damage accidents.
Then we described (at a high level) the mathematical models underlying the safety-analysis
codes used to predict plant behaviour in accidents. Finally we looked—all too briefly—at the
safety role of the plant operators and indicated the options for the safety characteristics of
future designs.
10 References
[Ader, 1998] C. Ader, G. Heusener, and V. G. Snell, “Strategies for the Prevention and Mitigation
of Severe Accidents”, IAEA International Symposium on Evolutionary Water-Cooled Reactors: Strategic Issues, Technologies, and Economic Viability, IAEA Paper No. IAEA-SM353-16, Korea, 1998.
[AECB, 1980] Atomic Energy Control Board, Requirements for the Safety Analysis of CANDU
Nuclear Power Plants, Consultative Document C-6, Proposed Regulatory Guide, June
1980.
[AECL, 1976] R. E. Kay, J. W. Hilborn, and N. B. Poulsen, The Self-Limiting Power Excursion
Behaviour of the Slowpoke Reactor, Atomic Energy of Canada Limited Report AECL-4770,
January 1976.
[AECL, 2005] Atomic Energy of Canada Limited, CANDU 6 Technical Summary, May 2005 (Primer
on CANDU 6 design).
Reactor Safety Design and Safety Analysis
160
The Essential CANDU
[AECL, 2011], ZED-2 User Facility Proposal Package, AECL report ZED2-123110-REPT-001,
Revision 0, May 2011.
[Andreani, 2010] M. Andreani and D. Paladino, “Simulation of Gas Mixing and Transport in a
Multi-Compartment Geometry using the GOTHIC Containment Code and Relatively
Coarse Meshes”, Nuclear Engineering and Design, Vol. 240, No. 6, pp. 1506–1527 (2010).
[Blahnik, 1991] C. Blahnik, et al., “Modular Accident Analysis Program for CANDU Reactors”,
Proc. 12th Annual Canadian Nuclear Society Conference, Saskatoon, Saskatchewan, Canada, June 9-12, 1991, pp. 235-242.
[Blahnik, 2012] C. Blahnik, M. J. Brown, T. Nitheanandan, and S. M. Petoukhov, “Perspective on
Analyses of Core Damage in CANDU Reactors”, 24th Nuclear Simulation Symposium, Ottawa, Ontario, Canada, October 14-16, 2012.
[Boss, 2006] K. Aydogdu and C. R. Boss, “Radiation Physics and Shielding Codes and Analyses
Applied to Design-Assist and Safety Analyses of CANDU and ACR Reactors”, PHYSOR2006, ANS Topical Meeting on Reactor Physics, Vancouver, BC, Canada, September 1014, 2006.
[Brooks, 1980] G. L. Brooks and E. Siddall, “An Analysis of the Three Mile Island Accident”,
presented at the CNS First Annual Conference, Montreal, Canada, June 1980.
[Buell, 2003] J. Buell, J. D. Dormuth, P. Ingham, and R. Swartz, RD-14M Facility Description, 153112020-UM-001, 2003; also USNRC ML031690499.
[Cameron, 1996] I. Cameron, Nuclear Physics and Reactor Theory 1.1—Module 9, Source Neutron Effects, Course given at Chulalongkorn University, Thailand, 1996. See CANTEACH:
https://canteach.candu.org.
[Chan, 1987] P. Chan, et al., “The Chernobyl Accident: Multidimensional Simulations to Identify
the Role of Design and Operating Features of the RBMK-1000”, Conference on Probabilistic Safety Assessment and Risk Management, Zurich, Switzerland; September 1987. Also
Atomic Energy of Canada report AECL-9246.
[Charak, 1995] I. Charak and P. H. Kier, CANDU Reactors, Their Regulation in Canada, and the
Identification of Relevant NRC Safety Issues, Argonne National Laboratory report
NUREG/CR-63 15 and ANL-9515, April 1995 (prepared for U.S. Nuclear Regulatory Commission).
[Chen, 2007] W. L. Chen, et al., “Effects of Cobalt-60 Exposure on Health of Taiwan Residents
Suggest New Approach Needed in Radiation Protection”, Dose Response, Vol. 5, No. 1,
pp. 63–75 (2007).
[CNSC, 2008] Canadian Nuclear Safety Commission, Design of New Nuclear Power Plants,
Regulatory Document RD–337, November 2008.
[CNSC, 2008a] Canadian Nuclear Safety Commission, Safety Analysis for Nuclear Power Plants,
Regulatory Document RD–310, February 2008
[CNSC, 2011] Canadian Nuclear Safety Commission, CNSC Staff Integrated Safety Assessment of
Reactor Safety Design and Safety Analysis
Reactor Safety Design and Safety Analysis
161
Canadian Nuclear Power Plants for 2010, INFO-0823, September 2011.
[CSA, 2008] Canadian Standards Association, Guidelines for Calculating Derived Release Limits
for Radioactive Material in Airborne and Liquid Effluents for Normal Operation of Nuclear Facilities, CSA N288.1-08, 2011.
[Cross, 1980] W. G. Cross, “The Chalk River Accident in 1952”, Historical Perspective on Reactor
Accidents, Seattle, Washington, July 1980.
[Currie, 1984] T. Currie and J. T. Rogers, “Experimental and Numerical Studies of Heat Transfer
Through Contact Areas of High Ellipticity”, ASME National Heat Transfer Conference, Paper 84-HT-85, 1984.
[Currie, 1985] T. C. Currie, J. T. Rogers, and J. C. Atkinson, A Study of the Technical and Economic
Feasibility of Using a SLOWPOKE-3 Nuclear Reactor for Building Heating and Cooling at
Carleton University, Study for AECL; November, 1985.
[Currie, 1986] T. C. Currie and J. T. Rogers, “Heat Transfer between Rough Surfaces in Contact
over a Highly Elliptical Contour Area: Comparison of Experimental and Numerical Results”, Proceedings of Eighth International Heat Transfer Conference, San Francisco, August 1986.
[Cuttler, 2009] J. M. Cuttler and M. Pollycove, “Nuclear Energy and Health: The Benefits of LowDose Radiation Hormesis”, Dose Response, Vol. 7, No. 1, pp. 52–89, 2009.
[EPA, 1993] K. F. Eckerman and J. C. Ryman, Federal Guidance Report No. 12 - External Exposure
to Radionuclides in Air, Water, and Soil, Environmental Protection Agency report EPA402-R-93-081, September 1993.
[Glasstone, 1994] S. Glasstone and A. Sesonske, Nuclear Reactor Engineering, 4th Edition,
Chapman & Hall, 1994.
[Gonzales, 2013] A. J. Gonzalez, et al., “Radiological Protection Issues Arising During and After
the Fukushima Nuclear Reactor Accident”, J. Radiol. Prot., Vol. 33, pp. 497–571, 2013.
[Grandjean, 2008] C. Grandjean and G. Hache, A State-of-the-Art Review of Past Programmes
Devoted to Fuel Behaviour Under Loss-of-Coolant Conditions, Part 3: Cladding Oxidation,
Resistance to Quench and Post-Quench Loads, Institut de Radioprotection et de Sûreté
Nucléaire (IRSN) report DPAM/SEMCA 2008-093, 2008.
[Hanna, 1998] B. N. Hanna, “CATHENA: A Thermal-Hydraulic Code for CANDU Analysis”, Nuclear
Engineering and Design, Vol. 180, 113–131, 1998.
[Howieson, 1987] J. Q. Howieson and V. G. Snell, Chernobyl: A Canadian Technical Perspective,
Atomic Energy of Canada Limited publication AECL-9334, January 1987. Also Nuclear
Journal of Canada, Vol. 1, No. 3, September 1987.
[HSE, 2006] Health and Safety Executive (United Kingdom), Safety Assessment Principles for
Nuclear Facilities, Bootle, 2006 Edition, Revision 1.
[Hurst, 1953] D. G. Hurst, The Accident to the NRX Reactor, Part II, Atomic Energy of Canada
Limited, Report AECL-233, October 1953.
Reactor Safety Design and Safety Analysis
162
The Essential CANDU
[Hurst, 1972] D. G. Hurst and F. C. Boyd, “Reactor Licensing and Safety Requirements”, Paper 72CNA-102, 12th Annual Conference of the Canadian Nuclear Association, Ottawa, Ontario,
June 1972.
[Huterer, 1984] J. Huterer, E. C. Ha, D. G. Brown, and P. C. Cheng, “Darlington GS Vacuum Building: Containment Shell”, Nuclear Engineering and Design, Vol. 85, 131-140, 1985.
[IAEA, 1991] International Atomic Energy Agency, Safety-Related Terms for Advanced Nuclear
Plants, IAEA-TECDOC-626, September 1991.
[IAEA, 2000] International Atomic Energy Agency, Safety of Nuclear Power Plants: Design, IAEA
report NS-R-1, 2000.
[IAEA, 2002] International Atomic Energy Agency, Safety Culture in Nuclear Installations, IAEATECDOC-1329, December 2002.
[IAEA, 2008] International Atomic Energy Agency, Analysis of Severe Accidents in Pressurized
Heavy-Water Reactors, IAEA-TECDOC-1594, June 2008.
[IAEA, 2010] International Atomic Energy Agency, Development and Application of Level 1
Probabilistic Safety Assessment for Nuclear Power Plants, IAEA-SSG-3, April 2010.
[IAEA, 2011] International Atomic Energy Agency, International Fact Finding Expert Mission of
the Fukushima Dai-Ichi NPP Accident Following the Great East Japan Earthquake and
Tsunami, IAEA Report, June 16, 2011.
[IAEA, 2011a] International Atomic Energy Agency, Safety of Nuclear Power Plants: Commissioning and Operation: Specific Safety Requirements, IAEA report SSR-2/2, July 2011.
[IAEA, 2012] International Atomic Energy Agency, Safety of Nuclear Power Plants: Design:
Specific Safety Requirements. IAEA report SSR-2/1, January 2012.
[ICRP, 1990] International Commission on Radiological Protection, 1990 Recommendations of
the ICRP, report ICRP-60, table B.
[ICRP, 2010] International Commission on Radiological Protection, Conversion Coefficients for
Radiological Protection Quantities for External Radiation Exposures, ICRP Publication
116, Ann. ICRP 40(2–5), 2010.
[ICRP, 2012] International Commission on Radiological Protection, Compendium of Dose Coefficients based on ICRP Publication 60, ICRP Publication 119, Ann. ICRP 41 (Suppl.).
[INES, 2008] International Atomic Energy Agency and OECD/Nuclear Energy Agency, INES - The
International Nuclear and Radiological Event Scale - User’s Manual, 2008 Edition, IAEA,
Vienna, 2009.
[Inhaber, 1978] H. Inhaber, Risk of Energy Production, Atomic Energy Control Board report AECB
1119, March 1978.
[INPO, 2010] Institute of Nuclear Power Operations, Field Guidance: Organizational Effectiveness Evaluation and Assistance, INPO report, Revision 2, March 2010.
[INSAG, 1986] International Nuclear Safety Advisory Group, Summary Report on the PostReactor Safety Design and Safety Analysis
Reactor Safety Design and Safety Analysis
163
Accident Review Meeting on the Chernobyl Accident, International Atomic Energy Agency
Report 75-INSAG-1, Vienna, 1986.
[INSAG, 1991] International Nuclear Safety Advisory Group, Safety Culture, International Atomic
Energy Agency Report 75-INSAG-4, 1991.
[INSAG, 1992] International Nuclear Safety Advisory Group, The Chernobyl Accident: Updating
of INSAG-1 – INSAG 7, International Atomic Energy Agency Report INSAG-7, 1992.
[INSAG, 1996] International Nuclear Safety Advisory Group, Defence in Depth in Nuclear Safety,
International Atomic Energy Agency Report INSAG-10, 1996.
[INSAG, 1999] International Nuclear Safety Advisory Group, Basic Safety Principles for Nuclear
Power Plants, International Atomic Energy Agency Report INSAG-12, 1999.
[Ionescu, 2009] S. Ionescu, O. Uta, M. Pârvan, and D. Ohâi, “Pressurized Heavy Water Reactor
Fuel Behaviour in Power Ramp Conditions”, Journal of Nuclear Materials, Vol. 385, 387–
391, 2009.
[Jaffe, 1979] L. Jaffe, Staff Reports to the President's Commission on the Accident at Three Mile
Island, Reports of the Technical Assessment Task Force, Volume II, 1979.
[Japan, 2011] Government of Japan, Nuclear Emergency Response Headquarters, Report of the
Japanese Government to the IAEA Ministerial Conference on Nuclear Safety: The Accident at TEPCO’s Fukushima Nuclear Power Stations, June 2011.
[JNTI, 2011] Japan Nuclear Technology Institute, Examination Committee on Accident at Fukushima Daiichi Nuclear Power Station, Examination of Accident at Tokyo Electric Power
Co., Inc.’s Fukushima Daiichi Nuclear Power Station and Proposal for Countermeasures,
October 2011 (there are many more similar reports from IAEA and others).
[Kaplan, 1979] S. Kaplan and B. J. Garrick, “On the Use of Bayesian Reasoning in Safety and
Reliability – Three Examples”, Nuclear Technology, Vol. 44, 231, 1979.
[Kemeny, 1979] J. G. Kemeny, Report of the President's Commission on the Accident at TMI,
1979.
[Krause, 2007] M. Krause, “Hydrogen Program at AECL”, 2nd European Review Meeting on Severe
Accident Research (ERMSAR-2007), Forschungszentrum Karlsruhe GmbH (FZK), Germany,
June 12-14, 2007.
[LANL, 2000] Los Alamos National Laboratory, A Review of Criticality Accidents, report LA-13638,
2000. (See page 74.)
[Larson, 1961] E. A. G. Larson, A General Description of the NRX Reactor, Atomic Energy of
Canada Report AECL-1377, 1961.
[Lewis, 1953] W. B. Lewis, The Accident to the NRX Reactor on December 12, 1952, Atomic
Energy of Canada Limited, Report AECL-232, July 1953.
[Lewis, 1990] B. J. Lewis, C. E. L. Hunt, and F. C. Iglesias, “Source Term of Iodine and Noble Gas
Fission Products in the Fuel-to-Sheath Gap of Intact Operating Nuclear Fuel Elements”,
Reactor Safety Design and Safety Analysis
164
The Essential CANDU
Journal of Nuclear Materials, Vol. 172, 197-205, 1990.
[Lewis, 1999] B. J. Lewis, P. Tume, L. G. I. Bennett, M. Pierre, A. R. Green, T., Cousins, B. E.
Hoffarth, T. A. Jones, and J. R. Brisson, “Cosmic Radiation Exposure on Canadian-Based
Commercial Airline Routes”, Radiat. Prot. Dosim., Vol. 86, No. 1, pp. 7–24, 1999.
[Lewis, 2009] B. J. Lewis, F. C. Iglesias, R. S. Dickson, and A. Williams, “Overview of HighTemperature Fuel Behaviour with Relevance to CANDU Fuel”, Journal of Nuclear Materials, Vol. 394, pp. 67–86 (2009).
[Liauw, 1997] W. K. Liauw, W. S. Liu, R. Y. Chan, “TUF Validation against Reactor Trip Data at
Darlington NGS”, Canadian Nuclear Society Conference: Powering Canada’s Future, Toronto (Canada), June 8-11, 1997.
[Liverman, 1979] D. M. Liverman and J. P. Wilson, “The Mississauga Train Derailment and
Evacuation, 10–16 November 1979”, Canadian Geographer, Vol. 25, No. 4, pp. 365–375,
1981.
[Mathew, 2004] M. Mathew, T. Nitheanandan, and S. J. Bushby, Severe Core Damage Accident
Progression within a CANDU Calandria Vessel. AECL Chalk River Laboratories. Reactor
Safety Division, Forschungsbericht (2004).
[McCormick, 1981] N. J. McCormick, Reliability and Risk Analysis, Academic Press, 1981, ISBN 012-482360-2.
[Meneley, 2003] D. A. Meneley, Nuclear Safety and Reliability, Lecture notes for a course at the
University of New Brunswick, available at the CANTEACH repository,
https://canteach.candu.org/Pages/Welcome.aspx, 2003.
[Meneley, 2009] D. A. Meneley and A. Muzumdar, “Power Reactor Safety Comparison – A
Limited Review”, Proceedings, CNS 30th Annual Conference, Calgary, AB, May 31–June 3,
2009.
[Morison, 1987] W. G. Morison, et al., “Containment Systems Capability”, Nuclear Journal of
Canada, Vol. 1, No. 1, pp. 53-68, 1987 [from CANTEACH].
[Muzumdar, 2009] A. J. Muzumdar and D. A. Meneley, “Large LOCA Margins in CANDU Reactors:
An Overview of the COG Report”, Proceedings, CNS 30th Annual Conference, Calgary, AB,
May 31–June 3, 2009.
[NISA, 2011] Nuclear and Industrial Safety Agency (NISA) and Japan Nuclear Energy Safety
Organization (JNES), The 2011 Pacific Earthquake off the Pacific Coast of Tohoku and the
Seismic Damage to the NPPs, April 4, 2011.
[OMSC, 1981] Ontario Ministry of the Solicitor General, The Mississauga Evacuation – Final
Report, November 1981.
[Ott, 1981] K. O. Ott and J. F. Marchaterre, “Statistical Evaluation of Design-Error Related Nuclear Reactor Accidents”, Nuclear Technology, Vol. 52, No. 2, 179-188, 1981.
[Page, 1972] R. D. Page, Nuclear Power Symposium - Lecture No. 5: Canadian Power Reactor
Fuel, Atomic Energy of Canada Limited, 1972 [from CANTEACH].
Reactor Safety Design and Safety Analysis
Reactor Safety Design and Safety Analysis
165
[Popov, 2012] N. K. Popov and V. G. Snell, “Safety and Licensing Aspects of Power Reactor
Reactivity Coefficients”, Proceedings, 20th International Conference on Nuclear Engineering (ICONE20), Anaheim, California, USA, July 30–August 3, 2012.
[Popov, 2013] N. Popov, V. Snell, R. Tran, and G. LeRoy, “Thermo-Hydraulic Aspects of Reactivity
Coefficients in CANDU”, 15th International Topical Meeting on Nuclear Reactor ThermalHydraulics (NURETH-15), Pisa, Italy, May 12–17, 2013.
[Rizkalla, 1984] S. H. Rizkalla, S. H. Simmonds, and J. G. MacGregor, “Pre-Stressed Concrete
Containment Model”, Journal of Structural Engineering, Vol. 110, No. 4, pp. 730–743,
1984.
[Rizkalla, 1986] S. Rizkalla, “Limit States Behaviour of Pre-Stressed Concrete Containment
Structures”, Proceedings, Second International Conference on Concrete Technology for
Developing Countries, Tripoli, Libya (Splaj), October 27–30, 1986;. Vol. 2, El-Fateh University, Civil Engineering Department, 1986.
[Rogers, 1987] J. T. Rogers, “Insights from Chernobyl on Severe Accident Assessment of CANDU
Reactors”, Nuclear Journal of Canada, Vol. 1, No. 2, pp. 107–118, 1987.
[Rogers, 1995] J. T. Rogers, D. A. Meneley, C. Blahnik, V. G. Snell, and S. Nijhawan, “Coolability of
Severely Degraded CANDU Cores”, ICHMT International Seminar on Heat and Mass
Transfer in Severe Reactor Accidents, Cesme, Turkey, May 21–26, 1995. Also Atomic Energy of Canada Ltd. Report AECL-11110.
[Rogers, 2002] J. T. Rogers and M. L. Lamari, “Application of the CANDU Molten Core Model
‘DEBRIS.MLT’ to RASPLAV Test Results”, 22nd Nuclear Simulation Symposium, Canadian
Nuclear Society, Ottawa, November, 2002
[Rogers, 2004] J. T. Rogers, Options For Coal-Fired Power Plants in Ontario, monograph at
Canadian Nuclear Society, http://www.cns-snc.ca/cns_media, September 27, 2004.
[Rogers, 2004a] J. T. Rogers, “CANDU Power Reactor Behavior Following Reactor Trip”, Presentation at Panel Discussion on Islanding, Cogeneration Conference, Ottawa, October 26,
2004.
[Rogovin, 1980] M. Rogovin and G. T. Frampton, Three Mile Island—A Report to the Commissioners and to the Public, Nuclear Regulatory Commission Special Inquiry Group, January
1980.
[Roy, 2004] R. Roy, et al., “Reactor Core Simulations in Canada”, PHYSOR 2004 -The Physics of
Fuel Cycles and Advanced Nuclear Systems: Global Developments, Chicago, Illinois, April
25-29, 2004, American Nuclear Society, Lagrange Park, IL (2004)
[Rzentkowski, 2013] G. Rzentkowski, Y. Akl, and S. Yalaoui, “Application of Probabilistic Safety
Goals to Regulation of Nuclear Power Plants in Canada”, 34th Annual Conference of the
Canadian Nuclear Society, Toronto, June 9–12, 2013.
[Sanderson, 2003] B. Sanderson, Fuel Channel Behaviour, presented to U.S. Nuclear Regulatory
Commission, May 6–7, 2003, USNRC accession ML031340404.
Reactor Safety Design and Safety Analysis
166
The Essential CANDU
[Santamaura, 1998] P. A. Santamaura, J. G. Tielemans, T. H. Nguyen, H. S. Shapiro, R. E. B.
Henderson, and B. A. duQuesnay, “Severe Core Damage Frequency and Insights from
CANDU 6 Level 1 Probabilistic Safety Assessment”, Pacific Basin Nuclear Conference
(PBNC98), Banff, Alberta, Canada, May 1998.
[Semonov, 1983] B. A. Semonov, “Nuclear Power in the Soviet Union”, IAEA Bulletin, Vol. 25, No.
2, June 1983.
[Siddall, 1981] E. Siddall, Risk, Fear, and Public Safety, Atomic Energy of Canada Limited Report
AECL-7404, April 1981.
[Simpson, 1996] L. A. Simpson, P. M. Mathew, A. P. Muzumdar, D. B. Sanderson, and V. G. Snell,
“Severe Accident Phenomena and Research for CANDU Reactors”, Proc. 10th. Pacific Basin Nuclear Conference, October 20–21, 1996, Kobe, Japan.
[Slovic, 1987] P. Slovic, “Perception of Risk”, Science, Vol. 236, No. 4799, pp. 280-285, April 1987.
[Smithsonian, 2004] Smithsonian National Museum of American History, Three Mile Island: The
Inside Story, 2004.
[Snell, 1978] V. G. Snell, “Evolution of CANDU Safety Philosophy”, Proceedings, Canadian Nuclear Society Symposium on CANDU Reactor Safety Design, November 1978.
[Snell, 1988] V. G. Snell, S. Alikhan, G. Frescura, J. Q. Howieson, F. King, J. T. Rogers, and H.
Tamm, “CANDU Safety under Severe Accidents: An Overview”, IAEA/OECD International
Symposium on Severe Accidents in Nuclear Power Plants, Sorrento, Italy, March 1988.
Also Atomic Energy of Canada Ltd. Report AECL-9802.
[Snell, 1989] V. G. Snell, J. W. Hilborn, G. F. Lynch, and S. McAuley, “Safety Aspects of District
Heating Reactors”, invited paper presented to the IAEA Workshop on the Safety of Nuclear Installations of the Next Generation and Beyond, Chicago, August 1989.
[Stacy, 2000] S. M. Stacy, Proving the Principle, Idaho Operations Office of the Department of
Energy, Idaho Falls, Idaho, report DOE/ID-10799, 2000. This is a history of Idaho Nuclear
Laboratories. See Chapters 15 and 16 for SL-1.
[StatsCan, 2009] Leading Causes of Death, Total Population, by Age Group and Sex, Statistics
Canada, 2009.
[Talbot, 2003] E. O. Talbot, A. O. Youk, K. P. McHugh-Pemu, and J. V. Zborowski, “Long-Term
Follow-Up of the Residents of the Three Mile Island Accident Area: 1979–1998”, Environmental Health Perspectives, Vol. 111, No. 3, March 2003.
[TEPCO, 2011] Tokyo Electric Power Company, Evaluation Status of Exposed Dose of Employees
Engaged in Emergency Work in Fukushima Daiichi Nuclear Power Station, Exhibit, July
13, 2011.
[TEPCO, 2011a] Tokyo Electric Power Company, Effects of the Earthquake and Tsunami on the
Fukushima Daiichi and Daini Nuclear Power Stations, May 24, 2011.
[Thompson, 1965] T. J. Thompson and J. G. Beckerley, The Technology of Nuclear Reactor Safety,
MIT Press, 1965.
Reactor Safety Design and Safety Analysis
Reactor Safety Design and Safety Analysis
167
[Tregoning, 2008] R. Tregoning, L. Abramson, and P. Scott, Estimating Loss-of-Coolant Accident
(LOCA) Frequencies through the Elicitation Process, United States Nuclear Regulatory
Commission report NUREG-1829, April 2008.
[UNSCEAR, 2000] United Nations Scientific Committee on the Effects of Atomic Radiation,
ANNEX J, Exposures and Effects of the Chernobyl Accident, UNSCEAR 2000 Report to the
General Assembly, 2000.
[UNSCEAR, 2001] United Nations Scientific Committee on the Effects of Atomic Radiation,
Hereditary Effects of Radiation, UNSCEAR 2001 Report to the General Assembly, with
Scientific Annex, 2001.
[UNSCEAR, 2008] United Nations Scientific Committee on the Effects of Atomic Radiation,
ANNEX D, Health Effects due to Radiation from the Chernobyl Accident, UNSCEAR 2008
Report to the General Assembly, 2008.
[USAEC, 1962] U.S. Atomic Energy Commission, Idaho Operations Office, Nuclear Incident at the
SL-1 Reactor, report IDO-19302, January 1962.
[USAEC, 1962a] U.S. Atomic Energy Commission, Final Report of SL-1 Recovery Operation, report
IDO-19311, July 1962.
[USAEC, 1962b] U.S. Atomic Energy Commission, Additional Analysis of the SL-1 Excursion,
report IDO-19313, November 1962.
[USDOE, 1986] U.S. Department of Energy, Report of the U.S. Department of Energy’s Team
Analyses of the Chernobyl-4 Atomic Energy Station Accident Sequence, DOE/NE-0076,
November 1986.
[USNRC, 1981] United States Nuclear Regulatory Commission, Fault Tree Handbook, Report
NUREG-0492, January 1981.
[USNRC, 2001] United States Nuclear Regulatory Commission, Systematic Radiological Assessment for Source and By-Product Materials, report NUREG-1717, June 2001.
[USNRC, 2002] A. Howell, et al., United States Nuclear Regulatory Commission, Degradation of
The Davis-Besse Nuclear Power Station Reactor Pressure Vessel Head: Lessons Learned
Report, USNRC report, September 30, 2002.
[USNRC, 2011] United States Nuclear Regulatory Commission, Recommendations for Enhancing
Reactor Safety in the 21st Century: The Near-Term Task Force Review of Insights from the
Fukushima Dai-Ichi Accident, USNRC report, July 12, 2011.
[USNRC, 2011a] United States Nuclear Regulatory Commission, Final Safety Culture Policy
Statement, USNRC report NRC–2010–0282; see Federal Register / Vol. 76, No. 114 /
Tuesday, June 14, 2011 / Notices.
[USNRC, 2013] United States Nuclear Regulatory Commission, Title 10, Code of Federal Regulations, Part 50, Appendix A, Criterion 54.
[USSR, 1986] USSR State Committee on the Utilization of Atomic Energy, The Accident at the
Chernobyl Nuclear Power Plant and its Consequences, Information compiled for the IAEA
Reactor Safety Design and Safety Analysis
168
The Essential CANDU
Experts’ Meeting, Vienna, 25-29 August 1986; Parts I and II, August 1986. Also see Information on the Accident at the Chernobyl Nuclear Power Station and its Consequences,
prepared for IAEA, translation of Atomnaya Energiya, Vol. 61, No. 5, pp. 301-320, November 1986.
[Venart, 2004] J. E. S. Venart, “Flixborough: the Explosion and its Aftermath”, Trans IChemE, Part
B, March 2004; Process Safety and Environmental Protection, Vol. 82, Issue B2, pp. 105–
127, 2004.
[Westinghouse, 2011] Westinghouse, AP1000 Design Control Document, Tier 2, Revision 19,
Section 15.4.8.2.1.7, USNRC.
[Westinghouse, 2011a] Westinghouse, AP1000 Design Control Document, Tier 2, Revision 19,
Section 15.6.5.2, USNRC.
[Westinghouse, 2011b] Westinghouse, AP1000 Design Control Document, Tier 2, Revision 19,
Section 1, USNRC.
[Wren, 1999] J. C. Wren, J. M. Ball, and G. A. Glowa, “The Chemistry of Iodine in Containment”,
Nuclear Technology, Vol. 129, No. 3, pp. 297-325, 2000.
[Wren, 2001] J. C. Wren and J. M. Ball, “LIRIC 3.2—An Updated Model for Iodine Behaviour in
the Presence of Organic Impurities”, Radiation Physics and Chemistry, Vol. 60, 577–596,
2001.
[Xu, 1999] J. Xu, V. S. Krishnan, P. J. Ingham, B. N. Hanna, and J. R. Buell, “Thermal-Hydraulic
Design Methods and Computer Codes”, China Journal of Nuclear Power Engineering, Vol.
20, No. 6, 1999.
[Yaremy, 1979] E. M. Yaremy, “A Review of the Incident at the Three Mile Island Nuclear Power
Plant”, presented to the Canadian Electrical Association Thermal and Nuclear Power Section Meeting, Calgary, Alberta, October 1979.
11 Further Reading
[Duderstadt, 1976] J. J. Duderstadt and L. J. Hamilton, Nuclear Reactor Analysis, New York, NY:
Wiley, 1976. ISBN: 9780471223634.
[IAEA, 2001] International Atomic Energy Agency, Thermo-Hydraulic Relationships for Advanced
Water-Cooled Reactors, IAEA-TECDOC-1203, April 2001.
[OECD-NEA CSNI, 1989] Thermo-Hydraulics of Emergency Core Cooling in Light Water Reactors,
a State-of-the-Art Report (SOAR) by a Group of Experts of the NEA Committee on the
Safety of Nuclear Installations, OECD-NEA report Rep. No. 161, Paris.
Reactor Safety Design and Safety Analysis
Reactor Safety Design and Safety Analysis
169
12 Glossary
AECB
Atomic Energy Control Board
AECL
Atomic Energy of Canada Limited
AOO
Anticipated Operational Occurrence
BDBA
Beyond Design Basis Accident
BEAU
Best Estimate with Analysis of Uncertainties
BECS
Boiler Emergency Cooling System
BWR
Boiling Water Reactor
CHF
Critical Heat Flux
CNSC
Canadian Nuclear Safety Commission
DBA
Design Basis Accident
DBE
Design Basis Earthquake
DSA
Deterministic Safety Analysis
ECC
Emergency Core Cooling
ECI
Emergency Coolant Injection (a subsystem of ECC)
EPR
European Pressurized Reactor
EWS
Emergency Water System
FMEA
Failure Modes and Effects Analysis
HPECC
High-Pressure ECC
HTS
Heat-Transport System (see also RCS)
IAEA
International Atomic Energy Agency
INES
International Nuclear Event Scale
INPO
Institute of Nuclear Power Operations
INSAG
International Nuclear Safety Advisory Group
LLOCA
Large Loss-of-Coolant Accident
LOCA
Loss-of-Coolant Accident
LPECC
Low-Pressure ECC
LWR
Light-Water Reactor
MCR
Main Control Room
MPECC
Medium-Pressure ECC
MSSV
Main Steam Safety Valve
Reactor Safety Design and Safety Analysis
170
The Essential CANDU
MWe
Megawatt electric
OPG
Ontario Power Generation
PRV
Pressure-Relief Valve
PSA
Probabilistic Safety Analysis
PWR
Pressurized-Water Reactor
R&D
Research and Development
RBMK
Реактор Большой Мощности Канальный (High Power Channel-Type Reactor)
RCS
Reactor Coolant System (see also HTS)
ROP
Regional Overpower (Protection System)
S/C
Suppression Chamber
SCA
Secondary Control Area
SCDF
Severe Core-damage Frequency
SDS
Shutdown System
SG
Steam Generator
SOE
Safe Operating Envelope
SOR
Shut-Off Rod
Sv
Sievert, a unit of radiation dose
TMI
Three Mile Island
USNRC
United States Nuclear Regulatory Commission
Reactor Safety Design and Safety Analysis
Reactor Safety Design and Safety Analysis
171
13 Appendix 1 – Basic Rules of Boolean Algebra
This is a quick refresher in the basics of Boolean logic.
Boolean algebra is a set of laws formulated by the British mathematician George Boole. It deals
with statements (here represented by A, B, C, etc.) which can be either true or false and are
often denoted by the numbers 1 and 0 respectively. So, for example, A=0 means that the
statement A is false.
For example, let A represent the statement, “the sun is the centre of the universe”. Then A=0.
13.1 Operators
Several operators can act on these statements:
AND is an operator which gives the answer C=1 only if both of its inputs are 1, and 0 otherwise.
It should be represented as:
A.B or AB or A∙B or A B or A.AND.B, or graphically as in Figure 69.
It can be thought of as the intersection of sets A and B.
Examples:
If A is true and B is true, then A B should be true.
If A=1 and B=0, then A.B=0.
OR is an operator which gives the answer C=1 only if either or both of its inputs
are 1, and 0 otherwise. It is represented as:
Figure 69 AND gate
A+B or A∪B or A.OR.B, or graphically as in Figure 70.
It can be thought of as the union of sets A and B.
Examples:
If A is true and B is false, then A∪B is true.
If A=1 and B=0, then A+B=1.
NOT is an operator which inverts the input.
Figure 70 OR gate
It is represented as .NOT.
The output of .NOT.A is denoted as A’ or Ā.
It is represented graphically as in Figure 71.
It can be thought of as “the opposite of” or “the complement of” set A.
Examples:
Figure 71 NOT gate
If A is true, then .NOT.A is false.
Reactor Safety Design and Safety Analysis
172
The Essential CANDU
There are also four lesser-used operators (.NAND., .NOR., .XOR., and .XNOR.)
13.2 Basic Principles
A=0 or A=1
(i.e., something can only be true or false, not both)
If A=0, A A=0
(i.e., if A is false, and because A A=A, then A A is false. Sometimes this is written as 0.0=0)
If A=1, A∪A=1
(i.e., if A is true, and because A∪A=A, then A∪A is true. Sometimes this is written as 1+1=1.
Remember, you are not doing arithmetical addition!)
If A=0, then A∪A=0
(This is obvious if you think of set theory as we did above. Sometimes it is written 0+0=0).
If A=1, then A A=1
Again, obvious from set theory; also written 1.1=1
If A=1 and B=0, then A B = B A = 0
(i.e., if A is true and B is false, then the intersection of A and B can never be true, and vice versa.
Sometimes this is written as 1.0 = 0.1 = 0)
If A=1 and B=0, then A∪B = B∪A = 1
(i.e., if either one of A or B is true, then the union of A and B (A.OR.B) is always true. This can be
written 1+0 = 0+1 = 1)
13.3 Theorems
These sound abstract, but are obvious once you draw Venn diagrams with set-theory symbols.
You can substitute the mathematical symbols + and ∙ for ∪ and if this is more intuitive for
you.
Reactor Safety Design and Safety Analysis
Reactor Safety Design and Safety Analysis
173
Commutative Law
A∪B = B∪A
A B = BA
Associative Law
(A∪B)∪C = A∪(B∪C)
(A B) C = A (B C)
Distributive Law
A (B∪C) = (A B) ∪ (A C)
A∪(B C) = (A∪B) (A∪C)
Identity Law
AA = A
A∪A = A
Completeness
(A B) (A B) A
(A B) (A B) A
Redundancy
A∪(A B) = A
A (A∪B) = A
Mathematical
1+A=1
1∙A=A
0+A=A
0∙A=0
Reactor Safety Design and Safety Analysis
174
The Essential CANDU
A+Ā=1
A∙Ā=0
A + ĀB = A + B
A(Ā + B) = A∙B
DeMorgan’s Theorem
(A B) A B
(A B) A B
These will be useful when you work out fault trees mathematically.
13.4 Combining Probabilities
If event A occurs x times out of n repeated experiments, then:
P( A) Probability of event A
x
lim n
n
(59)
Obviously:
0 P( A) 1
P( A) P( A) 1
(60)
In other words, an event must either occur or not occur; there is no third possibility.
13.4.1 Probability of both events occurring
A1A2 means that both events occur, and therefore P(A1A2) is the probability that both events
occur. The product rule for probabilities states that:
P(A1A2) = P (A1 | A2) P (A2) = P (A2 | A1) P (A1).
(61)
For example, if A1 is the probability that part 1 fails and A2 is the probability that part 2 fails,
then
P(A1A2) = probability that both part 1 fails and part 2 fails
= probability that part 2 fails (probability that part 1 fails, given that part 2 fails)
= probability that part 1 fails (probability that part 2 fails, given that part 1 fails).
Because probabilities are numbers, the does mean simple multiplication in these equations.
It is conventionally omitted; i.e., P(A1)P(A2) is understood to mean P(A1) P(A2).
The conditional probability P (A1 | A2) means the probability of event A1 given that event A2 has
Reactor Safety Design and Safety Analysis
Reactor Safety Design and Safety Analysis
175
occurred.
Figure 72 shows this graphically; yellow represents all events; green those events with outcome
A1; blue with outcome A2; red, with outcome both A1 and A2.
Figure 72 Probability of both of two events
If the events are independent,
P(A2 | A1) = P(A2).
(62)
P( A1 A2 ... AN ) P( A1 ) P( A2 A1 )...P( AN A1... AN 1 ) .
(63)
In general:
If events are independent:
P( A1 A2 ... AN ) P( A1 ) P( A2 )...P( AN ) .
(64)
13.4.2 Probability of either event occurring
The union of two events, A1 and A2, is denoted as:
A1 A2 or A1 + A2 or A1 OR A2.
This means the cases where either event occurs, including cases where both events occur. Note
that:
P(A1 + A2) = P (A1) + P (A2) - P (A1A2).
(65)
Reactor Safety Design and Safety Analysis
176
The Essential CANDU
Figure 73 Probability of either of two events
as shown in Figure 73. Note that the + sign on the left of this equation is not the same as the +
sign on the right: the former refers to the union of two sets, the latter to arithmetic addition.
The reason for subtracting P(A1A2) is that what you want is the total area encompassed by the
combination of the blue and green ovals in the diagram. If you simply add P(A1) and P(A2), you
count the intersection where both events occur (in red) twice. Therefore, you have to subtract
one of them away.
In general:
N 1
N
P( A1 A2 ... AN ) P( AN )
n 1
N
P( A A
n 1 m n 1
n
m
) ... (1) N 1 P( A1 A2 ... AN ) .
(66)
If events are independent:
N
1 P( A1 A2 ... AN ) [1 P( AN )] .
(67)
n 1
13.4.3 Rare independent events
Assuming (as is often but not always the case for nuclear failure probabilities) that the events
are both independent and rare, or P(AN)<<1, then:
N
P( A1 A2 ... AN ) P( AN ) .
(68)
n 1
Reactor Safety Design and Safety Analysis
Reactor Safety Design and Safety Analysis
177
14 Appendix 2 – Common-Cause Failures – An Example
Consider two shut-off rods, each of which has a probability of failure of 0.001 per demand.
What is the probability that they both fail when required?
If they are independent, then P(A1A2) = P(A1)P(A2) = (0.001)2 = 10-6 per demand.
Suppose that a common-cause (CC) failure occurs 10% of the time. That is:
P(A1) = P(A2) = 0.0009 (random) + 0.0001 (CC),
and therefore the probability of one rod failing given that the other has failed is 90% random
and 10% common cause (with probability 1):
P(A1|A2) = 0.9 * 0.001 + 0.1 * 1 = 0.1009
or
P(A1A2) = P (A1 | A2) P (A2) = 0.1009 * 0.001 = 0.0001009 ~ 10-4.
Therefore, a 10% common-cause probability has increased the combined probability of failure
by a factor of 100.
15 Appendix 3 – Why a Reactor Cannot Explode Like an Atomic Bomb
This Appendix provides further technical detail on the difference between a nuclear weapon
and a reactor power excursion that is not shut down. It assumes that you have read the reactor
physics Chapter. Some material is taken from [Meneley, 2003]. All material is in the public
domain.
Assume a pure plutonium core surrounded by a shaped charge of high explosive. The core is
initially subcritical and is rendered supercritical by compression from the explosive. The neutron kinetics follows the familiar equation (delayed neutrons are irrelevant here):
dN (t )
N (t ) ,
dt
(69)
where N(t) is the neutron density, is the reactivity, is the delayed neutron fraction, and is
the prompt neutron generation time.
Solving,
N (t ) N (0)e
(
)t
.
(70)
For a weapon, a typical value of - is ~1.7 (so that is pretty well irrelevant). Because criticality is achieved by fast, not thermal fission, is about 10-8 seconds or one “shake”. The e-folding
time (when the population of neutrons increases by a factor of 2.7) is therefore 1.7 shakes.
After 33 shakes, the number of neutrons is:
Reactor Safety Design and Safety Analysis
178
The Essential CANDU
8
N (33 108 ) 1 e1.710 3310 2.3 1024 .
8
(71)
Using very crude assumptions, such as not adding in the contribution of previous generations of
neutrons and not counting energy losses and core expansion, we can estimate the order of
magnitude of the energy produced. If each fission event generates 180MeV of usable energy,
and if for each incident neutron absorbed in Pu239, two fast neutrons are produced, the number
of neutrons in Equation (71) is accompanied by an energy release at 56ns of:
E 2.3 1024 neutrons 0.5 fissions / neutron 180 Mev / fission
1kT
8kT , (72)
2.6 1025 MeV
where kT is kilotons of TNT equivalent. This is 34 × 106MJ.
The reaction is self-limiting because the thermal energy causes the core to expand rapidly and
stops the chain reaction.
By contrast, in a thermal reactor such as CANDU, the largest - (from a large LOCA) is about
0.011; is about 0.001 sec. The timescale is measured in tens of seconds rather than nanoseconds, and the reaction is terminated by damage to the core lattice after about ten seconds, with
an energy input of ~50 full-power seconds. The total energy produced for an 1800MWth
reactor is therefore 9×10⁴ MJ, or more than two orders of magnitude smaller than the value for
a bomb.
16 Acknowledgments
We gratefully thank the following reviewers for their hard work and excellent comments during the
development of this Chapter. Their feedback has much improved it. Of course the responsibility for any
errors or omissions is entirely the author’s.
Glenn Archinoff
Glen McGee
Dan Meneley
Terry Rogers
We also thank Diana Bouchard for expertly editing and assembling the final copy.
Reactor Safety Design and Safety Analysis