1
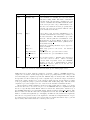
URDME v. 1.2: User’s manual
Pavol Bauer1
Brian Drawert2
Stefan Engblom1
Andreas Hellander2
December 19, 2012
1
Division of Scientific Computing, Department of Information Technology, Uppsala University, P. O. Box
337, SE-75105 Uppsala, Sweden, e-mails: [email protected], [email protected].
2
Department of Computer Science, University of California-Santa Barbara, Santa Barbara, California
93106, USA, e-mail: [email protected], [email protected].
Manager of this release: Pavol Bauer (to whom correspondence should be addressed).
1
Introduction
Stochastic simulation methods are frequently used to study the behavior of cellular control
systems modeled as continuous-time discrete-space Markov processes (CTMC). Compared
to the most frequently used deterministic model, the reaction rate equations, the mesoscopic
stochastic description can capture effects from intrinsic noise on the behavior of the networks
[1, 9, 26, 27, 30].
In the discrete mesoscopic model the state of the system is the copy number of the
different chemical species and the reactions are usually assumed to take place in a well-stirred
reaction volume. The chemical master equation is the governing equation for the probability
density, and for small to medium sized systems it can be solved by direct, deterministic
methods [11, 12, 16, 22, 25, 29]. For larger models however, exact or approximate kinetic
Monte Carlo methods [18, 19] are frequently used to generate realizations of the stochastic
process. Many different hybrid and multiscale methods have also emerged that deal with the
typical stiffness of biochemical reactions networks in different ways, see [2, 7, 20, 23, 24, 28]
for examples.
Many processes inside the living cell can not be expected to be explained in a well-stirred
context. The natural macroscopic model is the reaction-diffusion equation which has the
same limitations as the reaction rate equations. By discretizing space with small subvolumes
it is possible to model the reaction-diffusion process by a CTMC within the same formalism
as for the well-stirred case. A diffusion event is now modeled as a first order reaction from
a subvolume to an adjacent one and the state of the system is the number of molecules of
each species in each subvolume. The corresponding master equation is called the reactiondiffusion master equation (RDME) and due to the very high dimensionality it cannot be
solved by deterministic methods for realistic problem sizes.
The RDME has been used to study biochemical systems in [8, 15]. Here the next subvolume method (NSM) [8], an extension of Gibson and Bruck’s next reaction method (NRM)
[17], was suggested as an efficient method for realizing sample trajectories. An implementation on a structured Cartesian grid is freely available in the software MesoRD [21].
The method was extended to unstructured meshes in [13] by making connections to the
finite element method (FEM). This has several advantages, the most notable one being the
ability to handle complicated geometries in a flexible way. This is particularly important in
cell-biological models where internal structures often must be taken into account.
This manual describes the software URDME which provides an efficient, modular implementation capable of stochastic simulations on unstructured meshes. URDME is easy
1
to use for simulating and studying a particular model in an applied context, but also for
developing and testing new approximate methods. We achieve this by relying on third-party
software for the geometry definition, meshing, preprocessing and visualization, while using
a highly efficient computational core written in ANSI C for the actual stochastic simulation.
This keeps the implementation of the Monte Carlo part small and easily expandable, while
the user benefits from the advanced pre- and post-processing capabilities of modern FEM
software. In this version of URDME, we have chosen to provide an interface to Comsol
Multiphysics 3.5a and 4.x [3].
The rest of this manual is organized as follows. Section 2 summarizes the major changes
to URDME compared to the earlier version 1.1. Section 3 describes the software requirements and the installation procedure. An overview of the code structure is presented in
Section 4 and the details concerning the input to the code, the provided interface to Comsol
and the way models should be specified are found in Section 5. A URDME model is set up
and simulated in a step-by-step manner in Section 7 and in Section 8 we show how a new
core solver can be integrated in the URDME infrastructure.
In two appendices we recapitulate the mesoscopic reaction-diffusion model and show how
the stochastic diffusion intensities are obtained from a FEM discretization of the diffusion
equation. We also list for reference a few stochastic simulation algorithms.
We refer the interested reader to the full paper [5] for further information on the URDME
software, including comparisons to other available software and examples of some more
advanced usage.
2
Summary of major changes
Below, we summarize the major changes compared to URDME 1.1 [4].
• URDME 1.2 includes support for Comsol Multiphysics 4.x as well as Comsol Multiphysics 3.5a. The support for Comsol Multiphysics 3.5a will be removed in a coming
release of URDME.
• The syntax of the Matlab interface has been refined, essentially by moving the modelproperties from fem.urdme to the structure umod and storing the Comsol Multiphysics
geometry in the field umod.comsol.
• Basic SBML support has been added into URDME, allowing for translation of SBML
level 2 files into URDME model and propensity files with the external script sbml2urdme.
• The solvers can be compiled and executed without any Matlab dependencies using a
new, in-house library for reading .mat files. This feature does not support the full set
of Matlab data-structures, but is compatible with the NSM and DFSP solvers. It is
disabled by default. To enable it, define URDME LIBMAT in ’/build/Makefile.nsm’.
• Propensities for mass-action models can be defined directly in the Matlab model file
as inline propensities.
3
Obtaining and installing URDME 1.2
Usage: URDME is work in progress. You may use, distribute, and modify the code freely
under the GNU GPL license version 3. We welcome contributions, suggestions, comments,
and bug-reports. Support questions should be directed to the URDME mailing list, which you
can sign up for on http://www.urdme.org.
2
3.1
System requirements and software dependencies
• Linux or Apple OSX operating system.
• Matlab
– Tested versions: 2007a, 2008a, 2008b, 2009a, 2009b, 2011b, 2012a
– Command line interface must be installed
• Comsol multiphysics 3.5a (with appropriate patches) or Comsol multiphysics 4.x
– Tested versions: 3.5a, 4.0, 4.2, 4.3 (recommended)
– Must have Matlab integration components installed
• GCC (Xcode on Apple computers, with command-line tools)
– Executables gcc and make must be in the path
– Standard libraries must be installed
• The optional SBML support requires additionally
– Python runtime libraries 2.6 or higher
– SBML library for python (libsbml)
3.2
Installation procedure
1. Obtain the latest release of URDME from http://www.urdme.org. Download the file
urdme-1.2.tar.gz.
2. Unpack the archive. This can be done by running the command “tar -zxvf urdme1.2.tar.gz” in a terminal. Often it is possible to double click the file icon in the
operating system’s graphical file manager.
3. Run the installation script with ‘system administrator’ privileges. In a terminal,
change directory to urdme-1.2 created from the downloaded archive. Run the script
install.sh with ‘root’ or system administrator privileges. This can usually be done
by running the command “sudo ./install.sh”. Follow the prompts of the installation
script, the default values should be sufficient for most users. If the installation script
runs with no errors, URDME should be installed correctly.
3.3
3.3.1
Testing of the installation and Quick start guide
Using Comsol Multiphysics 3.5
1. Start Comsol and open a model file, e.g. urdme-1.2/examples/mincde/coli.mph.
2. From Comsol, start Matlab:
File > Client/Server/MATLAB > Connect to MATLAB
3. Initialize the Matlab environment.
• Change Matlab’s working directory to the folder for the URDME model you wish
to simulate. At the Matlab command prompt type
>> cd urdme-1.2/examples/mincde/
4. Export the model geometry from Comsol to Matlab.
• Update the Model data:
Solve > Update Model
3
• Export the data:
File > Export > FEM Structure as ’fem’
5. Simulate the model. At the Matlab command prompt type:
>> umod = urdme(fem,’mincde’)
6. Visualize the results. At the Matlab command prompt type:
>> postplot(umod.comsol,’Tetdata’,’MinD m’)
3.3.2
Using Comsol Multiphysics 4.x
1. Start the Comsol interface to Matlab (”LiveLink”),
./comsol server matlab in Unix-based systems.
2. Change Matlab’s working directory to the folder for the URDME model you wish to
simulate. At the Matlab command prompt type
>> cd urdme-1.2/examples/mincde/
3. Load the Comsol geometry into Matlab:
>> fem = mphload(’coli.mph’)
4. Simulate the model. At the Matlab command prompt type:
>> umod = urdme(fem,’mincde’);
5. Visualize the results. At the Matlab command prompt type:
>> umod.comsol.result.create(’res1’,’PlotGroup3D’);
>> umod.comsol.result(’res1’).set(’t’,’900’);
>> umod.comsol.result(’res1’).feature.create(’surf1’, ’Surface’);
>> umod.comsol.result(’res1’).feature(’surf1’).set(’expr’, ’MinD m’);
>> mphplot(umod.comsol,’res1’);
6. Optionally, save the output to a mph-file for further observations in the Comsol GUI:
>> mphsave(umod.comsol,’coli output.mph’)
3.3.3
Further possibilities
To manipulate the model, edit the following files:
coli.mph (Comsol model geometry, edited via the Comsol interface)
- Physical geometry and mesh properties
- Names of chemical species
- Diffusion coefficients
mincde.m (Matlab pre-processing script)
- Stoichiometric matrix
- Dependency graph
- Initial conditions of chemical species
- Custom diffusion rules (i.e. support for membrane-only species)
mincde.c C-functions defining the propensity (rate) of each reaction channel.
A more detailed description on how to set up and simulate this model is found in Section 7.
4
4
Code overview
URMDE consists of three logical layers. The top layer is made up of an interface to an
external mesh generator and pre-/post-processing engine, currently Comsol Multiphysics.
The bottom layer is a set of simulation routines, or solvers, written in ANSI C. Interfacing
those two levels is a middle layer implemented in the Matlab environment, designed to
facilitate data processing and visualization, as well as custom model development. Together
these layers form a software package that enables the development and efficient simulation
of complex and powerful models of spatial stochastic phenomena.
The URDME structure is designed with both efficiency and flexibility in mind. A model
is defined by three separate files, one for each of the logical layers. The geometry of the
model is defined in a Comsol .mph file, along with the names and diffusion rates of each
chemical species. A Matlab model file supplies the model with the stoichiometric matrix,
the dependency graph, and the initial state of the system. The stoichiometric matrix defines
the effect of the chemical reactions on the state of the system while the dependency graph
indicates the reaction rates that need to be updated after a given reaction or diffusion event
has occurred. Finally, a model file written in ANSI C specifies the propensity functions for
the chemical reactions in the system. Using compiled rather than interpreted reaction rates
ensures maximum efficiency when simulating the model.
The computational solver that ships with URDME is an efficient implementation of NSM
[8]. Table 4.1 shows the directory structure of URDME together with a short description of
each routine.
A solver has (at least) two arguments: the path to an input file in .mat format and a
name of an output file on which to store the trajectory that is generated. The input file will
contain all the data structures the solver needs, each with its specific name. The URDME
C-core contains utility routines to extract this data from the input file.
The main steps involved in launching a solver is outlined below, along with the routines
that perform the different tasks. Generally, the user does not have to know or perform
all these steps manually: they are all wrapped in the main routine urdme found in the file
‘urdme.m’. However, users planning to write a plug-in solver for URDME will benefit from
a more detailed knowledge of the code structure. The relevant steps are:
1. Process the .mph model file. This is achieved by exporting the FEM-structure from
Comsol to Matlab and invoking the routine comsol2urdme. This will initialize a new
structure, umod storing the original FEM-structure in the field umod.comsol. The
umod structure contains as well the fields D, vol, sd, i.e. those data structures related
to the geometry of the model and to the unstructured mesh. Compare Table 4.1.
2. The next step is to invoke the Matlab .m model file to initialize the remaining, essential
data structures, N, G, u0, tspan and optionally data. They should all be added as fields
to the umod struct. Any modifications of the data structures added to the model by
comsol2urdme in the previous step is typically performed in this step as well.
3. After all required fields in the umod struct have been initialized, urdme validate is
invoked to perform error-checking on the input to make sure that all required fields in
umod are present and has the correct properties.
4. Next, all fields in umod is serialized to a .mat input-file using urdme2mat.
5. After specifying the propensities in a ANSI C source file, the solver(s) are compiled
using urdme compile and then launched by a system call from within the Matlab
environment (or directly from e.g. a bash terminal).
6. The input file is now read by the solver, using the utility routine read model found in
‘matmodel.h’. read model allocates, initializes and returns a C-struct urdme model.
This urdme model struct is then the sole input to the routine nsm found in ‘nsm.c’.
5
nsm unpacks the structure and calls the main simulation routine nsm core found in
’nsmcore.c’. A similar construction should be used by contributed solvers for easy
integration, see Section 8.
7. After successful simulation, the resulting trajectory is written to an output file in .mat
format. This file is then loaded back into Matlab and added to the FEM-struct by
urdme2comsol for visualization using Comsol routines or custom Matlab scripts.
5
Details and specifications
In this section we give a detailed description of the input to urdme and explain how the
coupling between the Comsol/Matlab interface and the solvers works.
5.1
Input to the solver
Table 5.1 summarizes the input to the NSM solver. For precise type definitions, consult the
preamble of the source file ‘nsmcore.c’. While specific for the NSM solver, most of the input
data are likely to be needed by any simulation algorithm. Furthermore, contributed solvers
should preferably accept the same set of input as the NSM solver for compatibility across
models.
5.2
Specifying propensities for chemical reactions
We have provided two separate methods to specify the reaction propensities. Simple polynomial rate laws (mass-action) can be provided as inline propensities and can be specified
in the Matlab model file. For general propensities and full flexibility, the rate laws can be
specified in a model file written in C.
An “inline propensity” is a compact data format for specifying basic chemical reactions
with polynomial rate laws. An inline propensity P can be defined as
(
k1 xi xj
+ k2 xk + k3 Ω if i 6= j,
Ω
P (x) =
k1 xi (xi −1)
+
k2 xk + k3 Ω if i = j.
2Ω
Here x is the column in x which contains the state of the subvolume considered and Ω is
the corresponding volume. The coefficients and indices are specified in matrices K and I
where K(:, r) = [k1 ; k2 ; k3 ] and I(:, r) = [i; j; k] are the constants corresponding to the rth
inline propensity. The matrix S is a (possibly empty) sparse matrix such that S(:, r) lists all
subdomains in which the rth inline propensity is turned off. Note that no inline propensities
are active in subdomain zero! A complete example of the use of inline propensities can be
found in the ’annihilation’ example that ships with URDME 1.2.
The other (and fully general way) to specify propensity functions are to supply them to
urdme as a model file written in ANSI C. The precise form of the propensity functions is
defined by the data type PropensityFun, defined in the header ‘propensities.h’ (found in
the ‘include’ directory) as
typedef double (*PropensityFun)(const int *x, double t, double vol,
const double *data, int sd);
The arguments vol, data, and sd to a PropensityFun are described in Table 5.1. Additionally, the input vector x of length Mspecies is the copy number in a given subvolume,
and t is the absolute time. Note that none of the current solvers are capable of simulating
Markov chains with explicitly time-dependent propensities. The time argument is included
in the typedef at this stage only to simplify future developments.
Below is a commented example of a model file defining a simple chemical system composed of a single species X undergoing a dimerization reaction.
6
Directory
File(s)
Description
bin
urdme init
Environmental variable helper program.
build
Makefile
GNU Make input file for automatic solver compilation.
Makefile for the NSM solver.
Makefile.nsm
comsol
comsol2urdme.m
urdme2comsol.m
Matlab-script converting Comsol’s FEM-struct to
a valid urdme-input.
Matlab-script for conversion of the output of
urdme to the solution format used by Comsol.
doc
manual.pdf
The most recent version of this manual.
include
matmodel.h
propensities.h
report.h
read matfile.h
Functions to serialize data to/from solvers.
Definition of the propensity function datatype.
Header for report.c.
Functions to read/write .mat files.
msrc
urdme.m
urdme startup.m
urdme compile.m
urdme validate.m
urdme2mat.m
urdme addsol.m
Gateway routine for the solvers.
Initializes URDME.
Automatic solver compilation.
Input validation.
Serialize model data for input to solvers.
Read an output file and add solution to umod
(used when running in background mode).
Convert ”inline” propensities into an ANSI C
propensity file.
urdme inline convert.m
src
report.c
matmodel.c
read matfile.c
Report function used by urdme.
Functions to serialize data to/from solvers.
Functions to read/write .mat files.
src/nsm
nsm.h
nsm.c
nsmcore.c
binheap.h
binheap.c
Header for the NSM solver.
NSM solver interface.
NSM solver computational core.
Header for binheap.c.
The binary heap used in the NSM solver.
sbml
sbml2rdme
Translate SBML models into URDME models.
examples
(various)
Contains files specifying the example studied in detail in Section 7.
Table 4.1: Overview of the files and routines that make up URDME.
7
Name
Type
Description
Ncells
Mspecies
scalar (int)
scalar (int)
Mreactions
dsize
scalar (int)
scalar (int)
Number of subvolumes.
Number of different species. This also defines
Ndofs:= Mspecies×Ncells.
Number of reactions.
Size of the data vector used in the propensity
function.
u0
Matrix[Mspecies×Ncells]
(int)
vector (double)
tspan
u0(i, j) gives the initial number of species i
in subvolume j.
An increasing sequence of points in time
where the state of the system is to be returned.
Propensity function pointers. See Section 5.2
for details.
Pointer to a report function. This function
is called every time the chain reaches a value
in tspan.
report
Vector[Mreactions]
(PropensityFun)
ReportFun
vol
Vector[Ncells] (double)
sd
Vector[Ncells] (int)
data
Matrix[dsize×Ncells] (double)
D
Sparse matrix[Ndofs× Ndofs]
(double)
N
Sparse matrix[Mspecies
Mreactions] (int)
G
Sparse
matrix[Mreactions
× (Mspecies+Mreactions)]
(int)
prop
×
The volume of the macroelements, i.e. the
diagonal elements of the lumped mass-matrix
M (cf. Appendix A.2).
The subdomain numbers of all subvolumes.
See Section 7 for more details.
Generalized data vector. A pointer to column j is passed as an additional argument
to the propensities in subvolume j.
The transpose of the diffusion matrix M −1 K
obtained from the FEM discretization of
the macroscopic diffusion equation, cf. (A.5).
Each column in D (i.e. each row in M −1 K)
corresponds to a subvolume, and the nonzero coefficients D(i, j) give the diffusion rate
constant from subvolume i to subvolume j.
The stoichiometric matrix. Each column corresponds to a reaction, and execution of reaction j amounts to adding the jth column
to the state vector.
Dependency graph.
The first Mspecies
columns correspond to diffusion events and
the following Mreactions columns to reactions. A non-zeros entry in element i of column j indicates that propensity i needs to be
updated if the event j occurs. See Section 7
for examples.
Table 5.1: Input arguments to urdme. For more details, see the source file ‘nsmcore.c’. All
data in the table will be passed to the core simulation routine via a C-struct urdme model
except prop and report that are specified in separate C files. For all sparse matrices, the
compressed column sparse (CCS) format is used. This is the same format Matlab uses and
online documentation is available.
8
/* Propensity definition of a simple dimerization reaction. */
#include <stdlib.h>
#include <stdio.h>
/* Type definition for propensity functions: */
#include "propensities.h"
/* Rate constant. */
const double k = 1.0e-3;
double rFun1(const int *x, double t, double vol, const double *data, int sd)
/* X + X -> 0. */
{
return k*x[0]*(x[0]-1)/vol;
}
PropensityFun *ALLOC_propensities(void)
/* Allocation. */
{
PropensityFun *ptr = (PropensityFun *)malloc(sizeof(PropensityFun));
ptr[0] = rFun1;
return ptr;
}
void FREE_propensities(PropensityFun *ptr)
/* Deallocation. */
{
free(ptr);
}
A model file must implement the following routines:
• PropensityFun *ALLOC_propensities(void)
• void FREE_propensities(PropensityFun *ptr)
The first function should allocate and initialize an array of function pointers to the propensity
functions and return a pointer to this array. This is the function that the solvers will call
to access the rate functions. The second function should deallocate the pointer ptr. For
further examples, see Section 7.
6
Using the SBML interface
The SBML interface is found in the sbml directory and allows for translation of downloaded
SBML files to URDME compatible model and propensity definitions.
6.1
Installation procedure
1. Install the Python runtime libraries (Version 2.6 or higher) available at http://www.
python.org.
2. Download and install the official SBML library from http://sbml.org/Software/
libSBML. Make sure to enable the language interface (API) to Python during the
installation. The detailed guide on how to compile libsbml with the Python API is
available in the online documentation of the library.
9
6.2
Testing and quick start guide
1. Change into the sbml directory of the URDME installation.
2. You can now use the sbml2urdme translator to generate a propensity and model function of the mincde example, described in detail in chapter 7. Execute the bash-script
sbml2rdme in combination with the provided SBML-file mincde.xml as first parameter.
./sbml2rdme mincde.xml
You should obtain the following information:
Creating model c-file mincde.c
Creating model m-file mincde.m
3. The script generated a model (.m) and propensity (.c) file with the same filename as
the SBML specification file (in this case ’mincde’). You can proceed with execution
the generated files together with geometries imported from Comsol Multiphysics.
umod = urdme(fem,’mincde’)
Asuming the geometry definition to be available in the variable fem.
! The SBML Level 2 specification is not sufficient to describe all properties and dynamics of a full URDME model. Although the generated models are fully operational
they can be considered as drafts which can be manually extended with more specific
model requirements. See chapter 7 for extensions of the mincde-model.
6.3
Usage guide
The SBML translator can be called as a bash-script where model.xml is the SBML definition
file and the output directory is an optional parameter.
./sbml2rdme <model.xml> [output directory]
Alternatively, the Python script sbml2rdme.py available in sbml/src directory of the
distribution can be called with the same parameters within the Python environment.
6.4
Limitations
In the actual version the translator supports exclusively SBML Level 2. Reverse reactions
are not supported.
7
Example: Min oscillations in E. Coli
In this section we describe the general workflow involved in setting up and simulating a
model in URDME using the Comsol and Matlab interfaces. The major steps are:
1. Specify the model. This involves defining the geometry, mesh, initial conditions and
chemical reactions of the model. In URDME, this will require the generation of three
model files: a Comsol model file ‘model.mph’ , a Matlab model file ‘model.m’ and a
reaction propensity ANSI C file ‘model.c’, where we use model as a placeholder for the
non-extension part of the file-name.
The Comsol model defines the geometric domain of the problem and Comsol Multiphysics is used to create a mesh representing the spatial discretization of the diffusion
equation with Neumann boundary conditions and the corresponding inter-voxel diffusion jump coefficients. The Matlab model file specifies the chemical reaction networks
10
of the problem by defining a stoichiometric matrix N and a dependency graph G. The
propensity functions for the chemical reactions are specified in the ANSI C model file.
2. Export the FEM-structure from Comsol to Matlab. After defining the geometry and
using Comsol to create a tetrahedral mesh of the model, the resulting data structure (FEM) is exported from Comsol to the Matlab workspace via the built-in Comsol/Matlab coupling.
3. Run the simulation. The solver is launched from the Matlab workspace via the interface
routine in ‘urdme.m’. As input, you will have to specify the .m and .c model files.
Internally, urdme uses comsol2urdme to initialize the main structure umod.The function
defined in the file ‘model.m’ file then appends data to this structure.
4. Post-processing. After a normal termination of the solver, a trajectory of the stochastic
process will be attached to the Comsol file stored in umod.comsol. At this point, you
can use all post-processing options available in the Comsol interface to visualize the
results. If you have other needs not covered by the built-in routines, you can implement
your own post-processing scripts in Matlab. If using Comsol Multiphysics 4.x, you
might as well save the solution stored in umod.comsol to a file via the command
mphsave and observe0 it externally in the Comsol GUI.
To illustrate the above steps in detail, we will reproduce simulations of the Min system
from [15]. The geometry will be a model of an E. coli bacterium. It is rod shaped with
length 3.5µm and diameter 0.5µm. The reactions and parameters of the model can be found
in Table 7.1.
k
d
MinD m
MinD c atp −→
k
de
Min e+MinD m −−
→ MinDE
k
dD
MinD c atp + MinD m −−
→ 2MinD m
k
e
MinDE −→
MinD c adp + Min e
kp
MinD c adp −→ MinD c atp
Table 7.1: The chemical reactions of the MinD/MinE model. The constants take the values
kd = 0.0125µm−1 s−1 , kdD = 9 × 10⁶ M −1 s−1 , kde = 5.56 × 10⁷ M −1 s−1 , ke = 0.7s−1 and
kp = 0.5s−1 .
7.1
Setting up the model for simulation
The following steps shows how to create the Comsol model file. If you don’t want to go
through all the steps yourself, open the example file ‘coli.mph’ in the ‘examples/mincde’
folder.
Defining the geometry and diffusion rates in Comsol Multiphysics 3.5
1. Open Comsol and select ‘Chemical engineering module – Mass transport – Diffusion –
Transient analysis’ (3D). In the ‘Dependent variables’ field write MinD c atp MinD m,
Min e MinDE MinD c adp. These are the names of the variables that we will use. Select
Lagrange – Linear elements and press ‘OK’.
! Note that the ‘Chemical engineering module’ is not required in general for URDME,
but is used in this example for convenience.
2. Next we create the geometry. We will build the rod shaped domain from two spheres
and one cylinder. Press the ‘Cylinder’ button and in the radius and height field enter
0.5e-6 and 3.5e-6 and press ‘OK’. You should now see a cylinder in your workspace.
In the ‘Draw mode’ action bar, press ‘Zoom extents’ in order to get a better view of
the domain. Press the ‘sphere’ button and enter 0.5e-6 in the radius field and press
11
‘OK’. Create another identical sphere but enter 3.5e-6 as the z-coordinate. Select all
three figures and press the ‘union’ button and then the ‘Delete interior boundaries’
button.
3. Having defined the species and the geometry, the next step is to specify the parameters
in the model. In the menu ‘Physics > Subdomain settings’, choose subdomain 1 and
set the diffusion constants to 2.5e-12 for MinD c adp, MinD c atp and Min e. For
MinDE and MinD m the diffusion constant should be 1e-14.
! MinDE and MinD m are membrane bound species, hence their lower diffusion rates.
We have not specified this explicitly at this stage, but will do so later in the Matlab
model file.
4. In order to be able to distinguish between the interior of the bacterium and the membrane, we must also create two domains. One interior domain that represents the
cytoplasm and one boundary domain that represents the membrane. This is done by
defining the special variable rdme sd as an expression with different value in the different subdomains. It can then be used to distinguish the nodes on the boundary from
those in the interior. Select ‘Options > Subdomain expressions’ and enter rdme sd
with value 1 and click ‘OK’. Select ‘Options > Boundary expressions’ and select all
boundaries (there should be 12 of them). Enter rdme sd with value 2. Finally select
‘Options > Global expressions’ and enter rdme sdlevel with value 2 indicating that
the lowest dimension where rdme sd is defined is on the surface of the geometry.
5. In the ‘Mesh’ menu, select ‘Mesh > Free mesh parameters’ and choose ‘Custom mesh
size’. Set the maximum element size to 1e-7 and press ‘Initialize mesh’. Now select
‘Solve > Update model’. Make sure that you are connected to Matlab, if not, connect
via ‘File > Client/Server/Matlab > Connect to MATLAB’. Then export the FEM
structure to the Matlab workspace from the ‘File > export’ menu.
Defining the geometry and diffusion rates in Comsol Multiphysics 4.x
1. Open Comsol and use the Model Wizard to create the model template. Select ‘3D’ as
space dimension’ and add the physics module ‘Chemical Species Transport / Transport
of Diluted Species’ in the next step. In the ‘Dependent variables’ window chose the
‘Number of species’ to be 5 and in the ‘Concentrations’ list enter the names MinD c atp
MinD m, Min e MinDE and MinD c adp. These are the names of the variables that we
will use. Select the ‘Time Dependent’ study type in the next step of the wizard and
click on the flag symbol to create the template.
! Note that the ‘Chemical engineering module’ is not required in general for URDME,
but is used in this example for convenience.
2. Next we create the geometry. We will build the rod shaped domain from two spheres
and one cylinder. Right click on ‘Geometry 1’, select the ‘Cylinder’ option and in the
radius and height field enter 0.5e-6 and 3.5e-6. Click on the ‘Build Selected’ Button
and you should now see a cylinder in your workspace. Now, select the ‘Sphere’ node
from the ‘Geometry’ context-menu and and enter 0.5e-6 in the radius field. Create
another identical sphere but enter 3.5e-6 as the z-coordinate. Click on ‘Build All’
and observe the created domain in the graphics-window.
Right click on ‘Geometry’ again and select ‘Boolean Operations > Union’. Select
all three domains and add them to the ‘Input objects’ selection. Uncheck the ‘Keep
interior boundaries’ box and complete the geometry creation by pushing the ‘Build
All’ button.
3. Having defined the species and the geometry, the next step is to specify the parameters in the model. In the physics settings ‘Transport of Diluted Species > Transport
12
Mechanisms’, deactivate the flag on ‘Convection’. Next we need to specify the diffusion constants of the species in the ‘Diffusion’ node of the physics menu. Enter the
diffusion coefficients 2.5e-12 for MinD c adp, MinD c atp and Min e. For MinDE and
MinD m the diffusion constant should be 1e-14. The units of all constants are m2 /s.
! MinDE and MinD m are membrane bound species, hence their lower diffusion rates.
We have not specified this explicitly at this stage, but will do so later in the Matlab
model file.
4. In order to be able to distinguish between the interior of the bacterium and the membrane, we must also create two domains. One interior domain that represents the
cytoplasm and one boundary domain that represents the membrane. This is done
by defining the special variable rdme sd as an expression with different value in the
different subdomains. It can then be used to distinguish the nodes on the boundary
from those in the interior.
Click right on the menu ‘Definitions’, and create two ‘Variables’ elements. In the first
one, select the ‘Geometry entity level’ to be ‘Domain’ and chose the ‘Selection’ to be
‘All domains’. Now, enter a new variable in the window below by specifying the name
to rdme sd and expression to 1.
In the second Variable-element, specify the geometric entity level to ‘Boundary’ and
set the ‘Selection’ to ‘All boundaries’. Enter the variable name rdme sd into the
‘Variables’ window and set the expression to 2 indicating that the lowest dimension
where rdme sd is defined is on the surface of the geometry.
5. In the ‘Mesh’ node, set ‘User controlled mesh’ as sequence type and in the appeared
‘Size’ node select the ‘Custom’ option. Set the maximum element size to 1e-7 and
press ‘Build All’. Now click on the ‘Study’ node and press the ‘Compute’ button.
Now you need to transfer the created geometry into Matlab. Make sure that you are
connected to the Server, if not, connect via ‘File > Client Server > Connect to Server’.
When having a working connection the export can be performed by selecting ‘File >
Client Server > Export Model to Server’.
Another option is to save the model as a mph-file, and open it later in a running
Matlab session with ‘LiveLink’ via the command mphload.
Specifying the chemical reactions The chemical reactions are specified in a separate
model file written in C. This file will be given as input to URDME, which will compile
and launch a solver. Every time the reaction propensity file is changed, the solver needs to
be recompiled, but this will be automatically detected by URDME. The way the reaction
propensity functions are specified are explained in more detail in Section 5.2, which we
recommend that you read before continuing with this example.
The following code specifies the reaction propensity model .c file for the reactions in
Table 7.1. This file is located in ‘examples/mincde/fange.c’ in the URDME installation
directory. Either open that file, or create a new one of your own, entering the code below.
#include <stdlib.h>
#include "propensities.h"
/* Ordering of the
#define MinD_c_atp
#define MinD_m
#define MinD_e
#define MinDE
#define MinD_c_adp
species. */
0
1
2
3
4
13
/* Indicator values of sd. */
#define CYTOSOL 1
#define MEMBRANE 2
/* Number of reactions. */
#define NR
5
/* Rate constants.
const double NA
const double kd
const double kdd
const double kde
const double ke
const double k_adp
*/
= 6.022e23;
= 1.25e-8;
= 9.0e6;
= 5.56e7;
= 0.7;
= 1.0;
/* Reaction propensities. */
double rFun1(const int *x, double t, double vol, const double *data, int sd)
/* MinD_c_atp -> MinD_m */
{
if (sd == MEMBRANE)
return kd*x[MinD_c_atp]/data[0];
return 0.0;
}
double rFun2(const int *x, double t, double vol, const double *data, int sd)
/* MinD_c_atp + MinD_m -> 2MinD_m */
{
return kdd*x[MinD_c_atp]*x[MinD_m]/(1000.0*NA*vol);
}
double rFun3(const int *x, double t, double vol, const double *data, int sd)
/* MinD_m + Min_e -> MinDE */
{
return kde*x[MinD_m]*x[MinD_e]/(1000.0*NA*vol);
}
double rFun4(const int *x, double t, double vol, const double *data, int sd)
{
return ke*x[MinDE];
}
double rFun5(const int *x, double t, double vol, const double *data, int sd)
/* MinD_c_adp -> MinD_c_atp */
{
return k_adp*x[MinD_c_adp];
}
PropensityFun *ALLOC_propensities(void)
{
PropensityFun *ptr = malloc(sizeof(PropensityFun)*NR);
14
ptr[0]
ptr[1]
ptr[2]
ptr[3]
ptr[4]
=
=
=
=
=
rFun1;
rFun2;
rFun3;
rFun4;
rFun5;
return ptr;
}
void FREE_propensities(PropensityFun* ptr)
{
free(ptr);
}
There are a few points that deserves highlighting:
• Note the unit conversions given explicitly in the bimolecular propensity function. The
rate constants for the bimolecular reactions in this model are given in the unit M −1 s−1
and need to be converted to mesoscopic rates. That is why we divide with Avogadros
number times the volume of the subvolume. Also, the way we have set up the geometry
model file, the volume is given in the unit m3 , and needs to be converted to L3 .
URDME cannot keep track of matching the units between the different model files
automatically: this is the responsibility of the end-user.
• Note how we use the input sd in the first reaction to make sure that it only occurs
in subvolumes lying on the membrane. We have to make sure, however, that we keep
track of what value we assigned to the different subdomains in the Comsol model file
(the value of the expression rdme sd).
• The input t passes the current time to the propensity function. This input is included
in the typedef of the propensity function to make it more general and accommodate
future needs. However, the NSM-solver does not currently handle time dependent
propensities correctly. Thus, the resulting stochastic trajectory will not be a statistically correct realization of the intended process.
• The first reaction in the model contains a scaling with the local length scale of the
subvolume. For a uniform Cartesian mesh this would simply have been the (constant)
side lengths of the cubes in the mesh. For the unstructured mesh however, this value
will be different in every subvolume. It is readily obtained from Comsol, and is passed
to the propensity function via the data vector data. data will be initialized with the
correct values in the Matlab model file fange.m, next to be described.
Creating a .m model file Before we can run the simulation, we have yet to specify a few
more data structures. We will also need to modify the diffusion rates that we obtain from
the initial Comsol model so that the membrane-bound species only diffuse on the membrane.
We have already prepared for this by labeling the subvolumes next to the boundary using
the expression rdme sd in the Comsol model file ‘coli.mph’.
Open the file ‘examples/mincde/fange.m’. We will walk through the contents of this file
and explain what the different parts do. Additional information can also be found in the
comments in the file.
1. The stoichiometric matrix. To execute the reactions, the solvers need to know the
stoichiometry of the reactions. This is specified via a sparse matrix N of dimensions
Mspecies × Mreactions. Entry (i, j) in N tells how species i changes upon execution
of reaction j. The following lines of code will set up the stoichiometric matrix for our
example:
15
% Stoichiometric matrix. Every column corresponds to a reaction.
umod.N = sparse([-1 -1 0 0 1 ;...
1
1 -1 0 0 ;...
0
0 -1 1 0 ;...
0
0 1 -1 0 ;...
0
0 0 1 -1]);
2. The dependency graph. Efficient implementations of simulators for large systems uses
a dependency graph to minimize the re-computation of rates. URDME requires that
such a graph G, in the form of a sparse matrix, be submitted to the NSM-solver. It
should have dimensions Mreactions × (Mspecies+Mreactions). The following code
sets up G for this example.
% Dependency graph. The first Mspecies columns indicate the propensities
% that need to be updated when the corresponding species diffuses. The
% next Mreactions columns work analogously for reaction events.
umod.G = sparse([1 0 0 0 0 1 1 0 0 1;...
1 1 0 0 0 1 1 1 0 1;...
0 1 1 0 0 1 1 1 1 0;...
0 0 0 1 0 0 0 1 1 0;...
0 0 0 0 1 0 0 0 1 1;]);
A non-zero entry at row i in column j means that propensity number i must be updated
if species j diffuses (j ≤ Mspecies) or if reaction j−Mspecies occurs (j > Mspecies).
! A common reason for errors when developing a new model is errors in N or G. A quick
way of setting up the dependency graph is umod.G = sparse(ones(Mreactions,
Mspecies+Mreactions)). This will make all propensities be recomputed after each
event. While making the code run slower, this is guaranteed to be correct and can be
useful when debugging your model file.
3. The initial condition. There is complete freedom in specifying the initial condition. In
the present case we simply distribute 4002 M inD c atp and 1040 M inE molecules in
some random way in the entire bacterium.
% Specify the total number of molecules of the species.
nMinD = 4002;
nMinE = 1040;
u0 = zeros(Mspecies,Ncells);
ind = floor(Ncells*rand(1,nMinE))+1;
u0(3,:) = full(sparse(1,ind,1,1,Ncells));
ind = floor(Ncells*rand(1,nMinD))+1;
u0(5,:) = full(sparse(1,ind,1,1,Ncells));
umod.u0 = u0;
Note that the code above does not produce a uniformly random initial distribution
since the volume of each voxel is not taken into account.
4. Specifying the times to output the state of the system. URDME will look for a vector
tspan to determine when to output the state of the trajectory (the number of events
16
generated in a typical realization often exceeds 109 so we can’t output after each event).
Here, we want to sample the system on the time interval [0, 200s], with output each
second. This is achieved by:
umod.tspan = 0:200.
5. Membrane diffusion. In order to make M inD m and M inDE diffuse only on the
membrane, we will zero out all elements in the diffusion matrix that are in the cytosol.
To obtain indices of those subvolumes we use the information in the subdomain vector
sd. sd will be generated by the urdme interface upon calling the solver interface, and
will contain the information encoded in the expression rdme sd in the Comsol model
file. For more details, see Section 5.
pm = find(umod.sd == 2);
cyt = find(umod.sd == 1);
Remember that we gave rdme sd the value 2 on the membrane and 1 in the interior.
The diffusion matrix D will contain the rate constants for the diffusive events on the
unstructured mesh. D is also generated from the Comsol model file when calling the
solver, and will be available to the .m model file in umod.D. To (efficiently) zero out
the correct entries in D, we first decompose the sparse matrix, find the entries using pm
and cyt above, and then reassemble the matrix again (compensating for the removed
entries by adjusting the diagonal of the matrix). All in all, the code to do this is as
follows:
% For MinD_m (2) and MinDE (4), flag all dofs in the cytosol for
% removal.
ixremove = [];
for s = [2 4]
ixremove = [ixremove; Mspecies*(cyt-1)+s];
end
D = umod.D’;
% Decompose the sparse matrix.
[i,j,s] = find(D);
% Set all elements in the diffusion matrix corresponding
% to the cytosol to zero.
ixremove = [find(ismember(i,ixremove)); find(ismember(j,ixremove))];
i(ixremove) = [];
j(ixremove) = [];
s(ixremove) = [];
% Reassemble the sparse matrix and adjust the diagonal entries.
ixkeep = find(s > 0);
D = sparse(i(ixkeep),j(ixkeep),s(ixkeep),Ndofs,Ndofs);
d = full(sum(D,2));
D = D+sparse(1:Ndofs,1:Ndofs,-d);
umod.D = D’;
17
! It is of fundamental importance that the columns of D sum to zero, and that all offdiagonal entries are positive. For an introduction to how D is constructed, see Appendix
A. For a detailed account, consult [13].
! The way we have modeled membrane diffusion is simply by saying that the subvolumes
closest to the membrane constitute the membrane layer. As the mesh becomes finer
near the boundary, the thickness of this layer will decrease, eventually approaching a
2D model of the membrane. One can think of other ways of modeling the membrane
diffusion. The most obvious is to explicitly draw the membrane as a separate (true)
subdomain with a fixed thickness in the Comsol model file. This would usually mean
that more subvolumes are needed to resolve that thin layer.
6. The generalized data vector. Finally, we need to set umod.data to contain the values of
the length parameter for the subvolumes (it is needed in the first reaction, rFun1). To
do this, we use the built-in Comsol function postinterp in version 3.5 or mphinterp
in version 4.x which can be used to evaluate an expression in any point in the domain. Here, we simply get the subvolume sizes by using the pre-defined expression h,
evaluated in the vertices of the mesh.
When using Comsol Multiphysics 3.5 we type:
dofs = xmeshinfo(fem,’Out’,’dofs’);
umod.data = postinterp(umod.comsol,’h’,dofs.coords(:,1:Mspecies:end));
umod.data = umod.data(dofs.nodes(1:Mspecies:end));
In Comsol Multiphysics 4.x we use the following code instead:
xmi = mphxmeshinfo(umod.comsol);
umod.data = mphinterp(umod.comsol,’h’,’coord’, ...
xmi.dofs.coords(:,1:Mspecies:end), ’solnum’, 1);
umod.data = umod.data(xmi.dofs.nodes(1:Mspecies:end)+1);
! The ordering of the vertices in the mesh in the FEM structure (e.g. fem.mesh.p) is
not necessarily the same as the ordering in Comsol’s extended mesh format of the degrees of freedom. To ensure that the ordering is consistent between these two structures
we can alternatively transform them using the following method in Comsol 3.5:
dofs = xmeshinfo(fem,’Out’,’dofs’);
data = postinterp(fem,’h’,fem.mesh.p);
umod.data = data(dofs.nodes(1:Mspecies:end));
For more details concerning the internal ordering of the dofs, consult the Comsol user’s
manual. The interface routines comsol2urdme and urdme2comsol also contain useful
information on this matter.
7.2
Running the simulation
With all three model files set up correctly, we are now ready to launch the simulation. In
Matlab, change the current working directory to ‘examples/mincde’ (or if you have prepared
your files in another directory, to that one).
First, we need to load the Comsol Multiphysics FEM-model into the Matlab workspace,
either by requesting it from the server or by typing:
>> fem = mphload(’coli.mph’);
Asuming coli.mph is the file name of the model previously created in Comsol Multiphysics. To launch the simulation, call the main interface routine in ‘urdme.m’:
18
>> umod = urdme(fem,’mincde’);
URDME will now extract information from the Comsol and Matlab model files, compile
the solver with linking to the propensities specified in mincde.c, and then execute the solver
by making a system call.
7.3
Post-processing
If the simulation in the previous step completed without errors, the model structure will
now contain a realization of the stochastic process. To visualize the trajectory, we can use
any of the visualization options available in Comsol or we can create routines of our own.
To look at the MinD m distribution on the membrane at the final time we can use Comsol’s
post-processing functionality:
Post-processing using Comsol Multiphysics 3.5
>> postplot(umod.comsol,’Tetdata’,’MinD_m’);
To visualize the result at any other time, e.g after 100s:
>> postplot(umod.comsol,’Tetdata’,’MinD_m’,’T’,100);
! You can specify any time in the interval you simulated, but if you specify a time that
lies between two points in tspan Comsol will do interpolation to approximate the result at
that point.
To visualize a species inside the domain, we can do as follows:
>> postplot(umod.comsol,’Slicedata’,’MinD_c_atp’);
There are many more options that can be passed to postplot to control the plot produced.
For a detailed account , see the Comsol documentation:
>> help postplot
If you prefer to work within the Comsol GUI for visualization, you can import the FEM
structure stored in umod.comsol with the attached stochastic trajectory back into Comsol.
Then, from the Comsol GUI, import the new structure (umod.comsol): ’File > Import >
FEM structure...’. You can now visualize the trajectory using the menu ’Postprocessing >
Plot Parameters’.
Post-processing using Comsol Multiphysics 4.x
>> umod.comsol.result.create(’res1’,’PlotGroup3D’);
This command creates a plot-contanainer for the following visualization.
To visualize the result at a specific time, e.g after 100s:
>> umod.comsol.result(’res1’).set(’t’,’100’);
! You can specify any time in the interval you simulated, but if you specify a time that
lies between two points in tspan Comsol will do interpolation to approximate the result at
that point.
To visualize the result of the simulation on the surface we can use:
>> umod.comsol.result(’res1’).feature.create(’surf1’, ’Surface’);
>> umod.comsol.result(’res1’).feature(’surf1’).set(’expr’, ’MinD_m’);
>> mphplot(umod.comsol,’res1’);
19
Where we can replace the string ’MinD m’ with the name of any other occupied species.
To visualize the solution inside the domain, we need to first create a new plot container.
>> umod.comsol.result.create(’res2’, ’PlotGroup3D’);
>> umod.comsol.result(’res2’).set(’t’,’100’);
Now we can visualize the solution on a ‘slice’ of the zx-axis of the model.
>>
>>
>>
>>
>>
umod.comsol.result(’res2’).feature.create(’slc2’, ’Slice’);
umod.comsol.result(’res2’).feature(’slc2’).set(’expr’, ’MinD_c_atp’);
umod.comsol.result(’res2’).feature(’slc2’).set(’quickplane’, ’zx’);
umod.comsol.result(’res2’).feature(’slc2’).set(’quickynumber’, ’1’);
mphplot(model,’res2’);
There are many more options that can be passed to mphplot to control the plot produced.
For a detailed account, see the Comsol documentation:
>> help mphplot
If you prefer to work within the Comsol GUI for visualization, you can import the FEM
structured with the attached stochastic trajectory back into Comsol. This can be done by
typing:
>> mphsave(umod.comsol,’output_filename.mph’)
Optionally, from the Comsol GUI, import the new structure (umod.comsol): ’File > Client
Server > Import Model from Server’. You can now visualize the trajectory using the options
provided in the ‘Results’ node.
8
Integrating solvers with URDME
In this section we will describe how to integrate a third party spatial stochastic solver into
URDME using the DFSP [6] plugin as an example. URDME plugins have three main
components: the makefile, the solver executable, and (optionally) a pre-execution script.
Each part is described in Table 8.1 where the files that make up the DFSP solver are
explained. We recommend that developers follow this format when integrating their own
solvers.
When the middle level interface calls the solver executable, it passes all model and
geometry data to the solver via a .mat data file. The names of the input file and the output
file are both specified as command line arguments (i.e. in the argv parameter to the main
function). The core URDME distribution includes routines to read and parse this data file
into a C-language struct (see the header file ‘matmodel.h’). The solver is then called with
the model struct as a parameter. Once the solver has finished simulating the model, it
attaches the calculated solution trajectory to the model structure. The solution trajectory
is then serialized to the output file using supplied routines (see ‘urdme.m’). When the
solver has completed its execution, the middle level interface imports the serialized solution
trajectory and makes it available to the post-processing and visualization routines. The
logical separation of solvers from the rest of the URDME software enables streamlined
development and debugging of new computational methods.
For efficient simulation of URDME models, it is necessary to compile the model specific
propensity functions with the routines of the solver chosen to perform the simulation. The
solver specific makefiles are responsible for this compilation. For illustration we will use
the DFSP plugin and the “mincde” model as an example (i.e. replace ‘dfsp’ with the name
of the solver you wish to integrate). From the middle-level Matlab interface, when the
20
Directory
File(s)
Description
build
Makefile.dfsp
Solver makefile, for building the solver automatically when calling urdme. The name of this file is
very important: the automatic compilation process
looks for a makefile that is suffixed with the name
of the solver (in lower case). This makefile compiles the solver with the model’s propensity functions into the low-level executable which is called
by the middle-level interface.
src/dfsp
dfsp.c
Solver entry point and data initialization code.
Contains a main-function and setup routines for
the data structures. The initialization procedure
takes the .mat file (which is a serialization of the
umod structure from the Matlab workspace) and
instantiates a urdme model struct (defined in include/matmodel.h).
Header file containing all function prototypes necessary for DFSP.
Main entry point for the solver: the function
dfsp core.
Helper function to process reaction events.
Helper function to process diffusion events.
dfsp.h
dfspcore.c
dfsp reactions.c
dfsp diffusion.c
msrc
urdme init dfsp.m
Pre-execution script to initialize data structures
before the solver is called.
When executing
a model with a specified solver, the URDMEinterface looks for a Matlab-function named
urdme init <solver> (that is, in the file ‘urdme init <solver>.m’).
Table 8.1: Overview of the files that make up the DFSP plugin solver.
urdme function is called with the parameter {’Solver’,’dfsp’}, URDME attempts to
compile the executable ‘urdme/fange.dfsp’ from the propensity function file ‘fange.c’ and
solver files using the compilation specified in ‘Makefile.dfsp’ in ‘urdme/build’. The makefile
is responsible for all necessary steps of the compilation process and the target executable is
built in the ‘urdme’ subdirectory of the current working directly, and is named according
to the propensity file (‘fange.c’) and solver DFSP, thus ‘urdme/fange.dfsp’. The automatic
compilation process is designed for ease of use from the middle-level Matlab interface.
Often spatial stochastic simulation methods require additional processing of geometry
and model data before execution can proceed. In URDME, this is accomplished through
the use of a specifically named Matlab function found in the ‘urdme/msrc’ subdirectory of
the URDME distribution. For the DFSP plugin, this file is named ‘urdme init dfsp.m’. The
function defined in this file must take as arguments the fem data structure and a variable
number of additional arguments (i.e. varargin). If urdme is called with solver arguments,
that cell-vector is passed as the second argument to this function. Implementation of a preprocessing script provides method developers with a powerful and flexible way to perform
any necessary data transformations for their specific solvers.
21
Acknowledgment
The authors are grateful to Per Lötstedt and Linda Petzold for valuable input during the
development of URDME.
Previous contributor: Josef Cullhed (v. 1.0).
Funding: The Linnaeus center of excellence UPMARC, Uppsala Programming for Multicore Architectures Research Center (PB, SE). U.S. NIH grant R01EB7511, U.S. DOE award
DE-FG02-04ER25621, U.S. NSF IGERT DGE-02-21715 and grant DMS-1001012, Institute
for Collaborative Biotechnologies Grant W911NF-09-0001 from the U.S. Army Research
Office (BD), U.S. National Institute of Biomedical Imaging And Bioengineering of the National Institute of Health under Award Number R01-EB014877-01 (BD, AH) The Swedish
Graduate School in Mathematics and Computing (SE, AH), the Royal Swedish Academy of
Sciences scholarship FOA08H-109, FOA09H-63, FOA09H-64, SSF A3 02:124 (AH).
The content is solely the responsibility of the authors and does not necessarily represent
the official views of these agencies.
22
References
[1] Naama Barkai and Stanislav Leibler. Circadian clocks limited by noise. Nature, 403:267–
268, 2000.
[2] Yang Cao, Dan T. Gillespie, and Linda Petzold. Multiscale stochastic simulation algorithm with partial equilibrium assumption for chemically reacting systems. J. Comput.
Phys., 206:395–411, 2005.
[3] Comsol Inc. Comsol Multiphysics Reference Guide, 4.3 edition, 2012.
[4] B. Drawert, S. Engblom, and A. Hellander. URDME v. 1.1: User’s manual. Technical
Report 2011-003, Dept of Information Technology, Uppsala University, 2011.
[5] B. Drawert, S. Engblom, and A. Hellander. URDME: a modular framework for stochastic simulation of reaction-transport processes in complex geometries. BMC Syst. Biol.,
6(76):1–17, 2012.
[6] Brian Drawert, Michael J. Lawson, Linda Petzold, and Mustafa Khammash. The diffusive finite state projection algorithm for efficient simulation of the stochastic reactiondiffusion master equation. J. Chem. Phys., 132(7):074101, 2010.
[7] Weinan E, Di Liu, and Eric Vanden-Eijnden. Nested stochastic simulation algorithm
for chemical kinetic systems with disparate rates. J. Chem. Phys., 123, 194107, 2005.
[8] Johan Elf and Måns Ehrenberg. Spontaneous separation of bi–stable biochemical systems into spatial domains of opposite phases. Syst. Biol., 1(2), 2004.
[9] Michael B. Elowitz, Arnold J. Levine, Eric D. Siggia, and Peter S. Swain. Stochastic
gene expression in a single cell. Science, 297(5584):1183–1186, 2002.
[10] Stefan Engblom. Numerical Solution Methods in Stochastic Chemical Kinetics. PhD
thesis, Uppsala University, 2008.
[11] Stefan Engblom. Galerkin spectral method applied to the chemical master equation.
Commun. Comput. Phys., 5(5):871–896, 2009.
[12] Stefan Engblom. Spectral approximation of solutions to the chemical master equation.
J. Comput. Appl. Math., 229(1), 2009.
[13] Stefan Engblom, Lars Ferm, Andreas Hellander, and Per Lötstedt. Simulation of
stochastic reaction–diffusion processes on unstructured meshes. SIAM J. Scientific.
Comp., 31(3):1774–1797, 2009.
[14] Stewart N. Ethier and Thomas G. Kurtz. Markov Processes: Characterization and
Convergence. Wiley series in Probability and Mathematical Statistics. John Wiley &
Sons, New York, 1986.
[15] David Fange and Johan Elf. Noise-induced Min phenotypes in
2(6):0637–0647, 2006.
E. coli. PLOSB,
[16] Lars Ferm and Per Lötstedt. Adaptive solution of the master equation in low dimensions. Appl. Numer. Math., 59(1):265–284, 2009.
[17] Michael A. Gibson and Jehoshua Bruck. Efficient exact stochastic simulation of chemical
systems with many species and many channels. J. Phys. Chem., 104:1876–1889, 2000.
[18] Daniel T. Gillespie. A general method for numerically simulating the stochastic time
evolution of coupled chemical reacting systems. J. Comput. Phys., 22:403–434, 1976.
23
[19] Daniel T. Gillespie. Approximate accelerated stochastic simulation of chemically reacting systems. J. Chem. Phys., 115(4):1716–1733, 2001.
[20] Eric L. Haseltine and James B. Rawlings. Approximate simulation of coupled fast and
slow reactions for stochastic chemical kinetics. J. Chem. Phys., 117(15):6959–6969,
2002.
[21] Johan Hattne, David Fange, and Johan Elf. Stochastic reaction–diffusion simulation
with MesoRD. Bioinformatics, 21(12):2923–2924, 2005.
[22] Markus Hegland, Conrad Burden, Lucia Santoso, Shev MacNamara, and Hilary Booth.
A solver for the stochastic master equation applied to gene regulatory networks. J.
Comput. Appl. Math., 205(2):708–724, 2007.
[23] Andreas Hellander. Numerical simulation of well stirred biochemical reaction networks
governed by the master equation. Licentiate thesis, Department of Information Technology, Uppsala University, 2008.
[24] Andreas Hellander and Per Lötstedt. Hybrid method for the chemical master equation.
J. Comput. Phys., 227(1):127–151, 2008.
[25] Shev F. MacNamara. Krylov and Finite State Projection Methods for Simulating
Stochastic Biochemical Kinetics via the Chemical Master Equation. PhD thesis, The
University of Queensland, Australia, 2008.
[26] Harley H. McAdams and Adam Arkin. It’s a noisy business! Genetic regulation at the
nanomolar scale. Trends in Genetics, 15(2):65–69, 1999.
[27] Johan Paulsson, Otto G. Berg, and Mans Ehrenberg. Stochastic focusing: Fluctuationenhanced sensitivity of intracellular regulation. Proc. Nat. Acad. Sci. USA, 97(13):7148–
7153, 2000.
[28] Christopher V. Rao and Adam P. Arkin. Stochastic chemical kinetics and the quasisteady-state assumption: Application to the Gillespie algorithm. J. Chem. Phys.,
118(11):4999–5010, 2003.
[29] Paul Sjöberg. Numerical Methods for Stochastic Modeling of Genes and Proteins. PhD
thesis, Uppsala University, 2007.
[30] Mukund Thattai and Alexander van Oudenaarden. Intrinsic noise in gene regulatory
networks. Proc. Nat. Acad. Sci. USA, 98:8614–8619, 2001.
24
A
Stochastic chemical kinetics
In this section we briefly describe how reaction and diffusion events are modeled and how
we obtain the diffusion rate constants when the domain is discretized using an unstructured
mesh. For a more detailed introduction to the subject along with many additional references,
consult e.g. [10].
The computational core of URDME is based on the next subvolume method (NSM) [8].
Details concerning the actual simulation algorithms can be found in Appendix B.
A.1
Mesoscopic chemical kinetics
In a well-stirred chemical environment reactions are understood as transitions between the
states of the integer-valued state space counting the number of molecules of each of D
different species. The intensity of a transition is described by a reaction propensity defining
the transition probability per unit of time for moving from the state x to x + Nr ;
ωr (x)
x −−−→ x + Nr ,
(A.1)
where Nr ∈ ZD is the transition step and is the rth column in the stoichiometric matrix N .
Eq. (A.1) defines a continuous-time Markov chain over the positive D-dimensional integer
lattice.
When the reactions take place in a container of volume Ω, it is sometimes useful to know
that the propensities often satisfy the simple scaling law
ωr (x) = Ωur (x/Ω)
(A.2)
for some function ur which does not involve Ω. Intensities of this form are called density
dependent and arise naturally in a variety of situations [14, Ch. 11].
A.2
Mesoscopic diffusion
In the mesoscale model, a diffusion event is modeled as a first order reaction taking species
Sl in subvolume ζi from its present subvolume to an adjacent subvolume ζj ,
aij xli
Sli −−−−→ Slj ,
(A.3)
where xli is the number of molecules of species l in subvolume i. On a uniform Cartesian
mesh such as those used in MesoRD [21], the rate constant takes the value aij = γ/h2 where
h is the side length of the subvolumes and γ is the diffusion constant. In URDME we use
an unstructured mesh made up of tetrahedra and the rate constants are taken such that
the expected value of the number of molecules divided by the volume (the concentration)
converges to the solution obtained from a consistent FEM discretization of the diffusion
equation
ut = γ∆u.
(A.4)
Using piecewise linear Lagrange elements and mass lumping, we obtain the discrete problem
ut = M −1 Ku
(A.5)
where M is the lumped mass matrix and K is the stiffness matrix. The rate constants on
the unstructured mesh are then given by
aij =
1
kij ,
Ωi
(A.6)
where Ωi is the diagonal entry of M and can be interpreted as the volume of the dual element
associated with mesh node i (see Figure A.1). For more details, consult [13].
The assumption made in the mesoscopic model is that molecules are well-stirred within
a dual cell. These dual cells correspond to the cubes of the staggered grid in a Cartesian
mesh.
25
Figure A.1: A 2D example of an unstructured triangular mesh. The primal mesh is shown
in dashed and the dual in solid. Within each dual element the system is assumed to be
well-stirred, and molecules can jump from each dual cell to the neighboring ones.
B
Algorithms
One of the most popular algorithms to generate realizations of the CTMC in the well-stirred
case is Gillespie’s direct method (DM) [18]. Several algorithmic improvements of this method
exist, one of them being the next reaction method (NRM) due to Gibson and Bruck [17].
The underlying algorithm in URDME is the next subvolume method (NSM) [8]. The
NSM can be understood as a combination of NRM and DM in order to tailor the algorithm
to reaction-diffusion processes.
For reference, we first state below both DM and NRM and then outline NSM.
Algorithm 1 Gillespie’s direct method (DM)
Initialize: Set the initial state x and compute all propensities ωr (x), r = 1, . . . , Mreactions .
Also set t = 0.
while t < T do
Compute the sum λ of all the propensities.
Sample the next reaction time (by inversion), τ = − log(rand)/λ. Here and in what
follows, ‘rand’ conveniently denotes a uniformly distributed random number in (0, 1)
which is different for each occurrence.
Sample the next reaction event (by inversion); find n such that
Pn−1
Pn
j=1 ωj (x)
j=1 ωj (x) < λ rand ≤
Update the state vector, x = x + Nn and set t = t + τ .
end while
26
Algorithm 2 Gibson and Bruck’s next reaction method (NRM)
Initialize: Set t = 0 and assign the initial number of molecules. Generate the dependency
graph G. Compute the propensities ωr (x) and generate the corresponding absolute waiting
times τr for all reactions r. Store those values in a heap H.
while t < T do
Remove the smallest time τn = H0 from the top of H, execute the nth reaction x :=
x + Nn and set t := τn .
for all edges n → j in G do
if j 6= n then
Recompute the propensity ωj and update the corresponding waiting time according
to
τjnew = t + τjold − t
ωjold
.
ωjnew
else {j = n}
Recompute the propensity ωn and generate a new absolute time τnnew . Adjust the
contents of H by replacing the old value of τn with the new one.
end if
end for
end while
Algorithm 3 The next subvolume method (NSM)
Initialize: Compute the sum σir of all reaction rates ωri and the sum σid of all diffusion
rates aij xsi in all subvolumes i = 1, . . . , Ncells . Compute the time until the next event in
each subvolume, τi = − log(rand)/(σir + σid ), and store all times in a heap H.
while t < T do
Select the next subvolume ζn where an event takes place by extracting the minimum
τn from the top of H.
Set t = τn .
Determine if the event in ζn is a reaction or a diffusion event. Let it be a reaction if
(σnr + σnd ) rand < σnr , otherwise it is a diffusion event.
if Reaction event then
Determine the reaction channel that fires. This is done by inversion of the distribution
for the next reaction given τn in the same manner as in Gillespie’s direct method in
Algorithm 1.
Update the state matrix using the (sparse) stoichiometric matrix N .
Update σnr and σnd using the dependency graph G to recalculate only affected reactionand diffusion rates.
else {Diffusion event}
Determine which species Sln diffuses and subsequently, determine to which neighboring subvolume ζn0 . This is again done by inversion using a linear search in the
corresponding column of D.
Update the state: Snl = Snl − 1, Sn0 l = Sn0 l + 1.
Update the reaction- and diffusion rates of subvolumes ζn and ζn0 using G.
end if
Compute a new waiting time τn by drawing a new random number and add it to the
heap H.
end while
27