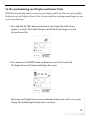
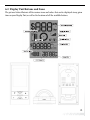
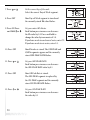
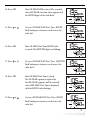
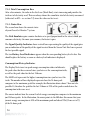
1
User Manual
Please read before using this equipment.
Table of Contents
1 Welcome ......................................................................................................................................1
2 Your Powercost Monitor™ ....................................................................................................2
2.1 Safety instructions............................................................................................................3
2.2 Care and maintenance ......................................................................................................3
3 Determining your utility meter type ..................................................................................4
4 Unpacking and verifying basic operation ........................................................................7
4.1 Powering the display unit ................................................................................................7
4.2 Powering the sensor unit..................................................................................................7
4.3 Verifying the basic operation ..........................................................................................8
5 Sensor unit installation ..........................................................................................................9
5.1 You will need ....................................................................................................................9
5.2 Electromechanical meter................................................................................................10
5.2.1 Preparing your sensor unit..............................................................................10
5.2.2 Installing your sensor unit ..............................................................................10
5.3 Electronic meter (optical port on face)..........................................................................12
5.3.1 Preparing your sensor unit..............................................................................12
5.3.2 Installing your sensor unit ..............................................................................13
5.4 Electronic meter (optical port on face-shims required)................................................14
5.4.1 Preparing your sensor unit..............................................................................14
5.4.2 Installing your sensor unit ..............................................................................15
5.5 Electronic meter (optical port on top) ..........................................................................16
5.5.1 Preparing your sensor unit..............................................................................16
5.5.2 Installing your sensor unit ..............................................................................17
5.6 Re-synchronizing your Display and Sensor Units ........................................................19
6 Setting up your display unit ................................................................................................20
6.1 Determine your type of billing ......................................................................................20
6.2 Display unit buttons and icons ......................................................................................21
6.3 Setting up for single (flat) rate billing............................................................................24
6.4 Setting up for tiered billing ............................................................................................26
6.5 Setting up for time-of-use billing ..................................................................................29
7 Display unit functions ..........................................................................................................33
7.1 Your display unit ............................................................................................................33
7.1.1 Current Consumption Row..............................................................................33
7.1.2 Total Consumption Row ..................................................................................34
7.1.3 Status Row ......................................................................................................34
7.2 Dollar and cents display mode ......................................................................................35
7.3 Kilowatt and kilowatt-hours mode ................................................................................36
7.4 Temperature display ......................................................................................................37
7.5 Loss of signal display......................................................................................................38
7.6 Resetting the total values................................................................................................39
7.7 Display backlight ............................................................................................................39
8 Troubleshooting......................................................................................................................40
1
Welcome
Thank you for purchasing the PowerCost Monitor™ from Blue Line Innovations.
The PowerCost Monitor™ can help you reduce your electricity bill. Our goal is to
empower all households to reduce the amount of electricity they use without having
to dramatically change their lifestyles.At Blueline Innovations Inc., we develop all our
products and services with that goal in mind.
By using this manual and making the PowerCost Monitor™ a regular part of your daily
household management, you can considerably reduce the amount of electricity you
consume without significantly altering the way you live from day to day.
Important: This manual contains important safety and care information, and
provides step-by-step instructions for using this product. Please read this manual
thoroughly, and keep it in a safe place in case you need to refer to it later.
You will find relatively inexpensive and effective tips at www.save-electricity.ca
to help you maximize energy savings.When used in conjunction with the PowerCost
Monitor™, these tips will help you attain your conservation goals.
The PowerCost Monitor™ is straightforward and easy to use. Should you happen to
experience any difficulties with your system, please use the following resources in the
order listed below:
1. The troubleshooting section at the end of this manual.
2. If the problem persists or you have a question that remains unanswered,
additional information is available online at www.bluelineinnovations.com.
3. If none of the above resources contains the solution to your problem, please feel
free to dial our toll free line at 1-866-607-2583. One of our customer support
staff will be happy to assist you. However, we do ask our clients to understand
that this is a last resort to be used only if all else has failed.
1
2
Your PowerCost Monitor™
Your PowerCost Monitor™ gives you the advantage of real-time feedback. Tests have
proven that households where real-time feedback is put to good use can reduce their
electricity needs by as much as 5 - 20%.
Real-time feedback means being able to:
• See how much energy your home is using from minute to minute.
• See the effect of turning on or off various electrical devices in your home.
It is important to remember that the PowerCost Monitor™ is just a tool. The amount
of savings is up to you. By striving to keep the values shown on the Display Unit as
low as possible, you will use less electricity - up to 20% less - every month. That will
translate into:
• Real savings on your monthly electricity bill
• Reduced green-house gas emissions
• Reduced demand on the power grid
Your PowerCost Monitor™ has an easy to read screen that lights up at the touch
of a button. It can display the:
• current electricity consumption in dollars and cents per hour;
• total cost of energy consumed in dollars and cents;
• current energy consumption in kilowatts;
• total energy consumed in kilowatt-hours; and
• outdoor temperature in Celsius and Fahrenheit.
2
2.1. Safety Instructions
This device does not interfere with your utility meter readings in any way.After the
PowerCost Monitor™ is installed, utility company personnel will still be able to access
your readings normally.
Please read, understand and apply the safety instructions below and read the rest of the User
Manual thoroughly before using this product. These instructions must be followed at all times.
• Do not attempt to repair the PowerCost Monitor™ yourself. If you experience any
difficulties, please refer to the troubleshooting section of this manual or visit
www.bluelineinnovations.com for assistance. If you are still having difficulty please
feel free to call our customer support department toll-free at (866) 607-2583.
• Take precautions when handling batteries. They can cause injuries, burns, and/or
property damage as a result of contact with metal objects, heat, and corrosive materials.
• A damaged LCD display may leak fluids that can be harmful to your health. If any fluid
does leak from the Display Unit after you drop it accidentally, immediately wash it off
with soap and water.
• Do not use this device in aircraft or hospitals. The use of radio frequency devices can
cause malfunctions in the control devices of other sensitive equipment.
2.2. Care and Maintenance
To ensure your PowerCost Monitor™ provides trouble-free service, please read the following
tips and the rest of the User Manual thoroughly before using the system.
• Do not immerse the PowerCost Monitor™ in any liquid.
• Do not use the Display Unit in high moisture areas.
• Place the Display Unit indoors only. Placing the Display Unit outdoors can result
in damage to the product and will void the warranty.
• Keep this product away from heat sources such as stoves and heaters.
• Do not drop the PowerCost Monitor™ or cause any sudden impact to it.
• If disposing of this product, do so in accordance with your local waste
disposal regulations.
3
3
Determining Your Utility Meter Type
Your utility meter is most probably located outside your house and it looks like one
of the pictures on the following two pages.
Your PowerCost Monitor™ Sensor Unit has been designed to fit on virtually any
residential meter type, using its built-in clamping strap that goes over the meter dome.
However, the installation procedure varies according to meter types. It is extremely
important that you determine accurately what kind of meter is installed in your home
before proceeding.
Here are a few indications to help you.
There are two families of electrical meters:
• Electromechanical meters (with dials and a spinning disk with a black mark)
• Electronic meters (with a digital readout)
Electronic meters emit an invisible light pulse signal, similar to a remote control
infrared beam, through an optical port. The meter’s optical port can be located:
• On the front of the meter face
• On top of the meter.
The next two pages will help you accurately determine the kind of meter you have
and what it should look like when you complete the installation of your PowerCost
Monitor™ system.
4
Find the picture on the left side that looks like your meter. The picture next to it shows how
your sensor should look when properly mounted.
IF YOU DETERMINE THAT YOUR METER IS ONE OF THE TWO FOLLOWING TYPES, YOU CAN
FOLLOW THE PROCEDURES IN THE QUICKSTART GUIDE TO INSTALL YOUR SENSOR UNIT.
Your meter looks like this…
… with the Sensor Unit mounted
Electromechanical Meter
Use Quick Install Guide
or see section 5.2
Optical Port
>1.5 inches
Electronic Meter
Measure the distance
between the FRONT optical
port and the outer rim of the
dome. It should be NO LESS
THAN 1.5 inches (37 mm).
Use Quick Install Guide
or see section 5.3
5
Your meter looks like this…
Optical Port
… with the Sensor Unit mounted
Electronic Meter
with FRONT optical port,
LESS THAN 1.5 inches from
outer rim of meter dome.
You will need the rubber
shims. See section 5.4
<1.5 inches
<1.5 inches
Optical Port
Electronic Meter
with FRONT optical port,
LESS THAN 1.5 inches from
outer rim of meter dome.
You will need the rubber
shims. See section 5.4
Optical Port
Electronic Meter
with TOP optical port.
You will need the clear
alignment template.
See section 5.5
6
4
Unpacking and Verifying Basic Operation
Verify that your box contains all the following components:
• Display Unit
• Sensor Unit
• Rubber Shims (2)
• Clear Alignment Template (1)
• Installation Guide, Setup Guide and User Manual
• Alkaline “AA” Batteries (4)
• Installation DVD
After you unpack your PowerCost Monitor™, keep all the packing materials in a safe place.
4.1. Powering the Display Unit
Proceed as follows to power the Display Unit:
1. Remove the Display Unit from the box.
2. Remove the Display Unit battery cover on the back
of the unit, insert two alkaline “AA” batteries in the
orientation indicated and replace the cover.
3. The Display Unit beeps and, after approximately
5 seconds, it displays the start-up screen.
Find an appropriate location for the Display Unit. It must be an indoor location 30 meters
(100 ft.) or less from your home’s utility meter.
Note: To ensure your PowerCost Monitor™ operates at peak performance, you should place
your Display Unit in a room near your utility meter. Ideally, it should be on the same side of
the house where the utility meter is situated. Also, deduct 5 meters for every wall separating
the Sensor Unit from the Display
4.2. Powering the Sensor Unit
1. Open the Sensor Unit battery compartment
by moving the cover latch to the unlocked position.
2. Install two AA alkaline batteries, with the battery
closest to the Sensor Arm going in positive (+) end first.
3. Close the cover and move the cover latch back to the
locked position. The red STATUS indicator lights up.
7
4.3. Verifying the Basic Operation
Your Sensor Unit comes pre-programmed with a unique ID code so it will only work with
your Display Unit. This synchronization step ensures that both the Display Unit and Sensor
Unit operate properly using the same ID code.
1. Press and hold the SYNC button on the front of the Display Unit until you hear a beep
(approx. 3 seconds). The Display Unit displays this screen:
2. Press and release the RESET button on the battery cover of the Sensor Unit.
The display exits ID mode and displays this screen.
If your Display Unit does not react as described above, repeat steps 1 and 2 and,
if you still do not get the expected results, see the Troubleshooting section at the
end of this User Guide.
8
5
Sensor Unit Installation
5.1. You Will Need…
It is very important to follow the installation instructions for the PowerCost Monitor™
exactly as outlined in this User Guide for the type of meter installed in your home.
Failure to do so will result in incorrect consumption data being displayed and may
void the product warranty.
For best results, install your Sensor Unit on a dry day.Also, to facilitate signal detection,
we recommend you turn on an appliance that uses a lot of energy, like your
electric stove or dryer.
When you are ready, go to your utility meter taking the following items with you:
• This User Guide
• Display Unit
• Sensor Unit
• 1 large Flat Head screwdriver
• Stepping stool or ladder if your utility meter is located higher than eye level
• Clean damp cloth
• Supplied Rubber Shims (if needed for your meter type)
• Supplied Clear Alignment Template (if needed for your meter type)
IMPORTANT: Wipe the meter glass dome clean with the damp cloth before
proceeding.
WARNING: If your meter is not installed at eye level, please use all the necessary
precautions when on the stepping stool or ladder.
9
5.2. Electromechanical Meter
Electromechanical meters have dials on the
face and a spinning disk. The faster the disk
spins, the higher your electricity consumption.
5.2.1. Preparing Your Sensor Unit
Proceed as follows to prepare your Sensor Unit
for mounting on your electromechanical meter.
1. Pull the Sensor Arm latch upward to open it.
2. Extend the Sensor Arm to its full length by
pulling on it. If you accidentally pull it out
completely, push it back into the casing.
3. Close the latch.
5.2.2. Installing Your Sensor Unit
1. Adjust the sensor mounting strap by turning the adjustment screw several turns with
a flat head screwdriver until it is a little wider than the diameter of your meter dome.
2. Fit the Sensor Unit over your utility meter as shown below.
Ensure that the Sensor Arm is as close to the front of the
utility meter glass dome as possible.
3. Tighten the sensor strap adjustment
screw until snug. The Sensor Unit
should still be able to move so
adjustments can be made.
Do not over-tighten!
10
4. Make sure that the Sensor Arm is properly positioned with the disk on the utility meter.
It should be positioned so that the alignment line on the Sensor Arm is inline with the
disk and the sensor head is centered from side-to-side.
NOTE: If the Sensor Arm is not properly positioned, the Sensor Unit may not detect the motion
of the disk and will generate incorrect readings.
5. Press and release the RESET button on the battery cover of the Sensor Unit. The red
STATUS indicator on the Sensor Unit first lights up, then turns off and, within 45 seconds,
it starts flashing once per revolution of the disk. The indicator stops flashing after
approximately 2 minutes in order to conserve battery power.
6. Tighten the strap adjustment screw until the Sensor Unit cannot be moved easily.
Do not over-tighten!
After a few minutes, if the Sensor Unit indicator does not flash when the black mark
passes, or if it flashes while the black mark is not visible, then the Sensor Arm is not
properly aligned. To re-adjust the Sensor Arm:
1. Open the Sensor Arm latch and gently move the Sensor Arm up or down
a few millimeters to align it with the meter disk.
2. Close the Sensor Arm latch then repeat step 5 above. Continue to do this
until the Sensor Unit consistently and only flashes once per disk revolution.
7. Now read section 5.6 to re-synchronise your Display and Sensor Units.
11
5.3. Electronic Meter (Optical Port on Face)
Electronic meters have digital readouts, as well as an optical port which emits light pulses similar
to the infrared light produced by a television remote control.
This section deals with meters where the optical port is located on the face, more specifically,
where the distance between the port and the outer rim of the meter dome is AT LEAST 1 1⁄2
inches (37 mm). If in doubt, physically measure the distance between your port and the outer
rim of the dome. If it is less than 1 1⁄2 inches (37 mm), you must follow the instructions in section
5.4 to install your Sensor Unit.
Optical Port
>1.5 inches
5.3.1. Preparing Your Sensor Unit
Your Sensor Unit is ready to be installed from the box.
However, it is recommended that you do the following:
1. Pull the Sensor Arm latch upward to open it.
2. Ensure that the Sensor Arm is completely pushed
in as far as it will go.
3. Close the latch.
12
5.3.2. Installing Your Sensor Unit
1. Adjust the sensor mounting strap by turning the adjustment screw several turns with
a flat head screwdriver until it is a little wider than the diameter of your meter dome.
2. Fit the Sensor Unit over your utility meter by sliding
the clamp around the meter dome. Ensure that the
Sensor Arm is as close to the front of the utility meter
glass dome as possible.
3. Tighten the sensor-strap adjustment screw until
snug. The Sensor Unit should still be able to move
so adjustments can be made. Do not over-tighten!
4. Make sure that the Sensor Arm is properly positioned
on the utility meter. It should be positioned so that the
Sensor Head is located exactly above the optical port.
5. Press and release the RESET button on the
battery cover of the Sensor Unit. The red STATUS
indicator on the Sensor Unit first lights up, then starts
flashing regularly and, within 45 seconds, you should
also see an extra flash every now and then, at a rate
that varies according to your electricity consumption.
The indicator stops flashing after approximately
2 minutes in order to conserve battery power.
6. Tighten the strap adjustment screw until
the Sensor Unit cannot be moved easily. Do not over-tighten!
If you have not seen an extra flash after about 5 minutes,
the Sensor Arm is not properly positioned over the optical port
or the glass dome is dirty. Clean the dome and repeat steps 4 and 5 above.
7. Now read section 5.6 to re-synchronise your Display and Sensor Units.
13
5.4. Electronic Meter (Optical Port on Face – Shims Required)
Electronic meters have digital readouts, as well as an optical port which emits light pulses similar
to the infrared light produced by a television remote control.
This section deals with electronic meters that have their optical port on the face, at a distance
LESS THAN 1.5 inches (37 mm) from the outer rim of the meter dome. If in doubt, physically
measure the distance between your port and the outer rim of the dome. If it is equal to or more
than 1.5 inches (37 mm), follow the instructions in section 5.3 to install your Sensor Unit.
Here are two examples of such meters.Although the meter in the photo on the right hand side
appears to have two optical ports, it has only one, and it is the opening located closest to the
meter’s center.
Optical Port
Optical Port
5.4.1. Preparing Your Sensor Unit
Proceed as follows:
1. Pull the Sensor Arm latch upward to open it.
2. Ensure that the Sensor Arm is completely pushed
in as far as it will go.
3. Close the latch.
In these electronic meters, the optical port is too close to the dome’s outer rim for it to be
possible to position the Sensor Head over the port, because the Sensor Arm is too long,
even when fully pushed in.
14
The supplied rubber shims are required to achieve proper installation.
4. Loosen the hose clamp and determine by eye if one or two shims will be required.
5. Remove the adhesive backing from one of the shims and press the shim in place onto
the underside of the Sensor body.
IMPORTANT: DO NOT stick the shim to the glass dome.
6. If required, remove the adhesive backing from the second shim and press the second
shim onto the first.
5.4.2. Installing Your Sensor Unit
7. Fit the Sensor Unit, with the shims installed, over your utility meter by sliding the
assembly around the meter dome. Ensure that the Sensor Arm is as close to the front
of the utility meter glass dome as possible.
8. Tighten the sensor-strap adjustment screw until snug. The Sensor Unit should still be
able to move so adjustments can be made. Do not over-tighten!
9. Make sure that the Sensor Arm is properly positioned
on the utility meter. It should be positioned so that the
Sensor Head is located exactly above the optical port.
10. Press and release the RESET button on the battery
cover of the Sensor Unit. The red STATUS indicator
on the Sensor Unit first lights up, then starts flashing
regularly and, within 45 seconds, you should also
see an extra flash every now and then, at a rate that
varies according to your electricity consumption.
The indicator stops flashing after 2 minutes in order
to conserve battery power.
11. Tighten the strap adjustment screw until the Sensor Unit cannot be moved easily.
Do not over-tighten!
If you have not seen an extra flash after about 5 minutes, the Sensor Arm is
not properly positioned over the optical port or the glass dome is dirty.
Repeat steps 9 and 10 above.
12. Now read section 5.6 to re-synchronise your Display and Sensor Units.
15
5.5. Electronic Meter (Optical Port on Top)
Electronic meters have digital readouts, as well as an optical port which emits light pulses similar
to the infrared light produced by a television remote control. This section deals with electronic
meters that have their optical port on the top.
Optical Port
These meters require that you reconfigure the Arm in the Sensor Unit.
5.5.1. Preparing Your Sensor Unit
1. Pull the Sensor Arm latch upward to open it.
2. Gently pull the Sensor Arm completely out
of the Sensor Body.
3. Turn the Sensor Arm over.
16
4. Push the smaller end of the Sensor Arm
upwards through the latch opening.
5. Push the Sensor Head behind the strap,
and as far down as it will go into the bottom
cavity of the body.
6. Tuck the wire neatly into the side cavity.
7. Close the latch.
5.5.2. Installing Your Sensor Unit
To help with the positioning of the Sensor Head exactly over the optical port, Blueline
Innovations has supplied you with a clear plastic template that goes on top of the meter dome.
8. Stand directly in front of your meter, at a height where you can see the optical port.
The optical port itself looks like a mall pipe in the center of the top portion of the meter.
9. Hold the template with the protruding tab facing towards you and the white arrow
pointing away from you. Peel off the adhesive backing.
10. Position the template on the meter so that the
horizontal white line on the template follows
the front edge of the meter dome, and the white
arrow points straight to the optical port.
Optical Port
11. Carefully stick the template to the dome. Press on
the template on top of the dome, and then press
on the protruding tab down the front of the dome.
Verify the alignment. If needed, gently remove the
template and try again.
17
12. Slide the Sensor Unit over the glass dome
and align the edges of the Sensor Unit body
with the white sidelines on the template.
13. Tighten the hose clamp so that the Sensor Unit is snug but can still move easily.
14. Push the Sensor Unit back on the glass dome as far as it will go.
15. Open the Sensor Arm latch and sight down the
opening.You see a vertical plastic tab painted
white on the inside of the Sensor body.
16. Align the white plastic tab with the white line on the template.
17. Press and release the RESET Button. The red STATUS indicator lights up.
18. Keeping the white lines on the body and template
aligned, pull the Sensor Unit towards you gently
and slowly until the red STATUS indicator starts
flashing regularly.Within 45 seconds, you
should also see an additional flash every now
and then, at a rate that varies according to your
electrcity consumption.
19. When you see these additional flashes at variable
intervals, your Sensor Unit is properly aligned and
is sending signals to your Display Unit. Tighten the
clamp to secure the Sensor Unit to the meter dome.
20. Now read section 5.6 to re-synchronise your Display and Sensor Units.
18
5.6. Re-synchronizing your Display and Sensor Units
NOTE: You normally only need to synchronize your Display and Sensor Units once. If you replace
the batteries in your Display or Sensor Units, the system will start working normally again as soon
as you insert fresh ones.
1. Press and hold the SYNC button on the front of the Display Unit until it beeps
(approx. 3 seconds). The Display Unit goes into ID Mode and it begins to search
for your Sensor Unit.
2. Press and release the RESET button on the battery cover of the Sensor Unit.
The Display Unit exits ID mode and displays this screen:
Your Sensor and Display Units are now synchronized and you are ready to set up your
Display Unit by following the instructions in section 6.
19
6
Setting Up Your Display Unit
Once the Sensor Unit begins to detect power usage from your utility meter, the Display
Unit automatically starts showing information after a short time. The actual numbers
displayed are immaterial at this point.
6.1. Determine your Type of Billing
Before you start setting up your Display Unit, you must first determine the type of
billing your electricity provider is applying to your account. Retrieve a recent electricity
bill and find out which of the following three billing modes applies in your case.
SINGLE (FLAT) RATE mode
Your bill shows a single value in cents
per kilowatt-hour
You are charged a SINGLE (FLAT) RATE
for electricity consumption.
(See section 6.3)
TIERED RATE mode
Your bill shows more than one value
in cents per kilowatt-hour
You are charged a TIERED RATE for electricity
consumption.You pay the first (usually the lowest)
rate until you reach a threshold, and you start paying
another (usually higher) rate thereafter.
(See Section 6.4)
TIME OF USE mode
Your bill shows different values according
to various time periods during the day.
You are billed on a TIME OF USE basis.You pay
different Off-Peak and On-Peak rates, reflecting
the overall demand your electricity provider must
satisfy between given hours of the day. (Go to section 6.5)
20
Single (Flat) Rate Example
$0.063/kWh
$0.063 = 6.3 cents
kWh = kilowatt/hour
You are paying 6.3 cents per
kilowatt/hour at all times.
Tiered Rate Example
1200 kWh @ $0.063/kWh and
1369 kWh @ $0.075 /kWh
$0.063 = 6.3 cents
$0.075 = 7.5 cents
kWh = kilowatt/hour
You are paying 6.3 cents per
kilowatt/hour (the first rate)
for the first 1200 kilowatt/hours
(the threshold), and 7.5 cents
per kilowatt/hour (the second
rate) thereafter.
In our example, you consumed
2,569 kilowatt/hours in total, of
which the last 1,369 were charged
the second rate (7.5 cents).
6.2. Display Unit Buttons and Icons
The pictures below illustrate all the various icons and values that can be displayed at any given
time on your Display Unit, as well as the locations of all the available buttons.
21
ICON/BUTTON
PURPOSE
Disk Emulator
When spinning, indicates that the Display Unit is receiving
a signal from the Sensor Unit. The higher the energy
consumption, the faster the disk emulator spins.
Consumption History
Graphical representation of the power consumption over
the last 7 days. See the User Manual for more detailed
explanations
Battery Levels
Status of the Display Unit and Sensor Unit batteries.A black
battery icon indicates a fresh battery.When a battery s fresh,
the icon is not visible; the black area on the icon increases as
the battery becomes depleted.
Signal Quality
Provides an indication of the quality of the signal from
the Sensor Unit. The more bars the better the signal.
$
Dollar Mode: Current Values are shown in dollars-per-hour
($/hr) and consumption totals are shown in dollars ($).
KW
Kilowatt Mode: Current Values are shown in kilowatts (kW)
and consumption totals are shown in kilowatt-hours (kWh).
RATE
Tiered Rate Indicator: Appears on the display with a
number under it indicating the current rate in tiered rate
mode. This indicator only appears in Configuration mode.
THRESHOLD
Tiered Rate Indicator: Appears on the display indicating
that the value to enter or modify represents the number
of kilowatts at which the rate changes. Appears during
normal operation to indicate that a consumption threshold
has been exceeded and that a new rate applies.
OFF-PEAK
ON-PEAK
Time of Use Indicators: Appear on the display to indicate
one of two possible different rates charged by the utility
company during the day.
22
ICON/BUTTON
PURPOSE
Increase: During setup, each press of the button
INCREASES the target value on the display by various
increments. In some cases, if you Press-and Hold, the value
is increased by a much larger increment; for example, the
Kh increases by increments of 1.0 instead of 0.1.
Decrease: During setup, DECREASES the target value
on the display by various increments. In some cases, if
you Press-and Hold, the value decreases by a much larger
increment; for example, the Kh value decreases by
increments of 1.0 instead of 0.1.
CLEAR
Press and hold to reset the consumption totals to zero.
SYNC
Press and hold to enter ID mode.
SET
Press and hold to enter configuration mode.
MODE
In Configuration Mode, press and hold to switch between
Tiered-Rate and Time-of-Use operating modes.
12/24
Time Format: Press to switch the clock between 12-hour
and 24-hour time display format.
ºC/ºF
Temperature Format: Press to switch between Celsius and
Fahrenheit degrees temperature display format.
Light
Backlight: Press to illuminate the display backlight for
5 seconds.
23
6.3. Setting Up for SINGLE (FLAT) RATE Billing
IMPORTANT: The instructions that follow assume that your Sensor Unit is
transmitting signals normally to your Display Unit. Your Display Unit should show:
1. The Disk Emulator spinning.
2. The Signal Quality indicator
showing a strong signal.
Proceed as follows:
1. Press-and-Hold SET After 3 seconds, the Display Unit beeps
and enters Configuration Mode. The
HOURS digits of the clock are flashing.
2. Press-and-Hold
If the OFF-PEAK/ON-PEAK indicators
MODE (if required) are displayed, press and hold to display
the RATE and THRESHOLD indicators.
3. Press or
Set the correct hour of the day.
Increase or decrease the HOURS value.
If the Display Unit is not in 24-hour mode,
the AM/PM indicator changes whenever
the HOURS value exceeds 12.
4. Press SET
The HOURS value you set is stored and
the MINUTES value starts flashing.
5. Press or
Set the correct minutes of the time of day.
Increase or decrease the MINUTES value.
6. Press SET
Your MINUTES value is stored and a
Day-of-Week segment starts flashing.
24
7. Press or
Set the correct day of the week.
Select the correct Day-of-Week segment.
8. Press SET
Your Day-of-Week segment is stored and
the currently stored Kh value flashes.
9. Press OR Pressand-Hold or
Set your meter’s Kh Factor.
Each button press increases or decreases
the Kh value by 0.1. Press-and-hold to
change the value by increments of 1.0.
If you have an electromechanical meter, enter 7.2.
If you have an electronic meter, enter 1.0.
10. Press SET
Your Kh value is stored.“1” is displayed
under RATE, and the currently stored value
for Rate 1 flashes next to the ¢/kWh segment.
11. Press or
Set your electricity rate
Each button press increases or decreases
the displayed Rate value by 0.1.
12. Press SET
Your Rate is stored. The THRESHOLD
segment appears and the currently stored
Threshold flashes.
13. Press-and-Hold
...until the display shows a series of dashes.
14. Press SET
Your electricity rate is now stored.
The Display Unit quits Configuration
mode and is now fully configured
for operation.
25
6.4. Setting Up for TIERED RATE Billing
IMPORTANT: The instructions that follow assume that your Sensor Unit is
transmitting signals normally to your Display Unit. Your Display Unit should show:
1. The Disk Emulator spinning.
2. The Signal Quality indicator
showing a strong signal.
Proceed as follows:
1. Press-and-Hold SET After 3 seconds, the Display Unit beeps
and enters Configuration Mode. The
HOURS digits of the clock are flashing.
2. Press-and-Hold
If the OFF-PEAK/ON-PEAK indicators
MODE (if required) are displayed, press and hold to display
the RATE and THRESHOLD indicators.
3. Press
or
Set the correct hour of the day.
Increase or decrease the HOURS value.
The AM/PM indicator changes whenever
the HOURS value exceeds 12.
4. Press SET
The HOURS value you set is stored and
the MINUTES value starts flashing.
5. Press
Set the correct minutes of the time of day.
Increase or decrease the MINUTES value.
or
6. Press SET
26
Your MINUTES value is stored and a
Day-of-Week segment starts flashing.
7. Press or
Set the correct day of the week.
Select the correct Day-of-Week segment.
8. Press SET
Your Day-of-Week segment is stored and
the currently stored Kh value flashes.
9. Press OR Pressand-Hold or
Set your meter’s Kh Factor.
Each button press increases or decreases
the Kh value by 0.1. Press-and-hold to
change the value by increments of 1.0.
If you have an electromechanical meter, enter 7.2.
If you have an electronic meter, enter 1.0.
10. Press SET
Your Kh value is stored.“1” is displayed
under RATE, and the currently stored value
for Rate 1 flashes next to the ¢/kWh segment.
11. Press or
Set your first electricity rate
This is generally the lowest rate on your bill.
Each button press increases or decreases the
displayed Rate value by 0.1.
12. Press SET
Your Rate is stored. The THRESHOLD
segment appears and the currently stored
Threshold flashes.
13. Press or
Set your rate threshold
Each button press increases or decreases
the displayed THRESHOLD value by 10 units.
Press and hold to change the value changes by
increments of 100.
27
14. Press SET
Your Threshold value is set.“2” is displayed
under RATE, and the currently stored value for
the Rate 2 flashes next to the ¢/kWh segment.
15. Press or
Set your second electricity rate.
This is generally the highest rate on your bill.
Each press one of these buttons increases or
decreases the displayed Rate value by 0.1.
16. Press SET
Your second rate is stored. The THRESHOLD
segment appears and the currently stored value
for the second Threshold flashes.
17. Press-and-Hold
...until the display shows a series of dashes.
If needed, you can set a 2nd threshold and
a 3rd rate by repeating steps 12 to 15 above.
Your Display Unit can thus accommodate
up to 9 different rates.
18. Press SET
Your electricity rate is now stored.
The Display Unit quits Configuration mode
and is now fully configured for operation.
28
6.5. Setting Up for TIME-OF-USE Billing
IMPORTANT: The instructions that follow assume that your Sensor Unit is
transmitting signals normally to your Display Unit. Your Display Unit should show:
1. The Disk Emulator spinning.
2. The Signal Quality indicator
showing a strong signal.
Proceed as follows:
1. Press-and-Hold SET After 3 seconds, the Display Unit beeps
and enters Configuration Mode. The
HOURS digits of the clock are flashing.
2. Press-and-Hold
If the RATE and THRESHOLD indicators
MODE (if required) are displayed, press and hold to display
the OFF-PEAK/ON-PEAK indicators.
3. Press or
Set the correct hour of the day.
Increase or decrease the HOURS value.
The AM/PM indicator changes whenever
the HOURS value exceeds 12.
4. Press SET
The HOURS value you set is stored and
the MINUTES value starts flashing.
5. Press or
Set the correct minutes of the time of day.
Increase or decrease the MINUTES value.
6. Press SET
Your MINUTES value is stored and a
Day-of-Week segment starts flashing.
29
7. Press or
Set the correct day of the week.
Select the correct Day-of-Week segment.
8. Press SET
Your Day-of-Week segment is stored and
the currently stored Kh value flashes.
9. Press OR Pressand-Hold or
Set your meter’s Kh Factor.
Each button press increases or decreases
the Kh value by 0.1. Press-and-hold to
change the value by increments of 1.0.
If you have an electromechanical meter, enter 7.2.
If you have an electronic meter, enter 1.0.
10. Press SET
Your Kh value is stored. The OFF-PEAK and
¢/kWh segments appear and the currently
stored OFF-PEAK RATE flashes.
11. Press or
Set your OFF-PEAK RATE.
Each button press increases or decreases
the OFF-PEAK RATE value by 0.1
12. Press SET
Your Off-Peak Rate is stored.
The OFF-PEAK segment is replaced by
the ON-PEAK segment and the currently
stored ON-PEAK RATE flashes.
13. Press or
Set your ON-PEAK RATE.
Each button press increases or decreases
the value by 0.1
30
14. Press SET
Your ON-PEAK RATE is stored. The currently
stored ON-PEAK start time value appears and
the HOURS digits of the clock flash.
15. Press or
Set your ON-PEAK RATE Start Time- HOURS.
Each button press increases or decreases the
value by 1.
16. Press SET
Your ON-PEAK Start Time HOURS value
is stored. The MINUTES digits are flashing.
17. Press or
Set your ON-PEAK RATE Start Time - MINUTES.
Each button press increases or decreases the
value by 10.
18. Press SET
Your ON-PEAK Start Time is stored.
The ON-PEAK segment is replaced by
the OFF-PEAK segment, and the currently
stored OFF-PEAK Start Time is displayed
with the HOURS value flashing.
19. Press or
Set your OFF-PEAK RATE Start Time- HOURS.
Each button press increases or decreases the
value by 1.
31
20. Press SET
Your OFF-PEAK Start Time HOURS is stored.
The MINUTES digits are flashing.
21. Press or
Set your OFF-PEAK RATE Start Time- MINUTES.
Each button press increases or decreases the
value by 10.
22. Press SET
Your RATE, HOURS and MINUTES values,
as well as the current day-of-week segments
are stored. The SUN (Sunday) segment is flashing.
23.
Set the days of the week that are subjected to the
ON-PEAK rate. Press to change the Day of the Week segment and press
to toggle the current segment On (On-Peak Rate) or Off (Off-Peak Rate).
The default values are MON to FRI (ON), SAT and SUN (Off)
24. Press SET
Exit the Configuration process.
Your Display Unit is now fully configured for operation.
32
7
Display Unit Functions
7.1. Your Display Unit
When the Sensor Unit begins to detect power usage from your utility meter and the
Display Unit receives the Sensor Unit signals correctly, the Signal Strength indicator
indicates a good quality signal, the Disk Emulator starts spinning and real information
appears on the screen after a short time.
7.1.1. Current Consumption Row
At first, the screen shows a series of dashes, then after a short delay, it displays the
current cost of electricity in dollars-per-hour in the top row. The faster the Disk
Emulator spins, the greater the rate of energy consumption and the higher the
dollars-per-hour (or kW – see section 7.2) value you will see on the screen.
IMPORTANT: If your Display Unit shows unusually low consumption (0.4 KW
or less) for an extended period of time when you are performing normal
household tasks such as cooking, laundry, or turning on other appliances, your
Sensor Unit may have become misaligned. See Section 8 for more information.
33
7.1.2. Total Consumption Row
After a few minutes, the value in the third row (Totals Row), starts increasing and provides the
total cost of electricity used. This row always shows the cumulative total of electricity consumed
(either in $ or kW – see section 7.2) since the value was last reset.
7.1.3. Status Row
The second row shows the current status
of your PowerCost Monitor™ system.
The Disk Emulator spins counter-clockwise at a speed proportional to the rate at which you
consume electricity: the more you consume, the faster it spins.
The Signal Quality Indicator shows vertical bars representing the quality of the signal gives
you an indication of the quality of the signal received from the Sensor Unit. Five bars represent
the best possible signal.
The two Battery Level Indicators appear when the corresponding battery level is low. You
should replace the battery as soon as a battery level indicator is displayed.
Consumption History Indicator
The Display Unit stores two peak energy consumption values in kilowatts:
the peak value that has occurred since you last reset the consumption totals,
as well as the peak value for the last 24 hours.
The MAX level represents the highest consumption since you last reset the
totals. The number of bars displayed represents how the 24-hour peak
compares to the maximum peak. For example, the illustration above shows 7 bars out of a
possible 10, therefore the peak for the last 24 hours is 70% of the peak recorded since the
consumption totals were reset.
The arrows indicate how the current level of energy consumption compares to the maximum
and 24-hour peaks. In the illustration, the arrow points to the fifth bar: this means that your
current energy consumption is 50% of the maximum peak and about 70% (5 bars out of 7)
of the 24-hour peak.
34
7.2. Dollar & Cents Display Mode
The first screen you will see once the PowerCost Monitor™ starts functioning is similar
to the one below.
Press the $ key to display all values in dollars and cents.
The top row shows how much electricity you are currently consuming in dollars and cents.
In this example you are currently using $1.08/hour worth of electricity.
The third row represents the total dollars worth of electricity consumed since the total was
last reset. In the example above you have used $27.09 worth of electricity since the total
was last reset.
To reset the Total Dollar value, refer to Section 7.6.
35
7.3. Kilowatt and Kilowatt-Hours Mode
Press the KW key to display all values inkilowatts and kilowatt-hours.
The top row now shows how much electricity you are currently consuming in kilowatts.
In the example above, you are currently using 5.2 kW of electricity.
The third row now displays the Total Kilowatt-Hours (kWh) of electricity consumed since
the value was last reset. In the example above, you used 36.9 kWh of electricity since the
total was last reset.
To reset the Total kWh value, refer to Section 7.6.
36
7.4. Temperature Display
The PowerCost Monitor™ displays the temperature reading at the location of the Sensor Unit.
The temperature can be displayed in either °C or °F, as shown in figure 6.5 below. To change the
temperature reading between Celsius and Fahrenheit, press and release the - °C/°F button on
the back of the Display Unit.
NOTE: If your utility meter is located indoors, this function will NOT show outside temperature.
It only shows the temperature at the utility meter where the Sensor Unit is situated.
37
7.5. Loss of Signal Display
In the event that your Display Unit loses the signal from the Sensor Unit you will see a screen
similar to one of the two illustrations below, depending on the mode your Display Unit is
currently operating in. For example, this may occur if you move the Display Unit to a location
in your house that is too far from the Sensor Unit.
Here are a few causes of loss of signal:
• The Sensor Unit batteries are exhausted.
• The Display Unit has been moved out of range of the Sensor Unit.
• There is a strong interference from other electronic devices,
such as wireless weather stations.
• The Sensor Unit has become misaligned, possibly because of ice or snow falling on it.
To resolve the problem, press any button on the back of the Display Unit and then move the
Display Unit closer to your Utility Meter. If this does not solve the problem, try re-synchronizing
the Display and Sensor Units. Refer to the instructions in section 5.2 to 5.5 according to the type
of meter that is installed in your home.
38
7.6. Resetting the Total Values
Press-and-hold the CLEAR button located on the front of the Display Unit until you hear a beep
to reset the Total values (Dollars and kW) that appear on the third row of the screen, as well as
the peak values for the Consumption History Indicator. The current values do not change, as
shown below.
7.7. Display Backlight
Your PowerCost Monitor™ has a backlight that can be used to see the screen in dimly lit
conditions. To turn the backlight on, press the LIGHT button located on the top of the display
unit. The screen will light up in blue and remain lit for approximately 5 seconds.
39
8
Troubleshooting
In the event that you are experiencing difficulty installing or using your PowerCost Monitor™
system, please refer to the information below to assist you in resolving the issue. If you do
not see your problem listed here, or you are still unable to get your system working properly,
more information is available at http://www.bluelineinnovations.com/pcm or you may send
an email to [email protected] describing the difficulty you are having.You
may also call us toll-free at 1-866-607-2583.
I am unsure of my utility meter type. How can I find out which type of meter I have?
The PowerCost Monitor™ system supports virtually all residential utility meter types.
First, please look at the photos in section 3 and determine your meter type; then follow
the installation instructions for your meter in section 5.
After installing the Sensor Unit on my meter and pressing the RESET button, nothing
happens. The red STATUS indicator does not light up.
After installing the Sensor Unit on my meter and pressing the RESET button, the red
indicator lights up. How can I tell if the unit is operating properly?
Either you have installed the Sensor Unit batteries backwards or the batteries are exhausted.
Ensure that the battery closest to the Sensor Arm is inserted positive (+) end first and the other
battery is opposite. Also, if you are changing the batteries, ensure that the new batteries are
fresh. Refer to Section 4.2.
When you press the RESET button, the red STATUS indicator lights up and stays lit until the
Sensor Unit has determined 1) that it is correctly installed on a meter and 2) the type of meter
on which it is installed. The STATUS indicator then starts flashing either at each pass of the
black mark on the disk in front of the Sensor Head (electromechanical meter) or irregularly
(electronic meter).
In both cases, the indicator stops flashing after about 2 minutes to preserve battery life.
This is normal. If this sequence does not happen as described, the Sensor Unit is likely
not positioned properly on the meter. Repeat the steps in Sections 5.2 to 5.5 as appropriate
for your meter type.
40
When I try to synchronize my Display and Sensor Units, the Display Unit keeps
showing “id” on the screen.
The Sensor Unit appears to have detected my meter properly, but I only see
dashes (--) on my Display Unit.
This indicates that the Display Unit is in ID mode, meaning that is is searching for your
Sensor Unit. Press the RESET button on the Sensor Unit. If the Display Unit remains
in ID mode, locate it within 10 feet (3m) of the Sensor Unit, and then press the RESET
button again.
This indicates that the Display Unit is not receiving transmissions from the Sensor Unit.
Ensure that the Display Unit is located within 100 feet (30m) of the Sensor Unit. Note that
each wall of your house reduces the range by approximately 15 feet (5m). Also, aluminum
siding on your house will significantly reduce the range. If this is the case, try to position
the Display Unit so that there is a window between it and the Sensor Unit.
If range or wall construction does not seem to be the problem, repeat the steps in Section 5.6.
Lastly, it is possible that the batteries in the Sensor Unit are exhausted. Replace the batteries
with fresh ones.
The power usage shown on my Display Unit is not updating or is unusually low.
The Sensor Battery indicator shows low battery charge, but I installed fresh batteries
not long ago.
Try turning on an electric appliance that consumes a large amount of power such as a stove
or dryer. If the Display Unit does not update within a couple of minutes, then the Sensor Unit
is likely not aligned correctly on your utility meter. Try repeating the steps in Section 5.2 to
5.5 as appropriate for your meter type.
Regular alkaline batteries can become exhausted very rapidly when it is extremely cold
outside. If you are expecting an extended period of temperatures below -20°C (-4°F), try
using lithium type AA batteries in the Sensor Unit. These batteries are commonly available
wherever you can buy batteries and they provide better cold-weather performance.
41
The temperature shown on the Display Unit does not match weather reports or
appears to be incorrect.
The consumption information shown on my Display Unit is not correct and it
jumps randomly.
The temperature shown on the Display Unit is the ambient temperature at your utility meter;
it may vary from other sources, such as TV weather reports, because of distance and other
factors. Also, if your utility meter is exposed to direct sunlight during any part of the day, then
the reading will be higher than normal. The reading will return to the correct value when the
utility meter is shaded.
There are several things that can affect the accuracy of the information shown on your
Display Unit and they all relate to interference.
If your neighbour also has a PowerCost Monitor™ system you may be receive their
information. In this case you need to change the Sensor Unit address and resynchronize
the Display Unit. Follow the steps in Section 5.6, but press and hold the RESET button
for five (5) seconds). The Sensor Unit then selects a new address randomly on which to
base the synchronization.
Wireless devices, such as weather stations or old-style baby monitors and cordless phones,
transmit information on frequencies similar to the PowerCost Monitor™. If you have a
wireless weather station try turning it off briefly and check to see if the PowerCost Monitor™
Display Unit returns to normal operation. If it does, then check to see if you can change
the channel that your weather station operates on.
The total shown on my Display Unit does not match the total shown on my
electricity bill.
In order for the two totals to match you would need to clear the totals on the Display Unit
on the exact day and time as the utility company reads your meter. The total amount
shown on the PowerCost Monitor™ is accurate, but is really meant as a reference to indicate
how much power you have consumed since you last cleared the totals. If you clear the totals at
the beginning of every month, for example, then you can use the PowerCost Monitor™
to compare against your monthly budget.
42
Warranty
LIMITED ONE YEAR WARRANTY
Blue Line Innovations warrants this product to be free from defects in materials
and workmanship for a period of one year from the date of sale to the original user
or consumer purchaser. Blue Line Innovation’s exclusive obligation under this warranty
shall be, at its option, (a) to supply, without charge, a replacement of the product or
(b) to refund the purchase price in respect of any product that is found to be defective
and that is returned, with its proof of purchase, to the original supplier.
This warranty excludes and does not cover defects, malfunctions, or failures caused by
misuse, unauthorized repairs, modifications or accidental damage.
Note: This warranty does not apply to batteries or damage to the product caused by the
use of faulty batteries.
This warranty is only applicable to a product purchased through a Blue Line
Innovations authorized dealer.
In no event shall Blue Line Innovations be liable for consequential or incidental
damages.
This warranty is in lieu of all other expressed warranties. The duration of any implied
warranty is limited to the period of the expressed warranty set forth above.
MANUFACTURED IN CHINA
Blue Line Innovations Inc.
187 Kenmount Road
St. John’s, NL Canada
A1B 3P9
Web Site: www.bluelineinnovations.com
E-Mail: [email protected]
Toll Free: 1-866-607-2583
© BlueLine Innovations Inc.
PowerCost Monitor™ is a trademark of BlueLine Innovations Inc.
43
Specifications
Power
Display Unit
2 AA Alkaline Batteries (LR6 or equivalent)
Sensor Unit
2 AA Alkaline Batteries (LR6 or equivalent)
Wireless Communications
Frequency
433.92MHz
Update Rate
Approximately every 30 seconds
Range
Up to 30m (100ft.) line-of-sight (Subtract 5m or 15
feet for each wall between Display and Sensor Units)
Operating Temperature Range
44
Display Unit
10˚C to 45˚C (50˚F to 113˚F) For indoor use only.
Sensor Unit
-40˚C to 60˚C (-40˚F to 140˚F)
FCC Information
FCC Class B Part 15
This device complies with part 15 of the FCC Rules. Operation is subject to the following
two conditions:
1. This device may not cause harmful interference, and
2. This device must accept any interference received, including interference
that may cause undesired operation.
Warning: Changes or modifications not expressly approved by Blue Line
Innovations Inc. void the user’s authority to operate the equipment.
This equipment has been tested and found to comply with the limits for a Class B
digital device, pursuant to part 15 of the FCC Rules. These limits are designed to
provide reasonable protection against harmful interference in a residential installation.
This equipment generates, uses, and can radiate radio frequency energy and, if not
installed and used in accordance with the instructions, may cause harmful interference
to radio communications. However, there is no guarantee that interference will not
occur in a particular installation. If this equipment does cause harmful interference
to radio or television reception, which can be determined by turning the equipment
off and on, the user is encouraged to try to correct the interference by one or more
of the following measures:
• Reorient or relocate the receiving antenna.
• Increase the separation between the equipment and receiver.
• Connect the equipment into an outlet on a circuit different
from that to which the receiver is connected.
• Consult the dealer or an experienced radio/TV technician for help.
Industry Canada Certification
Operation is subject to the following two conditions:
1. This device may not cause harmful interference, and
2. This device must accept any interference received, including interference
that may cause undesired operation.
45
187 Kenmount Road
St. John’s NL Canada
A1B 3P9
www.bluelineinnovations.com
Toll Free: (866) 607-2583
P/N: BLI-00193R003
© BlueLine Innovations Inc.
PowerCost Monitor™ is a trademark of BlueLine Innovations Inc.