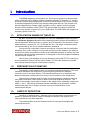
1
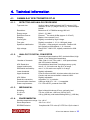
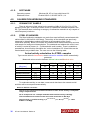
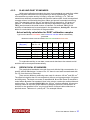
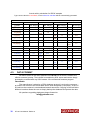
RT-50
Laboratory gamma ray spectrum
analyzer with evaluation program
LabCenter
User Manual
Edition 8.
November 2010
SW Version 2.6.0
for Windows XP,
Vista or Windows 7
LABORATORY GAMMA RAY
SPECTRUM ANALYSER
RT-50
WITH EVALUATION PROGRAM
LabCenter
Production and service:
GEORADIS s.r.o.
Hudcova 56b
621 00 Brno
Czech Republic
Phone: +420 541 422 231
Fax: +420 541 422 232
E-mail: [email protected]
Web: www.georadis.com
2
RT-50 User Manual Edition 8
Content
Content
3
1.
5
Introduction
1.1.
1.2.
1.3.
2.
APPLICATION RANGE OF THE RT-50
PREPARATION OF SAMPLES
LIMITS OF DETECTION
Description of RT-50
2.1.
2.2.
CONFIGURATION AND REQUIREMENTS
MAINTENANCE
2.2.1.
2.2.2.
2.2.3.
2.2.4.
2.3.
SERVICE SUPPORT
2.3.1.
3.
Recomended daily procedures
Monthly procedures
Storage and transportation
Safety
Repairs
LabCenter SOFTWARE
3.0.
3.1
3.2.
3.3.
INSTALLATION
FIRST RUNNING - CONNECTION TO THE DATABASE
GRAPHICAL USER INTERFACE - MAIN PANEL
FIRST START – CONFIGURATION
3.3.1.
3.3.2.
3.3.3.
3.3.4.
3.3.5.
3.3.6.
3.3.7.
3.3.8.
3.4.
CALIBRATION
3.4.1.
3.4.2.
3.5.
3.6.
3.7.
4.
Gain setup
Calibration
MEASURING OF SAMPLES
RESULTS
PROGRAM TERMINATION (ENDING THE PROGRAM)
3.7.1.
3.7.2.
3.8.
3.9.
Measuring devices
User‘s list
Nuclide list
Sample description
Measurement methods
Corrections
Other parameters
Reports
Info about the program
Logout and program termination
ERRORS AND SYSTEM MESSAGES
CHECKING OF THE SYSTEM CONDITION
Technical information
4.1.
GAMMA RAY SPECTROMETER RT-50
4.1.1.
4.1.2.
4.1.3.
4.1.4.
4.1.5.
4.2.
Detector and analog processor
Analog to digital converter
Mechanical
Environmental
Software
CALIBRATION WORKING STANDARDS
4.2.1.
4.2.2.
4.2.3.
4.2.4.
Cesium test Sample
Steel standards
Slag and dust standards
Geophysical standards
5
5
5
7
7
8
8
9
9
9
9
9
11
11
11
13
15
15
16
17
18
19
21
21
22
23
23
24
27
29
30
30
31
31
32
35
35
35
35
35
35
36
36
36
36
37
37
RT-50 User Manual Edition 8 3
4.3.
4.4.
5.
DATA FORMAT
CORRECTION FILE FORMAT
Enhanced software options
5.1. USEFUL FREEWARE
5.1.1.
5.1.2.
5.1.3.
5.1.4.
5.1.5.
5.2.
5.3.
4
Acrobat Reader
Decay
Flame Robin
PDFCreator
POEdit
SOFTWARE FOR EXTERNAL COMMUNICATION WITH THE DATABASE
MECHANICAL COMPLETATION OF SPECTROMETER RT-50
RT-50 User Manual Edition 8
38
39
41
41
41
41
41
41
42
42
42
1.
Introduction
The RT-50 laboratory spectrometer is a 1024 channel gamma-ray spectrometer
with a cylindrical NaI/Tl (Sodium Iodide) scintillation detector (3‘‘diameter x 3‘‘ height),
enclosed in heavy lead shielding with a minimum wall thickness of 3.5 inches (9 cms).
A specially designed lid permits easy sample loading and removal. The analyzer unit
has an integrated high voltage supply, amplifier, analog - digital converter plugged
directly onto the detector socket. The RT-50 spectrometer unit operates under the
control of the system computer (PC) via a USB cable. The USB cable also supplies all
necessary power to the unit.
1.1.
APPLICATION RANGE OF THE RT-50
RT-50 is controlled from a standard PC using the LabCenter software program.
The LabCenter program calculates from measured gamma spectra concentrations of
natural radioactive elements K-40, U (natural) and Th (natural) or the activities of manmade elements - typically Cs-137, Co-60 and Am-241. The range of tested elements
can be extended by the use of suitable calibration standards.
Correct activity computation requires geometrical conformity with the calibration
standards. Size, mass, material and even the positioning of the sample in the detector
should be as similar as possible as those of the calibration samples to achieve the best
results and optimize system performance. A description of the basic supplied standards
can be found in chapter 4.2.
Use of heavy lead shielding (9 cm wall thickness) allows the RT-50 to reach very
low level detection limits of various radionuclides. The lid of the measuring chamber
must be kept closed during the measurement process.
1.2.
PREPARATION OF SAMPLES
Preparation of steel samples does not require any special procedures. The steel
calibration standards are designed to copy the typical geometries of samples
commonly used in the steel industry. The sample temperature must respond to the
detector temperature which means it must be equal to ambient room temperature.
Dust and slag samples must be milled and homogenized in suitable measuring
cans which must have a size similar to those of the dust calibration samples. The
weight of the sample should also be similar to the weight of the calibration sample and
within +/- 30 %. Measuring containers that are repeatedly used should be carefully
cleaned after each use to make sure there is no cross contamination of the
measurement sample.
1.3.
LIMITS OF DETECTION
Sensitivity of measurement – detection limit is influenced by several factors. In
addition to geometrical factors (shape of sample) the weight of the sample and
measurement time are also important.
The following table gives the detection limits for most typical samples and
measurement times.
RT-50 User Manual Edition 8 5
Laboratory spectrometer RT-50
produced by GEORADIS Brno, CZ
Detection limits for the selected radionuclides – etalons TS11 (100 ml / 120 g)
Time of meas Cs-137
K
U eq.
Th eq.
300 s
5 Bq 35 Bq 1,0 %
5 Bq 3,0 ppm 5 Bq 3,0 ppm
900 s
3 Bq 22 Bq 0,6 %
3 Bq 2,0 ppm 3 Bq 2,0 ppm
1800 s
2 Bq 15 Bq 0,4 %
2 Bq 1,3 ppm 2 Bq 1,3 ppm
3600 s
1.4 Bq
10 Bq
0,3 %
1.4 Bq
1,0 ppm
1.4 Bq
1,0 ppm
Detection limits for the selected radionuclides – etalons G250 (250 ml / 400 g)
Time of meas Cs-137
K
U eq.
Th eq.
300 s
8 Bq 60 Bq 0,5 %
8 Bq 1,5 ppm 8 Bq 1,5 ppm
900 s
5 Bq 35 Bq 0,3 %
5 Bq 1,0 ppm 5 Bq 1,0 ppm
1800 s
3.5 Bq 25 Bq 0,2 % 3.5 Bq 0,7 ppm 3.5 Bq 0,7 ppm
3600 s
2.5 Bq
20 Bq 0,15 % 2.5 Bq
0,5 ppm
2.5 Bq
0,5 ppm
Detection limits are calculated for radionuclides and methods supplied by
manufacturer. The following formula can be used to determine limits in different
conditions.
DLvz = DLet * mvz / met
DLvz sample detection limit,
DLet detection limit of the standard,
met calibration standard weight
mvz sample weight .
DLt = DLst * SQRT( tst / tt )
DLt detection limit for new time of measurement,
DLst detection limit for old time of measurement
tst standard measuring time
tt new measuring time.
6
RT-50 User Manual Edition 8
2. Description of RT-50
The RT-50 is a compact instrument (see picture 2.1.) which is controlled from a
standard PC via USB interface. The USB cable also supplies all operating power to the
unit. The solid base of the instrument case supports heavy lead shielding assembled
from lead rings. A sample chamber consisting of a thin aluminium container is inserted
in the shielding. The sample chamber is covered with a massive movable lead lid. Its
sophisticated design allows easy single hand operation. Use of the handle guarantees
safe operation of the lid. However the lid is very heavy and extreme caution should be
used when operating the lid. The cabinet is coated with durable plastic for easy
maintenance and cleaning. At the rear there is a USB cable. There are no other
controlling or manipulating elements located on the instrument. The instrument is fully
controlled from the system computer.
Picture 2.1
2.1.
CONFIGURATION AND REQUIREMENTS
The RT-50 consists of following parts:
• Detector NaI(Tl) ø 76 mm x 76 mm (3x3‘‘) with integrated photomultiplier
•
•
•
•
•
•
•
•
Multichannel gamma-ray spectrometer
Steel or Lead shielding with movable lid
Stabilization standard Cs-137 TEST SOURCE
Set of calibration STEEL standards (Co-60, background)
USB cable
Digital balances RADWAG WPS 600/C/10 with RS-232 port
PC and 15‘‘ LCD monitor
Installation CD for PC program LabCenter
RT-50 User Manual Edition 8 7
• User‘s guide
Selectable options are:
• Set of calibration standards G250 (volume 250 ml, K, U, Th, Cs, background) for
GEO applications
• Set of calibration standards G100 (volume 100 ml, K, U, Th, Cs, background) for
GEO applications
• Set of 250 ml containers (100 pc)
• Set of 100 ml containers (100 pc)
• Set of calibration standards D100 (volume100 ml, K, U, Th, Cs, Co, Am,
background) for dusts and slags
The standard RT-50 system includes the PC and the digital balance. Customers
have the option to supply their own PC and digital balance.
The following are minimal requirements for a PC supplied by the customer.
•
•
•
•
•
•
2.2.
Processor Intel Celeron, 2.0 GHz or compatible
RAM 512 MB DDR
Hard disc 40 GB
CD ROM
VGA standard to support Windows XP
Microsoft Windows XP Professional
MAINTENANCE
All functions of the RT-50 instrument (except sample changing) are controlled by
software from PC. There is no control element located on the instrument.
The RT-50 is designed for simple maintenance but the user can take simple
basic steps to ensure accurate measurement of samples. It is extremely important to
keep the measuring area/sample chamber free of any potential contamination by
radioactive elements. The guaranteed sensitivities depend on a minimal radiation
background. We recommend that calibration standards and also the test samples are
put in a suitable plastic bag before being placed in the sample chamber. It is much
simpler to dispose of a contaminated bag than to perform a complicated
decontamination of the measuring area/sample chamber.
The manufacturer recommends that the operator wipes the measuring area once
a month with a clear tissue soaked in alcohol.
There are no maintenance requirements for next components of the instrument.
2.2.1.
RECOMENDED DAILY PROCEDURES
Users will have to adjust procedures to suit their own requirements. The following
are recommended procedures that should be carried out at the start of every shift to
ensure system performance is optimized.
• visually inspect the instrument and the measuring area/sample chamber to ensure
that it is free of dirt etc. If necessary clean the chamber using alcohol or similar.
• run the gain set up procedure (Gain setup chapter 3.4.1.) to ensure the
spectrometer is working under the optimal conditions
8
RT-50 User Manual Edition 8
2.2.2.
MONTHLY PROCEDURES
The user should carry out a more complete procedure each month to check
overall system performance.
In addition to regular cleaning (see 2.2.) it is recommended that the user makes a
technical parameters check and a total recalibration. You will find a guide in chapter
3.3.
It is strongly recommended that the user keeps a record of the total calibration
results and compares the results with those obtained in previous periods to check the
overall system performance. Where the user employs non standard calibration
samples with non standard geometries it is important to repeat all calibrations.
2.2.3.
STORAGE AND TRANSPORTATION
The RT-50 instrument must be stored in a dry and corrosion free environment.
Storing temperatures are from - 20 to +50 oC, relative humidity up to 80%.
The instrument is extremely heavy. It is prohibited by the manufacturer to
move or transport the instrument en block. A complete disassembly of the
instrument is required. If it is required to move/relocate the instrument users must
consult the manufacturer or a service center. Any misuse or unauthorized movement
of the equipment could invalidate the warrantee. The manufacturer accepts no liability
arising from such actions.
2.2.4.
SAFETY
The RT-50 instrument may contain lead. The lead is a dangerous heavy metal
and it is important to follow all rules and procedures to protect health and environment.
Under normal circumstances the lead is covered inside the instrument and there is no
unauthorized access to it. Under normal circumstance the instrument is completely
safe, however it is important to keep the unit out of any aggressive liquids or gasses
which could lead to chemical reactions causing lead containing chemical release.
Any opening of the RT-50 instrument’s cabinet must be done with respect to the
presence of lead. All manipulation and movement of the instrument must be done
under hazardous material safety policy. It is recommended to call service center to
provide all works by authorized and specially trained personnel.
End of life disposal of the instrument must be done in accordance with the
regulations applying to heavy metals. (ECO and WEEE – Waste Electrical and
Electronic Equipment). The shielding must be removed from the instrument and
deposited as a heavy metal. It is recommended to contact the manufacturer who will
provide end of life disposal.
The RT-50 instrument is very heavy - up to 580 kg (1280 pounds). It is highly
important to check the loading limit of the floor of the proposed location for the
instrument. The minimum loading limit requirement is for at least 2800 kg/m2.
Any manipulation with assembled instrument is prohibited!
2.3.
SERVICE SUPPORT
2.3.1.
REPAIRS
The RT-50 is a delicate instrument. There are no user serviceable parts inside
the equipment. No unauthorized operation inside the instrument is permitted. Such
actions could invalidate the warrantee. The manufacturer accepts no liability arising
from such actions.
RT-50 User Manual Edition 8 9
In case of any malfunction - please contact our local service center, dealer or the
manufacturer direct.
The Manufacturer‘s service center is accessible on:
Phone: +420 541 422 231
E-mail: [email protected]
10
RT-50 User Manual Edition 8
3. LabCenter SOFTWARE
3.0.
INSTALLATION
• The LabCenter software should start automatically after inserting the CD into the
PC. In the event that startup does not work automatically call Start.exe from the
main directory of the CD. Installation menu (Picture 3.0) will display.
• It is essential to install all three parts during the first installation. Uploading or reinstalling any of them in future can be done separately. Part can be installed in any
order. Pressing button with written label user triggers installation of chosen part.
Installation runs automatically and returns back to the installation menu.
Picture 3.0
• Install Georadis USB Driver - is execute on the PC with connected RT-50
• Install Firebird SQL Server - is execute on the PC where the data will be stored
• Install Georadis LabCenter - is execute on the PC for spectrometer control
Notes:
In the simplest case it is only one computer, but those works could be divided
between more computers.
USB Driver is not necessary in case of DEMO installation.
Supervising of the results can be done only with LabCenter installation.
The RT-50 spectrometer can be connected to the PC after successful installation
of USB Driver. It starts New Hardware Guide. Refuse the connection to the Windows
Update on the first screen via Not now selection and confirm all other suggestions.
3.1
FIRST RUNNING - CONNECTION TO THE DATABASE
The user must arrange an access to the SQL server that support storage of the
settings and results. It can be used with any customer‘s SQL using customer defined
access to their own network, or can be run on a local SQL server on the local PC
delivered by the manufacturer.
It is arranged automatically during the first startup of the LabCenter or it can be
run any time via program Database setup (shortcut Database setup located on
Georadis LabCenter folder in Startup menu).
RT-50 User Manual Edition 8 11
The selection of the database language appears first followed by the screen like
Picture 3.1.
Picture 3.1
After the selection of the computer where the database is located the password
must be entered. The initial password is „masterkey“. The password can be modified
later according to the chapter 3.3.2. Click on the Connect button activates the bottom
part of the window.
As the button descriptions leads new database can be created, the existing one
opened or the selected one can be deleted. Usually is used labcenter.fdb in
Documents\LabCenter folder of the actual user. Than the automatic templates could
be used for the usual types of measurement - compare Picture 3.2.
Picture 3.2
Those are:
• Measurement of Co-60 in steel samples,
• Measurement of Am-241, Co-60, Cs-137, K-40, Ra-226 and Th-232 in dust samples
or
• Measurement of Cs-137, K-40, U-nat. and Th-nat. in geological samples.
The user select Yes at the type he want to use. It is possible to select all of them,
some of them or no one.
The created template methods are exemplary ones. There are proper
radionuclides with suitable Region Of Interest (ROI) for their evaluation but it is
12
RT-50 User Manual Edition 8
necessary to modify the names of the etalons, their reference dates and activities
according to the Protocols and etalons supplied with the RT-50 spectrometer.
The user can define any number of the fields for sample description. The only
commonly used fields that are important for running of the SW or for evaluation of
results are preset. The details are in the chapter 3.3.4.
Not using the preset templates the new empty database is created. It is
necessary to fill in all parameters and values for the method. This is recommended only
for advanced user.
Click on the Open database button opens the dialogue Open database. The
selection of the folder and database confirmed by Open button causes the database
connection. It‘s name and path is displayed under the buttons for database
manipulation.
When the installation is provided by Administrator and the user have no access to
the Administrator‘s Documents folder, where the database can be located, it is
necessary to type the correct path and database name to the Open database window
manually using keyboard without dialogue Select use. The same way must be used for
connection to the database on the computer connected by the PC net.
Delete database proceeds according to the Windows practice. Database for
deleting must be opened first, after deleting the new one should be opened.
Creating or opening the database must be confirmed by clicking on the OK
button. The active window is closed. Next run of the LabCenter proceeds according to
the followed chapters.
3.2.
GRAPHICAL USER INTERFACE - MAIN PANEL
The LabCenter is activated by clicking on the shortcut from the desktop. The
program is password protected. When the popup window Database login (picture 3.3.)
appears the correct user name and password must be entered to access the main
panel.
Picture 3.3
The GUI main panel (picture 3.4.) has access features. From the top down the
following appear.
RT-50 User Manual Edition 8 13
Picture 3.4
•
•
•
•
Main bar with program‘s name.
Main menu bar with text items File and Measure.
Below the main menu bar is a bar with icons - speed buttons.
Compo boxes below icons serves to filtering of displayed results. User can select
criteria for faster orientation in the results database. Sorting keys are Day Period,
Method of Measurement, User Name and Device.
• At the very bottom of the page is a status bar with five message fields.
The first field is reserved for MCA status. There are three messages alternating.
Device connected, Deviceless mode for any demo or reanalysis from database and
Device not connected!
A correct login in to database indicates a message Database connected
(second field from the left). Message Database disconnected announces any problem
with the database.
The third field indicates readiness to measure. Message Gain setup alternates
with error message Gain setup timeout! where a gain has to be adjusted prior to a
measurement. The timeout is preset for 8 hours which means that the system requires
a gain setup every 8 hours. Setting the gain every 8 hours minimizes any influence of
the ambient temperature on results.
A user name, actual date and time is displayed in the last field of the bar.
14
RT-50 User Manual Edition 8
Main menu. Clicking on File activates the following drop down menu:
• Logout user‘s logout,
• Settings program setup
• Quit for quitting.
Clicking on Measure activates:
•
•
•
•
3.3.
Gain setup – MCA gain adjustment
Measure sample – measuring of a sample
Results – browsing of the results database
Calibrate – calibration procedures.
FIRST START – CONFIGURATION
A default setup is done during the installation process. Most users use the
default setup settings.
For customers who want to customize their program the following procedure
should be performed.
Activating of item Settings from menu or speed button Settings will generate six
tab cards each with a variety of user selectable parameters.
3.3.1.
MEASURING DEVICES
Picture 3.5
The tab Measuring devices (picture 3. 5.) harbors two windows with a list of
selectable items, Gamma measuring device and Scales. The LabCenter supports
different types of MCU (Measuring devices) and balances from different manufacturers.
The relevant MCU or Scales can be selected by highlighting the relevant item from the
list. Clicking Apply will trigger communication with the selected device. The serial
number of the chosen instrument is displayed if the initialization is successful.
RT-50 User Manual Edition 8 15
The manufacturer supports two types of MCA - RT-50 Georadis and GR 320
SAIC - Exploranium. On the list of scales there are Axis A500, Chyo YMC LABO
MK-500C, Mettler Toledo AB-S or PB-S, Ohaus Advanturer, Radwag
WAA/WAS/WPS and Radwag PS. LabCenter expect the communication with any
scales via serial line. User can find default set up for most common scales in the next
table.
Scales
Type
Axis
A500R
Chyo
YMC
LABO
MK-500C
Mettler
Radwag
Toledo
OHAUS
Radwag
WAA/WAS/
ABAdvanturer
PS
WPS
S/PB-S
Baud Rate
Data Bits
Parity
Stop Bit
Flow
Control
Character
for Weight
Sending
4800
8
No
1
2400
8
No
1
2400
8
No
1
2400
8
No
1
4800
8
No
1
4800
8
No
1
No
No
No
No
No
No
SI
D
S
P
SI
S
If other scales are to be used then a separate driver for that scale can be added
to the LabCenter. The customer shall submit a data and command format to the
manufacturer in order that the plug-in can be integrated with the program.
3.3.2.
USER‘S LIST
Picture 3.6
Tab Users - Picture 3.6 - lists defined users and their access rights. Login name,
First name, Last name and Clearance are stored with every result or calibration. The
Clearance limits access rights by categories. There are:
16
RT-50 User Manual Edition 8
• Administrator – full access to all files and features. It is restricted for
manufacturer’s personnel.
• Power user – partially limited access for calibration, measurement and parameter
setup. It is rated for managers.
• User – limited access for worker. Only measurement and gain setup are accessible.
Adding a new user or modification of a current user can be done. Buttons located
on the right side of the list. Touching any of the buttons leads to an editable popup
screen. The user can change any of the items. New values are stored after touching
buttons Add user or Modify user. To exit screen without any change use the Cancel
button.
Delete user opens a confirmation window to double check operation before
permanent data erasing.
3.3.3.
NUCLIDE LIST
Only suitably qualified personnel should edit the following tabs.
Picture 3.7
Tab Nuclide list - picture. 3.7 - is a list of nuclides with their half-life and ROIs
(region of interest) which can be assigned to any spectral evaluation method. User can
RT-50 User Manual Edition 8 17
edit current, add new or delete nuclides from the list. The editing is fully interactive and
the user must fill all relevant data on the editable sheets. It is obvious that unskilled
change of any number can lead to fatal errors during evaluation.
Buttons New nuclide, Edit nuclide and Delete nuclide activate related edit
sheets. Editing of ROIs follows same principals. The pop-up window with the list of
nuclides from the library for nuclides identification appears during adding new nuclide
to choose the same description for nuclide used in calibration and identification mode
of evaluation.
3.3.4.
SAMPLE DESCRIPTION
Tab Sample description - Picture. 3.8 - allows to user to define its own database
structure as every user has different requirements on sample identifiers. Sample
description tool helps to integrate LabCenter data output to existing company data
structures. Each sample description item has its unique Name, simple Description,
Type, Minimum and Maximum value and Allow empty attribute. The Name is a
unique name that will be assigned in the database. It is highly important to follow user’s
internal company’s own procedures for creating data structures to guarantee a future
compatibility inside the company’s database. The Description is used to better specify
the content. Type of the item defines its format. The following types are predefined:
Picture 3.8
•
•
•
•
Integer number
Real number a float number with decimal point
String a chain of characters
Weight this allows communication with scale
After choosing a type the user will continue with button Next >>. Entering
Minimum and Maximum and Allow empty set up an internal policy and can protect user
against typing errors. For String types it is recommended to enter maximum length in
characters.
Edit field allows a change of description. Change of the Name and string length
is restricted. Typing button Modify field will update the database. Button Cancel
abandons the edit screens. Selected existing items can be erased from the database
by using Delete field.
18
RT-50 User Manual Edition 8
3.3.5.
MEASUREMENT METHODS
Tab Measurement methods - Picture 3.9 - allows the user to select evaluation
methods of spectrum analysis. There are various methods implemented and final
analysis of spectrum consists of them. User can select suitable methods for his task.
The Measurement method list upper window displays currently usable methods with
a basic description. The next three selectable lists are for the selection of analyzed
radionuclides, related standards and sample descriptors. The user can add a New
method, Edit existing one or Delete any of them. Adding of a new method begins with
typing the related button. After opening an edit sheet the first step is to enter Name for
the method and simple description. The description is used for fast orientation. Next it
is necessary to preset measuring period in seconds and select measuring Geometry.
Last task is to select math formula for evaluation Least square analysis, unit of results
- Mass activity, eventually set up threshold for contamination alarm Has limit and
evaluation via Nuclide analysis. Select Add Method to store or Cancel to leave
without change.
Picture 3.9
The following measuring geometries are available:
• Steel - a steel cylinder with diameter 35 mm and height 10 mm. Recommended
tolerances with user‘s sample: specific mass 7 - 8, even surface of the base,
maximum diameter 50 mm - minimum diameter 20 mm, thickness 4 - 50 mm, total
weight 20 – 800 g.
• Dust (dust or slag) - loose material in a can. Volume 100 cm3 and apparent density
1.2. Recommended tolerances: density 0.8 - 1.6, element size less than 5 mm in
diameter.
RT-50 User Manual Edition 8 19
• Rock – loose material in a can. Volume 100 or 250 cm3 and apparent density 1.5.
Recommended tolerances: density 1.0 - 2.0, element‘s size less than 5 mm in
diameter.
• Water – dispersions in a can. Volume 250 cm3 and density 1.0. Recommended
tolerances: density 0.8 - 1.2, no sediments.
The method of Least square analysis (LSQ) simulate the measured spectrum
from the spectra of the calibration etalons – the calibration procedure is necessary to
provide before start of measurement. The final results are as precise as possible. The
Standard deviation from the statistics is calculated for each value.
When Mass activity is set to Yes the mass activity is calculated during
evaluation via LSQ method. Otherwise the total activity is calculated.
The selection of Has limit to Yes causes the comparison of the results with the
allowed limit – generate the messages “SAMPLE OK” or “SAMPLE ABOVE LIMIT”.
The method of Nuclide analysis (NA) search the spectrum for peaks and
position of the found peaks compare with the internal library of nuclides to find the
present ones. The following calculation of the activity is provided from the peak areas.
No calibration is necessary for this method but the results are not as accurate as those
ones obtained via LSQ method. No Standard Deviation is calculated, the results should
be taken as estimation value. Detection of peak that is not belonged to any nuclide
from the library results to Unidentified nuclide with zero activity due to unknown
efficiency of measurement.
When both methods (LSQ and NA) evaluate the same nuclide, only result
calculated via LSQ is displayed on the screen with both labels C (calibration) and I
(identification) – compare chapter 3.6. The name of nuclide must be the same in both
methods, using different names gives two results for the same nuclide.
Use Edit Method for correction or Delete method for erasing.
There are three windows below the Measurement method list. Each method
consists of predefined Nuclides; calibration standards used etalon and database
structure for sample description. Each method can have different nuclides, sample
descriptors and nuclides that allow creation of a wide scale of methods. These
components are fully editable for each method.
To add a new standard, press button Add etalon and edit sheet Add a new
etalon. The following items must be entered for each standard:
• Name: - specific name of the standard. It should link or copy the name printed on
the physical calibration standard.
• Description: - simple description
• Reference date: - date when the activity of the standard was certified
• Expire date: - date of usability
• Radionuclide - partial activities of all nuclides in standard.
Edit date from selectable edit fields to use acceptable date format. Clicking on
button Add etalon saves a new standard, Cancel to abandon the edit. Future
correction is possible - type Edit etalon and continue in Modify etalon sheet.
The activities in this table (visible by moving the bar below the window) are
shown like 4.34/3.95 where the first number is activity of nuclide to reference date
given in Protocol while the second number is actual activity – to the current day and
time.
The last window defines the fields visible for the selected method.
20
RT-50 User Manual Edition 8
3.3.6.
CORRECTIONS
Tab Corrections - Picture 3.10 - allows including the correction of the activity
evaluation according to one of parameters. The basic use of this is the correction for
the sample thickness in case of mass activity of Co-60 in STEEL samples due to it may
vary between 5 and 20 mm. The table of correction function must be saved on the hard
disk in text form to be downloadable to the database. The details about it‘s structure
are in the chapter 4.4.
Picture 3.10
To assign the correction table to appropriate measuring method a row from the
list on the tab with requested method must be selected first. Then become accessible
button for assigning describe the field for correction, choose the sample parameter
used for correction and select the file with the appropriate table (usually in the
subfolder CORR). Confirmation by Add correction button the table is load to database
and ready to use in evaluation process.
Being assigned the table can be edited, saved or removed as it is seen on the
buttons in the Corrections window.
Using this possibility is recommended only for advanced users due to it has the
essential influence to the analysis results. In any doubt contact the producer
technicians.
3.3.7.
OTHER PARAMETERS
Tab Other parameters - Picture 3.11 - allows selection of the following:
• Stabilization nuclide: instructs the MCA which peak pattern will be used for setting
of the gain. Currently only Cs-137 data is available in two modes. Gain only is used
for quick stabilization during normal operation; Gain & Offset is used in case of
doubts about the correct energy calibration - positions of peaks. The second
method takes longer time - see the paragraph below. Producer suggestion is to set
the Stabilization period to 200 seconds instead of 60 seconds in case of Gain only
setting.
RT-50 User Manual Edition 8 21
Picture 3.11
• Stabilization period[s]: Defines the time of spectra acquisition prior to stabilization
error is displayed. So it is maximal time of stabilization. The suggested period for
stabilization is 60 seconds. The used photo-peak(s) should reach 1000 counts in
maximal counts channel.
• Language: of the user interface. Change of the language is valid after restart of the
LabCenter program. For possibility of translation the LabCenter SW to different
language see chapter 5.1.5. or contact the producer.
3.3.8.
REPORTS
Tab REPORTS – see Picture 3.12 - allows choosing output forms for printouts.
Forms are written in html format and customer can arbitrarily modify them in any noformatting editor, for instance Notepad. User can assign forms for used sample types.
For indication of results above and below alarm limit can be used different forms. To
assign a form to appropriate measuring method a row from the list on the tab with
requested method must be selected first. Then become accessible buttons for
assigning, saving and deleting assignments to the predefined forms saved in the folder
REP. When no limit is checked the form “Sample below limit” is suitable.
Picture 3.12
22
RT-50 User Manual Edition 8
3.4.
CALIBRATION
Picture 3.13
A calibration is a process that foreruns a sequence of measurements. Calibration
consists of measuring of samples with a known activity (calibration standards) and the
response of the local background, then computation of calibration matrixes. The
LabCenter performs this task automatically. It is important to perform calibration with a
well tempered and adjusted system, because bad calibration will influence the future
chain of measurements. It is important to start the calibration process with Gain setup,
to compensate all gain shifts caused by temperature.
3.4.1.
GAIN SETUP
Type Gain setup from menu item Measure or use speed-button Gain setup. A
new button Start - see picture 3.13 - appears on desktop. The button is accompanied
with text label Insert Cs-137 source and press START.
The remaining desktop area is covered with a graphics chart. Insert Cs-137
source in the sample chamber in the RT-50 and close the lid. Push button Start - icon
and label of the button will flip to Stop – see picture. 3.14. Also the label on the right
changes to Gain setup progress: A new spectrum of the test source is being
collected. Progress of the stabilization is displayed on the bar on the top of the chart.
RT-50 User Manual Edition 8 23
Picture 3.14
On the chart there is displayed an animated spectrum of the test source.
Expected positions of peaks are marked with red vertical lines. Requested stabilization
threshold is marked with a red horizontal line. Once triggered, a new ADC gain and
offset is computed and applied. System checks allowed deviations and in case of
positive test result the message Gain setup successfully completed will show. A
negative test leads to repeating of the stabilization procedure. Three attempts at
successful stabilization are permitted. Unsuccessful gain setup means a fatal problem
and the process of calibration or any measurement cannot continue.
Notes:
The successful gain setup is confirmed on the bottom bar by the message Gain setup ok.
The new gain setup is asked after 24 hours by the message Gain setup timeout!.
If the time from the last Gain setup is longer than 120 hours (5 days) the SW ask providing
the Gain setup twice to increase its precision.
3.4.2.
CALIBRATION
A Power user or Administrator is required to perform calibration.
Calibration starts after selecting Calibrate from the Measure menu or via
speedbutton Calibrate. An interactive list of available measuring methods shows on
desktop (picture 3.15.) with Select measurement method for calibration in the
header. The required method to be calibrated is selected via the related button. The
next screen will show Select etalon for calibration – picture. 3.16.
24
RT-50 User Manual Edition 8
Picture 3.15
LabCenter software allows measurement of each standard independently. The
user must ensure that all expected standards plus background will be measured.
Besides the standard‘s name, information about the last performed calibration is also
displayed. The label Calibrated:07/16/06 11:41:39 displays the last calibration date
and time or message Not calibrated! alerts that the standard has not been measured
at all. Assigned button Calibrate starts the measurement. The LabCenter software
allows one single background measurement to be assigned to all standards - button All
Background - or to measure partial background immediately after measurement of a
standard.
Picture 3.16
Where a complete calibration of all required standards in one batch is undertaken
it is not necessary to measure partial backgrounds for each standard. However this
must be done if only selected standards are measured. Each standard measurement
should be accompanied with actual background to allow for daily background
variations.
The last item is Local background. The local background is subtracted from any
sample spectra in almost all computation methods. It is recommended to measure
impact of local background more often than the system is calibrated. This is to
minimize the background fluctuation on results. As a time saving feature, the
Implemented calibration procedure allows correction of partial standards without the
requirement to repeat the whole calibration procedure.
After selecting the button Calibrate or Measure a spectral chart will display on
desktop - Picture 3.17 with button Stop on top and label Calibration progress: or
Background measurement progress: with progress bar on the right. The x axis
displays energies in the spectrum in keV. The y axis counts the number of registered
pulses in cnts). Pre-selected ROIs (regions of interest) are highlighted green in the
spectral chart. This allows the skilled user rapid orientation and supervision of the
calibration process.
RT-50 User Manual Edition 8 25
Picture 3.17
Spectrum acquisition may be interrupted via the Stop button. A message box Calibration abort (picture 3.18.) with the question Do you really want to abort
calibration? offers a last chance before abandonment of the standard measurement.
Typing Yes aborts measurement and the spectrum is lost. No reverts the system back
to the measuring loop.
Picture 3.18
A successful run of a standard measurement run will finish with header
Calibration setup - picture 3.19 - and message Background measurement
(Calibration) successfully completed. Confirm by selecting OK.
When all standards and background measurements are completed the calibration
is finished and a sample measurement can begin.
26
RT-50 User Manual Edition 8
Picture 3.19
3.5.
MEASURING OF SAMPLES
Picture 3.20
The speed button Measure or Measure sample item from menu Measure starts
the measurement of a sample. First the method of measurement has to be selected
from the list displayed on the desktop. Select the required method to activate the
sample description entry form - New sample description (Picture 3.20). The number
of displayed fields depends on the previous setup done on tabs Sample description
and Measurements methods, therefore the picture 3.20. is only illustrative. All
required information should be entered before Inserting sample in the measuring
container/sample chamber. Ensure the lid is closed securely. Measurement starts by
selecting the start measurement button.
All fields with preset attributes Allow empty to No must be filled. If this is not
done then selecting Start measurement only triggers a warning message box with the
message Field must be filled: Any field with Field type Weight is editable directly
from the keyboard or to receive the actual weight from scale on line click button Get…
When measurement starts an animated chart is displayed on the desktop
accompanied with button Stop and progress bar on the right - picture. 3.21. The screen
is similar to the calibration screen but with the addition of the label Sample
measurement progress. The X axis scales energies in keV and y counts impulses
cnts in spectral channels. ROIs are highlighted in green.
RT-50 User Manual Edition 8 27
Picture 3.21
Pressing Stop interrupts the measurement at anytime. Any action can be aborted
through the confirmation box Sample measurement abort with message Do you
really want to abort sample measurement? and selection buttons Yes and No.
The right upper corner of the spectral chart contains a popup window with
SAMPLE MEASUREMENT in the header. It is an animated status screen with all
important information updated every second during measurement. The following data is
displayed:
•
•
•
•
•
•
•
•
•
•
28
Method:
name of current measurement method
Measure time:
elapsed time / preset time
Total counts:
number of all pulses registered in the whole spectrum
Average counts/s: average count rate
Dead time:
actual dead time
Sample Serial Number:
sample serial number or another name or label
Sample Weight:
weight of the sample
The sample thickness:
the sample thickness if used
Next iteration in: time to next preliminary evaluation
Quality of fit:
measure of conformity between spectrum of the sample and
spectra of the calibrated standards. This must be close to 1 (one). Poor conformity
indicates the presence of another nuclide other than the one covered in the method.
RT-50 User Manual Edition 8
• Results:
preliminary results. The evaluation is provided 30 seconds after
the start of the measurement and thereafter every 10 seconds until the
measurement is completed. This preliminary evaluation offers a limited precision
estimate of results before the final computation to help speed up the manager‘s
decision process. The meaning of the values is described in the chapter 3.6.
Successful measurement is announced with an acoustic tone and a box
Measurement completed appears on desktop. All results are now final and are
automatically saved to the database. Activating the OK button confirms the message.
The sample can then be removed from the measuring container/sample chamber. The
system is now ready to measure a fresh sample. N.B. The old user must log out before
a new user can log on (see End Program section 3.7.1 below)
3.6.
RESULTS
Picture 3.22
The results screen – picture 3.22 - displays immediately after login in to the
database. User can also access the results via the speed button Results or by
selecting results from the Measure menu. The results screen consists of three
windows. The upper window displays a list of all saved measurement results ordered
by time of measurement. The time of measurement and the user name will help with
orientation in database. The user can select any row from the list. Related results of the
measurement selected will display in the window on left bottom corner. Also the
measured spectrum for the measurement selected is displayed in the third window on
the bottom right.
RT-50 User Manual Edition 8 29
Buttons on the right allows user to output important information from the
database. It is possible to print results on predefined form. Delete item from the
database and export measured spectra as well as the complete data record in any
ASCII file.
The results are shown in some columns. The first one (no label) gives the flag “C”
when this row is evaluated by LSQ method using Calibration or/and “I” when the
evaluation is done by NA method via nuclide Identification. The meaning of the
following columns is clear, Std. dev. (SD) means Standard Deviation of the calculated
activity calculated from the statistics of measurement.
Note that activities below the detection limit are in black color, results with
activities above the detection limit and below the followed limit are in blue color and
results above the followed limit and results of NA method are in red color. The activity
above the followed limit and/or presence of any nuclide out of calibration list caused
message “SAMPLE ABOVE LIMIT” due to it is unexpected nuclide activity.
3.7.
PROGRAM TERMINATION (ENDING THE PROGRAM)
3.7.1.
INFO ABOUT THE PROGRAM
Picture 3.23
30
RT-50 User Manual Edition 8
Click on Info button results to the window Program information appears on the
screen. The SW version, creation date, server version and next info according to the
Picture 3.23 are displayed. Those parameters have reason only for service purposes.
Click on Close button close the window.
3.7.2.
LOGOUT AND PROGRAM TERMINATION
To change a user the old user must first logout. To logout choose Logout from
the menu or via the speed button. A new popup window - picture 3.24 - Logout with
control question Do you really want to log out? will display. Touching Yes switches to
Database login and a new user can enter - see chapter. 3.2. No will abandon the
action and leaves the old user active.
Picture 3.24
Program termination (ending the program) occurs after activating Quit. To end
the program a confirmation popup must be activated - Picture 3.25.
Picture 3.25
3.8.
ERRORS AND SYSTEM MESSAGES
Error message
Device not
connected!
Database
disconnected!
Error description
The software has no
connection with the
equipment for
measurement of gamma
radiation spectra
Remedial measure
Check the connection to the spectrometer via
USB cable, select and connect the right
equipment according to the serial number in
menu: Settings - Measuring devices Gamma measuring device, confirm by Apply
button
Log on the database server by procedure Login
The software is not
connected to the database using one of the right name and password. The
logging must be started up the SW via
server with program
setting, calibration spectra
Database setup
and results of
measurement
RT-50 User Manual Edition 8 31
Gamma
measuring
device must be
connected to
perform this
operation!
Check the connection to the spectrometer via
The spectrometer is not
USB cable and selection of the right equipment
connected or has no
according to the serial number in menu:
response. It is not possible
Settings - Measuring devices - Gamma
to provide the selected
measuring device, confirm by Apply button
function.
Gain setup
timeout!
Gain setup was not
provided or it takes more
than 24 hours since last
setting
Start Gain setup procedure
Gain setup
error! Insert
source and try
again.
The Cs-137 was not found
in the spectrum during
Gain setup so the Gain
setup was not provided
Check the presence of the Cs-137 test source
in the sample chamber; it's orientation by the
labeled side to the detector (down) and run the
Gain setup again. If error repeats call the
service.
Field must be
filled:
The required field
specified behind this
message was not filled in
Fill in the specified field
Device
communicating
error. Params
could not be
read!
The spectrometer is not
connected or does not
respond
Check the connection to the spectrometer via
USB cable and selection of the right equipment
according to the serial number in menu:
Settings - Measuring devices - Gamma
measuring device, confirm by Apply button
3.9.
CHECKING OF THE SYSTEM CONDITION
The RT-50 spectrometer is fully automatic system that adapts the internal
parameters to the actual conditions of electronics or outside temperature. This is done
during Gain setup and Calibrate procedure. Of course the system has limited range of
parameters.
Also the detector can move the parameters due to the condition of the crystal,
photomultiplier and their optical contact. The location of the detector inside the massive
shielding in the laboratory ensure the best condition for the detector allowing it proper
work for tens of years. But nevertheless an error can appear.
The following routine can give you an idea about the actual condition of the
system. Check if the sample chamber is clean and no radiation sources are close to
the RT-50 spectrometer.
1. Measure the calibration sample as a regular sample – if Mass activity of steel is
one of the used methods measure the calibration sample of Co-60 in steel,
otherwise use the calibration sample of mostly used method with the simplest
spectrum (Cs-137, K-40, Co-60). Use the standard time of measurement, no quick
preview, to obtain smooth spectrum.
2. Look to the view of spectra. When the detector is in perfect condition the full peak(s)
must be inside the highlighted area. In case of Co-60 measurement both peaks
should be there and the minimum between the peaks should reach as low as left
border of the first peak or lower. See the following picture:
32
RT-50 User Manual Edition 8
3. The results must show only nuclide of measured sample (usually Co-60) and the
activity must be in the region of ±3 Standard Deviations (SD) from the certified
value (see Calibration Samples Protocol) corrected to the actual date using half-life
of the nuclide. Compare the Manual, chapter 4.2.2 or 4.2.3. If no, run Gain setup
and/or the Calibration according to the following steps and measure the sample
again.
4. Look to the Quality of fit (the last item in the SAMPLE MEASUREMENT field). It
should be lower than 5. The ideal value is 1, it can happen that it is lower than 1 – it
does not matter. When this value exceeds 5, the Calibration is strongly
recommended. Do not forget to run the Gain setup before the Calibrate procedure.
5. Go to Results menu and select the newest sample in the upper field. Than activate
the Details list in the left bottom field of the LabCenter window. The Quality of fit is
the first item there. The fifth item is Gain correction. This parameter was used
during the simulation of the measured spectra from the calibration ones and should
be close to value 1.00, let say 0.98 – 1.02. If not provide the Gain setup and repeat
the measurement.
6. When Gain setup and Calibration is not necessary to provide or was finished the
results of the measurement must be OK (otherwise the electronics or detector is
unstable and must be completely replaced) and the spectra view should looks
like the picture above – otherwise the detector lose the quality. The Nuclide
Identification does not work precisely in that case and the block of electronics with
the detector should be replaced soon. The calibration every month (week) is
recommended as well to avoid inaccurate results.
Notes:
During the Gain setup the following parameters are displayed on the screen:
RT-50 User Manual Edition 8 33
High voltage – should be between 450 and 1000 Volts but close to the original
value mentioned in the Quality Assurance PROTOCOL as HV Potentiometer:
let say ± 10 Volts. If more, it means that the parameters of the detector or
electronics were moved and was compensated by high voltage. No influence on
the evaluation process.
ADC gain – fine setting of the gain varies in the range 0.95 – 1.05. If more, the
next iteration of the Gain setup runs automatically and it is compensated by HV
value.
ADC offset – gives the real shift between the zero of energy in keV and zero of
voltage in mV. Any value is OK but normally about -40 mV.
Temperature – show the temperature on the processor measured by the internal
thermometer. Not far from the laboratory temperature but the precision is poor.
34
RT-50 User Manual Edition 8
4. Technical information
4.1.
4.1.1.
GAMMA RAY SPECTROMETER RT-50
DETECTOR AND ANALOG PROCESSOR
Type and size:
Resolution:
Energy range:
Reference source:
Shaping:
Coarse gain:
Fine gain:
Spectrum stabilization:
High voltage:
4.1.2.
ANALOG TO DIGITAL CONVERTER
Type:
Number of channels:
ADC Dead time:
Integral nonlinearity:
Differential nonlinearity:
Lower threshold:
Upper threshold:
ADC Offset:
Dead time correction:
Communication interface:
Power requirements:
4.1.3.
Successive Approximation ADC, double buffered, high
speed 1.5 ms with digital linearization
1024 (Ch# 0,1 Life Time; ch# 2 - 1022 spectral data;
ch# 1023 cosmic channel)
Zero additional dead time (including memory cycle)
max 0.1 %, full scale over top 99 % of range
max 1 %, full scale over top 99 % of range
Digitally adjustable
Fixed to channel #1022, all pulses above this level are
Cosmic and are accumulated in channel #1023
Digitally adjustable
Automatic, 0.1 % precision.
USB type A(M) 2.0 / 1.0 / 1.1 compatible
5 V / 100 mA DC, powered from USB
MECHANICAL
Shielding:
H x W x D:
Weight:
4.1.4.
Sodium Iodine (thallium doted) NaI(Tl) volume 0.35l
diameter 76 mm (3”) height 76 mm (3”), Photomultiplier
bialkali
Better then 9 % FWHM at energy 662 keV.
20 keV - 3.0 MeV
External, 137Cs activity 9 kBq (approx. 0.25 mCi)
Bipolar, time constant 1 ms
Digitally controlled by High Voltage
Digitally controlled +/- 3 % in 1024 gain steps
Two point – offset and gain correction. Position 662
keV typically at 220 channel +/- 0.1 channel
Range 500 - 1000 V DC, digitally controlled in 4096
steps
Steel, minimal thickness 85 mm, optionally lead
770 mm x 360 mm x 620 mm (30"x14"x24")
410 kg (900 lbs), with lead shielding 580 kg (1280 lbs)
ENVIRONMENTAL
Working temperature range: 0 to +40 oC
Store temperature:
-20 oC to + 60 oC
RFI/EMI Emission:
Complies with FCC rules (47 CFR Part 15) for class A.
RT-50 User Manual Edition 8 35
4.1.5.
SOFTWARE
Operating system:
Database server:
4.2.
Windows 2K, XP or Linux with Kernel 2.6
Firebird SQL 2.0, ISO/IEC 9075-1, 14
CALIBRATION WORKING STANDARDS
4.2.1.
CESIUM TEST SAMPLE
There is delivered a little yellow knob containing 9 kBq (0.25 µCi) of Cs-137 for
adjusting of the gain. Its activity is below a limit for radioactive materials adopted in the
EU. The standard does not belong to category of radioactive materials in any respect of
valid European jurisdiction.
4.2.2.
STEEL STANDARDS
The Steel calibration standards are made from steel artificially contaminated with
radionuclide Co-60 (Half life 1925 days). The activity of the standard was preciously
measured by independent method and linked to the standards of the Czech
certification authority. Basic set contains one standard with determined activity and one
void sample for background determination. The standards are labeled with code. Level
of activity is coded by letters (A – Z) followed with serial number. There is available a
spreadsheet „Actual activity calculation.xls“ on the installation CD. All activities can be
recalculated to any suitable date. The user can use the following table:
Actual activity calculation for STEEL samples
Type correct value for Actual date, correct values for activities will be automatically
generated.
Measured values must be between Minimal value and Maximal value
Actual activity
Sample
[Bq/gram]
A 701-5
60
Co
Reference date
1.1.2005
0.00
Actual date
10.2.2006
0.00
Standard deviation
[%]
Minimal value*
[Bq]
0.00
Maximal value*
[Bq]
0.02
* An average of ten measurements
N 701-5
M 701-5
L 701-5
K 701-5
60
60
60
60
7.82
6.76
1.6
6.65
6.87
4.29
3.71
1.8
3.64
3.77
1.85
1.60
3.9
1.54
1.66
0.48
0.41
5.0
0.39
0.44
Co
Co
Co
Co
To recalculate activity to new date a new actual date has to be entered and all
activities will be recomputed automatically.
Notice to Half life correction
Activity of any radioactive elements decreases in time. A new activity is computed
using a simple formula.
As an example we use a sample marked N with certified activity 7.82 Bq/g.
Time left between the reference date and a new actual date is 405 days.
Actual activity = (certified activity) x (2-(time left/half life)) = 7.82 x (2-(405/1925)) = 7.82 x
0.8643 = 6.76 Bq/g
36
RT-50 User Manual Edition 8
4.2.3.
SLAG AND DUST STANDARDS
Unlike steel calibration standards the slag / dust standards are made from milled
regular slag with reasonable low concentration of natural radioisotopes. Typical
concentrations are native activity 0.04 Bq/g 226Ra and 0.03 Bq/g 232Th. This raw
material was artificially contaminated with specified radionuclide. A well homogenized
compact mixture is mixed with the silicon rubber and poured in standard measuring
cans. The standard volume 100 cm3 and height 35 mm responds to 120 grams of
material. The standards are labeled with the major radioisotope name and code
TS11_nn where nn is the serial number of standard. For example TS11_53. All
activities of standards can be recalculated in the spreadsheet „activity.xls“. Next are
tables for recalculation of activities of Slag standards.
Actual activity calculation for DUST calibration samples
Type correct value for Actual date, correct values for activities will be automatically
generated.
Measured values must be between Minimal value and Maximal value
Actual activity
[Bq/gram]
TS11
SN: 51 - 55
Reference date
Actual date
Standard deviation
Minimal value*
1.1.2007
15.5.2007
[%]
[Bq]
241
60
137
29.40
6.88
6.56
3.5
6.33
16.00 15.05 15.46
15.87 15.05 15.46
2.5
12.0
2.6
15.47 13.25 15.06
8.10
6.78
16.26 16.85 15.86
8.34
Am
29.38
2.8
28.57
Maximal value*
[Bq]
30.19
* An average of ten measurements
Co
Cs
40
K
226
Ra
232
Th
8.10
3.0
7.86
To recalculate activity to new date a new actual date has to be entered and all
activities will be recomputed automatically.
4.2.4.
GEOPHYSICAL STANDARDS
The geophysical standards are made from rock with the high concentration of a
specific natural radioisotope. In case of Cs-137 there is used sand contaminated with
Cs-137 from the area of Chernobyl.
There are two different measuring cans used for volumes 100 cm3 and 250 cm3.
The effective height is then 35 mm respectively 40 mm and average weight 120 grams
and 400 grams. The basic set counts for standards K, U and Th. Name of standard is
coded where G marks Geo standard. Next is the volume, used major radionuclide and
3
serial number. For example G100-U 02 is the 100 cm uranium standard. All cans are
carefully sealed to ensure a proper balance of daughter products. Recalculation of
activities is also possible but for very long half times of natural radionuclide has no
practical sense. Tables are in „activity.xls“. The example follows:
RT-50 User Manual Edition 8 37
Actual activity calculation for ROCK samples
Type correct value for Actual date, correct values for activities will be automatically generated.
Etalon G100
Reference date
K40
1.7.2006
40
Cs137
Rel. SD [%]
Rel. SD [%]
K [%]
35.3
3.6
1
83.3
K [Bq/kg]
11 200
3.6
300
1
950
83.3
40
137
Cs [Bq/kg]
U
Th
Rel. SD [%]
1.5
Ue [ppm]
290
3
580
Ue [Bq/kg]
1.7
4
40.0
1.7
50
40.0
593
2
400
1.7
The [ppm]
The [Bq/kg]
Actual date
K40
20.9.2006
Rel. SD [%]
40
Cs137
35
3.6
1
83.3
K [Bq/kg]
11 200
3.6
300
1
940
83.3
137
Cs [Bq/kg]
U
Rel. SD [%]
K [%]
40
1.7
Th
Rel. SD [%]
Rel. SD [%]
1.5
Ue [ppm]
290
3
580
Ue [Bq/kg]
The [ppm]
The [Bq/kg]
4.3.
Rel. SD [%]
1.7
4
40.0
1.7
50
40.0
593
2
400
1.7
1.7
DATA FORMAT
All data is stored in the main database file Lab.fdb. Its structure is flexible and
reflects customer’s setup. The Lab.fdb is controlled by SQL server and can be simply
accessed or modified with any SQL browser. We recommend freeware program
FlameRobin.
The manufacturer’s selection of SQL database protocol is to give the customer
an indirect full access to the stored data and to allow integration (if required) of the RT50 Lab into the customer’s own database/network structures. Copying of the Lab.fdb to
different locations allows the user to simply backup the database and protect the data.
All questions regarding databases please forward to:
[email protected]
38
RT-50 User Manual Edition 8
4.4.
CORRECTION FILE FORMAT
The correction file could be used for any type of correction of the activity
evaluation. It is used in case that the geometry of the measured sample and calibration
samples are not exactly the same and the activity can be re-calculated according to the
known formula or table found from the experiment. The formula must be used for table
calculation to allow LabCenter SW only one correction format.
The file with correction table must be in the text only form.
The first row has only one number - ratio between the parameter of the
calibration sample and entered unit. For instance calibration sample for STEEL mass
activity measurement has the thickness 10 mm and the thickness is entered in mm so
the ratio is 10/1=0.1.
The second row starts: “Param:” followed by the name of nuclides for which the
corrections are calculated. The names must be typed in the same form as is used in
Setting - List of Nuclides. When this row is missing so the first correction is applied to
the all found nuclides.
The followed rows have some numbers separated by tabulator. The first number
is the value of the parameter used for correction (sample thickness) divided by this
value for the calibration sample (so the value for calibration sample is any time 1) while
the next numbers are a relative efficiency of the measurement in comparison to the
calibration sample (so the value for calibration sample is 1 again). The order of values
agrees with the order of the nuclides in the second row. The example of the thickness
correction file follows:
0.1
Param: Co-60 Am-241 Cs-137
0.3 0.7727 0.2966 0.6084
0.4 0.8042 0.3667 0.6461
0.5 0.8360 0.4359 0.6800
0.6 0.8680 0.5034 0.7122
0.7 0.9001 0.5688 0.7437
0.8 0.9325 0.6317 0.7749
0.9 0.9650 0.6918 0.8061
1
0.9977 0.7493 0.8375
1.1 1.0306 0.8041 0.8693
1.2 1.0637 0.8565 0.9013
1.3 1.0970 0.9065 0.9338
1.4 1.1305 0.9543 0.9667
1.5 1.1642 1.0000 1.0000
1.6 1.1981 1.0437 1.0338
1.7 1.2322 1.0857 1.0680
1.8 1.2664 1.1258 1.1027
1.9 1.3009 1.1644 1.1379
2
1.3355 1.2014 1.1736
2.1 1.3703 1.2370 1.2097
2.2 1.4054 1.2713 1.2462
2.3 1.4406 1.3043 1.2832
2.4 1.4760 1.3360 1.3206
2.5 1.5116 1.3666 1.3584
2.6 1.5474 1.3962 1.3966
2.7 1.5833 1.4247 1.4352
RT-50 User Manual Edition 8 39
2.8
2.9
3
3.1
3.2
3.3
3.4
3.5
3.6
3.7
3.8
3.9
4
4.1
4.2
4.3
4.4
4.5
4.6
4.7
4.8
4.9
5
5.1
5.2
5.3
5.4
5.5
5.6
5.7
5.8
5.9
6
40
1.6195
1.6559
1.6924
1.7292
1.7661
1.8032
1.8406
1.8781
1.9158
1.9537
1.9918
2.0300
2.0685
2.1072
2.1460
2.1851
2.2243
2.2637
2.3033
2.3431
2.3831
2.4233
2.4637
2.5043
2.5451
2.5860
2.6272
2.6685
2.7100
2.7518
2.7937
2.8358
2.8781
1.4522
1.4788
1.5046
1.5295
1.5536
1.5769
1.5995
1.6214
1.6427
1.6634
1.6834
1.7028
1.7218
1.7401
1.7580
1.7754
1.7923
1.8088
1.8248
1.8405
1.8557
1.8705
1.8850
1.8992
1.9129
1.9264
1.9395
1.9523
1.9649
1.9771
1.9891
2.0008
2.0122
RT-50 User Manual Edition 8
1.4743
1.5136
1.5534
1.5935
1.6339
1.6747
1.7157
1.7571
1.7988
1.8407
1.8829
1.9254
1.9681
2.0111
2.0543
2.0977
2.1413
2.1852
2.2292
2.2733
2.3177
2.3622
2.4069
2.4517
2.4967
2.5418
2.5870
2.6324
2.6778
2.7234
2.7691
2.8148
2.8607
5. Enhanced software options
The more programs are stored on the installation CD for enhanced use of
LabCenter SW. The installation SW itself is in the folder labcenter of the installation
CD. The next folders named develop, utility and video are there as well. The example
of software for external communication with database designated for software
engineers who supply the data transmission inside the internal net of the user is in the
folder develop. The user instructions are there too. The folder utility contents
installation files of useful freeware and folder video contents the file with guide for
mechanical completion of the RT-50 spectrometer.
5.1. USEFUL FREEWARE
The folder utility contents 5 installation files of freeware useful for LabCenter
use. Those are:
5.1.1.
ACROBAT READER
The mostly spread freeware for displaying the files in PDF format. It is important
for instance for reading the User manual in PC. It is available after the LabCenter
installation from the Start menu by selection Programs - Georadis LabCenter - Docs
- Manual Lang, where Lang means the shortcut of the manual language.
The newest version or different language versions are available on:
http://www.adobe.com/products/acrobat/readstep2.html.
5.1.2.
DECAY
Decay is software including the overview of nuclides and their properties.
Interested in extension of list of nuclides in methods the user can get all the needed
info in this database. The calibration sample with known activity of this nuclide and
selected geometry is necessary for its measurement.
The software is available on: http://132.234.129.50/Downloads/RadDec.html.
5.1.3.
FLAME ROBIN
Flame Robin is software for operation of SQL database. It is useful for software
engineers that want to get the detail info about the LabCenter database to include them
to the company info system.
The software is available on:
http://sourceforge.net/project/showfiles.php?group_id=124340
5.1.4.
PDFCREATOR
PDF Creator is software that allows the export of any file to PDF format. The new
printer PDF Creator appears in the computer after its installation. The document is
exported to PDF via printing it by this printer. The file name and folder should be
selected during this operation.
That is useful on the computers without printer for storage of the copies of
various files like Protocols about the measurement and similar ones.
The software is available on: http://sourceforge.net/projects/pdfcreator/.
RT-50 User Manual Edition 8 41
5.1.5.
POEDIT
PO Edit is software for creation of the software translation. The LabCenter has
the subfolder locale with subfolders of various languages according to the Windows
habits. Each of them contents file labcenter.po that can be simply translated using
POEdit freeware. The new file labcenter.mo is automatically generated after saving of
the translation. This file starts to be active after the selection Setting – Other setting –
Language and LabCenter restart. All software messages and reports are taken from
this file. The detail manual is stored in English text file in the folder POEdit on CD due
to the translation is provided from the basic language of the software – English.
5.2.
SOFTWARE FOR EXTERNAL COMMUNICATION WITH THE
DATABASE
The folder develop contents the LabCenterInt.zip file with the examle of
software for external communication with SQL database labcenter in subfolder src.
The source code in C++ is in the same folder. The SW description with possibilities of
use is in subfolder doc.
The SW is designated for software engineers who supply the data transmission
inside the internal net of the user.
5.3.
MECHANICAL COMPLETATION OF SPECTROMETER RT-50
The video folder contents the instruction film how to complete RT-50 together.
The file has Windows Meta Video (WMV) format that can be run on the computer with
basic Windows installation. No special SW is necessary for viewing it.
The video film is made out for the users which do not order the installation and
training due to any reasons.
42
RT-50 User Manual Edition 8