1
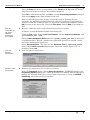
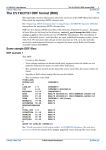
INTREPID User Manual
Library | Help | Top
Radiometrics processing (C07b)
1
| Back |
Top
Radiometrics processing (C07b)
This cookbook demonstrates the stages in processing radiometric data.
Overview
In the exercises you
1
Ensure that your copy of INTREPID is registered, and install the Cookbook data
from the INTREPID install CDROM.
2
View the grid datasets provided, showing the original data and the results of the
radiometrics processing.
3
Use the Multi-Channel Processing tool to compute NASVD spectral smoothing on
the raw 256 spectra data
4
Use the Multi-Channel Processing tool to perform remaining full spectra
corrections and extract standard K,U,Th and Total Count windows.
5
Use the Standard3 tool to compute Compton stripping, height corrections and
radio-element conversions on K,U,Th and Total Count fields.
6
Grid the processed radiometric fields.
7
Use the Uranium levelling tool to remove any residual radon levelling problems
from the Uranium field
8
Microlevel, etc
Preliminary notes
We assume that you understand:
•
How to use a suitable visualisation tool for examining grids (For this worked
example we recommend the INTREPID Flight Path Editor, the INTREPID
Visualisation tool or ERMapper. For instructions on using both of the INTREPID
tools, see Flight Path Editor (T19).
•
If necessary for your choice of optional steps, how to use the INTREPID Gridding
tool. For instructions, see Gridding (T22a).
Solution datasets and optional steps
For each stage of this worked example we have provided solution datasets or fields
that you can use as input for the next stage if you do not wish to carry out this stage
of the example.
Location of sample data for Cookbooks
Where install_path is the path of your INTREPID installation, the project
directory for the Cookbooks sample data is
install_path\sample_data\cookbooks.
For example, if INTREPID is installed in
C:\Program Files\Intrepid\Intrepid4.5,
then you can find the sample data at
C:\Program Files\Intrepid\Intrepid4.5\sample_data\cookbooks
For information about installing or reinstalling the sample data, see "Sample data for
the INTREPID Cookbooks" in Using INTREPID Cookbooks (R19).
For a description of INTREPID datasets, see Introduction to the INTREPID database
(G20). For more detail, see INTREPID database, file and data structures (R05).
Library | Help | Top
© 2012 Intrepid Geophysics
| Back |
INTREPID User Manual
Library | Help | Top
Radiometrics processing (C07b)
2
| Back |
Location of dataset files
In this worked example we assume that the example datasets reside in directory
install_path\sample_data\cookbooks\radiometrics\buffalo.
If the sample data is not present
If the sample data is not present as described above and we have not supplied you
with a CD-ROM, you need to download it from our website. Go to http://
www.intrepid-geophysics.com then to Downloads. Log in, creating an account if
necessary and go to Data. The dataset is available in that page. Download it and
unzip it into the folder described above.
System requirements
To process the Radiometrics worked example you need about 45 Mb hard disk space.
If you wish to save your own new NASVD or MNF-smoothed spectrum, you need an
additional 25 Mb.
Steps to follow
Registering your copy of INTREPID
Ensure that
your INTREPID
installation is
licensed
You must have at least an evaluation licence to run the radiometrics worked
examples. Contact Intrepid Geophysics or one of our agents if you require an
evaluation license.
Copy the radiometrics sample data from the supplied CDROM
If we supplied you with a CD-ROM, copy the radiometrics sample data to
install_path\sample_data\cookbooks\radiometrics\buffalo. For more
information, see Preliminary notes.
The data includes
•
The survey line dataset buffalo_sub..DIR with raw data and supplied solution
fields,
•
Solution grid datasets.
Introduction
The data you process in this cookbook was acquired over the 1:100,000 Buffalo map
sheet, as part of the Victorian Initiative for Minerals and Petroleum (VIMP). The
data custodians are Geoscience Victoria, Department of Primary Industries,
Melbourne, Australia. The data is freely available through the Geoscience Australia
GADDS (Geophysical Archive Data Delivery System).
This data was acquired by a Bell helicopter equipped with an Exploranium GR820
256 channel spectrometer. These instruments utilise real-time automatic gain
stabilisation based on tracking of the Thorium peak to control the tendency of the
spectrometer to drift. The gamma ray detector had a total crystal volume of 16.8
litres. The sampling interval for the radiometric data was 1.0 second (approx 45
metres sample spacing). The survey line spacing was 200 metres and the flight lines
were flown in an E-W direction. The mean survey flying height was 80 metres.
Library | Help | Top
© 2012 Intrepid Geophysics
| Back |
INTREPID User Manual
Library | Help | Top
Radiometrics processing (C07b)
3
| Back |
View the grid datasets provided
View the
‘supplied grids
View the three supplied grids kroi, uroi, troi, of the window data supplied. For
ease of viewing the three grids simultaneously, we suggest that you use the
INTREPID Flight Path Editor, the INTREPID Visualisation tool or ERMapper.
These grids show the standard radiometric windows, extracted from the
International Atomic Energy Agency (IAEA) defined regions of interest (K,U,Th) in
the raw 256 channel spectrum data. They represent the data at a completely
unprocessed stage.
Using the visualisation tool, the Load Ternary Grid option is a good way of viewing
the 3 bands of radiometric data. Chosose K as the red colour, Th as the green colour,
and U as the blue colour. This create a standard RGB 3 channel display.
At this early stage of processing, the count rate representing each K,U,Th window is
significantly affected by counts from the adjacent windows. The data is also
contaminated by background radiation contributions from the aircraft, cosmic rays,
and the presence of Radon gas escaping from the ground. You can see the effect of
Radon most clearly in the U grid.
The count rate is also affected by the ground clearance of the detector, as well as the
volume of the detector.
In order to reduce the data to a more meaningful state, such that we can draw valid
conclusions as well as make sensible comparisons with other surveys, we need to
carry out a series of corrections to the raw data. Central to applying these corrections
are a series of calibrations which are carried out separately before, during, and after
the survey. The calibration data must be prepared, and the results of these
calibrations are stored in a special file which INTREPID uses during the processing
of the 256 channel data. Accurate radiometric data processing is impossible
without properly collected calibration data.
In INTREPID, the preparation of calibration data is done using the Calibration
spectra processing tool, prior to any radiometric data processing.
In INTREPID, radiometric data processing is done using the following tools:
Library | Help | Top
•
Multichannel Processing for 256 channel data corrections
•
Standard3 Corrections for corrections to extracted window data
•
Uranium Leveling for removal of residual Radon problems
•
Maximum Noise Fraction for an alternative spectral smoothing method to
NASVD
© 2012 Intrepid Geophysics
| Back |
INTREPID User Manual
Library | Help | Top
Radiometrics processing (C07b)
4
| Back |
The Multichannel Processing Tool
In this section you learn how to apply the following corrections to 256 channel
radiometric data
•
Noise Adjusted Singular Value Decomposition (NASVD) spectral smoothing
•
Livetime corrections
•
Aircraft background and cosmic radiation corrections
•
Radon corrections
•
Extraction of IAEA standard Total Count and K,U,Th photopeaks from the 256
channel spectra data
All steps can be run in one single operation. However in practise, the NASVD
smoothing takes much longer to run than the other steps, so with a large dataset it is
more practical to run the Multi-Channel Processing tool in two stages.
•
NASVD spectral noise reduction (smoothing)
•
The remainder of the multi-channel processing and corrections.
In this tutorial we do the processing in two stages.
Run NASVD
spectral
smoothing
1
Run NASVD spectral smoothing.
This is the first step in the radiometrics data processing sequence. In this
example we shall use the NASVD method to smooth the raw 256 channel spectra
data. Note that both NASVD and MNF smoothing methods support line or flight
based processing, and also spectra stacking, a method which boosts the Signal/
Noise ratio.
Launch the Multi-Channel Processing tool. From the File menu, choose Load Line
Dataset. Choose Select Line Dataset, and open buffalo_sub..DIR.
Select Calibration Data - leave the calibration file as dfa_default.asc. The
NASVD process does not require any special calibration data.
Select Spectrum Field - ensure that the Spectrum Field is set to spectrum (this is
the raw spectrum). Leave the sample interval as 1.0 seconds. Choose OK.
From the Processes menu, select Corrections. The Processing Options dialog
box appears. Selected check boxes which are checked indicate that those options
included in the processing.
Check the Selected check box corresponding to NASVD smoothing, and choose
NASVD smoothing. The dialog box allows you to specify the number of principal
components which the NASVD process uses to reconstruct the spectra. For this
exercise, we save the default of 8 components. Choose OK.
The following further options are available:
•
Boost Signal/Noise ratio by Adjacent Spectra addition
•
Save Spectralal Components and Amplitudes
The Selected check box for ‘Channels to be saved’ is already checked. Click on the
coresponding button. The Channels to be saved dialog box appears. From Field
Selector, choose the top Select button corresponding to Spectral data. The Select
Spectrum Field dialog box appears. At Enter New Field Name, type
spectrum_nasvd and choose OK. Check the Save box to the left of the Select
button. This saves the noise cleaned spectrum as a new output file in the dataset.
Library | Help | Top
© 2012 Intrepid Geophysics
| Back |
INTREPID User Manual
Library | Help | Top
Radiometrics processing (C07b)
5
| Back |
Clear the Save check box corresponding to the Totcnt, K, U, Th windows. At this
stage there is no need to extract the standard windows.
Press OK to exit the dialog box, and OK to exit the Processing Options dialog box.
Now select Apply in the main window of the tool.
Run the
remainder of
the multichannel
processing
corrections
2
After a pause the processing begins, and graphs appear showing the raw
spectrum, the NASVD smoothed spectrum, and the 8 principal components for
each processed line. When all lines are processed a message box appears. Choose
OK to return to the main tool. From the File menu, Choose Quit to exit from the
tool.
Run the remainder of the multi-channel processing corrections.
As before, launch the Multi-Channel Processing tool.
From the File menu, choose Load Line Dataset. Choose Select Line Dataset, and
open buffalo_sub..DIR.
Choose Select Calibration Data and select cosmic_radon_jwf.asc from the list
of calibration files. This file contains the calibration spectra for aircraft, cosmic
and radon background signatures.
View the
dataset
parameters
3
Select Spectrum Field - this time set the Spectrum Field to spectrum_nasvd
(this is the NASVD smoothed spectrum). Leave the sample interval as 1.0
seconds. Choose OK.
View the dataset parameters
Examine other
parameters
4
Examine the parameters for the other corrections.
Library | Help | Top
From the Processes menu, choose Select Corrections. INTREPID displasy the
Processing Options dialog box. Check boxes that are checked indicate that those
options are included in the processing. Check all processes, except for NASVD
smoothing, which has already been done.
© 2012 Intrepid Geophysics
| Back |
INTREPID User Manual
Library | Help | Top
Radiometrics processing (C07b)
6
| Back |
We now go through the parameters for each step in detail. To view the parameters
for each process, click on the appropriate process button.
•
Livetime/Deadtime Normalisation.
In this survey the spectrometer was a GR820, which records the Live time as a
data field. Choose the Use Measured Live Time option, and choose Select Live
Time. From the dialog box with the list of fields, select ltime and choose OK.
•
Energy Calibration.
The Energy Calibration process needs to know where in the spectrum the
main K,U,Th peaks are located. The Energy Calibration parameters supply
this information, in terms of the spectrum channels. Normally you would
derive these values from the spectrum data by using the View spectrum
function on the main tool interface. However for this example we just use the
default values, which should suffice. Energy calibration by line is
recommended.
•
Cosmic and Aircraft Background Removal
With 256-channel processing, the background corrections can be done as full
spectrum corrections. Single window coefficients are replaced by spectra,
which have a unique value for each channel in the spectrum. These spectra are
stored in the calibration file. Consequently the background corrections can be
performed more accurately than is possible using windowed data.
In the Cosmic + Aircraft Background Removal dialog box, check Remove
Cosmic Background, and click the corresponding button. From the dialog box,
select cosmic and choose OK. Check the Remove Aircraft Background check
box and choose OK.
•
Radon Background Removal
INTREPID uses the spectral ratioing method described by Minty (1992) to
remove radon from the 256 channel spectra data. It examines the ratio of
counts in the 0.609 MeV Radon window to the Bi214 (U) window to estimate
the amount of Radon contamination.The process requires a 256 channel pure
Radon spectrum in the calibration file.
The constants C1 and C2 and the integration period control the extent of
radon removal from the data. C3 and C4 are normally set to zero.
Increasing C1 estimates that the contribution from Radon to the Radon
window is larger, so removes a higher proportion of counts. Decreasing C2
estimates that there is a smaller Compton scattering contribution from
Uranium in the Radon window.
The Compton stripping ratios alpha, beta and gamma and terrain clearance
parameters are used to remove K, U, Th contributions from the raw Radon
count rate.
NOTE: This process does NOT perform Compton stripping, even though
the stripping ratios are required.
Initially we use the default values for C1 and C2. Set the values for C3 and C4
to zero. Initially we leave the integration period at 400 samples. Set the
stripping ratios Alpha, Beta, Gamma to 0.2395, 0.3940, 0.6443. This process
also requires the survey terrain clearance. Make sure the reference terrain
clearance is set to 80m, which was the nominal survey height. Click on the
Select Terrain Clearance button, and from the dialog box, select
effective_ht_ml and choose OK. Choose OK to dismiss the Radon
Background Removal dialog box.
Library | Help | Top
© 2012 Intrepid Geophysics
| Back |
INTREPID User Manual
Library | Help | Top
Radiometrics processing (C07b)
7
| Back |
•
Specify output
fields for
windowed data
Run the task
and view its
progress
5
Channels to be saved
Under Field Selector heading, use the Select buttons to display dialog boxes
for selecting fields and specify output windowed data fields. If you do not
want to overwrite the existing fields, add _1 to the field names
totnasvd256_1, knasvd256_1, unasvd256_1, thnasvd256_1. Choose
OK
Choose OK, then choose OK to dismiss the Processing Options dialog box.
Run the task as specified. Watch the progress of the task in the graphs that
INTREPID displays.
Choose Apply in the main window. INTREPID displays six spectra profiles
corresponding to the stages of the process, as shown in the diagram below. It
displays the data for the line just processed, refreshing the display for each line.
Stage 4
Stage 5
Stage 6
The aircraft
background-removed
spectrum
The cosmic backgroundremoved spectrum
The radon backgroundremoved spectrum
The display includes the
IAEA standard windows.
The display includes the
IAEA standard windows.
Stage 1
Stage 2
Stage 3
The raw spectrum
The normalised
spectrum, corrected for
livetime / dead time
The energy calibrated
spectrum, stretched or
contracted so that the
peaks corresponding to
the IAEA standard
windows have standard
channel numbers. From
this stage INTREPID
displays the IAEA
standard windows K, U,
Th.
The display includes
the IAEA standard
windows.
Library | Help | Top
© 2012 Intrepid Geophysics
| Back |
INTREPID User Manual
Library | Help | Top
Radiometrics processing (C07b)
8
| Back |
Here is an illustration of the profile windows as they appear on the screen.
Tip: Watching for errors: If the energy calibration process (stage 3) is going
wrong, the red area surrounding a peak appears markedly asymmetric, perhaps
excluding the peak itself. This is the most common cause of failure. If the aircraft
or cosmic background processes (stages 4 and 5) are going wrong, the profile drops
significantly. Under normal circumstances, the change in these stages should be
imperceptible in the profile display. If the Radon background process (stage 6) is
going wrong, the Uranium peak (channel 149) disappears. The main change you
see when the process is going correctly is fluctuations in the Radon (lower
Uranium) window (channel 51) when compared with the stage 5 profile. If an
error appears, note the line number at which it occurs. You can then view the log
file for the line and review the parameters for the process.
Tip: Log file: The Multi-Channel Processing tool can generate a comprehensive
log as it proceeds. This log contains vital information for checking the results,
troubleshooting and obtaining technical support. The Windows version of
INTREPID appends this log to its log file nt.<user>.log.
Return to the main tool interface, but leave the Multi-Channel Processing tool
open.
Library | Help | Top
© 2012 Intrepid Geophysics
| Back |
INTREPID User Manual
Library | Help | Top
Radiometrics processing (C07b)
9
| Back |
Grid the corrected data fields
Using the INTREPID Gridding tool, grid the totnasvd256_1, knasvd256_1,
unasvd256_1, thnasvd256_1 fields.
Using the visualisation tool, view the grids you have created. The Load Ternary Grid
option is a good way of viewing the 3 bands of radiometric data. Select K as the red
colour, Th as the green colour, and U as the blue colour. This creates a standard RGB
3 channel display.
What can you say about the Uranium grid? Has all of the Radon contamination been
removed?
It is clear from this example that not all of the radon has been removed from the
Uranium signal. For most surveys flown over relatively flat terrain Radon
contamination is generally fairly constant down a flight line, however this dataset
was collected over a series of hills and valleys, resulting in an uneven radon
distribution down the flight lines. You can see, from examining the RGB display, that
the Radon has collected in localised pockets in the valleys under the flight lines.
In the next example we re-apply all the corrections (except for NASVD), using
different parameters for the Radon correction.
Return to the main menu of the tool and from Processes, select Corrections.
•
Radon Background Removal
An integration period for the radon removal must be used because of the low count
rate in the Radon window. Decreasing the integration time results in more
localised radon removal but the downside is that a smaller integration time also
introduces more noise into the corrected data.
This time change the integration time to 50 seconds. Leave all other parameters
the same. Choose OK to dismiss the Radon Background Removal dialog box.
Choose OK to dismiss the Processing Options dialog box. Choose Apply in the
main window.
Grid the corrected data fields
Using the INTREPID Gridding tool, grid the totnasvd256_1, knasvd256_1,
unasvd256_1, thnasvd256_1 fields. Compare the grids to the previous grids.
Library | Help | Top
© 2012 Intrepid Geophysics
| Back |
INTREPID User Manual
Library | Help | Top
Radiometrics processing (C07b)
10
| Back |
The standard 3 processing tool
In this section you learn how to apply the following corrections to the standard
gamma-ray spectrometer fields K, U, Th and Total Count.
Dataset
selection
parameters
1
•
Stripping correction for Compton scattering
•
Normalise measurements to a standard distance above the ground (Height
attenuation)
• Conversion of count rates in the air to element concentrations on the ground
Dataset Selection parameters
Launch the Standard 3 gamma ray adjustment tool. From the File menu, choose
Load Line Dataset. The Select Line dataset dialog box appears.
Choose Select Line Dataset and open buffalo_sub..DIR. Next choose Select
TotalCount Field and select the field totnasvd256_1 from the list of field names.
Similarly for Potassium, Uranium, Thorium, select the fields knasvd256_1,
unasvd256_1, thnasvd256_1. fields.
If you have previously completed the 256 multichannel processing exercise, fields
for Cosmic, Livetime and Clearance should already be assigned. If not make sure
that you assign them. Leave the Sample interval at 1.0 seconds.
From the File menu, choose Save Output Fields. Specify output data fields
totcps_1, kpcent_1, uppm_1, thppm_1, if you do not want to overwrite the
existing fields.
2
Run Compton stripping.
From the Processes menu, choose Compton Stripping. For the Value at ground,
replace the default Alpha, Beta, Gamma stripping ratios with 0.2395, 0.3940,
0.6443. Leave the reverse ratios and height attenuation factors as defaults.
Choose OK.
3
Height attenuation.
From the Processes menu, choose Height Attenuation. Replace the default Total
Count, Potassium, Uranium, Thorium coefficients with 0.006958, 0.008911,
0.006510, 0.006878. Choose OK.
4
Terrain clearance limits
From the Processes menu, choose Terrain Clearance Limits. These are the valid
height ranges and the nominal survey altitude for the height correction. Enter a
minimum value of 10m, maximum value of 110m, and a nominal value of 80m.
Choose OK.
5
Conversion to Ground Concentrations
From the Processes menu, choose Conversion to Ground Concentrations. These
sensitivity coefficients are used to convert counts per second to ground
concentrations.
For this exercise we convert K, U, Th, but leave Total Count as counts per second.
Leave the value for Total Count as the default of 1.0.
Replace the Potassium, Uranium, Thorium coefficients with 54.48, 6.21, 3.14.
Choose OK.
6
Apply the process
Choose Apply in the main window to run the selected processes.
Library | Help | Top
© 2012 Intrepid Geophysics
| Back |
INTREPID User Manual
Library | Help | Top
7
Radiometrics processing (C07b)
11
| Back |
Grid the fields
Using the INTREPID Gridding tool, grid the totcps_1, kpcent_1, uppm_1,
thppm_1 fields. Compare the grids to the previous grids.
Uranium levelling
In this section you learn how to use the Potassium and Thorium fields to remove any
residual radon artifacts in the Uranium data. The method is based on the assumption
that, for background corrected data, the U flight-line means are a linear function of
the K and Th flight-line means.
1
Dataset Selection parameters
Launch the Uranium Levelling tool. From the File menu, choose Load Input data
> Open Input Potassium. Select buffalo_sub..DIR, and then select the
kpcent_1 field in the Select Input Potassium Field dialog box.
In the Select Input Uranium Field dialog box, select uppm_1.
In the Select Input Thorium Field dialog box, select thppm_1.
From the File menu, choose Save Output Data. In the Select Output Uranum Field
dialog box, type uppm_1_ulev. Choose OK.
2
Apply the process
To apply the process press Apply in the main window. A message box appears
containing a log summary of the mean line values for the input fields and the
corrections applied to the output field.
Using the INTREPID Gridding tool, grid the uppm_1_lev field. As before, use the
Visualisation tool to examine the grid.
Try adjusting
parameters
Further exploration
If you have completed the main exercise and have some spare time, try adjusting the
following parameters and examine any differences in the results.
The following table suggests some adjustments you can make.
Parameter
Change
Implication and Effects
C1
Decrease
Estimates that the contribution from Radon to the Radon window is
larger, so removes a higher proportion of counts.
C2
Decrease
Estimates that there is a smaller Compton scattering contribution
from Uranium in the Radon window.
Integration time
(bunch size)
Decrease
Uses shorter line segments to calculate the Radon contribution. If
you make it too small, you degrade the data.
See Minty (1997) for a description of the derivation of C1, C2, C3 and C4
You can also save the Radon peak as a dataset field by selecting it in the Channels to
be saved dialog box. Gridding and inspecting this field may give you a clearer picture
of where Radon is affecting the survey data.
Library | Help | Top
© 2012 Intrepid Geophysics
| Back |
INTREPID User Manual
Library | Help | Top
Radiometrics processing (C07b)
12
| Back |
View individual spectra
If you are processing 256-channel data, it can sometimes be useful to view the raw
spectra. We shall do this using the supplied data.
1
Launch the Multi-Channel Processing Tool.
2
From the File menu, choose Load Line Dataset.
3
In the Please select the line dataset dialog box:
•
Choose Select Line Dataset, and open buffalo_sub..DIR.
•
Leave the calibration file as the default.
•
Choose Select Spectrum Field, and select spectrum.
•
Choose OK.
4
In the main window, choose View. INTREPID displays the Choose line number
for testing dialog box.
5
Select any line from the list and choose OK. INTREPID sums all the individual
spectra for the current line and displays them as a single spectrum plot. Choose
Next or Previous to navigate to different lines.
Determine channel positions of IAEA peaks
The Energy Calibration process requires high and low channel bounds for the main
photo peaks. These must be determined accurately from the data, otherwise the
process may fail to find the main peaks.
In the Multi-Channel Processing tool, point to the spectrum plot. Values for x and y
appear on the graph. The x value is the spectrometer channel number corresponding
to the cursor position. When you are finished, choose Cancel. From the File menu,
choose Quit.
Performing NASVD or MNF smoothing
You may wish to perform NASVD or MNF smoothing before the multi-channel
corrections. On a large dataset the spectral smoothing could take several hours.
Both NASVD and MNF processes are straightforward, so we have omitted detailed
steps.
If you process by flight instead of by line, it ensures that INTREPID uses a higher
number of samples to gather statistics and aid the signal de-noising process. This is
most beneficial for Uranium estimates.
You may be able to further enhance results by combining local spectra to ‘boost’ the
signal/noise statistics. There is an option to do this in INTREPID.
Overview - NASVD smoothing
1
Run Multi-Channel Processing and input the spectrum to be smoothed.
2
Select only NASVD Smoothing and Channels to be Saved.
3
Accept the default 8 principal components for the NASVD process unless you have
a strong reason for doing otherwise.
4
Save the spectrum as an output file.
If you save the windowed data, you can grid it and check the results of the NASVD
processing.
Library | Help | Top
© 2012 Intrepid Geophysics
| Back |
INTREPID User Manual
Library | Help | Top
Radiometrics processing (C07b)
13
| Back |
Overview - MNF smoothing
1
In the Project Manager, from the Radiometrics menu, launch the Maximum
Noise Fraction tool and open the dataset.
2
Specify the spectrum to be smoothed.
3
Specify whether you want INTREPID to perform the integration, or stacking, of
the individual spectra on a line-by-line or a flight-by-flight basis before PC
analysis.
4
Specify the name of the output smoothed spectrum.
5
Select the Advanced tab.
6
Specify the number of principal components for the MNF process. Accept the
defaults for First and Last Good Channel.
What is in the radiometrics sample data cookbook?
The radiometrics cookbook contains the following datasets
The radiometrics line dataset buffalo_sub..DIR
This radiometrics dataset is a subset of a larger dataset that was originally flown
over the 1:100,000 Buffalo map sheet in the Eastern Highlands of Victoria, Australia.
The test dataset is a helicopter survey with specifications:
•
200 metre line spacing
•
80 metre terrain clearance
•
GR820 spectrometer with 16.8 litres of crystal detector
•
1 second sample rate
•
40 metres/second aircraft speed
•
Real time Differential GPS navigation
The buffalo_sub..DIR dataset contains the following fields
Field
Dimension
Description
fid
Scalar
Fiducial
flight
Scalar
Flight number
line
Scalar
Line number
linetype
Scalar
Line type
easting
Scalar
East-West location
northing
Scalar
North-South location
radalt
Scalar
Terrain clearance
temp
Scalar
Temperature
effective_ht_ml
Scalar
Terrain clearance corrected for temperature and pressure (also
called STP height)
dtmfinal_ml
Scalar
Digital terrain model (microlevelled)
spectrum
256 band
Raw 256 channel spectra recorded by the spectrometer in real
time
Library | Help | Top
© 2012 Intrepid Geophysics
| Back |
INTREPID User Manual
Library | Help | Top
Radiometrics processing (C07b)
14
| Back |
Field
Dimension
Description
spectrum_nasvd
256 band
256 channel spectra after NASVD smoothing (deleted)
ltime
Scalar
Live time recorded by the spectrometer in real time
cosmic
Scalar
Cosmic count (total counts > 3 MeV) recorded by the
spectrometer in real time
totroi
Scalar
Raw Total Count (0.4–3.0MeV) recorded by the spectrometer in
real time and summed
kroi
Scalar
Raw data recorded by the spectrometer in real time and summed
for K window
uroi
Scalar
Raw data recorded by the spectrometer in real time and summed
for U window
troi
Scalar
Raw data recorded by the spectrometer in real time and summed
for Th window
totcps
Scalar
Final processed Total Count data
kpcent
Scalar
Final processed Potassium data
uppm
Scalar
Final processed Uranium data
thppm
Scalar
Final processed Thorium data
totnasvd256
Scalar
Total Count data after NASVD correction, multi-channel
processing and then rewindowing
knasvd256
Scalar
Potassium data after NASVD correction, multi-channel
processing and then rewindowing
unasvd256
Scalar
Uranium data after NASVD correction, multi-channel processing
and then rewindowing
thnasvd256
Scalar
Thorium data after NASVD correction, multi-channel processing
and then rewindowing
Spectra Calibration file
A spectra calibration file, cosmic_radon_jwf.asc contains the aircraft background,
cosmic background and Radon calibration spectra for the data. This file exists in the
directory install_path/config/calibration_spectra.
References
See "References" in Multi-channel gamma ray spectrometric processing (C07)
Library | Help | Top
© 2012 Intrepid Geophysics
| Back |