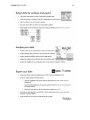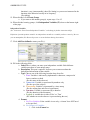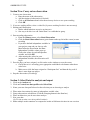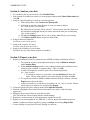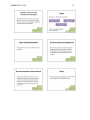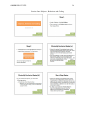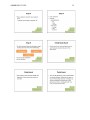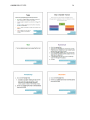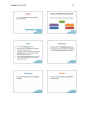
1
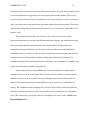
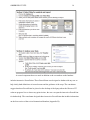
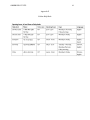
OBSERVER XT UTS
1
Noldus Observer XT: Usability Testing System
Britney Myers and Nehali Shah
James Madison University
Performance Analysis and Needs Assessment
Dr. Jane Thall
April 23, 2012
OBSERVER XT UTS
2
Index
A. Abstract
p. 3
B.
Organizational Background
p. 3
C.
What is actually happening?
p. 5
D. What should be happening?
p. 6
E.
Performance Gap
p. 7
F.
Data Collection Process
p. 7
G. Gap Analysis and Justifications
p. 10
H. Recommendations
p. 11
I.
Conclusion
p. 16
I.
Appendix
p. 18
OBSERVER XT UTS
3
Abstract
Usability testing and behavioral research are being considered as necessary topics to
cover in a future class, called Human Factors, at James Madison University. It is important for
future Human Resource Development professionals to understand human behavior in the form of
emotions, facial expressions, and actions. The client had planned to use the Noldus Observer XT
as a means to instruct students on usability testing and behavioral research. However, the Noldus
Observer XT software is difficult to understand for novice users. The consultants were called in
to develop a thorough instructional guide for conducting research with the software. Data was
collected, regarding a previously created instructional guide, through interviews with the client
and through the consultants following the guide to create an observation with the Noldus
Observer XT system. Based on the data, the consultants deemed the original instructional guide
to be inadequate. Therefore, the consultants created a more specific instructional guide for
creating and carrying out observations on the Observer XT system, pulling information from
Subject Matter Experts (SME), tutorials on the Noldus Observer XT website, and following the
manual that accompanies the software. In addition to a new instructional hand out, the
consultants created interactive PowerPoints that will help researchers understand key vocabulary
and procedures in the system. The new instructional guide and the PowerPoints will help aide
students and faculty in the Human Factors course or other classes in the College of Education at
James Madison University, conduct valuable research.
Organizational Background
The consultants for this project, Nehali Shah and Britney Myers, were presented with a
client that works within the College of Education at James Madison University. The client, Dr.
Michelle Estes, presented a problem with the Noldus Observer XT system that is hoped to be
OBSERVER XT UTS
4
used in future courses in the Human Resource Development program as well as other programs
at JMU.
The Noldus Observer XT system was bought by the College of Education in 2009 to
conduct usability testing of software applications. The Observer XT software has only been used
once since it was purchased. A graduate student in the Adult Education/Human Resource
Development Master’s program used the program for a reading and research project during the
2009-2010 school year.
The Observer XT is an advanced event-logging software that can be used by researchers
attempting to present observational data. The software was launched in 1990, and over the years
has evolved to allow researchers to incorporate video recordings of their participants, code and
describe the observed behaviors in a quantitative manner, and share their coding schemes with
other researchers. The Observer XT software can be used in a variety of fields of study including
child-parent interactions, classroom observation, market and consumer research, psychiatric
research, behavioral assessment, user experience research, usability testing and human factors
research (Ouwerkerk, n.d.).
Originally, two complications were posed regarding the ease of the use of the Observer
XT software. The first was the set up of the software, including the computer, video cameras,
microphones, etc. Since this specific system is portable, it took the graduate student more time to
use the system because he had to set everything up before he could begin the actual
project/observation. Eventually, a permanent home was found to house the software so that setup
was not required for every user wanting to use the program. The Observer XT software is now
set up on the third floor in Memorial Hall. This is a secured room in which both a key and
passcode are required to unlock and enter the room.
OBSERVER XT UTS
5
The second complication is what this project is addressing. After the setup complication
was solved, there still existed the problem of learning how to actually set up a project and carry
out an observation, in order to gather data and analyze results. The program and its options are
very detailed and require a basic understanding of research, specifically behavioral research
language. The rest of this document will cover the details in the complications of the use of the
software as well as recommendations for the future use of the Observer XT software.
The software was originally bought in hopes of having a system for both students and
professors to use for either behavioral research or usability testing of the application of software.
Although the software can be very useful, both in research and other class activities, there
seemed to exist a problem with the software’s ease of usability. The client, Dr. Estes, told the
consultants that there is an existing instructional handout, however, it does not seem to be
efficient in directing new users on how to use the actual system. Dr. Estes was looking for some
type of further instruction where new users can come in and be able to use the system fairly
easily without having to reference the actual Observer XT manual. She stated that any kind of
help as far as enhancing the support provided for using the software would be very beneficial to
her as well as the future HRD Undergraduate Program that is currently being developed.
What is actually happening?
The Noldus Observer XT software currently lives in an observation room in Memorial
Hall at James Madison University. It was originally purchased several years ago in hopes of
being used by students in their research projects. Only one student has used the software since it
was purchased in 2009. This number is much less than the amount that was expected by JMU
and the professors who intended for students to use it.
OBSERVER XT UTS
6
A big factor that plays into the lack of use of the system is in using it. Last year, two
graduate students from the Adult Education and Human Resource Development graduate
program, set up the Noldus system in the room it is currently located in. This relieved the
problem of having to set up the system each and every time it was to be used. Although the
system was set-up in a permanent place, no other students or faculty have used it.
What should be happening?
Now that the software is housed in a constant and secured environment, it should be used
much more than it currently is. The ideal situation the client is looking for is for anyone,
including new users, to be able to approach the Observer XT program, use it, and then analyze
results gathered from the software as easily as possible. Students and faculty should not be
discouraged and/or confused while trying to use the system due to the lack of resources and help
available. Rather, they should feel comfortable with the directions they are being given, in
whatever format that may be.
With that said, it is not expected for someone with no research background to completely
understand all of the terms and applications of the system immediately. Therefore, the system
will ideally be used after some instruction and/or background is given about the purpose and uses
that the software provides. The consultants decided that any instructional guide presented with
the software, be user friendly, while incorporating necessary information regarding research.
This means that the guide not only needs to be easy to follow, but should also provide enough
background information about research in general, and should clarify any research jargon that
must be known in order to use the software for a project.
OBSERVER XT UTS
7
Performance Gap
The original document was a two-page instructional handout of steps to guide the
researcher on how to use the Observer XT software (Appendix A). The handout was broken into
five categories: (1) Set up your project, (2) Carry out an observation, (3) Select data for analysis
and export, (4) Analyze your data and (5) Export your data. Below each of those categories,
anywhere between four and seven steps were provided on how to execute that category. While
going through the process themselves, the instructional designers immediately saw where the
handout was lacking in clarity of instruction. In fact, there was confusion in the very first step, on
which program to open to begin a new project using the software. There was clearly a need for
further instruction and description of what the proper steps the user needs to take in successfully
testing software using the Observer XT. The consultants deemed it necessary to not only to add a
significant amount of information to the current instructional handout, but also create more
interactive learning modules. The gap that exists with the Observer XT program and its users is
that the system is a very detailed software to use that requires a great deal of instruction on how
to use it; however, that necessary instruction is lacking. Students and faculty wishing to use the
software should be able to successfully set-up, carry out, analyze and export a project with the
provided instructional materials with ease.
Data collection process
The data collection process consisted of consulting with the client/subject matter expert
(SME), gathering data from the Observer XT manual, sources from the Internet, and finally the
consultants’ use of the actual software. The project consultants originally planned to interview
with students and/or faculty that have used the software in the past, however that number is very
limited- hence the need for help and instruction. It was discovered that no one had used the UTS
OBSERVER XT UTS
8
to conduct research in the past three years. The last student to use the software was a graduate
student of the Adult Education and Human Resource Development program who graduated and
no longer resides in Harrisonburg. Therefore, the consultants were limited to only having the
client and one other professor available to interview and gather data from.
The data collection officially began after the initial meeting with the client/SME. The
initial meeting allowed the consultants to discuss with Dr. Estes her needs and wants for the
project and provided an overall explanation at the perspective project at hand. After the first
meeting, the consultants were able to conclude that a performance gap definitely existed, and that
is one in which needs assessment and performance analysis would help begin to solve. The client
and both consultants agreed on terms to which the consultants would fulfill for this project
(Appendix B).
To gain a more thorough understanding, the consultants used the actual Observer XT
system as one of the data collection processes. The consultants began by starting a new project
and followed the original instructional handout through each of the steps provided. This was
thought to be the best approach in order for the designers to truly understand where the needs
were.
It was immediately evident that the current instructional handout is not only not very user
friendly, but also missing multiple key steps in all of the sections of setting up and conducting an
observation. As they walked through the Observer XT program, the instructional designers
composed notes on where the instruction was incorrect, unclear, or simply missing. This was an
efficient method because the consultants both have a research background, but no experience
with the Noldus system, nor any experience with behavioral research, which the system
OBSERVER XT UTS
9
primarily uses behavioral research language. This allowed the consultants to really view the
instructional handout and software from the perspective of a future user.
One of the next data collection processes included the consultants referencing the
Observer XT manual and online sources. This was deemed necessary since the assessors could
only gather so much information from the existing handout and since they had no prior
knowledge of the software. The assessors carefully dissected the manual to see what kind of
information would be necessary to include in an upgraded version of an instructional guide.
They tried to make sure no “nice to know” information would be in the recommendation to add
to the guide since too much information can overwhelm students and/or professors when using a
new software program.
Internet sources were also believed necessary to include as a part of the data collection.
Although the manual provided useful information, the Internet provided further instructional help
that was also user-friendly. The website that was most used was the Noldus Information
Technology site. Although a lot of the information included in the Observer XT User Manual
was on the website, the website also contained tutorials and more information on the use of the
system. The site also included information on the latest version of the Observer XT software –
Observer XT 10.5.
Interviews with the client/SME were another data collection process that was used
throughout the entire course of the project. Information such as the background of the past uses
of the Observer XT software, lack of information on the program and information on the
software itself was gathered from the SME. The consultants had several meetings throughout the
semester with Dr. Estes to discuss the progress of the project as well as any questions the
consultants had at that point in time.
OBSERVER XT UTS
10
Consultants were also able to meet with a professor in the psychology department at
JMU. For this project, Dr. Krisztina Jakobsen, is also considered as one of the SMEs of the
project. Dr. Jakobsen works in the psychology department, where the second Noldus Observer
XT system that JMU owns is housed. The purpose of this meeting was to collect more
information about the software, as well as to gather information about the behavioral side of the
software program, since it is heavily based in behavioral research. The consultants, as well as the
client, were able to collect very useful data (Appendix C).
Gap analysis and justifications
While the consultants followed the original instructional guide, multiple instances were
found in which clarity, necessary steps, and valuable information were lacking. For example, in
the section titled “Set up your project,” information was not given on how to even open the
Noldus Observer XT software (Appendix A). Through conversations with Dr. Estes and trial
and error, the consultants realized that simply double-clicking on the Noldus Observer XT icon
on the desktop does not open the program. A USB key must be inserted prior to even opening
the program. If this step is missed, the program will show an error message and shut itself off.
Therefore, the consultants decided to start the “Set up your project” process by instructing users
to first insert the USB key and then to double-click on the Observer XT icon on the desktop
(Appendix D). Similarly, clarity was lacking in the original handout regarding selections of
independent variables and behaviors of interest. It seemed as though the previous handout
assumed that all users of the software will be highly knowledgeable regarding vocabulary
associated with these topics. For example, the instructions of the original handout concerning
selection of behavior groups start by stating, “Create behavior groups (mutually-exclusive or
start-stop)” (Appendix A). By working through the software using the original instructional
OBSERVER XT UTS
11
guide, the consultants realized they did not know the definitions for “mutually-exclusive” nor
“start-stop.” Therefore, the consultants referenced the user manual for the software and provided
these definitions as a part of the interactive PowerPoint they created, titled, “Subjects, Behavior,
and Coding” (Appendix E).
Based on their observations and consultation meetings with their client and SMEs, the
clients decided that this gap in ease of use needed to be filled. It was clear that the software itself
is difficult to understand, for even knowledgeable professors who have conducted vast amounts
of research. It was thought that if the software was confusing for them, then students, especially
those in their undergraduate career, would have an even more difficult, frustrating time
attempting to use the Observer XT program. Therefore, the consultants decided that in order for
this program to play an important role in the new Human Factors course, a more in-depth, yet
easy to follow instructional guide be developed. In order to be certain that the guide covered the
necessary steps in creating, conducting, and analyzing a project, the consultants further decided
to use accompanying materials, in the form of interactive PowerPoints to help students and
faculty understand more basic, background information, like definitions of key terms (Appendix
E).
Recommendations
There are several recommendations the consultants developed to provide to the client
regarding the Observer XT software.
Recommendation One
The first recommendation is to keep an instructional handout similar to the existing one.
The paper handout should be kept in the same place, next to the computer where the software is
used in the UTS room. This allows any users to have immediate and direct access to instructions
OBSERVER XT UTS
12
and details of how to start and carry out an observational project. The only change is that a newer
version of that handout is suggesting to be used instead of the existing handout. This revised
version includes much more detail and clarification on the steps involved to create a new project,
carry out an observation, and analyze and export data gathered from the observation. The details
added to the existing handout include information that is on a ‘need to know’ rather than a ‘nice
to know’ basis.
The consultants recreated the first section of the revised version of the existing
instructional handout to give to the client. Before making any changes, the consultants took into
high consideration that the bulk of the future users of this software will have little to no
background on research. Therefore, the first step to enhancing the instructional handout the
consultants took was to define or clarify any type of behavioral research language that someone
with little to no research background would not understand without any explanation. For
example, definitions and clarifications between “continuous” and “instantaneous” sampling were
written out within the new handout (Appendix D).
Students taking courses in the AHRD minor are good candidates for completing the
remaining section of the revised handout. The rest of the sections could be reevaluated by the
students to see how much more detail is needed. Although some detail and clarification was
added to the instruction in sections two through four, only section one was completed in its
entirety. The completion of the remaining four sections could be done by referencing both the
Observer XT manual, the Observer XT website and the trial use of the Observer XT program
itself. This would make a good project for any of the higher-level classes of the AHRD minor.
Recommendation Two
OBSERVER XT UTS
13
The second recommendation, which was partly created by the consultants, includes
additional components to the instructional handout. Screenshots of examples of the steps
involved in a new project on the Observer XT were also added to the first section of the new user
handout. Additional screenshots are also being suggested for use for the rest of the handout. One
example area of where the screenshots can be useful for users is in section three of the
instructions when it talks about how to “filter observations by name or independent variable
value” (Appendix A). All of the screenshots that are included and/or being suggested will
provide a visualization of the steps that the users need to follow (Appendix D). Appropriate areas
where screenshots can be helpful include any section or steps that include areas that are more indepth and content-heavy. Here are some examples that the consultants added to the upgraded
version of the handout:
OBSERVER XT UTS
14
A second component that was made in addition to the screenshots on the handout
includes interactive PowerPoints. These PowerPoints were designed to further aide any user to
help clarify both definitions of research terms and the guidance of the steps. The consultants
suggest that these PowerPoints be placed on the desktop of the laptop where the Observer XT
software program lives so that at any point in time, the user can open the interactive PowerPoint
for further help. The consultants designed three interactive PowerPoints that include information
on the first section of the revised instructional handout (Appendix D).
OBSERVER XT UTS
15
The third component the assessors would suggest for the client to consider using are
screencasts. Screencasts would be yet another step up from interactive PowerPoints and would
include voice within the instruction. This would provide even further guidance to the user
because he or she would both be able to visually see the steps happening in a video as well as
hear a person talking and guiding him or her through the appropriate steps. This is another
component that could be developed by students in the AHRD minor at JMU.
Recommendation Three
Third, the consultants suggest that the College of Education upgrades to the newest
version of the Noldus. Currently, the College of Education owns the Observer XT 9.0.
However, the software has been updated to version 10.5, which carries more user-friendly
features and is available for purchase. The Observer XT 10.5 was developed in response to user
concerns. It includes improvements in navigation via drop down menus and button bars, a
screen layout that users can manipulate themselves, an option for researchers to easily share their
projects, and easier instructions on how to set up their project, conduct an observation, and
analyze their results (Ouwerkerk, n.d.).
Recommendation Four
The fourth recommendation the consultants would like to present, is the use of the
technical support provided by Noldus Information Technology. The team at Noldus offers help
regarding both human and animal research in the form of consultations, customer support, and
training courses. It is suggested that the College of Education focus on the customer support
help desk and then consulting services Noldus Information Technology offers regarding human
factors research. Technical support for any Noldus product can be attained through the Noldus
website (www.noldus.com), telephone, e-mail, Skype, and remote assistance (Appendix F). If
OBSERVER XT UTS
16
contacted, Noldus says they will help researchers set up a test lab environment, conduct a test,
and present the results (Ouwerkerk, n.d.).
Recommendation Five
The fifth recommendation the consultants suggest is pilot testing. Upon discussion
between Dr. Jakobsen, Dr. Estes, and both consultants, it was decided that pilot testing would be
an effective and efficient approach to conducting research with the Observer XT system. Dr.
Jakobsen noted that she had performed pilot testing in the past, before conducting her research.
This helped her research team decide the specific behaviors that would be observed given the
conditions they presented in the test environment. Furthermore, pilot testing also aided the team
in choosing the appropriate independent variables to study. The consultants believe that
conducting pilot testing with the software will help students and faculty using the system
conducts more thorough research that has a clear focus.
Conclusion
The Observer XT software proves to be a very useful program both in and outside of the
classroom. As stated earlier, it was originally purchased so that both students and faculty would
have an outlet to use for both behavioral research and usability testing of software applications.
Although there is an existing instructional piece to help guide along new users of the system, it
was found to be inadequate in both efficiency and information. It has become more pertinent for
revised and additional instructional pieces to be added since it is planned to be used a part of a
project in the Human Factors course that will be a part of the AHRD major in the near future.
With the five recommendations taken into consideration, the consultants believe that the system
will not only be able to be used with more ease but also be used more often than it currently is.
Even implementing one of the recommendations will help future users be able to work through
OBSERVER XT UTS
17
the system with greater ease than compared to using the current instructional handout. With the
help of AHRD students these recommendations can be developed and eventually implemented to
ensure that the system will be used as it is expected to, for both students and faculty.
OBSERVER XT UTS
18
Appendix A
Previous Instructional Handout
OBSERVER XT UTS
19
OBSERVER XT UTS
20
Appendix B
Client/Consultant Agreement
Ultimate Goal:
To clarify the instructional guide for the Usability Testing System. This will be accomplished
through creating a more detailed and user-friendly step-by-step handout.
Procedure/Process:
A. Use Wix versus Weebly to understand how to use the UTS
1. Take notes on where steps may be missing with established guide
2. Both Nehali and Britney will test and learn how to use the UTS
3. Figure out where instruction is needed
B. Interview with Dr. Estes and any other individuals who have used the system within the past
year
1. Gather further information about where the guide falls short for the user
Overarching Framework
1. Break up guideline into however many sections to be able to provide the best training
a. Sections will include “Setting up the Codes”, “Implementing the Experiment” and
“Analyzing the Data”
b. More sections will be added if needed
2. Create entire first section (Setting up the Codes)
3. For the rest of the sections, we will provide a descriptive outline with suggestions of what
content needs to be included in the instruction for those particular pieces
4. The provided modules and outline will be provided to the client in both paper and electronic
form
5. We will also provide the client with suggestions to who would be good candidates to work
on pieces of a section(s) in the future
Client Signature:
Date:
Consultant #1 Signature:
Date:
Consultant #2 Signature:
Date:
OBSERVER XT UTS
21
OBSERVER XT UTS
22
Appendix C
Notes taken during meeting with Dr. Krisztina Jakobsen
•
•
•
•
Set up as much as you can in the beginning, because some things you cannot change in
the middle of the project
Tech support is always helpful
Add Pilot testing to recommendations
For this project, focus is on frequency rather than duration
Dr. Jakobsen took the consultants and client through a run-through of how to set up a project using the
Noldus system. Here were the notes that were taken:
Creating new project:
1. Observations
a. Offline or live
2. Coding scheme
a. Add subjects
i. Example: (1) Mom, (2) Child
ii. Example: (1) Student A, (2) Student B
3. Behaviors
a. ***Really important to add before starting project because they are one of things
that you cannot change later on in the observation***
b. Setting up behavior groups
i. Mutually exclusive*
1. Choose when you cannot a behavior running at the same time as
another behavior
2. Example: Cannot have “Facial Expressions” and “Think Aloud”
running at the same time
a. It does not make sense for someone to look happy, but say
they are confused
3. Example set up of behavior groups:
a. Facial Expressions
i. Frustrated
ii. Happy
iii. Sad
iv. Confused
b. Think Aloud
i. Frustration
ii. Anger
iii. Excited
iv. Confusing
ii. Start-stop behavior:
1. If one behavior starts, you can also start one simultaneously
4. Independent variables
OBSERVER XT UTS
23
a. It is possible to not put IV in the Noldus system, but rather have IV on a
spreadsheet and then combine the data (not necessarily useful for this specific
project)
b. The system already tells you start, stop and duration time
c. Example set up of Independent Variables:
i. Age
1. Type:
a. Numerical
2. Predefined variables:
a. Define a range; Example 18-21 years, so if someone puts in
that they are 24 years old, it would say he or she is not
eligible for this testing
ii. Language
1. Type:
a. Text
2. Predefined variables:
iii. Consent
1. Type:
a. Text
2. Predefined variables:
a. (Add in) Yes consent
b. (Add in) No consent
iv. Native Language
1. Type:
a. Text
2. Predefined variables:
a. (Add in) English
b. (Add in) Spanish
5. Creating Observation
a. Include participants
i. Name: (name of person, ID number, etc.)
Description: (don’t necessarily have to put a description: could also put the ID of a person here so you can
protect their identity
OBSERVER XT UTS
24
Appendix D
Noldus Observer XT Instructional Guide
Newly Developed Instructional Handout
(Only section one fully completed)
Sections:
1. Setting up your project
p. 2
a. Observation
p. 2
b. Subjects, behaviors and coding
p. 3
c. Independent variables
p. 4
2. Carry out an observation
p. 6
3. Select Data for Analysis and Export
p. 7
4. Analyze your Data
p. 7
5. Export Data
p. 8
OBSERVER XT UTS
25
Section 1: Set up your project
1.
2.
3.
4.
Insert the USB drive
Double click The Observer XT 9 on the desktop
Create a project (CTRL+N)
Click Set Up Project
Observation
(See “Interactive PowerPoint Observations” on desktop for further
instructions/help)
5. Choose how you will observe (Instructions provided here are for a Live Observation)
a. Offline Observation (pre-recorded media file)
b. Live Observation (live event)
6. If you are conducting a live observation, click Devices to choose which device(s) you will be
using:
a. Sony DV Device
b. VGA2USB V2U18761
7. Choose your Observation Method
a. Continuous Sampling:
i. You record all occurrences of the behaviors of interest of one or more
subjects for a specified length of time.
ii. Choose when you want to calculate absolute frequencies and durations of
the behaviors of interest
b. Instantaneous Sampling:
i. You record the behavior of one or more subjects at preselected moments
in time (sample points).
ii. Choose when you want to calculate relative frequencies of behaviors (Ex:
time, budgets), general activity of one or more subjects, behavioral
synchronization of several subjects and spatial relations in groups
iii. Not suitable when you want to record behaviors with a very short
duration.
iv. Important to choose an appropriate interval between sample-point to yield
meaningful data.
c. Combine Continuous and Instantaneous Sampling: use when you want to
record the behavior of one or more subjects in detail (focal subjects) while
recording the behavior of other subjects in less detail
8. Choose your Observation Duration:
a. Open-ended observation: Choose this if you want to end observation manually.
b. Duration based on elapsed time: Choose this option if you want to stop the
observation when the time from the start (including the time the observation was
suspended) has reached the Observation duration.
c. Duration based on observed time: Choose this option if you think you may
suspend an observation at some time and want to stop the observation when the
Observation duration has been reached, excluding the time the observation was
OBSERVER XT UTS
26
suspended.
9. Click Coding Scheme (Right Green Arrow) at bottom right of screen when finished
Subjects, Behaviors and Coding
(See “Interactive PowerPoint Subjects, Behaviors & Coding” for further instructions/help.)
10. Under Subjects click Add Subject
a. Type a name in the Subject name column, then press Enter.
11. Under Behaviors click Add Behavior Group to create behavior groups. Pick between:
a. Mutually Exclusive states:
i. Select this option if the state
behaviors within that group
exclude each other at any time.
When one of the behaviors is
active, the other behaviors within
the same group cannot be active.
ii. The advantage of mutually
exclusive behaviors is that during
coding, you do not need to stop
behaviors. When you start a new
behavior, the previously coded
behavior of the same group
automatically stops.
(Ex: walk and sit)
iii. If you choose this, you have the following option:
1. Exhaustively active behavior group:
a. Select if you want to score the behaviors of this group in
such a way that no “empty” time line is left between
successive events.
b. Start-Stop states:
i. Select this option if the state behaviors within that group are independent
of each other with regard to their onset. Such behaviors do not stop
automatically when a new behavior is scored and have, therefore, in
addition to a start key-code, a stop code to stop it.
(Ex: Task 1 and User error. These behaviors describe independent events,
since the beginning of one does not necessarily mean the end of the other.)
12. Enter a group name for your behavior group
(Ex: Facial Expression, Think Aloud, etc.)
13. Enter behaviors
(Ex: Under ‘Facial Expression’: Sad, Confused, Happy, etc.; Under ‘Think
Aloud’: Confusion, Excitement, etc.)
14. For each behavior determine its behavior type in the drop down menu from the following:
a. Initial State Event: is automatically scored at the start of an observation
b. State Event: have a distinct start and end. Besides the frequency of occurrence,
the duration is recorded
(Ex: walking, playing, grooming)
c. Point Event: behaviors without measurable or relevant duration. Either their
OBSERVER XT UTS
27
duration is very (immeasurably) short (Ex: hitting) or you are not interested in the
duration of the behavior but only in its frequency
(Ex: talking)
15. When finished, click Create Group.
a. If you want to add another group(s), repeat steps 11 to 15.
16. When finished creating groups, click Independent Variables (IV) down at the bottom right
of the page.
Independent Variables
(See “Interactive PowerPoint Independent Variables” on desktop for further instructions/help)
Definition of an independent variable: An independent variable is a variable you have control of, the one
you can manipulate (Ex: Research present or research absent during observation)
17. Click Add User-defined to name your IV(s).
18. Fill in the following fields:
a. Label: Here is where you name your independent variable. Each different
variable must have its own unique name.
b. Description: This part is optional. It allows you to enter text about the
background information of that variable.
c. Type: Choose one of the following from the drop-down list:
i. Text: Variable is indicated by alphanumeric characters, composed of
letters, numbers or both
(Ex: the name of the observer)
ii. Numerical: Variable is represented by numbers only
(Ex: the age of the subject)
iii. Timestamp: Variable is represented by a time stamp
(Ex: the starting date and time of experiment)
iv. Duration: Variable is represented by a duration
(Ex: the duration of the treatment)
v. Logical: A variable that is either ‘False’ or ‘True’
(Ex: whether or not the observer is present during the test)
d. Format:
i. For Text Variables: If the variable is text only, a ‘format’ does NOT need
to be specified.
ii. For Numerical Variables:
1. Click in the Format box
OBSERVER XT UTS
28
2. Select the No. of decimals box and enter the number of decimals
your variable has. If your variable has zero decimal places, leave
the box blank.
3. Check the Scientific notation box if you want to write your
numerical variable in scientific notation form
(Ex: 1485.236 as 1.485e+0.03)
4. In the Unit field, enter the unit of your variable
(Ex: ‘years’ for the age of the subject)
5. Click OK
iii. For Timestamp Variables:
1. Click in the Format field.
a. If variable is a System variable (one that includes Start
Time, Stop Time and duration of your observation), the
Time Format preferences window appears instead of the
Format string window.
b. Enter your preferred format in the field at the top and click
OK.
iv. For Duration Variables:
1. Click in the Format field.
2. Enter your preferred format in the field at the top and click OK.
v. For Logical Variables: You do not need to specify a format.
e. Predefined Values:
i. For Text Variables:
1. Click in the Predefined Values field.
2. Enter a value for your independent variable
(Ex: name of one of the observers)
3. Click Add. The value you entered will move to the Predefined
Items field. You can enter the other names of the other observers.
4. Keep the Allow other values check box selected if you are not
sure whether the values you have defined are exhaustive.
ii. For Numerical Variables:
1. Double-click in the Predefined Values box.
2. Enter the minimum and maximum values for your independent
variable. Then click OK.
iii. For Timestamp and Duration Variables: You do not need to specify any
predefined values.
iv. For Logical Variables:
1. Click in the Predefined Values box.
2. Enter values for ‘False’ and ‘True’
(Ex: If your variable is ‘presence of observer’, you may define the
values ‘No’ (False) and ‘Yes’ (True)).
f. Scope and Value Update.
This value is already established. If you would like to change it, see the
Observer XT reference manual. (Chapter 4; p. 121)
OBSERVER XT UTS
29
Section Two: Carry out an observation
1. Create a new observation
a. Enter the name of the observation
b. Add description of observation (if desired)
c. Click on the Devices tab and select the necessary devices to use your recording
d. Click OK
2. If you are working offline, select a video file (if you are working live this is not necessary)
3. Starting and Observation
a. Define which behaviors are active at time zero.
b. One way to do this is to add “Initial State” to each behavior group
4. Start recording observation
a. From the Observe menu, select Start Observation
b. Click the Start Observation button (green button at the top left of the screen) to start
recording
c. If you have defined independent variables in
your project setup and you chose to edit
them before the observation, the Enter
Independent Variables values pops up.
Choose the values for each independent
variable, and click OK.
d. After entering the values for your
independent variables, the observation will
begin.
5. Press the keys you have assigned, or click on the codes window to score the events
a. Clarify that as it is recording, press appropriate established code buttons when those
codes arise
b. Make sure to click the letter assigned to “Participant One” and then the key code if
there is more than one subject
6. Stop the observation (Ctl+Alt+Q)
Section 3: Select Data for analysis and export
1. Click on the Analyze tab
2. Click on Create a new data profile under Select Data
3. Name your new data profile based on the selection you are choosing to analyze
4.
5.
6.
7.
Filter entire observations by name or independent variable value
Group observations or behaviors (Click the Grouping button in the Start box)
Filter out behaviors you do not want to analyze
Nest your data
(Ex: To find out what A was doing whilst B walked)
8. Make multiple result containers to compare the results of different selections in one overview
OBSERVER XT UTS
30
Section 4: Analyze your data
1. To visualize a plot of your raw data, click Visualize Data.
2. Select which set of data you want to see in the pop up window titled Select Observation and
click Ok
3. Analyze a specific behavior to answer a research question
a. Under Select Data, click Create a new data profile
b. In the pop up window, enter the type of event you want to analyze
(Ex: “Look at adult”) and click Ok.
c. By default, all of your data will be selected. You must now select the filter from
the left hand side through which you want to narrow the data you are analyzing
(Ex: “Look at adult”)
d. Clicking the Settings button allows you to change what filter(s) you are using
e. Click Select Analysis button to proceed when ready.
4. Analyze numerical modifiers
(Ex: What was the average speed?)
5. Analyze the sequence of events
(Ex: How often did run follow walk?)
6. Analyze the reliability of your scoring
(Ex: How does my observation compare to another?)
Section 5: Export your data
1. Export your analysis results for statistical tests in SPSS or further calculations in Excel
a. To export the results of your behavioral analysis click on Behavior Analysis
under Analyze Data.
b. In the Analysis Settings window, select which elements you would like to have
shown in rows, columns, or separate sheets. Then, click Ok
c. A table will display the results of your selected behavioral profile
(Ex: “Look at adult”)
2.
3.
4.
5.
6.
7.
i. To add more statistics to your table, click the Statistics tab above the
table. Choose what statistics you want to display, and then click Ok
d. To export your results to SPSS or another statistical analysis software, click the
Export button above the table.
e. In the next window, you can choose to export to an .xls, .xml, or .txt file. Choose
which option you want to use, and then click Export
Create an episode selection (Analyze menu) under Episode Selection
Generate a highlight video of the behaviors that interest you (this is what I mean by
aggression)
Export the physiological data for your data selection
(Ex: The heart rate for one minute after he started running)
Export the event data form all your observations together in one file
Export all your data together in one XML file (*.odx) for import into another project on
another computer to analyze together by going to Analyze and clicking Export data
Create a backup of your project for safe keeping of your data
OBSERVER XT UTS
31
Appendix D
Interactive PowerPoints
Section One: Observation
OBSERVER XT UTS
32
OBSERVER XT UTS
33
OBSERVER XT UTS
34
Section One: Subjects, Behaviors and Coding
OBSERVER XT UTS
35
OBSERVER XT UTS
36
OBSERVER XT UTS
37
Section One: Independent Variables
OBSERVER XT UTS
38
OBSERVER XT UTS
39
OBSERVER XT UTS
40
OBSERVER XT UTS
41
Appendix F
Noldus Help Desk
OBSERVER XT UTS
42
References
Grieco, F., Loijens, L., Zimmerman, P., & Spink, A. (2009). The Observer XT: Reference
Manual Version XT 9.0. Wageningen, The Netherlands: Noldus Information
Technology.
Ouwerkerk, N. (n.d.). Noldus Information Technology. Retrieved from http://www.noldus.com/.