1
Manual to Online FISH Probe Optimization Tool
Jakub Nedbal
17. January 2010 (ver 1.0)
CONTENTS
1
This manual describes the details of the FISH probe optimization algorithm starting
with the processing of the user supplied data and nishing with the output report
generation. It will help unfamiliar users understand the principle of the algorithm and
help them understand its functions and ways to modify them by changing the default
conguration le.
Contents
1 Introduction
2
2 Interaction with the User
3
3 Sequence for Analysis
4
4 Conguration File Import
4
5 Sequence Alignment
5
6 Similar and Unique Sequences
5
7 Merging Adjacent Similar Sequence Stretches
6
8 Region Length Filtering
6
9 Histogram of Unique Similar Sequence Repeats
8
10 PCR Product Search
9
10.1 PCR Templates Selection . . . . . . . . . . . . . . . . . . . . . . . . . .
9
10.2 Neighboring Template Overlap . . . . . . . . . . . . . . . . . . . . . . .
10
10.3 Primer Search Parameters
10
. . . . . . . . . . . . . . . . . . . . . . . . .
10.4 Restriction Endonuclease Recognition Site Search
11 PCR Products for Unique Regions
. . . . . . . . . . . .
11
11
1
INTRODUCTION
2
12 PCR Products for Unique Similar Regions
13
13 Restricted Sequences
13
14 Graphical Output
14
14.1 Similar Sequence Distribution
. . . . . . . . . . . . . . . . . . . . . . .
15
14.2 Sequence Grouping into Regions . . . . . . . . . . . . . . . . . . . . . .
15
14.3 PCR Products . . . . . . . . . . . . . . . . . . . . . . . . . . . . . . . .
15
14.4 Reference Sequences
. . . . . . . . . . . . . . . . . . . . . . . . . . . .
16
14.5 Horizontal Axis . . . . . . . . . . . . . . . . . . . . . . . . . . . . . . .
16
14.6 Annotation of the Output
. . . . . . . . . . . . . . . . . . . . . . . . .
17
. . . . . . . . . . . . . . . . . . . . . . . . . . . . . . .
17
14.8 Output Mirroring . . . . . . . . . . . . . . . . . . . . . . . . . . . . . .
17
14.7 Output Format
15 Textual report
19
16 Mega BLAST Alignment Parameters
19
16.1 Genomes in Single Sequence . . . . . . . . . . . . . . . . . . . . . . . .
20
16.2 Genomes with Patches and Haplotypes . . . . . . . . . . . . . . . . . .
21
17 Mega BLAST Alignment Import
21
18 WWW Interface
22
18.1 Data Safety
. . . . . . . . . . . . . . . . . . . . . . . . . . . . . . . . .
19 Technical Details of the Software and Hardware
19.1 Task Scheduling . . . . . . . . . . . . . . . . . . . . . . . . . . . . . . .
24
24
27
1 Introduction
The website http://www.nanoimaging.uni-jena.de/sh/ is the user interface to the
FISH probe search algorithm.
It gives the user the option to select a target species
and input a DNA sequence to be analyzed for the presence of potential FISH targets.
2
INTERACTION WITH THE USER
3
The sequence together with other optional parameters are analyzed and a report is
generated.
It includes a comprehensive graphical presentation of the analyzed DNA
sequence with suitable FISH probes highlighted alongside the relevant genes on a background map of unique and similar sequences. Primer pairs necessary for the production
of the FISH probes and their exact sequences are also delivered.
The user-supplied DNA sequence referred to as the query is aligned to the genome
of the selected species. Query sequences found in only a single position in the entire
genome are considered unique . These unique regions of sucient length are selected
for the design of FISH probes. Any parts of the query which are found in the genome
in multiple similar copies are referred to as similar .
If several similar sequences
overlap or are separated by a gap of a maximum permitted length, they are grouped
into a single similar region . These similar regions are analyzed for the presence of
a subclass of unique similar sequences. Such sequences are found in multiple similar
copies within the genome, but all of them localize to the same similar region and make
suitable repetitive FISH probe targets.
Both unique and unique similar regions are
partitioned into segments of user dened length range for production of for single-copy
unique and repetitive unique similar FISH probes. PCR primers with user-determined
characteristics are designed to enable either PCR-mediated cloning of the FISH probe
templates or direct synthesis of the FISH probes.
2 Interaction with the User
A successful query submission through the web page results in a project directory
being produced on the web server.
In this directory the query sequence for analysis
is saved along with the selected target species, the user's email address, a default or
user-modied conguration le, and an optional le with the reference sequences such
as genes.
This project directory content is imported and the analysis of the input
les is initiated while a new web page is send to the user's web browser to display
regularly updated information about the progress of the data processing.
Once the
analysis is successfully nished, a report is posted on the website and the user receives
a notication email. If any processing error occurs, the user is also informed.
3
SEQUENCE FOR ANALYSIS
4
3 Sequence for Analysis
The user must provide at least one query sequence to be aligned with the genome for
identication of the specic FISH probe targets.
Additionally, a reference sequence
can be provided. This may consist of multiple shorter sequences of genes, regulatory
sequences or any other interesting parts of the query. They will be aligned to the query
sequence and their positions will be displayed in the graphical output for easier interpretation of the identied FISH probes positions.
Both the query sequence and the
1
optional reference must conform with the standard DNA FASTA format . In simplied
words, the FASTA format consists of a string of bases (ACGT) preceded by a line initiated by the greater-than character > followed by the name of the sequence. Multiple
sequences with their names can be concatenated into one le.
4 Conguration File Import
The user has the option to provide a custom conguration le or rely on the default one.
The conguration le allows modication of large range of parameters of the analysis.
It is based on the XML format in which XML tags are surrounded with explanatory
text.
Each XML tag consists of a parameter and a value organized in the following
format:
< parameter > value </ parameter >
The user may vary any of the values if desired and the algorithm will adopt to this
change. The parameters in the conguration le are grouped into those dening Mega
BLAST alignment parameters, search parameters for the unique and unique similar
FISH probes, graphical output parameters, and primer optimization parameters. The
default conguration le with annotations describing in detail each entry is included in
Abstract
??.
If any XML tags are missing from the conguration le, they are corrupted or
the user-specied values are out-of-range or otherwise unacceptable, they are replaced
1 http://www.ncbi.nlm.nih.gov/blast/fasta.shtml,
December 2010
5
SEQUENCE ALIGNMENT
5
by hardwired default values of which the user is notied.
These modied tags are
appended to the end of the conguration le which is returned to the user at the end
of the analysis.
Anything distinguished by a
fixed-width typeface
throughout the rest of this
chapter refers to a parameter used in the conguration le.
5 Sequence Alignment
The supplied sequences are aligned with the genome of the specied organism by Mega
BLAST algorithm
?.
It is initiated with default parameters except for the disabled
low complexity sequence ltering and the expectation value lowered from 10 to 0.01.
The ltering undesirably removes some repetitive sequences which potentially could
represent suitable FISH probe targets.
Lowering the expectation value cuto saves
processing time by increasing the stringency of search for similar sequence; in other
words more dissimilar sequences are omitted from the alignment result.
Further details of the sequence alignment are discussed later in this chapter in
Sections 16 and 17.
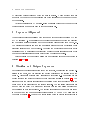
6 Similar and Unique Sequences
Each alignment contains information about the bit score, the starting and ending positions in the query, and the starting and ending positions of the similar hit in the
genome.
Alignments obtained from all sequence databases (e.g.
chromosomes) are
pooled together and sorted according to their bit scores (details in Section 17). The
alignment with the highest score species the position of the query sequence within the
genome and is not considered in the further analysis.
The remaining alignments are
mapped onto the query by marking any sequence between each alignment start and
end positions as a similar sequence. The similar sequences are those which are found
in the query and one or more similar copies identied by Mega BLAST elsewhere in
the genome (Section 5). This way the target region becomes divided into stretches of
7
MERGING ADJACENT SIMILAR SEQUENCE STRETCHES
6
a
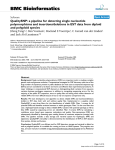
unique and similar sequences as illustrated in Figure 7.1 ) which displays the unique
sequences in white while the similar ones in light gray.
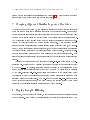
7 Merging Adjacent Similar Sequence Stretches
As introduced in the Section
??,
the algorithm searches for unique similar sequences
which are found within only a single similar region of the query sequence. These unique
similar sequences are suitable targets for repetitive yet unique FISH probes which bind
to a number of places within the similar region but not elsewhere in the entire genome.
The boundaries of such similar region must be selected carefully in order for the algorithm to correctly identify the unique similar sequences.
A set of unique similar
sequences might be localized into a single limited region of a chromosome, but if separated by even a short stretch of unique sequence, they would be interpreted as belonging
to dierent similar region s and not considered being unique similar. Therefore a tolerance for short unique sequence gap within a single similar region is introduced. This
allows merging of several similar sequences separated by short gaps into a single similar
region.
The length of this permitted gap is specied by
max_sim_gap parameter in the con-
guration le. It set to 1000 by default which suited the needs of the project introduced
in Chapter .......... In general, this parameter is dependent on the distribution of the
unique and similar sequences in each query and can only be determined empirically
by the user. Selecting
max_sim_gap
as large as the length of the entire query might
be desirable to detect the presence of any unique similar sequences in case none were
identied using the default value.
The pay-o for the large
max_sim_gap
is the loss
of any unique sequences found in the gaps between the similar regions which could
otherwise be potentially available as suitable FISH probe targets.
8 Region Length Filtering
Each region, whether unique or similar, might contain sequences potentially suitable
as FISH targets. The maximum permissible length of these target is determined by the
8
REGION LENGTH FILTERING
0
50k
100k
7
150k
200k
250k
300k
(a) max_sim_gap 0
S2
0
50k
100k
150k
S1
200k
250k
300k
250k
300k
(b) max_sim_gap 1000
S1
0
50k
100k
150k
200k
(c) max_sim_gap 3000
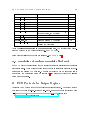
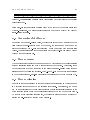
Figure 7.1:
Non-contiguous similar region grouping.
Similar sequences separated
by gaps consisting of unique sequences are merged into a single similar region if the gap
length is less than the
max_sim_gap value.
(a) With max_sim_gap set to 0, the similar
sequences shown in light gray are fragmented without presence of any similar unique
sequences.
S1 and S2
(b) The default value of 1000 for max_sim_gap yields two similar regions
(c) max_sim_gap of 3000 results in merging most of the similar sequences
into a single similar region S1 .
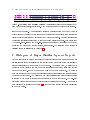
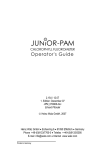
9
HISTOGRAM OF
UNIQUE SIMILAR
U8
U2
U7 U6 U5
0
U4
U3
50k
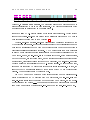
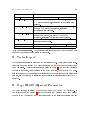
Figure 8.1:
SEQUENCE REPEATS
S2
100k
150k
Unique and similar regions
8
S1
200k
250k
U1
300k
of satisfactory lengths are highlighted by
pink and blue rectangles, respectively. FISH probes are sought within these regions.
length of each region. The uorescence intensity obtainable from each FISH probe is
proportional to the length of its target and therefore only suciently long targets can
justify the labor intensive and expensive FISH probe production. A length threshold for
the regions is therefore introduced to only use the suciently long ones. It is determined
by the
min_uniq_length
and
min_sim_length
parameters by default set to 4000 and
30000 for the unique and similar regions, respectively. The selection of the regions of
fullling length is illustrated in Figure 8.1.
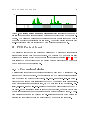
9 Histogram of Unique Similar Sequence Repeats
Each similar region is divided into unique similar sequences which occur in one or more
similar repeats found exclusively in the similar region and those which are similar to
sequences localized to other parts of the genome.
To identify them, a histogram is
generated which displays the number of similar sequence repeats within each similar
region of the query. It has a bin for each base of the query sequence. The value in
each bin corresponds to the number of similar repeats of its surrounding sequence found
the same similar region. The histogram bin value is
zero if the surrounding sequence
is similar to any genomic sequence not contained in the similar region. The non-zero
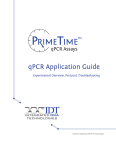
histogram bins dene the unique similar sequence positions in the query. An example of
such histogram is presented in Figure 9.1 with the unique similar sequence highlighted
in the cyan color.
10
PCR PRODUCT SEARCH
9
200
0
0
50k
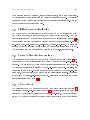
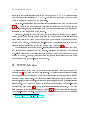
Figure 9.1:
100k
150k
200k
Similar unique sequence histogram
250k
300k
value represents the number of
similar repeats of given sequence stretch within each similar region of the query sequence.
The histogram value is zero for sequences which are similar to any part of
the genome outside the scrutinized similar region. The unique similar sequences with
non-zero histogram bins are highlighted by cyan color in the sequence map.
10 PCR Product Search
The algorithm serves the main purpose of designing PCR primers to clone suitable
sequences for specic FISH probe production. The obtained PCR products are tiled
across to the selected unique and unique similar sequences (Sections 8 and 9).
The
permissible PCR product length and the overlap between neighboring PCR products
can be dened in the conguration le.
10.1
PCR Templates Selection
Multiple parameters decide which sequences should be used for PCR cloning and subsequent FISH probe production. The templates for the PCR primer design are selected
from the unique and unique similar regions.
Min_uniq_pcr
and
min_sim_pcr
parame-
ters dene the minimum permissible length of the PCR template within these regions.
If the given region is not suciently long, the PCR primers will not be designed. Similarly,
max_uniq_pcr
template.
and
max_sim_pcr
limit the maximum allowed length of the PCR
If the scrutinized region is longer than this value, it is rst divided into
the lowest possible number of templates of length within the allowed range. The region division depends on the value of the
pcr_overlap
parameter which denes the
requirement for overlap between the neighboring PCR products and its extent.
10
PCR PRODUCT SEARCH
10.2
10
Neighboring Template Overlap
The primers are sought only in the terminal tails of the selected PCR templates. Initially, the length of these tails is limited to 100 bases. If no primers could be identied
within the tails, they are incrementally extended by another 100 bases and the search is
repeated until a suitable primer pair is found or the absolute value of the
pcr_overlap
parameter is reached. If no primers could be found within the extended tails, the sequence search window is shifted by the absolute value of the
pcr_overlap
parameter.
The search for primers, again starting with only 100 bases long tails, is repeated until
successful PCR primer pair is identied or the end of the region is reached. The length
of the terminal tails into which the primers localize is purposely minimized to lessen
the gaps between individual PCR products. The search window and the terminal tails
are always chosen such that both PCR primers stay within the studied region to ensure
specicity of the resulting FISH probes.
If the
pcr_overlap
value is negative, the PCR primer search of the second and
successive PCR products starts beyond the end of the previous PCR product such that
neighboring PCR products never overlap. This is particularly benecial for the design
of the CyDNA FISH probes which should not compete for the same overlapping binding sites. On the contrary, positive
pcr_overlap
gives rise to overlapping neighboring
PCR products which are desirable for FISH probes generated by nick translation or
random priming. Such FISH probes are generated randomly and therefore are inherently overlapping and competing for their binding sites anyway.
The overlap of the
PCR products increases the span of the FISH probe binding sites by eliminating any
gaps between the individual PCR products.
10.3
Primer Search Parameters
The primers search referred to in the previous paragraphs is conducted by the Primer3
program
?.
The user can vary the primer search parameters such as the permissi-
ble length and annealing temperatures of the primers by modifying the conguration
le (summarized in Table 1).
The detailed information about each of each of these
11
PCR PRODUCTS FOR
UNIQUE
Conguration parameter
primer_opt_size
primer_min_size
primer_max_size
primer_opt_temp
primer_min_temp
primer_max_temp
primer_salt_corrections
REGIONS
11
Description
Default
Primer optimum length
20
Primer minimum length
15
Primer maximum length
30
Primer optimum temperature
66
Primer minimum temperature
58
Primer maximum temperature
68
Primer salt corrections (0) Breslauer,
2
(1) SantaLucia, (2) Owczarzy
primer_gc_clamp
primer_min_gc
primer_max_gc
primer_max_tm_diff
Primer GC clamp
2
Primer minimum GC content
30
Primer maximum GC content
70
Maximum dierence between primer
3
melting temperatures
Table 1:
Primer parameters in the conguration le.
The details of each param-
eter can be found in the Primer3 release 2.2.2 README le.
2
parameter is available in the Primer3 release 2.2.2 README le .
10.4
Restriction Endonuclease Recognition Site Search
Each PCR product is scrutinized for the presence of selected restriction endonuclease
recognition sites.
Their absence determines the optimal restriction sites for incorpo-
ration into the cloning PCR primers. The user may select a comma separated list of
names from the Restriction Enzyme Database
?3
and include it through the
enzyme
parameter for analysis.
11 PCR Products for Unique Regions
Designing FISH probes for unique sequences is straightforward.
with length between
min_pcr_size
and
max_uniq_pcr
a primer pair is identied near
2 http://sourceforge.net/projects/primer3/les/primer3/2.2.2-beta/,
3 http://rebase.neb.com/,
January 2011
For unique regions
January 2011
11
PCR PRODUCTS FOR
H
G
F
0
E
D
REGIONS
12
C
B A
50k
Figure 11.1:
UNIQUE
100k
150k
Unique FISH Probes.
200k
250k
300k
The optimized unique FISH probes are made of
sequences highlighted by the empty pink rectangles. They bind unique sequences which
are present only in a single copy in the entire genome.
its ends to allow PCR-mediated cloning of the intermediate sequence. Unique regions
longer than the
max_uniq_pcr
are divided into multiple templates and a PCR primer
pair is designed to clone each of them (Section 10).
The
min_uniq_pcr
and
max_uniq_pcr
values should be selected according to the
type of experiment planned. If FISH probes are generated by nick translation of random
priming the overall length of the FISH probe target should be in the order of tens of
kilobases for reliable uorescence detection. A PCR product less than a few kilobases
in length would contribute rather insignicantly to the desired overall length of the
FISH probe. Hence, the
min_uniq_pcr is by default set to 4000.
If the unique regions,
on the other hand, are very fragmented, and no contiguous regions of sucient length
are identied, this default value might need to be decreased. The
max_uniq_pcr
value
depends mainly on the feasibility of the PCR-mediated cloning. To save time and cost,
lower number of longer PCR products to cover a given region is desirable. However, the
length of the PCR amplicons is limited by the eciency of the PCR and the subsequent
cloning. The upper limit is set by default to 8500.
For CyDNA based FISH probes in which individual FISH probe molecules are directly synthesized in a PCR reaction with E10 polymerase, the
max_pcr_size
min_pcr_size
values limit the length of the produced FISH probes.
and
In the experi-
ments described in Chapter ....... the goal was to obtain FISH probes around 500 bases
long which was achieved by setting
min_uniq_pcr
to 500 and
max_uniq_pcr
to 700.
12
PCR PRODUCTS FOR
UNIQUE SIMILAR
REGIONS
13
12 PCR Products for Unique Similar Regions
More complicated is the design of FISH probes for unique similar sequences.
These
FISH probes bind multiple similar targets that are all located within a single simi-
lar region. The unique similar sequences are dened by the non-zero regions in the
histogram of the unique repeats (Section 9).
The PCR product length is limited by the
min_sim_pcr
and
max_sim_pcr
param-
eters. These values are selected as described in the previous Section 11 with the dierence in mind, that these FISH probes bind repetitive targets and thus bind sequences of
overall length exceeding their own. Unique similar FISH probes prepared from shorter
PCR products can be tolerated because they give rise to stronger uorescence signal
compared to the unique probes. The default
min_sim_pcr
value is 2000.
Providing that any unique similar sequences are present within the query, a large
number of suitable PCR products is likely to be identied. Each of these PCR products
or its portions are similar to multiple sites within the same similar region. The FISH
probes obtained from these PCR products would also bind sequences exceeding their
own length. The PCR product which is similar to the longest overall pool of sequences
is selected as the best PCR product for unique similar FISH probe production (Figure
a
12.1 ). Additionally, combinations of 2 to 5 best PCR products are selected from the
b
pool (Figure 12.1 : only two best FISH probes are displayed). This oers the user the
alternative to decide on the number of FISH probes that must be produced to a label
sucient amount of DNA for adequate uorescence signal.
13 Restricted Sequences
The user is given the option to select a range of positions within the query which should
be excluded from the analysis. It becomes desirable if the DNA template for the PCR
reaction (BAC or plasmid) is available for only part of the query and the cloning primers
must be selected only form this template. The range of sequences restricted from the
search is specied by the
restrict_sequence parameter obeying the following format.
The start and end positions of the restricted sequence within the query are separated
14
GRAPHICAL OUTPUT
14
a
0
50k
100k
150k
200k
250k
300k
(a) Single unique repetitive FISH probe binds ve similar sites.
b
a
0
50k
100k
150k
200k
250k
300k
(b) Two best unique repetitive FISH probes extend the labeled length of the ve similar sites.
Figure 12.1:
Unique Similar FISH Probes.
The optimized unique similar FISH
probes are made of sequences highlighted by the empty blue rectangles. Their binding
sites also span all sequences similar to each probe which are emphasized by the lled
blue rectangles displayed in the same row as the respective FISH probe.
by a comma (,). Semicolon (;) separates several restricted sequence in each query and
the pipe symbol (|) separates restricted sequences if multiple queries are submitted
simultaneously.
Restricted sequences are automatically dened for positions of the query sequence
which contain other values than the standard bases ACGT. An example of this would
be the human T cell receptor
β
locus which is not fully sequenced and it contains two
regions with sequences entirely consisting of undened bases N (Figure
?? b).
14 Graphical Output
While the PCR cloning primers for FISH probe templates production are the most
important results of the analysis, a graphical output is crucial for understanding and
interpreting the results. It provides a highly-customizable graphical representation of
the query sequence with the distribution of unique, similar (Section 6), and unique
similar (Section 9) sequences. The the binding sites for the optimized FISH probes
(Sections 11 and 12) are emphasized along with the optional reference sequences such
as genes (Section 14.4).
The conguration le parameters allow the user to choose
14
GRAPHICAL OUTPUT
15
which features should be displayed, enable their annotation, and modify their colors.
By default all the options are enabled and a standard colors are provided. The detailed
description of each parameter is described in the available conguration le. Only the
most important ones are introduced here.
14.1
Similar Sequence Distribution
The background of the graphical output is composed of a map splitting the query
into unique sequences, similar sequences, and unique similar sequences.
They are
further distinguished by a darker tint if they are part of a similar region (Figure 9.1).
Each sequence type can be assigned a dierent color by the parameters
sim_color, tint_uniq_color tint_sim_color,
and
uniq_sim_color.
uniq_color,
The colors are
specied by comma separated vector of its RGB components ranging from 0 to 255.
The background map can be enabled and disabled by the
14.2
plot_area
parameter.
Sequence Grouping into Regions
The contiguous unique regions of the minimum required length (see Section 8) can
be highlighted by rectangles spanning each region by setting the
plot_uniq_reg
pa-
rameter. They are label Uxx where xx is an integer distinguishing one from another.
The color of the rectangle is specied by
uniq_pcr_color
parameter.
Similarly, the
contiguous similar regions -marking rectangles can be enabled by the
plot_sim_reg
parameter. They are labeled Sxx where xx are the distinguishing integers. Their color
is determined by the
sim_pcr_color
parameter. Distribution of regions in the default
sequence is displayed in Figure 8.1.
14.3
PCR Products
The positions of the PCR products for unique FISH probe production (Section 11)
are displayed if
plot_uniq_pcr
is set (Figure 11.1). Their positions in the query are
highlighted by rectangles of color is dened by
uniq_pcr_color.
The naming strategy
for the PCR products changes if the unique regions are displayed or not (see previous
14
GRAPHICAL OUTPUT
16
Section). When disabled (plot_uniq_reg is 0), the PCR products are labeled with the
letters of alphabet applied in an increasing order (i.e.
A-Za-z).
Otherwise, they are
given the name of the respective region and a letter if more than one PCR product is
contained in a single region.
Similar labeling convention applies to the unique similar PCR products (Section
plot_sim_pcr parameter (Figure 12.1).
sim_pcr_color parameter. Unlike with the unique
12) enabled by the
Their color is determined
by the
PCR products which are
plotted side-by-side, each unique similar PCR product is plotted on a separate line of
b
the graphical output (Figure 12.1 ). This provides space for marking the positions of
sequences similar to each PCR product.
lled rectangles with the color dened by
14.4
These similar sequences are highlighted by
mistarget_color
if
plot_mistarget
is set.
Reference Sequences
Apart from the analyzed query sequence, the user may provide a second FASTA le
containing one or more reference sequences such as genes, their exons or regulatory
sequences. These reference sequences are plotted in their respective positions as empty
rectangles with their color specied by the
the user-supplied FASTA le
4
genes_color
parameter. Each sequence in
is preceded by its name which is displayed inside the
rectangle (Figure 14.2). The sequence names can take advantage of the advanced for-
AT X which for example allows to display Greek letters by
matting options oered by L
E
typing a backslash followed by their English name, i.e. \mu or \sigma. Underscore
_, i.e.
_{your-text} would dene subscripts, while the power symbol ^ super-
script. The line dening the sequence name for the IGHG3 gene would then look the
following: >\gamma_{3} and it would display
14.5
γ3
in the graphical output.
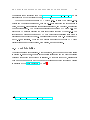
Horizontal Axis
The readability and arrangement of the query features are enhanced by the horizontal
axis divided into multiple intervals. It can be enabled and disabled by the
4 http://www.ncbi.nlm.nih.gov/blast/fasta.shtml,
December 2010
plot_axis
14
GRAPHICAL OUTPUT
0
50k
Figure 14.1:
17
100k
150k
200k
250k
300k
Horizontal Axis simplies visual alignment of features in the resulting
graphical output.
parameter. Its text annotation position below (1) or above (0) the axis is determined
axis_topbottom. The axis normally starts with 0 but can be oset by any value by
axis_offset if desired.
by
14.6
Annotation of the Output
Depending on the
plot_labels
value, the graphical output can be annotated with a
title bearing the user-provided name of the query, the chromosome number and the
studied species and the X-axis and histogram would be labeled with their limiting
values. The letter sizes used for the annotation and their type-face can also be dened
through the conguration le.
14.7
Output Format
The graphical output is produced as an image in EPS vector format which allows scaling
without resolution limits and even manual editing of the content.
be converted into a bitmap formatted image using the
Optionally, it can
graph_format
parameter and
selecting one of the following options: -dpng, -djpeg, -dti or the other formats listed
in the conguration le.
14.8
dpi_res
determines the resolution of the bitmap le in DPI.
Output Mirroring
Sometimes the genes contained in the query sequence are organized on the chromosome
in a reversed order compared to the intuitive expectation.
For instance, the human
IgM immunoglobulin heavy chain constant region gene is functionally upstream of the
other constant region genes but it is localized closer to the end of the chromosome.
To overcome this confusing arrangement, the displayed sequence can be mirrored by
setting the
rev_xaxis
to 1 instead of the default 0.
14
GRAPHICAL OUTPUT
α2
0
50k
ε
γ4
18
γ2
α1
100k
150k
γ1
γ3
200k
δ
250k
µ
300k
105.99M
106.34M
Position on Chromosome 14 of Homo Sapiens
(a) rev_xaxis 0
µ
γ3
δ
0
50k
100k
γ1
α1
150k
γ2
γ4
200k
ε
250k
α2
300k
106.34M
105.99M
Position on Chromosome 14 of Homo Sapiens
(b) rev_xaxis 1
Output mirroring enabled by rev_xaxis parameter mirrors the content
of the graphical output. a) Human immunoglobulin heavy chain constant region genes
Figure 14.2:
as they are ordered and oriented on human chromosome 14.
intuitive because rst to the left is the IgA2
Their order is contra-
(α2 ) gene while the last one is IgM (µ).
b)
The same query sequence with genes was horizontally mirrored to obtain the expected
order.
15
TEXTUAL REPORT
19
File ending
Content
.primer.txt
Summary of all primer sequences.
.unique_segs.txt
Primer sequences for unique FISH probes, complete
PCR product sequences, restriction endonuclease site
presence.
.nonunique_segs.txt
Primer sequences for all unique similar FISH probes,
complete PCR product sequences, restriction
endonuclease site presence.
.nonunique_segs-N.txt
Selection of primer sequences for the N best unique
similar FISH probes, complete PCR product
sequences, restriction endonuclease site presence.
XXX.primers.txt
Detailed analysis for each primer pair including
alternative primer pairs.
.genconf
Conguration le generated in the analysis.
.log
Log le of the analysis.
Table 2:
Textual reports.
The analysis report is provided in a number of les whose
names and contents are summarized in this table.
15 Textual report
Text reports are generated alongside the graphical output. These les contain all information about the cloning PCR primers designed for the production of specic FISH
probe templates. Their contents are summarized in Table 2. They provide details on
the primer sequences, their positions in the query sequence, the complete PCR products sequences which are necessary for verication of any plasmids produced using these
primers, and the presence of restriction endonucleases recognition sites within the PCR
products.
16 Mega BLAST Alignment Parameters
The query sequence is aligned to the genome using the Mega BLAST algorithm.
It
was introduced in the Section 5 without providing any details which would disrupt
the ow of the Chapter and they will be introduced in the following Sections with the
16
MEGA BLAST ALIGNMENT PARAMETERS
20
assumption that the reader is already familiar with the algorithm and its requirements.
5
The genome sequence used for the alignment is obtained from the Ensembl project .
The quality of the genome assembly varies among the species. Some of the less investigated genomes are assembled into a single contiguous database not accounting for
the individual chromosomes. In others, it is assembled into sequences of the individual
chromosomes, mitochondrial, and nonchromosomal DNA. The nonchromosomal DNA
databases contain assembled sequences that could not have been ordered or oriented
onto one of the chromosomes so far. The most studied genomes also include patch
and haplotype sequences. The patch sequences contain newly sequenced parts of the
genomes and amended sequences obtained by improved techniques which might in the
future be incorporated into the main chromosomal assemblies. However, certain parts
of the genome are highly susceptible to changes between dierent organisms of the
same species. This prevents the determination of the invariable genome sequence for
that species. Typically, this occurs with polymorphic genes such as the natural killer
cell immunoglobulin-like receptor (Section
??),
(MHC), or the color pattern of butteries.
the major histocompatibility complex
The haplotype databases contain such
alternative sequences of the variable loci acquired from dierent organisms (
?
and
?).
The type and quality of the genome assembly inuences the function and performance of the algorithm and is discussed in the next two paragraphs.
16.1
Genomes in Single Sequence
The genome sequences assembled into a single le not accounting for the individual
chromosome are divided number of sequence database les to speed up the alignment
to such genomes.
The genome fractioning is done at random positions which would
impede alignment if the query sequence would overlap with one of these breaks. Due
to the size of each genome, and the very small number of such articial breaks, it is
highly unlikely to ever occur.
5 ftp://ftp.ensembl.org/pub/current_fasta/
17
MEGA BLAST ALIGNMENT IMPORT
16.2
21
Genomes with Patches and Haplotypes
The patches and haplotypes for the chromosomal sequences are typically not used for the
alignment to save computation time and to avoid undesired introduction of duplicated
or similar sequences. The user has the option to enable them by setting
and
include_haplo
include_patch
to 1.
17 Mega BLAST Alignment Import
This Section discusses an important
bit_score parameter which determines the thresh-
old between similar and unique sequences.
It is linked to the alignment introduced
above (Section 16).
The distribution of the similar and unique sequences detected in the query will
depend on the setting of this threshold.
It also inuences the specicity of the pro-
duced FISH probes which is partially determined by the presence of similar sequences
throughout the genome.
There is no direct characterized link between the sequence
similarity obtained by Mega BLAST and the FISH probe's tolerance for mismatches
and therefore it must be determined empirically. To obtain it, it was assumed that the
similar sequence stretch should be at least the length of the FISH probes and exceed
similarity of 85 %.
The Mega BLAST delivers positions of the similar sequences sorted by their bit
score
6
value which reects the length and the number of mismatches and gaps between
the two compared sequences. The minimum required bit score for an alignment to be
processed is dened by the
6 Bit
bit_score
value. By default, it is set to 200. This sets the
score is calculated from the raw score being the sum of scores of all mismatches, gaps, and
extensions of the compared sequences. The penalties for a mismatch, gap occurrence and gap extension
depend on a lookup table called the substitution matrix whose values are proportional to the natural
likelihood of occurrence of these mutations, insertions or deletions. The raw score is dependent on the
parameters of the substitution matrix and therefore raw scores obtained from alignments using dierent
substitution matrices are not comparable. The bit score unlike the raw score is normalized in respect
to the substitution matrix values and therefore even bit scores obtained using dierent substitution
matrices can be directly compared. Both scores are closely related to the expectation value introduced
in the Section 5. This is equivalent to the number of alignments with raw scores better than the current
one which would occur in the query and database sequences by random chance.
18
WWW INTERFACE
22
lower limit for the similar sequences in the human genome to
85.2 ± 1.5.
with the percentage similarity of
260 ± 40
bases in length
The length matches the FISH probe size
which is preferably between 100 and 300 bases.
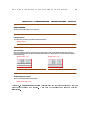
Lower
a
17.1 ).
bit_score value might be desirable for designing unique
FISH probes (Figure
The lower bit score threshold decreases the stringency of the search for the
similar sequences, making the resulting FISH probes more specic for their targets and
less likely to bind other parts of the genome.
Higher
bit_score,
on the other hand, might increase the quality of the designed
unique similar FISH probes as long as it does not mask presence of similar sequences
found elsewhere in the genome which would lead to production of nonspecic unique
similar FISH probes. Therefore, the
bit_score
can be increased only if it does not
c
result in longer overall stretch of unique similar FISH (Figure 17.1 ).
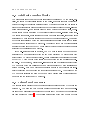
The implications of changing the
bit_score values should be understood and taken
into account when designing the FISH probes. Repeating the algorithm with several
bit_score
values might be desirable before deciding which is the optimal set of FISH
probes to be used. All FISH probes used in the experiments presented in this thesis
were designed with the
bit_score
value of 200.
18 WWW Interface
The user interface of the FISH probe optimization algorithm is achieved through an
7
Internet page . The page has four main sections. The Introduction explains the usage
and applications of the algorithm while Protocols provide technical advice on cloning
and FISH probe production. The Standard Designer allows the user to upload a query
sequence, select a target species, provide an email address, and upload optional reference
sequence le. The Advanced Designer in addition requires upload of an user-supplied
conguration le (Figure 18.1).
Once analysis is successfully completed, a new page
with summary of the results is provided (Figure 18.2) and a notication email is sent
to the user-specied address. The data is kept on the server for one week for the user
7 http://www.nanoimaging.uni-jena.de/sh/
18
WWW INTERFACE
23
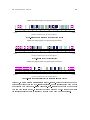
Similar and Unique Regions in Target Region ’Human-CH’
D
C
0
a
50k
100k
150k
200k
B A
250k
300k
106.34M
105.99M
Position on Chromosome 14 of Homo Sapiens
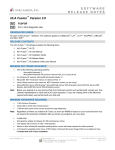
(a) bit_score 0: High stringency for unique FISH probes
Similar and Unique Regions in Target Region ’Human-CH’
H
G
F
0
E
D
C
50k
a
100k
150k
200k
B A
250k
300k
106.34M
105.99M
Position on Chromosome 14 of Homo Sapiens
(b) bit_score 200: Compromise value
Similar and Unique Regions in Target Region ’Human-CH’
O N
M
L K J
0
I
50k
H
G
F
E
a
100k
D
150k
200k
250k
C
B
A
300k
106.34M
105.99M
Position on Chromosome 14 of Homo Sapiens
(c) bit_score 1000: High stringency for unique similar FISH probes
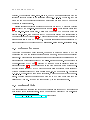
FISH Probe dependence on bit_score. Highly specic unique FISH
probes are obtained with low bit_score values (a). Highly similar unique FISH probes
are obtained with higher bit_score values (c). Bit_score of 200 oers a compromise
between both extremes (b). It reects the average minimum cut-o value of 260 bases
Figure 17.1:
for similar sequences which is similar to the size of the FISH probe molecules.
19
TECHNICAL DETAILS OF THE SOFTWARE AND HARDWARE
24
for viewing and download.
18.1
Data Safety
The design of the web site oers a compromise between data safety on one side and the
usability with simplicity on the other. The user stays anonymous without the need to
provide any login details or further information and the results are accessible exclusively
to the user for one week following their completion. None of the data submitted to the
web server is publicly available, yet it could be potentially viewed by a third-party
exerting a concentrated hacking eort.
Privacy Protection Means
Each user submission to the web server is given a unique 11 to 16 digit tag without
which the data cannot be accessed by anybody else. It consists of an ever increasing
10 digit number distinguishing the queries by the time of their submission.
This is
followed a randomly generated 1 to 6 digit number separated by a dash.
The user submitted query including the DNA sequences, conguration les and the
email address are kept on the server only for a short time before it is safely stored for
analysis. The email address is only kept during the analysis and destroyed after sending
the notication email.
The results are irrecoverably destroyed a week after nishing
the analysis.
The web server communicates with the Internet browser of the user through a nonencrypted connection which is the common case for similar research tools intended for
the scientic community.
19 Technical Details of the Software and Hardware
The analysis software and the web server operates on a single computer featuring AMD
Athlon II X2 240e processor and 4 GB of RAM installed with Debian 5.0 GNU Linux
operating system.
The server is physically located at King's College London with
19
TECHNICAL DETAILS OF THE SOFTWARE AND HARDWARE
25
INTRODUCTION | STANDARD DESIGNER | ADVANCED DESIGNER | PROTOCOLS
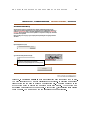
ADVANCED DESIGNER (1)
Advanced designer searches for specific FISH probes within the provided DNA sequence using the
settings from your uploaded configuration file. You may modify and use the configuration file obtained as a
result of the standard designer query or the default configuration file can be downloaded in text format and
PDF format. Note that the PDF version cannot be uploaded. It is only meant for viewing. Only unformatted
raw text files can be uploaded.
Before proceeding to the next page, copy the captcha password protecting the server againgst automatic
web attacks.
Upload Configuration File (.conf):
Browse…
Type in the CAPTCHA password shown right:
Phonetic spelling (mp3)
Please copy the grainy captcha code which you see on the right.
Itis importantto use captcha to distinguish your genuine inquiry
fromautomatic robots repeatedly submitting the forms and overloading the server.
Next Page
Figure 18.1:
Advanced Designer shows typical layout used throughout the web site.
The page is introduced by a short description of its content. It contains a le upload
dialog button for the user to upload a conguration le. The safety password image
at the bottom right to protect the page from automated attacks. At the bottom is a
submission button leading to the next page. Hint buttons
reveal information dialogs
to aid the user. The menu bar at the top simplies the page navigation.
19
TECHNICAL DETAILS OF THE SOFTWARE AND HARDWARE
26
INTRODUCTION | STANDARD DESIGNER | ADVANCED DESIGNER | PROTOCOLS
QUERY FINISHED
Your query has been processed. Below you can see the result.
COMPLETE PROJECT
The zip file provides a convenient way to download the complete project directory.
1294450611-139937.zip
OUTPUT GRAPHICS
Here you can download the output images with the sequence map, the optional gene positions, and the optimized FISH probe positions. Each image
comes in EPS vector graphic format and a bitmap format which by default is PNG. To get a different output format or resolution modify the configuration
file and resubmit the query.
1294450611-139937_1_1.eps
1294450611-139937_1_2.eps
1294450611-139937_1_1.png
1294450611-139937_1_all.png
FILE WITH UNIQUE FISH TARGETS
This is a list of all the optimized unique FISH probe targets.
1294450611-139937.unique_segs.txt
Figure 18.2:
Result output consists of clearly laid out graphical outputs and textual
reports for download and viewing.
illustration.
Only part of the result page is shown here for
19
TECHNICAL DETAILS OF THE SOFTWARE AND HARDWARE
27
the Internet trac redirected from the http://www.nanoimaging.uni-jena.de/ domain
server located at the University of Jena, Germany.
The core of the software runs in GNU Octave 3.2.4. It calls NCBI Blast 2.2.18.2
performing the sequence alignment, Primer3 2.2.2-beta searching for optimal primer
pairs, Emboss 5.0.0 for restriction endonuclease site search, and Gnuplot 4.2 generating
the graphical output.
The website user interface is operated by Apache 2.2.9 web
server with CGI scripts handling the user input values executed by Perl 5.10.0. The
individual web pages are written in HTML with JavaScripts controlling their dynamic
features such as the hint buttons
. Emails are sent through Exim 4.69 email server by
mutt 1.5.18 email client. Other common programs supplied with Debian GNU Linux
distribution are used for scheduling, data parsing, and le handling.
19.1
Task Scheduling
The script runs in an indenite loop. Every 60 seconds, check for a new query submission
is performed. In such case, the loop is temporarily interrupted and the query processing
described throughout the Section
?? is initiated.
At the start of each day, results older
than one week are removed and the genome databases are updated if their new version
8
is available at the Ensembl project FTP site .
8 ftp://ftp.ensembl.org/pub/current_fasta/,
January 2011