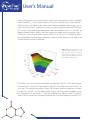
1
qPCR Application Guide Experimental Overview, Protocol, Troubleshooting I N T EG R AT E D DNA T E C H N O LO G I E S ©2010 Integrated DNA Technologies User’s Manual qPCR Application Guide Experimental Overview, Protocol, Troubleshooting 1. Introduction . . . . . . . . . . . . . . . . . . . . . . . . . . . . . . . . . . . . . . . 5 1.1 Advantages of qPCR . . . . . . . . . . . . . . . . . . . . . . . . . . . . . . . . . . . 5 1.2 Types of qPCR . . . . . . . . . . . . . . . . . . . . . . . . . . . . . . . . . . . . . . . 6 1.2.1 5’ Nuclease Assay . . . . . . . . . . . . . . . . . . . . . . . . . . . . . . . . . 7 1.2.2 Molecular Beacons . . . . . . . . . . . . . . . . . . . . . . . . . . . . . . . . 8 1.2.3 Hybridization/FRET Probes . . . . . . . . . . . . . . . . . . . . . . . . . . . . 9 1.2.4 ScorpionsTM Probes . . . . . . . . . . . . . . . . . . . . . . . . . . . . . . . . 10 1.2.5 Intercalating Dyes . . . . . . . . . . . . . . . . . . . . . . . . . . . . . . . . . 11 1.3 qPCR Workflow . . . . . . . . . . . . . . . . . . . . . . . . . . . . . . . . . . . . . 12 2. Total RNA Isolation . . . . . . . . . . . . . . . . . . . . . . . . . . . . . . . . . . 13 2.1 Isolate . . . . . . . . . . . . . . . . . . . . . . . . . . . . . . . . . . . . . . . . . . . 13 2.2 Quantify . . . . . . . . . . . . . . . . . . . . . . . . . . . . . . . . . . . . . . . . . . 14 2.3 Check Quality . . . . . . . . . . . . . . . . . . . . . . . . . . . . . . . . . . . . . . 14 2.4 Avoid RNases, DNases . . . . . . . . . . . . . . . . . . . . . . . . . . . . . . . . . 15 3. Perform Reverse Transcription . . . . . . . . . . . . . . . . . . . . . . . . . . . 18 4. Real-Time PCR Design and Protocols . . . . . . . . . . . . . . . . . . . . . . . 20 4.1 5’ Nuclease Assay Design . . . . . . . . . . . . . . . . . . . . . . . . . . . . . . . 21 4.1.1 Primers and Probes . . . . . . . . . . . . . . . . . . . . . . . . . . . . . . . . 21 4.1.1a Calculating Melting Temperature (Tm) . . . . . . . . . . . . . . . . 23 4.1.2 Choosing the Correct Fluorescent Label for the Instrument . . . . . . . 25 4.1.3 Multiplex qPCR . . . . . . . . . . . . . . . . . . . . . . . . . . . . . . . . . . 27 4.1.4 Selecting the Right Controls . . . . . . . . . . . . . . . . . . . . . . . . . . 29 4.1.4a Negative Controls . . . . . . . . . . . . . . . . . . . . . . . . . . . . 29 4.1.4b Positive Controls . . . . . . . . . . . . . . . . . . . . . . . . . . . . . 29 4.2 PrimeTime qPCR Assay PCR Protocol . . . . . . . . . . . . . . . . . . . . . . . . 32 4.2.1 Resuspension Protocol . . . . . . . . . . . . . . . . . . . . . . . . . . . . . 32 4.2.1a Avoiding Probe Degradation . . . . . . . . . . . . . . . . . . . . . 33 4.2.2 Assay Protocol . . . . . . . . . . . . . . . . . . . . . . . . . . . . . . . . . . 33 4.2.2a Master Mixes . . . . . . . . . . . . . . . . . . . . . . . . . . . . . . . . 35 2 5. Assay Validation . . . . . . . . . . . . . . . . . . . . . . . . . . . . . . . . . . . . 37 5.1 Standard Curves . . . . . . . . . . . . . . . . . . . . . . . . . . . . . . . . . . . . . 37 5.1.1 Range of Dilution . . . . . . . . . . . . . . . . . . . . . . . . . . . . . . . . . 37 5.1.2 Template . . . . . . . . . . . . . . . . . . . . . . . . . . . . . . . . . . . . . . 37 5.2 PCR Efficiency . . . . . . . . . . . . . . . . . . . . . . . . . . . . . . . . . . . . . . 39 5.3 Linear Dynamic Range . . . . . . . . . . . . . . . . . . . . . . . . . . . . . . . . . 39 5.4 Limit of Detection (LOD) . . . . . . . . . . . . . . . . . . . . . . . . . . . . . . . . 39 5.5 Precision and Variability . . . . . . . . . . . . . . . . . . . . . . . . . . . . . . . . 40 6. Analyze Data . . . . . . . . . . . . . . . . . . . . . . . . . . . . . . . . . . . . . . 41 6.1 Setting the Baseline . . . . . . . . . . . . . . . . . . . . . . . . . . . . . . . . . . 41 6.2 Setting the Threshold . . . . . . . . . . . . . . . . . . . . . . . . . . . . . . . . . 42 6.3 Determining Gene Expression Changes . . . . . . . . . . . . . . . . . . . . . . 43 6.3.1 Absolute Quantification . . . . . . . . . . . . . . . . . . . . . . . . . . . . . 43 6.3.2 Relative Quantification . . . . . . . . . . . . . . . . . . . . . . . . . . . . . . 43 6.3.2a Normalization . . . . . . . . . . . . . . . . . . . . . . . . . . . . . . . 44 Efficiency-Corrected Gene Expression Measurements . . . . . . 46 6.4 Qualitative Analysis . . . . . . . . . . . . . . . . . . . . . . . . . . . . . . . . . . . 47 7. PrimeTime Assay Troubleshooting . . . . . . . . . . . . . . . . . . . . . . . . 48 7.1 Baseline . . . . . . . . . . . . . . . . . . . . . . . . . . . . . . . . . . . . . . . . . . 49 7.2 Assay Design . . . . . . . . . . . . . . . . . . . . . . . . . . . . . . . . . . . . . . . 50 7.3 Probe and Primer Degradation . . . . . . . . . . . . . . . . . . . . . . . . . . . . 52 7.4 Sample Expression . . . . . . . . . . . . . . . . . . . . . . . . . . . . . . . . . . . 54 7.5 Incorrect Reaction Setup . . . . . . . . . . . . . . . . . . . . . . . . . . . . . . . 54 7.6 Instrument . . . . . . . . . . . . . . . . . . . . . . . . . . . . . . . . . . . . . . . . 55 7.7 Threshold . . . . . . . . . . . . . . . . . . . . . . . . . . . . . . . . . . . . . . . . . 56 7.8 RNA Sample Quality . . . . . . . . . . . . . . . . . . . . . . . . . . . . . . . . . . 57 7.9 Design Specificity . . . . . . . . . . . . . . . . . . . . . . . . . . . . . . . . . . . . 59 7.10 Passive Reference Problem . . . . . . . . . . . . . . . . . . . . . . . . . . . . . . 59 7.11 Multiplexing . . . . . . . . . . . . . . . . . . . . . . . . . . . . . . . . . . . . . . 59 7.12 Primer-Primer or Primer-Probe Interaction . . . . . . . . . . . . . . . . . . . . 60 7.13 Genomic DNA Contamination . . . . . . . . . . . . . . . . . . . . . . . . . . . 60 7.14 Amplicon Contamination . . . . . . . . . . . . . . . . . . . . . . . . . . . . . . 61 7.15 Standard Curves . . . . . . . . . . . . . . . . . . . . . . . . . . . . . . . . . . . . 62 7.16 Master Mix . . . . . . . . . . . . . . . . . . . . . . . . . . . . . . . . . . . . . . . 64 7.17 Normalization . . . . . . . . . . . . . . . . . . . . . . . . . . . . . . . . . . . . . 67 7.18 Reaction Parameters . . . . . . . . . . . . . . . . . . . . . . . . . . . . . . . . . 68 8. References . . . . . . . . . . . . . . . . . . . . . . . . . . . . . . . . . . . . . . . 70 3 User’s Manual 1. Introduction This qPCR Application Guide is intended to provide guidance to users on the entire qPCR process, from RNA isolation to data analysis. This document should be used to obtain a basic understanding of all that is involved in the experimental setup, performance, and analysis. The guide begins with a general overview of qPCR and then provides more specific information regarding the 5’ nuclease assay, including specific resuspension and qPCR protocols and a troubleshooting section for common problems that arise in the process. Importantly, this document follows the recommendations provided in the MIQE Guidelines: Minimum Information for Publication of Quantitative Real-Time PCR Experiments1, which is a definitive guide and excellent resource for all of the necessary requirements for experimental setup, analysis, and publication. 1.1 Advantages of qPCR Quantitative real-time PCR (qPCR) has become the most precise method for analyzing gene expression. Prior to qPCR, the most common methods for determining expression levels were Northern blotting, RNase protection assays, or traditional reverse transcription (RT) PCR. RT-PCR was an improvement over the older methods due to its ease of use and the much smaller amounts of RNA needed for the reaction. However, with this method, the expression levels can only be observed after the completion of the entire reaction by running part of the reaction on an agarose gel. While traditional RT-PCR can be useful for determining the presence or absence of a particular gene product, qPCR has the advantage of measuring the starting copy number and detecting small differences in expression levels between samples. With qPCR, investigators can observe the entire amplification curve and eliminate the step of running a gel, which will reduce both the amount of time the process takes and the chance of contamination. Thus, amplification and quantification can occur simultaneously. A typical PCR amplification plot has an exponential, linear, and plateau phase (Figure 1). The amplification reaches a plateau as the reaction components are exhausted. Thus, by waiting until the end of the reaction to view the amplification, only the final plateau is observed and any differences User’s Manual in initial abundance are obscured. In contrast, qPCR quantifies the PCR products while the amplification is in progress. Fluorescent reagents assist this process by allowing the amplification to be measured while the reaction is still ongoing by use of a fluorescence detector in conjunction with the thermal cycler. This allows analysis of the entire amplification curve rather than only at an end point. Figure 1. qPCR Amplification Plot showing baseline, exponential, and plateau regions of the amplification curve. Plateau Region Exponential Region Baseline Region 1.2 Types of qPCR Current real-time applications require the use of fluorescent reagents in order to measure the amount of product amplified. These fluorescent reagents can be either sequencespecific or non-sequence-specific. Common sequence-specific reagents include 5’ nuclease probes (including PrimeTime and TaqMan® probes), molecular beacons, hybridization/FRET (Fluorescence Resonance Energy Transfer) probes, and Scorpions® probes. The most common non-sequence-specific reagents are intercalating dyes such as SYBR® Green I or EvaGreen®. 6 1.2.1 5’ Nuclease Assay The 5’ nuclease chemistry utilizes two primers, a probe, and the exonuclease activity of Taq DNA polymerase2. • The DNA probe is non-extendable and labeled with both a fluorescent reporter and a quencher, which are maintained in close proximity to each other as long as the probe is intact (Figure 2). Due to the presence of the quencher on the 3’ end, the polymerase cannot extend from the probe. • As long as the probe is intact, the quencher will absorb the energy emitted by the reporter dye. • Because all three components, the two primers and one probe, must hybridize to the target, this approach leads to greater specificity and detection accuracy of the PCR product amplified. In addition, different probes can have different fluorophores, which will allow multiple targets to be simultaneously detected in a single reaction3, 4 See section 4.1.3 for more information on multiplexed reactions. • Once the primers and probe hybridize to the target and the primers begin to be extended, the 5’ to 3’ exonuclease activity of the polymerase during extension will hydrolyze the probe and the fluorophore and quencher will dissociate from the target. The spatial separation of reporter and quencher will disrupt the ability of the quencher to absorb energy emitted from the reporter and, thus, a substantial increase in reporter dye fluorescence will occur5. The fluorescence produced during each cycle is measured during the extension phase of the PCR reaction. • Examples of nuclease assays include PrimeTime qPCR Assays or TaqMan® assays. D D 7 D Q D Q Q Q Figure 2. 5’ Nuclease Assay. In step one, the primers and probe hybridize in a sequence-dependent manner to the complementary DNA strand. Because the probe is intact, the fluorophore and quencher are in close proximity and the quencher absorbs fluorescence emitted by the fluor. In step two, the polymerase extends from the primers and begins DNA synthesis. In step three, the polymerase reaches the probe and the exonuclease activity of the polymerase cleaves the hybridized probe. As a result of cleavage, the fluorophore is separated from the quencher so that the quencher no longer absorbs the fluorescence emitted by the fluor. This fluorescence is detected by the real-time instrument. In step four, the polymerase continues extension of the primers to finish synthesis of the DNA strand. User’s Manual 1.2.2 Molecular Beacons Molecular beacons are dual-labeled probes that form stem-loop hairpins with the loop sequence complementary to the gene target6. • The beacons are labeled with a 5’ fluorophore and a 3’ quencher. The stem region is designed such that, at annealing temperature and in the absence of target, the ends of the beacon are held closely together, which allows the quencher to absorb the fluorescence from the reporter (Figure 3). • If the probe finds and hybridizes to its target sequence during the annealing phase of the PCR reaction, the quencher will no longer be in close proximity to the fluorophore and the reporter will fluoresce7. • The probe will dissociate at the 72°C extension step and will remain uncleaved and able to participate in the next round of synthesis. Molecular beacons will thermodynamically favor the hairpin structure over a non-specific target sequence, which makes the probes highly specific. A perfect match probetarget hybrid will be energetically more stable than the stem-loop structure, whereas a mismatched probe-target hybrid will be energetically less stable than the stem-loop structure8. D D Q Q D Q D Q Figure 3. Molecular Beacons. In step one, the primers hybridize in a sequence-dependent manner to the complementary DNA strand. The molecular beacon is held together in a hairpin with the fluorophore and quencher in close proximity so that the quencher absorbs the fluorescence emitted by the fluor. In step two, the polymerase extends from the primers and begins DNA synthesis. The probe hybridizes to the highly specific complementary target sequence, which separates the fluorophore and quencher so that the quencher no longer absorbs the fluorescence emitted by the fluor. The fluorescence is detected by the real-time instrument. In steps three and four, the polymerase continues extension of the primers to finish synthesis of the DNA strand and the molecular beacon reforms into the hairpin structure. 8 1.2.3 Hybridization/FRET Probes Hybridization/FRET probes consist of two separate fluorescent probes; one probe is labeled on the 3’ end and the other is labeled on the 5’ end. • The 3’ end of the probe also contains a phosphorylation modification so that the probe will not be extended. • The primers amplify the target and the two probes hybridize to the target in a head-to-tail configuration, which brings the two fluorophores near each other. • A light source is used to excite the donor fluorophore which will then, through FRET (Fluorescence Resonance Energy Transfer), transfer its energy and excite the acceptor reporter fluorophore. • The detector is set to read the wavelength of the acceptor reporter fluorophore. • In order for the energy transfer to occur, the spectra of the two fluorophores must overlap so that the donor fluorophore can excite the acceptor fluorophore. • These types of probes require dedicated machinery in order to excite the donor fluorophore. The LightCycler® thermocycling real-time PCR system from Roche is designed for these types of probes. IDT offers synthesis of the probes, as well as the primers, needed for this system. Figure 4. Hybridization/FRET Probes. In step one, the primers hybridize in a sequence-dependent manner to the complementary DNA strand. The two probes remain distant so the donor is not able to activate the acceptor. In step two, the polymerase extends from the primers and begins DNA synthesis. The two probes hybridize to the complementary target sequence, which brings the two fluorophores into proximity. The activated donor fluorophore will transfer its energy to the acceptor reporter fluorophore. The fluorescence of the reporter fluorophore will be detected by the real-time instrument. In steps three and four, the polymerase continues extension of the primers to finish synthesis of the DNA strand; the probes detach from the sequence and move apart. A D D A A 9 A D D User’s Manual 1.2.4 ScorpionsTM Probes ScorpionsTM probes consist of a primer covalently linked to a spacer region followed by a probe that contains a fluorophore and a quencher. • The probe contains a specific, complementary target sequence, a spacer region which forms a self-complementary stem, a fluorophore, and an internal quencher all contiguous with the primer. • When not bound to the target, the probe remains in a stem-loop structure, which keeps the quencher and fluorophore proximal and allows the quencher to absorb the fluorescence emitted from the fluorophore. • During PCR, the primer will bind to the target and go through the first round of target synthesis. Because the primer and probe are connected, the probe will be attached to the newly synthesized target region. The spacer region prevents the DNA polymerase from copying the probe region and disrupting the stem structure. • Once the second cycle begins, the probe will denature and hybridize to the target, which will allow the fluorophore and quencher to be separated and the resulting fluorescence emission can be detected. D Q D Q D Q Q D Figure 5. ScorpionsTM Probes. In step one, the primers hybridize in a sequence-dependent manner to the complementary DNA strand. The probe is attached to the primer and remains in a hairpin structure with the fluorophore and quencher in close proximity so that the quencher absorbs the fluorescence emitted by the fluor. In step two, the polymerase extends from the primers and begins DNA synthesis. In step three, extension continues and will create the complementary sequence for the probe. In step four, the probe hybridizes to the highly specific complementary target sequence of the newly synthesized strand, which separates the fluorophore and quencher so that the quencher no longer absorbs the fluorescence emitted by the fluor. The fluorescence is detected by the real-time instrument. 10 1.2.5 Intercalating Dyes Intercalating dyes are non-sequence-specific fluorescent dyes that exhibit a large increase in fluorescence emission when they bind into double-stranded DNA. Examples include SYBR® Green I , the Cyto family of dyes, EvaGreen®, and LC dyes9, 10. During the PCR reaction, the primers will amplify the target sequence and multiple molecules of the dye will bind to the double-stranded product and will fluoresce. • Intercalating fluorescent dyes are not specific to a particular sequence; thus, they are both inexpensive and versatile because they do not require a dyelabeled probe. • However, as they can bind to any double-stranded sequence, they will also bind to primer-dimer artifacts or incorrect amplification products11. It is important to also analyze the melting curve of the amplicon to ensure that the primers are amplifying a single product; this is observed as a single melting curve peak. • In addition, these types of dyes cannot be used for multiplexed analyses as the different products would be indistinguishable. See section 4.1.3 for more information on multiplexed reactions. • Finally, because multiple molecules bind, the amount of fluorescent signal detectable is dependent on the mass of the amplified product. Thus, assuming both amplify with the same efficiency, a longer product will generate more signal than a shorter product7. In contrast, probes are both specific to a particular sequence and will only emit energy from a single fluorophore no matter the length of the amplified product. This will create a 1:1 ratio between a cleaved probe and an amplicon and allows for more accurate quantification of the number of copies amplified. Figure 6. Intercalating Dye. In step one, the primers hybridize in a sequence-dependent manner to the complementary DNA strand. In step two, the polymerase extends from the primers and begins DNA synthesis. In step three, the intercalating dye binds to the doublestranded DNA in a sequence-independent manner. In step four, the polymerase continues extension of the primers to finish synthesis of the DNA strand and the intercalating dye continues to bind along the length of the double-stranded product. 11 User’s Manual Related Products at IDT IDT offers PrimeTime qPCR products for the 5’ nuclease assay. The PrimeTime Assays consist of a forward primer, a reverse primer, and a dual-labeled probe all delivered in a single tube. The PrimeTime dual-labeled DNA probe is a non-extendable oligonucleotide that is labeled with a fluorescent reporter and a quencher dye. IDT also synthesizes custom primers on a number of scales ranging from 25 nmole to 10 µmole, molecular beacons, and hybridization/FRET probes. In addition, IDT offers SciTools Design Tools, a suite of free design and analysis tools which include the RealTime PCR and PrimerQuest design tools (for designing primers, probes, and assays), Oligo Analyzer (for analyzing oligonucleotide melting temperature, hairpins, dimers, and mismatches), and mFold (for analysis of the secondary structures of oligonucleotides). For more information, to order any of these products, or to use the free design tools, please visit the IDT website at www.idtdna.com. 1.3 qPCR Workflow The typical qPCR experiment involves the following steps: 1. Isolate total RNA (Section 2) 2. Perform reverse transcription (Section 3) 3. Perform real-time PCR (Section 4) 4. Validate assay and analyze data (Sections 5 and 6) Each of these steps is covered in this guide along with recommendations for proper experimental setup and design. All of the recommendations follow the guidelines as set by the MIQE Guidelines: Minimum Information for Publication of Quantitative Real-Time PCR Experiments1. COLLECT SAMPLE ISOLATE RNA REVERSE TRANSCRIPTION REACTION MIX qPCR REACTION RUN AND ANALYZE qPCR 12 2. Total RNA Isolation The first step in running a qPCR assay is to collect the sample and isolate total RNA. The method of isolation will depend on the sample type and experimental conditions. Once the RNA is isolated, both the quantity and quality of the sample should be assessed. Throughout the process, it is imperative that the sample remain free of RNases and DNases. Here, we provide some suggestions for isolation, quantification, assessing quality, and for keeping the preparation space clear of nucleases. 2.1 Isolate RNA isolation can be accomplished by organic extraction methods (such as phenol extraction), reagents (such as TRIzol® reagent [Invitrogen], QIAzol® reagent [Qiagen], RNA STAT-60 [Tel-Test, Inc.]), or a variety of solid phase RNA isolation kits that are available on the market from a number of companies including Qiagen, Ambion, and Promega. The best method will depend on your sample type and the amount of RNA available for harvesting. For example, small RNAs and miRNAs can only be efficiently isolated with organic extraction methods12 while solid phase kits are the appropriate choice for high sample throughput. It is important that the RNA extracted is of high quality and all samples be treated in exactly the same method. Differences in either sampling or isolation methods can lead to unwanted variation between samples. Surfaces and supplies should be free of RNases in order to assure the highest quality RNA by preventing degradation. Some samples may require DNase treatment to remove genomic DNA contamination. This step may not be necessary if the amplicon spans an intron as this design will not target genomic DNA. If the isolated RNA is not going to be used immediately, it should be frozen at -20°C for short-term storage lasting, at most, a few months. For longer term storage (more than a couple of months), precipitate the RNA and store it in ethanol at -20°C. 13 User’s Manual 2.2 Quantify RNA can be quantified by a number of methods, including an RNase P assay, UV spectrophotometry, microfluidic analysis, capillary gel electrophoresis, or by the use of fluorescently-labeled RNA binding dyes1. The RNase P assay uses qPCR to detect RNase P levels and can most accurately detect the quantity of RNA present in the sample. When using spectrophotometry, it is important to measure the sample at multiple wavelengths including 240 nm (for analysis of background absorption and organic contaminations), 260 nm (wavelength specific to nucleic acids), 280 nm (wavelength specific to proteins), and 320 nm (for analysis of turbidity)13. The background readings should be subtracted from the A260 and A280 readings in order to find the most accurate concentration. 2.3 Check Quality In addition to having similar quantities of RNA, it is also important that the samples be of similar quality. The quality of the RNA can have a large impact on the results of the experiment; poor quality RNA can compromise the entire experiment and result in wasted time and money. Furthermore, differences in quality between two samples can lead to the misinterpretation of gene expression differences. The most accurate assessment of RNA quality can be determined by calculating the integrity of the RNA. This can be achieved using the Agilent 2100 Bioanalyzer (Agilent Technologies) or the Experion (Bio-Rad Laboratories). These instruments use a very small amount of RNA sample and electrophoretically separate the samples, which are then detected by laser-induced fluorescence. High quality RNA will have high 18S and 28S peaks and a low amount of 5S RNA13 (Figure 7). The RNA integrity value is determined from the shape of the electropherogram curve produced and is based on a number of characteristics. The software uses an algorithm to assign a number to the RNA with 1 being the most degraded and 10 being the most intact13. The ideal integrity value will depend on the sample as some types of tissues will provide higher quality RNA. See the publication from Fleige and Pfaffl13 for more information on average integrity values for various tissues. 14 Sample 2 18S rRNA Sample 2 Sample 1 18S rRNA Sample 1 ExperionTM (BioRad) RNA Quality Analysis Figure 7. Examples of poor quality RNA (Sample 1) and good quality RNA (Sample 2). Sample 1 shows that under limited RNA degradation, the 28S rRNA species is more susceptible. 28S 18S 28S rRNA The ratio of the 260/280 nanometer absorbance readings can also give an indication of the quality. However, other contaminants may affect this ratio so it is not as accurate as the RNA integrity value analysis. Typically, a ratio greater than 1.8 indicates the RNA is of good quality. Lower ratios may indicate organic compound contamination. Turbidity in the sample can also lead to errors in calculation. To correct for the effects of turbidity, A320 readings should be subtracted from readings at A240, A260, and A280. Alternative methods for determining quality include gel electrophoresis, microfluidics-based rRNA analysis, or a reference gene/target gene 3’:5’ integrity assay 1, 14. 2.4 Avoid RNases, DNases RNases and DNases are nucleases that can quickly degrade samples and oligonucleotides. They are ubiquitous and some are hard to eliminate. Therefore, it is very important to take precautions to ensure that samples are protected from degradation by these nucleases. Follow clean PCR guidelines (see next page) to prevent contamination and test the samples using detection reagents like RNaseAlertTM and DNaseAlertTM. If you do find contamination in your samples, be sure to replace all reagents and stock buffers and thoroughly clean the PCR preparative areas. 15 User’s Manual Guidelines for Maintaining a Contamination-Free Workplace At some point, most qPCR users will experience some level of template contamination. Simple steps can mitigate the risk of accidental contamination that results in non-informative data and, thus, wasted time and money. 1. Design the process flow in a unidirectional fashion. PCR setup should be done in a template-free room with reagents that will never come in contact with potential contamination sources. This means keeping enzyme mixes, water, primers, probes, pipettes, tubes, filter tips, and plates in a room where template will not be isolated or stored. 2. Bench top hoods with HEPA filters and UV lights can be useful but are not absolutely necessary. Short-term UV light treatment is only effective against live organisms but not purified nucleic acid. 3. Regular cleaning of non-porous surfaces with a 10% bleach solution is encouraged. 4. Water carboys are not recommended for long-term water storage as aquatic bacteria (for example, Stenotrophomonas) can thrive in these containers. 5. If using robotics, do not use the same platform to set up plates and to isolate nucleic acids. 6. Multiple freeze thaw cycles are often mistakenly thought to lead to the degradation of oligonucleotides that are in a buffered solution. In order to prevent this problem, users are often advised to make small aliquots of the primer-probe mixes. However, IDT has shown that PrimeTime Assays containing primer-probe mixes are stable in a buffered environment for over 30 freeze thaw cycles (Figure 8). Aliquots are useful if the stock solutions will be accessed frequently with pipettes that are potentially contaminated with nucleic acids. 7. Once mixes have been made and dispensed into the wells, move the plates to a new location for template addition. 8. Regular decontamination of commonly used equipment is recommended, especially pipettes and work surfaces. 16 0 Freeze-Thaws 15 Freeze-Thaws 30 Freeze-Thaws 8a 0 vs. 30 Freeze-Thaws Rn vs. Cycle 8b Figure 8. (a) PrimeTime Assays are stable after 30 freeze-thaw cycles. A standard scale PrimeTime Assay was hydrated in IDTE to 40x. The tube was frozen at -20°C and thawed 30 times. At various freeze/thaw points, some of the Assay was aliquoted out to be run with a cDNA standard curve. The Assays were run against a validated universal human reference cDNA standard curve with concentrations ranging from .005 ng50 ng and with the Taqman® Gene Expression Mastermix (Applied Biosystems). (b) The PrimeTime Assays are shown at the 0.5 ng cDNA concentration in a ROX TM-normalized view (Rn). PrimeTime Assays have no probe degradation and no impact on C q value occurs between 0 and 30 freeze-thaw cycles. Related Products at IDT RNaseAlertTM and DNaseAlertTM: These reagents are fluorescence-quenched oligonucleotide probes that emit a fluorescent signal only after nuclease degradation and allow for rapid, sensitive detection of RNases or DNases. ReadyMadeTM Primers and Randomers: IDT offers a number of primers and randomers, including random hexamers and Oligo(dT) primers, that are pre-made, purified, and ready to ship upon order. For more information and to order these products, visit IDT’s website at www.idtdna.com. 17 User’s Manual 3. Perform Reverse Transcription Transcription is the synthesis of RNA from a DNA template; reverse transcription is the synthesis of DNA from an RNA template. DNA synthesized from RNA is often referred to as first strand cDNA. The conversion from RNA to cDNA is necessary for qPCR as the Taq polymerase is a DNA-dependent enzyme. The exact reaction conditions are dependent upon the particular kit or protocol used, but all contain the same basic components: the RNA to be converted, dNTPs to provide the nucleotides for cDNA synthesis, primers, buffer, DTT to stabilize the enzymes, RNase inhibitor to keep the RNA from degrading, and a reverse transcriptase enzyme. For accurate comparison in the qPCR step, each sample should have the same amount of starting RNA in the reverse transcription reaction. Large variations in the amount of RNA per RT reaction can lead to fluctuations in the RT efficiency. Poor reverse transcription may lead to loss of signal from messages with low expression levels. The type of primers used will depend on the final goal. Both random primers and oligo(dT) primers will produce random DNAs, while gene-specific primers will produce cDNA for only a specific target. Random hexanucleotide primers bind to mRNA at a variety of complementary sites and lead to short, partial length cDNAs. These primers can be used when the template has extensive secondary structure. Random primers will produce the greatest yield and so are useful when the template is limiting. Specific oligonucleotide primers, which selectively prime the mRNA of interest, are also used in certain applications such as diagnostic assays. Oligo(dT) primers will ensure that the poly(A) tails of mRNAs are reverse transcribed and are more commonly used for cDNA applications such as cDNA libraries. A mixture of random hexamers and oligo(dT) primers will produce a greater amount of cDNA and will work well with samples that have mid to high levels of expression. However, the mixture can also be problematic by consuming all of the dNTPs in copying the highly abundant RNAs. If the amount of RNA available is limiting and all the targets to be detected are known ahead of time, gene-specific primers are preferable. However, gene-specific primers must be carefully designed in order to ensure that transcriptional variants are not missed. It is very important that a minus RT control is included during the reverse transcription step. This reaction has all of the same components of the other reactions with the exception that the reverse transcriptase enzyme is left out. This control will be very useful later 18 in the qPCR step as a negative control. Amplification of this control will indicate detection of genomic DNA remaining from the RNA isolation step. Aliquot the cDNA samples and store the first strand cDNA at -20°C. Variation can easily be introduced at this step in the process so it is very important that all samples be treated the same including the amount of RNA, the priming strategy, the enzyme type, the volume of the reaction, the temperature used, and the reaction time1. Finally, some products are available on the market that allow both the RT and qPCR reactions to occur in a single step. This may be a good option if you plan to use the cDNA for only a single assay. If, however, you are interested in making a large amount of cDNA to use for a number of assays, the two-step process is necessary. In addition, the one-step qPCR reaction is potentially less sensitive than the two-step process. Example Reverse Transcription Reaction (20 μL reaction volume) 1. Combine the following components: • • • 1 μL of 2 μM Gene Specific RT Primer or 250 ng of Oligo(dT) 1 μL dNTP mix (10 mM each) 10.5 μL of 10 ng/μL total RNA (100 ng) 2. Heat at 65°C for 5 minutes and then chill on ice. 3. Add: • • • 4 μL of 5X First Strand Buffer 2 μL of 0.1 M DTT 1 μL of RNase inhibitor such as RNasin® (Promega) 4. Incubate at 42°C for 2 minutes 5. Add: • 0.5 μL of Superscript® II (Life Technologies) 6. Incubate at 42-44°C for 1 hour* 7. Incubate at 70°C for 15 minutes *A lower temperature is required when random hexamers are used. For random hexamers, incubate at 25°C for 15 min and then increase the temperature after some extension has occurred. 19 User’s Manual 4. Real-Time PCR Design and Protocols A number of important factors must be considered in order to achieve interpretable and reliable results from a qPCR reaction. First, the primer and probe design is crucial to the success of the experiment. Second, the instrument will dictate certain parameters of the experiment; importantly, some instruments are not compatible with some fluorescent dyes. Table 1 (see page 26) shows a number of dyes and their compatibility with instruments. However, this list is limited and may be subject to change. Check the manual of your particular instrument to verify the compatible dyes and correct cycling conditions. Third, if you are running a multiplex experiment, additional considerations will need to be incorporated – particularly in the assay design and choices of dyes. Lastly, as a final step before the reaction is set up, determine the controls that you will run and be sure to calculate those extra reactions into your total number of reactions. Be sure to include both positive and negative controls. This section includes recommendations for design as well as protocols for resuspension and for reaction setup. Always use clean reagents, check the expiration dates, and verify the concentrations for all reagents. Related Products at IDT PrimeTime qPCR Products: IDT offers Assays and probes designed for 5’ Nuclease assays, the gold standard for quantitative gene expression studies. The Assays consist of a forward primer, a reverse primer, and a dual-labeled probe all delivered in a single tube. The oligonucleotide mixture allows for relative or absolute quantification of a target sequence within a sample. PrimeTime qPCR Assays are offered in three different sizes to fit your experimental and budgetary needs. The PrimeTime dual-labeled DNA probe is a non-extendable oligonucleotide that is labeled with a 5’ fluorescent reporter and a 3’ quencher dye. For more information and to order PrimeTime qPCR products, visit the IDT website at www.idtdna.com. 20 4.1 5’ Nuclease Assay Design 4.1.1 Primers and Probes We strongly recommend using the RealTime PCR design tool located on the IDT website to be sure all of the important parameters will be included in the assay design. Primers Probe Amplicon Range Ideal Range Ideal Range Ideal 70-150 100 Length 18-30 22 20-28* 24 Melting Temperature 60-64°C 62°C 66-70°C 68°C GC content 35-65% 50% 35-65% 50% *For probes that do not contain MGB Tm enhanced properties. Primers Tm: Because primers anneal at 60°C in a typical PCR reaction, the optimal melting temperature of primers is slightly higher, between 60-64°C. The ideal temperature is 62°C and is based on the average conditions and factors associated with the PCR reaction. The melting temperature of the two primers should not differ by more than 4°C in order for both primers to bind simultaneously and efficiently amplify the product. Length: Aim for primer lengths of 18-30 bases with a balance between the melting temperature, purity, specificity, and secondary structure considerations. GC content: Make sure that the primers are specific to the target and that they do not contain runs of four or more Gs15. The GC content should be within the range of 35-65% with an ideal content of 50%, which allows complexity while still maintaining a unique sequence. Avoid sequences that may create secondary structures, self-dimers, and heterodimers; use a tool such as IDT’s OligoAnalyzer to find potential sites that are likely to form these structures. 21 User’s Manual Probes Tm: The melting temperature of the probe must be 6-8°C higher than the primers and should fall within the range of 66-70°C for a 2-step protocol. If the melting temperature is too low, the probe will not bind to the target. In this case, the primers may amplify a product but the probe will be unable to provide the fluorescence that is necessary to detect the product. Length: Probe length should be between 20 and 28 bases in order to achieve an ideal Tm without increasing the distance between the dye and quencher to a point where the quencher will no longer remain able to absorb the fluorescence of the fluorophore. Probes longer than 30 bases may perform poorly due to the distance between the quencher and dye. GC content: Aim for a GC content of 35%-65% and avoid a G at the 5’ end as it can quench the 5’ fluorophore. Ideally, the probe should sit in close proximity to the forward or reverse primer, but not overlap, although this is not absolutely necessary. As with the primers, avoid sequences that may create secondary structures or dimers. Amplicons Length: Aim for an amplicon length of 70-150 bases, which will allow the primers and probe to compete for hybridization and allow enough sequence for all components to bind. This length is most easily amplified using standard cycling conditions. Longer amplicon lengths are possible, up to 500 bases, but the cycling conditions will need to be altered to account for the increased time needed for extension. Amplicons or assay designs should span an exon-exon junction to reduce the possibility of genomic contamination. Tm: Calculate all melting temperatures under Real-Time PCR conditions—standard parameters for qPCR are 50 mM K+, 3 mM Mg2+, 0.8 mM dNTPs. See section 4.1.1a for more information on calculating melting temperature. Make sure that both the primers and the probe are specific to the target and are not complementary to other targets. Use BLAST to analyze the sequences and ensure they are specific. BLAST is a Basic Local Alignment Search Tool provided by NCBI 22 (http://www.ncbi.nlm.nih.gov/) that finds regions of local similarity between sequences. Enter an accession number or enter the sequence in FASTA format and compare it to the genome of a specific species or to all BLAST databases. BLAST allows searches against nucleotide or protein databases and provides the statistical significance of the matches. 4.1.1a Calculating Melting Temperature (Tm) Primers and probes hybridize to targets and form short duplexes in the annealing step of the PCR reaction. The stability of those duplexes is described by the melting temperature; the temperature at which an oligonucleotide duplex is 50% in single-stranded form and 50% in double-stranded form. Melting temperature is the key design parameter. Inaccurate predictions increase the probability of failed assay design. IDT provides a number of free software tools on the website that can predict Tm values from oligonucleotide sequence and solvent composition. It is a common misunderstanding to think that Tm is solely a property of the oligonucleotide sequence and does not vary with experimental conditions. Melting temperature depends on oligo sequence, oligo concentration, and cations present in the buffer – specifically on both the monovalent ([Na+]) and the divalent ([Mg2+]) salt concentrations (Figure 9). For this reason, the melting temperature for specific experimental situations should be calculated using IDT SciTools design tools. Figure 9. Example of melting profiles for primers of various lengths in the typical PCR buffer (1mM Mg 2+, 50mM KCl, 10mM Tris). The content of GC base pairs is about 50%. 23 User’s Manual Predictive algorithms have recently been significantly improved; the nearest-neighbor method predicts Tm with a higher degree of accuracy than previously used methods16. Older formulas, which do not take interactions between neighboring base pairs into account, do not provide Tm predictions that are accurate enough for real-time PCR design. IDT scientists have published experimental studies on the effects of Na+, K+ and Mg2+ on oligonucleotide duplex stability and have proposed a model with increased accuracy17. The linear Tm correction has been used in the past to account for salt stabilizing effects, but melting data of a large oligonucleotide set demonstrated that non-linear effects are substantial and must be considered17. Figure 10. The stability of a 25 base pair long duplex (CTG GTC TGG ATC TGA GAA CTT CAG G) varies with K + and Mg 2+ concentrations. Competitive binding of ions to DNA is observed. PCR buffers also contain deoxynucleoside triphosphates (dNTPs), which bind magnesium ions (Mg2+) with much higher affinity than DNA. Since they decrease free Mg2+ activity, the Tm may be also decreased17 (Figure 10). The best predictive algorithm considers this effect as well. IDT’s SciTools design tools employ the latest nearest-neighbor method, thermodynamic parameters18-20 and the improved salt effects model17 to achieve state-of-the-art predictions of melting temperatures with an average error around 1.5°C. 24 Related Products at IDT SciTools Design Tools: IDT offers a number of free design and analysis tools on their website. These include the RealTime PCR design tool (for designing primers, probes, and assays), OligoAnalyzer® tool (for analyzing oligonucleotide melting temperature, hairpins, dimers, and mismatches), and mFold (for analyzing the secondary structures of oligonucleotides). For more information and to use these free SciTools design tools, visit the IDT website at www.idtdna.com. 4.1.2 Choosing the Correct Fluorescent Label for the Instrument The correct dye will depend on the type of instrument you are using and the compatibility of the dye with the instrument. Table 1 lists IDT recommended dyes that are compatible with common instrumentation. Refer to your instrument manufacturer’s guidelines for information specific to the particular instrument you are using. FAM is the most popular of these dyes and is often more sensitive than some of the other dyes available. 25 User’s Manual Table 1 TYE 665 Stratagene Mx3005P Cy5 Stratagene Mx3000P LC 640 Roche LC480 TEX 615 BioRad MyIQ5 Texas Red BioRad MyIQ2 LC Red 610 BioRad iCycler BioRad MiniOpticon x x x x x x x x x x x x x x x x x x x x x x x x x x x x x x x x x x x x x x x x x x x x x x x x x x x x x x x x x TAMRA BioRad CFX96 x TYE 563 BioRad CFX384 x Cy3 ABI StepOne Plus x MAX ABI StepOne x JOE ABI 7900 x HEX ABI 7500 x TET ABI 7300 FAM ABI 7000 ROX Instrument Compatibility with Reporter Dyes x x x x supplier provided or recommended reporter dyes x instrument incapable of supporting instrument capable dyes, but may require calibration 26 4.1.3 Multiplex qPCR In multiplex PCR, multiple targets are all amplified in a single reaction tube. Each target is amplified by a different set of primers and a uniquely-labeled probe that will distinguish each PCR amplicon. Multiplexing provides some advantages over single-reaction PCR, including a lower amount of starting material, increased throughput, lowered reagent costs, and less sample handling. However, the experimental design for multiplexing is more complicated as the amplification of each target can affect others in the same reaction. Therefore, careful consideration of design and optimization of the reactions is critical. In order to incorporate all necessary parameters, we strongly recommend using a design tool for primers and probes. 1. Make sure that the primers and probe sets do not have complementary sequences to each other. Use BLAST to analyze the sequences and ensure they are non-complementary. 2. Each target must be identified by a separate reporter dye. Select dyes so that the emission spectra of each of the fluorophores do not overlap or overlap as little as possible (Figure 11). Additionally, some instruments are compatible with only certain dyes—check the documentation for your instrument to be sure the dyes are compatible. As a general rule, it is a good idea to select FAM for any low copy messages because it has a strong signal. Lower signal fluorophores can then be used for the higher abundant messages. 3. Optimize the individual reactions and make sure that they each have an efficiency above 90%. 4. Validate the multiplex reactions by running a combined reaction along with an individual reaction to make sure they are performing similarly. Compare the standard curves and verify that the Cq values are similar at both the high and low ends. A good multiplex will have similar curves and similar limits of detection. (Figure 12) 5. Optimize the multiplex reactions. Limit the primers for the targets expressed at a high level to a 1:1 ratio with the probe. Increase the primer-to-probe ratio for targets expressed at a lower level. IDT offers custom primer-to-probe ratio options with PrimeTime Assays. Increasing the amount of enzyme and dNTPs added to the reaction may be necessary—we recommend doubling the amount of these reagents. A few master mixes are available on the market that are specially formulated for multiplexing. 27 User’s Manual Dye Dye Absorption max (nm) Dye Emission max (nm) 6-FAM 495 520 TET 522 539 Hex 538 555 Joe 529 555 Max 524 557 Cy3 550 564 TAMRA 559 583 Rox 588 608 Texas Red 598 617 Tex 615 596 613 Tye 665 645 665 Cy5 648 668 Figure 11. Absorbance range of fluorophores. FAM Singleplex FAM Multiplex HEX Singleplex Figure 12. Example of Multiplex with PrimeTime Assays. Each reaction was run with 50 ng of cDNA with FAM or HEX dye. C q values were 22.8 for FAM singleplex, 22.5 for FAM multiplex and 25 for HEX for both singleplex and multiplex. HEX Multiplex 28 4.1.4 Selecting the Right Controls 4.1.4a Negative Controls IDT recommends the following three negative controls. At minimum, the no template control is absolutely necessary in all qPCR experiments. 1. A no template control (NTC) omits the DNA or RNA template from the PCR reaction. This reaction serves as a general control for unwanted nucleic acid contamination or primer-dimer formation that may make the results more difficult to interpret, particularly when using SYBR® Green I chemistry. 2. A no reverse transcriptase control (RT-) omits the reverse transcriptase in the reverse transcription step of a qRT-PCR reaction. The purpose of this control is to assess the amount of genomic DNA contamination present in an RNA preparation. 3. A no amplification control omits the DNA polymerase from the PCR reaction. This reaction serves as a control for background fluorescence of the PCR. 4.1.4b Positive Controls 1. An exogenous positive control is external DNA or RNA carrying a target of interest. These control reactions will alert you to any components in the sample that might inhibit reverse transcription and/or PCR. IDT synthesizes miniGenes and UltramersTM which can serve the role of an exogenous positive control with a known starting copy number. We also recommend adding a phage promoter region (such as T7 or SP6) to the amplicon sequence. This will generate an in vitro transcribed RNA to provide a control for the reverse transcription step. Purified amplicons generated by PCR can also serve as exogenous positive controls. 2. An endogenous positive control is a native target that is present in the experimental sample of interest and can serve as a normalizer among samples. These control reactions will correct for quantity and quality differences between samples. IDT recommends that you test at least two, but preferably three, normalizing or reference genes to ensure accurate internal controls. The best normalizing gene to use will depend on the RNA source and experimental conditions of the sample you will be testing. The best practice is to screen multiple genes under the experimental 29 User’s Manual conditions employed and look to see which expression levels fluctuate the least. Programs, such as geNorm, can be used to evaluate the performance of various normalizers. The most commonly used normalizers are listed in Table 2. Alternatively, review the literature for the genes tested on samples with conditions similar to yours. In this case, once you have chosen a normalizing gene, be sure to run a reaction to verify that the gene expression levels do not fluctuate across samples before you use it as a control. Table 2 GENE ID 18S Description 18S ribosomal RNA PGK1 phosphoglycerate kinase 1 ACTB actin, beta POLR2A polymerase (RNA) II (DNA directed) polypeptide A B2M beta-2-microglobulin PPIA peptidylprolyl isomerase A (cyclophilin A) GAPDH glyceraldehyde-3-phosphate dehydrogenase RPLP0 ribosomal protein, large, P0 GUSB glucuronidase, beta TBP TATA box binding protein HMBS hydroxymethylbilane synthase TFRC transferrin receptor HPRT1 hypoxanthine phosphoribosyltransferase 1 UBC ubiquitin C IPO8 importin 8 YWHAZ 3-monooxygenase/tryptophan 5-monooxygenase activation protein, zeta polypeptide 30 Related Products at IDT Both Ultramers and miniGenes serve as excellent controls and, importantly, can serve as standards with known concentrations. For more information and to order Ultramers and miniGenes, visit the IDT website at www.idtdna.com. UltramersTM: IDT’s synthesis systems and chemistries allow the high-fidelity synthesis of very long oligos (up to 200 bases). Suitable for demanding applications like cloning, ddRNAi, and gene construction, Ultramers can save researchers a great deal of time and trouble through direct synthesis of the entire fragment. miniGenes: IDT also offers a confidential and guaranteed gene synthesis service. miniGenes are oligonucleotides up to 400 base pairs that are constructed using Ultramers, are sequence verified, and delivered in a purified plasmid. 31 User’s Manual 4.2 PrimeTime qPCR Assay PCR Protocol This protocol is intended for use with PrimeTime qPCR Assays. Concentrations and volumes may vary for other products. 4.2.1 Resuspension Protocol 1. Centrifuge PrimeTime qPCR Assay tubes at 750 x g for 10 seconds prior to opening in case any material was dislodged during shipment. 2. Resuspend the Assay in IDTE buffer (10mM Tris, 0.1mM EDTA pH 8.0) at the volumes indicated in the chart below. a. PrimeTime qPCR Assays can be resuspended as 40X, 20X or 10X stocks. Different concentrations may be preferable depending on the size of the Assay and desired final reaction volume (see table below). b. Vortex the sample to ensure maximal product recovery. 3. Centrifuge the resuspended Assay at 750g for 10 seconds. The resuspended Assays will yield a final 1X concentration of 500nM primers and 250nM probe when ordered under default conditions.* Recommended Resuspension Volumes for PrimeTime Assay Stock Creation Final Desired Stock Concentration 40X 20X 10X PrimeTime Mini qPCR Assay Not recommended 100 µL 200 µL PrimeTime Std qPCR Assay 250 µL 500 µL 1,000 µL PrimeTime XL qPCR Assay 1,250 µL Not recommended Not recommended *Standard or XL Assays ordered with a custom primer:probe ratio other than 2:1 will yield a different concentration of primers. 32 Related Products at IDT IDTE: IDT offers a 1X TE buffer (10 mM Tris, pH 7.5 or 8.0, 0.1 mM EDTA) for initial resuspension and storage of DNA oligos. DNA oligonucleotides can be damaged by prolonged incubation or storage in even mildly acidic solutions; DNA dissolved in distilled water will often have a final pH < 5.0 and is at risk for depurination. IDTE is guaranteed to be nuclease-free. Each lot is tested using our RNaseAlert and DNaseAlert reagents to document the absence of any detectable nuclease activity. For more information and to order IDTE, visit the IDT website at www.idtdna.com. 4.2.1a Avoiding Probe Degradation In order to avoid probe degradation, resuspend primers and probes in TE buffer (10mM Tris pH 8.0; 0.1mM EDTA; pH 8.0) rather than H2O as TE buffer will maintain a constant pH. Store probes away from exposure to light. Oligonucleotides should be aliquoted into portions for immediate use and those for long-term storage. Storage in aliquots will help minimize the risk for contamination of the stocks. 4.2.2 Assay Protocol The majority of real-time PCR reactions are performed with 20 μl, 10 μl, or 5 μl for each reaction volume. It is very important that the cDNA and reaction volumes remain constant across all samples that need to be compared. IDT recommends that you perform a minimum of triplicate reactions for each sample. Remember to factor in control samples when calculating the number of reactions you need for each assay. 1. In a sterile 1.5 ml microcentrifuge tube, pipette the assay, master mix and water in the volumes listed below: 33 User’s Manual 10X Assay 20 μl reaction 10 μl reaction 5 μl reaction PCR reaction component 1 rxn 3 replicates* 1 rxn 3 replicates* 1 rxn 3 replicates* 10X PrimeTime Assay 2 µL 8 µL 1 µL 4 µL 0.5 µL 2 µL 2X Master Mix** 10 µL 40 µL 5 µL 20 µL 2.5 µL 10 µL cDNA + RNase-free water (IDT)‡‡ 8 µL 32 µL 4 µL 16 µL 2 µL 8 µL ‡ 20X Assay 20 μl reaction 10 μl reaction 5 μl reaction PCR reaction component 1 rxn 3 replicates* 1 rxn 3 replicates* 1 rxn 3 replicates* 20X PrimeTime Assay 1 µL 4 µL 0.5 µL 2.0 µL 0.25 µL 1 µL 2X Master Mix** 10 µL 40 µL 5 µL 20 µL 2.5 µL 10 µL cDNA + RNase-free water (IDT)‡‡ 9 µL 36 µL 4.5 µL 18 µL 2.25 µL 9 µL ‡ 40X Assay 20 μl reaction PCR reaction component 1 rxn 3 replicates* 40X PrimeTime Assay 0.5 µL 2X Master Mix** cDNA + RNase-free water (IDT)‡‡ ‡ 10 μl reaction 5 μl reaction 1 rxn 3 replicates* 1 rxn 3 replicates* 2 µL 0.25 µL 1 µL 0.13 µL 0.5 µL 10 µL 40 µL 5 µL 20 µL 2.5 µL 10 µL 9.5 µL 38 µL 4.75 µL 19 µL 2.38 µL 9.5 µL * Replicates include excess to account for volume loss during pipetting. ‡ IDT recommends 1-100 ng of cDNA per 20 µL reaction. ‡‡ DEPC-free, nuclease-free IDT water is recommended. ** It is imperative that every single sample be treated in the same manner in order to achieve reliable results. For that reason, it is very important to use a master mix to ensure that every sample receives the same amount of each of the reaction components. See Figure 13 for information on all master mixes tested at IDT. 34 2. Cap the tube and vortex to mix. Centrifuge the tube at 750g for 10 seconds. 3. Depending on the number and total volume of reactions, select 96- or 384-well plates. 4. Transfer the appropriate amount of master mix reaction (either 20, 10, or 5 μl minus the cDNA volume) into each well of the reaction plate. 5. Add the cDNA to the appropriate wells. Pipette up and down to mix the reaction. 6. Seal the plate with optically clear film. 7. Centrifuge the plate at 1000g for 30 seconds. Load the plate on the instrument. 8. The suggested cycling times for a real-time PCR run are 953:00min-10:00min-(950:15s-600:45s) x 40 cycles. However, the exact cycling parameters will depend on the particular instrument and the master mix that you are using. Refer to the instrument manufacturer’s guidelines and the instructions for the master mix you are using for correct cycling conditions. Using the correct cycling conditions to activate the enzyme is crucial to the success of the experiment. 4.2.2a Master Mixes Master mixes that are developed manually with the addition of reaction buffer, dNTPs, MgCl2, and Taq polymerase give researchers maximum flexibility. This is due to the fact that the components can be adjusted according to experimental needs. However, most researchers use a predesigned master mix that has been optimized to work in most standard assays. It is important to note that small changes in the formulations of the master mix can significantly affect assays if they are not run under the correct cycling conditions. A brief description of the role of the different components in a master mix is given below. • Buffer is required to maintain optimum pH and salt conditions. • MgCl2 is required both to stabilize primer and probe interactions with DNA and as a cofactor for Taq polymerase activity. Occasionally, it may be necessary to add more MgCl2 to the master mix in order to achieve optimum amplification results. • dNTPs are the building blocks for DNA synthesis. Some master mixes can include dUTP in conjunction with the UNG enzyme to eliminate previous PCR carryover. However, the amplification sensitivity is higher only if dNTPs are used. • UNG (Uracil N- glycosylase) can be used to eliminate PCR carryover contamination 35 User’s Manual as it will degrade any PCR product containing dUTPs. If a master mix includes dUTP, it is necessary to adapt cycling conditions to include an UNG step to degrade any previous PCR product. • Taq polymerase – Master mixes normally contain modified DNA polymerases to eliminate nonspecific priming by a standard DNA polymerase that may occur before the initial denaturation step. Taq polymerases have been modified to be inactive at low temperatures either through use of an antibody modification or chemical modification. These modified polymerases are known as “hot start” and require heating at 95°C for 5 to 10 minutes for activation. • ROX – Some thermocyclers require the use of an internal reference dye, such as ROX, for normalization across wells and pipetting errors. Therefore, certain master mixes are available with different formulations of ROX. Check with your instrument to see if and how much ROX is recommended in your assay. Qiagen QuantiTect Probe PCR Kit ABI TaqMan® Gene Expression Master Mix Bio-Rad iTaqTM Supermix with ROX Stratagene Brilliant® II QPCR Master mix Invitrogen Express qPCR SuperMix Efficiency 102.70% 102.50% 99.10% 100.70% 102.10% Correlation Coefficient (R2) 0.999 0.999 0.997 0.999 0.999 Product Amplification Curve Standard Curve Figure 13. Successful amplification of PrimeTime Assays with various commercial master mixes. To determine the success of PrimeTime qPCR Assays with commercially available master mixes, IDT tested five different master mixes across six orders of magnitude. A tenfold dilution series over six orders of magnitude (1E7 to 100 copies) was created for the JAK2 transcript. The standard curves were generated by running the assay with the indicated commercial master mixes. The samples were run on the ABI 7900 under standard cycling conditions (502:00min, 9510:00min, (9500:15s – 601:00min)) x 45 cycles. The data demonstrate greater than 90% efficiency and correlation coefficients greater than 0.99 for all tested qPCR master mixes. 36 5. Assay Validation Before the gene expression data can be analyzed, it is important to evaluate the assay performance. This is achieved by assessing the standard curve, PCR efficiency, linear dynamic range, limit of detection, and the precision of the assay1. Once this information is gathered, and if it is of good quality, then the changes in gene expression can be determined. It is important to validate each new assay—even if it is straight from the literature – to verify that the assay is reproducible with the conditions you will be using. 5.1 Standard Curves A standard curve is created by diluting a template with a known concentration. The template is serially diluted and each dilution serves as a standard. The known samples are assayed simultaneously with the unknowns and a standard curve is made from the serial dilutions. The quantity of the unknown sample can then be determined through interpolation from the standard curve. Running a standard curve means setting up additional reactions, but the data that can be obtained from the results is very important for determining the quality of the PCR reaction. 5.1.1 Range of Dilution A standard curve across multiple logs is needed (Figure 14). The concentration should span at least 4 logs10 of magnitude and preferably span 5 to 6 logs10. The range of concentrations tested in the standard curve should cover the range in the test unknowns without extrapolating. The PCR efficiency is close to 100% when the standard curve has a correlation coefficient close to 1 and the slope is close to -3.32. See section 5.2 for more information on PCR efficiency. 5.1.2 Template A few options are available for standard curve starting materials. First, the target of interest can be amplified and either cloned or the PCR product can be purified and serially diluted. Second, to avoid the additional steps of cloning, long oligos or genes, such as Ultramers and miniGenes, can be purchased from IDT and will provide a known amount of product. Cloned amplicons, Ultramers, and miniGenes provide ample product to easily create a 7 log10 standard curve. As a third option, serial cDNA dilutions can be made 37 User’s Manual using RNA from a tissue or cell line with high levels of expression of the target of interest. RNA obtained from multiple cell lines and subsequently pooled are also commercially available. It is important to get as many data points as possible with at least 4-7 points for the standard curve to ensure a reliable estimation of the reaction efficiency. 40 35 30 CQ Slope = -3.2692 R² = 0.9994 25 20 15 0 1 2 3 4 5 6 7 Log (Quantity) Figure 14. A tenfold dilution series over six orders of magnitude (1E7 to 100 copies) was created for the JAK2 transcript. The standard curves were generated by running the Assay with the Gene Expression Master Mix (Applied Biosystems). The samples were run on the ABI 7900 under standard cycling conditions (502:00min, 9510:00min, (9500:15s – 601:00min)) x 45 cycles. Related Products at IDT Both Ultramers and miniGenes serve as excellent controls and, importantly, can serve as standards with known concentrations. For more information and to order Ultramers and miniGenes, visit the IDT website at www.idtdna.com. Ultramers: IDT’s synthesis systems and chemistries allow the high-fidelity synthesis of very long oligos (up to 200 bases). Suitable for demanding applications like cloning, ddRNAi, and gene construction, Ultramers can save researchers a great deal of time and trouble through direct synthesis of the entire fragment. miniGenes are oligonucleotides up to 400 base pairs that are constructed using Ultramers, are sequence verified, and delivered in a purified plasmid. 38 5.2 PCR Efficiency The efficiency of the qPCR reaction is influenced by many factors including target length, target sequence, primer sequence, buffer conditions, impurities present in the sample, cycling conditions, and the type of enzyme used21. The precision of a particular PCR assay is dependent upon the efficiency of the reaction. Because efficiencies may vary between samples, the use of an efficiency correction when calculating differences in gene expression is highly recommended in order to obtain the most accurate results. See section 6.3.2a for more information on efficiency corrections. A well performing assay will have an efficiency between 90-110%. The amplification efficiency can be obtained by analyzing the slope of the log-linear portion of the standard curve. When the logarithm of the initial template concentration is plotted on the x axis and the Cq is plotted on the y axis, PCR efficiency = 10-1/slope – 1 [1]. Based on this equation, the theoretical maximum of 1.00 (100%) indicates a doubling of the product with each cycle. 5.3 Linear Dynamic Range The linear dynamic range is the range over which a reaction is linear as established by the standard curve. The curve should, ideally, span 5-6 log10 concentrations and, at a minimum, span 3-4 orders of magnitude with 4-5 data points. It is important to ensure gene expression calculations are made within the linear dynamic range. 5.4 Limit of Detection (LOD) The LOD is the limit of detection and is the lowest concentration at which 95% of the positive samples are detected1. The LOD provides an idea of where the signal is lost, which is also where the measurement is no longer valid. To determine the LOD, examine the standard curve to find the most dilute sample that is still detectable in every case and with variance that is less than a Cq (see section 6.2 for an explanation of Cq). Ideally, the no template control (NTC) reaction will not register a Cq value. However, if the NTC reaction does register a Cq value, the lowest template dilution must be several Cq values lower than the NTC in order to not be negatively impacted. Only Cq values that fall within the LOD are viable results. It is very important that one does not attempt to extrapolate Cq values that fall outside the lowest value. 39 User’s Manual 5.5 Precision and Variability The precision of an experiment depends on many factors. Results can vary based on temperature differences, which might affect the completion of annealing or denaturation, concentration differences, pipetting errors, and stochastic variation1. Precision can be determined through sample replicates within an experiment and between experiments1. In some cases, normal biological variation between samples may exceed the variation in gene expression between sample conditions. This type of variability must be taken into consideration both when designing the experiment and when analyzing the data. See Willems et al.22 for examples of how to work with variable samples. 40 6. Analyze Data 6.1 Setting the Baseline The baseline is the fluorescence detected in the initial cycles of PCR prior to a detectable signal. The baseline should be set in the linear view and should be wide enough to eliminate the background found in early cycles of amplification, but should not overlap with the area in which the amplification signal begins to rise above background (Figure 15). The baseline stop value should be at a Cq value two cycles before the amplification curve for the highest expressing sample crosses the threshold. Both the reporter and the reference dye will each have particular fluorescence emission intensities. The normalized reporter is the ratio of fluorescence emission intensity of the reporter dye to that of the reference dye and is referred to as Rn. A reference dye, ROX, is often used to normalize for any non-PCR-related fluctuations in the reaction. This reference dye is not required on all instruments but is a helpful tool for troubleshooting. The normalized signal, once the background is subtracted, is referred to as the ΔRn. The best way to set the baseline is dependent on the particular instrument used. For more information on setting the baseline, please refer to the documentation for the instrument you are using. Linear View Log View START END START END Figure 15. Baseline set in Linear (panel 1) and Log views (panel 2). 41 User’s Manual 6.2 Setting the Threshold The threshold is the ΔRn level that determines the threshold cycle, or Cq. The threshold is set in log view as a line above the baseline and through the amplification curve in the exponential growth region (Figure 16). The Cq is the cycle number where this threshold line crosses the fluorescence amplification plot2. Setting the threshold is instrument dependent. For more information, refer to the documentation for the instrument you are using. Figure 16. Example of proper threshold setup. The threshold is indicated by a green line through the curve in the exponential region. Plateau Region Exponential Region Baseline Region 42 6.3 Determining Gene Expression Changes Gene expression is quantified by the number of cycles it takes for detectable levels of fluorescence to reach the threshold. A sample with a higher level of expression of a specific gene will reach the threshold at an earlier cycle than a sample with a lower level of expression. To analyze the relative amounts of product, investigators compare either absolute levels of RNA copies for each sample or relative levels of RNA to an unchanged control7. 6.3.1 Absolute Quantification This method requires a standard curve of the gene of interest and a calculation of the number of copies in a known amount. This could be accomplished with a known amount of RNA, linearized plasmid, PCR amplicon, or oligonucleotide. The unknown amount can then be extrapolated from the standard curve calculation. The reliability of this method is dependent on identical amplification efficiencies between the samples compared23. 6.3.2 Relative Quantification This method is the more commonly used method of analysis and is expressed as the fold difference between a test and a control. The gene expression is typically relative to one of the following: an endogenous control, an exogenous control, a reference gene index, or a target gene index23. Relative quantification measures the difference (Δ) between the threshold cycles (Cq)23. The equation used depends on the similarity or differences in the efficiencies of the reactions. 43 User’s Manual 6.3.2a Normalization Normalization allows comparison among samples because it controls for variations in the process. Typically, normalization utilizes a reference gene, or genes, as an internal control and a comparison of the samples to this reference. However, samples may also be normalized to sample size, to total RNA, or to an artificial molecule that is incorporated into the sample24. The compared samples must have been subjected to identical sampling, isolation, reverse transcription, and qPCR reaction conditions. In addition, the results obtained depend on the quality of the normalizer chosen so verifying a representative normalizer is vital for the accuracy of the results. • Normalizing to a reference gene When normalizing to a reference gene, it is very important that the reference gene is experimentally validated to be sure that it is an accurate measure against which to compare all other sample variations. Ideally, more than one reference gene should be tested. The reference genes should have stable mRNA expression and the amount of reference gene mRNA should be strongly correlated with the total amounts of mRNA in the samples1. It is critical, when using this method, that the reference gene or genes utilized does not show variation caused by experimental conditions. Normalization data is reported as a ratio of the mRNA concentration of the gene of interest to the mRNA concentration of the reference gene1. This can be calculated by a comparative Cq method or a standard curve method. • No efficiency correction The assumption of this method is that the reaction occurs with 100% efficiency and that each cycle leads to a doubling of the target DNA. Because these conditions are unlikely, we do not recommend this method. Due to these assumptions, it is important to use a low cycle number and set the crossing threshold (Cq), or number of cycles each reaction takes to reach a particular, arbitrary fluorescence level, at the earliest cycle possible. This Cq value will then be used to determine the relative expression level. 44 ΔCq = Cq target – Cq reference equation (1) ΔΔCq = ΔCq sample – ΔCq control equation (2) R = 2-ΔΔCq equation (3) 1. Determine the Cq value for each reaction. 2. Calculate the difference in Cq values for the gene of interest (target) and the endogenous control(s) (reference). This is the ΔCq as shown in equation (1). 3. Subtract the control-condition ΔCq from the treated-condition ΔCq to find the ΔΔCq as shown in equation (2). 4. To calculate the ratio of gene expression change (R), the negative value of this subtraction (-ΔΔCq) becomes the exponent of 2 and represents the difference in the “corrected” number of cycles to threshold. The value of 2 is used because the assumption is that the product doubles in each cycle. This is shown in equation (3). 5. For example, if the control sample ΔCq is 2 and the treated sample ΔCq is 4, the 2-ΔΔCq will be 0.25. Therefore, the level of the gene of interest in the treated sample is 25% of that in the control sample. This can be verified by looking at the qPCR curves – the treated sample would take additional cycles to reach the same amount of product as the control sample due to the lower amount of starting material7, 23, 25. 45 User’s Manual Efficiency-Corrected Gene Expression Measurements To account for gene expression efficiency differences, one of the following equations should be utilized. This is the recommended method for calculating gene expression fold changes because it takes into account the varying levels of assay efficiency. In equations 4-6, E represents the amount of fold change per cycle per gene. For example, for an assay with a 95% efficiency, E would equal 1.95. • Efficiency Corrected based on one sample23 Ratio = (Etarget)ΔCq target (control - sample) (Eref ) ΔCqRef(control – sample) equation (4) • Efficiency Corrected based on multiple samples23 Ratio = (Etarget)ΔCq target (MEAN control - MEAN sample) (Eref ) ΔCqRef(MEAN control – MEAN sample) equation (5) • Efficiency Corrected based on multiple samples and multiple reference genes23 Ratio = (Etarget)ΔCq target (MEAN control - MEAN sample) (Eref index) ΔCqRef index(MEAN control – MEAN sample) equation (6) Example A researcher used BRCA1 as a target gene and GAPDH as a reference gene. After performing a standard curve with a set of plasmid positive controls, the efficiency of each assay was calculated from the slope of the standard curve: BRCA Assay Efficiency = 93% GAPDH Assay Efficiency = 98% The researcher ran the control and treated samples in triplicate which resulted in the following Cq values: 46 Cq BRCA1 GAPDH Control Cq Treated Cq Replicate 1 Replicate 2 Replicate 3 Replicate 1 Replicate 2 Replicate 3 25.2 25.7 25.4 22.1 22.5 22.3 14.1 13.8 14.2 13.5 13.9 13.7 Mean Cq BRCA1 GAPDH 25.4 14.0 22.3 13.7 Using equation (4), the researcher was able to calculate the gene expression fold change between treated and control samples. ΔCq_BRCA1 = Cq control - Cq treated ΔCq_BRCA1 = 25.4 – 22.3 ΔCq_BRCA1 = 3.1 ΔCq_GAPDH = Cq control - Cq treated ΔCq_GAPDH = 14.0 – 13.7 ΔCq_GAPDH = 0.3 R= (1+93%)3.1 (1+98%)0.3 R = 6.25 Therefore, in the treated sample, BRCA1 expression levels increased 6.25 fold relative to the control sample. A more accurate measurement was made by taking the amplification efficiency of each assay into account. If equation (3), which assumes 100% assay efficiency, had been used instead, the result would have been 6.96, which would have been an overestimate of the gene expression fold change. 6.4 Qualitative Analysis For some applications, the purpose of PCR may be to determine the presence or absence of a particular nucleic acid target rather than to compare mRNA levels among samples. For these applications, it is still very important to assess the quality of the experiment— particularly to determine the sensitivity. A target may appear to be absent when it was actually present in a low amount but the experimental setup did not allow detection. 47 User’s Manual 7. PrimeTime Assay Troubleshooting As qPCR is a complex, multifaceted process, suboptimal amplification may be observed due to a number of reasons. Troubleshooting or generation of additional data may be required to achieve optimal results. Please see the table below for commonly observed problems and the potential solutions to consider. Then, refer to the indicated section to learn more about the issues as well as how to investigate and correct them. 7.2 Assay design x 7.3 Probe integrity/degradation x 7.4 Sample expression x 7.5 Incorrect reaction setup x 7.6 Instrument issues x 7.7 Threshold setup x x 7.8 Sample quality x x x x x Delayed Signal x Efficiency x False Positives Low Signal 7.1 Baseline setup Noisy Data No Amplification Potential Problem Observed Issue x x x x x x 7.9 Design specificity x 7.10 Passive reference problem x 7.11 Multiplexing x 7.12 Primer/Probe interaction x x x x x x x x x x x 7.13 Genomic DNA contamination x x 7.14 Amplicon contamination x x 7.15 Standard curves x 7.16 Master mix x x x x 7.17 Normalization 7.18 Reaction Parameters x x x x 48 7.1 Baseline 7.1.1. Is the baseline set correctly? The baseline in qPCR is a critical component of data analysis to allow accurate Cq determination. The baseline should be wide enough to eliminate background found in early cycles of amplification, but should not overlap with the area in which the amplification signal begins to rise above background. The baseline end value should be prior to the change in fluorescence and before the amplification curve crosses the threshold. See section 6.1 for more information on setting the baseline. START END START END START END Figure 17a. Examples of correct baseline setup. Panel 1 - Linear Rn View, Panel 2 - Linear Baselined ΔRn, Panel 3 - Log Baselined ΔRn START END START END START END Figure 17b. Examples of incorrect baseline setup. Panel 1 - Linear Rn View, Panel 2 - Linear Baselined ΔRn, Panel 3 - Log Baselined ΔRn (low signal). The stop point of the baseline extends into the exponential part of the curve causing the baseline to shift. This will result in an erroneous Cq point. 49 User’s Manual 7.2 Assay Design 7.2.1 Did you use a design tool? We recommend that all assays be designed with a design tool like the RealTime PCR Design Tool from IDT. These tools will provide the best primers and probes and will incorporate all necessary parameter considerations. 7.2.2 What is the length and Tm of primer and probe sequences? Were they calculated using conditions that are accurate for your reaction? We strongly recommend using the design tool to be sure all of the necessary parameters are included in the assay design. The primer Tm should be in the 60-64°C range; the probe Tm should be 6-8°C higher than primers. Also, PrimeTime qPCR Probes from IDT do not contain Tm enhancing modifications such as Minor Groove Binders (MGB) that are commonly used in assays from Applied Biosystems. Therefore, directly entering a probe sequence designed using Applied Biosystems software will have a reduced melting temperature within the IDT Assay and performance will be significantly impacted. Finally, it is very important that the design for the primers and probes takes the actual PCR conditions into consideration. For example, the salt concentration can have a dramatic effect on the melting and binding dynamics. See section 4.1.1 for more information on proper assay design. 7.2.3 Is the assay specific to the target gene? Use BLAST to analyze the primer and probe sequence to check for specificity. Run a gel to see if bands are present and if they are the correct size. It is important to run the gel in an area separate from where the PCR reaction is assembled in order to avoid contamination. See section 4.1.1 for more information on proper assay design and specificity. 50 7.2.4 What is the length of the amplicon? Amplicons should be in the 70-150 base pair range. Longer amplicons can work but they should not be longer than 500 base pairs, and the cycling conditions will likely need to be adjusted to accommodate the longer product. See section 4.1.1 for more information on proper assay design. 7.2.5 Does the assay have secondary structure that is decreasing the binding efficiency? A part of the assay (primers or probe) may need to be redesigned. We recommend using a design tool that will take secondary structures into consideration such as mFold on the IDT website. See section 4.1.1 for more information on proper assay design. Related Products at IDT SciTools Design Tools: IDT offers a number of free design and analysis tools on the website. These include the RealTime PCR design tool (for designing primers, probes, and assays), OligoAnalyzer (for analyzing oligonucleotide melting temperature, hairpins, dimers, and mismatches), and mFold (for analyzing the secondary structures of oligonucleotides). For more information and to use these free SciTools design tools, visit the IDT website at www.idtdna.com. PrimeTime qPCR Products: IDT offers Assays and probes designed for 5’ Nuclease assays, the gold standard for quantitative gene expression studies. The Assays consist of a forward primer, a reverse primer, and a dual-labeled probe all delivered in a single tube. The oligonucleotide mixture allows for relative or absolute quantification of a target sequence within a sample. PrimeTime qPCR Assays are offered in three different sizes to fit your experimental and budgetary needs. The PrimeTime dual-labeled DNA probe is a non-extendable oligonucleotide that is labeled with a 5’ fluorescent reporter and a 3’ quencher dye. For more information and to order PrimeTime qPCR products, visit the IDT website at www.idtdna.com. 51 User’s Manual 7.3 Probe and Primer Degradation 7.3.1 Did the primers amplify a product? Run the reaction on an agarose gel to see if a PCR product is present and to identify if the primers are working. Check the concentration of the primers to be sure it is correct. 7.3.2 Is the probe degrading while cycling? Run a reaction with the probe alone (no primers) to see if the signal is increasing with the probe alone. The probe alone should show low flat line fluorescence or slightly increasing fluorescence. Also, be sure to run a no template control. 7.3.3 Was the probe already degraded prior to cycling? This will be indicated by extremely high background fluorescence that does not change with cycling. This is particularly relevant if the background fluorescence has changed since a previous run with the same probe. If the probe has degraded, you will need to start over with a new aliquot, if available, or a newly synthesized probe. IDT recommends that the probe be resuspended in TE buffer. Water may be acidic and cause degradation of the probe due to depurination and strand scission. Always store probes in aliquots at -20°C. See section 4.2.1 for a resuspension protocol. 7.3.4 Is the probe degradation due to nuclease contamination? Use a reagent such as RNaseAlert or DNaseAlert to check for nuclease contaminants. IDT recommends that the probe be resuspended in nuclease-free TE buffer and stored in aliquots at -20°C. See section 4.2.1 for a resuspension protocol and section 2.4 for more information on avoiding nuclease contamination. 52 7.3.5 Is high background signal present? This could be due to a lack of quencher, a high level of free fluorophore in the probe, or probe degradation. A cleaved oligo in the solution can occur due to nuclease contamination, during the synthesis of the probe, or due to poor purification of the probe. IDT performs HPLC, mass spectrometry, and capillary electrophoresis on each probe synthesized to ensure the purity of the probe. These QC results are all posted on the customer’s web account at no extra charge. High background can also be caused by poor quenching of the probe. Probes longer than 30 bases potentially have poor quenching ability. Make sure to design the probes to be shorter than 30 bases, if possible. If there is a long run of As or Ts, the addition of LNA bases can help raise the Tm. Poor quenching may also occur if an inappropriate quencher is being used for the assay. Verify that the quencher and fluorophore are a good pair. See section 4.1.1 for proper design of probes and Figure 11 for absorbance ranges of quenchers and fluorophores. To check integrity of the probe, perform a STNR (signal to noise ratio) assay. Take an aliquot of the probe to a final concentration of 0.25 μM. Add 1U Micrococcal Nuclease and digest the sample at 37°C. Measure the increase in fluorescence over a background reaction of a probe plus buffer without the addition of Micrococcal Nuclease. An intact probe should exhibit an increased fluorescence. A degraded probe would exhibit a constant fluorescence. Alternatively, if available, check the probe by running it through capillary electrophoresis or mass spectrometry. 7.3.6 Is there absolutely no fluorescence signal? The baseline fluorescence should be above background. Run a reaction without the primer/probe mixture and compare it to an experimental plate to see if the experimental plate is producing any fluorescence above background. No fluorescent signal may be due to an incorrect concentration of probe added to the reaction (see section 7.5.1), a degraded probe (see sections 7.3.2 and 7.3.3), or an issue with the instrument (see section 7.6). 53 User’s Manual 7.4 Sample Expression 7.4.1 Is the target expressed in the sample? A signal will not be detectable if the target gene is not expressed in a given sample or is expressed below a detectable level. Verify that the probe and primer sequences match the actual target. If the sequences match, try a new cDNA prep. We recommend using 10-100 ng of cDNA per reaction. Alternatively, you can try a variant sequence. Positive controls are very important to be sure the reaction is working. A positive control template can be ordered as either a miniGene or Ultramer from IDT. 7.4.2 Did you include enough template in the reaction? If too little template was included in the starting materials, the reaction may not have been able to amplify the target to a level that is detectable. Increase the amount of template in the reaction. 7.5 Incorrect Reaction Setup 7.5.1 Were all components added and in the correct amount? It is possible that one of the components was inadvertently left out or added at an incorrect concentration. We recommend that you repeat a failed experiment once to make sure it was not due to a simple mistake in the first round. Refer to the protocol to verify that all listed components were added. Verify that all reagents were added in the appropriate concentration. See section 4.2.2 for a protocol. 7.5.2 Were any of the reagents expired? Check the expiration date on all reaction components to make sure they are not expired. Replace any expired reagents. 54 7.5.3 Was the reaction thoroughly mixed? This is a common mistake and will result in a large spread in the replicates and poor spacing between standards. Be sure to vortex the sample after all components are added. 7.5.4 Are the primers and probe at the optimal concentration? The protocol in section 4.2.2 lists the recommended primer and probe concentrations; however, this may not be ideal for your sample. Increase the concentration in 25 nM increments. See Figure 18 for an example of curves from a reaction run with a low concentration of probe. Correct Probe Concentration Incorrect Probe Concentration Figure 18. Example of low signal due to an incorrect probe concentration, shown in Rn Linear View. 7.6 Instrument 7.6.1 Does the instrument need a new light source/bulb? Refer to your instrument’s manual for instructions on how to replace a light source/bulb. 55 User’s Manual 7.6.2 Is the instrument set on the correct dye and filter settings? See section 4.1.2 for more information on dye selection and for IDT-recommended dyes for each instrument. Check your instrument’s guidelines for compatible dyes and filter settings. 7.6.3 Does the instrument need calibration? All instruments should have monthly maintenance including calibration. Refer to the instrument manual for instructions. Run an assay that has previously worked to see if it is still working. 7.6.4 Does the block have fluorescent contaminants resulting in high background and decreasing signal? Run a background or water plate to confirm the background is still within specification. Refer to the instrument manual or contact a service organization. 7.6.5 Are the cycling temperatures and time parameters set correctly? Check all parameters to be sure they are set to the conditions suggested in the protocol in section 4.2.2. Make sure the fluorescence is being collected at the extension step. 7.7 Threshold 7.7.1 Is the threshold set too high or too low? The threshold is the ΔRn level that determines the threshold cycle, or Cq. The threshold is set as a line above the baseline and through the amplification curve in the exponential growth region. The Cq is the cycle number where this threshold line crosses the fluorescence amplification plot. Setting the threshold is instrument dependent. For more information on setting the threshold, see section 6.2 and the documentation for the instrument you are using. 56 Figure 19. Examples of Threshold setup shown in log view. The threshold is indicated by a green line through the curve. Panel 1 – correct setup – in exponential phase, Panel 2 - incorrect setup – in plateau phase, Panel 3 – incorrect setup – in baseline phase 7.8 RNA Sample Quality 7.8.1 Is the template degraded? A number of factors can contribute to poor template quality including the method used to isolate the RNA, a poor reverse transcription, and improper storage and handling. Check the quality of the sample by assessing the RNA integrity or examining a small amount on a gel (see section 2.3). Use TE when resuspending the RNA sample as described in the resuspension protocol in section 4.2.1. Check the RT reagents for contamination or expiration. 7.8.2 Is the template contaminated? Some contaminants can remain in the sample from the host tissue or cell, enzymes in the RT or qPCR reactions, components used to isolate the RNA, or other reagents added in the process. These contaminants can inhibit the amplification of the sample. To check for inhibitors, run a serial dilution of your sample with an endogenous control assay. The highest concentration of template has the highest concentration of inhibitor, which causes a delayed Cq. In contrast, a lower concentration has lower inhibitor levels and so will result in an earlier Cq and will change the slope in the line. 57 User’s Manual Average Cq Values Oligo dT Primed 35.0 34.0 33.0 32.0 31.0 30.0 29.0 28.0 27.0 26.0 25.0 24.0 23.0 22.0 21.0 20.0 8 ng cDNA 0.8 ng cDNA 0.08 ng cDNA No Treatment 2' NaOH 5' NaOH 10' NaOH Treatment Time Average Cq Values Random Hexamer Primed 35.0 34.0 33.0 32.0 31.0 30.0 29.0 28.0 27.0 26.0 25.0 24.0 23.0 22.0 21.0 20.0 8 ng cDNA 0.8 ng cDNA 0.08 ng cDNA No Treatment 2' NaOH 5' NaOH 10' NaOH Treatment Time Intact Partially Degraded Figure 20. Effect of poor sample quality. Poor RNA quality can delay C q values. Two samples with untreated RNA (top left) and degraded RNA (bottom left) were compared. The C q values were delayed for the degraded RNA as compared to the untreated RNA as shown by the average C q values (top right) and the curves (bottom right). 8 ng, 0.8 ng, and 0.08 ng of cDNA were left untreated or treated with NaOH for 2 minutes, 5 minutes, or 10 minutes to create increasing levels of degradation. 58 7.9 Design Specificity 7.9.1 Are there mismatches between target and assay sequences? Perform a BLAST to check for the specificity of the target and assay sequences. Run a gel to see if the correct size of product is being amplified. 7.10 Passive Reference Problem 7.10.1 Do you have fluctuation in the passive reference signal? It is important to make sure that the passive reference signal is significantly higher than the background signal of the instrument. Check your master mix to see if it has the correct passive reference concentration (high or low ROX) for the instrument that you are using. The use of high or low ROX will depend on the instrument—check the instrument manual. This problem may also arise if ROX is degraded. If the ROX signal is too low, the ΔRn will be high and noisy. If the ROX signal is too high, the ΔRn will be low. 7.11 Multiplexing 7.11.1 Do all the primers have a similar Tm? Do all the probes have a similar Tm? Make sure all of the primers and all of the probes have similar melting temperatures. The melting temperatures of the probes should be 6-10°C higher than those of the primers. Limit the primers for the highest expressing targets to a 1:1 primer:probe ratio. See section 4.1.3 for more information on setting up a multiplexed assay. 7.11.2 Do the Cq values of the target in the multiplex look similar to the same target in a single reaction? The Cq values should be similar whether a target is tested as a single reaction or a multiplex reaction. Limit the primers for the highest expressing targets to a 1:1 primer:probe ratio. Double the amounts of dNTPs and enzyme in the master mix. See section 4.1.3 for more information on setting up a multiplexed assay. 59 User’s Manual 7.11.3 Are the individual targets expressed at similar levels in the sample? A more abundant target may amplify more efficiently than a less abundant target and compromise the entire reaction. This is of particular concern in later cycles when the dNTPs and Taq are limiting. Limit the primers for the highest expressing targets to a 1:1 primer:probe ratio. Add twice the amounts of dNTPs and enzyme in the master mix. See section 4.1.3 for more information on setting up a multiplexed assay. 7.12 Primer-Primer or Primer-Probe Interaction 7.12.1 Is one of the primers interacting with the probe? Or are the primers forming a primer-dimer? The amplification curve may show a rising baseline. Make sure to run a no template control. Evaluate the cross reactivity of each assay component. 7.13 Genomic DNA Contamination 7.13.1 Do you see contamination in the no RT control? Amplification in the no RT control may indicate genomic contamination. Treat samples that contain genomic DNA with DNase (see section 3). When possible, design primers, probes, or amplicons so that they span an exon-exon junction to avoid amplification of genomic DNA (see section 4.1.1). 60 7.14 Amplicon Contamination 7.14.1 Do you see contamination in the no template control? Amplification in the no template control may indicate amplicon cross contamination. See section 2.4 on ways to avoid contamination. If you do find contamination in your sample be sure to replace all reagents and stock buffers and thoroughly clean the PCR preparative areas. Related Products at IDT RNaseAlertTM and DNaseAlertTM: IDT has developed these reagents which allow for rapid, sensitive detection of RNases or DNases. These reagents are fluorescencequenched oligonucleotide probes that emit a fluorescent signal only after nuclease degradation. The assays can be used qualitatively to test lab reagents, equipment, and supplies for nuclease contamination. For more information and to order RNaseAlert and DNaseAlert, visit the IDT website at www.idtdna.com. 61 User’s Manual 7.15 Standard Curves 7.15.1 Does the test sample give a lower Cq than highest standard curve dilution? The sample is likely too concentrated. Dilute the test sample. See section 5.1 for more information on the standard curve. 7.15.2 Does the test sample give a higher Cq than the lowest dilution on the standard curve? The reaction may have reached the limit of detection. Increase the amount of cDNA in the reaction. See section 5.4 for more information on the limit of detection. 7.15.3 Is the standard curve set within an appropriate range? The standard curve should remain within the range of the target. See section 5.1 for more information on standard curves. 7.15.4 Were the serial dilutions precise? Imprecise dilutions will lead to an imprecise standard curve. Prepare a fresh dilution series from a known concentration. See section 5.1 for more information on standard curves. Check the calibration on the pipettes. Make sure to use pipettes that are appropriate for the volume amounts. All standard dilutions should be done in the presence of 100 ng/µL tRNA to avoid absorption of nucleic acids on the plastic. This is especially important for the lower copy number dilutions. 62 7.15.5 Does the standard curve show amplification efficiency greater than 115%? An insufficient number and range of dilutions can lead to an erroneous standard curve. A standard curve across multiple logs is needed (Figure 14 and section 5.1). The curve should be at least 4 orders of magnitude and should cover 5 to 6 log10 concentrations. Check the values on the replicates to be sure they have a difference of less than 0.5 Cq. x x Figure 21a. Unknown C q value outside the standard curve range. Top panel - Purple curves are unknown ERBB3 levels in 10 ng of Hepa 1-6 cell line RNA. Standards include 1E6-1E2 copies of cloned plasmid. Bottom panel – The blue X marks the C q value of the unknown as being outside the standard curve range. 63 Figure 21b. Unknown C q value within the standard curve range. Top panel - Purple curves are unknown CTNNB1 levels in 10 ng of Hepa 1-6 cell line RNA. Standards include 1E6-2E1 copies of cloned plasmid. Bottom panel – The blue X marks the C q value of the unknown as within the range of the standard curve. User’s Manual 7.16 Master Mix 7.16.1 Did you use a master mix? Every single sample should be treated in the same manner in order to achieve reliable results. For that reason, it is very important to use a master mix to ensure that every sample receives the same amount of each of the reaction components. See section 4.2.2a for more information on master mixes. 7.16.2 Was the master mix stored properly? Check the instructions for the master mix to verify proper storage. Also check for expiration dates to be sure the mix is still current. Replace any expired reagents. 7.16.3 Was the ROX concentration correct in the master mix? Check your master mix to verify it has the correct passive reference (high or low ROX) for the instrument that you are using. The use of high or low ROX will depend on the instrument – check the instrument manual. This problem may also arise if ROX is degraded. If the ROX signal is too low, the ΔRn will be high and noisy. If the ROX signal is too high, the ΔRn will be low. 64 50 nM ROX 10 nM ROX Figure 22a. Example of an incorrect ROX concentration (too low). The top panels show the correct ROX concentration while the bottom panels show a concentration that is too low. ROX concentrations were tested using Immolase DNA Polymerase (Bioline), 250 nM Probe, 500 nM primers (Assay NM_004530.2), 0.8 mM dNTP, and 3 mM MgCl2. Tenfold serial dilutions were performed on cDNA made from Human Universal Reference RNA (20 – 0.002 ng). Cycling conditions were 9510:00-(950:15-601:00)x 45. 50 nM ROX 100 nM ROX Figure 22b. Example of an incorrect ROX concentration (too high). The top panels show the correct ROX concentration while the bottom panels show a concentration that is too high. ROX concentrations were tested using Immolase DNA Polymerase (Bioline), 250 nM Probe, 500 nM primers (Assay NM_004530.2), 0.8 mM dNTP, and 3 mM MgCl2. Tenfold serial dilutions were performed on cDNA made from Human Universal Reference RNA (20 – 0.002 ng). Cycling conditions were 9510:00-(950:15-601:00)x 45. 65 User’s Manual 7.16.4 Does an assay that has worked previously still work with the mastermix? Rerun an assay that you know has worked previously to see if the problem is assayspecific. 7.16.5 Does the master mix have amplicon or genomic DNA contamination? See sections 7.14 (amplicon) and 7.13 (genomic DNA) for information on contamination. See section 2.4 for ways to prevent contamination. 66 7.17 Normalization 7.17.1 Did you use an appropriate normalization control for your sample? The data gathered from normalization can only be as good as the control used. Make sure that the control has been verified as appropriate for your sample before you use it as a normalizer. The expression level of the reference should be the same across all samples. See section 6.3.2a for more information on normalization. Hs PGK1 Hs SFRS9 Figure 23. Choosing the most stable normalizer. RNA was isolated and cDNA created from 18 wells of HepG2 cells transfected with a control DsiRNA. Assays targeting PGK1 and SFRS9 were performed on the same cDNAs. The SFRS9 assay curves showed a smaller degree of variance than PGK1 assays. 67 User’s Manual 7.18 Reaction Parameters 7.18.1 Was the reverse transcription step too short? Increase the length of the reverse transcription step in 5-minute increments up to a maximum of 60 minutes. 7.18.2 Was the reverse transcription temperature too low? Increase the temperature of the reverse transcription reaction in 5°C increments up to a maximum as determined by the enzyme and the type of primer you are using. 7.18.3 Was the reverse transcription reaction set up at room temperature? The reaction should be set up on ice so that the cDNA synthesis does not begin prematurely. 7.18.4 Is the annealing or extension step long enough? Annealing or extension steps that are too short can result in no or little amplification. Increase the time in 3-second increments up to a maximum of 30 seconds for an average length amplicon. 7.18.5 Is the annealing temperature too high or too low? An annealing temperature that is too high can result in no amplification while one that is too low can result in non-specific amplification or primer-dimers. Change the annealing temperature in 2°C increments. 68 7.18.6 Did the reaction have enough cycles? Too few reaction cycles can result in no or little amplification. The number of cycles can vary from 35 to 45 but the ideal number of cycles is 40. 7.18.7 Was the activation step in the PCR reaction long enough for the enzyme that you used? Some enzyme will require longer activation at 95°C than others. Check the requirements for the enzyme you are using. 60 Sec Anneal/Extend 45 Sec Anneal/Extend 15 Sec Anneal/Extend Figure 24. Examples of assay results when run at different cycling conditions. Panel 1 – 60 seconds for annealing and extension, Panel 2 – 45 seconds for annealing and extension, Panel 3 – 15 seconds for annealing and extension. Reactions were run with the AB Gene Expression MasterMix, a 384-well format, 10 µL per reaction, and a 5 log dilution of Human Universal Reference RNA cDNA. 69 User’s Manual 8. References 1. Bustin, S.A. et al., The MIQE guidelines: minimum information for publication of quantitative real-time PCR experiments. Clin Chem, 2009. 55(4): p. 611-22. 2. Heid, C.A. et al., Real time quantitative PCR. Genome Res, 1996. 6(10): p. 986-94. 3. Hindiyeh, M. et al., Evaluation of a multiplex real-time reverse transcriptase PCR assay for detection and differentiation of influenza viruses A and B during the 2001-2002 influenza season in Israel. J Clin Microbiol, 2005. 43(2): p. 589-95. 4. Thiel, C.T. et al., A new quantitative PCR multiplex assay for rapid analysis of chromosome 17p11.2-12 duplications and deletions leading to HMSN/HNPP. Eur J Hum Genet, 2003. 11(2): p. 170-8. 5. Nazarenko, I. et al., Effect of primary and secondary structure of oligodeoxyribonucleotides on the fluorescent properties of conjugated dyes. Nucleic Acids Res, 2002. 30(9): p. 2089-195. 6. Tyagi, S. and F.R. Kramer, Molecular beacons: probes that fluoresce upon hybridization. Nat Biotechnol, 1996. 14(3): p. 303-8. 7. VanGuilder, H.D., K.E. Vrana, and W.M. Freeman, Twenty-five years of quantitative PCR for gene expression analysis. Biotechniques, 2008. 44(5): p. 619-26. 8. Marras, S.A., F.R. Kramer, and S. Tyagi, Multiplex detection of single-nucleotide variations using molecular beacons. Genet Anal, 1999. 14(5-6): p. 151-6. 9. Gudnason, H. et al., Comparison of multiple DNA dyes for real-time PCR: effects of dye concentration and sequence composition on DNA amplification and melting temperature. Nucleic Acids Res, 2007. 35(19): p. e127. 10. Sang, F. and J. Ren, Capillary electrophoresis of double-stranded DNA fragments using a new fluorescence intercalating dye EvaGreen. J Sep Sci, 2006. 29(9): p. 1275-80. 11. Zipper, H. et al., Investigations on DNA intercalation and surface binding by SYBR Green I, its structure determination and methodological implications. Nucleic Acids Res, 2004. 32(12): p. e103. 12. Boom, R. et al., Rapid and simple method for purification of nucleic acids. J Clin Microbiol, 1990. 28(3): p. 495-503. 70 13. Fleige, S. and M.W. Pfaffl, RNA integrity and the effect on the real-time qRT-PCR performance. Mol Aspects Med, 2006. 27(2-3): p. 126-39. 14. Nolan, T., R.E. Hands, and S.A. Bustin, Quantification of mRNA using real-time RT-PCR. Nat Protoc, 2006. 1(3): p. 1559-82. 15. Poon, K. and R.B. Macgregor, Jr., Unusual behavior exhibited by multistranded guanine-rich DNA complexes. Biopolymers, 1998. 45(6): p. 427-34. 16. Owczarzy, R. et al., Predicting sequence-dependent melting stability of short duplex DNA oligomers. Biopolymers, 1997. 44(3): p. 217-39. 17. Owczarzy, R. et al., Predicting stability of DNA duplexes in solutions containing magnesium and monovalent cations. Biochemistry, 2008. 47(19): p. 5336-53. 18. SantaLucia, J., Jr. and D. Hicks, The thermodynamics of DNA structural motifs. Annu Rev Biophys Biomol Struct, 2004. 33: p. 415-40. 19. McTigue, P.M., R.J. Peterson, and J.D. Kahn, Sequence-dependent thermodynamic parameters for locked nucleic acid (LNA)-DNA duplex formation. Biochemistry, 2004. 43(18): p. 5388-405. 20. Xia, T. et al., Thermodynamic parameters for an expanded nearest-neighbor model for formation of RNA duplexes with Watson-Crick base pairs. Biochemistry, 1998. 37(42): p. 14719-35. 21. Arezi, B. et al. Amplification efficiency of thermostable DNA polymerases. Anal Biochem, 2003. 321(2): p. 226-35. 22. Willems, E., L. Leyns, and J. Vandesompele, Standardization of real-time PCR gene expression data from independent biological replicates. Anal Biochem, 2008. 379(1): p. 127-9. 23. Pfaffl, M.W., Relative quantification, in Real-time PCR, T. Dorak, Editor. 2006, International University Line: La Jolla, CA. p. 63-82. 24. Huggett, J. et al., Real-time RT-PCR normalisation; strategies and considerations. Genes Immun, 2005. 6(4): p. 279-84. 25. Livak, K.J. and T.D. Schmittgen, Analysis of relative gene expression data using real-time quantitative PCR and the 2(-Delta Delta C(T)) Method. Methods, 2001. 25(4): p. 402-8. 71 User’s Manual 9. Notice of Limited Licenses NOTICE TO PURCHASER: LIMITED LICENSES IDT manufactures and sells PrimeTime™ qPCR Probes for research purposes only under licenses from both Life Technologies and Roche Molecular Systems. If applicable, IDT requires that customers comply with both of the following licensing statements. PrimeTime™ Assays are sold only under license from Life Technologies, and must be used in compliance with the Life Technologies’ limited license. Life Technologies (Scientific Research) A license to perform the patented 5’ Nuclease Process for research is obtained by the purchase of (i) both Licensed Probe and Authorized 5’ Nuclease Core Kit, (ii) a Licensed 5’ Nuclease Kit, or (iii) license rights from Applied Biosystems. This product contains Licensed Probe. Use of this product is covered by one or more of the following US patents and corresponding patent claims outside the US: 5,538,848, 5,723,591, 5,876,930, 6,030,787, 6,258,569, and 5,804,375 (claims 1-12 only). The purchase of this product includes a limited, non-transferable immunity from suit under the foregoing patent claims for using only this amount of product for the purchaser’s own internal research. The right to use this product in the 5’ Nuclease Process under the applicable claims of US Patents Nos. 5,210,015 and 5,487,972, and corresponding patent claims outside the United States, can be obtained through purchase of an Authorized 5’ Nuclease Core Kit. Except under separate license rights available from Applied Biosystems, no right under any other patent claim, or to perform commercial services of any kind, including without limitation reporting the results of purchaser’s activities for a fee or other commercial consideration, or to sublicense, repackage with other products, or resell in any form, is conveyed expressly, by implication, or by estoppel. This product is for research use only. Diagnostic uses under Roche patents require a separate license from Roche. Further information on purchasing licenses may be obtained from the Director of Licensing, Applied Biosystems, 850 Lincoln Centre Drive, Foster City, California 94404, USA. Roche Molecular (Diagnostic Research) “THIS PROBE IS MADE AND SOLD PURSUANT TO A LICENSE UNDER U.S. PATENT NOS. 6,214,979, 5,210,015, 5487,972, 7,445,900 AND 5,804,375 (CLAIMS 1-12 ONLY) AND CORRESPONDING CLAIMS IN PATENTS OUTSIDE THE U.S. OWNED BY ROCHE. PURCHASE OF THIS PROBE ENTITLES THE PURCHASER TO USE THE PROBE IN A REACTION MIXTURE COVERED ONLY BY CLAIMS 1-12 OF THE 5,804,375 PATENT AND COUNTERPART CLAIMS OF SAID CLAIMS OUTSIDE THE UNITED STATES OWNED BY ROCHE TO PERFORM ONLY INTERNAL RESEARCH USING THE 5’ NUCLEASE PROCESS IN THE DIAGNOSTIC RESEARCH FIELD. NO LICENSE IS HEREBY GRANTED FOR ANY OTHER FIELD OF USE AND NO LICENSE OR OTHER RIGHTS ARE GRANTED TO INCLUDE THIS PROBE IN ANY ROCHE PATENTED KIT OR TO PROVIDE THE RESULTS OF ANY REACTION OR TEST USING THIS PROBE TO ANY THIRD PARTY, EXPRESSLY OR BY IMPLICATION, BY THE SALE OR PURCHASE OF THIS PRODUCT. NO LICENSE OR OTHER RIGHTS ARE INCLUDED UNDER ANY OTHER ROCHE PATENT DIRECTED TO ANY NUCLEIC ACID AMPLIFICATION OR DETECTION PROCESS, REACTION MIXTURE OR KIT, EXPRESSLY OR BY IMPLICATION, BY THE SALE OR PURCHASE OF THIS PRODUCT. PRACTICE OF ANY OTHER ROCHE PATENTED NUCLEIC ACID AMPLIFICATION OR DETECTION PROCESS, THE INCLUSION OF THIS PROBE IN ANY ROCHE PATENTED KIT OR PROVIDING THE RESULTS OF ANY REACTION OR TEST USING THIS PROBE TO ANY THIRD PARTY REQUIRES A SEPARATE LICENSE. FOR INFORMATION ON PURCHASING SUCH LICENSES IN THE DIAGNOSTICS RELATED FIELDS, PLEASE CONTACT THE LICENSING DEPARTMENT OF ROCHE MOLECULAR SYSTEMS, INC., 4300 HACIENDA DRIVE, PLEASANTON, CALIFORNIA 94588, USA.” 72 Texas Red® is a registered trademark of Molecular Probes/Life Technologies and is licensed for research use under patents or patent applications owned by Molecular Probes/Life Technologies. BHQ® quenchers and products incorporating them are to be used for research & development purposes only and may not be used for any commercial, clinical, in vitro diagnostic or other use. Products incorporating these dyes are subject to the proprietary worldwide rights of Biosearch Technologies, Inc. and are made and sold under license from Biosearch Technologies, Inc. There is no implied license for commercial use with respect to the products and a license must be obtained directly from Biosearch Technologies, Inc. with respect to any sale, lease, license or other transfer of the products or any material derived there from, the sale, lease, license or other grant of rights to use the Products or any material derived or produced from them, or the use of the Products to perform services for a fee for third parties (including fee for service or contract research). CyDye®, Cy®, and Cy5® dyes are registered trademarks of GE Healthcare Limited. The purchase of this Product includes a limited non-exclusive sublicense under U.S Patent Nos. 5 556 959 and 5 808 044 and foreign equivalent patents and other foreign and U.S counterpart applications to use the amidites in the Product to perform research. NO OTHER LICENSE IS GRANTED EXPRESSLY, IMPLIEDLY OR BY ESTOPPEL. Use of the Product for commercial purposes is strictly prohibited without written permission from Amersham Biosciences Corp. For information concerning availability of additional licenses to practice the patented methodologies, please contact Amersham Biosciences Corp, Business Licensing Manager, Amersham Place, Little Chalfont, Bucks, HP79NA. EvaGreen® is a registered trademark of Biotium, Inc TYE™, MAX™, TEX™ 613, PrimerQuest®, Oligo Analyzer® and SciTools® are trademarks of Integrated DNA Technologies. FAM™, HEX™, ROX™, TAMRA™ and TET™ are trademarks of Applied Biosystems, Inc. LightCycler® Dyes are a registered trademark of a member of the Roche group and are sold under license from Roche Molecular Diagnostics GmbH. Molecular Beacons are sold under license from the Public Health Research Institute only for use in a purchaser’s research and development activities. Scorpions® is a registered trademark of DxS Limited LTD SYBR® Green is a registered trademark of Molecular Probes, Inc TaqMan® is a registered trademark of Roche Molecular Systems that is licensed exclusively to Applied Biosystems Inc. for use in certain non-diagnostics fields. Tye™ Dyes are sold under license from Thermo Fisher Scientific (Milwaukee) LLC. 73