1
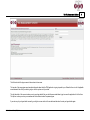
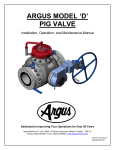
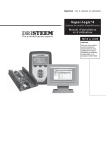
Pipelines 2 Data (P2D) Ltd Pig Managem ent
System
Client User Manual
©2011 Pipelines 2 Data (P2D) Ltd
Pig Management System
b y Pi p el i n es 2 Data (P2D) L td
The P ipelines 2 Data (P 2D) P ig Managem ent S ys tem is a s ec ure web b as ed applic ation that allows the full m anagem ent of m ultiple pigging
program m es ac ros s m ultiples pipelines and c lients . The s ys tem allows for m ultiple pigging program m es agains t either one or m any c lient
pipelines utilis ing c lient as s igned pigs . A ll pig runs are trac k ed and graphs are produc e of the deb ris rem oved b y eac h run. The c ondition of
the pig after eac h run is trac k ed and inform ation is s tored ab out the s tate of the pig and the m aintenanc e that the pig requires in order to
b e us ed again for a run. The s ys tem has the ab ility to upload and s tore elec tronic inform ation agains t item s lik e pipelines , pigs or c ondition
reports .
Pipelines 2 Data (P2D) Ltd Pig Management System
©2011 Pipelines 2 Data (P2D) Ltd
All rights reserved. No parts of this work may be reproduced in any form or by any means - graphic, electronic, or mechanical, including photocopying, recording, taping, or
information storage and retrieval systems - without the written permission of the publisher.
Products that are referred to in this document may be either trademarks and/or registered trademarks of the respective owners. The publisher and the author make no claim
to these trademarks.
While every precaution has been taken in the preparation of this document, the publisher and the author assume no responsibility for errors or omissions, or for damages
resulting from the use of information contained in this document or from the use of programs and source code that may accompany it. In no event shall the publisher and the
author be liable for any loss of profit or any other commercial damage caused or alleged to have been caused directly or indirectly by this document.
Printed: February 2012 in (whereever you are located)
Contents
3
Table of Contents
Part I The Pig Management System
4
1 Accessing the Pig Management System
4
2 The PMS Menu Bar
6
3 The PMS Tracker
8
The PMS Tr ack er Tr ee
Click ing at the Pipelines 2Data Level In the Tr ee
Click ing at the Client Level In the Tr ee
Click ing at the Pipeline Level In the Tr ee
Pipeline Details
System Information
Click ing at the Pr ogr am m e Level In the Tr ee
Programme Details
Timeline
Debris Removal Trend
Click ing at the Pig Run Level In the Tr ee
Condition Report
Maintenance
System Information
4 The PMS Pig Section
Finding Your Pig
Pig Details
Pig Runs
Pig Condition Repor ts
Maintenance His tor y
Logis tics
Sys tem Infor m ation
5 The PMS Stock Information
9
10
11
14
16
19
20
23
24
25
27
28
30
31
32
34
35
36
39
41
43
44
45
©2011 Pipelines 2 D ata (P2D ) Ltd
3
4
1
Pipelines 2 Data (P2D) Ltd Pig Management System
The Pig Management System
The Pipelines2Data Pig Management System is a secure web based application that allows the full management of multiple pigging programs across
multiples pipelines and clients. The system allows for multiple pigging programs against either one or many client pipelines utilising client assigned pigs. All
pig runs are tracked and graphs are produce of the debris removed by each run. The condition of the pig after each run is tracked and information is stored
about the state of the pig and the maintenance that the pig requires in order to be used again for a run. The system has the ability to upload and store
electronic information against items like pipelines, pigs or condition reports.
1.1
Accessing the Pig Management System
The first screen you see when you access the PMS is the logon screen which is shown below and is separated into three main areas.
©2011 Pipelines 2 D ata (P2D ) Ltd
The Pig Management System
5
The left hand side of the logon screen is broken down into two areas.
The top part of the screen gives some descriptive information about what the PMS application is going to provide to you. Below this there is a list of applicable
announcements that will tell you what is going on with the system or with your data.
The right hand side of the screen is where you enter your logon details that you should have received before trying to access the application for the first time.
The top box is where you enter your username and the box below is where the password goes.
If you enter any of your logon details incorrectly you will get a screen similar to the one below and be asked to enter your logon details again.
©2011 Pipelines 2 D ata (P2D ) Ltd
6
Pipelines 2 Data (P2D) Ltd Pig Management System
Should you not have your details or the ones you were sent don't appear to work please get in contact with Pipelines2Data to check your details or get new
ones sent through.
1.2
The PMS Menu Bar
The menu bar sits along the top of the PMS application and allows access to the main areas of the system. The selected menu option is highlighted in white,
after a successful logon you will be taken by default to the home page which is very similar to the logon page without the need for a username and password
form.
©2011 Pipelines 2 D ata (P2D ) Ltd
The Pig Management System
7
The other four options on the menu bar are as follows :TRACKER
This option take you to the area of the PMS application where your pipelines and their associated programs details are shown.
PIGS
This option takes you to the area of the PMS application where all the pig details are shown.
STOCK
This option takes you to the area of the PMS application where all the stock that is used by your pigs are shown.
SIGN OUT
This option ends your session on the PMS application and returns you to the logon page.
If you do not use the system for a period of 10 minutes then you will see a message box like below telling you that your session has timed out because of
inactivity.
When you press the ok button then you will be be returned to the home page again, this is a protection mechanism much like what you have with online
banking and most password protected websites.
©2011 Pipelines 2 D ata (P2D ) Ltd
8
1.3
Pipelines 2 Data (P2D) Ltd Pig Management System
The PMS Tracker
The tracker page is the main area of the Pig Management System. It is this screen that gives you access to all the details for every pipeline and every
associated programme that you have being managed by Pipelines2Data.
The page is divided into two main areas, the left hand area is shown as a tree much like Windows Explorer and allows access to all the different levels within
the tracker, the right hand side changes depending on what level of the tree you are accessing. The page opens up at the client level and with the tree on the
left hand side fully expanded like the screenshot below shows.
©2011 Pipelines 2 D ata (P2D ) Ltd
The Pig Management System
9
This part of the application can be broken down into six different areas of functionality
1.
2.
3.
4.
5.
6.
1.3.1
The PMS Tracker Tree
Clicking at the Pipelines2Data Level In the Tree
Clicking at the Client Level In the Tree
Clicking at the Pipeline Level In the Tree
Clicking at the Programme Level In the Tree
Clicking at the Pig Run Level In the Tree
The PMS Tracker Tree
The tree at the left hand side of the main tracker screen opens up defaulted as fully expanded but can be collapsed and then expanded by click on the little +
and - boxes next to each link in the tree. The functionality of the tree is the same as Windows Explorer.
At the top of the tree you will see a button which has a yellow star inside. Pressing this button hides the tree from
view and allows the detail panel on the right hand side to take up the whole width of your screen. This can be very
useful if you are working on a lower resolution monitor as you will be able to see a lot more of he detail information.
Pressing the star button again will unhide the tree.
The text next to this button is called a "bread crumb" and shows you exactly where in the tree you are and can be
most helpful especially when the tree is hidden.
You can click on any of the items of text in between the > to take you directly to that level in the tree.
The tree allows access to the 5 levels of functionailty and each level is linked to a separate image in the tree. Clicking
on each level opens up further details on the right hand side of the window.
Level 1 - Top : Pipelines2Data
Level 2 - Client : P2D Client Company
Clicking this shows the client list on the right hand side.
Clicking on this levels shows the pipeline list details on the
right hand side
Level 3 - Pipeline : P2D001: 16" MCH to DUN Clicking on a pipeline brings up the programme list which
lists of all the programmes associated with this pipeline on
the right hand side.
Level 4 - Programme : 2008s-CCR-PRJ-001
Clicking on a programme opens up thepig runs listing all
the runs associated with this programme on the right hand
©2011 Pipelines 2 D ata (P2D ) Ltd
10
Pipelines 2 Data (P2D) Ltd Pig Management System
Level 5 - Pig Run - 1 - MUR-02
1.3.2
side.
Clicking on an individual pig run opens up the Pig Run
Details on the right hand side.
Clicking at the Pipelines2Data Level In the Tree
The client list is accessed by clicking on the top level of the PMS Tracker Tree labelled with the text Pipelines2Data. The screenshot below shows you the
default view shown at this level (please note the screenshot below has the tree hidden using the yellow star button next to the bread crumb text.
©2011 Pipelines 2 D ata (P2D ) Ltd
The Pig Management System
The table shown the details for the logged on users company. You can export these details to Microsoft Excel by clicking the
side of the Clients title bar.
1.3.3
11
picture at the right hand
Clicking at the Client Level In the Tree
The pipeline list is accessed by clicking on the name of your client (e.g. P2D Client Company 1) which sits at the second level in the tree. The screenshot
below shows you the default view shown at this level (please note the screenshot below has the tree hidden using the yellow star button next to the bread
crumb text.
©2011 Pipelines 2 D ata (P2D ) Ltd
12
Pipelines 2 Data (P2D) Ltd Pig Management System
When you click on your company in the tree you get a list of all your pipelines that Pipelines2Data are managing a pigging programme on or have ever
managed a pigging programme on assuming you wish to keep your historical data within the system. You can export the list of pipelines to Microsoft Excel
by clicking the
picture at the right hand side of the Pipelines title bar.
The table shows only basic information about the pipeline, it's code reference, name, client name, main client contact, it's size and the product(s) that go
through the pipeline. To get more details about any of the pipelines listed just double click the row you wish to see more details for. A popup will appear like
shown below listing more details about your pipeline.
©2011 Pipelines 2 D ata (P2D ) Ltd
The Pig Management System
13
The full list of other function that can be accessed at this level sit at the right hand side of the bread crumb bar as shown below.
At the pipeline level there are two functions you can access. The first is the default one which has been described above, the other function you can access
at this levels is the Client Details which shows more details about the client company that owns the pipelines together with the contacts that Pipelines 2 Data
(P2D) have for the company. This screen looks like this.
©2011 Pipelines 2 D ata (P2D ) Ltd
14
1.3.4
Pipelines 2 Data (P2D) Ltd Pig Management System
Clicking at the Pipeline Level In the Tree
The programme list is accessed by clicking on any pipeline that belongs to your company (e.g. P2D001 : 16" MSH to DUN) which sits at the third level in the
tree. The screenshot below shows you the default view shown at this level (please note the screenshot below has the tree hidden using the yellow star button
next to the bread crumb text.
©2011 Pipelines 2 D ata (P2D ) Ltd
The Pig Management System
15
When you click on any pipeline in the tree you get a list of all the historical, currently active and future programmes assigned to the selected pipeline. You
can export the list of programmes to Microsoft Excel by clicking the
picture at the right hand side of the Programmes title bar.
The table shows only basic information about the pipeline programmes, their Pipelines 2 Data (P2D) reference and client reference, the start and end date for
the programme and the details surrounding the number of runs and how many have been completed. To get these details in a pop up window just double click
the row you wish to see the details for. A popup will appear like shown below listing the same details about the programme.
©2011 Pipelines 2 D ata (P2D ) Ltd
16
Pipelines 2 Data (P2D) Ltd Pig Management System
The full list of other function that can be accessed at this level sit at the right hand side of the bread crumb bar as shown below.
At the programme level there are three functions you can access. The first is the default one which has been described above, the other functions you can
access at this levels are as follows.
- Pipeline Details
- System Information
1.3.4.1
Pipeline Details
The Pipeline Details screen is accessed from the right hand side menu options on the bread crumb displayed at programme level.
The pipeline details are split into three tabs each of which is pictured below.
Pipeline Characteristics
This tab shows all the pipeline details like the year it was made, the lengths and bends and all the details about the launch and receiver units.
©2011 Pipelines 2 D ata (P2D ) Ltd
The Pig Management System
17
Pipeline Contacts
The pipeline contacts tab shows the client and the pipeline owning company contacts includes their postal address, email and web address together with all
their contact numbers.
©2011 Pipelines 2 D ata (P2D ) Ltd
18
Pipelines 2 Data (P2D) Ltd Pig Management System
Pipeline Comments
The final tab shows a list of all comments that have been stored against the pipeline.These comments can be made by anyone and the list shows these in
chronological order.
©2011 Pipelines 2 D ata (P2D ) Ltd
The Pig Management System
1.3.4.2
System Information
The System Information screen is accessed from the right hand side menu options on the bread crumb displayed at programme level.
©2011 Pipelines 2 D ata (P2D ) Ltd
19
20
Pipelines 2 Data (P2D) Ltd Pig Management System
The System Information tab shows all file uploads that have been added for this pipeline, this can include any files and there is an option of loading these files
into separate folders which are displayed in the left hand side of the window. You can navigate to another folder by simply clicking it. Clicking a folder will then
refresh the right hand side which will list all the files that have been uploaded in the selected folder.
1.3.5
Clicking at the Programme Level In the Tree
The pig run list is accessed by clicking on any programme that belongs to one of your companies pipelines (e.g. 2008s-CCR1-PRJ-001) which sits at the
fourth level in the tree. The screenshot below shows you the default view shown at this level (please note the screenshot below has the tree hidden using the
yellow star button next to the bread crumb text.
©2011 Pipelines 2 D ata (P2D ) Ltd
The Pig Management System
21
When you click on any programme in the tree you get a list of all the pig runs that have either been run, are running or are set to run in the future. You can
export the list of pig runs to Microsoft Excel by clicking the
picture at the right hand side of the Pig Record Sheet title bar.
The table shows information about the pig runs, the sequence, phase, the pig id and type together with the planned and actual dates. If the run has been
completed the details from the run like flowrate and debris retrieved during the run are also shown in the table. By double clicking on any of the runs you can
get these details in a pop up window as shown below.
©2011 Pipelines 2 D ata (P2D ) Ltd
22
Pipelines 2 Data (P2D) Ltd Pig Management System
The full list of other function that can be accessed at this level sit at the right hand side of the bread crumb bar as shown below.
At this level there are four functions you can access. The first is the default one which has been described above, the other functions you can access at this
levels are as follows.
©2011 Pipelines 2 D ata (P2D ) Ltd
The Pig Management System
23
- Programme Details
- Timeline
- Debris Removal Trend
1.3.5.1
Programme Details
The Programme Details screen is accessed from the right hand side menu options on the bread crumb displayed at the pig run record list screen.
This screen shows the same details about the programme that been shown before. The reason it is also available at this level is to allow the user to access
these details without having to move back up a level in the PMS Tracker Tree.
The screen is shown below.
©2011 Pipelines 2 D ata (P2D ) Ltd
24
1.3.5.2
Pipelines 2 Data (P2D) Ltd Pig Management System
Timeline
The Timeline screen is accessed from the right hand side menu options on the bread crumb displayed at the pig run record list screen.
The timeline displays the pig runs in a project plan kind of format. Each pig used in the programme has it's own line so subsequent runs of the same pig
remain in the same line as earlier runs. If the run is in green then this is based on actual runs, if the run is in red then this is currently only a planned run and
subject to changes.
You can export this graph as a PDF by clicking the
image at the right hand side of the Programme Timeline bar.
©2011 Pipelines 2 D ata (P2D ) Ltd
The Pig Management System
1.3.5.3
25
Debris Removal Trend
The Debris removal screen is accessed from the right hand side menu options on the bread crumb displayed at the pig run record list screen.
The debris removal graph plots the amount of soft and hard wax recovered after each pig run. You can export this graph as a PDF by clicking the
the right hand side of the Programme Timeline bar.
©2011 Pipelines 2 D ata (P2D ) Ltd
image at
26
Pipelines 2 Data (P2D) Ltd Pig Management System
©2011 Pipelines 2 D ata (P2D ) Ltd
The Pig Management System
1.3.6
27
Clicking at the Pig Run Level In the Tree
The pig run details is accessed by clicking on any individual pig run from a programme (e.g. 1 - MUR-02 (Planned : 22 Apr 2010)) which sits at the fourth level
in the tree. The screenshot below shows you the default view shown at this level (please note the screenshot below has the tree hidden using the yellow star
button next to the bread crumb text.
The full list of other function that can be accessed at this level sit at the right hand side of the bread crumb bar as shown below.
©2011 Pipelines 2 D ata (P2D ) Ltd
28
Pipelines 2 Data (P2D) Ltd Pig Management System
At this level there are four functions you can access. The first is the default one which has been described above, the other functions you can access at this
levels are as follows.
- Condition Report
- Maintenance
- System Information
1.3.6.1
Condition Report
The Condition Report screen is accessed from the right hand side menu options on the bread crumb displayed at the pig run details screen.
This screen is the equivalent of the current form based system that is filled in after the completion of a pig run. Each condition report can have multiple
pictures uploaded together with all the details regarding the condition of the seals and the general condition of the pig after the run.
The screen is shown below.
©2011 Pipelines 2 D ata (P2D ) Ltd
The Pig Management System
©2011 Pipelines 2 D ata (P2D ) Ltd
29
30
1.3.6.2
Pipelines 2 Data (P2D) Ltd Pig Management System
Maintenance
The Maintenance screen is accessed from the right hand side menu options on the bread crumb displayed at the pig run details screen.
This screen shows the maintenance that was carried out on the pig after the run and can include the spare parts that were needed as well as any painting or
cleaning that was also needed to get the pig ready for it's next run.
©2011 Pipelines 2 D ata (P2D ) Ltd
The Pig Management System
1.3.6.3
System Information
The System Information screen is accessed from the right hand side menu options on the bread crumb displayed at pig run detail level.
©2011 Pipelines 2 D ata (P2D ) Ltd
31
32
Pipelines 2 Data (P2D) Ltd Pig Management System
The System Information tab shows all file uploads that have been added for this pig run, this can include any files and there is an option of loading these files
into separate folders which are displayed in the left hand side of the window. You can navigate to another folder by simply clicking it. Clicking a folder will then
refresh the right hand side which will list all the files that have been uploaded in the selected folder.
1.4
The PMS Pig Section
The pig page is the area of the Pig Management System where all the details about your pigs is accessible from.
The page is divided into two main areas, the left hand area is where you can put in details to find the pig that you want to know details about. The right hand
side changes depending on what details of your pig you are looking at.
©2011 Pipelines 2 D ata (P2D ) Ltd
The Pig Management System
This part of the application can be broken down into seven different areas of functionality
1.
2.
3.
4.
5.
6.
7.
Finding Your Pig
Pig Details
Pig Runs
Pig Condition Reports
Maintenance History
Logistics
System Information
©2011 Pipelines 2 D ata (P2D ) Ltd
33
34
1.4.1
Pipelines 2 Data (P2D) Ltd Pig Management System
Finding Your Pig
To find you pig you use the Pig Selector which is positioned on the left hand side of the Pig screen that is opened by default when you click the menubar link.
At the top of the Pig Selector you will see a button which has a yellow star inside. Pressing this button hides
the pig selector from view and allows the detail panel on the right hand side to take up the whole width of your
screen. This can be very useful if you are working on a lower resolution monitor as you will be able to see a lot
more of he detail information. Pressing the star button again will unhide the tree.
The text next to this button is called a "bread crumb" and shows you exactly what pig you have selected
which can be most helpful especially when the tree is hidden.
You can search for you pig in four different ways, there are
By the Pig Name, this box takes wildcards so you can bring back all pigs beginning with P by typing in P%
in the box.
You can search by Pig Type by selecting the type of pig that you are looking for in the dropdown list.
You can search by the Pipeline that your pig has been used on by selecting the pipeline from the drop down
list.
You can select the company that owns the pig.
To bring back a list of all your pigs you can leave everything as default and just press the filter button. Your
search results are brought back in the list like shown below with the pig name and it's current location in
brackets.
©2011 Pipelines 2 D ata (P2D ) Ltd
The Pig Management System
35
To see the information about you pig select it in the Pig Results window and then click the Select Pig link
underneath the result box.
1.4.2
Pig Details
When you select a pig from the Pig Results displayed in the Pig Selector the default page that is opened up is that of Pig Details. An example of this screen
is shown below.
©2011 Pipelines 2 D ata (P2D ) Ltd
36
Pipelines 2 Data (P2D) Ltd Pig Management System
This screen shows you the pig identifier, the client it belongs to, it's type description and current location from the logistics tab.
The table below these main details lists all the stock parts that this pig uses together with the quantity of the item used.
1.4.3
Pig Runs
This screens gives you the details of all the runs this pig has made as part of a pigging programme is was/is scheduled to make at this point in time. The
details are presented in a table which can be exported to Microsoft Excel.
©2011 Pipelines 2 D ata (P2D ) Ltd
The Pig Management System
The details in the table list all of the pig runs details that are stored by the application
The Pipelines Programme Project Number
The run number from the programme
The phase of the programme
The planned run date
The planned run duration
The flowrate through the pipeline during the run
The actual launch and receive date assuming the run was made
The amount of soft and hard wax that was recovered during the run in the unit of measure used by the particular programme
©2011 Pipelines 2 D ata (P2D ) Ltd
37
38
Pipelines 2 Data (P2D) Ltd Pig Management System
The minimum and maximum pressure recorded during the run
The minimum and maximum temperature recorded during the run
The general condition of the pig after the run
Any comments that were made about the pig run
Please note the final few columns are not visible on the screen without using the scroll bar positioned underneath the grid. Double clicking a line brings up all
the details in a little popup form to make the details easier to read.
©2011 Pipelines 2 D ata (P2D ) Ltd
The Pig Management System
1.4.4
39
Pig Condition Reports
This screens gives you a list of all the Pig Condition Reports that have been made for this pig during it's lifetime. The details are presented in a table which
can be exported to Microsoft Excel.
The table lists the following details
The unique pig condition report number
The job number
The date the PCR was done
©2011 Pipelines 2 D ata (P2D ) Ltd
40
Pipelines 2 Data (P2D) Ltd Pig Management System
The details entered into the general condition box of the PCR
The remarks that were made
Double clicking a line brings up all the details in a little popup form to make the details easier to read.
Because there are so many details stored on a Pig Condition Report this window scrolls. A list of what this window shows is shown below.
©2011 Pipelines 2 D ata (P2D ) Ltd
The Pig Management System
41
PCR No
Job No
Date
Length of Run
Transit Time
Tool type used on pig
Product type(s) in pipeline
Was there a PET of Transmitter fitted
Was a wax sample required
Any hazardous contaminants present
How worm were the sealing discs
Was the wear on the seals even
The specific wear in four locations (as depicted by the diagram) of every seal on the pig including the rear guide(s)
A picture of the pig wear details
A description of the pig wear details
The pig's general condition
A description of the damage if any to the guide disc(s)
A description of the damage if any to the sealing disc(s)
A description of the damage if any to the bumper nose
Any general remarks
Who completed the PCR and when
Up to six pictured of the pig
1.4.5
Maintenance History
This screens gives you a list of all the Pig Maintenance History records that have been made for this pig during it's lifetime. The details are presented in a
table which can be exported to Microsoft Excel.
©2011 Pipelines 2 D ata (P2D ) Ltd
42
Pipelines 2 Data (P2D) Ltd Pig Management System
The details in the table are as follows
Date of maintenance
Title or description of maintenance
Was painting required
Was cleaning required
Was grit blasting required
Was their 3rd party maintenance needed
Labour hours expended
Comments about the Maintenance
©2011 Pipelines 2 D ata (P2D ) Ltd
The Pig Management System
1.4.6
Logistics
This screens tracks the location of the pig during its use in a programme including it's transit back to the Pipelines2Data offices for checking and
maintenance before it returns to the offshore location to be used on the next run.
The grid lists all the logistic information for the selected pig including
The date and time of the logistics record
The location of the pig at that time
©2011 Pipelines 2 D ata (P2D ) Ltd
43
44
Pipelines 2 Data (P2D) Ltd Pig Management System
Who reported the location
Any comment regarding this recor
1.4.7
System Information
The system information screens shows all documentation for the pig. The System Information tab shows all file uploads that have been added for this pig, this
can include any files and there is an option of loading these files into separate folders which are displayed in the left hand side of the window. You can
navigate to another folder by simply clicking it. Clicking a folder will then refresh the right hand side which will list all the files that have been uploaded in the
selected folder.
©2011 Pipelines 2 D ata (P2D ) Ltd
The Pig Management System
1.5
The PMS Stock Information
The stock links shows a list of all parts used by your pigs. It includes a part number a description of the part and the quantity currently held in stock by
Pipelines2Data. Like most grids in the application this can be exported in a Microsoft Excel format.
©2011 Pipelines 2 D ata (P2D ) Ltd
45