1
AN APPLICATION OF DIGITAL VIDEO RECORDING AND OFF-GRID TECHNOLOGY
TO BURROWING OWL CONSERVATION RESEARCH
Jennifer M. Williams
Thesis Prepared for the Degree of
MASTER OF SCIENCE
UNIVERSITY OF NORTH TEXAS
August 2014
APPROVED:
Miguel F. Acevedo, Major Professor
Kamesh Namuduri, Committee Member
Ruthanne Thompson, Committee Member
Shengli Fu, Committee Member and
Interim Chair of the Department of
Electrical Engineering
Costas Tsatsoulis, Dean of the College of
Engineering
Mark Wardell, Dean of the Toulouse
Graduate School
Williams, Jennifer M. An Application of Digital Video Recording and Off-Grid
Technology to Burrowing Owl Conservation Research. Master of Science (Electrical
Engineering), August 2014, 100 pp., 14 tables, 63 illustrations, bibliography, 98 titles.
Through this research, engineering students and conservation biologists
constructed an off-grid video system for observing western burrowing owls in El Paso,
Texas. The burrowing owl has a declining population and their range decreasing, driving
scientists' interest to see inside the den for observing critical nesting behavior. Texas
Parks and Wildlife Department (TPWD) biologists wanted videos from inside the dark,
isolated hillside owl burrows. This research yielded a replicable multi-camera prototype,
empowering others to explore applications of engineering and wildlife monitoring. The
remote station used an off-the-shelf video recording system, solar panels, charge
controller, and lead acid batteries. Four local K-12 science educators participated in
system testing at Lake Ray Roberts State Park through the Research Experiences for
Teachers (RET, NSF #1132585) program, as well as four undergraduate engineering
students as senior design research.
Copyright 2014
by
Jennifer M. Williams
ii
ACKNOWLEDGEMENTS
At this time, I express my sincere appreciation to those who positively influenced
the research discussed herein. I am eternally grateful for the guidance and inspiration
provided by my research mentors: Dr. Miguel Acevedo, Dr. Shengli Fu, Dr. Kamesh
Namuduri, and Dr. Ruthanne Thompson. I extend special thanks to Lois Balin, Richard
Heilbrun, Benny Pol, and John Sproul of Texas Parks and Wildlife Dept. (TPWD) Urban
Wildlife Program for their collaboration and support though this research experience. I
greatly appreciate the contributions of the: undergraduate students (M. Deebani, T.
Nguyen, A. Saunders, J. Xu); teacher participants (D. Chegwidden, R. Jones, C. Meyer,
L. Wolf); TPWD's B. Daniels, M. Daniels, and K. Lauderdale; and volunteers at
installation. The support of the Department of Electrical Engineering faculty and staff is
greatly respected. To family and friends, I offer genuine thanks with special notes to
Brandon Morgan and Christina Reeder.
I gratefully acknowledge funding from: National Science Foundation (NSF)
Graduate Research Fellowship Program (GRFP)–beginning 2012; TPWD Urban Wildlife
Program researchers, staff, and volunteers; NSF RET (NSF #1132585) site in Sensor
Networks at UNT; and the Research in Motion Graduate Student Scholarship. Any
opinions, findings, and conclusions or recommendations expressed in this material are
those of the author and do not necessarily reflect the views of the National Science
Foundation, TPWD, Research in Motion, nor the companies' whose products are
mentioned. I also recognize the licenses held by the prospective companies, namely
ArduinoTM under the Creative Commons Attribution Share-Alike, LGPL, and GPL
licenses.
iii
TABLE OF CONTENTS
Page
ACKNOWLEDGEMENTS ............................................................................................... iii
LIST OF TABLES ........................................................................................................... vii
LIST OF ILLUSTRATIONS ............................................................................................ viii
CHAPTER 1 INTRODUCTION ........................................................................................ 1
1.1
Problem Definition and Motivation...................................................................... 1
1.2
Burrowing Owl Video Project Objectives ............................................................ 1
1.3
Scientific Value of this Research ........................................................................ 2
CHAPTER 2 SUPPORTING KNOWLEDGE ................................................................... 4
2.1
Species and Habitat ........................................................................................... 4
2.2
Related Work ..................................................................................................... 7
CHAPTER 3 DESIGN CONSIDERATIONS .................................................................. 11
3.1
Specifications and Constraints ......................................................................... 11
3.2
Methods ........................................................................................................... 13
3.2.1
Project Development ................................................................................. 13
3.2.2
Data Collection from the Field Site ............................................................ 17
3.2.3
Data Transfer, Review and Long-Term Storage ........................................ 18
3.2.4
Considerations for the Longevity of the Research ..................................... 19
3.3
Equipment Selection ........................................................................................ 19
iv
3.3.1
Most Comparable Vendor-Built Products................................................... 19
3.3.2
Alternative User-Built Approaches ............................................................. 21
3.3.3
Digital Video Recording Systems Overview............................................... 22
3.3.4
Selected Recording System and Off-Grid Equipment ................................ 23
3.3.5
Solar Panel Mount ..................................................................................... 25
3.3.6
Camera Mounts and Access Tunnels ........................................................ 27
3.3.7
Cost Overview ........................................................................................... 31
3.4
Preliminary Equipment Study and Power Considerations ................................ 32
3.4.1
H.264 Compression for Video Storage ...................................................... 34
3.4.2
Motion Detection ........................................................................................ 34
3.4.3
Remote Access to the DVR ....................................................................... 36
3.4.4
Intro to Going Off-Grid with Solar Panels................................................... 41
3.4.5
Sizing the Solar Panels and Battery Backup ............................................. 42
3.4.6
Wild Watch and Power Management with RET ......................................... 46
3.4.7
Outdoor Equipment Study with Undergraduate Team ............................... 58
CHAPTER 4 FINAL TESTING AND DISCUSSION ....................................................... 68
4.1
Final Site at El Paso, Texas ............................................................................. 68
4.1.1
Site Layout................................................................................................. 68
4.1.2
Performance .............................................................................................. 71
4.2
Broader Impacts ............................................................................................... 74
v
4.3
Avenues for Continued Research .................................................................... 77
4.3.1
Modifications to Improve Efficiency ........................................................... 77
4.3.2
Wireless Access and Establishing a Multi-Agent Network ......................... 78
4.3.3
Incorporating Video Data to Environmental Monitoring Stations................ 80
4.3.4
Other Extensions ....................................................................................... 81
CHAPTER 5 CONCLUSION ......................................................................................... 84
APPENDIX A SAMPLE MOTION DETECTION CODE ................................................. 85
APPENDIX B PARTS LIST FOR OFF-GRID PROTOTYPE AT RIO BOSQUE ............ 87
BIBLIOGRAPHY ........................................................................................................... 89
vi
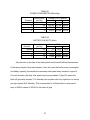
LIST OF TABLES
Page
TABLE I Comparable products...................................................................................... 21
TABLE II Parts list of comparable recording system ..................................................... 31
TABLE III Parts list of selected recording system .......................................................... 32
TABLE IV Cost of prototype at Rio Bosque ................................................................... 32
TABLE V Power consumption reference points ............................................................ 43
TABLE VI Power consumption for basic off-grid ........................................................... 44
TABLE VII Battery capacity for basic off-grid ................................................................ 44
TABLE VIII Solar panel output for basic off-grid ............................................................ 45
TABLE IX Solar panel output per day............................................................................ 45
TABLE X Sample usage scenarios ............................................................................... 56
TABLE XI Power consumption ...................................................................................... 57
TABLE XII Battery capacity ........................................................................................... 57
TABLE XIII Solar panel output ...................................................................................... 58
TABLE XIV Cloud cover and solar quality ..................................................................... 62
vii
LIST OF ILLUSTRATIONS
Page
Fig. 2.1. Den and tunnel layout at Rio Bosque ................................................................ 6
Fig. 2.2. Blue barrel den and tunnels .............................................................................. 7
Fig. 2.3. Den access bucket system ................................................................................ 7
Fig. 3.1. Project components......................................................................................... 14
Fig. 3.2. Block diagram of the basic off-grid prototype .................................................. 15
Fig. 3.3. Equipment box layout ...................................................................................... 15
Fig. 3.4. SwannTM 8-Channel DVR with 4 Cameras ...................................................... 24
Fig. 3.5. SwannTM PRO-550 infrared cameras .............................................................. 24
Fig. 3.6. Side views without panels and close up of mount ........................................... 26
Fig. 3.7. Front view of the frame and rear view with equipment .................................... 26
Fig. 3.8. Threaded-pipe frame ....................................................................................... 27
Fig 3.9. Example bin and a den access diagram ........................................................... 28
Fig. 3.10. Flexible PVC coupling for the tunnel cameras ............................................... 29
Fig. 3.11. Burrow layout at Rio Bosque with cameras ................................................... 29
Fig. 3.12. Top view of the burrow layout........................................................................ 30
Fig. 3.13. Atrium grate used as camera mount ............................................................. 30
Fig. 3.14. DVR file naming scheme ............................................................................... 33
Fig. 3.15. Outdoor camera positioned at a bird feeder .................................................. 33
Fig. 3.16. Home setup and DVR display ....................................................................... 33
Fig. 3.17. Simple state diagram for motion record ......................................................... 35
Fig. 3.18. Local viewing scenario (shared network)....................................................... 37
viii
Fig. 3.19. SwannTM live viewing..................................................................................... 38
Fig. 3.20. SwannTM network configurations ................................................................... 38
Fig. 3.21. Remote viewing scenario (outside the network) ............................................ 39
Fig. 3.22. Port forwarding in firewall settings ................................................................. 39
Fig. 3.23. DVR device information on router configurations .......................................... 40
Fig. 3.24. SwannTM Remote (mobile) viewing................................................................ 41
Fig. 3.25. Spliced power cable and port ........................................................................ 47
Fig. 3.26. RET install at IDB .......................................................................................... 47
Fig. 3.27. Two different mice visited the burrow ............................................................ 48
Fig. 3.28. Screen capture of the RET field test .............................................................. 48
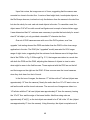
Fig. 3.29. P550 and P640 in a 17" tall den with 5" tall nest ........................................... 50
Fig. 3.30. P550 and P640 in a 14" tall den with 5" tall nest ........................................... 50
Fig. 3.31. P550 and P640 in a 14" tall den with 9" tall bird ............................................ 51
Fig. 3.32. P550 and P640 in a 17" tall den with 10" tall housecat ................................. 51
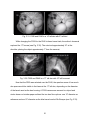
Fig. 3.33. Tripod and den floor setup............................................................................. 52
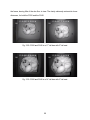
Fig. 3.34. P550 in a 14" den height and 17" den height ................................................ 52
Fig. 3.35. ArduinoTM UNO and prototype with PIR sensor ............................................. 53
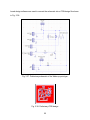
Fig. 3.36. Block diagram of the Wake-up prototype ...................................................... 54
Fig. 3.37. Preliminary schematic of the Wake-up prototype .......................................... 55
Fig. 3.38. Preliminary PCB design ................................................................................ 55
Fig. 3.39. Cameras facing a small pond ........................................................................ 58
Fig. 3.40. Setup by the pond at IDB .............................................................................. 59
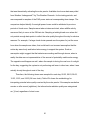
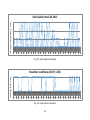
Fig. 3.41. Solar quality for October ................................................................................ 64
ix
Fig. 3.42. Load status for October ................................................................................. 64
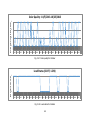
Fig. 3.43. Solar quality for November ............................................................................ 65
Fig. 3.44. Load status for November ............................................................................. 65
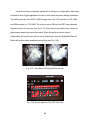
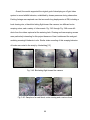
Fig. 3.45. Bird taking flight toward the camera .............................................................. 66
Fig. 3.46. Samples of a small buck, a doe running and a curious buck ......................... 66
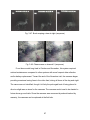
Fig. 3.47. Buck scraping a tree at night (sequence) ...................................................... 67
Fig. 3.48. Chase scene on channel 5 (sequence) ......................................................... 67
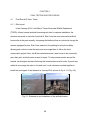
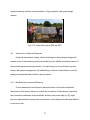
Fig. 4.1. Entrance to and installation of the artificial burrow .......................................... 68
Fig. 4.2. Running the cables between access bins ....................................................... 69
Fig. 4.3. Camera mount and tunnel access ................................................................... 69
Fig. 4.4. Installing the frame and equipment box........................................................... 69
Fig. 4.5. Front (angled) and rear view of the prototype.................................................. 70
Fig. 4.6. Equipment box at Rio Bosque ......................................................................... 70
Fig. 4.7. Burrowing owl on install day ............................................................................ 71
Fig. 4.8. Screen capture of February field test .............................................................. 72
Fig. 4.9. Burrowing owl at the far- and close-end of the tunnel ..................................... 73
Fig. 4.10. An owl exploring and an incubating owl ........................................................ 74
Fig. 4.11. Cottontail rabbit at site A ............................................................................... 74
Fig. 4.12. Initial field study at IDB with RET .................................................................. 77
x
CHAPTER 1
INTRODUCTION
1.1
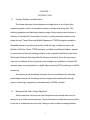
Problem Definition and Motivation
This thesis discusses the development and application of an off-grid video
monitoring system to aid in conservation studies of western burrowing owls. The
declining population and shrinking migratory range of these raptors ranks them as a
Species of International Conservation Concern [1], driving scientists' interest to see
inside the nest. Texas Parks and Wildlife Department (TPWD) biologists needed an
affordable means of observing owl activity inside the dark, isolated burrows in the
hillsides of El Paso, Texas. TPWD biologists, Lois Balin and Richard Heilbrun, wanted
to record video of the birds’ nesting behavior in the successful artificial burrows at the
Rio Bosque Wetlands Park (hereafter Rio Bosque for brevity). Since the owls travel
deep into the hillsides at the off-grid park, this underground installation of infrared (IR)
cameras was a unique application of digital video recording (DVR) technology to wildlife
monitoring.
As intriguing cross-disciplinary research, this work simultaneously cultivated
partnerships between the disciplines and encouraged public participation through
science, technology, engineering, and mathematics (STEM) outreach.
1.2
Burrowing Owl Video Project Objectives
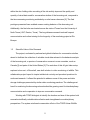
Without cameras in the burrows, the biologists would routinely wait hours for
activity to occur at the tunnel entrances. Human disturbance limited the monitoring effort
to the use of a telescopic lens from afar, leaving no way to observe nesting behavior
1
within the den. Adding video recording of the site activity improved the quality and
quantity of visual data used for conservation studies of the burrowing owl, compared to
the time consuming monitoring methods by on-site human observers [2]. The final
prototype presented here enabled unseen nesting behavior of the burrowing owl.
Additionally, the final site was located across the state of Texas from the University of
North Texas (UNT, Denton, Texas). The long distance research involved frequent
communication and online training for the longevity of the monitoring project at Rio
Bosque.
1.3
Scientific Value of this Research
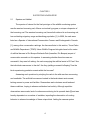
The project, motivated by national and global initiatives for conservation studies,
aimed to facilitate the collection of valuable visual data relevant to the behavior analysis
of the burrowing owl, a species of conservation concern in some countries, such as
Canada [1] and parts of the United States [3]. The evolution of this off-grid video setup
explored a low-cost, off-the-shelf, user-built solution to video monitoring of wildlife. This
collaborative project hoped to inspire intellectual curiosity and provoked questions for
continued research. It offered the potential to address some of the power and data
storage challenges presented by similar video monitoring practices. The challenges at
hand for monitoring the burrowing owls embodied the growing need for interdisciplinary
communication and cooperation to improve conservation research.
Working with TPWD biologists to identify the location and size of the system both
ensured scientifically valuable data collection and strengthened cross-disciplinary
perspectives. The system reinforced conservation efforts of the TPWD Urban Wildlife
2
Program biologists, and it can be replicated by scientists and community members
elsewhere to explore engineering applications in wildlife studies.
To better understand the contributions of the video surveillance system, the next
chapter discusses the burrowing owl research underway by TPWD Urban Wildlife
Program biologists in El Paso prior to incorporating cameras.
3
CHAPTER 2
SUPPORTING KNOWLEDGE
2.1
Species and Habitat
The species of interest for the final prototype of the wildlife monitoring system
was the western burrowing owl, Athene cunicularia hypugaea, a unique subspecies of
the burrowing owl. The western burrowing owl, henceforth referred to as burrowing owl,
has a shrinking migratory range and declining population [1]. In 2009, the owls were
listed as a Species of International Conservation Concern and Endangered in Canada
[1], among other conservation rankings. As discussed later in this section, Texas Parks
and Wildlife Department (TPWD) Urban Wildlife Program biologists have built a series
of artificial burrows in Rio Bosque Wetlands Park (hereafter, Rio Bosque) as part of
conservation research on this species. In assessing whether these burrows are
successful, they were left asking: Are owls occupying the artificial nests in El Paso? Are
the individuals newcomers to the site? Are they yielding successful offspring? Are the
birds experiencing predation events within the burrows?
Answering such questions by studying the owls in the wild was time consuming
and unreliable. The artificial burrows are located in the harsh desert environment,
lacking access to power and facilities. Researchers and volunteers would endured
these conditions, hoping to witness undisturbed owl activity. Although repetitive
observations were made, lack of continuous monitoring led to sporadic data [2] and was
heavily dependent on a number of variables, impeding the observation of roosting
behavior to advance knowledge of these unique birds. Adding the camera system
4
allowed them to simply swap a digital video recording unit full of potentially meaningful
visual data to review at the office.
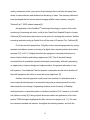
Videos from a similar project completed at the University of Reading [4]
motivated TPWD biologists to explore the application of video technology within
burrowing owl nests. Lois Balin, TPWD Urban Wildlife Program biologist in El Paso,
recommended the final sites at Rio Bosque, based on prior research with these owls [1].
Despite their conservation status, the burrowing owls face the loss of natural
habitat for nesting [1]. They opportunistically occupy burrows from other grounddwelling mammals, such as ground squirrels and prairie dogs that are undergoing
population management. Artificial burrows have provided alternative living spaces,
aiming to mitigate the scarcity of naturally-constructed sites of other burrowing
mammals [1]. Owls have been sighted at the artificial burrows throughout Rio Bosque
over several years [5]. This suggested that installing cameras on artificial burrows could
avoid the challenges of installing cameras within a poorly understood natural burrow.
Natural burrows introduced many unknowns essential for application, such as den
shape, depth, wall stability, and other critical aspects of long-term installation of
underground cameras.
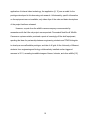
The Urban Wildlife Program biologists in El Paso created a tunnel system and
den out of 4" PVC-Schedule 40 and half of a hard-plastic barrel, respectively. TPWD
found that the owls preferred at least one turn in the tunnel [1], so a 4" PVC elbow fitting
added a turn before the den. A barrel provided the sturdy dome housing but was open
at the bottom, leaving an earthy den floor rather than a plastic floor. Balin's research [1]
involved carefully attaching metal identification bands on untagged fledglings at the
5
artificial den sites to monitor returning individuals. Therefore, there was a need to easily
reach inside the den from above to pick up a bird. Thus, an access system was added
to the top of the den. Tunnel entrances could be blocked off and the den opened from
overhead to reach the owls.
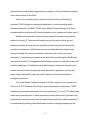
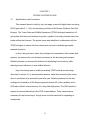
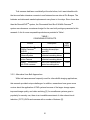
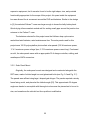
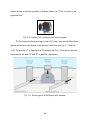
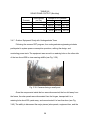
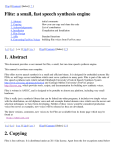
The burrow layout is shown in Fig. 2.1. Birds would enter the tunnels on the
hillside, travel down 4' of tunnel, turn to go another 4' of tunnel, and arrive at the den [1].
They could continue straight through the den to a tunnel system mirrored on the other
side, leading back out to the hillside. The tunnels were slightly sloped to allow water
runoff out of the tunnels in case of rain.
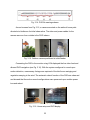
Fig. 2.1. Den and tunnel layout at Rio Bosque
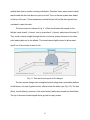
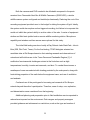
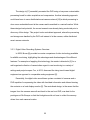
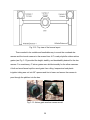
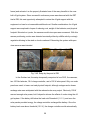
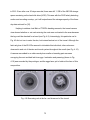
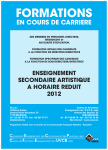
The den access design used a weighted bucket sitting atop a removable platform
at the bottom of a main 5-gallon bucket, affixed to the den below (see Fig. 2.2). The den
(blue), tunnels (black), and most of the main bucket (white) were buried into the hillside.
The top of the main bucket stayed above ground for easy access.
6
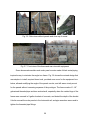
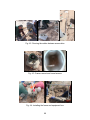
Fig. 2.2. Blue barrel den and tunnels
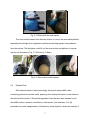
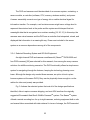
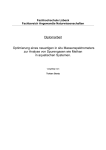
The inner bucket lowered into the main bucket, to rest on the removable platform,
separating the biologist from organisms inside and protecting against nest predation
from the surface. The biologists could lift out the inner bucket and platform to expose
the den, as illustrated in Fig. 2.3 (Photos by L. Balin).
Fig. 2.3. Den access bucket system
2.2
Related Work
With advancements in video technology, there exist many wildlife video
monitoring projects around the world, spanning from treetop bird nests to polar bears in
the remote Arctic tundra. A theme that appeared in the literature was intended use of
the wildlife videos: research, surveillance, enforcement, and education. Cox [2]
presented a concise categorization of literature by study objective, where the majority of
7
nest cameras were used to observe nest predation studies, feeding ecology, and adult
behavior. The unique application of video technology presented in this paper combines
these uses into year-round observation of burrowing owl activity from cameras placed
within an underground artificial dwelling.
Recognizing developments in video technology and its application to wildlife
sciences, Brown [6] and Ribic [7] provided a nice overview of available technology and
discussed several case studies. In 2012 [7], the authors not only discussed the methods
for several nest monitoring scenarios, but also gave suggestions depending on the
study objectives. The projects described in the literature followed two approaches of
adding video recording to monitor wildlife: vendor-built systems made specifically for
wildlife monitoring, and user-built systems with outdoor cameras [2].
One of the leading, commercially available, self-contained digital video recording
systems used for wildlife monitoring by large research organizations at the time of this
research in 2014 was SeeMoreTM Wildlife Systems [8]. Since its original goal to create a
system for live video monitoring in the harsh Alaskan environment, this Alaska-based
company installed hundreds of cameras worldwide over six years [8]. These proprietary
systems are responsible for much of the incredible footage broadcasted by large
organizations such as the National Geographic SocietyTM productions. ZatzWorks Inc.
offered helicopter-mounted video technology for the stunning video segments often
seen on large television programming productions and others, according to the
company's webpage. With such high quality and proven results from hundreds of
camera installations, the cost was steep compared to some of the other user-built
approaches [2]. These video systems were likely expensive because they provide high-
8
quality, maintenance-free, year-round off-grid designs that could offer hot-swap hard
drives for data collection and wireless live streaming of video. The company claimed to
have developed the first remote thermal imaging wildlife camera system, using the
Thermal-Eye™ 300D infrared camera [8].
An application of the SeeMoreTM monitoring technology in context of the video
monitoring of burrowing owl nests, could be the Castle Rock Seabird Project in Arcata,
California [9]. Aerial observations were not an option for studying the nocturnal, shallowburrowing seabirds nesting at Castle Rock off the coast of Crescent City, California [9].
From the user-built perspective, Golightly took an interesting approach by using a
standard surveillance system consisting of a digital video recording device and outdoor
cameras [10]. In 2011, Golightly described the equipment used and performance in
terms of data collection and battery replacement [10]. This off-the-shelf design
contrasted that of specialized systems developed commercially, while also presenting
an opportunity to improve design and implementation. An apparent advocate of userbuilt systems, Cox stated that "the first question researchers should ask is whether offthe-shelf equipment will suffice to meet their study objectives" [2].
Another user-built approach could move from simplicity to optimization and in
some cases the development of customized low-power processing boards for video
data acquisition and storage. Engineering students at the University of Reading
developed such a customized system to facilitate Joachim's Ph.D. research on the little
owl (Athene noctua) [4]. During original discussions about an application of the video
system TPWD biologists highlighted the little owl nest box project in [4, 11]. The nest
box cameras recorded owl behavior throughout the breeding season, and with the
9
application of infrared video technology, the application [4, 11] was a model for the
prototype developed in this burrowing owl research. Unfortunately, specific information
on the equipment was not available, only video clips of the owls and basic descriptions
of the project had been released.
However, a quote from the wildlife camera company recommended by
researchers with the little owl project was requested. Closewatch Nest Box & Wildlife
CamerasTM systems retailer produced a quote of seemingly off-the-shelf equipment,
sparking the idea of a partnership between engineering students and TPWD biologists
to develop a more affordable prototype, and take it off-grid. At the University of Missouri,
students from engineering and biology collaboratively installed motion-triggered
cameras in 2011, revealing incredible images of bears, bobcats, and other wildlife [12].
10
CHAPTER 3
DESIGN CONSIDERATIONS
3.1
Specifications and Constraints
This research aimed to identify, test, and apply a user-built digital video recording
(DVR) approach [2, 7, 10] to the burrowing owl sites at Rio Bosque Wetlands Park (Rio
Bosque). The Texas Parks and Wildlife Department (TPWD) biologists needed an offgrid system that they could maintain long-term, capable of recording infrared video from
inside artificial owl burrows. The project scope was identified in collaboration with the
TPWD biologists to ensure that their needs were met and to facilitate appropriate
research questions.
In short, the goal was to lower the prototype cost compared to other vendor-built
systems, yet preserve the core features necessary for the burrowing owl research.
Reliable cameras can increase the likelihood of witnessing burrow activity, while
reducing human influence on such wildlife behavior.
Key to the design was to modify the existing TPWD artificial burrow design
discussed in section 2.1 to accommodate cameras, rather than reinventing the setup,
since it was known to be successful year after year. Selecting cameras for the final
underground orientation at Rio Bosque required infrared (IR) video capability and a
DVR with sufficient internal memory for a long field deployment. The DVR needed to
support an external hard drive to the DVR for data backup. Three cameras were
necessary for the burrow layout, though more could be beneficial for expanding to
nearby sites.
11
Both the cameras and DVR needed to be affordable compared to the quote
received from Closewatch Nest Box & Wildlife CamerasTM ($2300 USD), a similar
wildlife camera system configured and installed professionally. Reducing the cost of the
recording equipment provided room in the budget for taking the system off-grid. Ideally,
the system would also explore motion triggered recording, but failure to incorporate this
would not inhibit the system's ability to archive video of the owls. A series of equipment
studies and field tests yielded such a remote wildlife monitoring station. Microphone
capability and wireless real-time access were optional for this study.
The initial field testing was done locally at Ray Roberts Lake State Park - Isle du
Bois (IDB, Pilot Point, Texas). For the final testing, TPWD biologists selected two
candidate sites at Rio Bosque based on their existing research and observations of
natural and artificial burrows in the Trans-Pecos and Panhandle Regions [1]. A
multitude of environmental challenges existed at the final sites such as high
temperatures, humidity, insects and mammals, and dust. To combat these issues, a
weatherproof case was selected with shading provided by the solar panels, along with
heat-sinking properties of the earth below the equipment case, and use of ventilation
and sealants.
Continued use of the prototypes for burrowing owl research at Rio Bosque
extends beyond the author's participation. Therefore, ease of setup, use, replication,
and dissemination were considered from the beginning.
Additional planning and preparation prior to field installation was incorporated to
reduce harm imposed on the environment. Park rangers and property managers
provided guidance and advisement on restrictions, such as the type and number of
12
vehicles allowed off path for installation. One of the final sites at Rio Bosque was about
100 yards off of the driving path, so the equipment was transported with hand-trucks
and wheelbarrows.
Furthermore, the research efforts were mindful of the regulations and
professional standards including those of the FCC regarding closed-circuit television
(CCTV), and the IEEE 937-2007, IEEE 1013-2007, IEEE 1562-2007, and IEEE 18572013. The cameras were buried in the burrows, avoiding the privacy concerns
associated with cameras mounted in public areas.
3.2
Methods
3.2.1 Project Development
The effort followed applied research, adding digital video and off-grid technology
to an ongoing wildlife monitoring project. The overall strategy depended on appropriate
project selection and organized collaboration, with consideration for project longevity.
Consulting with the TPWD Urban Wildlife Program biologists about their research needs
and current species of concern led to the selection of the burrowing owl monitoring
project. Three major tasks were identified: (1) construct a prototype, (2) refine and test
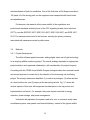
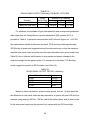
at a local outdoor site, and (3) deploy at the burrowing owl site. Fig. 3.1 shows the
various aspects of this work with equipment considerations in the top portion and
implementation on bottom. For example, the power aspect consisted of energy
collection, power storage, and power management.
Intended to be replicated, the system used at its core: a consumer-ready video
surveillance system, solar panels, and lead acid battery. Instead of the typical wildlife
13
camera options that required a data and battery swap every few days to every week [2,
10], this system needed to collect several weeks of data at a time. A pro-active design
approach was taken for the batteries by use of a charge controller, the DVR by
configuring to auto-reboot, and the underground cameras by incorporating a way to
access them for maintenance or repositioning at the tunnels.
Fig. 3.1. Project components
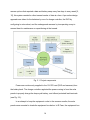
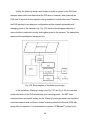
Power was continuously supplied to the 12V DC load (DVR and cameras) from
the battery bank. The charge controller regulated the power coming in from the solar
panels to properly charge the deep-cycle battery, and offered protected load terminals
(see Fig. 3.2).
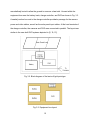
In an attempt to keep the equipment cooler in the summer months, the solar
panels were mounted to shade the equipment box below. In El Paso, the equipment box
14
was shallowly buried to allow the ground to serve as a heat sink. Housed within the
equipment box were the battery bank, charge controller, and DVR as shown in Fig. 3.3.
A sealed junction box next to the charge controller provided a passage for the camera
power and video cables, as well as the solar panel input cables. At the load terminals of
the charge controller, the cameras and DVR were connected in parallel. The layout was
similar to the user-built DVR systems depicted in [2, 10, 13].
Fig. 3.2. Block diagram of the basic off-grid prototype
Fig. 3.3. Equipment box layout
15
To acquire meaningful views, the biologists requested a camera above the den,
and a camera at each tunnel elbow. The den camera was needed to view general
movement, nest formation, egg laying and hatching, feeding patterns, and predation. A
camera was mounted above the den, peering through the platform of the main bucket.
The elbow cameras helped the biologists see if the entering bird had an identification
band, type of food they brought to the nest, face markings, relative size to other visitors,
and front view of nest predators entering the burrow. Both the den access design and
functionality were preserved because the TPWD biologists and volunteers were already
familiar.
To help expand the project reach, opportunities were embraced to include
diverse participants in meaningful ways. The project involved four K-12 educators
through the Research Experiences for Teachers Site (RET, NSF Grant Num. 1132585)
at University of North Texas (UNT, Denton, Texas) during the summer of 2013 to help
conduct the initial field test and delve into power consumption challenges. Then, what
began with the mentorship of an undergraduate engineering student grew to four that
participated in the next phase of local testing in the fall of 2013. Local volunteers helped
install the Rio Bosque prototypes and learned about the equipment first-hand in early
spring of 2014.
Both the local testing and the final installation followed a set-it-and-forget-it
approach with long deployments with occasional site checks. Part of the local field
testing involved a couple of full-month deployments to observe how the system
performed on longer cycles more similar to the end use at Rio Bosque. The install
schedule at IDB was more lenient because there was not an intended organism or
16
event for observation, while at Rio Bosque it was important to install several weeks prior
to breeding season for the burrowing owls. A single prototype was deployed at IDB from
June-November 2013, and two prototypes were installed in early 2014 one-half mile
apart at the final site in El Paso.
3.2.2 Data Collection from the Field Site
Once the hard drives were full, the biologists needed to either (1) swap the DVR,
or (2) swap the hard disk drive (HDD) from the field with a formatted empty one from the
office [2, 14]. Upon visiting the Rio Bosque site, it was elected to swap DVRs instead of
HDDs due to the particularly dusty, windy environment. The pros outweighed the cons
for this application, though swapping HDDs remained a less expensive option for
environments/scenarios in which swapping HDDs was feasible. Also, the DVR selected
for this research stored the H.264 video files on the internal HDD in a format not easily
recognizable by Windows® or Mac® operating systems. However, the format of the USB
connected storage drive was FAT32, which was compatible, allowing simple transfer
and review on a computer.
Swapping the full DVR in the field allowed better cleaning and preparation of the
DVRs and HDDs at the office. The DVR could be more effectively cleared of dust and a
proper maintenance check could be performed at the office. For the TPWD biologists to
swap the DVR at both prototypes, they needed two DVRs in the office ready for the
swap. The DVRs at the office would be used for reviewing, backing up data from, and
reformatting the field hard drives for the next field deployment. At the office, the next set
of DVRs to be deployed would be configured and configurations verified. Out in the
17
field, the two cleared DVRs would replace the field DVRs for the next month, allowing
the biologists to review the data back at the office.
3.2.3 Data Transfer, Review and Long-Term Storage
Data on the internal hard drive could be reviewed locally on the DVR by
connecting a monitor via VGA cable. To transfer the contents off of the DVR, the files
from the internal HDD of the DVR were backed up to the USB drive for review on a
computer using the SwannTM PlayBack or AVIGenerator software. The data is backed
up to a USB storage drive by following the on-screen prompts, which are also
summarized in the supplemental DVR guide generated through this work.
When reviewing the files, it was important not to fast forward too quickly so as
not to miss a meaningful event [10]. There was an interesting difference in the fast
forward feature of the DVR compared to the Swann™ PlayBack software. Reviewing
data only up to 8x fast on the DVR was found to be acceptable, which matched the up
to 8x faster than normal reviewing speed witnessed by Golightly [10] in 2011. However,
reviewing the data on a computer using the Swann™ PlayBack software allowed
speeds of up to 16-32x faster than normal without missing events longer than 2 seconds
in duration, outperforming the design presented in [10] in 2011 that allowed 8x faster
review. The difference seemed to be the way the DVR executed fast forward on the
compressed file compared to the computer software. The DVR appeared to skip frames
according to speed selection to move forward faster in the file, while the Swann™
PlayBack software actually displayed all frames faster.
18
For more long term storage, the conservation biologists could consider
submitting the archived video files to national repositories, such as the Macaulay Library
[15]. The videos would then be posted online for open-access review and might avoid
TPWD housing such large amounts of archived video.
3.2.4 Considerations for the Longevity of the Research
In addition to on-site installation and training, online training sessions were
conducted and supplemental guides were generated, with corresponding video clips, to
highlight relevant information from the lengthy product manuals. These efforts created a
collection of product manuals, installation guides, and training documents with videos,
for knowledge transfer beyond the author's participation. Also, each product needed to
offer technical support phone lines and reference materials made available online.
3.3
Equipment Selection
The equipment for the final prototype included: a DVR, four infrared outdoor
cameras, a 300 W solar panel array and charge controller kit, batteries, mounting
materials, and an outdoor equipment box.
3.3.1 Most Comparable Vendor-Built Products
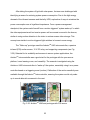
Browsing the SeeMoreTM Wildlife Systems product webpage, their most
comparable system to the prototype design was the RemoteDVR™ - Basic System
priced at $6450 [8]. In addition to purchasing the Basic System, the client must supply
two 55 Ahr deep-cycle batteries for power storage. The RemoteDVR™ system's 160 W
19
solar panel array and charge controller, together with the 110 Ahr battery bank, only
provided power for 12 hours per day [8]. A power upgrade could be selected (+$950) to
run 24 hours per day [8].
The system would record when motion was detected and the control panel had
"VCR style functions" [8]. Intended to be swapped out for data collection, two 80 GB
hard drives were included in the system, with an option to upgrade for a maximum of
250 GB capacity (+$800). In comparison, this research outlined a prototype that offered
500 GB, allowing for a longer deployment period before necessary data collection as
compared to the SeeMoreTM [8] and Golightly [10] designs. RemoteDVR™ was a fourchannel DVR, so only four cameras could be connected at one time. The prototype from
this work had scalability to record eight channels on one DVR, scanning for motion in
each camera feed with independent recording trigger per feed. The all-weather cameras
had infrared for night recording, similar to the prototype here. An LCD screen was also
offered to review video in the field, which would have been a great addition to the
burrowing owl setup, but was not necessary in the scope of this research.
Of course, game or trail cameras naturally came to mind for wildlife imaging,
however, as with many application-specific designs, they had their limitations [2]. The
typical game camera housing was bulky, making it infeasible for the specific camera
placements at the final observation site. Another hindrance was the relatively small
storage space [10, 16], in comparison to the 500 GB storage space of the selected
system. In addition, some game cameras had solar panels to help address the issue of
swapping batteries. Some game cameras offered wireless transmission of the images,
but that was not yet feasible for the El Paso site.
20
Trail cameras had been used briefly at the site before, but it was infeasible with
the time and labor intensive commute to and between burrow sites at Rio Bosque. The
batteries and data cards needed replacement every three to four days. Since it was less
than the RemoteDVRTM system, the Closewatch Nest Box & Wildlife CamerasTM
system was chosen as a maximum budget for the user-built prototype presented in this
research. A list of some comparable products are provided in Table I.
TABLE I
COMPARABLE PRODUCTS
Product
Description
Closewatch Nest Box &
Wildlife CamerasTM
UHR-IR
RaptorTM Cellular
Camera System
EncounterTM 5MP HD IR
Action Camera
SwannTM DVR8-2550
with P550 cameras
three cameras and two
recording drives(ships
from UK)
Three cameras with
individual recording drives
Three cameras with
individual recording drives
Set of four cameras with
central recording drive
Cost
(USD)
$1700
$3000
$450
$400
3.3.2 Alternative User-Built Approaches
While trail cameras were frequently used for other wildlife imaging applications,
this research provided unique challenges. In addition, researchers have grown more
curious about the application of DVR systems because of the larger storage space,
improved image quality, and video archiving [2]. As surveillance systems grow in
popularity for security use, there is an incredible assortment of other closed-circuit
television (CCTV) DVRs and cameras with a number of features [2].
21
The design in [17] essentially recreated the DVR using a low-power customizable
processing board for video acquisition and compression. Another interesting approach
could have been to use a distributed smart camera network [18] in which processing is
done on an embedded board at the camera and transmitted to a central location. While
these designs had potential, the current research was already being conducted prior to
discovery of this design. This project took a centralized approach, where the processing
and storage was handled by the DVR unit instead of at the camera, unlike distributed
smart camera networks.
3.3.3 Digital Video Recording Systems Overview
In 2009, Brown [6] provided a concise comparison of video technology available
for wildlife monitoring, highlighting the advantages and disadvantages of the different
features. For examples of applying this technology, the reader is directed to [2] for a
well-organized collection of case studies cogent to nest monitoring in a variety of
settings and project scopes. Cox, in 2012, discussed the rising trend toward digital
equipment as opposed to comparable analog equipment [2].
Essentially, the digital video surveillance system consisted of cameras and a
DVR capable of compressing the video with time/date information and allowed viewing
the contents on a local display monitor [2]. The centralized design, in the sense that the
images from the cameras were all sent back to the one host DVR, was best for the
prototypes at Rio Bosque so that the biologists would not have to collect the memory
drives from each camera location.
22
The DVR and cameras could be described of as a sensor system, containing: a
sensor module, a controller (software, CPU, memory, wireless module), and power.
A sensor essentially converts one type of energy into a usable electrical signal for
information transfer. For example, a soil moisture sensor might use a voltage level to
represent the moisture level at the probe and the system would interpret that into
meaningful data that is recognized as a moisture reading [19, 20, 21]. In this setup, the
cameras were visual sensors and the DVR was a controller that interpreted, stored, and
displayed that information in a meaningful way. Power was included in the sensor
system as a common dependence among all of the components.
3.3.4 Selected Recording System and Off-Grid Equipment
An eight-channel DVR and camera surveillance kit (SwannTM DVR8-2550 and
four P550 cameras) [22] was selected for this research, from among the many camera
solutions for wildlife monitoring scenarios. The DVR functionality offered a simple menu
system for navigating through the features, keeping the technology learning curve
lower. Although the design only needed three cameras, an option to hook up two
burrows systems at the same DVR (if they can be physically close enough to run the
cables for video and power) was provided.
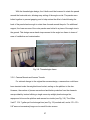
Fig. 3.4 shows the selected system that met all of the design specifications
identified, did not require overseas shipping, and cost 66% less than the originally
suggested Closewatch Nest Box & Wildlife CamerasTM system. The SwannTM system
offered a central recording box for up to eight cameras, reducing equipment bulk on site
and manual labor associated with data retrieval. In terms of storage, the DVR executed
23
H.264 standard compression which maximized storage capacity on the hard drive. The
I/O capabilities of the DVR were suitable for this project, including: BNC connections for
the cameras, VGA for video output to a monitor, USB port for computer mouse, USB
port for backing up files to flash drive, and LAN. The video signal type was NTSC and
recorded at a resolution of 352x240 (CIF).
© Swann Communications Ltd.
Fig. 3.4. SwannTM 8-Channel DVR with 4 Cameras
High quality IR cameras intended for outdoor use were selected and, with
infrared enabled, the cameras required a minimum illumination of zero lux, which was
necessary for the den camera especially. Dome cameras were available, as well as
pan-tilt-zoom (PTZ) cameras. However, these features would not necessarily improve
the results for this application, so costs were minimized by using a traditional bullet
camera. The utilized system came with PRO-550 cameras shown in Fig. 3.5, offered a
62 degree viewing angle and 420 TV lines of video quality [22].
Fig. 3.5.
© Swann Communications Ltd.
SwannTM PRO-550 infrared
cameras
With the set-it-and-forget-it approach, a sturdy equipment box needed to
withstand the elements, be lockable, and made of hard plastic to run the cables through
a small hole in the side. Pelican™ cases are used for all-weather transportation of
24
expensive equipment, but it was also found to be the right shape, size, and provided
functionality appropriate for the scope of this project. Air space inside the equipment
box was allowed for air movement around the DVR and batteries. Similar to the design
in [2], the selected Pelican™ case was large enough to house the hefty battery bank.
Quick-drying silicone sealant worked well for sealing small gaps around the junction box
entrance to the Pelican™ case.
The batteries selected for this project were the Lifeline® deep cycle marine
sealed lead acid batteries, rated maintenance-free. The solar panels used for this
project were 100 W polycrystalline photovoltaic solar panels (100 W maximum power,
17.4 V maximum power voltage Vpm, 5.75 A maximum power current Imp). Purchased
as a kit, the solar panels came with an appropriate 30 A charge controller, cabling, and
weatherproof MC4 connectors.
3.3.5 Solar Panel Mount
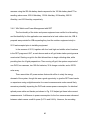
Originally, the solar panel mount was designed and constructed alongside the
RET team, made of slotted angle iron and galvanized bolts (see Fig. 3.6 and Fig. 3.7).
The panels were affixed using large t-shaped gate hinges. The panels required a sturdy
frame facing south, and placed at the latitude angle [23]. This approximate 32 degree
angle was harder to accomplish with the angle iron because the pieces had to be cut to
size, and sometimes the slots did not line up without modification.
25
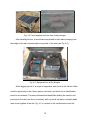
Fig. 3.6. Side views without panels and close up of mount
Fig. 3.7. Front view of the frame and rear view with equipment
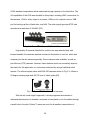
Some homemade smaller-scale solar panel mounts made of black metal piping
inspired a way to minimize the angle-iron frame. Fig. 3.8 shows the revised design that
was simpler to install, required fewer tools, provided more room for the equipment box
below, allowed modifying the angle of the panels on-site, and still was a sturdy mount
for the panels without increasing expense of the prototype. The frame made of 1-1/4"
galvanized threaded pipe and tees worked well, especially when the vertical legs of the
frame were secured in 5-gallon buckets of concrete, and buried the depth of the bucket.
U-bolts secured the solar panels to the horizontal rail, and pipe wrenches were used to
tighten the threaded pipe fittings.
26
With the threaded pipe design, the U-bolts could be loosened to rotate the panels
around the horizontal axis, allowing easy setting of the angle on site. The panels were
bolted together to prevent gapping, and to help reduce the effect of wind blowing the
back of the panels hard enough to rotate them forward around the pole. For additional
support, the lower corners of the outer panels were bolted to a piece of the angle iron in
the ground. This design was a drastic improvement to the angle iron frame in terms of
ease of installation and customization.
Fig. 3.8. Threaded-pipe frame
3.3.6 Camera Mounts and Access Tunnels
For minimal change to the original den access design, a camera box could have
been inserted under the weighted inner bucket, resting on the platform to the den.
However, the number of pieces was reduced and better protection from the elements
was provided by instead utilizing a single screw-top airtight plastic storage bin,
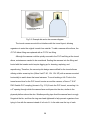
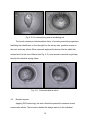
repurposed to house the platform and camera box inside (see Fig. 3.9). The Vittles
Vault™ 15 4.7 gallon pet food storage bins (see Fig. 3.9) worked well, and at 12"x 12"x
9.8" were not excessively large nor too small for den access.
27
© Gamma2 Air Tight Pet
Food Containers
Fig 3.9. Example bin and a den access diagram
The tunnel camera mount did not interfere with the tunnel layout, allowing
organisms to enter the original tunnels from outside. To add a camera at the elbow, the
4" PVC elbow fitting was replaced with a 4" PCV tee fitting.
Although the camera could be quickly secured to the PVC tee fitting at the tunnel
elbow, maintenance needed to be considered. Sealing the cameras into the fitting and
buried with the tunnels would require digging up for cleaning, replacing, and
repositioning. Therefore, the screw-top bin design was modified for the tunnel elbows
utilizing a taller screw-top bin (Vittles Vault™ 80, 14"x 14"x 28") with a camera mounted
horizontally to watch down the tunnel entrance. To avoid making a full 4" hole in the
tunnel access bins for the PVC tunnel to enter around the camera, a Fernco™ 4"x2"
DWV flexible PVC coupling (shown in Fig. 3.10) fit onto the PVC tunnel, converting it to
a 2" opening through which the camera face could peer into the den, similar to the
plywood platform above the den. Weatherproofing tape lined the camera face to snugly
fit against the bin, and then the ring was hand-tightened to help prevent organisms from
trying to live with the camera instead of in front of it. In the side near the top of each
28
access bin was a hole through which to feed the cables in a 2" PVC or conduit to the
equipment box.
© Zoro Tools, Inc.
Fig. 3.10. Flexible PVC coupling for the tunnel cameras
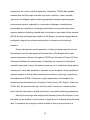
The final layout for the burrow was a total of 28" deep; from the top of the aboveground access bins to the bottom of the den and tunnel floor (see Fig. 3.11 and Fig.
3.12). The den was 17" in height with a 19" diameter den floor. At the elbows and den,
the screw-top lids were 14" and 10" in diameter, respectively.
Fig. 3.11. Burrow layout at Rio Bosque with cameras
29
Fig. 3.12. Top view of the burrow layout
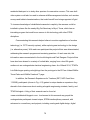
There needed to be a stable and breathable way to mount the overhead den
camera and the tunnel cameras in the access bins. A 6" round polyolefin outdoor atrium
grates (see Fig. 3.13) provided the height, stability, and breathability desired for the den
camera. For consistency, 6" atrium grates were laid horizontally for the elbow cameras.
A bolt and wood brace kept the round grate from rolling. Inexpensive hard plastic
irrigation tubing was cut into 3/4" spacers and ties to lower and secure the camera to
peer through the platform into the den.
Fig. 3.13. Atrium grate used as camera mount
30
An opening at least 8" diameter was needed in the bottom of the den access bin
to allow the biologists to reach the fledglings for banding. The platform was a section of
pressure-treated plywood about 1/2" thickness, cut to cover the large opening at the
bottom of the den access bin. For the platform to cover the larger opening into the den,
it would not simply fit through the circular screw-top opening. A simple solution was to
cut the platform in half, and secure with hinges so that it could be folded to
insert/remove for den access. A hole saw attachment on a handheld power drill was
used to cut the 2" hole for the camera to fit through the center of the platform. From
inside the burrow, the birds could see the camera face fitted flush into the platform.
3.3.7 Cost Overview
The monitoring station developed through this work met specifications, and was
more cost effective than the referenced equipment quote. The cost of the on-grid four
camera and two DVR system from Closewatch Nest Box & Wildlife CamerasTM was
$1693 USD (see Table II), not including overseas shipping and professional installation.
The cost of the DVR and camera system selected in this research was approximately
$400 USD (see Table III).
TABLE II
PARTS LIST OF COMPARABLE RECORDING SYSTEM
Description
Quantity
Total Cost (USD)
Closewatch Nest Box & Wildlife CamerasTM
Super UHR IR Wildlife Camera
Product code: WCVF90SUHR
4
1022
Two-Channel Mini Digital Recorder, up to
32GB Product code: 2CDVR01
2
671
Recording System and Camera Total
$1693
31
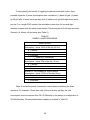
TABLE III
PARTS LIST OF SELECTED RECORDING SYSTEM
Description
Quantity
Total Cost (USD)
1
400
SwannTM SWDVK-825504 eight-channel
DVR & four cameras
Recording system and camera Total
$400
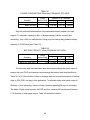
Taking the DVR and cameras off-grid and installing a new access system placed
the total expense per prototype at $1821.47 USD (see Table IV and Appendix B). The
cost for taking the comparable Closewatch Nest Box & Wildlife CamerasTM off-grid and
installing the cameras in the same manner would have been $3114.47 USD.
TABLE IV
COST OF THE PROTOTYPE AT RIO BOSQUE
Item totals
Recording system and cameras
Solar panels, charge controller, batteries
Solar panel mount
Camera mounts and access bins
Total
3.4
Cost (USD)
400
1005
164.58
251.89
$1821.47
Preliminary Equipment Study and Power Considerations
The scenario at Rio Bosque drove the system, though other capabilities of the
equipment were explored. The DVR was configured and contents reviewed via VGA
monitor display, and local and remote viewing was established for simulation.
Fig. 3.14 outlines the DVR's default naming scheme, with (a) Channel ID, (b)
Yr/Mo/Day, (c) Pack Start Time, (d) Pack End Time, (e) File Type H.264.
32
Fig. 3.14. DVR file naming scheme
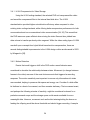
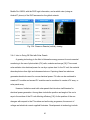
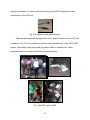
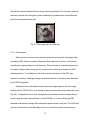
As can be seen from Fig. 3.15, a camera mounted on the author's home patio
directed at a birdhouse for initial observation. The video and power cables for the
camera were run from outside to the DVR indoors.
Fig. 3.15. Outdoor camera positioned at a bird feeder
Connecting the DVR to the monitor using VGA displayed the live video feed and
allowed DVR navigation (see Fig. 3.16). With the system configured to record upon
motion detection, unnecessary footage was captured of the bird house swinging and
vegetation swaying in the wind. The automatic reboot function of the DVR was observed
and showed that the motion record configurations were preserved upon sudden power
loss and reboot.
Fig. 3.16. Home setup and DVR display
33
3.4.1 H.264 Compression for Video Storage
Using the H.264 coding standard, the selected DVR unit compressed the video
and saved the compressed files to the internal hard disk drive. The H.264
standardization provided higher rate-distortion efficiency when compared to other
existing video coding standards, while offering better compression performance for both
conversational and non-conversational video communication [24, 25]. This meant that
the DVR was more space efficient when storing the video files and also yielded less
data volume to transfer per hourly video segment. While the video coding layer of H.264
was built upon concepts from hybrid block-based motion-compensation, there are
several distinguishable improvements to the H.264 design outline as discussed in 2003
by Wiegand in [25].
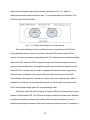
3.4.2 Motion Detection
Events that could trigger a shift in the DVR motion record behavior were
considered to describe the relationship between states. Movement (or change between
frames in the video) was one of the most obvious events that triggered a recording
response. The motion sensitivity was important to ensure only information-rich video
was recorded, helping to preserve disk space and energy use. Consider if a bird ruffles
its feathers in a burst of movement, and then remains stationary. That movement event,
and perhaps the following minutes of inactivity, might be considered irrelevant for a
particular research scope and the storage space could remain available for more
meaningful data. However, movement such as the bird entering/exiting the burrow or
feeding the offspring would be above threshold and should trigger recording. A sample
34
state transition diagram depicting this series is provided in Fig. 3.17, where '0'
represents movement below threshold and '1' is movement above the threshold. The
DVR records in the Active state.
Fig. 3.17. Simple state diagram for motion record
The motion detection for this surveillance system was done by the DVR unit
using digital processing, instead of a passive infrared (PIR) sensor located at the
camera similar to most game camera designs [6]. The cameras were constantly sending
feed to the DVR, where the DVR analyzed the input and determined when to record
based on user configurations. Although the specific motion-detection algorithm for the
selected DVR is unknown by this author, it appeared the decision was completed by
frame-to-frame comparison of the input feed from each channel input to the DVR.
Unfortunately, that meant the cameras ran continuously, thus wasting power. Motion
detected on a channel only recorded that channel, not all channels connected to the
DVR, which saved storage space for more meaningful data.
Setting the sensitivity and the region of interest (ROI) in the channel frame was a
feature of the selected DVR. The ROI was configured when the cameras were installed,
and was not intended to change after setting, which introduced a chance of error in
detecting meaningful movement. When using stationary camera mounts, for example, a
35
short animal might pass below the camera's field of vision or DVR's ROI, avoiding
motion triggered video record.
3.4.3 Remote Access to the DVR
While having the stand alone system suited the original project description,
options for viewing the settings and contents of the DVR over the internet were
explored. Having access to the data off-site would be valuable beyond simply viewing
live-streaming data from the DVR, because the data would be available for download to
a personal computer and recording configurations could be altered. The ideal case
would be for a transmitter to send the DVR signal to a router connected at a host
computer.
Bandwidth was important with the LAN connection, but became even more so
with wireless communications. To aid in this, there needed to be high compression
efficiency (i.e. the H.264 standard) because of the generally low bit-rates selected by
users to avoid fees [24]. In 2003 Stockhammer [24] described four types of service
classes for video applications: conversational, streaming, interactive, and background
traffic. With the full functionality of remote access to the DVR, then the applicable traffic
classes could be: streaming, interactive, and background [24]. The video feed was
streaming when connected to the DVR, but the main treasure was remote access to the
stored videos as more of a background service class [24].
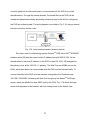
During the home setup, a successful local connection was established via LAN to
a home router with administrative access, allowing remote login to the DVR on a shared
network. With the router and DVR following DHCP, the local IP address of the router
36
could be typed into an internet browser to communicate with the DVR from on the
shared network. Through the internet browser, the stored files on the DVR can be
viewed and downloaded–ideally eliminating exhaustive trips to the field for configuring
the DVR and collecting data. The wiring diagram is provided in Fig. 3.18, using a shared
internet connection via the router.
Fig. 3.18. Local viewing scenario (shared network)
The router used for initial testing was the VerizonTM FiOS ActionTecTM MI424WR
wireless router [26] with the router's public IP address being 96.226.56.104. On the
shared network, the local IP address for the DVR on was 192.168.1.235 assigned by
the primary router at the 192.168.1.1 gateway. The Web Port was 40085 (set on the
DVR), which was the port to communicate with the DVR over the internet locally. To
connect remotely to the DVR in a local network configuration the IP address was
192.168.1.235:40085. Accessing this Web Port brought up the SwannTM DVR login
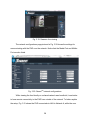
screen, where the Media Port was 49002 (set by the DVR). Fig. 3.19 shows the login
screen that appeared in the browser, with live viewing mode as the default view.
37
Fig. 3.19. SwannTM live viewing
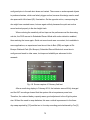
The network configurations page pictured in Fig. 3.20 shows the settings for
communicating with the DVR over the network. Notice that the Media Port and Mobile
Port are also listed.
Fig. 3.20. SwannTM network configurations
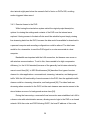
While viewing the feed locally on a shared network was beneficial, it was better
to have remote connectivity to the DVR from outside of the network. To better explain
the setup, Fig. 3.21 shows the DVR connected via LAN to Network A, while the user
38
accesses the DVR on a laptop connected to a router on Network B. Both routers must
be connected to the internet.
Fig. 3.21. Remote viewing scenario (outside the network)
To do this, the public IP address for the router was needed (96.226.56.104), as
well as the desired ports from the DVR for accessing certain data. The Web Port 40085
was necessary for connecting to the DVR over the web browser, the Media Port 49002
for accessing media on the DVR, and Mobile Port 18004 for viewing over the cellular
network using a mobile phone. Since global access required logging into the router via
the public IP instead of the DVR specifically, the relevant ports from the DVR's local
connection were forwarded to the router. Otherwise, the local DVR ports were not
visible nor accessible via the router on the public IP.
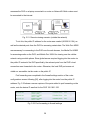
Port forwarding was completed in the firewall settings section of the router
configurations screen following [26], after logging into the router from the public IP
address. Fig. 3.22 shows a screen capture of the ports added to port forwarding on the
router, note the device IP was that for the DVR 192.168.1.235.
Fig. 3.22. Port forwarding in firewall settings
39
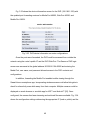
Fig. 3.23 shows the device information screen for the DVR (192.168.1.235) with
the updated port forwarding services for Media Port 49002, Web Port 40085, and
Mobile Port 18004.
Fig. 3.23. DVR device information on router configurations
Once the ports were forwarded, the DVR could be accessed from outside the
network using the router's public IP and the DVR Web Port. The SwannTM DVR login
screen was accessed at the global address 96.226.56.104:40085 and entering the
Media Port, user name, and password allowed access to the DVR contents and
configurations.
In addition, forwarding the Mobile Port enabled mobile viewing through the
SwannViewTM smartphone app. Incorporating wireless access could allow biologists to
check for site activity even while away from their computer. Multiple cameras could be
displayed on a web browser or a mobile app for iOS™ and Android™ [22]. Once
configured, the camera feed was streaming and archived files were available. Fig. 3.24
shows the configuration settings referencing the appropriate IP (local or public) and the
40
Mobile Port 18004, with the DVR login information, and a mobile view (using an
Android™ phone) of the DVR accessed on the global network.
Fig. 3.24. SwannTM Remote (mobile) viewing
3.4.4 Intro to Going Off-Grid with Solar Panels
A growing technology in the field of alternative energy sources for environmental
monitoring is the use of photovoltaic (PV) cells, modules and arrays [19]. PVs convert
solar radiation into electrical power for use by a system load. In the PV unit, the material
absorbs photons from light and releases electrons. Capturing these free electrons
generates electrical current for use as electrical power. PV cells can be combined to
create a PV module and several PV modules can be combined to create a PV array, or
solar panel array.
However, limitations exist with solar panels that introduce inefficiencies for
electrical power generation. Among them include the position and angle of the sun’s
rays to the surface of the PV unit affecting efficiency [19]. As the position of the sun
changes with respect to the PV surface and as the day progresses, the amount of
voltage and electrical current supplied fluctuates. Developments in technology include
41
several methods to combat the limitations and increase efficiencies of the PV units,
such as Maximum Power Point Tracking (MPPT) systems [19].
The selected SwannTM DVR and cameras operated at 12 V DC, typically
delivered by the accompanying power supply. That power supply would traditionally
plug into a standard 120 V AC power outlet on-grid, and convert the output to 12 V DC
for the devices. Some designs in the literature that used a 12 V battery included a
power inverter to preserve the use of the standard power supply, while others like [10]
kept the system in DC from the batteries. Since the power was already in DC from the
charge controller to the load, it was excessive to use a DC-AC power inverter to utilize
the original power supply.
Deep-cycle sealed lead acid batteries are commonly used for outdoor
applications, such as that for this research, because of their high dependability, stability,
and symptoms of nearing end of lifespan [2, 21]. Nickel Cadmium tends to deplete
faster than lead-acid and often requires that the battery be completely drained before
recharging for longer lifespan [21]. The Lifeline® manual [27] recommended to increase
the size of the selected battery by 20% to account for inherent inefficiencies, and to use
an automatic charge controller rated at least .2*C, where C is the rated Ahr capacity of
the battery. A proper load cutoff was also necessary to ensure that the system was not
depleting too much of the battery charge. Preventing such deep large depth of
discharge (DOD) would help to maintain the lifespan of the battery [27].
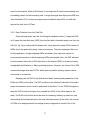
3.4.5 Sizing the Solar Panels and Battery Backup
Essentially, there were three major steps and corresponding calculations to
consider for taking the system off-grid: (1) power consumption of the load, (2) battery
42
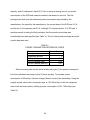
capacity, and (3) solar panel output [21]. Prior to sizing an energy source, the power
consumption of the DVR and cameras needed to be taken into account. The first
prototype was built upon the estimated power consumption as provided by the
manufacturer. As quoted by the manufacturer, the current draw of the DVR was 2.0 A
and the set of four cameras was 2.0 A, totaling 4.0 A required by this 12 V DC load. It
was discovered, in testing the first prototype, that the actual current draw was
considerably less than specified (see Table V). Thus for the second prototype the actual
current draw was used.
TABLE V
POWER CONSUMPTION REFERENCE POINTS
Device
DVR (quoted)
4-cameras (quoted)
DVR (actual)
4-P550 Camera (light)
4-P550 Camera (dark-IR)
Current (Amps)
2
2
0.69
0.44
0.67
Since burrowing owls can be active all day and night [1], the power consumption
had to be calculated assuming motion 24 hours per day. To calculate: power
consumption in Whrs/day = (device voltage)*(device current)*(hrs active/day). Using the
original quoted values, the consumption was at 1152 Whrs/day. In fact the equipment
used much less than quoted, yielding a power consumption of 391.7 Whrs/day (see
Table VI).
43
TABLE VI
POWER CONSUMPTION (Whrs/day) FOR BASIC OFF-GRID
Scenario
Quoted
Basic Off-Grid
Hours
Active Daily
24
24
Number of IR Cameras
1
4
8
720
1152
1728
246.96
391.68 584.64
Step two included determination of the associated battery capacity for load
support. To calculate: capacity in Ahrs = (# days backup)*(device current)*(hrs
active/day), then +20% for inefficiencies. Using only one backup day yielded a battery
capacity of 39.168 Ahrs (see Table VII).
TABLE VII
BATTERY CAPACITY (Ahrs) FOR BASIC OFF-GRID
Scenario
Quoted
Basic Off-Grid (24/7)
Hours
Active Daily
24
24
Number of IR Cameras
1
4
8
72
115.2
172.8
24.696
39.168 58.464
The third step and final calculation was the corresponding solar panel output to
support the load (DVR and cameras) and recharge the battery bank size identified in
Table VII. In [21] the number of days to recharge was set to equal the number of backup
days to 50% DOD, one day in this application. To calculate: daily solar panel output in
Ahrs/day = [(hrs active/day)*(device current)+(battery capacity)]/(# days to recharge).
The basic off-grid setup to power the DVR and four cameras 24 hrs/day would require
71.8 Ahrs/day of solar panel output. Table VIII shows the results.
44
TABLE VIII
SOLAR PANEL OUTPUT (Ahrs/day) FOR BASIC -OFF-GRID
Scenario
Quoted
Basic Off-Grid (24/7)
Hours
Active Daily
24
24
Number of IR Cameras
1
4
8
132
211.2
316.8
45.276
71.808 107.184
For reference, the available off-grid solar panel kits and corresponding estimated
daily output from the Windy NationTM product descriptions [28], updated 2013, is
provided in Table IX. In personal communication with Technical Support on 11/3/2103,
the representative stated as reference that each 100 W would provide approximately
400 Whr/day of power and suggested sizing the solar panel array so that the maximum
required solar panel output would be near the lower estimated output value quoted (see
Table IX), due to inherent inefficiencies of solar panels and season changes in the
angle the sunlight hits the panel surface. For example, the calculated 71.8 Ahrs/day
would suggest the need for a 300 W system (see Table IX).
TABLE IX
SOLAR PANEL OUTPUT PER DAY (Ahrs/day)
Size of Solar Panel Array
400W
300W
200W
100W
Ahr/day
100-200
75-150
50-100
25-50
Based on these calculations, questions were posed, such as: (1) what would be
the difference in solar panel output per day required for a system with one DVR and four
cameras using among a 200 Ahr, 100 Ahr, and 60 Ahr battery bank; and (2) what would
be the solar panel output per day required for a system with two DVRs and eight
45
cameras using the 200 Ahr battery bank compared to the 100 Ahr battery bank? The
resulting values were: 232.64 Ahrs/day, 132.64 Ahrs/day, 92 Ahrs/day, 265.28
Ahrs/day, and 165 Ahrs/day, respectively.
3.4.6 Wild Watch and Power Management with RET
The functionality of the video and power equipment was verified in a lab setting,
and the feasibility for this application was examined at a local outdoor test site, IDB. A
proposal was provided for IDB requesting they host the outdoor equipment study in
2013 and accepted prior to installing equipment.
In the summer of 2013, together with four local high and middle school teachers
in the RET program at UNT, a mock burrow and an off-grid video station prototype was
constructed. Starting on-grid in the field allowed time to begin collecting data, while
providing time for off-grid preparations. Then moving off-grid, the system comprised of
one DVR, four cameras, two 100 Ahr batteries, 30 A charge controller, and a 300 W
solar array.
There were inline AC power meters that would suffice to study the energy
demand of the system, though this was a good opportunity to give the RET team handson experience using a digital ammeter for current measurements under several likely
scenarios potentially impacting the DVR and camera power consumption. An identical
spliced power cable and female port shown in Fig. 3.25 helped get these inline current
measurements. A difference in power consumption for the four cameras was witnessed
between a dark versus a well-lit space (0.67 A and 0.44 A). However, the recording
46
settings nor number of cameras actively recording on the DVR changed the power
consumption of the DVR unit.
Fig. 3.25. Spliced power cable and port
Cameras were deployed aboveground in two L-shaped tunnels, a burrow [1], and
a birdhouse. Fig. 3.26 is a collection of pictures from installation day of the 300 W IDB
system. Camouflage spray paint made for plastics came in a sandy color, which
disguised the equipment box in both the local and final sites.
Fig. 3.26. RET install at IDB
47
It was found that the cameras operated in an always-on configuration, which was
not ideal for this off-grid application but had to work since they were already purchased.
The backup process from DVR to USB storage drive took: 105 seconds for 195.4 MB,
and 600 seconds for 1176.9 MB. The outdoor test at IDB with the RET team detected
bugs and mice in the burrows (see Fig. 3.27), after monitoring continuously over three
deployments spanning several days each. When the quick set motion record
configuration did not perform well on one of these tests, using the Scheduled Record
Mode with motion detect enabled resolved this (see Fig. 3.28).
Fig. 3.27. Two different mice visited the burrow
Fig. 3.28. Screen capture of the RET field test
48
Upon first review, the image was out of focus, suggesting that the camera was
mounted too close to the den floor. A series of den height trials, to anticipate objects in
the Rio Bosque burrows, involved not only the distance from the camera to the den floor
but also the clarity for nest- and owl-sized objects in the den. To resemble a nest, the
object was a 5"x5"x5" box with a small owl figurine and a couple of extra chicken eggs.
It was determined that 14" minimum was necessary to provide the best clarity for a nestsized 6" tall object, yet only provided a viewable 12" diameter den floor.
One set of P640 cameras came with one of the DVR systems, as a 'free
upgrade'. Lab testing showed the P550 was better than the P640 for this close-range
application in the den. The P640 (the "upgraded" model) was rated for 50% longer
range of night vision, suggesting that the minimum focal distance was a bit larger than
that of the P550s. In Fig. 3.29 through Fig. 3.31, the images were taken in a mock den
with both the P550 and the P640, adjusting the distance of objects in view to mimic
what might be seen in the field burrows. Those captured with the P550 are on the left
and the images on the right use the P640. Of less concern were the tunnel cameras,
since they look down four feet of tunnel.
In the first row of images, the den was 17" tall den with a 5" tall nest (object was
approximately 12" from the camera). Nearly the entire den floor 12"x12" was in view, as
well as the walls and the tunnel entrances. The second row of images was taken in a
14" tall den with the 5" tall nest (object was approximately 9" from the camera), leaving
the 12"x12" floor and the edge of the tunnel visible. Adult burrowing owls are
approximately 9" tall [1], so the test object was raised to be 9" tall in the 14" den (object
was approximately 5" from the camera). Using this setup, the object occupied most of
49
the frame, leaving little of the den floor in view. The clarity obviously reduced at closer
distances, for both the P550 and the P640.
Fig. 3.29. P550 and P640 in a 17" tall den with 5" tall nest
Fig. 3.30. P550 and P640 in a 14" tall den with 5" tall nest
50
Fig. 3.31. P550 and P640 in a 14" tall den with 9" tall bird
While changing the P550 for the P640 in these home trials, the author's housecat
explored the 17" burrow (see Fig. 3.32). The cat stood approximately 10" at the
shoulder, placing the object approximately 7" from the camera).
Fig. 3.32. P550 and P640 in a 17" tall den with 10" tall housecat
Now that the P550 was selected over the P640, the question arose of how much
den space would be visible in the frame at the 17" tall den, depending on the diameter
of the barrel used as the den housing. A P550 camera was secured to a tripod and
circles drawn on butcher paper outlined the two den floor options: one 12" diameter as
reference and one 19" diameter as the blue barrel used at Rio Bosque (see Fig. 3.33).
51
Fig. 3.33. Tripod and den floor setup
At the 14" den height, most of the 12" diameter floor space was in frame as was
witnessed in the den height trials. Raising the den to 17" tall seemed to be appropriate
for this study because a decent portion of the 19" diameter floor space was visible (see
Fig. 3.34). Of course, the results were even better at a 19-20" den height, where a
majority of the 19" floor is in view. However, that den height might prevent the biologists
from reaching into all edges of the den for banding. Therefore, the research moved
forward with the 17" den height in El Paso. Originally, the blue barrel design from TPWD
was 13", so older burrows in need of repair would be replaced with a 17" design.
Fig. 3.34. P550 in a 14" den height and 17" den height
52
After taking the system off-grid with solar power, the team was challenged with
identifying a means for reducing system power consumption. Due to the high energy
demand of the infrared cameras and the hefty HDD, exploration of ways to minimize the
power consumption was of significant importance. From a power management
standpoint, the system would benefit from a motion-triggered “system wake-up” in which
the video equipment would not receive power until movement occurred in the burrow,
similar to using motion detection in the video to reduce excess video storage. This
concept was similar to motion-triggered light switches in homes to save energy.
The "Wake-up" prototype used the ArduinoTM UNO microcontroller, a passive
infrared (PIR) motion sensor, 12 V DC relay, and supporting components (see Fig.
3.35). Selected for its scalability and success in sensor system applications, the
ArduinoTM microcontroller was a good start for the prototype with its open-source
platform, lower learning curve, and versatility. The research investigated using the
ArduinoTM UNO microcontroller to "wake up" the system, essentially using it as a power
controller based on a triggering event (motion). Calibration of the motion sensitivity was
available through the ArduinoTM microcontroller, ensuring the system would only wake
up to record data-rich movement in the nest.
Fig. 3.35. ArduinoTM UNO and prototype with PIR sensor
53
Initially, the Wake-up design used a relay to switch on power for the DVR and
cameras when motion was detected at the PIR sensor. However, after power up the
DVR took 45 seconds to boot up before being available to record video input. Therefore,
the DVR was kept in an always-on configuration and the research proceeded with
managing power to the cameras only. Fig. 3.36 shows a block diagram depicting a
microcontroller connected to a relay that toggles power to the cameras. The dashed box
represents the weatherproof equipment box.
Fig. 3.36. Block diagram of the Wake-up prototype
In the preliminary “Wake-up” design (see Fig. 3.37 and Fig. 3.38), the cameras
would send video to the DVR immediately upon receiving power. The RET team
completed some successful testing, but the "Wake-up" prototype remains an element of
continued research and could move toward a custom printed circuit board (PCB) with
design files for replication. For demonstration purposes, PCBWizard™ printed circuit
54
board design software was used to convert the schematic into a PCB design file shown
in Fig. 3.38.
Fig. 3.37. Preliminary schematic of the Wake-up prototype
Fig. 3.38. Preliminary PCB design
55
To help quantify the benefit of toggling the camera power with motion, three
potential scenarios of power consumption were considered: (1) basic off-grid; (2) wakeup off-grid with 18 hours active per day; and (3) wake-up off-grid with eight hours active
per day. For a single P550 camera, the calculations were done for four and eight
cameras powered from the same power station. The prototypes at Rio Bosque would be
Scenario 1b, a basic off-grid setup (see Table X).
TABLE X
SAMPLE USAGE SCENARIOS
Basic Off-Grid
Scenario 1: DVR & cams always on, motion record
Assumption - active 100% of the day (24 hrs)
a. 1 camera
b. 4 camera
c. 8 cameras
Wake-Up (Theoretical)
Scenario 2: DVR always on, motion record
Assumption - active 75% of the day (18 hrs)
a. 1 camera
b. 4 cameras
c. 8 cameras
Scenario 3: DVR always on, motion record
Assumption - active 33.33% of the day (8 hrs)
a. 1 camera
b. 4 cameras
c. 8 cameras
Table XI shows the power consumption results when considering the three
scenarios. For example, if there were only 8 hours of activity per day, the total
consumption could be reduced from 391.68 Whrs/day in the always-on configuration to
263.04 Whrs/day. The associated battery capacity is outlined in Table XII.
56
TABLE XI
POWER CONSUMPTION (Whrs/day)
Scenario
quoted
1
2
3
Hours Active
per Day
24
24
18
8
Number of IR Cameras
1
4
8
720
1152
1728
246.96 391.68 584.64
234.9 343.44 488.16
214.8 263.04 327.36
TABLE XII
BATTERY CAPACITY (Ahrs)
Scenario
quoted
1
2
3
Hours Active
per Day
24
24
18
8
Number of IR Cameras
1
4
8
72 115.2 172.8
24.696 39.168 58.464
23.49 34.344 48.816
21.48 26.304 32.736
Any reduction in the size of the battery bank would benefit field studies because
of the heavy weight of lead acid batteries. Also, the lower the load's power consumption
and battery capacity, the smaller the necessary solar panel array needed to support it.
For each scenario, the daily solar panel output are provided in Table XIII, where the
basic off-grid setup required 71.8 Ahrs/day and a system with only eight hours of activity
per day required 48.2 Ahrs/day. This corresponded to a Windy NationTM solar panel
array of 200 W instead of 300 W for the basic off-grid.
57
TABLE XIII
SOLAR PANEL OUTPUT (Ahrs/day)
Scenario
quoted
1
2
3
Hours Active
per Day
24
24
18
8
Number of IR Cameras
1
4
8
132
211.2
316.8
45.276 71.808 107.184
43.065 62.964 89.496
39.38 48.224 60.016
3.4.7 Outdoor Equipment Study with Undergraduate Team
Following the summer RET program, four undergraduate engineering students
participated in system power consumption questions, refining the design, and
conducting power tests. The equipment was moved to a watering hole on the other side
of the tree line at IDB to view roaming wildlife (see Fig. 3.39).
Fig. 3.39. Cameras facing a small pond
Once the components inside the box were disconnected, the box slid away from
the frame, the solar panels were dismounted from the hinges, transported it to a
watering hole about 500 yards away, and reconstructed it in less than hour (see Fig.
3.40). The ability to disconnect the major pieces (solar panels, equipment box, and the
58
frame) and relocate it on the property illustrated one of the many benefits to the userbuilt off-grid system. Since successful continuous power was observed with the RET
trial at IDB, this next opportunity attempted to resize the off-grid support with the
equipment on hand or at reasonable additional cost. Smaller combinations for off-grid
support were explored in hopes of reducing cost, weight of the batteries, and physical
footprint. Mounted on t-posts, the cameras would view open-area movement. With this
camera positioning, motion was detected constantly either by wildlife activity or simply
vegetation blowing in the wind or clouds overhead. Exhausting the system with openview cameras was intended.
Fig. 3.40. Setup by the pond at IDB
In the October test, the setup temporarily comprised of one DVR, five cameras,
two 100 Ahr batteries, 30 A charge controller, and a 100 W solar panel. Only one solar
panel was used, to lower cost and physical footprint, although outages and a slower
recharge rate were anticipated with the reduced solar array output. Obviously 100 W
was not enough solar power, but it helped to witness the effects of under sizing the offgrid system. If the battery fell below the load cutoff threshold (11.1 V), and once the
solar panels provided energy, the charge controller recharged the battery. Once the
battery level rose above threshold (12.5 V), the charge controller would automatically
59
reconnect power to the load terminal, while continuing to recharge the battery. The
charge controller was set to Normal Mode to continuously supply power to the load from
the battery (when above threshold).
There were indications of wildlife activity in many directions around the pond, so
a fifth camera was added to the prototype. Considering this extra camera, the revised
daily power consumption was 439.92 Whrs/day, requiring a minimum of 43.99 Ahrs
battery capacity. To recharge the system would require 80.65 Ahrs/day of solar panel
output, still in the 300 W solar panel array sizing with Windy NationTM. panels Only the
200 Ahr battery bank was available during this testing from the preliminary design.
According to calculations, the 200 Ahr battery bank should require 236.66 Ahrs/day of
solar panel output, placing the array at over 400 W. Therefore, some outages were
anticipated.
In the November test, the setup comprised of one DVR, five cameras, one 100
Ahr battery, 30 A charge controller, and a 100 W solar panel. The behavior of the
system to only one 100 Ahr battery in the bank was observed to see if the single 62 lb
battery would suffice at Rio Bosque. Five cameras and a single DVR with one 100 W
solar panel drained the batteries to threshold and recharged, further testing the DVR's
response to power outages than the October test. Five cameras, a DVR, and a 100 Ahr
battery, yielded a solar panel output requirement of 136.66 Ahrs/day.
Through both October and November, the system withstood insufficient power
events, such as heavy cloud cover, when the system depended solely on the battery
storage, and also semi-cloudy days increasing the battery recharge time. The DVR
power status was compared to a corresponding level of inferred solar radiation quality
60
that was theoretically activating the solar panels. Available cloud cover data was pulled
from Weather Underground™ by The Weather Channel® for the testing periods, and
was compared to samples of the DVR power status at corresponding time stamps. The
comparison helped identify if overnight power losses could be attributed to previous
periods of cloud cover. Samples were taken at dawn and dusk, when wildlife activity
was more likely to occur at the IDB test site. Sampling at midnight and noon alone did
not provide enough data points to reflect the solar quality throughout the day for obvious
reasons. For example, if a large cloud cluster passed over the system for just the noon
hour when the sample was taken, that could lead to an incorrect assumption that the
entire day was cloudy and lacked solar energy to support the system. Such an
assumption might suggest that the batteries are working well through storms, when in
reality the data was not representative of the amount of potentially usable solar energy.
The opposite could happen as well, where the sample is during the one hour of sunlight
for the day, suggesting the system is not performing well even in direct sun, when it was
actually cloudy throughout most of the day.
Therefore, the following times were sampled for each day: 00:53, 06:53, 09:53,
12:53, 15:53, and 18:53 (24 hour clock). Table XIV shows the methodology for
interpreting potential solar quality received by the solar panels. If the sample was before
sunrise or after sunset (nighttime), the inferred solar radiation quality was categorized
as (1) bad, regardless of cloud cover.
61
TABLE XIV
CLOUD COVER AND SOLAR QUALITY
Cloud Cover
Rank
1
2
3
4
5
6
7
8
9
Cloud Cover Description
Clear
Scattered Clouds
Partly Cloudy
Mostly Cloudy
Overcast
Light Rain/Snow
Rain
Heavy Rain
Thunderstorms and Rain
Solar Quality
Rank
4
3
3
2
2
1
1
1
1
Solar Quality
Description
good
fair
fair
poor
poor
bad
bad
bad
bad
Fig. 3.41 and Fig. 42 show the inferred solar quality and the load status for the
October field deployment, respectively. From these plots the rising and setting of the
sun can be compared to the load status through the day and overnight, while also
providing an indication of cloud cover. Load power was automatically switched off by the
charge controller to protect the battery (11.1 V threshold) after prolonged periods
without sufficient sunlight, such as the 21 hour span experienced October 13-16.
Sustained heavy cloud cover reduced solar quality, but once the storm passed to
expose clear skies, the system recharged the batteries to the minimum for safe use
(11.4 V) in approximately 5 hours and the load resumed normal operation with the
stored configurations. This was supported by the theoretical equation provided by [27]
defining time to recharge to full = [(DOD/100) x Rated Capacity (Ahr) / Rated Output of
Charger (Amps)] + 2 hours. For the 200 Ahr and 50% DOD using the 30 A charge
controller, it would take 5.33 hours to recharge to full.
During the November deployment, the system endured several cloud cover
episodes: 11/4-11/6, 11/16, and 11/19-11/26 (see Fig. 3.43 and Fig. 3.44). Aside from
62
normal mode (0 hours delay) on the charge controller, there were only settings to delay
power on after sunrise on this charge controller, which suggests that some might use it
for applications without nighttime power demands. For observation starting 11/27, the
charge controller mode was changed from normal mode (power load always) to a four
hour delay mode, disconnecting load power from sunset to four hours after sunrise. The
battery size of the preliminary prototype installed at the IDB tests was reduced to 66 Ahr
for the final prototype.
63
Load Status (0-OFF, 1-ON)
0
0053
0953
1553
0053
0953
1553
0053
0953
1553
0053
0953
1553
0053
0953
1553
0053
0953
1553
0053
0953
1553
0053
0953
1553
0053
0953
1553
0053
0953
1553
0053
0953
1553
0053
0953
1553
0053
0953
1553
0053
0953
1553
0053
0953
1553
0053
0953
1553
0053
0953
1553
0053
0953
1553
0053
0953
1553
0053
0953
1553
0053
0953
1553
1
0053
0953
1553
0053
0953
1553
0053
0953
1553
0053
0953
1553
0053
0953
1553
0053
0953
1553
0053
0953
1553
0053
0953
1553
0053
0953
1553
0053
0953
1553
0053
0953
1553
0053
0953
1553
0053
0953
1553
0053
0953
1553
0053
0953
1553
0053
0953
1553
0053
0953
1553
0053
0953
1553
0053
0953
1553
0053
0953
1553
0053
0953
1553
Inferred Solar Quality (1-Bad, 4-Good)
Solar Quality: 10/5/2013-10/25/2013
4
3
2
10/5
10/5
10/6
10/6
10/7
10/7
10/8
10/8
10/9
10/9
10/10 10/11 10/12 10/13 10/14 10/15 10/16 10/17 10/18 10/19 10/20 10/21 10/22 10/23 10/24 10/25
Fig. 3.41. Solar quality for October
Load Status (0-OFF, 1-ON)
1
10/10 10/11 10/12 10/13 10/14 10/15 10/16 10/17 10/18 10/19 10/20 10/21 10/22 10/23 10/24 10/25
Fig. 3.42. Load status for October
64
Load Status (0-OFF, 1-ON)
0
0053
1253
0053
1253
0053
1253
0053
1253
0053
1253
0053
1253
0053
1253
0053
1253
0053
1253
0053
1253
0053
1253
0053
1253
0053
1253
0053
1253
0053
1253
0053
1253
0053
1253
0053
1253
0053
1253
0053
1253
0053
1253
0053
1253
0053
1253
0053
1253
0053
1253
0053
1253
0053
1253
1
0053
1253
0053
1253
0053
1253
0053
1253
0053
1253
0053
1253
0053
1253
0053
1253
0053
1253
0053
1253
0053
1253
0053
1253
0053
1253
0053
1253
0053
1253
0053
1253
0053
1253
0053
1253
0053
1253
0053
1253
0053
1253
0053
1253
0053
1253
0053
1253
0053
1253
0053
1253
0053
1253
Inferred Solar Quality (1-Bad, 4- Good)
Solar Quality: Nov 4-30, 2013
4
3
2
11/4 11/5 11/6 11/7 11/8 11/9 11/10 11/11 11/12 11/13 11/14 11/15 11/16 11/17 11/18 11/19 11/20 11/21 11/22 11/23 11/24 11/25 11/26 11/27 11/28 11/29 11/30
Fig. 3.43. Solar quality for November
November Load Status (0-OFF, 1-ON)
1
11/4 11/5 11/6 11/7 11/8 11/9 11/10 11/11 11/12 11/13 11/14 11/15 11/16 11/17 11/18 11/19 11/20 11/21 11/22 11/23 11/24 11/25 11/26 11/27 11/28 11/29 11/30
Fig. 3.44. Load status for November
65
Overall, the results supported the original goal of developing an off-grid video
system to record wildlife behavior, uninhibited by human presence during observation.
Exciting footage was captured over the two month-long deployments at IDB, including a
buck chasing doe, a black bird taking flight toward the camera, two different bucks
scraping a tree, and a variety of other events. Fig. 3.45 through Fig. 3.48 some stillshots from the videos captured at the watering hole. Chasing and tree-scraping scenes
were particularly interesting for this project because of how it addressed the end goal:
archiving meaningful behavior in situ. Similar video recording of this scraping behavior
of bucks was noted in the study by Huckschlag [13].
Fig. 3.45. Bird taking flight toward the camera
Fig. 3.46. Samples of a small buck, a doe running and a curious buck
66
Fig. 3.47. Buck scraping a tree at night (sequence)
Fig. 3.48. Chase scene on channel 5 (sequence)
From these month-long trials in October and November, this system required
minimal maintenance compared to other systems with more frequent data collection
and/or battery replacement. Toward the end of the November trial, the cameras began
providing occasional racing lines in the video feed, during all hours of the day and night.
The cause was not identified, though it is likely the prolonged heat of being placed in
direct sunlight was an issue for the cameras. The cameras would need to be shaded in
future above-ground trials. Since the cameras were commercial products backed by
warranty, the cameras can be replaced at the field site.
67
CHAPTER 4
FINAL TESTING AND DISCUSSION
4.1
Final Site at El Paso, Texas
4.1.1 Site Layout
In late January 2014, Lois Balin of Texas Parks and Wildlife Department
(TPWD), offered several potential burrowing owl sites for camera installation; the
decision was made to use site A and site B. Site A was the most successful artificial
burrow site at the park annually, increasing the likelihood that an owl would occupy the
camera-equipped burrow. Site A was nearest to the parking lot and picnic tables,
allowing park visitors to see the setup and encourage them to follow the local
conservation project. Also, site B was chosen because it was known to be successful
year after year, and both were in need of repair. To help reduce erosion around the
tunnels, the biologists started reinforcing the tunnel entrances with rocks. A perch was
added to encourage the owls to visit and nest. Local volunteers worked together to
install two prototypes of the research in January 2014 (shown in Fig. 4.1 to Fig. 4.6).
Fig. 4.1. Entrance to and installation of the artificial burrow
68
Fig. 4.2. Running the cables between access bins
Fig. 4.3. Camera mount and tunnel access
Fig. 4.4. Installing the frame and equipment box
69
Fig. 4.5. Front (angled) and rear view of the prototype
After installing the box, a wood brace was placed to help reduce warping from
the weight of the dirt compressing the long sides of the case (see Fig. 4.6).
Fig. 4.6. Equipment box at Rio Bosque
When digging up site A, a couple of organisms were found in the old den. Balin
took the opportunity to see if there was an owl inside, and check for an identification
band for her research. The team witnessed first-hand Balin sealing the tunnels, and
peering into the den from above. Incredibly, both a juvenile owl and a cottontail rabbit
were found together in the den. Fig. 4.7 is a picture of the owl discovered, and the
70
identification band indicated that this was a returning individual. The owl was cautiously
removed from the den during the system installation and observation showed that the
individual returned later that day.
Fig. 4.7. Burrowing owl on install day
4.1.2 Performance
Although set to motion record using the quick-set record mode, the digital video
recording (DVR) device consistently detected false instances of motion, continuously
recording the camera feeds from all channels. This produced an overwhelming amount
of empty footage in which there was no actual motion in the frame, despite the DVR
detecting motion. To troubleshoot, the motion sensitivity feature of the DVR was
lowered to minimum, although perhaps small dust particles in the frame were detected
by the DVR's algorithm.
Despite the quick-set default motion record working properly in the den height
trials and at the TPWD office, it continued to false record nonstop at the field setup (see
Fig. 4.8). Configurations and clock settings are automatically stored for weeks without
power using the small internal battery on the DVR [22], so it was unlikely the DVR
resorted to the default settings with unexpected power losses in the field. The DVR was
also set to auto-reboot each Saturday at noon to refresh the system and resume as
71
configured prior to the safe shut-down and restart. There were no underexposed objects
to produce shadows, which can falsely trigger motion, because this design used a small
den space with full infrared (IR) illumination. On the opposite notion, overexposing the
den might have created issues, but was again unlikely because the quick-set motion
record worked properly in the den height trials.
When reducing the sensitivity did not improve the performance at the burrowing
owl site, the DVR was set to Scheduled Record Mode with motion detection enabled,
thus resolving the issue again. Quick-set record mode was convenient, but unreliable in
some applications, as experienced one time at Isle du Bois (IDB) and again at Rio
Bosque Wetlands Park (Rio Bosque). Scheduled Record Mode took more time to
configure and teach to other users, but improved reliability as witnessed in this
research.
Fig. 4.8. Screen capture of February field test
After a month-long deploy in February 2014, the batteries were still fully charged
and the 24/7 recordings showed that the system did not experience power loss.
Therefore, the reduced battery capacity was a good adjustment to the off-grid system
size. Without the need to swap batteries, this was a critical improvement to the three
day swap required by [10] and the two to four day recording period achieved by Cox [2]
72
in 2012. Even after over 30 days recorded, there was still 11 GB of the 500 GB storage
space remaining on the hard disk drive (HDD). This was with the DVR falsely detecting
motion and recording nonstop, yet it still outperformed the storage capacity of the three
day data retrieval for [10].
Helping to address Lois Balin of TPWD's banding research, the tunnel camera
view showed whether or not owls entering the nest were uncharted to the area because
the leg could be checked for a band (see Fig. 4.9). Interestingly, this particular owl in
Fig. 4.9 did not turn to enter the den, but instead backed out of the tunnel. Although the
faint red glow of the IR LEDs seemed to intimidate this individual, other owls were
observed in and out of the den and tunnel system throughout the month (see Fig. 4.10).
A camera was added to an older nearby burrow after a breeding pair was seen
occupying the nest and had laid nine eggs. Incubation and preening (shown in Fig.
4.10) was recorded by the prototype, and the eggs have yet to hatch at the time of this
composition.
Fig. 4.9. Burrowing owl at the far- and close-end of the tunnel
73
Fig. 4.10. An owl exploring and an incubating owl
The tunnel cameras provided excellent clarity of incoming and exiting organisms,
facilitating the identification of food brought into the den by owls, predation events on
the nest, and many others. Other mammals explored the burrow, like the rabbit that
entered site A at the end of March (see Fig. 4.11) bore several scars which might help
identify this individual among others.
Fig. 4.11. Cottontail rabbit at site A
4.2
Broader Impacts
Applying DVR technology, this work offered the potential to advance current
conservation efforts. The innovation behind this design was not in the individual
74
components, but in their collective application. Undeniably, TPWD's Balin needed
research data that this project was able to provide. In addition, it was a valuable
opportunity that bridged a gap in technology application between engineering and
environmental science, especially for conservation challenges. Interdisciplinary
partnerships are necessary for developing stand-alone environmental observation
systems capable of providing valuable data for scientists to use toward further research
[29]. By the time prototypes were installed at Rio Bosque, the project engaged diverse
participants, ranging from students and scientists to educators and community
members.
System development and the generation of training materials was the focus for
this research, while the data acquired at the final sites at Rio Bosque will be used
toward conservation studies by biologists at TPWD and University of Texas at El Paso.
This project facilitated the advancement of knowledge on a species of international
research interest and concern, the western burrowing owl. A method was developed for
collecting rich visual data, beneficial to scientists across disciplines, offering potential to
advance research in diverse fields centered around science, technology, engineering,
and mathematics (STEM). Furthermore, project expansions could strengthen the
research partnership between the University of North Texas (UNT, Denton, Texas) and
TPWD. Also, the archived video clips could be used in classrooms to teach students
about scientific observations, wildlife conservation, and related technology applications.
Although the prototype was designed with burrowing owls at Rio Bosque in mind,
the model can be modified to suit a number of applications for scientists and enthusiasts
alike. For example, the prototype could be modified to view a song bird nest in a
75
residential backyard or to study other species of conservation concern. This user-built
video system could also be used to advance wildlife management studies, such as deer
surveys and habitat characterizations, that could benefit from being supported off-grid.
To increase knowledge of rehabilitated mammals in captivity, the cameras could be
installed in places like the nearby Big Cat Sanctuary in Boyd, Texas, which has an
internship program that could be an avenue to link technology with other STEM
disciplines.
Communicating this research helped others to envision applications of modern
technology (i.e. CCTV security system), while exploring new technology in the design
(i.e. alternative power). With each new participant the project efforts were disseminated,
addressing the research progress and remaining questions. At each new site, this
information was communicated to the local biologists and Park Rangers. Project efforts
have also been shared in a variety of invited talks, ranging from a local 5th grade
audience to an undergraduate electrical engineering class. As of March 2014, TPWD's
Lois Balin began posting owl sightings from the prototype to the El Paso Urban WildlifeTexas Parks and Wildlife Facebook™ page.
In addition, the Research Experiences for Teachers (RET, NSF Grant Num.
1132585) participants (shown in Fig. 4.12) gained a unique hands-on experience they
shared in their classrooms about working alongside engineering students, faculty, and
TPWD biologists. A blog of their research can be found at
<www.untwildwatch.blogspot.com>. Involvement in this research may propel the
undergraduate participants toward unique, STEM interdisciplinary research, with
relevance to course theory and projects, including: analog and digital design, digital
76
signal processing, wireless communications, off-grid systems, and senior design
classes.
Fig. 4.12. Initial field study at IDB with RET
4.3
Avenues for Continued Research
Using this research as a base, others could improve the prototype design and
answer some of the remaining questions pertaining to the wildlife monitoring stations. A
few potential expansions might include: (1) transitioning to a more efficient long-term
design, with power management; (2) establishing a network of these stations; and (3)
adding environmental data collection, among others.
4.3.1 Modifications to Improve Efficiency
Future researchers could improve the performance of the motion-detection
technique for this system, aiming to reduce the occurrence of false alarms. Improving
the connection mechanism at the terminals, similar to the power strip in [10], might
improve implementation because the connections on the charge controller were difficult
to secure on-site.
77
While considering the charge controller, a better type of unit could improve the
performance of the off-grid system. There are maximum power point tracker (MPPT)
designs that would improve efficiency from the solar panels. Some charge controllers
simultaneously trickle charge the battery and supply the load from the solar panels.
Solar tracking systems use motors to keep the surface of the solar panel at the
optimal angle to the sun, and some systems combine wind and solar power [8].
Incorporating a small vertical axis wind turbine (VAWT) would prove useful at windy
sites like Rio Bosque.
In the Wake-up design, the ArduinoTM microcontroller can be placed in sleep
mode and have it wake up to excitation from the passive infrared (PIR) sensor, helping
to address the concern that the ArduinoTM microcontroller consumes excess power for
the task at hand. Since the microcontroller would already be inside the equipment box,
a temperature sensor and another relay could be used to detect when ambient
temperature inside the equipment box becomes excessive and shut off power to the
DVR for overheat protection and a small DC operated fan could be switched on to
reduce cooling time. Improvements to the off-grid components could reduce the
physical footprint and cost.
4.3.2 Wireless Access and Establishing a Multi-Agent Network
In addition to improving efficiency and replicating this system to monitor
additional sites, researchers could apply networking techniques between sites. Earlier in
this paper, remote access to the DVR was discussed. A local area network (LAN)
connection between the DVR and the main router would allow remote access to the
78
DVR. This wired network would be unrealistic for the El Paso setup, while a wireless
point-to-point range extension might be feasible to take the signal from Rio Bosque
Wetlands Park to the TPWD office in El Paso, Texas (approximately 17.7 km). Point-topoint wireless bridges essentially extend the range of a primary router to an area
outside of coverage such as this. There exists a plethora of information on wireless
communication techniques for video content, becoming a hearty research topic with
considerations for range, bandwidth, compatibility, reliability, and power consumption of
the radio module. Another scaling issue might occur when placing more than one DVR
on the network. An access point at each DVR could allow communication with the
central router, but bandwidth and quality could certainly suffer with increased data
volume.
Power management techniques could be extended to the wireless networking
scheme to transmit only meaningful data-rich video, and only when motion is present at
the camera. This could avoid unnecessary power consumption used to transmit empty
footage. A challenge moving forward could be coordinating when the host receives the
signal for video download, especially if the system only receives power at the
occurrence of movement. A similar comparison would be attempted to place a call when
the receiving phone is turned off, preventing communication until power is restored.
Perhaps a solution would be to power the system all day once per week for file access,
while also serving as a scheduled time to charge the internal battery responsible for
keeping the DVR time/date information.
Recent discussions with faculty at the Department of Electrical Engineering at
UNT identified a need for two expansions: a team to work on the long distance
79
transmission from Rio Bosque to the TPWD office in El Paso; and another team to
locally explore a larger network of video nodes at more owl sites with short range
communication, utilizing the Default Tolerant Network adaptive mesh protocol. The local
mesh network of sites could then transmit to a base station at Rio Bosque for long
distance transmission to the TPWD main office in El Paso, creating a conglomerate of
digital and wireless technology.
4.3.3 Incorporating Video Data to Environmental Monitoring Stations
Next, the network of wildlife monitoring stations could move toward adding the
data to the Texas Environmental Observatory (TEO) [21, 30], which provides a
repository of environmental measurements for parameters such as temperature,
humidity, and soil moisture. Formed under prior research as the CRI: IAD Infrastructure
for Environmental Monitoring and Modeling using Large-Scale Sensor Networks (NSF
CNS-0709285) at UNT, the TEO [30] has several weather stations scattered across
Denton, Texas for collecting environmental data. A long-term site at the City of Denton
Clear Creek National Heritage Center (NHC) could be a wireless hop to the TEO base
station at UNT. Combining video and environmental data for public reference would
support the discussion in [29].
In 2006, the National Science Foundation (NSF) [29] addressed the need for
long-term sensing of the environment and discussed the use of in situ sensors for
gaining a broader understanding of the Earth. Building upon the value of environmental
data collection discussed in [29], the wildlife video footage could be incorporated with
environmental data to further characterize the habitat at a given moment. Researchers
80
at UNT have already been working toward multimedia test benches for environmental
monitoring [31].
4.3.4 Other Extensions
Furthermore, researchers could revisit hard drive swapping because it is likely
more cost effective in a more suitable environment. The proprietary format of the DVR
internal hard drive imposed challenges for the transfer of data and knowledge from one
research team to another. However, there may be other DVRs that offer a hotswappable hard drive discussed by some wildlife video systems [8].
As with any video archiving project, the challenge of big data arises as
tremendous amounts of footage accumulates. An interesting solution would be to apply
some recent work by [32], in which baseball video files were analyzed to identify clips by
major action type. While [32] focused on extracting highlights of sports videos, the owl
footage could be filtered using research-developed digital processing similar to [32].
Use of an activity analyzer to categorize video segments by movement or activity, could
simplify the process of studying the birds' behavior. For example, the clips could be
separated into similar behavior like entering/exiting the nest or eggs hatching. However,
the design discussed in [32] relied on color features of the video frames, while the data
recorded by this video monitoring station was entirely infrared, appearing monochrome.
Others could also seek to improve the performance of the compression
algorithms and video analyses. These could not be explored with the selected SwannTM
system because the software development kit (SDK) was not available, preventing
customization of DVR processing. In a more customizable system, improvements could
81
be made to video compression by taking advantage of known source qualities. A
background modeling unit [18] could be used due to the static mount of the cameras
and relatively unchanging background in the burrow, or by comparing combinations of
features to signify movement between frames. The latter could be described as a twodimensional graph where the axes could be specific features and a slope dividing
normal and abnormal feature combinations to trigger movement. These features might
be saturation levels of a certain color or texture.
Creating a portable power station, or essentially a scaled down version of the
prototype, could be used to connect a standard display monitor on-site and could be
used for demonstrations. Using a smaller battery bank, charge controller, and solar
array the portable power station to power a monitor in the field would allow verification
of the video feed on-site without an extension cord from a power inverter in the car.
Some might even respond to Balin's research use of metal identification tags with
future work by adding radio-frequency identification (RFID) technology. RFID tagging
could be used to trigger recording in the burrow, improve the logging of individual owl
activity, and could even expand to GPS tags for tracking migration.
Continued research was explored by the author of this research in a proposal
writing experience as a graduate course assignment at UNT. The sample three-year
proposal titled the Wild Watch Expansion Project (WWEP) described UNT resources
and potential external collaborators for research. This could be revisited and submitted
for NSF funding to support undergraduate students, graduate students, and a post doc
researcher. Others could build upon prior technical research completed here and further
incorporate public outreach to increase awareness of technology in environmental
82
studies. A natural collaboration could follow with local boys and girls clubs, as well as
engineering education outreach partners in the Dallas-Fort Worth area. Collaborators
could include The Global Owl Project (GLOW), UNT, TPWD, the Wildlife Society, the
Wildlife Conservation Society, United States Fish and Wildlife Service (USFWS), and
the National Park Service Teacher Ranger Teacher Program.
83
CHAPTER 5
CONCLUSION
Through this research, an off-grid video monitoring system was developed and
implemented to aid in the burrowing owl conservation efforts of biologists with the Texas
Parks and Wildlife Department (TPWD). With the species population on a downward
trend, the western burrowing owl is a bird of conservational concern. Researchers with
TPWD combat the lack of natural habitat with the installation of artificial burrows at Rio
Bosque Wetlands Conservation Park. The system developed in this thesis changed the
once time-consuming and unpredictable means of observing the owls at these artificial
sites into a simple matter of reviewing archived videos of burrow activity.
While vendor-built digital video recording (DVR) systems exist for wildlife studies,
this application to underground burrows was an opportunity to experiment with a userbuilt system design. An infrared (IR) camera facing out of the two entrances and one IR
camera overlooking the den, equipped the TPWD biologists to answer more of their
research questions such as owl food selection, nesting behavior, and predation events
on the burrow. The solar powered video system was installed with access for
maintenance and modification in mind, along with supplemental guides and videos
generated to help disseminate project details from one research team to the next.
84
APPENDIX A
SAMPLE MOTION DETECTION CODE
85
/ *Revised Motion Detection Code 7/11/2013
* source http://www.ladyada.net/learn/sensors/pir.html
* PIR sensor tester
* comments added pertaining to this research
*/
int trigger = 12;
// choose the pin for the LED
int pir = 2;
// choose the input pin (for PIR sensor)
int pirState = LOW;
// we start, assuming no motion detected
int val = 0;
// variable for reading the pin status
void setup() {
pinMode(trigger, OUTPUT);
// declare LED as output
pinMode(pir, INPUT); // declare sensor as input
Serial.begin(9600);
}
void loop(){
val = digitalRead(pir); // read input value
if (val == LOW) {
// check if the input is LOW (LOW=motion)
digitalWrite(trigger, HIGH); // turn LED ON (trigger relay)
if (pirState == LOW) {
// we have just turned on, //new motion event
Serial.println("Motion detected!");
// We only want to print on the output change, not state
pirState = HIGH; //hold motion state
}
delay(5000);
}
else { //no motion
digitalWrite(trigger, LOW); // turn LED OFF
if (pirState == HIGH){
// we have just turned off
Serial.println("Motion ended!");
// We only want to print on the output change, not state
pirState = LOW; // exit motion state
}
}
}
86
APPENDIX B
PARTS LIST FOR OFF-GRID PROTOTYPE AT RIO BOSQUE
87
Video System
Price
(USD)
SwannTM SWDVK-825504 Kit: eight-channel
DVR & four cameras
Subtotal
Off-grid Support
Windy NationTM 300W Off-Grid Kit
Polycrystalline solar panels and 30A CC
12V 33Ahr Deep Cycle Marine Lead Acid
Battery GPL-U1T (Lifeline®)
PelicanTM box 1690 w/o foam
Subtotal
Solar Panel Mount
1-1/4" x 48" Galvanized Pipe
1-1/4" x 18" Galvanized Pipe
1-1/4" Galvanized Cap Fitting
1-1/4" Galvanized Tee Fitting
5/16" x 1-3/4" x 3-1/4" U-bolt
5 Gallon Plastic Bucket
Quikrete™ 50-lb (Fast-Set Concrete Mix)
Chain (sold by the foot)
Outdoor security locks (set of 4)
Subtotal
Camera Mounts and Access
6" Atrium Grate
Thin Irrigation Tubing (1 foot)
Vittles Vault™ 15 (4.7 Gallon)
www.uplastic.com
Vittles Vault™ 80 (20 Gallon)
www.uplastic.com
Galvanized bolts and nuts
Fernco™ 4"x2" DWV flexible PVC coupling
Weatherproofing tape
Silicone sealant
Pressure Treated Plywood (1/2"x2"x2")
Small galvanized hinges
Subtotal
Total for Off-Grid Prototype at Rio Bosque
Burrow
88
Quantity
1
Cost
(USD)
400
Price
(USD)
435
Quantity
1
$400
Cost
(USD)
435
140
2
280
290
1
Price
(USD)
23.1
9.91
3.21
6.6
1.3
2.78
4.98
2.51
29.97
Quantity
Price
(USD)
9
1
21.82
Quantity
3
1
1
290
$1005
Cost
(USD)
69.3
19.82
6.42
13.2
7.8
5.56
4.98
7.53
29.97
$164.58
Cost
(USD)
27
1
43.64
50.19
2
100.28
20
9
10
10
5.97
3
1
2
1
2
1
2
20
18
10
20
5.97
6
$251.89
$1821.47
3
2
2
2
6
2
1
3
1
BIBLIOGRAPHY
[1]
“Burrowing owls of the trans-pecos and panhandle regions of Texas,” Texas Parks
and Wildlife Dept., pp. 1-11, 2009.
[2]
A. W. Cox, M. S. Pruett, T. J. Benson, S. J. Chiavacci, and F. R. Thompson III,
"Development of camera technology for monitoring nests," in Video Surveillance of
Nesting Birds, Ed. C. A. Ribic, F. R. Thompson III, and P. J. Pietz, Univ. of
California Press, 2012, pp. 185-209.
[3]
"California's largest burrowing owl population is in rapid decline," Center for
Biological Diversity, Press Release, Sept. 2010.
[4]
Reading, Univ. of. "Reading experts get wise on future of Little Owl," School of
Systems Eng., Univ. of Reading, May 2010.
[5]
"Rio Bosque Wetlands Park," Center for Environmental Resource Management
(CERM), Univ. of Texas at El Paso, 2013.
[6]
J. Brown and S. D. Gehrt, "The basics of using remote cameras to monitor
wildlife," Fact Sheet: Agriculture and Natural Resources, Ohio State University
Extension, Ohio State University, Tech. Rep. W-21-09, 2009.
[7]
C. A. Ribic, F. R. Thompson III, and P. J. Pietz, Video Surveillance of Nesting
Birds. Univ. of California Press, 2012.
[8]
"Remote wildlife viewing systems," SeeMore Wildlife Systems, Inc., Homer, AK,
2013.
[9]
R. T. Golightly, "Castle Rock Seabird Project," Dept. of Wildlife, Humboldt State
Univ., Arcata, CA, 2013.
89
[10]
R. T. Golightly and S. R. Schneider, "Years 9 and 10 of a long-term monitoring
effort at a Marbled Murrelet nest in Northern California," Humboldt State
Sponsored Programs Foundation, California Dept. of Fish and Game, National
Park Service, Arcata, CA, Final Report, Agreement #P0880019, Feb. 2011.
[11]
E. Joachim, "Little owl video blog," Discover Wildlife, BBC Wildlife Magazine, 2011.
[12]
J. Wiese-Fales, "Engineers, wildlife biologists join forces for an inside view of life in
the wild," Mizzou Engineer Magazine, College of Eng., Univ. of Missouri, Dec.
2011.
[13]
D. Huckschlag, "Development of a digital infrared video camera system for
recording and remote capturing," European Journal of Wildlife Research, vol. 54,
no. 4, pp. 651-655, Oct. 2008.
[14]
A. J. Pierce and K. Pobprasert, "A portable system for continuous monitoring of
bird nests using digital video recorders," Journal of Field Ornithology, vol. 78, no.
3, pp. 322-328, 2007.
[15]
"About the Macaulay Library," Macaulay Library, Cornell Lab of Ornithology,
Cornell Univ., 2014.
[16]
M. Bolton, N. Butcher, F. Sharpe, D. Stevens, and G. Fisher, "Remote monitoring
of nests using digital camera technology," Journal of Field Ornithology, vol. 78, no.
2, pp. 213-220, 2007.
[17]
M. A. Acevedo and L. J. Villanueva-Rivera, "Using automated digital recording
systems as effective tools for the monitoring of birds and amphibians," Wildlife
Society Bulletin, vol. 34, no. 1, pp. 211-214, 2006.
90
[18]
S. Fleck and W. Straber, "Smart camera based monitoring system and its
application to assisted living," in Proc. of the IEEE, vol. 96, no. 10, Oct. 2008,
pp.1698-1714.
[19]
J. F. Artiola, I. L. Pepper, and M. L. Brusseau, Environmental Monitoring and
Characterization. Elsevier Academic Press, 2004.
[20]
M.F. Acevedo, M. Varanasi, and R. Thompson, "Research Experiences for
Teachers in sensor networks: Project description," Univ. of North Texas, Denton,
TX, Funded NSF Proposal, NSF no. 1132585, 2011.
[21]
S. Gurung, "Integrating environmental data acquisition and low cost wi-fi data
communication," M.S. thesis, Dept. Elect. Eng., Univ. of North Texas, Denton, TX,
2009.
[22]
Advanced-Series Eight Channel H.264 Digital Video Recorder User Manual, ver.
M82550H18011E, Swann Communications Ltd., 2010.
[23]
G. M. Masters, Renewable and Efficient Electric Power Systems. John Wiley &
Sons Inc., 2004.
[24]
T. Stockhammer, M.M. Hannuksela, and T. Wiegand, "H.264/AVC in wireless
environments," IEEE Transactions on Circuits and Systems for Video Technology,
vol.13, no.7, pp. 657-673, Jul. 2003.
[25]
T. Wiegand, G.J. Sullivan, G. Bjontegaard, and A. Luthra. "Overview of the
H.264/AVC video coding standard," IEEE Transactions on Circuits and Systems
for Video Technology, vol.13, no.7, pp.560-576, Jul. 2003.
[26]
User Manual for VerizonTM FiOS Router Model MI424WR, rev. E, Verizon, 2008.
91
[27]
Technical Manual for Lifeline® Batteries, doc. no. 6-0101, rev. C., Concorde
Battery Corporation, Jul. 2011.
[28]
Complete Off-Grid Solar Kits (100 to 600W) User's Manual, rev. 1, Windy Nation,
2012.
[29]
National Science Foundation, "Sensors for environmental observatories," National
Science Foundation, Press Release 06-010, 2006.
[30]
"TEO online - Texas Environmental Observatory," Dept. Elect. Eng., Univ. of North
Texas, Denton, TX, 2013.
[31]
H. Kandula, "Development of a testbed for multimedia environmental monitoring,"
M.S. Thesis, Dept. Elect. Eng., Univ. of North Texas, Denton, TX, 2011.
[32]
A. N. A. Saudagar, "Automatic extraction of highlights from a baseball video," M.S.
Thesis, Dept. Elect. Eng., Univ. of North Texas, Denton, TX, 2011.
[33]
"About Crittercam," Crittercam, National Geographic Society, 2013.
[34]
N. L. Allison and S. Destefano, "Equipment and techniques for nocturnal wildlife
studies," Farm Bill Contributions to Wildlife Conservation, spec. section of Wildlife
Society Bulletin, vol. 34, no. 4, pp. 1036-1044, Nov. 2006.
[35]
A. Badescu, O. Fratu, A. Frujina, S. Halunga, and I. Marcu, "Wireless sensor
network for wildlife monitoring," Environmental Engineering and Management
Journal, vol. 10, no. 11, pp. 1625-1634, 2011.
[36]
"Basic facts about burrowing owls," Fact Sheet: Burrowing Owl, Defenders of
Wildlife, 2013.
[37]
R. Belu, "Design and analysis of a micro-solar power for wireless sensor
networks," in 9th Int. Conf. on Communications, Jun. 21-23, 2012, pp. 275-278.
92
[38]
B. S. Chauhan, E. David, and P.K. Datta, "Sensors for desert surveillance,"
Defence Science Journal, vol. 55, no. 4, pp. 493-503, Oct. 2005.
[39]
C. Chen, "Developing a wildlife tracking extension for ArcGIS," M.S. thesis, Dept.
Geography, Univ. of North Texas, Denton, TX, 2009.
[40]
C. H. Chen-Ritzo, C. Harrison, J. Paraszczak, and F. Parr, "Instrumenting the
planet," IBM Journal of Research and Development, vol. 53, no. 3, pp. 1:1-1:16,
May 2009.
[41]
P. Corke, T. Wark, R. Jurdak, W. Hu, P. Valencia, and D. Moore, "Environmental
wireless sensor networks," in Proc. of the IEEE, vol. 98, no. 11, Nov. 2010, pp.
1903-1917.
[42]
P. J. DeCoursey, J. R. Krulas, G. Mele, and D. C. Holley, "Circadian performance
of sprachiasmatic nuclei (SCN)-lesioned antelope ground squirrels in a desert
enclosure," Journal of Physiology & Behavior, vol. 62, no. 5, pp. 1099-1108, Nov.
1997.
[43]
S. A. Demers and C. W. Robinson-Nilsen, "Monitoring Western Snowy Plover
nests with remote surveillance systems in San Francisco Bay, California," Journal
of Fish and Wildlife Management, vol. 3, no. 1, pp. 123-132, Jun. 2012.
[44]
P. Dendrinos, E. Tounta, A. A. Karamanlidis, A. Legakis, and S. Kotomatas, "A
video surveillance system for monitoring the endangered Mediterranean Monk
Seal (Monachus monachus)," Aquatic Mammals, vol. 33, no. 2, pp. 179-184,
2007.
93
[45]
V. Dyo, S. A. Ellwood, D. W. Macdonald, A. Markham, C. Moscolo, B. Pasztor, N.
Trifoni, and R. Wohlers, "Wildlife and environmental monitoring using RFID and
WSN technology," in SenSys Annual Conf., Berkeley, CA, Nov. 4-6, 2009.
[46]
V. Dyo, S. A. Ellwood, D. W. Macdonald, A. Markham, C. Moscolo, B. Pasztor, S.
Scellato, N. Trigoni, R. Wohlers, and K. Yousef, "Evolution and sustainability of a
wildlife monitoring sensor network," in SenSys'10 Annual Conf., Zurich,
Switzerland, Nov. 3-5, 2010.
[47]
K. Fowler and M. F. Gard, "Practical issues for installing instrumentation outdoors
part 1," IEEE Instrumentation & Measurement Magazine, vol.14, no.6, pp.32-38,
Dec. 2011.
[48]
A. Garcia-Sanchez, F. Garcia-Sanchez, F. Losilla, P. Kulakowski, J. Garcia-Haro,
A. Rodriguez, J. Lopez-Boa, and F. Palomares, "Wireless sensor network
deployment for monitoring wildlife passages," Sensors, pp. 7236-7262, 2010.
[49]
N. L. Guinasso, Jr., L. C. Bender III, J. N. Walpert, L. L. Lee III, R. D. Martin, R. D.
Hetland, S. K. Baum, and M. K. Howard, "Texas Automated Buoy System (TABS),"
MTS/IEEE Biloxi - Marine Technology for Our Future: Global and Local
Challenges, in Proc. of OCEANS Annual Conf., Oct. 26-29, 2009.
[50]
Y. Guo, P. Corke, G. Poulton, T. Wark, G. Bishop-Hurley, and D. Swain, "Animal
behaviour understanding using wireless sensor networks," in Proc. of the 31st
IEEE Conf. on Local Computer Networks, Nov. 14-16, 2006, pp. 607-614.
[51]
R. N. Handcock, D. L. Swain, G. J. Bishop-Hurley, K. P. Patison, T. Wark, P.
Valencia, P. Corke, and C. J. O’Neill, "Monitoring animal behaviour and
environmental interactions using wireless sensor networks, GPS collars and
94
satellite remote sensing," in Wireless Sensor Technologies and Applications, spec.
issue of Sensors2009, vol. 9, no. 5, 2009, pp. 3586-3603.
[52]
J. K. Hart, and K. Martinez, "Environmental sensor networks: A revolution in the
earth system science?" Earth-Science Reviews, vol. 78, no, 3-4, pp. 177-191, Oct.
2006.
[53]
J. Heimbuch, "Conservationists launch cheap drone to monitor deforestation and
endangered species," TreeHugger, MNN Holding Company LLC, Feb. 2012.
[54]
J. Heimbuch, "Incredible lion photos taken with high-tech remote control camera,"
TreeHugger, MNN Holding Company LLC, Mar. 2012.
[55]
T. Hey, S. Tansley, and K. Tolle, The Fourth Paradigm. Microsoft Research, 2009.
[56]
M. R. Hudson and D. M. Bird, "An affordable computerized camera technique for
monitoring bird nests," Wildlife Society Bulletin, vol. 34, no. 5, pp. 1455-1457,
2006.
[57]
Z. C. Jewell and S.K. Alibhai, "WildTrack: Using footprints to monitor endangered
species," in Int. Workshop on Distributed Sensing and Collective Intelligence in
Biodiversity Monitoring, Netherlands, Dec. 3-5, 2008.
[58]
Z. Jewell, "Effects of monitoring technique on quality of conservation science,"
Conservation Biology, vol. 27, no. 3, pp. 501-508, 2013.
[59]
D. H. Johnson, D. Nieuwenhuyse, and J. Génot, "Survey protocol for the Little Owl
(Athene noctua)," Global Owl Project, Oct. 2007.
[60]
D.H. Johnson, D.C. Gillis, M.A. Gregg, J.L. Rebholz, J.L. Lincer, and J.R. Belthoff,
"Users guide to installation of artificial burrows for burrowing owls," ver. 2.0, Tree
Top Inc., Selah, WA, 2013.
95
[61]
D. I. King, R. M. DeGraaf, P. J. Champlin, and T. B. Champlin, "A new method for
wireless video monitoring of bird nests," Wildlife Society Bulletin, vol. 29, no. 1, pp.
349-353, 2001.
[62]
D. Klute, W. Howe, S. Sheffield, L. Ayers, S. Jones, T. Zimmerman, M. Green, and
J. Shaffer, "Status assessment and conservation plan for the Western Burrowing
Owl in the United States," U.S. Fish & Wildlife Service, Biological Technical
Publication, vol. 6, no. 1, pp. 1-120, 2003.
[63]
M. Lehning, N. Daws, M. Bavay, M. Parlange, S. Nath, and F. Zhao,
"Instrumenting the Earth: Next-generation sensor networks and environmental
science," in The Fourth Paradigm, Ed. T. Hey, S. Tansley, and K. Tolle, Microsoft
Research, 2009, pp. 45-51.
[64]
Y. Li, D. Huynh, S. Das, and D. Du, Wireless Algorithms, Systems, and
Applications Lecture Notes in Computer Science, vol. 5258. Springer Berlin
Heidelberg, 2008, pp. 224-236.
[65]
G. A. Lieberman and L. L. Hoody, "Closing the achievement gap: Using the
environment as an integrating context for learning," SEER Science Wizards, 1998.
[66]
P. Lukowicz, M. G. Baker, and J. Paradiso, "Guest editors' introduction: Hostile
environments," IEEE Pervasive Computing, vol. 9, no. 4, pp. 13-15, 2010.
[67]
A. Margalida, S. Ecolan, J. Boudet, J. Bertran, J. M. Martinez, and R. Heredia, "A
solar-powered transmitting video camera for monitoring cliff-nesting raptors,"
Journal of Field Ornithology, vol. 77, no. 1, pp.7-12, 2006.
[68]
D. Markham, "12 innovative ways technology is saving endangered species,"
TreeHugger, MNN Holding Company, Jun. 2012.
96
[69]
K. Martinez, J.K. Hart, and R. Ong, "Environmental sensor networks," IEEE
Computer, vol. 37, no. 8, pp. 50-56, 2004.
[70]
I. Morsi, "Electronic noses for monitoring environmental pollution and building
regression model," in 34th Annual Conf. of IEEE Industrial Electronics IECON,
Orlando, FL, Nov. 10-13, 2008, pp. 1730-1735.
[71]
"The National Park Service Teacher Ranger Teacher program," National Park
Service and School of Education & Human Development, Univ. of Colorado,
Denver, CO, 2013.
[72]
D. Niemann, "Litte owls," Discover Wildlife, BBC Wildlife Magazine, Jul. 2011.
[73]
D. Pavlacky, J. Blakesley, G. White, D. Hanni, and P. Lukacs, "Hierarchical multiscale occupancy estimation for monitoring wildlife populations," Journal of Wildlife
Management, vol. 76, no. 1, pp. 154-160, 2012.
[74]
A. Piedra, A. Braeken, and A. Touhafi, "Sensor systems based on FPGAs and
their applications: A survey," Sensors, vol. 12, pp. 12235-12264, 2012.
[75]
V. Ponnusamy, A. Hudaya, and A. G. Downe, "A biologically inspired energy
efficient intrusion detection system," in Int. Conf. on Computer and Information
Science, vol. 2, Jun. 12-14, 2012, pp. 729-735.
[76]
"Project Noah," Project Noah and Networked Organisms, 2013.
[77]
G. A. Proudfood, "Miniature video-board camera used to inspect natural and
artificial nest cavities," Predators, spec. issue of Wildlife Society Bulletin, vol. 24,
no. 3, pp. 528-530, 1996.
[78]
V. Reif, V. and R. Tornberg. "Using time-lapse digital recording for a nesting study
of birds of prey," European Journal of Wildlife Research, pp. 52:251-258, 2006.
97
[79]
J. Sauer and M. Knutson, "Objectives and metrics for wildlife monitoring," Journal
of Wildlife Management. vol. 72, no. 8, pp. 1663-1664, 2008.
[80]
P. Sikka, P. Corke, and L. Overs, "Wireless sensor devices for animal tracking and
control," 29th Annual IEEE Int. Conf. on Local Computer Networks, Nov. 16-18,
2004. pp 446-454.
[81]
A. Skelton, "A new wireless sensor node design for program isolation and power
flexibility," M.S. Thesis, Dept. Elect. Eng., Univ. of North Texas, Denton, TX, 2009.
[82]
C. So-In, C. Phaudphut, S. Tesana, N. Weeramongkonlert, K. Wijitsopon, U.
KoKaew, B. Waikham, and S. Saiyod, "Mobile animal tracking systems using light
sensor for efficient power and cost saving motion detection," in 8th IEEE Int.
Symposium on Communication Systems, Networks and Digital Signal Processing,
Jul. 18-20, 2012, pp. 1-6.
[83]
Solar Panel Charge Controller CHC-1224-10 CHC-1224-30 User's Manual, rev.
1.0, Windy Nation, 2013.
[84]
B. Song, H. Choi, and H. S. Lee, "Surveillance tracking system using passive
infrared motion sensors in wireless sensor network," in Intl. Conf. on Info.
Networking, Busan, 2008.
[85]
D. Song, N. Qin, Y. Xu, Y. Kim, D. Luneau, and K. Goldberg, "System and
algorithms for an autonomous observatory assisting the search for the Ivory-Billed
Woodpecker," in IEEE Conf. on Automation Science and Engineering (CASE),
Aug. 2008.
98
[86]
J. B. Sousa and G. A. Goncalves, "Unmanned vehicles for environmental data
collection," Clean Technologies and Environmental Policy, vol. 13, no. 2, pp. 369380, Apr. 2011.
[87]
R. Stolkin, L. Vickers, and J.V. Nickerson, "Using environmental models to
optimize sensor placement," IEEE Sensors Journal, vol.7, no.3, pp.319-320, Mar.
2007.
[88]
D. E. Swann, C.C. Hass, D.C. Dalton, and S.A. Wolf, "Infrared-triggered cameras
for detecting wildlife: An evaluation and review," Wildlife Society Bulletin, vol. 32,
pp. 357-365, 2004.
[89]
“Take Action: Have you ever seen a burrowing owl?" El Paso Zoo, El Paso, TX,
Jun. 2013.
[90]
E. F. Tochan, "Effect of environment factors on the reliability of electronic systems
and computers," in Mediterranean Conf. for Environment and Solar, 2000, pp.4547.
[91]
United States Dept. of Agriculture Forest Service, "Research at the Northern
Research Station," USDA Forest Service, Northern Research Station, 2013.
[92]
United States Fish and Wildlife Service, “Western Burrowing Owl (Athene
cunicularia hypugaea)," Redbook, United States Fish and Wildlife Service, AZ,
Jun. 2013.
[93]
N. Vijaykumar, "Datacenters in the desert," IEEE Technology and Society
Magazine, vol. 30, no. 2, pp. 31-38, 2011.
[94]
Y. Wang, J. Ostermann, and Y. Zhang, Video Processing and Communications.
Prentice Hall, 2002.
99
[95]
Y. Xu and D. Song, "Systems and algorithms for autonomous and scalable crowd
surveillance using robotic PTZ cameras assisted by a wide-angle camera,"
Autonomous Robots, vol. 29, no. 1, pp.53-66, Jul. 2010.
[96]
J. Yang, C. Zhang, X. Li, Y. Huang, S. Fu, and M.F. Acevedo, "An environmental
monitoring system with integrated wired and wireless sensors," in Wireless
Algorithms, Systems, and Applications Lecture Notes in Computer Science, Ed. Y.
Li, D. Huynh, S. Das, and D. Du, Springer Berlin Heidelberg, vol. 5258, 2008, pp.
224-236.
[97]
J. Yang, "Design and implementation of large-scale wireless sensor networks for
environmental monitoring applications," Ph.D. dissertation, Dept. Comp. Science
and Eng., Univ. of North Texas, Denton, TX, 2010.
[98]
Zoological Society of London, "New technologies for monitoring biodiversity," in
Symposium at the Zoological Society of London, London, May 16-17, 2013.
100