1
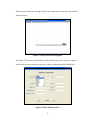
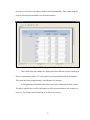
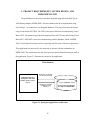
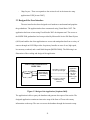
Design and Implementation of a User Friendly
Geodatabase System for the State of Texas
GRADUATE PROJECT REPORT
Submitted to the Faculty of
the Department of Computing and Mathematical Sciences
Texas A&M University-Corpus Christi
Corpus Christi, Texas
In Partial Fulfillment of the Requirements for the Degree of
Master of Science in Computer Science
by
Abhilash Uppala
Spring 2006
Committee Members
Dr. Dulal C. Kar
Committee Chairperson
______________________________
Dr. Joseph C. Loon
Committee Member
______________________________
Dr. David R. Thomas
Committee Member
______________________________
ABSTRACT
An efficient GIS application requires a geodatabase, which not only provides
different layers of geographical datasets but also provides the facility to handle rich data
types and sophisticated rules for business logic. Geodatabase design is based on
geographic representations consisting of organized thematic layers. There is no existing
application for the custom specific settings of the developed Texas census geodatabase.
The census geodatabase for the State of Texas using Microsoft SQL Server 2000 Desktop
Engine (MSDE 2000) has been developed and a windows application with user interface
using Visual Studio .NET 2003 ,Visual Basic .NET and Crystal Reports has been
developed. This project helps students to understand the design implementation of the
developed census geodatabase and also helps students to easily and flexibly retrieve, and
update census data for the state of Texas.
ii
TABLE OF CONTENTS
Abstract…………………………………………………………………………………..ii
Table of Contents………………………………………………………………………..iii
List of Figures…………………………………………………………………………....vi
List of Tables………………………………………………………………………….....vii
1.
Background and Rationale…………………………………………………………..1
1.1 History of GIS………………………………………………………………..1
1.2 Geodatabases………………………………………………………………....2
1.3 Census Representation in GIS ……………………………………………….4
1.3.1
Early Representation of Census Data...…………………………..4
1.4 Representation of Geodatabase……………………………………………...5
1.5 Existing System……………………………………………………………...6
1.5.1 Problems with the Existing System………………………………..6
1.5.2 The Developed System and its Advantages…….……..………...…6
2. Narrative………………………………………..…..…………………………..…...8
2.1 The Census Data Model Design Issues………………….……….……. …....8
2.2 Stages Involved in geodatabase design………………………………….…...9
2.1.1
Design Steps in the Conceptual Phase………………..…………..10
2.1.2
Design Steps in the Logical Design Phase…………………….....10
2.1.3
Design Steps in the Physical Design Phase………………..……..10
2.3 Geodatabase Requirements…….…………………………………….……...10
2.4 Types of Geodatabases……………………………………………….……...11
2.4.1 Personal Geodatabase ……………………………………………...13
2.4.2 Multi-User Geodatabase……………………………………………14
2.5 Application Interface………………………………………………………...14
3.
Project Requirements, System Design, and Implementation………………………. 18
iii
3.1 Implementation of Census Data Model in MSDE 2000……………………19
3.1.1 Architecture of the Geodatabase..…………………………………19
3.2 Documentation of the Design Steps………………………………..……….20
3.3 Design of the User Interface…………………………………………..…….21
3.3.1 Visual Basic.NET……………………………………………………22
3.3.2 Database Connectivity……………………………………………….22
3.3.3 ArcCatalog…………………………………………………………...23
3.3.4 Crystal Reports……………………………………………………….24
3.3.5 NDoc…………………………………………………………………24
3.4 Database Tables……………………………………………………………...25
3.4.1 County Population Table…………………………………………….25
3.4.2 County Area Table…………………………………………………...26
3.4.3 County Housing Table……………………………………………….26
3.5 System Requirements………………………………………………………...26
3.6 Documentation……………………………………………………………….27
3.7 Selected Example…………………………………………………………….28
4. Testing and Evaluation……………………..………………………………….……...31
4.1 Testing the Designed Windows Application..…………………………….....31
4.1.1 Database Connectivity Testing ………………………....………....31
4.1.2 Code Testing…...………………………………………..…….…...31
4.1.3 Usability of the Application Testing..……………………..…….…31
4.2 Comparing the System Designed to the ArcGIS system………………...…..32
5. Future Work ………………………………………………..………………….….…..34
6. Conclusion…………………………………………………………………………….35
Acknowledgements……………………………………………………………………...36
iv
Bibliography and References……………………………………………………….…...37
Appendix A: User Experience Survey Form……………………………………………39
Appendix B: User Manual………………………………………………………………41
v
LIST OF FIGURES
Figure 1.1 Polygon data type with thematic color mapping……………………………..3
Figure 1.2 Digital Elevation Model (DEM)……………………………………………...3
Figure 1.3 Census map of Texas………………………………………………………....4
Figure 1.4 Geodatabase………………………………………………………………......5
Figure 2.1
Stages of Geodatabase Design ……………………………………….……...9
Figure 2.2 Geodatabase ‘Census2000Data’ Designed in ArcCatalog……………….…12
Figure 2.3 Geodatabase Table Editor in ArcCatalog…………………………………...13
Figure 2.4
Menu System of Navigation ……………………………………………….15
Figure 2.5
Data Entry Interface……………………………………………………….15
Figure 2.6
Data Report Generation Interface…………………………………………16
Figure 2.7
Data Report For Year 2000………………………………………………..17
Figure 3.1
Developed Application Architecture…………..……………………….…..18
Figure 3.2
Geodatabase Structure……………………….……………………………..20
Figure 3.3
Design of the Application……………………………………………….....21
Figure 3.4
ADO.NET Architecture……………………………………………………23
Figure 3.5
ER Diagram………………………………………………………………...25
Figure 3.5
NDoc Documentation………………………………………………………28
Figure 3.6
Interactive Map of Texas with County Boundaries…………….…………..28
Figure 3.7
Data Display for Nueces County from the Map………………….………...29
Figure 3.8
Graph Display for Nueces County from the Map………………………….30
vi
LIST OF TABLES
Table 2.1
Types of Geodatabases……………………………………………………..11
vii
1. BACKGROUND AND RATIONALE
Geodatabase design involves identifying the thematic layers to be used in the
construction of the database and, also, specifying the contents of the geodatabases based
on the thematic layers to be used. “Geographic Information Systems (GIS) are
computerized systems for the storage, retrieval, manipulation, analysis, and display of
geographically referenced data” [GEOG 2005]. “GIS technology is founded upon the
capability to organize information into a series of layers that can be integrated using GIS”
[Arctur 2005].
1.1 History of GIS
The field of cartography and mapping dates back hundreds of years. GIS actually
began in the 1960’s. The history of GIS development can be divided into three areas. The
first area involves precursors and preconditions for the development of GIS. The
development in this area comprises the intellectual and technological prehistory of GIS,
such as the early forms of GIS [Arctur 2005]. The issues involved were metrication, land
surveys, military surveillance and mapping expeditions. These issues served as conditions
of the possibility for the GIS to emerge in the form it did. The second area was comprised
of cultural and political economical contexts. For example, there was a need to digitize
maps so that the land management system can be computerized. The third key area is the
development GIS models and software packages and can be traced back to the
innovations in the 1960’s [Arctur 2005].
1
Some of the early important milestones in GIS, which laid the foundation for the
present modern GIS software and databases, will be described in the next paragraph.
In the year 1963, the development of Canada Geographic Information System
(CGIS) commenced, lead by Roger Tomlison. The system was needed to analyze
Canada’s national land inventory. In the same year Urban and Regional Information
Systems Association (URISA) was formed. In the year 1964, Howard Fisher established
the Harvard lab for computer graphics and spatial analysis, which created pioneer
software for spatial data handling. In the year 1967, US Bureau of Census DIME (Dual
Independent Map Encoding) data format was developed by George Farmsworth. In the
year 1969, Environmental Systems Research Institute (ESRI) was founded by Jack and
Laura Dangermond [WISC 2001]. In the same year, Intergraph Corporation was founded
by Jim Meadlock (Originally called M&S computing Inc). Laser was also formed in the
United Kingdom in the same year. In the year 1971, the Canada Geographic Information
System (CGIS) became fully operational. In the year 1972, the first LANDSAT satellite
was launched. IBM’s GFIS (Geographic Information Systems) began in 1973. In the
same year, the Maryland Automatic Geographic Information (MAGI) has become one of
the first state wide GIS projects began. In the year 1973, the USGS began the
development of the Geographical information retrieval and analysis system [WISC
2001].
1.2 Geodatabases
A geodatabase is a collection of geographic datasets. The various types of
geographic datasets are feature classes, attribute tables, raster datasets, network datasets,
2
and topologies [GISLOUNG 2005]. Geodatabases are grouped into two different types,
namely vector and raster. Vector data is split into three types, namely, polygon, line and
point data type. Figure.1.1 illustrates the polygon type vector data with thematic color
mapping.
Figure 1.1 Polygon Data Type with Thematic Color Mapping [GISLOUNG 2005].
Raster data is also classified into three types: thematic data, spectral data and
pictures or image data. Figure 1.2 is an example of a thematic raster dataset, which is
called a Digital Elevation Model (DEM). Each cell presents a 30m pixel size with an
elevation value assigned to that cell [GISLOUNG 2005].
Figure 1.2 Elevation Model (DEM) [GISLOUNG 2005].
3
1.3
Census Representation in GIS
Census data has two main components: geographic mapping data of physical
features and tabular population or demographic data. Figure 1.3 is a census map for the
State of Texas.
Figure 1.3 Census Map of Texas [CENSUSb 2000].
1.3.1 Early Representation of Census Data
In the 1960’s, the census bureau had computerized files that listed the entire street
segment with address ranges and left and right boundary information. Punched cards
were used at that time [Arctur 2005]. The geodatabase management has become more
4
effective and feature rich with the advancement of storage technologies and the
development of computing power. With the advancement of application specific
programming languages and availability of effectively manageable databases,
geodatabase management has become very effective in terms of access time and
manipulation of spatial data.
1.4 Representation of a Geodatabase
The Figure 1.4 illustrates the geodatabase layer in the GIS services environment.
“The geodatabase provides the common data access and management framework for
ArcGIS that enables a user to deploy GIS functionality and business logic wherever it is
needed in desktops, servers (including the Web), or mobile devices” [ESRI 2005a].
Figure 1.4 Geodatabase [ESRIa 2005].
5
With this architecture, the user is equipped with the tools to assemble and use a
geographic information system. One of the main views of the geodatabase is a data model
for representing geographic information using standard relational database technology. A
second, equally important aspect is the way that the geodatabase manages data access and
storage [ESRI 2005a].
1.5 Existing System
There is no application available for students to perform customized tasks on
census geodatabase of the state of Texas. The ArcGIS software package allows the
student to create a geodatabase with format specification, but the students can not manage
the database or perform analysis on the database with ArcGIS software package.
1.5.1 Problems with the Existing System
The problem with ArcGIS is in the creation of customizable applications that is
used for performing a specific task on the geodatabase. The other problem is that data
entry in ArcGIS does not provide a GUI interface. Students need to format the data
before they can actually link the data file (.txt, .doc) to the map they have created. This
process consumes time and also the instructor can not customize tasks on the
geodatabase.
1.5.2 The Developed System and its Advantages
The developed system has been tailored according to the requirements of the
instructor. The system has been developed according to the course module, which was
developed by the instructor. The system has an interactive map of the state of Texas with
county information linked to the map. When a user clicks the county link on the
interactive map, then the county information is displayed on the screen. The population
6
growth graph has been designed and the graph reflects the most current data in the
database. In the sense, when the graph report is refreshed, the dataset is updated and the
report viewer displays the available data from the database. This developed application
has the ability to store and analyze up to 50 years of data. The other important advantage
of this application is the user has greater flexibility of entering the data into the
geodatabase and also has ability to view the contents of the geodatabase in an instructor
specified manner.
7
2. NARRATIVE
Census data is comprised of demographic and economic data. The census data is
very critical in understanding the social and economic well being of the population in a
country [CENSUS 2000a]. Usually the census bureau assumes responsibility of
determining the methods of data collection. After the data is collected, processing and
editing of the data is performed to prepare the data for analysis. The developed
geodatabase management tool collects the data from the users through the data entry
interface. The tool also enables one to perform selected data display using Crystal
Reports.
2.1 The Census Data Model Design Issues
Census data has two principal components. They are geographic mapping data of
the physical features and tabular population data, which is demographic data at many
levels of aggregation units [Arctur 2005]. Once the data is obtained; managing, correcting
and updating the collected data is a major task. To better manage and automate the
validation of the collected data, the TIGER (Topological Integrated Geocoding and
Referencing) System was developed by the United States Census Bureau [CENSUS
2000b]. The TIGER database usually contains, “street center-lines and their names, lakes,
streams, and their names, railroads, geographic entity boundaries, names, and codes, (for
the governmental units, census tracts, census blocks, etc) housing unit locations (selected
areas), key geographic locations (for airports, schools, etc.), ZIP codes and address
ranges (for street with city-style addresses)” [CENSUS 2000b].
Because of the extensive use of census data both by public and private
organizations, the data model that has been developed should enable the user to rapidly
8
put the data to use. The main design issues of the census data model are designing the
thematic layer framework, geodatabase structure, census topology, rules for the census
topology, census boundaries, linking census demographic statistics, deciding on the
administrative units (here county is the smallest divisible administrative unit) [Arctur
2005].
2.2 Stages Involved in Geodatabase Design
The design of the geodatabases generally starts with the thematic layer. Designing
a geodatabase can be divided in to three phases [Arctur 2005].They are 1) Conceptual
design phase, 2) Logical design phase and 3) Physical design phase. Figure 2.1 illustrates
the three phases of geodatabase design.
Conceptual Phase
Logical Design Phase
Physical Design Phase
Geodatabase
Figure 2.1 Stages of Geodatabase Design
9
2.2.1 Design Steps in the Conceptual Phase
The first step in this phase is to identify the end product. The second step is to
identify the key thematic layers based on the requirements of the project. The third step is
to specify the scale ranges and spatial representations for each thematic layer [Arctur
2005]. The final step in this phase is to specify group representations into datasets. In this
sense, discrete features are modeled with feature datasets and feature classes.
2.2.2 Design Steps in the Logical Design Phase
The first step in this phase is to define the tables in the database structure and
behavior of the attributes. The second step is to define the spatial properties of datasets by
topologies to enforce spatial integrity and shared geometry [Arctur 2005]. Next step is to
set the spatial reference for the dataset. The final step is to propose a geodatabase design;
this can be done by studying existing design for examples [Arctur 2005].
2.2.3 Design Steps in the Physical Design Phase
The steps in this phase are to implement, prototype, review, and refine the design.
To design the workflow for building and maintaining each layer. The final but very
important step is to document the design procedure using drawings, layer diagrams, and
schema diagrams, and reports to communicate to the data model [Arctur 2005].
2.3 Geodatabase Requirements
The geodatabase is a multitier architecture (application and storage), where
aspects related to data storage and retrieval are implemented in the storage (RDBMSRelational Database Management System) tier as simple tables, while high-level data
integrity and information processing functions are retained in the application
software[ESRI 2005b]. The following are the requirements for the geodatabase:
10
Scale to large numbers of users (hundreds to thousands).
Provide advanced GIS data models and behavior.
Maintain spatial data integrity.
Deliver fast data retrieval.
Use simple data structures.
Support multiple users and applications.
2.4 Types of Geodatabases
Geodatabases are available in two types, the personal geodatabase and the multiuser geodatabase. Table 2.1 describes in detail the personal and multi-user geodatabases.
Geodatabases work across a range of RDBMS architectures come in many sizes,
Geodatabase type
RDBMS
Notes
Personal geodatabase
Microsoft Jet Engine
(Access)
- Single user editing
- 2 GB size limit
- No versioning support
Multi-user versioned
geodatabase
- Oracle
- Oracle with Spatial
or Locator
- IBM DB2
- IBM Informix
- Requires ArcSDE
- Multi-user editing
- Version-based work flows
- Database size and number of users
up to RDBMS limits
- Microsoft SQL
Server
Table 2.1 Types of Geodatabases [ESRI 2005b].
and have varying numbers of users. They can scale from smaller, single user databases
built on the Microsoft Jet Engine (Access) database up to larger work groups,
departments, and enterprise databases accessed by many users [ESRI 2005b].
11
The geodatabase using ArcCatalog has been implemented in a similar format
employed by US Census Bureau. Figure 2.2 explains the creation of geodatabase named
“Census2000Data”:
Figure 2.2 Geodatabase ‘Census2000Data’ Designed in ArcCatalog
The geodatabase is developed using ArcCatalog from ArcGIS 9 package. Figure
2.3 shows the design time table structure in ArcCatalog. The table has been designed
according to the specifications of the US Census Bureau.
12
Figure 2.3 Geodatabase Table Editor in ArcCatalog
Figure 2.3 illustrates the geodatabase table editor in ArcCatalog. Using the table
editor the geodatabase tables can be designed according to the required specifications.
2.4.1 Personal Geodatabase
Generally a personal database supports a single user editing and has a size limit of
2GB of storage [ESRI 2005b]. The personal geodatabases are very inexpensive compared
to a multi-user commercial geodatabase. A personal geodatabase is ideal for small-scale
13
Windows applications, in which the database would be hosted on the client machine.
MSDE 2000 can be classified as a semi-personal or semi multi-user geodatabase as it
supports a maximum of 20 simultaneous database connections and is not equipped with
user interface, which helps to manage the database and tools to perform database backup.
For MSDE 2000, there is an availability of third party software to manage the database,
this is recommended by Microsoft [Microsoft 2003].
The personal geodatabase for this project has been designed using SQL Server
2000 and after the design phase the database including the structure of the tables are
backed up using SQL Server management console. This database backup file is then used
by freely available MSDE manager software from Blue Bear consulting, to restore the
geodatabase on the installed MSDE 2000 on the required system, where the application is
hosted.
2.4.2 Multi-User Geodatabase
Multi-user geodatabase are mainly used in workgroups, network based GIS,
online GIS services, enterprise environments. Multi-user geodatabases take full
advantage of their underlying RDBMS support and can handle many simultaneous users,
can perform long transactions and versioned workflows and can be extremely large and
continuous geodatabases [ESRI 2005b].
2.5 Application Interface
The geodatabase management tool developed for the census geodatabase for the
State of Texas has a menu system for navigation. Figure 2.4 illustrates the menu system
of the Texas Census Geodatabase Management Tool. In this tool there are a total of five
menus available for navigating through the application. The first is the Data Entry menu.
14
This menu is accessed for entering the data. The county list is stored in the selection box
inside the menu.
Figure 2.4 Menu System of Navigation
The Figure 2.5 illustrates the Data Entry Menu. In this menu, the county list is already
stored inside the selection box on the form, which is technically called Combo Box.
Figure 2.5 Data Entry Interface
15
The interface helps users to select a county and enter the detailed information into the
Geodatabase, which would be hosted on the local machine.
Figure 2.6 Data Report Generation Interface
Figure 2.6 illustrates the report generation interface. The user selects the year of
the report and generates the report of all the counties related to the selected year. The
report generation is done using Crystal Reports software. Figure 2.7 illustrates the data
report for the year 2000 for all counties. This report is generated using Crystal Reports
9.0. The report is pulled from the MSSQL database from the local computer. The report
displays Year, County Name, Population, Population Density, Total Land Area, Water
Area, Total Area, Number of Housing Units, and Housing Unit Density. The Year field in
the report generation interface form is dynamically bounded to the database. This allows
16
the users to select years only those available in the database table. Thus, minimizing the
error of selecting the unavailable year from the database.
Figure 2.7 Data Report For Year 2000
These fields from the database are displayed in three different reports according to
the user requirements. Figure 2.7 is the report from the population table in the database.
This report has been designed using Crystal Reports 9.0 package.
In this application, data bulk load feature was used to load huge amounts of data.
The data is typed in the text file with comma as field separator and new line character as
new row. This feature can load data up to 10,000 rows at a time.
17
3. PROJECT REQUIREMENTS, SYSTEM DESIGN, AND
IMPLEMENTATON
The geodatabase for this project has been designed using Microsoft SQL Server
2000 Desktop Engine (MSDE 2000). The same database has been implemented using
ArcCatalog 9.1 to compare the two designed databases. The project has been developed
using Visual Studio.NET IDE. The GUI for the project has been developed using Visual
Basic .NET. The business logic has been separated from the GUI and coded using Visual
Basic.NET. ADO.NET is used for communicating with the database, which is MSDE
2000. Crystal Reports has been used as a reporting tool for some of the report generation.
This application has been used by the instructor to interact with the geodatabase on
MSDE 2000. The architecture uses the client system to do the database hosting as well as
the application. Figure 3.1 illustrates the design of the application.
Client Machine
Application interface
developed in VB .NET
(Forms, menus, report viewer)
Result data to be dumped
into the report/data grid
SQL Queries, connection
establishment using
ADO.NET
Texas Census Geodatabase
developed on MSDE 2000
Figure 3.1 Developed Application Architecture
18
3.1 Implementation of Census Data Model in MSDE 2000
The census data model is implemented using the MSDE 2000. MSDE 2000 is a
data engine built and based on core SQL Server technology. With support for single- and
dual-processor desktop computers, MSDE 2000 is a reliable storage engine and query
processor for desktop extensions of enterprise applications. The common technology base
shared between SQL Server and MSDE 2000 enables developers to build applications
that can scale seamlessly from portable computers to multiprocessor clusters. Designed to
run in the background, supporting transactional desktop applications, MSDE 2000 does
not have its own user interface (UI) or tools. Users interact with MSDE 2000 through the
application in which it is embedded [MSDE 2003].
3.1.1 Architecture of the Geodatabase
The geodatabase is a multitier architecture (application and storage), where
aspects related to data storage and retrieval are implemented in the storage (RDBMS) tier
as simple tables, while high-level data integrity and information processing functions are
retained in the application software (GIS) [ESRI 2004c]. The RDBMS is used as one of a
series of implementation mechanisms for continuous sets of geographic data, like files.
The RDBMS does not fully define the semantics of the geographic data [ESRI 2004c].
The geodatabase is comprised of rules and behavior which are coupled with data.
19
Geodatabase
Data
Rules and Behavior
Figure 3.2 Geodatabase Structure
In this project, the census database has tables and rules for its implementations in
MSDE 2000. The user interface for laboratory application for students to use and
understand the geodatabase is constructed using Visual Basic .NET in Visual Studio 2003
development environment.
3.2 Documentation of the Design Steps
The design of the geodatabase has been documented step by step starting from the
table design to the rules framed for the database. In order to document the geodatabase,
the following five key parts to the schema representation are taken into consideration.
-
Datasets - These are collections of specifications for a feature class, database
catalog or an attribute table [Arctur 2005].
-
Domain - These are the list of ranges of valid values for attribute columns.
-
Relationships – They define how rows in one table are associated with the rows in
another table [Arctur 2005].
-
Spatial Rules – These rules are used to enforce the desired spatial behavior.
20
-
Map Layers - These corresponds to the various levels in the interactive map
application of GIS [Arctur 2005].
3.3 Design of the User Interface
The user interface has been designed to aid students to understand and populate
the geodatabase. The application has been constructed using Visual Basic .NET. The
application has been written using Visual Studio 2003 development tool. The access to
the MSDE 2000 geodatabase has been provided by Microsoft® ActiveX® Data Objects
(ADO) and enables the client applications to access and manipulate data from a variety of
sources through an OLE DB provider. Its primary benefits are ease of use, high speed,
low memory overhead, and a small disk footprint [MSDN 2004a]. The following is an
illustration of the working and design of the application.
Texas Census Geodatabase on
MSDE 2000
Results
Geodata
Queries
ADO .NET
(Responsible for
all data handling
functions)
Result data to be dumped
into the report/data grid
SQL Queries, connection
establishment using
ADO.NET
Application
interface
developed in
VB .NET
(Forms,
menus, report
-viewer)
Figure 3.3 Design of the Application [Stephens 2002].
The application is able to query the database and generate the report of the results. The
designed application contains an interactive map of the State of Texas with county
information on the map. The user can access the database through the interactive map.
21
3.3.1 Visual Basic.NET
Visual Basic .NET 2003 provides an easy way, and is a productive language tool,
for rapidly building applications for Microsoft Windows®. Ideal for existing Visual
Basic developers as well as new developers in the Microsoft .NET development
environment, Visual Basic .NET 2003 delivers enhanced visual designers, increased
application performance, and a powerful integrated development environment (IDE) to
get one on the fast track to application development. [MSDN 2004b]
3.3.2 Database Connectivity
ADO.NET provides consistent access to data sources such as Microsoft
SQL Server or MSDE 2000, as well as data sources exposed through OLE DB, SQL
Client, ODBC and XML. Data-sharing consumer applications can use ADO.NET to
connect to these data sources and retrieve, manipulate, and update data. ADO.NET
leverages the power of XML to provide disconnected access to data. ADO.NET was
designed hand-in-hand with the XML classes in the .NET Framework [MSDN 2004a].
The ADO.NET Dataset object can also be used independently of a .NET
Framework data provider to manage data local to the application or sourced from XML
[MSDN 2004a]. “ADO.NET cleanly factors data access from data manipulation into
discrete components that can be used separately or in tandem. ADO.NET includes .NET
Framework data providers for connecting to a database, executing commands, and
retrieving results. Those results are either processed directly, or placed in an ADO.NET
Dataset object in order to be exposed to the user in an ad-hoc manner, combined with
data from multiple sources” [MSDN 2004a].
22
Figure 3.4 ADO.NET Architecture
Figure 3.4 shows ADO.NET architecture. “The ADO.NET classes are found in
System.Data.dll, and are integrated with the XML classes found in System.Xml.dll.
Compiling code uses the System.Data namespace, which reference both System.Data.dll
and System.Xml.dll” [MSDN 2004a].
3.3.3 ArcCatalog
The Geodatabase has been constructed using ArcCatalog Using ArcGIS package.
The ArcCatalog application organizes and manages all GIS information such as maps,
globes, data sets, models, metadata, and services. It contains tools to:
- Browse and find geographic information from the datasets
- Record, view, and manage metadata
- Define, export, and import geodatabase schemas and designs
23
In ArcCatalog, “Users employ to organize, find, and use GIS data as well as document
data holdings using standards-based metadata. A GIS database administrator uses
ArcCatalog to define and build geodatabases” [ESRI 2005].
The windows application has been developed to interact with the geodatabase on
MSDE 2000 through an interactive map developed using visual basic .NET. The
developed application setup package has been installed on a single client machine. The
client machine hosts both the application and the database. Similar geodatabase has been
constructed using ArcCatalog that is compared to the geodatabase built using MSDE
2000.
3.3.4 Crystal Reports
Crystal Reports for .NET provides developers with a fast and highly productive
way to create and integrate presentation-quality, interactive reports. Crystal Reports for
Visual Studio .NET provides a comprehensive reporting solution for .NET developers
that is thoroughly integrated with both the Visual Studio .NET IDE and the .NET
Framework. Crystal Reports supports ADO.NET, XML Web Services, and ASP.NET
server controls and caching. It also integrates seamlessly with the Visual Studio .NET
Server Explorer, toolbox, and design environment. It has a rich programming model and
flexible options for customizing and deploying reports. [BOCR 2003]
3.3.5 NDoc
NDoc is an open-source documentation generator for .NET projects. It takes
project output in the form of dll or exe file and an XML file containing custom
documentation added within the code and products MSDN look-alike HTML based help
files. The tool uses a mixture of Reflection on the library or executable and the
descriptions exported to the XML files to populate this documentation. Visual Studio
24
helps in this process by adding some skeleton tags before methods when one begin to
type “///”. [ONCF 2003]
3.4 Database Tables
The data from the users are stored in SQL Server database in the form of tables.
Figure 3.5 illustrates the Entity-Relationship Diagram of the tables used in the project.
There are three tables in the database. The three tables were necessary instead of having
one table, as the data retrieval has been made simple. For example, in generating the
population report, we use only the population table. If it was only one table containing all
the fields, filling the data grid would take up more system resources.
Figure 3.5 ER Diagram
3.4.1 County Population Table
This table is used to store the name of the county, year, population, total area, and
population density of a county. In this table, there are two primary keys according to the
25
design logic, as we can have rows with same county name and different year. So the
combination of county name and the year served the role of a combined primary key.
3.4.2 County Area Table
This table is used to store the name of the county, year, population, total area,
land area and water area of a county. The primary key design for this table is similar to
the primary key design of the county population table.
3.4.3 County Housing Table
This table is used to store the name of the county, year, housing units, and
housing unit density of a county. The primary key design for this table is similar to the
primary key design of the county population table.
3.5 System Requirements
The project has been implemented on a PC running Windows XP Operating System
with service pack 2. A Windows XP with IIS installed on the local machine was used,
which functions as a database server for the system. The .NET Frame Work 1.1 runs the
application and database modules. The application was developed in Visual Basic.NET
and MSDE 2000 (SQL Server 2000).
Minimum requirements for running Visual Basic.NET are:
•
Processor: 450-Megahertz (MHz) Pentium II-class processor, 600-MHz Pentium
III-class processor and higher are recommended.
•
Operating System: Microsoft Windows® Server 2003, Windows XP
Professional. Applications can be deployed onto the following systems: Windows
Server 2003, Windows XP Professional.
26
•
Memory: Windows Server 2003: 160 Megabytes (MB) of RAM, Windows XP
Professional: 160 MB of RAM.
•
Hard Disk: 500 MB of available space required on system drive, 1.5 gigabytes
(GB) of available space required on installation drive. Additional 1.9 GB of
available space required for optional MSDN Library documentation [MSDN
2004c].
Minimum requirements for running MSDE 2000 are:
•
Processor: 450-Megahertz (MHz) Pentium II-class processor, 600-MHz Pentium
III-class processor and higher are recommended.
•
Operating System: Microsoft Windows® Server 2003, Windows XP
Professional. Applications can be deployed onto the following systems: Windows
Server 2003, Windows XP Professional.
•
Memory: 128 MB minimum on Windows XP
•
Hard Disk: 44 MB minimum [MSDN 2004d]
3.6 Documentation
NDoc tool has been used to generate the documentation files for this project. It
generates class library documentation from the assembly file of this project. It used
pluggable documenters to generate documentation in Visual CHM format as shown in
Figure 3.13. It provides the description of all the classes, members, and objects used in
the application. The help menu from the main menu of Figure 2.4 displays two options to
select the help system. The first is the technical documentation which is shown in Figure
3.5 and the second is the user manual for the project, which is a .PDF file.
27
Figure 3.5 NDoc Documentation
3.7 Selected Example
Figure 3.6 shows the interactive map of Texas. This map is loaded from the Data
Analysis Menu located in the main menu form as shown in Figure 2.4.
Figure 3.6 Interactive Map of Texas with County Boundaries
28
When a user clicks on the respective County (Nueces County is the selected
example in this project), the information regarding the Nueces County is displayed in
the data grid.
Figure 3.7 Data Display for Nueces County from the Map
The user can edit, update, and sort the information that is displayed inside the data
grid. Figure 3.7 is the Nueces County information displaying population data, area data
and housing unit data. The pencil icon inside the Total Area data grid indicates that the
data editing process is taking place. The user can then save the edited data inside the data
grid by clicking on the Save Changes button the form. This step completes the update
process of the application.
29
Figure 3.8 Graph Display for Nueces County from the Map
Figure 3.8 shows the population growth graph for Nueces County. The graph report
is generated from Figure 3.7 form, by clicking on the “Show Population Growth Graph
Button”. This report is dynamically linked to the database and on refreshing the report;
the report displays the most current entrees from the database. This report can be
generated for all the counties, which can be accessed through the interactive map. This
graph report has the ‘search record’, ‘export to PDF format’ and ‘print report’ features. A
similar graph on housing units is generated from Figure 3.7 form, by clicking on the
“Show Housing Units Growth Graph”.
30
4. TESTING AND EVALUATION
This chapter describes the usability and user interface design of the project. A set of
testing schemes has been used to see if the whole project is performing the tasks as
expected. The designed geodatabase has been tested for consistency in the rules and data
using ArcGIS 9.1 Software package. The designed geodatabase has been tested for errors
in tables and also in the relationship between tables.
4.1
Testing the Designed Windows Application
The windows application designed for the student geodatabase laboratory has been
tested for the database connectivity, code testing, and usability of the application.
4.1.1 Database Connectivity Testing
This testing is carried out on the database and the windows application if it is
populating the database as the expected manner.
4.1.2 Code Testing
This is performed to check if the code written is generating the expected results.
In this testing the input is supplied to the designed windows application and check if the
application is generating the expected output.
4.1.3 Usability of the Application Testing
Usability testing is used to identify how users actually interact with the
application. In a typical approach, users, one at a time or two working together, use the
application to perform tasks, while one or more people watch, listen, and take notes. The
application has been tested for the ease of navigation through the forms, appearance,
consistency so that the data is displayed as expected.
31
Appearance: All the pages in the application have been designed using same color, font,
and font style. All the pages have been checked for the uniformity in the appearance.
Ease of navigation: The application has been tested to see if there are any links that break
the application and made sure that all the links are properly connected to the required
pages.
The testing has also been carried by the instructor. His feedback has been
collected and analyzed to make the improvements in the application.
4.2 Comparing the System Designed to the ArcGIS system
The geodatabase has been built using ArcCatalog from ArcGIS 9.1 package and
compared as to features and ease of use of the application. This process enables one to
make further enhancements to the designed windows application. The database designed
on ArcGIS has been compared with the database on MSDE 2000 for the behavior of the
database and the ability to interface to a front-end application, like the application
developed in this project. The following are the findings of the comparison:
-
The Geodatabase developed in ArcCatalog is not ready to interact with front-end
application. In other words, separate software called ArcGIS engine is required to
develop the complete application with the ArcGIS database as the back-end
database. Whereas the database developed in MSDE 2000 is ready for developing
application using any available programming languages like C/C++, C#, Visual
Basic, Java etc.
-
Separate tools are required to perform data analysis on ArcCatalog in ArcGIS.
These tools are only available from ESRI and are not compatible with other
commercially and freely available software, thus limiting the scope of the
32
development in rapidly prototyping the application. Whereas the MSDE 2000 and
.NET environment enable the developer to rapidly prototype the application.
-
The advantage of the geodatabase developed using ArcCatalog is that, the
geodatabase is ready to interact with a shape file (Shape file is a vector data
storage format for storing the location, shape, and attributes of geographic
features. A shape file is stored in a set of related files and contains one feature
class.) used to make maps. Whereas in MSDE 2000 and .NET environment the
shape file must be defined by the developer, which is a time consuming process.
33
5. FUTURE WORK
This project has some scope for enhancement in the future. The following are some of
the ideas that can be incorporated into this project in future.
1. Cartographic visualization can be added as a new feature to the geodatabase for
this application.
2. This project is a well documented project using the NDoc tool for the technical
documentation. This documentation helps any developer to modify the code very
easily with minimum effort required to read the code.
34
6. CONCLUSION
The design of the geodatabase is aimed at understanding the design principles and
practices involved. The geodatabase for the census data for the state of Texas (in the
order of county) has been developed using the MSDE 2000, Crystal Report and ArcGIS
9.1 GIS software packages. The windows application for students of the GIS geodatabase
laboratory has been developed using Visual Basic .NET. This application would therefore
aid the students of GIS geodatabase laboratory to understand, populate and query the
geodatabase developed using MSDE 2000.
35
ACKNOWLEDEGEMENTS
I express my sincere thanks to my project committee member Dr. Joseph C. Loon,
for his guidance, support, and valuable insights all along the project, right from the
proposal phase. I also thank the committee chairperson Dr. Dulal C. Kar for his
encouragement and valuable support throughout the project and committee member
Dr. David R. Thomas for his encouragement and valuable feedback during the project
proposal and during various stages of the project.
36
BIBLIOGRAPHY AND REFERENCES
[Arctur 2005] Arctur, D. and Zeiler, M. Designing Geodatabases. ESRI Press, 2004.
[BOCR 2003] Business Intelligence with Crystal Reports. Available from
http://www.businessobjects.com/?404;http://www.businessobjects.com/products/r
eporting/crystalreports/net/default.asp (Visited on Dec 25, 2005).
[CENSUS 2000a] Performance Principles. Available from
http://www.census.gov/quality/performance_principles.htm (Visited Oct 1, 2005).
[CENSUS 2000b] Texas Map. Available from
http://ftp2.census.gov/geo/maps/special/profile2k/TX_2K_Profile.pdf (Visited
Oct 3, 2005).
[ESRI 2004c] Geodatabase Architecture. Available from
http://www.esri.com/software/arcgis/geodatabase/about/architecture.html (Visited
Oct 23, 2005).
[ESRI 2005] ArcCatalog. Available from
http://www.esri.com/software/arcgis/about/desktop.html (Visited Nov 3, 2005)
[ESRI 2005a] Geodatabase Structure. Available from
http://www.esri.com/software/arcgis/geodatabase/index.html (Visited Oct 21,
2005).
[ESRI 2005b] Personal and Multi-User Geodatabase. Available from
http://www.esri.com/software/arcgis/geodatabase/about/personal.html (Visited
Oct 22, 2005).
[GEOG 2005] GIS History. Available from
www.geog.buffalo.edu/ncgia/gishist/bar_harbor.html (Visited Sep 29, 2005).
[GISLOUNG 2005] Geodatabase types. Available from
http://gislounge.com/features/aa050100a.shtml (Visited Sep 29, 2005).
[MSDE 2003] MSDE 2000 Overview. Available from
http://www.microsoft.com/sql/msde/productinfo/overview.mspx (Visited Oct 22,
2005).
[MSDN 2004a] ADO Data Access. Available from
http://msdn.microsoft.com/library/default.asp?url=/library/enus/cpguide/html/cpconoverviewofadonet.asp (Visited Oct 24, 2005)
37
[MSDN 2004b] Developing Application using VB.NET (April 2004).
http://msdn.microsoft.com/library/default.asp?url=/library/enus/vbcon/html/vborivisualbasicinactionendtoendsolutions.asp (visited Oct 24,
2005).
[MSDN 2004c] Microsoft Visual Basic Developer Center (April 2004). Available from
http://msdn.microsoft.com/vbasic/productinfo/sysreqs/default.aspx (visited Dec
13, 2005).
[MSDN 2004d] Overview of Installing SQL Server 2000 (January 2004). Available from
http://msdn.microsoft.com/library/default.asp?url=/library/enus/instsql/in_overview_74vn.asp (visited Dec 14, 2005).
[Microsoft 2003] MSDE 2000 third party software. Available from
http://www.microsoft.com/sql/msde/partners/default.asp (Visited Nov 1, 2005)
[ONCF 2003] Documenting your code with NDoc. Available from
http://www.opennetcf.org/PermaLink.aspx?guid=05650440-2281-4f72-bdb2fe6343284dca (Visited Dec 24, 2005).
[Stephens 2002] Visual Basic .NET database Programming. QUE April 11 2002
[WISC 2001] GIS Geography History. Available from
http://www.geography.wisc.edu/sco/gis/history.html (Visited Oct 21, 2005).
38
APPENDIX A: USER EXPERIENCE SURVEY FORM
Texas Census Geodatabase Management Tool
Thank you for using ‘Texas Census Geodatabase Management Tool’. Please fill
out this survey, so that this tool can be improved to suit your need. Please circle the
appropriate choices for the questions below.
1. A. Instructor B. Student
2. How were the steps described in the user manual to install the database?
A.
B.
C.
D.
E.
Very easy
Easy
Average
Hard
Very hard
3. How were the steps described in the user manual to install the application?
A.
B.
C.
D.
E.
Very easy
Easy
Average
Hard
Very hard
4. Were the steps in the user manual very confusing?
A.
B.
C.
D.
No
Some steps were difficult.
Difficult to understand
No clue
5. How easy did you find the application to navigate?
A.
B.
C.
D.
E.
Very easy
Easy
Average
Hard
Very hard
39
6. How easy did you find help for the software?
A.
B.
C.
D.
E.
Very easy
Easy
Average
Hard
Very hard
7. How useful was this installation and usage of this software & geodatabase?
A.
B.
C.
D.
E.
Very useful
Useful
Neither useful nor useless
Somewhat useful
Somewhat useless
8. What features do you like to add to this software?
_____________________________________________________________
_____________________________________________________________
_____________________________________________________________
9. What features do you like in this software?
_____________________________________________________________
_____________________________________________________________
_____________________________________________________________
10. What features do you dislike in this software?
_____________________________________________________________
_____________________________________________________________
_____________________________________________________________
11. Your contact information (optional)
______________________________________________________________
______________________________________________________________
40
USER MANUAL
Installation Instructions
Installation of the MSDE 2000 on the Client Machine
1. On the CD-ROM, double-click ok the folder named MSDE 2000.
2. Now, double-click on the
3. After you double-click on the package similar to the above figure, it will unpack
all the required contents for MSDE 2000 installation.
4. Open a new command prompt. On Windows XP it may be found at Start Menu >
All Programs > Accessories > Command Prompt. You may also go to Start
Menu > Run and type command.
5. At the command prompt, change to the MSDE directory: First change to the drive
root: Type cd\. Then type cd <MSDE Directory Path> and press enter. If
unpacked to the default location this would be cd MSDERelA. You are now in the
directory where the setup.exe file is located.
41
6. The above screenshot shows the commands needed to be entered in the command
prompt.
7. To avoid errors during installation. Please enter the commands exactly as shown.
8. In the above example installation. The password “simple” is used. It is up to you
to decide on the password and you need to remember whatever password is
typed in the place of the “simple”.
9. After you have performed the above commands in the screenshot, please reboot
your computer.
10. MSDE 2000 installation is complete. For confirmation please find the
icon at
the right most corner of your computer screen. It indicates the MSDE 2000 is
running.
Installation of the MSDE Manager on the Client Machine
1. On the CD-ROM, double-click ok the folder named MSDE 2000.
2. Now, double-click on the setup icon.
3. Follow the on screen instructions to complete the installation of MSDE manager.
4. Now, you have successfully completed the installation of MSDE Manager.
Restoring the project Database and Structure using MSDE 2000
1. On the CD-ROM, double-click ok the folder named MSDE 2000.
2. Find for the backed up database icon.
3. Go to the Start Menu > All Programs > MSDE Manager > MSDE Manager
2000.
42
4. The above screenshot illustrates the location of MSDE Manager 2000 on your
system.
5. After you click on the MSDE Manager 2000, you will see the following interface.
6. Go to File> connect, as shown below.
7. After you click on connect, you will see the following screen
43
8. Logon to the local server on your computer, the user name will be “sa” and the
password is the same which you have created at the time of MSDE 2000
installation.
9. After the logon process. Click on the databases menu as shown below, to find
and click on restore a database entrée.
10. Type in the database name as “Txprojdbase” and navigate to MSDE 2000 folder
on the CD to find the
backup file as shown in the figure
below.
44
11. In this case the folder on the desktop is been shown, but on your computer you
must navigate it to the CD-ROM and to the folder MSDE 2000.
12. Click on Restore now button.
13. The project database loaded with 2000 census data for Texas State is ready to be
used by the program.
Installation of the Geodatabase Management Tool on the Client Machine
(Before you install the application make sure your system has .NET framework 1.1, if
you do not have it installed, open the .net framework folder on the CD and doubleclick on the installation icon to install it.)
1. In the CD-ROM find for the folder named Txgdbase and double-click on the
setup file.
2. Continue the setup reading onscreen instructions.
3. Make sure to install the application in the Program Files folder of you system. See
the following screenshot for more information.
45
4. Once finished the setup process. Go to the Program Files folder and click on the
Txgdbase and click on app.config file and Txprojdbase.exe.config file open it
using the notepad.
5. The connection string looks like the following in both the files:
<add key="oleconnection" value="Provider=SQLOLEDB; Data Source=ABHI;
user id=sa; password=simple; Initial Catalog=Txprojdbase;" />
6. Change the data source value and password, if you have entered different than
“simple”.
7. To find the data source value, right click on the
icon at the right corner of the
screen.
8. Click on the “Open SQL Service Manager”.
9. Note the server name, this server name is to be used in the data source value in the
app.config file.
10. Change the data source value with the server name found.
11. Save the app.config file opened in the notepad and close.
12. Repeat the same steps for Txprojdbase.exe.config file.
13. Go to Start Menu > All Programs and find the installed tool and click on it to
start using the tool.
46
14. To install the “Technical Documentation” and “User Manual” in “Help” menu
copy the “dotnet” folder on the CD-ROM to “C:” drive on your computer.
Bulk Load Feature:
1) On the CD you will find 3 text files namely ‘countypopulation’, ‘countyarea’,
‘countyhousing’. Copy them and put them all directly in the ‘C:’ drive.
2) For countyarea enter the data in this sequence – county, year, totalarea, landarea,
waterarea.
3) For countypopulation enter the data in this sequence – county, year, population,
totalarea, populationdensity.
4) For countyhousing enter the data in this sequence – county, year, housingunits,
housingunitsdensity.
47
Software Help
Texas Census Geodatabase Management Tool is menu based tool. The following
is the description of the menus and sub menus. Each menu has a shortcut key
configuration. The following table is the list of the menu / sub menu and the shortcut key
configuration associated with it.
Menu
Sub Menu
Shortcut Configuration
Data Entry
Data Entry Form
Ctrl+B
Data Bulk Load
Shift+F1
Load Texas Map
Ctrl+D
Load Full Data
Ctrl+E
County Population Report
Ctrl+G
County Area Report
Ctrl+H
County Housing Report
Ctrl+I
Technical Documentation
Ctrl+K
User Manual
Ctrl+L
-
Ctrl+X
Data Analysis
Data Report
Help
Exit
Data Entry Form: This Data Entry Form will help you to enter the data into the
geodatabase. You can rollover the mouse on the labels of the Data Entry Menu and help
relating the field is displayed on the screen. After entering the values into the
corresponding fields, you may choose to save the data entered by clicking on the “Save”
button at the bottom of the form. You may choose to clear the fields to enter another set
of data by clicking on the “Clear Fields” button. If you are finished entering the data, you
may choose to close the form by clicking on the “Exit” button.
48
Note: If you enter the same data twice, you will get an exception error and the
application will be closed.
Texas County Map: This map can be loaded by selecting “Load Texas Map” sub
menu under “Data Analysis” menu. This map loads all the counties of the Texas State. If
you rollover any county name on the map, the full county name will be displayed on the
screen. If you click on any of the county name the Texas County Information Form will
be loaded on the screen and this Form contains the population, area, and housing data
displayed inside the data grids on the form. There are two buttons on this form namely
“Show Population Growth Graph” and “Show Housing Units Growth Graph”. If you
click on either of the two buttons the corresponding graph will be displayed on the
screen.
Full Data Report: This form contains all the data available in the database. You
can edit the values in this form and by placing the cursor inside the table field and
entering the new value and after finishing the updating process you need to enter the
“Save Changes” button to reflect the changes made in the geodatabase.
Data Report: Under this menu there are three different sub menus to display the
data report for population, area, and housing information from the geodatabase. When
you click any of the report a form will be loaded and it allows you to enter the available
year to be displayed from the database in a dropdown box. Select the year and click on
“Generate Report” button to view the report. After clicking on the “Generate Report”
button ignore “Database Login” form by clicking on “Cancel” button. It may take a few
seconds time to display the report.
49
Help: Under this menu, there are two sub menus namely “Technical
Documentation” and “User Manual”. By clicking on the appropriate sub menus the
documentation will be displayed.
Exit: This menu closes the application.
A Note on the usage of Reports and Graphs:
Read the Labels for the function of the particular icon on the report.
50