1
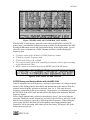
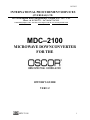
10/22/03
INTERNATIONAL PROCUREMENT SERVICES
(OVERSEAS) LTD
163-169 Brompton Road, Knightsbridge, London, SW3 1PY, U.K.
Phone +44 20 7258 3771 Fax +44 20 7724 7925
e-mail [email protected] web sites: www.intpro.co.uk & www.securitysearch.co.uk
MDC–2100
MICROWAVE DOWNCONVERTER
FOR THE
OWNER’S GUIDE
VER 1.2
MDC-2100
1
10/22/03
Table of Contents
TABLE OF CONTENTS ............................................................................................................................ 2
TABLE OF FIGURES ................................................................................................................................. 2
INTRODUCTION ........................................................................................................................................ 3
INSTALLING THE MDC-2100.................................................................................................................. 4
OSCOR OPERATIONAL CONTROL OF THE MDC-2100 .................................................................. 5
OSCOR SWEEP AND ANALYZE MODES WITH THE MDC-2100 .................................................................. 6
SPECIAL CONSIDERATIONS FOR STORING A SWEEP SPAN WITH THE MDC ................................................. 8
STORING A SIGNAL IN THE MDC FREQUENCY RANGE ............................................................................... 9
MICROWAVE TRANSMISSION CONSIDERATIONS WHEN UTILIZING THE MDC-2100 ................................. 10
USING THE MTU-2100 MICROWAVE TEST UNIT........................................................................... 11
MDC-2100 SPECIFICATIONS ................................................................................................................ 13
Table of FIGURES
FIGURE 1 MDC-2100 MICROWAVE DOWNCONVERTER ....................................................................... 3
FIGURE 2 ILLUSTRATION OF THE MDC-2100 DOWNCONVERSION PROCESS ................................ 3
FIGURE 3 MDC-2100 OPERATIONAL FREQUENCY BANDS .................................................................. 4
FIGURE 4 INSTALLATION OF THE OEP .................................................................................................... 5
FIGURE 5 SWEEP SPAN LIST WITH MDC INSTALLED........................................................................... 6
FIGURE 6 ANALYZING AN MDC SIGNAL................................................................................................. 6
FIGURE 7 SELECTING A SIGNAL WITH THE MDC ................................................................................. 8
FIGURE 8 SELECTING THE PROPER MDC BAND AND FILTER............................................................ 8
FIGURE 9 EXAMPLES OF STORING SPANS .............................................................................................. 9
FIGURE 10 ANALYZE MODE USING THE MDC ..................................................................................... 10
FIGURE 11 PROPER MTU ORIENTATION FOR TESTING BAND 1 (3-9GHZ) ..................................... 12
FIGURE 12 PROPER MTU ORIENTATION FOR TESTING BAND 2&3 (9-21GHZ) .............................. 12
MDC-2100
2
10/22/03
Introduction
The OSCOR Microwave Downconverter option (MDC-2100) expands the OSCOR’s
frequency range limit to 21GHz. Microwave signals tend to be directional, therefore the
MDC-2100 features an array of high gain directional antennas. The MDC-2100 is
compatible with the OPC interface and the OTL locator options. It can function in the
sweep, analyze and correlation modes and includes a tripod, which provides the stability
needed to securely point the downconverter antennas and a swivel neck for easy
positioning.
Figure 1 MDC-2100 MICROWAVE DOWNCONVERTER
Since the range of frequencies at this level is so broad, it would take an excessive amount
of time to view the entire spectrum, therefore, a special folding process is implemented to
increase the scanning speed. This process folds the spectrum from 3-21GHz into a
1.5GHz window. While this process may seem confusing, it greatly facilitates the ability
to cover a broad frequency range in a timely process and maintain the ability to
accurately determine the frequency of the transmitted signal. Figure 22 below illustrates
the down-conversion process.
3
6
4.5
9
7.5
12
10.5
15
13.5
18
16.5
21
19.5
0 1.5
All Numbers
in GHz .
Antennas
3-9
9-15
15-21
Figure 2 ILLUSTRATION OF THE MDC-2100 DOWNCONVERSION PROCESS
MDC-2100
3
10/22/03
When the range 3-21 GHz is selected, all twelve 1.5 GHz windows display
simultaneously, using all three antennae. Each of the three antenna frequency bands (3-9
GHz, 9-15 GHz, or 15-21 GHz) may be displayed separately, showing four 1.5 GHz
MHz windows folded simultaneously. Using the built-in microwave filters can reduce the
display to two folded windows. These filters are referred to as Filter A and Filter B.
Below is a chart representing the display of the frequencies in response to the selected
antenna and microwave filter. Understanding FIGURE 3 is critical to understanding the
OSCOR operations using the MDC-2100.
Note: The OSCOR display always shows the various 1.5GHz windows super-imposed on
each other.
ANTENNA
BAND
3 – 9 GHz
9 – 15 GHz
15 – 21 GHz
Filter A
Filter B
4.5 - 6
6 - 7.5
10.5 - 12
12 - 13.5
16.5 - 18
18 - 19.5
3 - 4.5
7.5 - 9
9 - 10.5
13.5 - 15
15 - 16.5
19.5 - 21
Filter A & B
4.5 - 6
6 - 7.5
10.5 - 12
12 - 13.5
16.5 - 18
18 - 19.5
3 - 4.5
7.5 - 9
9 - 10.5
13.5 - 15
15 - 16.5
19.5 - 21
Figure 3 MDC-2100 OPERATIONAL FREQUENCY BANDS
Installing the MDC-2100
In order to use the MDC-2100 with the OSCOR, a special connector (the OEP-2100)
must be installed in the connector tray of the OSCOR. This connector should be installed
permanently into the connector tray and provides for easy connection of the MDC-2100
while not affecting the OSCOR normal operation. Note the step numbers on the figure
below to assist in the installation.
To install the OEP-2100 connector for use with the MDC-2100:
1. Remove the OEP connector from the MDC packaging and insert the male mini-din
connector into the expansion port of the OSCOR as shown in the figure. (It may be
necessary to unplug the two tape recorder cables labeled REMOTE OUT
RECORDER).
2. Insert the black metal support into the connector tray. (The cables that provide
connection to the tape recorder controls must be placed under the black metal
support.)
3. Use the provided hex wrench (Alan wrench) to tighten the two hex screws into place.
(This is what holds the OEP into position.)
4. Unplug the UF/UHF BNC connector and plug it into the OEP at the properly labeled
jack.
5. Plug the OEP BNC cable into the OSCOR HF/UHF input.
MDC-2100
4
10/22/03
To install the MDC-2100:
1. Plug the MDC BNC connector into OEP BNC jack.
2. Plug MDC mini-din connector into the jack labeled MDC POWER/CTRL.
3. Utilize the OSCOR keypad for function control of the MDC-2100.
2
3
3
4
5
Figure 4 INSTALLATION OF THE
1 OEP
The MDC-2100 can be used in a stationary position sitting on the provided tri-pod or it
can be moved around the environment to provide a thorough sweep of the area. An
extension cable is provided to move the MDC-2100 away from the OSCOR. There is
minimal signal loss from using this cable because of the pre-amplification and downconversion process of the MDC-2100.
OSCOR Operational Control of the MDC-2100
Operational control of the MDC-2100 is provided by the OSCOR keypad using
the normal OSCOR functional control. For example, in the OSCOR SWEEP or
ANALYZE modes, pressing the F1 button will toggle through all of the OSCOR
inputs including the MDC-2100 frequency bands. Further more, in the SWEEP
mode, pressing the RECALL button will display the OSCOR available inputs
including the MDC inputs. Some of the other normal OSCOR functions that are
impacted by the MDC-2100 are described below.
MDC-2100
5
10/22/03
Figure 5 SWEEP SPAN LIST WITH MDC INSTALLED
With the MDC-2100 frequency spans selected in either the SWEEP or ANALYZE
modes, there is an additional configuration menu available for the operation of the MDC.
Pressing the F4 button accesses this configuration menu. In this display mode, you can
select the various combinations of MDC antennas and filters without changing the
frequency span.
•
•
•
•
•
F1 always returns to the All band (3-21GHz) frequency window.
F2 Selects a specific Frequency band.
F3 Selects the Filter (A, B, or A&B).
F4 is used to identify which of the remaining two frequency choices after narrowing
to one Band and one Filter.
MENU returns to the normal menu for the SWEEP and ANALYZE modes.
Figure 6 ANALYZING AN MDC SIGNAL
OSCOR Sweep and Analyze Modes with the MDC-2100
In the Sweep mode, the cursor frequency is no longer representative of a single frequency
because of the folding principle described in the introduction of this manual. Therefore,
when the entire frequency spectrum is displayed from 3 to 21 GHz, only the local
frequency is displayed for the cursor frequency. In this display, it is important to note that
the OSCOR is in the MDC mode and not confuse this display with the normal Whip/Hi
frequency display.
When a single antenna band is selected as described by figure 3, the cursor frequency
represents 4 different possible frequencies, and when a specific filter is selected (A or B)
then the cursor frequency represents 2 different possible frequencies. When rolling the
cursor rotary dial back and forth, half of the numbers representing potential signal
frequencies will be increasing while others will be decreasing. This again is due to the
down-conversion process.
MDC-2100
6
10/22/03
Often, signals will have an odd shape due to the downconversion. In Figure 8, a signal is
selected using the OSCOR NARROW button and the OSCOR rotary dial. This signal has
a rather strange shape because of the folding process of the down-conversion, but it
provides an excellent indicator for the proper signal downconversion. Hence, by pressing
the F4 “MDC Anlz” button to further analyze the signal, it is possible to analyze which
antenna and filter that is actually receiving the signal. Figure 8 shows the proper antenna
selected and the proper filter selected which corrects the signal shape. Furthermore, the
unusual signal shape of Figure 7 indicates that this signal should be a Filter B signal.
From the sweep mode, it is impossible to tell the exact frequency of the transmitted
signal.
To identify the correct frequency of a signal, follow these steps:
1. Place the cursor over the desired signal.
2. Change to Analyze mode.
3. Press F4 “MDC Anlz” and narrow to the MDC choices to a single antenna (F2) and
a single filter (F3). The label “Identify” appears over F4.
4. Verify the cursor is still locked on the desired signal. Press F4 “Identify”. The
waveform will move left or right. The actual frequency of the signal is displayed
above the spectrum, under the corresponding “Move Left” and “Move Right” labels.
Figure 7 USING “IDENTIFY” TO VERIFY A SIGNAL
In looking at the frequency span limits, these limits are always between 0 and 3GHz. This
is because the OSCOR is a spectrum analyzer that covers the frequency range up to
3GHz, but the input frequencies of the down-converter cover 3 to 21 GHz. Therefore, the
cursor frequencies provide the possible signal frequencies while the span numbers
(indicated at the top right and left of the display) provide the frequency span the OSCOR
is actually viewing after the down-conversion process.
MDC-2100
7
10/22/03
Technical Note: It is possible to have a very slight shift in frequency in the downconversion process. In the example below, the signal shifted by about 50KHz. This is
minimal shift considering the signal is at 10GHz.
Figure 8 SELECTING A SIGNAL WITH THE MDC
Figure 9 SELECTING THE PROPER MDC BAND AND FILTER
Special Considerations for Storing a Sweep Span with the MDC
Since the MDC down-conversion process displays multiple frequency bands at
once, the easiest way to quickly view a specific frequency span is to type in a
desired center frequency span and then use the EXPAND and NARROW keys to
adjust the frequency span.
To store a specific frequency span:
1. Ensure that the OSCOR is in the SWEEP mode and the MDC is connected.
MDC-2100
8
10/22/03
2. Type in the desired center frequency between 3 and 21 GHz.
3. Adjust the frequency span using the EXPAND and NARROW keys. (The span is
noted by the number in the top left corner of the OSCOR display.)
4. Press the STORE button.
5. To review the stored spans, simply press the RECALL button from the SWEEP
mode.
There are some important aspects of storing spans that should be understood:
• If you store a specific frequency band in the MDC range (for example 5.6 to
5.8 GHz), the MDC will also simultaneously search a parallel frequency band
(in the example it will also search from 6.2 to 6.4 GHz).
• You cannot store frequency spans that cross the 1.5 GHz cross-over points. See
FIGURES 2 and 3 for the 1.5GHz bands. Therefore, to search specifically from
4 to 6 GHz as an example, you may choose to search the 3 to 9 GHz antenna
band with the Group A filter to cover the range from 4.5 to 6 GHz (See Figure
3). And then, store a range centered at 4.25 GHz with a 500 MHz span to cover
from 4 to 4.5 GHz. However, the fastest and simplest method would be to
simply cover the entire span from 3 to 9 GHz with both Group A & B filters
selected.
• When storing a span in memory, the actual frequency limits are not displayed
in the frequency span list as shown in FIGURE 5. However, pressing the
RECALL button will recall the span showing the stored frequency span.
• To summarize these effects:
If you desire to cover a frequency span that is greater than 1.5GHz or
crosses the antenna bands, the best approach is always to cover the entire
antenna band that includes the desired frequency span. The table below
provides some examples and recommended search span for speed and
accuracy.
Example of a Desired
Recommended
Frequency Span
Implementation:
4 – 6 GHz
3 – 9 GHz
6 – 8 GHz
3 – 9 GHz
5.7 – 5.9 GHz
5.7 – 5.9 GHz
8 – 10 GHz
3 – 21 GHz
13 – 16 GHz
3 – 21 GHz
Figure 10 EXAMPLES OF STORING SPANS
Storing a Signal in the MDC Frequency Range
When a signal is stored in the OSCOR signal database, only the signal frequency is stored
in OSCOR memory. However, when the OSCOR tunes to a specific signal in the MDC
frequency band (3-21GHz) then the OSCOR automatically directs the MDC to the proper
MDC-2100
9
10/22/03
antenna band and filter group to maximize the signal to noise ratio and maximize the
system performance. An example signal is shown below FIGURE 11.
Figure 11 ANALYZE MODE USING THE MDC
Microwave Transmission Considerations when Utilizing the MDC-2100
There are important principles and considerations to understand when dealing with very
high frequency radiators.
· As the frequency increases, the penetration of the RF signal through building
materials decreases rapidly. Therefore, most high frequency microwave signals are
often considered to be a line-of-sight communication link. If you locate a microwave
surveillance device, the receiving station will be in the direction of the transmission
antenna.
· Also, as frequency increases, the size of the antenna used for transmission also
decreases. Therefore, in order to penetrate through building materials and to transmit
long distances, microwave transmissions are usually done using high-gain directional
antennas.
· Reflections from metal structures in a building can greatly complicate the location
and detection process. Furthermore, these reflections tend to de-polarize the
transmitted signals rather quickly. The MDC-2100 antennas are linearly polarized,
and there is some concern that the polarization effect of the MDC-2100 antennas
could cause the user to overlook a transmitter due to an incorrect polarization effect.
However, our experience and testing indicate that this is not a problem because of the
reflective nature of the metal structures in a normal building environment.
Because of the principles above, it is important to understand that to properly use the
MDC-2100, it is necessary to point the MDC-2100 in all directions of possible concern. It
is advisable to move the MDC-2100 to different locations in the room. It has been
suggested that because of the microwave reflections, it may be possible to completely
cover a room by pointing the MDC-2100 directly at the ceiling. The concept is that due to
the metal in most ceiling structures, there would be enough reflective effect to detect a
MDC-2100
10
10/22/03
transmitter from any location in the room. This method has some merits, but it is
impossible to predict how reliable that it would be in all situations. Therefore, this
method should only be used when it is absolutely necessary in order to save time. A good
rule of thumb is to assume that the MDC-2100 has an antenna pattern that is about 100
degrees wide. In other words, it is necessary to point the MDC-2100 in at least 4 different
directions around the room to cover the perimeter. Also, the MDC-2100 should be
pointed up and possibly moved around the room to cover the ceiling, and down to cover
the floor. Furthermore, if you expect a very sophisticated threat, it is recommended to
point the MDC-2100 into duct work, above ceiling tiles, and in any enclosed spaces in
which it would be possible to place a transmitter with a high gain antenna. At each
position that the MDC-2100 is placed, it is necessary to allow the OSCOR time to sweep
the entire frequency spectrum from 3 to 21GHz. For this case, it is highly recommended
that the “All Pass” mode of operation for the MDC-2100 be utilized. When a signal is
detected, the user can then manually select the different antenna bands and filters to
further investigate the signal. Or, the user can simply go to the analyze mode and allow
the MDC-2100 to determine the operational frequency of the transmitter. Also, it is not
recommended to use the MDC-2100 with the OSCOR automatic mode unless the MDC2100 directional characteristics are taken into consideration. Also when running the
OSCOR and MDC in the automatic mode, it is recommended to search the entire
frequency span with both A&B filter selected as previously described.
Using the MTU-2100 Microwave Test Unit
The MTU-2100 is designed to provide a simple test to verify that the MDC is working
properly. When the button is pressed on the MTU, low power microwave signals are
generated at 3 different frequencies for 3 minutes. The frequency of these signals is
labeled on the MTU. Each transmitted signal contains a modulated tone between 900Hz
and 1KHzfor audio identification. It is important to note that the frequency transmissions
from the MTU may drift slightly. It should also be noted that the MTU test transmitter
and the MDC down-converter both have polarized antennas. When using the MDC in a
room environment, the polarization is often not of great concern because of the
depolarizing effect that occurs from reflections from the room structure. However, when
verifying proper operation of the MDC using the MTU at a close proximity, the
polarization of the antennas is important. To achieve the proper polarization with the high
gain antennas of the MDC, the following positioning should be utilized.
1. 3 – 9 GHz band: MTU and MDC should be both horizontally oriented.
2. 9 – 15 GHz band: MTU and MDC should be perpendicularly oriented.
3. 15 –21 GHz band: MTU and MDC should be perpendicularly oriented.
MDC-2100
11
10/22/03
Figure 12 PROPER MTU ORIENTATION FOR TESTING BAND 1 (3-9GHZ)
Figure 13 PROPER MTU ORIENTATION FOR TESTING BAND 2&3 (9-21GHZ)
Since the MDC-2100 is a very sensitive receiving device, it is very possible for the
MDC-2100 to detect sub-harmonics from the MTU. In other words, when using the
MTU, additional signals may appear at frequencies other than the main transmitted. The
best way to determine if a signal is being radiated from the MTU is to move the MTU
away from the MDC and see if the signal disappears or go the analyze mode in the
OSCOR and listen for the modulated tone from the MTU. All signals from the MTU will
contain the modulated tone.
To use the MTU with the MDC:
1. Connect the MDC to the OSCOR.
2. Switch the OSCOR to the 3-21 GHz frequency range.
3. Press the F4 button to change to the MDC Anlz mode.
4. Press the F2 button to change to the 3-9 GHz frequency range.
5. Place the MTU in front of the MDC. DO NOT place the MTU closer than 3’ from the
MDC. (Remember to orient the MTU properly for the frequency you are testing.)
6. Press the power button on the MTU . The LED will light up when the MTU is active.
7. A signal will be generated in each frequency range.(3-9GHz,9-15 GHz,15-21 GHz),
and should be visible on the OSCOR display. Exactly where each frequency will be
generated is noted on the MTU label.
8. If you switch to the analyze mode and center the frequency, a tone should be heard.
9. Press the F2 button to change the frequency range and verify the presence of a signal
generated by the MTU.
10. The MTU will generate signals for approximately 3 (three) minutes after the power
button is pressed. Press the button again to reactivate if further testing is needed.
MDC-2100
12
10/22/03
MDC-2100 Specifications
Frequency Range: 3-21GHz
Conversion output: 5MHz to 3005MHz
Frequency Bands of Operation:
Band 1: 3-9GHz
Band 2: 9-15GHz
Band 3: 15-21GHz
All Band: 3-21GHz
Antenna Gain:
Band 1: 10 dB
Band 2: 9 dB
Band 3: 9 dB
MDS - Minimum Detectable Signal including receiver sensitivity, antenna gain, and
filtering losses:
Band 1: -110 dBm
Band 2: -110 dBm
Band 3: -110 dBm
Input Power: 300 milliamps at 12 volts
Weight: 1.1 lb (.5 Kg)
Dim: 11.4in (29cm) x 3.1in (8cm) x 1.4in (3.5cm)
Tripod:
Weight: .77lb (.35 Kg)
Dim: 8.75in (22.2cm) x 2.5in (6.4) x 1.5in (3.8cm)
Usage Height: 5.5in (14cm)
Case Dimensions:
Size (HxWxD): 6.25 x 18.5 x 14.5 in (47 x 36.8 x 15.9 cm)
MDC-2100
13
UPDATE TO MDC-2100 USER’S MANUAL
The newest revisions of the OSCOR key now allow for the exact identification of
signal locations with the MDC-2100. OSCOR keys release 40010 and higher are
needed for this functionality.
To identify the correct frequency of a signal, follow these steps:
1. Place the cursor over the desired signal.
2. Change to Analyze mode.
3. Press F4 “MDC Anlz” and narrow to the MDC choices to a single antenna (F2) and a single filter
(F3). The label “Identify” appears over F4.
4. Verify the cursor is still locked on the desired signal. Press F4 “Identify”. The waveform will move left
or right. The actual frequency of the signal is displayed above the spectrum, under the corresponding
“Move Left” and “Move Right” labels
Figure 1 USING “IDENTIFY” TO VERIFY A SIGNAL
In the example above the signal location is at 10.02GHz.