1
GEOCHAKT
FOR USE WITH GEOS™ and GEOS 128™
For Commodore 64 and 128 Computers
n Berkeley
Softworks
geoChart User's Manual Erratum
For Commodore 128 Users
geoChart will operate under GEOS 128 as well as versions of GEOS that
run in 64 mode. If you use GEOS 128, switch to 40-column mode before
opening geoChart. geoChart will not operate in 80-column mode.
You can select 40-column mode by using the following procedure:
1:
On the deskTop, select switch 40/80 from the geos menu.
2:
When the screen goes dark, press the RGB button or the composite
switch on your monitor as follows:
•
If you have an RGB button, press this button so that it is in CVBS
mode.
•
If you have a composite switch, press this switch so that it is in
COMPmode.
After you press the RGB button or the composite switch, the screen
will appear in 40-column mode.
Part No.: 14-0303-0111
GEOCHART
User's Manual
Berkeley Softworks
2150 Shattuck Ave.
Berkeley, CA 94704
Important: Read This Notice Before
Using This Software
BY READING THIS NOTICE AND USING THE ENCLOSED
SOFTWARE, YOU AGREE TO BE BOUND BY ALL THE TERMS
AND CONDITIONS OF THIS LICENSE AGREEMENT. IF YOU DO
NOT ACCEPT OR AGREE TO THESE TERMS, YOU MAY,
WITHIN FIFTEEN (15) DAYS, RETURN THIS ENTIRE PACKAGE,
TOGETHER WITH PROOF OF PURCHASE, TO THE PERSON
FROM WHOM YOU ACQUIRED IT OR TO BERKELEY SOFTWORKS, INC. FOR A FULL REFUND.
Software License Agreement
BERKELEY SOFTWORKS, INC. grants you a non-exclusive license to
use this copy of the program and accompanying materials according to the
following terms:
License
You may:
a.
b.
use the program on only one computer at a time;
make copies of the program in machine-readable form solely as
necessary for your personal use, provided that you reproduce all
proprietary notices on the copy; and
c.
transfer this license to another, together with all documentation and
copies of the software, but only if: (i) the transferee agrees in writing to
be bound by this software license agreement and (ii) you notify
BERKELEY SOFTWORKS, INC. of the transfer, together with the
transferee's name and address, and provide to BERKELEY SOFTWORKS, INC. the written and signed agreement of the transferee to be
bound by this license which reads: "I have read the BERKELEY
SOFTWORKS, INC. Software License Agreement and agree to be
bound by the terms thereof."
You may not:
a.
use the program in a network or a multi-user system;
b.
modify, translate, reverse engineer, decompile, disassemble, create
derivative works based on, make copies of the documentation, or copy
(except as necessary for your personal use) the program or the accom
panying materials;
c.
rent, transfer or grant any rights in the program or accompanying
materials in any form to any person, except as specifically permitted in
this agreement, without the prior written consent of BERKELEY
SOFTWORKS, INC., which, if given, is subject to transferee's consent
to the terms and conditions of this license, or
d.
remove any proprietary notices, labels, or marks on the program and
accompanying materials.
This license is not a sale. Tide and copyrights to the program, accompany
ing materials and any copy made by you, remain with BERKELEY
SOFTWORKS, INC.
Termination
Unauthorized copying of the program (alone or merged with other software)
or the accompanying materials, or failure to comply with the above restric
tions, will result in automatic termination of this license and will make
available to BERKELEY SOFTWORKS, INC. other legal remedies. Upon
termination, you will destroy or return to BERKELEY SOFTWORKS,
INC. the program, accompanying materials, and any copies.
Limited Warranty and Disclaimer
BERKELEY SOFTWORKS, INC. has no control over your use of the
software, nor can BERKELEY SOFTWORKS, INC., anticipate every
potential or possible use. Therefore, BERKELEY SOFTWORKS, INC.
does not and cannot warrant the performance or result that may be obtained
by its use, nor do we warrant that the operation of the program will be
uninterrupted or error-free. Therefore, BERKELEY SOFTWORKS, INC.
provides a limited warranty to you as follows:
BERKELEY SOFTWORKS, INC. warrants that the software will perform
substantially in accordance with the specifications set forth in the documen
tation provided with the software and that the diskettes on which the
program is furnished are free from defects in materials and workmanship
under normal use for a period of ninety (90) days from the date of delivery
to you, as evidenced by a copy of your receipt.
BERKELEY SOFTWORKS, ING's entire liability and your exclusive
remedy as to software performance and the diskettes (which is subject to
your returning the diskettes to BERKELEY SOFTWORKS, INC. or an
authorized dealer with a copy of your receipt) will be the replacement of the
diskettes or, if BERKELEY SOFTWORKS, INC. or the dealer is unable to
deliver a replacement diskette, the refund of the purchase price and termina
tion of this agreement. THE DURATION OF ANY IMPLIED WARRAN
TIES ON THE DISKETTES, INCLUDING THE IMPLIED WARRAN
TIES OF MERCHANTABILITY AND FITNESS FOR A PARTICULAR
PURPOSE, IS LIMITED TO THE SAME NINETY (90) DAY PERIOD
AS THE FOREGOING EXPRESS WARRANTY.
THE PROGRAM AND ACCOMPANYING MATERIALS ARE PRO
VIDED WITHOUT WARRANTY OF ANY KIND, EITHER EXPRESS
OR IMPLIED, OR STATUTORY, INCLUDING (BUT NOT LIMITED
TO) THE IMPLIED WARRANTIES OF MERCHANTABILITY AND
FITNESS FOR A PARTICULAR PURPOSE.
SOME STATES DO NOT ALLOW THE EXCLUSION OF IMPLIED
WARRANTIES SO THE ABOVE EXCLUSIONS MAY NOT APPLY TO
YOU. THIS WARRANTY GIVES YOU SPECIFIC LEGAL RIGHTS.
YOU MAY ALSO HAVE OTHER RIGHTS WHICH VARY FROM
STATE TO STATE.
Limitation ofLiability
IN NO EVENT WILL BERKELEY SOFTWORKS, INC. BE LIABLE
FOR ANY DAMAGES, INCLUDING LOSS OF DATA, LOST PROFITS,
COST OF COVER OR OTHER SPECIAL, INCIDENTAL, CONSE
QUENTIAL OR INDIRECT DAMAGES ARISING FROM THE USE OF
THE PROGRAM OR ACCOMPANYING MATERIALS, HOWEVER
CAUSED AND ON ANY THEORY OF LIABILITY. THIS LIMITA
TION WILL APPLY EVEN IF BERKELEY SOFTWORKS, INC. OR AN
AUTHORIZED DEALER HAS BEEN ADVISED OF THE POSSIBILITY
OF SUCH DAMAGE. YOU ACKNOWLEDGE THAT THE LICENSE
FEE REFLECTS THIS ALLOCATION OF RISK. SOME STATES DO
NOT ALLOW THE LIMTTATION OR EXCLUSION OF LIABILITY
FOR INCIDENTAL OR CONSEQUENTIAL DAMAGES, SO THE
ABOVE LIMITATION MAY NOT APPLY TO YOU.
General
This Agreement will be governed by the laws of the State of California.
This Agreement is the entire agreement between us and supersedes any
other communications with respect to the program and accompanying
materials.
If any provision of this Agreement is held unenforceable, the remainder of
this Agreement shall continue in full force and effect
If you have any questions, please contact us, in writing, at the following
address:
BERKELEY SOFTWORKS, INC.
Customer Service
2150 Shattuck Avenue
Berkeley, CA 94704
If you wish to return defective disks for replacement under this warranty,
send the defective disks and a copy of your purchase receipt to the address
above.
Sign and Mail the Registration Card Today
Return of the Registration Card is required to receive notices of new
versions or enhancements.
Copyright Information
geoChart software design by Anna Lijphart and Jim DeFrisco.
geoChart User's Manual by Patricia Huey, © Copyright Berkeley Softworks, Inc. 1988.
Printed 10/88
Commodore 64 ® is a registered trademark and Commodore 128 is a
trademark of Commodore Electronics, Ltd.
geoChart, geoCalc, geoCalc 128, geoWrite, geoFile, geoFile 128, Note Pad
Desk Accessory, GEOS, GEOS 128, GEOS 2.0, and geoPublish are
trademarks of Berkeley Softworks, Inc.
How to Get Help
If you ever encounter any problems with geoChart, there are several steps
you should take before trying to contact Customer Service. First, re-read
the pertinent chapter(s) in the manual. With a graphic interface it is often
tempting to ignore the manual and forge ahead with using the program.
However, if the program does not perform in a manner you expect, reading
the manual may help clarify any confusion. If the chapter does not answer
your question directly, try looking in the appendices, table of contents, or
index for help.
Should you come across any unfamiliar terms, refer to the
glossary on page 94.
QuantumLink
The first, fastest, and recommended way to obtain information about and
help with GEOS and its follow-on applications is through the Q-Link
telecommunications network. Q-Link is an on-line service network
designed for Commodore users.
Berkeley Softwoiks provides Customer Service message boards, along with
a Programming message board and other useful services, in the Commodore
Software Showcase section of Q-Link. Through these message boards, you
can receive the most timely help and information from Berkeley Softworks
employees and thousands of GEOS users. In addition, you will have access
to programs and products from Berkeley Softworks that are offered through
Q-Link, many of them free of charge.
Customer Service
The second way to obtain help is to contact Customer Service at Berkeley
Softworks, either by phone or letter. If you write, please include your
telephone number. All inquiries are answered in order received. The
Berkeley Softwoiks customer service telephone number and address are as
follows:
Call:
Customer Service: (415) 644-0890,9 a.m.-5 p.m. Pacific Time
Or write:
Berkeley Softworks
Commodore Customer Service Division
2150 Shattuck Avenue
Berkeley, CA 94704
Welcome to geoChart
geoChart enables you to expand the usefulness of the geoCalc, geoWrite,
geoFile, and the Note Pad desk accessory. With geoChart, you can translate
a set of values from these four sources into a chart format.
This manual is divided into eight chapters:
1.
2.
Getting Started describes how to install geoChart to your System disk.
Learning geoChart gives an overview of how geoChart works. A
tutorial is included in this chapter.
3.
Preparing a Text Scrap describes how to create charting information
in geoCalc, geoWrite, geoFile, or the Note Pad desk accessory. The
Note Pad, which is included on your geoChart program disk, has been
upgraded to enable you to create text scraps for use with geoChart.
Once you have prepared the charting data in the correct manner, you
can copy it to a geoChart document.
4.
Opening geoChart explains how prepare work disks for geoChart and
how to create or open a geoChart document.
5.
Importing Data describes what happens when you first open geoChart
and how to use Data Mode to import sections of a text scrap.
6.
Formatting Charts describes the many ways you can alter the appear
ance of a chart once you have imported a text scrap.
7.
File Management explains basic file management procedures: copying
a chart to another document, ways to save or reverse changes, printing
a geoChart document, and exiting geoChart.
8.
Appendices contains a glossary, a summary of geoChart's menu
options, illustrations of the various chart types, and a listing of error
messages. Also included are instructions for using the GEOS demon
stration program found on Side 2 of the geoChart program disk.
Suggested Order ofReading
Before you try to use geoChart, we suggest you use the chapters in this
manual in the following manner:
Chapter 1, "Getting Started"
to see what hardware and software you
need in order to use geoChart, and to
install and make backup copies of the
geoChart program disk. Before you can
use geoChart, you must install it to your
System disk.
Chapter 2, "Learning geoChart"
to get an overall idea on how geoChart
works. It is most important that you
read "How geoChart Works" before you
attempt to use geoChart. A tutorial is
provided in Chapter 2 so that you can
get some hands-on experience with
geoChart.
Once you have completed Chapters 1 and 2, you will be ready to use the
instructions in remaining chapters to create your own charts. You may
also wish to try out the GEOS demonstration program on Side 2 of the
geoChart program disk. The instructions for using this demo are found in
Appendix E: Demo Program. Enjoy!
Table of Contents
1
Getting Started
1
What You Need to Run geoChart 2
Installing geoChart
2
3
Learning geoChart
How geoChart Works
The Tutorial
3
7
8
14
Preparing a Text Scrap
25
What Goes in a Text Scrap? 26
Gearing the Data in geoCalc
30
Creating the Data in geoWrite
Creating the Data in geoFile
32
34
Creating the Data in the Note Pad Desk Accessory 37
4
Opening geoChart 41
Before You Try to Use geoChart 42
General Steps to Create a geoChart Document 45
Entering geoChart 47
5
Importing Data
51
Once You Open geoChart
Entering Data Mode
52
54
What the Data Mode Grid Does
56
Selecting Data with the Data Mode Grid 61
6
Formatting Charts
Selecting a Chart Type
65
66
Editing Text 71
Changing the Patterns of Markers
75
Changing Drawing Modes in Area Charts
77
Changing the Axis Range 79
Changing Number Formats
81
Changing the Background Grid 83
7
File Management 85
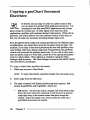
Copying a geoChart Document Elsewhere
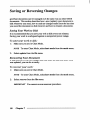
Saving or Reversing Changes
Renaming Your Document
88
89
Printing Your Document 90
Exiting geoChart 91
8
Appendices
93
Appendix A: Glossary
94
Appendix B: Menu Listing
98
Appendix C: Chart Samples
Appendix D: Error Messages
Appendix E: Demo Program
Index
113
100
106
111
86
Getting Started
Welcome to geoChart! Use the procedures in this chapter to get started
with geoChart This chapter describes the basic equipment you need to run
geoChart and how to install geoChart to your System disk. Also included is
a brief description of work disks.
Unfamiliar terms are defined in Appendix A: Glossary (page 94).
geoChart's command menu options are summarized in Appendix B: Menu
Listing (page 98). Error messages are explained in Appendix D: Error
Messages (page 106).
Getting Started
What You Need to Run geoChart
Required Equipment
•
a Commodore 64 or 64c computer, or a Commodore 128 or 128D
computer (running in 64 mode).
a compatible monitor or TV. The best monitor to use is a Commodore
1084,1702,1802,1902, or 1902A monitor. A television set can be
used, but the resolution is higher with a Commodore monitor.
•
an input device (joystick, mouse, Koala Pad, or Inkwell light pen),
one 5 1/4 inch disk drive (1541 or 1571).
•
blank 5 1/4 inch diskettes (for backup and work disks).
this product package, which contains one program disk and the geo
Chart User's Manual.
•
any version of GEOS that operates in 64 mode (1.2,1.3, and 2.0).
Optional Equipment
any version of geoCalc, geoWrite, or geoFile.
•
a RAM Expansion Unit (REU). With an REU, the operating speed of
geoChart is greatly increased. In addition, you will be able to dedicate
more disk space to geoChart and any other GEOS program you are
using.
•
additional disk drives (1541,1571, and, if you are using GEOS 2.0, a
1581).
•
a GEOS supported printer. Refer to your GEOS User's Manual or
GEOS 2.0 User's Manual for how to set up a printer for use with GEOS
and for a list of supported printers.
2
Chapter 1
Installing geoChart
Installing geoChart means "linking" it to your System disk. Once geoChart
is linked to your System disk, you will be able to open geoChart after
booting from your System disk.
You will need to install geoChart only once. The installation procedure
takes only a few minutes. After you install geoChart, you should copy it to
a backup disk. Also copy geoChart to work disks for day to day use.
Stepl: BootGEOS
In order to install and use geoChart, you will need to boot GEOS in 64
mode if you are using a Commodore 128 or 128D. It is recommended that
you use the same boot disk you used to install your other GEOS applica
tions.
To boot GEOS:
1:
Set up your Commodore, disk drive(s), monitor, and input device
according to the directions found in their instruction manuals. If you
are using a RAM Expansion Unit, carefully insert it into the proper slot
of your Commodore, as explained in the REU's instruction guide.
2:
Turn on the monitor and disk drive switches.
NOTE Never boot GEOS with more than one disk drive turned on.
Doing so will prevent GEOS from properly booting.
3:
Insert the System disk flabel side up) into the disk drive and close the
disk drive door.
4:
64 and 64c users: turn on your computer keyboard.
128 and 128D users: hold down the 03 key and turn on your com
puter keyboard.
5:
The Commodore 64 BASIC V2 screen will appear. Type
LOAD"GEOS",8,1 and press IRETURNI. The System deskTop will
appear shortly.
^
Getting Started
^
NOTE
If you are using a Parallel Printer Interface (PPI), enter the
following command to load GEOS:
OPEN4,25:PRINT#4:CLOSE#4:LOAD"GEOS",8,1. Press IRETURNI.
The System deskTop will appear shortly.
Step 2: Install geoChart
After you have booted GEOS, the System deskTop will appear. Now you
are ready to install geoChart to your System disk. You will not need to
install the Note Pad desk accessory, which is also supplied on your geoChart
program disk.
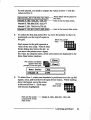
To install geoChart:
1:
2:
Close the System disk by clicking on its close
icon (or pressing [g \C\). The disk note pad will
ajck hem fQ
go blank and a question mark will appear in the
close the
disk drive icon representing the disk drive.
System disk.
Remove the System disk from the disk drive and insert the geoChart
program disk.
I
3:
1
1
Click here
Click on the disk drive icon at the right side of
the screen to activate the geoChart program disk,
drive a
The geoChart disk note pad will appear as follows:
[——-
2 files,
8~ selected
Ui
CEOCHfiRT
—■
geoChart
SI
6 5 Kbytes used
101 Kbytes free
n
1
the geoChart file icon
4:
(This deskTop is version 2.0.)
Open geoChart by double-clicking on its file icon.
NOTE An alternative is to click once on the geoChart file icon to
highlight it, then select open from the file menu.
4
Chapter 1
**
':w
5:
After you open geoChart for the first time, it will become installed to
the System disk you used to boot GEOS with in Step 1, "Boot GEOS."
A dialog box saying "geoChart installed" will appear. Click OK to
return to the deskTop.
NOTE If you copy geoChart to a work disk before installing it and try
to open geoChart from that disk, an error message saying "Cannot
install geoChart to this disk" will appear. You will need to install
geoChart from its original application disk first, and then transfer
copies of the installed geoChart to your work disks.
Step 3: Make a Backup Copy of Your Program Disk
After you have installed geoChart, you will be ready to make a backup disk.
You should always make a backup copy of any master disk, in case it is
damaged in the future. If necessary, refer to "Copying a Disk," page 3-9, of
your GEOS User's Manual. If you are using GEOS 2.0, refer to the GEOS
2.0 User's Manual: "Copying a Disk Using One Disk Drive" on page 71 or
"Copying a Disk Using More than One Disk Drive" on page 72.
Work Disks
Once you have installed geoChart and made a backup copy of the program
disk, you will be ready to use geoChart and the Note Pad desk accessory.
The easiest way to use geoChart (and any other GEOS application) is to
prepare work disks, which are disks you use on a day to day basis. The
kind of geoChart work disk you create depends entirely on your needs: the
kind of project you are working on, your disk drive set-up, and how much
space you have on your disks. Suggestions for how you can set up work
disks for geoChart are found under "geoChart and Work Disks" on page 42.
Now Go to Chapter 2, "Learning geoChart"
Now that you have installed geoChart, you will be ready to learn how to use
geoChart's features. Go to Chapter 2, "Learning geoChart."
Getting Started
Chapter!
Learning geoChart
This chapter contains an overview on how geoChart works as well as a
tutorial to give you some hands-on experience using geoChart. Read "How
geoChart Works" on the next page to get an idea of what you need to do to
create a geoChart document Afterwards, try the tutorial on page 14.
If you come across any unfamiliar terms, refer to Appendix A: Glossary
(page 94). The command menu options are summarized in Appendix B:
Menu Listing (page 98). Error messages are explained in Appendix D:
Error Messages (page 106).
:•:•:•:•:•:•:•:•:•:•:•:•:•:•:•:•:•:•:•:•:•:•:•:♦:♦:•:•:•:•:•:•:•:
Learning geoChart
^^
How geoChart Works
The geoChart application enables you to create a one-page chart using a
variety of styles and chart types. The actual size of a chart is approximately
3 1/2 by 4 inches, depending on the resolution of your printer. The chart's
components come from two application sources: one source is either
geoCalc, geoWrite, geoFile, or the Note Pad desk accessory; the other
source is geoChart itself. The data you wish to chart comes from either
geoCalc, geoWrite, geoFile, or the Note Pad. geoChart will translate the
data to a chart format.
Read (but don't try) the following steps to get a general idea of how to use
geoChart. This section covers a lot of information, so don't feel you have to
learn everything all at once just by reading this section. You can refer to it
later on if needed. When you try the tutorial on page 14, you will be able to
get some hands-on experience with using geoChart.
1.
First, you need to create the basic charting data — values, labels, and
chart title — in the Note Pad, geoCalc, geoWrite, or geoFile. You need
not worry about other components of the chart; these will be handled
by geoChart later on.
First, you create
qeos I file | edit j options
2.
the basic chart
ing data.
Next, you highlight the data you wish to have charted, then copy it to a
text scrap.
qeos j file j edit j options j display |
M7
M M Estimates '
Ail
Magazines;
Uideos
1
8
Chapter 2
§
I
-2 661j
678!
C
)2l\
987
Next, copy the
data to a text
scrap.
T«xt
*x*x««<«w«wccv«c«
3.
Then you paste the text scrap into a geoChart document.
However, the text scrap won't be pasted into the geoChart document
right away. This is because geoChart first divides the data within the
text scrap into sections, then gives you the option of selecting which
sections you want placed into a chart.
Here is how the text scrap data is divided into sections:
a.
the chart's title
Once you paste a text
scrap into a chart, you
can change or delete the
chart's title if needed.
The text scrap data need
not contain a chart title.
b.
values
Values are arranged in
qeos j file j edit j options; display |||
columns and rows. You
can select an entire
column or row (up to 20
values) to be placed in
the chart, or you can
select part of a column
or row if desired. Each set of values you select is called called a
data series. You can place up to four data series in each chart,
with each data series containing up to 20 values. The text scrap
data must contain values in order to be valid.
c.
series names
Each data series is
headed by a series
name. A series name
qeos
G2fl
j file j edit
_J4M
!o
|s -2001!
i
need not be restricted to
17 •stimates
labels at the head of a
18 Magazines ,j
column, though; you
19 Uideos
can designate the row
rtions | display ||1
.j
D
1
I*
qtr
!2nd qt(
\
\li\\
678!
!
987!
!'"
labels (Magazines and Videos) as series names instead of 1st Qtr
and 2nd Qtr. Once you paste the text scrap into a chart, you can
^
Learning geoChart
9
change or delete the series names if desired. The text scrap data
need not contain series names.
d.
category names
A category name is used
as a basis for measure
ment for each of its
corresponding values.
In the illustration at the
right, the category name
J8 Magazines!
19 Jldeos
-2601!
1221!
6781
9871
Magazines is used as a
basis of measurement for the values -2001 and 1221. You need
not restrict the category names as row labels; if desired, you can
have geoChart read the column labels (1st Qtr and 2nd Qtr) as
category names instead of Magazines and Videos. Once you paste
in the text scrap, you can change or delete the category names.
The text scrap data need not contain category names.
In summary, the text scrap data must contain values. The other
components, the chart's title, series names, and category names, are
optional.
4.
Once you know the components of a text scrap, it is easy to learn how
to select these components to be placed into a chart. Pasting in a text
scrap will activate Data Mode, which you use to select the sections you
want to be placed in the chart:
qeos
file
edit
grid
10
chart j mode
Data Series dialog box
Chapter 2
The main icon you use in Data Mode is the grid. Each square in the
grid represents a value in the text scrap:
-2001 ■
678 —Oh
987
-1221
To view values in the text scrap, move the pointer over the grid:
Clear
| Chart |
Data Series
I Magazines
list Qtr
II-ZB81
The Data Series dialog box will display each value and its correspond
ing labels. For example, in the illustration above, the top left square,
where the pointer is positioned, represents the value -2001. That
value's corresponding label names, 1st Qtr and Magazines, will be
included in the chart as well, even though there are no grid squares to
represent them.
To select a section of the text scrap, you need to highlight a corre
sponding section of the grid. If you wish to place the left column of
values into the chart, you will need to highlight the left column of grid
squares. Selecting a set of values is easy: all you need to do is
highlight the appropriate squares:
The two darkened
squares are
highlighted.
m
If you make a mistake, you can undo your selections by clicking on the
Clear icon.
5.
After you make your selections in the grid, you can exit Data Mode by
clicking on the Chart icon. At any time, you can reenter Data Mode to
select a different set of data series, if desired.
Learning geoChart
11
6.
After you exit Data Mode, you enter Chart Mode, which displays your
charted data. Here is how charting data is placed in a chart:
The series name
is placed in a legend.
Category names
are placed along
the chart's grid.
Chart Mode enables you to change the appearance of a chart in a
variety of ways:
•
Chart style You have nine chart styles from which to choose:
area, bar, column, pie, point, line, scatter point, scatter line, and
unibar. (See Appendix C: Chart Samples, page 100, for how the
various chart styles appear.)
•
Text If desired, you can add or change text (e.g., the labels) in a
number of ways. Not only can you change the basic formatting
such as font, style, point size, and content, you can determine
whether the text is displayed as well.
•
Markers Markers represent the values you import into a chart.
You can change the patterns used for markers. If the marker is a
filled shape, as in a column or pie chart, you can select from 32
different patterns. (These patterns are the same patterns used in
geoPaint.) If the marker is a point, you can select from four
different styles.
12
Chapter 2
^
x*x*x*x*x*x*x*x
Axis values Axis values are automatically input by geoChart and
provide a basis for measuring the values you pasted into the chart.
You can include negative values, if needed, depending on the chart
type currently displayed. In addition, you can change the format
(e.g., to percentages or dollar amounts) of axis values.
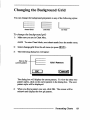
Background grid For charts that contain a background grid, you
can change the grid to one of two styles, or you can remove its
display entirely.
At any time, you can reenter Data Mode to select a different set of data
series, if desired.
After You've Created a Chart
After you have created the exact type of chart you need, you can copy it to
another document. geoChart's file management operations, which enable
you to update, recover, rename, and print a document, work in much the
same manner as those of other GEOS applications. As with other GEOS
applications, you can use desk accessories with geoChart.
Now that you have an idea of how geoChart works, try the tutorial on the
next page.
:*x*x*xtttt*x*:-X'^
Learning geoChart
13
The Tutorial
Use the following tutorial to become more familiar with geoChart Before
you begin this tutorial, make sure you have installed geoChart according to
the instructions in Chapter 1, "Getting Started." You should also have read
"How geoChart Works" on page 8 at the beginning of this chapter.
In this tutorial, you use the Note Pad to create a text scrap, which you will
paste into geoChart. Once you have pasted the text scrap into the tutorial
document, you will try out a few of geoChart's features.
Step 1: Prepare a Work Disk
Never use an original application disk to create documents! Instead, use a
work disk, which is more convenient to use. For this tutorial, the work disk
will be a copy of the original program disk.
The following instructions describe how to prepare the work disk using one
disk drive, one disk drive and a RAM Expansion Unit, and two disk drives.
To prepare the work disk using one disk drive:
1:
Format a blank 5 1/4 inch disk. Name the disk TUTORIAL. After the
disk has been formatted, remove it from the disk drive.
NOTE
If necessary, refer to "Formatting a Disk" on page 3-9 of the
GEOS User's Manual. If you are using GEOS 2.0, refer to page 75 of
the GEOS 2.0 User's Manual.
2:
Insert your System disk into the disk drive and activate the System disk
by clicking on its disk drive icon.
3:
Use the DISK COPY program to copy the contents of the geoChart
program disk to the TUTORIAL work disk. When you open DISK
COPY, simply follow the directions on the screen.
NOTE
If necessary, refer to "Copying a Disk" on page 3-9 of the
GEOS User's Manual. If you are using GEOS 2.0, refer to "Copying a
Disk Using One Disk Drive" on page 70 of the GEOS 2.0 User's
Manual.
14
Chapter 2
*x«w»w:«^^
4:
When the System deskTop appears, copy the DESKTOP file onto the
TUTORIAL work disk.
NOTE If necessary, refer to "Copying a File to Another Disk" on page
3-4 of the GEOS User's Manual. If you are using GEOS 2.0, refer to
"Copying a File to Another Disk" on page 66 of the GEOS 2.0 User's
Manual.
To prepare a work disk using one disk drive and a RAM
Expansion Unit:
1:
Format a blank 5 1/4 inch disk. Name the disk TUTORIAL. After the
disk has been formatted, remove it from the disk drive.
NOTE If necessary, refer to "Formatting a Disk" on page 3-9 of the
GEOS User's Manual. If you are using GEOS 2.0, refer to page 75 of
the GEOS 2.0 User's Manual.
2:
Insert the geoChart program disk into the disk drive and activate the
program disk by clicking on its disk drive icon.
3:
Copy the geoChart program disk contents onto the RAM Expansion
Unit.
NOTE If necessary, refer to "Copying a Disk" on page 3-9 of the
GEOS User's Manual. If you are using GEOS 2.0, refer to "To copy if
the disk drive formats are the same" under "Copying a Disk Using
More Than One Disk Drive" on page 73 of the GEOS 2.0 User's
Manual.
4:
Close the geoChart program disk and remove it from the disk drive.
5:
Insert the System disk into the disk drive and activate the disk.
6:
Copy the DESKTOP file to the RAM Expansion Unit.
NOTE If necessary, refer to "Copying a File to Another Disk" on page
3-4 of the GEOS User's Manual. If you are using GEOS 2.0, refer to
"Copying a File to Another Disk" on page 66 of the GEOS 2.0 User's
Manual.
^^
Learning geoChart
15
7:
Close the System disk and remove it from the disk drive.
8:
Insert the TUTORIAL work disk into the disk drive and activate the
disk by clicking on its disk drive icon.
9:
Open the RAM Expansion Unit disk drive and copy the contents of the
REU onto the TUTORIAL work disk.
To prepare a work disk using more than one disk drive:
1:
Format a blank 5 1/4 inch disk. Name the disk TUTORIAL. After the
disk has been formatted, remove it from the disk drive.
NOTE If necessary, refer to "Formatting a Disk" on page 3-9 of the
GEOS User's Manual. If you are using GEOS 2.0, refer to page 75 of
the GEOS 2.0 User's Manual.
2:
Insert the geoChart program disk into Drive A and activate the program
disk by clicking on its disk drive icon.
3:
Insert the TUTORIAL work disk into Drive B and activate the TUTO
RIAL disk by clicking on its disk drive icon.
4:
Open the geoChart program disk and copy its contents onto the
TUTORIAL work disk.
NOTE If necessary, refer to "Copying a Disk" on page 3-9 of the
GEOS User's Manual. If you are using GEOS 2.0, refer to "Copying a
Disk Using More Than One Disk Drive" on page 72 of the GEOS 2.0
User's Manual.
5:
Close the geoChart program disk and remove it from Drive B.
6:
Insert the System disk into Drive A and activate the disk.
7:
When the System deskTop appears, copy the DESKTOP file onto the
TUTORIAL work disk.
NOTE If necessary, refer to "Copying a File to Another Disk" on page
3-4 of the GEOS User's Manual. If you are using GEOS 2.0, refer to
"Copying a File to Another Disk" on page 66 of the GEOS 2.0 User's
Manual.
16
Chapter 2
•:*:•:♦:•:*:•:•:•:•:•:•:•:
Step 2: Open geoChart
Once you have prepared the TUTORIAL work disk, you will be ready to
create a geoChart document.
To create a new geoChart document:
1:
Open geoChart by double-clicking on its file icon.
NOTE An alternative is to click once on the
geoChart file icon so that it is highlighted, then
select open from the file menu.
Look for
this file
icon.
\Ai
CEOCHART
2:
The Create/Open/Quit dialog box will enable you to create a new
document, open an existing document, or quit to the deskTop. Click on
Create new document.
3:
The next dialog box will ask you to name the document. Enter the
name Tutorial and press iRETURNl.
4:
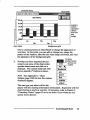
Whenever you create a new geoChart document, the first screen will
display the geoChart Generic Chart. The purpose of this chart is to
give you a rough idea of how a chart will appear. Its values do not
reflect the values in the text scrap you are about to paste into the
document.
$568
$458
$488
S
5358
$388
$256
Jcin
Mar
Feb
May
Apr
Jul
Jun
Sep
Aug
Nou
Oct
Dec
Month
the Generic Chart
^^^^^^
Learning geoChart
17
Step 3: Open the Note Pad and Enter Some Data
The Note Pad desk accessory supplied on your geoChart program disk has
been upgraded to enable you to copy its contents into a text scrap, which
then can be placed into a geoChart document
To use the Note Pad:
1:
Select note pad from the geos menu. The Note Pad will appear over
the geoChart generic chart
2:
Type the following data into the Note Pad, exactly as follows:
Be sure to
include
commas and
a I RETURN I
after each
line.
tote Pad
-close icon
5prockets,Jan,Feb,Mcif,Apf,Mciy
Model A,198,-232,30,-120,-56
Model 8,788,988,535,-222,677
Model C,321,788,612,673,322
Model 0,122,821,2661,988,1992
I
In order for charting data to be used, it must be set up in a certain
manner:
•
Sprockets is the chart's title: chart titles are always placed at the
upper left corner.
Jan, Feb, Mar, Apr, and May are column labels. Each column
label heads a vertical line of values. For example, Jan heads the
values 190,788,321, and 122. By default, geoChart will translate
column labels as series names; in the chart these will be placed in a
legend. If desired, you can change this default In this tutorial, you
will have geoChart place the column labels below the chart's grid.
•
18
Model A, Model B, Model C, and Model D are row labels. As
with the column labels, each row label heads a horizontal line of
values. For example, Model A heads 190, -232,30, -120,and -56.
Chapter 2
By default, geoChart will translate row labels as category names;
in the chart these will be placed below the charting grid. As with
column names, you can change the default; in this tutorial you will
have geoChart place the row labels in a legend.
Values are always placed directly after the labels, as in the
example in the illustration on the previous page.
When using the Note Pad to create charting data, separate each data
include spaces between each data item.
3:
Once you have entered all of the charting data in the correct manner,
you will be ready to copy it into a text scrap. To copy a Note Pad page
into a text scrap, hold down the OS key and press [t/].
4:
Now exit the Note Pad by clicking on the
close icon in the upper right corner. The
Note Pad will disappear and you will be
click here to
returned to the geoChart Tutorial document,
close the Note Pad
Step 4: Now Paste in the Text Scrap and Select the Charting
Data
In geoChart, you paste in a text scrap in much the same manner as you
would in any other GEOS application. However, the text scrap's data will
be redefined by geoChart.
To paste the text scrap into the Tutorial document and
select the charting data:
1:
Select paste from the edit menu (or press [fr1[Tl).
*:w
Learning geoChart
19
2:
The following dialog box will appear:
Pasting mill destroy old data.
777e new text scrap
data will overwrite
any current charting
data in the document.
This dialog box will appear whenever you are about to paste a new text
scrap into the document. It will let you know that the text scrap data
you are about to paste into the document will overwrite the current text
scrap data. The data that creates the geoChart Generic Chart will be
overwritten by your text scrap data. Click OK to continue.
3:
Data Mode, which lets you select specific rows or columns to be
charted, will appear:
command menu
qeos j file j edit j chart j mode
Data Mode
Tutorial i
First you need to use the grid to select which set of values in the text
scrap you wish to chart. The text scrap is composed of four rows and
five columns of values. Each set you select is called a data series. You
can chart up to four data series at a time. If you want to place the first
four columns of data into a chart, you can do so by clicking on the
Chart icon (or selecting chart mode from the mode menu). However,
20
Chapter 2
■>:•:•:•:•:•:•:•:•:•:•:•:•:•:«•:•:•:•:•:•:•:•
:^
^^
for this tutorial, you need to compare the values in Row 1 with the
values in Row 4.
These labeis will be placed in
Sprockets,Jan,Feb,Mar,Apr,Mayl
Model A,190,-232,30,-120,-56F
ihe chart
—Here is the first data series.
Model 6,788,988,535,-222,677
Model C,321,788,612,673,322
[Model D,122,821,2001,980,1992]
4:
Here is the second data series.
To select the first data series (Row 1), move the pointer so that it is
positioned over the top left square in
the grid.
Move the pointer
here.
Each square in the grid represents a
value in the text scrap. Note the Data
Series dialog box below the grid: as
HHtf
you move the pointer over a square,
the value, its category name, and its series name are displayed in the
three Data Series windows.
777e values and labels
appear when the
pointer is over the grid.
Data Series
[Model ft
5:
[Jan
JLL2L
To select Row 1, make sure the pointer is positioned over the top left
square, click, and hold down the input device button. While holding
down the button, move the pointer
to the end of Row 1. Each square
will become highlighted.
Here are the actual
components of that
data series.
the first
data series
Model A,190,-232,30,-120,-56
:•:•:•:•:•:•:•:•:•:•:•:•:•:•:•:•:•:•:•:■:•:•:•:•:
Learning geoChart
21
NOTE If you make a mistake, click on the Clear icon. This will undo
your selection and let you start over again.
6:
Release the input device button when the entire row is highlighted.
You have just selected the first data series.
7:
Now move the pointer down to the fourth row and click anywhere on
that row. As with Row 1, the entire row will
become selected. You have just selected the
second data series.
the second ^ta series
Step 5: Return to Chart Mode and Change
the Chart's Format
After you have selected the data series in Data Mode, you can have geoChart translate your selections to a charting format
1:
To exit Data Mode, use one of the following methods:
•
Click on the Chart icon.
•
Select chart mode from the mode menu.
In either case, a "Reading Data" message will appear and you will be
returned to Chart Mode.
2:
The two data series you selected will be translated into a charting
format The Generic Chart will be replaced by a column chart with
your text scrap data charted.
NOTE At any time, you can reenter Data Mode and reselect a different
set of data series. Switch between the two modes as often as you need
by selecting the mode you want from the mode menu.
22
Chapter 2
command menu
Chart Mode
am
geos ; file j edit j chart j mode
utork
markers
(which
represent
values
from the
text
scrap)
axis values
background grid
Use the command menu in Chart Mode to change the appearance of
your chart In this mode, you can add or change text, change the
patterns of the markers, alter the axis value range and format, and vary
the appearance of the background grid.
3:
Now that you have imported the text
scrap, try out some of the chart styles:
open the chart menu and click on a
chart type. The current chart type will
have an asterisk (*) before its name.
NOTE See Appendix C: Chart
Samples (page 100) for how the various
chart styles appear.
mt^mm
Pull down
Ejgg|Jfoe chart menu
?..S!E!
area
...„.„„...._..
Tstyle. °^
icoiumn
point
Ine
scatter
unibar
The chart type you select will be dis
played, with the charting information reformatted. Experiment with the
chart's format as much as you like. If necessary, refer to Chapter 6,
"Formatting Charts" (page 65) or to the index if you wish to try out
specific menu options.
Learning geoChart
23
Step 6: Exit geoChart
Once you have created a chart, you can copy it to any GEOS application
document that accepts photo scraps. If you wish to try copying the chart to
another document, please refer to "Copying a geoChart Document Else
where" on page 86 first The copying procedure for geoChart is slightly
different from the copying procedure used for other GEOS applications.
Exit geoChart in the same manner you would exit any GEOS application.
You can exit to create or open a new geoChart document, or you can exit
directly to the deskTop. In either case, once you exit a document, its
contents will be saved to disk. For this tutorial, you will exit to the deskTop.
To exit the geoChart document:
•
Select quit from the file menu.
Step 7: Lookfor the New File Icon
After you create a document with geoChart (or
nj==n the Tutorial
a document icon for the file on the deskTop.
Tutorial
any other GEOS application), GEOS will create
[111^1file lcon
After you exit geoChart, look closely at the
deskTop. You will see a new file icon: it resembles the geoChart file icon
and has the name Tutorial underneath. If you wish to open Tutorial again,
you can do so by double-clicking on its icon, or by highlighting the file icon
and selecting open from the file menu. This will open geoChart directly to
the data contained within the Tutorial document.
Congratulations! You have just completed the geoChart tutorial. Now that
you have had some hands-on experience using geoChart, you are ready to
create your own charts.
24
Chapter 2
Preparing
a Text Scrap
In order to create a chart in geoChart, first you will need to create the
chart's data — its values and labels — in geoCalc, geoWrite, geoFile, or the
Note Pad desk accessory. Once you have created this basic charting data,
you can copy it into a text scrap, then copy the text scrap contents into a
geoChart document After the charting data has been placed in a geoChart
document, you can chart specific sections of the data or change the chart's
appearance in a variety of ways.
This chapter explains how you can create charting data using geoCalc,
geoWrite, geoFile, and the Note Pad desk accessory.
Unfamiliar terms are defined in Appendix A: Glossary (page 94).
Preparing a Text Scrap
25
What Goes in a Text Scrap?
Any GEOS application that supports the use of text scraps can be used to
create a geoChart document The most commonly used applications are
geoCalc, geoWrite, and geoFile. The version of the Note Pad desk acces
sory that is supplied on your geoChart program disk has been enhanced to
create text scraps.
How Data Must Be Created
In geoChart, data is organized into series. Each data series contains a set of
categories, each having a corresponding value. The document you create
can contain the chart's title, column labels, row labels, and values.
The data you create must be set up in the following manner:
Place the chart's
title in the upper
left comer.
Widgets 1
Place the column labels at
the top.
Jan
|Jan
Feb
Mar|
TurboWidg
123
456
789
SuperWidg
321
654
987
WidgXL
213
546
879
I
Place the row
labels along the
left side.
Place the values immediately
after the labels,
Each label-value intersection is called a data point. In the above example,
the data point for TurboWidg in January is 123. Jan, Feb, and Mar are
column labels. TurboWidg, SuperWidg, and WidgXL are row labels.
You will note that the charting information is arranged in rows (e.g.,
Widgets, TurboWidg, SuperWidg, WidgXL, and corresponding values) or
columns (Widgets, Jan, Feb, Mar, and corresponding values).
The Chart's Title
Any non-numeric data entered in the upper left corner of the text scrap area
(e.g., the name "Widgets") will be interpreted by geoChart as the chart's
26
Chapter 3
x*:*:*x*x*x*x*x*x*x
tide. If you wish, you need not include a chart title for your chart. The
procedure for omitting data from a source document is described under each
appliction description in this chapter.
If you wish to give the chart a numeric title, you can do so by changing the
chart's name after the text scrap has been pasted into a geoChart document.
(The procedure for editing the text is described under "Changing Text for
All Charts" on page 71 in Chapter 6, "Formatting Charts.") In the geoChart
document, the chart's title will appear above the chart's grid.
Row and Column Labels
geoChart will recognize a data item as a label as long as it is non-numeric.
For example, entering 12345 instead of TurboWidg will cause geoChart to
interpret 12345 as a value, not a label. If you wish to enter numeric labels,
you can do so by editing the text after you have placed it into a chart. (The
procedure for editing the text is described under "Changing Text for All
Charts" on page 71 in Chapter 6, "Formatting Charts.")
As with the chart's title, you need not include row or column labels in the
text scrap. If you wish to leave out these labels, but want a chart title, leave
the appropriate areas blank:
Chart Title
321
123
456
654
987
789
213
546
879
If you plan to include row and column labels in your chart, they must be
placed either along the top row or the left column.
How Row and Column Labels Are Interpreted by geoChart
Depending on how you select data to be charted (in geoChart's Data Mode),
the row and column labels will be placed either alongside the chart's grid or
in a legend box. In most charts, row labels are by default read as category
names and will be placed along the chart's grid. In pie and unibar charts,
however, category names are placed in the legend box. Categories are used
as a basis of measurement for their corresponding values.
Column labels are by default read as series names and will be placed in the
chart's legend.
Preparing a Text Scrap
27
•:•:♦:•:♦:•:•:•:•:•:•:•:•:•:•:•:•:•:•;•:>:•:•:•:•:•:•:•:•:•:•:•:•:
X%*X-X-X-X*X*X*X-XX*X*X*X
By default, here is how geoChart will interpret a chart's labels:
HChartTitlel
[Series Name A
Series Name Bh
Category Name A
Value
Value
Category Name B
Value
Value
Series names
are placed in
a legend box.
Category
names
are placed
along the
chart's
grid
Values are
represented
by markers.
After you have pasted the text scrap into geoChart, you can easily change
the default label reading. For example, if you wish a label in the Series
Name A position to be read as a category name (i.e., placed along the
chart's grid), you can do so by using Data Mode's grid to select the series
horizontally.
In other words, you need not exit geoChart and reformat the original
charting data if you wish to change the placement of labels. geoChart will
do it for you.
Values
You do not need to have the same number of values in each row. A blank
value position will be ignored by geoChart. However, the values to the
right of the blank value will be shifted to the left:
123
321
213
456
"vyf'—r-r-
546
789
123
456
987
321
987
213
546
879
Here are the text scrap values
with one blank value.
789
879
Here is how geoChart reads
them.
In Data Mode, the grid will display a small white box over the grid cell
representing the missing value. If you want the values to remain aligned
with their corresponding labels, enter a 0 (zero) into the blank space.
28
Chapter 3
*X*X*X*X*X*X*K
geoChart will interpret the values as markers on the chart's grid. In the
geoChart document, there will be no marker to represent blank values.
Maximum Text Scrap Size
You can import a text scrap up to 50 columns and 25 rows of values. If
your charting data includes labels (i.e., the chart title, category names, and
series names), the maximum text scrap size is 51 columns and 26 rows of
Preparing a Text Scrap
29
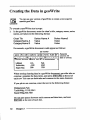
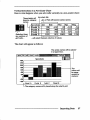
Creating the Data in geoCalc
You can use any version of geoCalc or geoCalc 128 to create a
ceocolc
teXt SCrap for use with SeoChart.
To create a geoCalc text scrap:
1:
In the geoCalc document, enter the chart's title, category names, series
names, and values in the following format:
Chart Title
Category Name A
Category Name B
Series Name A
Value
Value
Series Name B
Value
Value
For example, a geoCalc document could appear as follows:
qeos;
B21
\ file j edit I options display
M M
A
12 Hidqets
13 TurboHidq
14 SuperNidq
T
B
C
Ucin
I
Feb
-1212
23-11
269
789
When entering charting data in a geoCalc document, enter each data
item into a cell, using the same format as above. You can vary the
alignment of data items, if desired. However, make sure the values are
in "general" format. (You can change the values in geoCalc to a
general format by highlighting the values, selecting format from the
display menu, clicking on general in the dialog box, then clicking
OK.)
30
Chapter 3
wtttt<tt*:^
If you do not wish to include a label or a specific value, just leave the
appropriate cells blank:
qeos | file j edit j options ) displcuj]
The
chart's
title is
omitted
B
Jan
TurboWidg
SuperNjdg
IFeb
-1212!
298!"
789!
an omitted
value
You need not include blank rows or columns when you highlight data
for the text scrap. If you want the values aligned with their correspond
ing labels, enter a zero (0) into the blank space. In the geoChart docu
ment, there will not be a marker or label for the omitted data.
2:
3:
Once you have entered the data you need, highlight the labels and
values you wish to place in the chart.
Select copy text scrap from the options menu to place the information
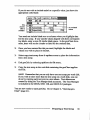
into a text scrap.
4:
Exit geoCalc by selecting quit from the file menu.
5:
Copy the text scrap to the work disk containing the geoChart applica
tion file.
NOTE Remember that you can only have one text scrap per work disk.
If you wish to store more than one text scrap on a work disk, you can
do so by copying each text scrap to a text album. Text albums are
created by using the Text Manager desk accessory. The Text Manager
is included in the GEOS, GEOS 128, and GEOS 2.0 packages.
You are now ready to open geoChart. Go to Chapter 4, "Opening geo
Chart" (page 41).
x*x*x*::*x*xx
XXvX*X*X*X*X*X-
Preparing a Text Scrap
31
Creating the Data in geoWrite
You can use any version of geoWrite to create a text scrap for
use with geoChart
CEOWRITE
To create a geoWrite text scrap:
1:
In the geoWrite document, enter the chart's title, category names, series
names, and values in the following format:
Chart Title
Category Name A
Category Name B
Series Name A
Value
Value
Series Name B
Value
Value
For example, a geoWrite document could appear as follows:
tab marker
Separate
columns with
tabs or commas.
qeos j file j edit j options j pci<ie j font j style \\
n
«
I
«
■
t
■
12
12■
■
.
■
I
■
■
I
"CeFTB C ENTER D mbHTD FULL IT
4-JU5TIFICBTIDN
Midgets
TurboHidq
Jan
-1212
Feb
2341
SuperHidg
200
789
LI
When entering charting data in a geoWrite document, use either tabs or
commas to separate the data items, and press I RETURN I at the end of
each row. You can use both tabs and commas in the same document.
If you plan to use commas, enter the text in the following format:
Widgets,Jan,Feb
TurboWidg,-1212,2341
SuperWidg,200,789
Do not enter spaces between each comma and data item, and press
IRETURNI at the end of each line.
32
Chapter 3
If you do not wish to include a label or a specific value, just leave the
appropriate area blank:
7770 chart's title is
omitted, but you
need to include its
comma.
,Jan, Feb I
TiirhnWlrin 2^41
' urD0Wiag,l,^41
SuperWidg,200,789
TnQ same 9oes tor
omitted values,
If you want the values aligned with their corresponding labels, enter a
zero (0) into the blank space. You need not include an omitted row of
data when you highlight data for the text scrap. In the geoChart
document, there will not be a marker or label for the omitted data.
2:
3:
Once you have entered the data you need, highlight the information you
wish to place in the chart.
Select copy from the edit menu (or press [g \C\) to place the informa
tion into a text scrap.
4:
Exit geoWrite by selecting quit from the file menu.
5:
Copy the text scrap to the work disk containing the geoChart applica
tion file.
NOTE Remember that you can only have one text scrap per work disk.
If you wish to store more than one text scrap on a work disk, copy each
text scrap to a text album. Text albums are created by using the Text
Manager desk accessory. The Text Manager is included in the GEOS,
GEOS 128, and GEOS 2.0 packages.
You are now ready to open geoChart. Go to Chapter 4, "Opening geo
Chart" (page 41).
XvX*^^
Preparing a Text Scrap
33
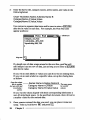
Creating the Data in geoFile
You can use any version of geoFile or geoFile 128 to create a
^1
ceofile
text scrap for use with geoChart The format for entering labels
and values in a geoFile document is slightly different from the
procedure used for geoCalc or geoWrite. The labels will be placed differ
ently, and each category will have its own record. Even though each
category will have its own geoFile record, all of the category-records will
be placed in one text scrap.
To create a geoFile text scrap:
1:
In the geoFile document, use Form Design Mode to set up the chart's
form design in the following format:
Chart Title
Series Name A
Series Name B
Enter Form Design Mode by selecting form design from the options
menu.
If desired, you can use a sublayout to set up the charting data in specific
fields.
For example, the charting data fields could appear as follows:
qeos j file j edit j options j field j
the chart's title —
Place series
Tfidqets
»
names as row
labels, not
column labels.
2:
Once you have created the form design, use Data Entry Mode to enter
the category names and values. Enter Data Entry Mode by selecting
data entry from the options menu.
34
Chapter 3
Here is how the first category/record should be set up:
Chart Title : Category Name A
Series Name A : Value
Series Name B : Value
Here is how the second category/record should be set up:
Chart Title : Category Name B
Series Name A : Value
Series Name B : Value
For example, your records, which contain the category names and
values, could appear as follows:
Here is the first record
qeos!
file j edit j options j form
Nidgets : TurboNidg
Here is the second record
qeos j file j edit j options j form
I 1 Nidgets : SuperHidg
! pEnTSit"
Feb : 2341
: JF4b :' 7!39
You can omit the chart's title and series names (in geoFile, the row
names), but you cannot omit the category names or any values. If you
wish to omit a value, enter a 0 (zero) in its place. You can delete
category names in the geoChart document.
For example, suppose you wish to exclude the chart's title. Here is
how you would omit it:
: TurboHidq
in Form Design Mode, leave the
chart title field blank.
in Data Entry Mode, here is how the
same field will appear.
Remember that in the geoChart document, blank fields will be dis
counted; there will not be a marker to represent them.
^
Preparing a Text Scrap
35
3:
You are now ready to create a text scrap. To select the data entry fields
you wish to include in the chart, click on each field.
NOTE Click on each field in the order you wish it to appear in the
document, e.g., top to bottom.
4:
Go to the next record and click on each data entry field to be included
in the chart.
5:
After you have clicked on the necessary fields from each record, select
build scrap from the file menu. The following dialog box will appear:
Nhich scrap?
11 Text
|
[Merge
I
Nhich form?
All forms
Selected forms
Current form
6:
Click on the Text option, then click on All forms (to chart all the
category/records in the file) or Current form (to chart the current
category/record).
7:
Once you have made the appropriate selections, click on OK to place
the charting information into a text scrap.
8:
9:
Exit geoFile by selecting quit from the file menu.
Copy the text scrap to the work disk containing the geoChart applica
tion file.
NOTE Remember that you can only have one text scrap per work disk.
If you wish to store more than one text scrap on a work disk, copy each
text scrap to a text album. Text albums are created by using the Text
Manager desk accessory. The Text Manager is found in the GEOS,
GEOS 128, and GEOS 2.0 packages.
You are now ready to open geoChart. Go to Chapter 4, "Opening geo
Chart" (page 41).
36
Chapter 3
Creating the Data in the Note Pad Desk
Accessory
□
• m*
The Note Pad desk accessory supplied on your geoChart
program disk has been upgraded to enable you to copy its
contents to a text scrap. In addition, you can add or delete pages,
move the text cursor, and use keyboard commands to go to another Note
Pad page. This version of the Note Pad is the same version supplied with
GEOS 2.0. Do not attempt to use earlier versions of the Note Pad to create
text scrap data, since these versions do not enable you to create text scraps.
The Note Pad is particularly useful with geoChart in that you can create the
charting data in the Note Pad while a geoChart document is displayed on
the screen. If you need to change the data, you can gain access to the Note
Pad right away, since it is listed in the geos menu along with any other desk
accessories you may have copied to your work disk. Use the Note Pad if
you wish to chart small amounts of data; i.e., data that does not exceed a
Note Pad page. However, the Note Pad holds up to 127 pages, so you can
store up to 127 pages of separate charting data at a time.
Before you use the Note Pad, be sure to copy it to the work disk containing
the geoChart application file. If the Note Pad is on that disk, you can take
full advantage of its easy accessibility when you are using geoChart.
To create a Note Pad text scrap:
1:
Open the Note Pad by selecting note pad from the geos menu. The
Note Pad will appear on the screen over the current application.
NOTE
If the deskTop is displayed, another method of opening the
Note Pad is to double-click on its file icon (or highlight its file icon and
select open from the file menu). You cannot open the Note Pad by
trying to open the Notes data file icon. This data file is used to store
the Note Pad entries.
^^
Preparing a Text Scrap
37
*:*:w:-:w:w^
2:
Enter the chart's title, category names, series names, and values in the
following format:
Chart Title,Series Name A.Series Name B
Category Name A,Value,Value
Category Name B,Value,Value
Use commas to separate data items and be sure to enter a IRETURNI
after the last value in each line. For example, the Note Pad could
appear as follows:
close icon
Hidgets,Jan,Feb
Turboklidq,-1212,2341
SuperNidg.2ea.789
dog-ear
If a lengthy row of data wraps around to the next line, geoChart will
still interpret it as one row of data, just as long as you enter a IRETURNI
after the last value.
If you wish to omit labels or values you can do so by not entering them.
If you wish to omit a label or a specific value, set up the charting data
as follows:
Here the chart's
title is omitted, '
but you still need
to include its
Series Name A.Series Name B ^ same
Category Name A,l,Value
for omjtted
Category Name B,Value,Value
values.
comma.
If you want the values aligned with their corresponding labels, enter a
zero (0) in the blank space. In the geoChart document, there will not be
a marker or label for the omitted data.
3:
38
Once you have entered the data you need, you can place it into a text
scrap. To do so, hold down [§ and press [c].
Chapter 3
4:
Exit the Note Pad by clicking on its close icon.
If the geoChart document is displayed, you can
paste in the Note Pad text scrap right away. See
Chapter 4, "Opening geoChart" (page 41).
Click here
t0 dose *"* Note Pad-
Changing Note Pad Entries
1:
Click on the desired insertion point within an open Note Pad. The text
cursor will move to that location.
2:
To delete characters, press IINST/DEL1 to backspace over the charac
ters. To insert text, simply begin typing.
Adding a Note Pad Page
•
Press [§ [Aj The new page, which will be inserted after the current
page, will be displayed.
Deleting a Note Pad Page
•
Press IS H. The current Note Pad page will be moved into a text
scrap and the page itself will be automatically deleted.
Moving to Another Note Pad Page
•
To go to pages 1-9, hold down O and press the page number.
Use the dog-ear at the lower left corner to move to the next page or the
previous page:
Click here to go to
the next page.
Click here to go to
the previous page.
Deleting the Entire Note Pad Contents
1:
Exit the current application or desk accessory and return to the deskTop.
Delete this
2: Look for the file icon entitled Notes (not note pad). LL=LJ m lcon'
3:
Delete the Notes file from the deskTop by dropping its ghost icon into
the waste basket This will remove all existing notes and give you a
fresh Note Pad.
Preparing a Text Scrap
39
40
Chapter 3
Opening geoChart
Once you have installed geoChart and prepared work disks, you can begin
using geoChart. This chapter describes how to begin using geoChart. Once
you have completed this chapter, you will know how to prepare a geoChart
work disk and how to open geoChart.
Unfamiliar terms are defined in Appendix A: Glossary (page 94). The
command menu options are summarized in Appendix B: Menu Listing
(page 98). Error messages are explained in Appendix D: Error Messages
(page 106).
Opening geoChart
41
Before You Try to Use geoChart
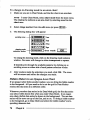
Is geoChart Installed?
•
Make sure you have installed geoChart as explained in the instructions
under "Installing geoChart" in Chapter 1, "Getting Started" Do not
attempt to use geoChart or copy it to a work disk before you install it to
your system.
geoChart and Work Disks
The following instructions describe how to set up work disks for using
geoChart, depending on your preferences and the disk drive set-up you
have. If you are setting up the data in geoCalc, geoWrite, or geoFile, the
easiest method for creating a geoChart work disk is to do the following:
1.
Create the geoCalc, geoWrite, or geoFile documents on the work disks
you usually use for those applications.
2.
Copy the document's charting data into a text scrap.
3.
Copy the text scrap to a geoChart work disk.
If you are using the Note Pad desk accessory to create charting data, its text
scrap will automatically be placed on the correct disk as long as the Note
Pad is on the geoChart application work disk.
Ifyou have one disk drive:
•
Copy geoChart, the text scrap (from the geoCalc, geoWrite, or geoFile
document), geoChart documents, the printer driver, font files, the Note
Pad desk accessory and other desk accessories to one disk. If you have
room, add geoCalc, geoWrite, or geoFile, and the DESKTOP file (from
your System disk).
Ifyou have one disk drive and a RAM Expansion Unit
(REU):
•
Copy geoChart, the text scrap, the printer driver, font files, Note Pad,
and other desk accessories to the REU. If you have room, add geoCalc,
geoWrite, or geoFile, and the DESKTOP file (from your System disk).
42
Chapter 4
^
•
Use the disk drive for the disk containing your geoChart documents.
Ifyou have more than one disk drive:
Copy geoChart, the printer driver, text scrap, font files, the Note Pad
desk accessory and other desk accessories, and the DESKTOP file from
your System disk.
•
Copy your geoChart documents to another disk.
The Note Pad Desk Accessory
Do not use earlier versions of the Note Pad to create text scraps, since they
are not designed to do so. Only use the version supplied on your geoChart
program disk. This version is also available with GEOS 2.0.
The DESKTOP File
If your application work disk has room, it is recommended that you copy
the DESKTOP file onto that disk. If not, when you exit the document, a
message will instruct you to insert a disk containing the version of the
DESKTOP file that was in use when you booted GEOS. If this happens,
you will need to remove the current disk and insert a disk containing the
DESKTOP (e.g., your System disk). If you wish to avoid this procedure,
simply copy the DESKTOP file to your work disk. When you exit a
document, you will be returned directly to the deskTop.
The Text Manager and Photo Manager Desk Accessories
If you plan to use geoCalc, geoWrite, or geoFile to create text scraps, you
may wish to keep copies of the Text Manager and Photo Manager desk
accessories on your work disks. These two desk accessories enable you to
store text and photo scraps permanently into special files called text albums
or photo albums. In this manner, you will be able to store more than one
text or photo scrap on a disk. The Text Manager and Photo Manager desk
accessories are included in GEOS, GEOS 128, and GEOS 2.0.
The Note Pad desk accessory holds up to 127 pages of data. Because of its
easy accessibility to geoChart, you can use the Note Pad to store more than
one set of charting data at a time. However, one set of charting data cannot
exceed more than one page of the Note Pad.
*:*:*:*x*xtt*«*xra^
Opening geoChart
43
««x*x»:w
Special Fonts
geoChart will accept most GEOS-supported fonts, but not megafonts. It is
recommended that you use smaller fonts so that geoChart will be able to
devote more room to the chart's grid area. Remember that the font menu
only displays the first six font files on the disk. If you wish to use a font not
displayed (e.g., the seventh font file on the disk), rearrange the font files on
the deskTop.
GEOS 2.0
If you are using GEOS 2.0, you may be using two different disk drive types
(e.g., a 1541 and a 1571). If this is the case, you will need to add the
CONFIGURE 2.0 file (from the System disk) to any work disk containing
the DESKTOP 2.0 file. If you have a RAM Expansion Unit, however, you
need not copy the CONFIGURE file to the work disk containing the
DESKTOP file.
44
Chapter 4
'X*H<w^^
•:•:•:•:•:•:♦:•:•:•:•:•:•:•:•:•:•:•:•:•:•:•:•:•:•:•:
General Steps to Create a geoChart
Document
The overall procedure for creating a chart using geoChart and geoCalc,
geoWrite, geoFile, or the Note Pad entails the following steps.
1.
First, you create the basic charting information (labels and values) in a
source document (geoCalc, geoWrite, geoFile, or the Note Pad). Copy
the information into a text scrap. The instructions for creating the text
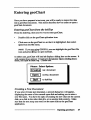
scrap are covered in Chapter 3, ''Preparing a Text Scrap" (page 25).
2.
Next, if you are using geoCalc, geoWrite, or geoFile, you copy the text
scrap to the work disk containing the geoChart application file.
3.
After you have copied the text scrap to your geoChart work disk, you
can open geoChart. The procedures for doing so are covered in
"Entering geoChart" (page 47).
4.
Next, you paste the text scrap into the geoChart document by selecting
5.
After you have pasted the text scrap into the geoChart document,
geoChart will enter Data Mode. Data Mode enables you to select
which parts of the data you want placed in the chart You can do one of
two things:
paste from the edit menu (or pressing IS E )•
•
Click on the Chart icon (or select chart mode from the mode
menu). geoChart will designate the first four columns in the grid
as data series. Chart Mode will be automatically activated.
•
Use the grid to select specific rows or columns of data to chart,
then click on the Chart icon (or select chart mode from the mode
menu). Your selections will be charted, and Chart Mode will be
activated.
NOTE The instructions for entering Data Mode and selecting data
series are found in Chapter 5, "Importing Data" (page 51).
Opening geoChart
45
x-x-x*x-x*x*:*xw:««^^
6.
After you enter Chart Mode, you can change the chart's appearance in a
variety of ways. For example, you have nine chart styles from which to
choose. In addition, you can change the axis range, text, or marker
styles.
NOTE The procedures for changing the appearance of a chart are
covered in Chapter 6, "Formatting Charts" (page 65).
7.
After you have created a chart, you can copy it to another GEOS
application document. Note that the procedure for copying a geoChart
document to a photo scrap differs slightly from how most GEOS
application documents are copied to photo scraps. These instructions
are in "Copying a geoChart Document Elsewhere" (page 86).
46
Chapter 4
«^^
Entering geoChart
Once you have prepared a text scrap, you will be ready to import the data
into a geoChart document. This section describes how to create or open a
geoChart document.
Entering geoChartfrom the deskTop
From the deskTop, there are two ways to enter geoChart:
•
Double-click on the geoChart application icon.
•
Click once on the geoChart icon so that it is highlighted, then select
open from the file menu.
NOTE If you are using GEOS 2.0, you can highlight the geoChart file
icon and press E12 to open geoChart.
In either case, geoChart will load and display a dialog box on the screen. It
will contain three options: Create new document, Open existing docu
ment, and Quit to deskTop. Click on one.
Please Select Option:
1 Create 1 new document
I Open 1 existing document
I
Quit
| to deskTop
Creating a New Document
If you select Create new document, a second dialog box will appear,
displaying the name of the currently open disk and asking you to enter a
new file name. You have the option of creating the new chart on the current
disk, on a disk in the other disk drive, or on another disk entirely. Make
sure that the text scrap you need is on the same disk as the geoChart
application.
Opening geoChart
47
X'X«*xtt«^^
On disk: Charts
■ Create a
Please enter new filename:
| in either
Turboklidg
""
document
drive.
To create a document on the currently open disk:
•
Type in a name for your geoChart document and press I RETURN I.
To create a new document on a disk in the other active
disk drive:
1:
Click on Drive.
2:
Type in a name for your geoChart document and press 1 RETURN 1.
To create a new document on a different disk in the
other active disk drive:
1:
2:
Click on Drive. When the Disk icon appears, click on Disk.
A dialog box will ask you to "Insert new disk into disk drive." Remove
the disk from the disk drive and insert the disk you need.
3:
Type in a name for your geoChart document and press I RETURN I.
Opening a Document
If you select Open existing document, a second dialog box will appear,
displaying the name of the currently open disk and a list of the first five
geoChart documents on that disk. If there are more than five geoChart
documents on the disk, click on the down scrolling arrow to view the rest of
the document names. You have the option of opening a geoChart document
on the currently active disk, on a disk in the other disk drive, or on another
disk entirely. Make sure that the text scrap you need is on the same disk as
the geoChart application.
48
Chapter 4
<tttt*:«w^
ITufboNidq
Estimates
Spark Plugs
Chart A
Adapters
Dn disk:
Charts
L
■
Open I 1
1
Open a
document
in either
drive.
Drive 1 1
[Cancel] |
To open a document on the currently open disk:
•
Click on the name of the document you need, then click on Open.
To open a document on a disk in the other active disk
drive:
1:
Click on Drive. The dialog box will display the names of the geoChart
documents on the disk in the other disk drive.
2:
Click on the name of the document you need, then click on Open.
To open a new document on a different disk in the other
active disk drive:
1:
2:
Click on Drive. When the Disk icon appears, click on Disk.
A dialog box will ask you to "Insert new disk into disk drive." Remove
the disk from the disk drive and insert the disk you need. The dialog
box will display the names of the geoChart documents on that disk.
3:
Click on the name of the document you need, then click on Open.
The first 15 geoChart documents can be displayed in the Open Existing
Document dialog box window. It is unlikely you will have more than 15
documents on a single disk. If you do, you will need to rearrange the file
icons on the deskTop if you wish to view their names in the Open Existing
Document dialog box window. Note that you can open an existing docu
ment directly from the deskTop by double-clicking on the document file
icon (regardless of the file icon's location on the disk).
Opening geoChart
49
Quitting to the deskTop
•
The third option in the Creato/Open/Quit dialog box is Quit to desk-
Top. Click on Quit to deskTop to exit geoChart and return to the
deskTop.
Opening an Existing Documentfrom the deskTop
Once you have created a document, its file icon will appear on the deskTop.
You can open it the same way you open geoChart or any other application,
using one of the following methods:
a geoChart
•
Double-click on the document file icon.
^
Click once on the document file icon so
that it is highlighted, then select open
from the file menu.
50
Chapter 4
w
Importing Data
Once you have created a text scrap and opened geoChart, you will be ready
to import the text scrap into a geoChart document. To do so, you will need
to use Data Mode. This mode enables you to define which sections of the
text scrap you wish to place in the chart. This chapter describes how to
import the text scrap and use Data Mode.
Unfamiliar terms are defined in Appendix A: Glossary (page 94). The
command menu options are summarized in Appendix B: Menu Listing
(page 98). Error messages are explained in Appendix D: Error Messages
(page 106).
w^^
Importing Data
51
*:-x*xtt<tt*^
Once You Open geoChart
When you create a new geoChart document, the Generic Chart will appear.
qeos I file j edit j chart j mode
Jan
Mar
Feb
May
Apr
Jul
Jun
Sep
Auq
Nov
Oct
Dec
Month
J
This GenericChart is designed to give you a general idea of how a chart is
set up. Once you paste in a text scrap, the Generic Chart will no longer
exist A new chart containing your text scrap data will replace the Generic
Chart
Use the command menu in the upper left corner to change the charting
information and alter the appearance of a chart. The geos menu displays the
desk accessories on the application work disk. The file menu options let
you perform basic file management operations, such as renaming, updating,
and exiting a document. Edit will enable you to copy and paste photo and
text scraps and reformat the chart's appearance. The chart menu options
will change the type of chart used (pie, area, bar, and so on). The mode
menu enables you to switch between data mode and chart mode, the modes
used to select charting information and change the appearance of a chart.
In the command menu, menu options in italics are inactive, depending on
the mode you are using. Active menu options appear in regular text. If you
are using Data Mode, the active menu options are as follows:
•
geos menu geoChart info and any desk accessories you may have
copied to that disk.
52
Chapter 5
*x^
file menu close, rename, and quit.
•
mode menu chart mode.
If you are using Chart Mode, the type of chart you are using will also
determine whether menu options are active or inactive. When using area,
bar, column, point, line, and scatter charts, the only inactive menu option is
chart mode in the mode menu. When using pie or unibar charts, the edit
menu's change range, change marker, change grid, and change format
options are inactive as well as chart mode in the mode menu.
*X*^
Importing Data
53
Entering Data Mode
Data Mode enables you to select sections of data from the source document
(such as a spreadsheet) to be charted in the geoChart document. There are
two ways to enter Data Mode. Pasting a text scrap will automatically select
Data Mode. If the document already contains data from a text scrap, you
can enter Data Mode by using the command menu.
Method 1: Paste in a Text Scrap
While in Data Mode, paste the text scrap into the geoChart document in the
same manner as you would paste a text scrap into any other GEOS applica
tion document.
To paste in a text scrap:
1:
In the geoChart document, select paste from the edit menu (or press
2:
A dialog box will warn you that "Pasting will destroy old data." Click
on OK to continue or Cancel to reverse the operation.
NOTE If you click OK, the text scrap you paste into the document will
overwrite any existing text scrap charting data.
Method 2: Use the Command Menu
If the document already contains the text scrap data you need, you can enter
Data Mode at any time.
To use the command menu:
•
54
Select data mode from the mode menu.
Chapter 5
The Data Mode screen will appear as follows:
qeos: file j edit; chart \ mode
Data Mode is simple to use. You can use it to chart data in a variety of
ways. The components of the Data Mode screen are as follows:
grid Each square in the grid represents a corresponding value in the
text scrap. Highlight cells in the grid to select sections of data from the
text scrap. The procedure for using the grid is described under "Select
ing Data with the Data Mode Grid" on page 61.
•
Data Series As you move the pointer over the grid, each value and its
corresponding category name and series name will appear in the Data
Series dialog box. If the pointer is not positioned over the grid, the
Data Series dialog box will be empty, as in the illustration above.
Clear Click on the Clear icon to undo grid cell selections.
•
Chart Click on the Chart icon to translate your grid cell selections to a
charting format. If you don't select any data to chart, the first four
columns of 20 values will be charted. Clicking on Chart will exit Data
Mode and activate Chart Mode.
Importing Data
55
What the Data Mode Grid Does
The grid enables you to select data series that you want to chart from the
text scrap data. The grid represents the text scrap you pasted into the
geoChart document. Its size will vary, depending on how large the text
scrap is. The grid can be as large as 25 rows by 50 columns of cells. Each
cell in the grid represents a value in the text scrap. Labels are not repre
sented by actual cells in the grid, but they are included in the chart when
you select values. They will also be displayed in the Data Series dialog box.
When you position the pointer over a particular cell, the value, its category
name, and its series name will appear in the Data Series dialog box below
the grid.
The procedures for using the grid to select data series depend on whether
you plan to chart your data in a non-scatter chart or a scatter chart. The
main difference is that a data point, which is one value intersection in a data
series, is interpreted differently by non-scatter and scatter charts. In a non-
scatter chart, one row or column of grid cells will represent one data series.
In a scatter chart, one data series will be represented by two rows or
columns of grid cells.
The following sections, "The Grid and Non-Scatter Charts" and "The Grid
and Scatter Charts" (page 59) describe how the placement of values and
labels are determined by grid cell selections.
The Grid and Non-Scatter Charts
Non-scatter charts are area, bar, column, line, point, pie, and unibar charts.
In a non-scatter chart one data point is represented by a category/value pair:
iFeb
ISprockets Ucin
Model A and
-
190 create one
data point
Modei "A"
JModeJ B
category
I
198!
-232
!
788!
988
values
names
A non-scatter chart will use the category names as a basis of measurement
for the values in the charted data series. In the chart, categories are placed
on the X axis; values are placed on the Y axis.
One data series is represented by one row or column of highlighted grid
cells. The direction of grid cells you select will determine the placement of
labels in the chart.
56
Chapter 5
•:ww>>>>xw«:-w*:*xwro^^
Vertical Selections in a Non-Scatter Chart
Here is what happens when you select cells vertically in a non-scatter chart::
These labels will
the chart's title
Jan and Feb will become series names.
become category
names.
L
Sprockets jJjnn
ModefA""!
ModeTl !
ModeJ C
Selecting these
two columns of
grid cells...
-1
Mo'defo"
..-
IFeb
iApr
iMor
-232:1
*988j
32iT""*"""7p|
612|
121
..i£!s.y...
■■"677
••■••■••••ti
673!
W
..„.„„„.
...will select these two columns of values.
The chart will appear as follows:
The series names will be placed
in a legend box.
geos j rile j edit j chart: { mode
Sprockets
The
values will
be repre
sented by
markers.
The category names will be placed along the chart's grid.
^
Importing Data
57
Horizontal Selections in a Non-Scatter Chart
Here is how your selections will appear if you select cells horizontally:
Model A and Model B will
become series names.
IMof
Sprockets Uan
Selecting
these two rows
of grid cells...
Modefft
ModeiT
ModeFc"
Mod'eTD"
These labels win become
category names.
chart's title
S
?S
535
IZMCZiiillll?
[Apr
-222!
673
9861
'-5*
322
ll
"1992
...will select these two rows of values.
The chait will appear as follows:
qeos | file j edit j chart j mode
series
Sprockets
' names
58
Chapters
names
Values are represented
by markers.
The Grid and Scatter Charts
A data point in a scatter chart is represented by an X, Y value pair rather
than a category/value pair. A scatter chart contains no category labels;
instead, these are replaced by a set of X values from the text scrap data.
Here is how scatter charts differ from non-scatter charts:
Non-Scatter Charts
To select one data series for a
non-scatter chart, you need to
select one row or column of grid
cells.
In a non-scatter chart, the
category and Y value create
one data point
Y axis values
Sfifi£SISS£l
on X axis
on Y axis
Scatter Charts
In a scatter chart, both X
and Y create one data point
To select one data series for a
scatter chart, you need to select
two rows or columns.
'axis values
L
196!
on X axis
-232
on Y axis
X axis values
As with non-scatter charts, the direction of grid cells you select (i.e., vertical
or horizontal) will determine the placement of row and column labels in the
chart.
Here is how two data series will be read in a scatter chart:
Jan will head the first data series. Feb will be deleted.
the chart's title
Mar will head the second data series. Apr will be deleted,
I
I
7770S0
values Y values
category
names will
be deleted.
In the example above, there are X,Y value pairs for each month.
Importing Data
59
Here is how the chart will appear:
geos j file j edit j chart j mode
series
Sprockets
1868
names
♦-••••V
Y value
♦
688
-288
-486
8
588
1666
1566
2868
2588-
Here is the 190/-232 data point from the Jan series.
X values
You will note that the category names Model A-Model D were deleted to
make room for the X values from each of the two data series. The series
names Feb and Apr were also deleted. Their corresponding values were
combined with the values under Jan and Mar as the Y axis values.
60
Chapter 5
^
Selecting Data with the Data Mode
Grid
Once you know how Data Mode works, the actual grid cell selections are
easy to make. The following procedures describe how to use the grid for
non-scatter charts, the default grid cell selections resulting from a non-
scatter chart, and how to use the grid for scatter charts.
Using the Gridfor Non-Scatter Charts
If you plan to select specific data series for area, bar, column, point, line,
pie, or unibar charts, use the following procedure. Note that pie and unibar
charts accept only one data series at a time.
To select grid cells for a non-scatter chart:
1:
Move the pointer so that it is positioned over the first cell of the row or
column you wish to select
2:
Click, and while holding the input
JhesQ ^ ^
device button down, drag the
selected. They
pointer either horizontally or
set the standard
vertically across the row or column
f°r the next
of cells. The cells will become
series'
highlighted as you go along.
HINT If you accidentally move the pointer in the wrong direction, or
if you move the pointer too quickly, just hold down the input device
button and move the pointer back to the correct cell. Resume your
selections. You can also undo your selections by clicking on the Clear
icon.
3:
Release the input device button when the cells you need are high
lighted. You have just selected the first data series.
NOTE If desired, you now can chart the data series by clicking on the
Chart icon or selecting chart mode from the mode menu. Go to Step
4 if you wish to select the next data series.
4:
The next data series must be in the
clicking once on
same cell formation as the first To this row will select
select the second data series, click
these ce//s-
^^^^
^^^*
anywhere on the row or column you plan to use.
Importing Data
61
*:*:*:*:«««««*:*:ro^
geoChart will automatically select the proper cell formation.
5:
To select the third and fourth series, click anywhere on the appropriate
row or column.
6:
To chart the data series you selected, click on the Chart icon or select
chart mode from the mode menu. Your selections will be charted and
Chart Mode will be activated. From there, you can change the chart's
appearance, if desired.
The Default Grid Cell Selections
If no grid cells are selected, by default geoChart will chart the first four
columns of 20 values in the grid as the chart's four data series. The chart
will be a non-scatter chart. The source document's row labels will be
designated as category names. The four column labels will be read as series
names.
To select grid cells by default:
1:
Make sure the grid has no cells highlighted.
NOTE You can deselect grid cells by clicking on the Clear icon.
2:
Click on the Chart icon or select chart mode from the mode menu.
The first four columns of 20 values will be charted. Chart Mode will
be activated.
Using the Gridfor Scatter Charts
In a scatter chart, one data series is represented by two rows or columns of
grid cell selections. The following procedures describe how to create a
scatter chart with two to four data series (and immediately place the data in
a scatter chart) and how to create a scatter chart from Chart Mode. If you
plan to chart only one data series, create the scatter chart from Chart Mode.
To create a scatter chart immediately from Data Mode:
1:
Move the pointer so that it is positioned over the first cell of the row or
column you wish to select
2:
Click, and while holding the input device button down,
drag the pointer either horizontally or vertically. The
cells will be highlighted as you go along.
62
Chapter 5
x axis values
HINT If you accidentally move the pointer in the wrong direction, or
if you move the pointer too quickly, just hold down the input device
button and move the pointer back to the correct cell. Resume your
selections. You can also cancel your selections by clicking on the
Clear icon.
3:
Release the input device button when the cells you need are high
lighted. You have just selected the X axis values of the first data series.
4:
To select the Y axis values, click on any cell
in the appropriate rows or columns.
5:
To select the next data series, click on any
X axis values
Y axis values
cell in the appropriate row or column.
6:
Click on a fifth row or column, even if you only want two data series
for the scatter chart The following dialog box will appear:
Too mont| series.
Do you want a scatter plot?
7:
Click OK. You will be returned to Data Mode.
8:
If desired, resume your selections until eight rows or columns (i.e., four
scatter chart data series) are selected.
9:
When finished, click on the Chart icon or select chart mode from the
mode menu. The data will be immediately charted in a scatter chart
when Chart Mode is activated.
Importing Data
63
To create a scatter chartfrom Chart Mode:
1:
While in Data Mode, select the rows or columns of grid cells you wish
to plot.
2:
Exit Data Mode by clicking on the Chart icon or selecting chart mode
from the mode menu. The data will be charted in a column chart
3:
Select scatter point or scatter line from the chart menu. The data
series will be placed in a scatter chart.
64
Chapters
Formatting Charts
There are a variety of ways you can change a chart's appearance. This
chapter describes how you can select a chart type, edit text, change the
patterns of markers, change the drawing modes in area charts, change the
range of axis values, change the number formats, and change the back
ground grid of a chart
Unfamiliar terms are defined in Appendix A: Glossary (page 94). The
command menu options are summarized in Appendix B: Menu Listing
(98). Error messages are explained in Appendix D: Error Messages (106).
Formatting Charts
65
Selecting a Chart Type
The types of charts you can select are area, bar, column, pie, point, line,
scatter (either point or line), and unibar. Select a chart type by clicking on
its name listed in the chart menu. Once you open the chart menu, the
currently selected chart type will appear with an asterisk (*) next to its
name.
Selecting Area, Bar, Column, Point, and Line Charts
Use area, bar, column, point, and line charts to chart more than one series at
a time and to display the category names in a chart
The formats for these chart types are as follows:
column
point
NOTE For illustrations of actual charts, see Appendix C: Chart
Samples, page 100.
To select among the area, bar, column, point, or line charts:
1:
Make sure you are in Chart Mode.
NOTE To enter Chart Mode, select chart mode from the mode menu.
2:
Open the chart menu and select from area, bar, column, point, or
line. geoChart will convert the selected data series to the chart type
you select
Selecting Pie and Unibar Charts
In pie and unibar charts, data values are represented as a fraction of the total
value of a selected data series. Pie and unibar charts do not accept negative
values.
66
Chapter 6
With pie and unibar charts, you can chart only one data series at a time. (A
dialog box will enable you to select which set.) However, you can set up
the original charting data so that you can compare data series. To do so, see
"Setting Up Charting Information to Compare Data Series in a Pie or
Unibar Chart" on page 68.
The formats for pie and unibar charts are as follows:
unibar
NOTE For illustrations of actual charts, see Appendix C: Chart Samples,
page 100.
To select a pie or a unibar chart:
1:
Make sure you are in Chart Mode.
NOTE To enter Chart Mode, select chart mode from the mode menu.
2:
Open the chart menu and click on either pie or unibar.
If the current charting data contains more than one series, a dialog box will
enable you to specify which series you would like to chart, as in the
following example:
Hhich series would you like to chart?
Jan is
selected.
0 Jcin
DFeb
□ Mar
□ Apr
To continue, click on the box representing the series you would like to
chart, then click OK. Cancel will reverse the operation and return you to
the main Chart Mode screen.
Formatting Charts
67
««
Category Names
If the text scrap data contains category names,
Model
Model
Model
Model
they will appear in a legend box on the right side
of the screen, as in the example at the right.
Percentage Values
A
B
C
D
Percentage values of the different categories are
automatically included in the pie or unibar chart Should you wish to
remove them from the chart, you can do so by referring to "Changing Text
for All Charts," page 71. You cannot have negative values in a pie or
unibar chart.
Unibar Charts with Many Percentages
Normally the percentages will line up with each corresponding marker.
However, if the values are small, the markers will be too narrow for the
corresponding percentages to line up exactly with each marker. Instead,
they will be stacked in the order that the markers appear.
Here the markers are
|||||||
large enough to 1|||||1 50 £
Here they are
correspond with their
not.
percentages.
Setting Up Charting Information to Compare Data Series in a Pie or
Unibar Chart
You can only chart one data series at a time in a pie or unibar chart. You
can, however, chart totals from the data series. All you need to do is
include a Totals column (or row) in the original charting data.
For example, suppose the original charting data appears as follows:
68
Sales
Smith
Jones
1
1
2
2
Johnson
3
3
Chapter 6
Model A
Model B
Add the Totals column as follows:
Sales
Model A
Model B
Smith
1
1
Totals
2
Jones
Johnson
2
3
2
3
4
6
You can also include a Totals row, if desired:
Sales
Smith
Model A
1
Model B
1
2
Jones
Johnson
2
2
4
3
3
Totals B
6
6
Totals A
Copy the new text scrap into geoChart When you use a pie or unibar chart,
select either Totals A or Totals B as the data series.
Selecting Scatter Point and Scatter Line Charts
As explained in Chapter 5 under "The Grid and Scatter Charts," page 59,
selecting a scatter chart will delete category names and half of the series
names from the charted data.
To retrieve the lost labels (if you
wish to use a different chart type,
for example), you can enter Data
Mode and reselect a new series
(refer to "Selecting Data with the
A scatter chart will eliminate these labels.
Sprockets Uan
jFeb
LModeilf'1
1965
^32
Model B
788!
988
Data Mode Grid" on page 61). Another method of retrieving the labels is to
paste the text scrap into the document when another chart type is displayed.
There are two ways to select a scatter chart. In Data Mode, if you select at
least two data series you can immediately plot the data in a scatter chart.
(The procedure for doing so is described under "Using the Grid for Scatter
Charts" on page 62.) The other method, which enables you to place one
data series in a scatter chart, is to select the scatter chart option from the
chart menu. This procedure is described on the next page.
Formatting Charts
69
To select a scatter chart:
1:
Make sure you are in Chart Mode.
NOTE To enter Chart Mode, select chart mode from the mode menu.
2:
Select scatter from the chart menu. A submenu listing point and line
will appear.
NOTE The point and line options refer to chart styles. For actual
illustrations of charts, see Appendix C: Chart Samples (page 100).
3:
4:
Click on either point or line.
A dialog box saying "Scatter plot will destroy old labels" will appear.
Click OK to continue or Cancel to reverse the operation.
NOTE The "Scatter plot will destroy old labels" dialog box refers to
the category and series names in the current text scrap data. Here is
how the chart's labels will be affected:
The series name Jan will go
in the chart.
The chart's title, Sprockets,
will go in the chart.
I
fJcin
The category
names will be
9 9^m9 9 9%0%J
VW999
mf\4
1
■
•
m
■
*■
deleted from the I Inodel B
chart.
70
Chapter 6
iFeb
988
The series name Feb
will be deleted from
the chart.
777© values will go in the chart.
Editing Text
You can change the text in any type of chart in a variety of ways: font,
point size, style, whether the text is displayed on the screen, and the
contents of the text itself. The text you place in a chart will be placed into
designated areas called text blocks. The text within each text block is
referred to as a text string.
Maximum Characters Per Text String
The maximum number of characters for the chart's title is 39. All other text
strings may contain up to IS characters.
Maximum Point Size
The largest point size available is 24. Note that geoChart does not support
megafonts.
Changing Textfor All Charts
If you change the text style for a chart's labels, the same style will apply if
you change to a different chart type. Note that adding more text to a chart
will cause the actual plotting area (i.e., the grid and its markers) to decrease
in size to accommodate the additional text.
To change text:
1:
Make sure you are in Chart Mode.
NOTE To enter Chart Mode, select chart mode from the mode menu.
2:
Select change text from the edit menu (or press [fr]|T"|).
Formatting Charts
71
:•:•>:•:•:♦:•:•:•:•:•:•:•:•:•:•:•:•:•:•:•:•:
3:
A dialog box representing the chart type will appear. It will also
contain rectangular regions representing areas where text can be added.
For example, if the chart were a column chart, the dialog box would
appear as follows:
The empty
rectangles
represent areas
where you can
add text
4:
Click on the rectangular region representing the text block you wish to
change. Depending on the current chart and the particular text block
you choose, the following dialog box will appear:
Pointsize |j|
9
Show
5:
Click on the options in the dialog box to make the changes in text as
needed:
•
Font Click on the scrolling arrows on either side of the window to
cycle through the list of font files you placed on the work disk. To
select a particular font, make sure its name appears in the Font
window.
•
Pointsize Click on the scrolling arrows on either side of the
window to cycle through the list of point sizes for the font dis
played in the Font window. To select a particular point size, make
sure the correct size is displayed in the Pointsize window.
72
Chapter 6
x<w<*K<tt<*:<<*>>>>>>^^^
Show Click on the Show option to display the text in the chart.
(An X inside the Show box will display the text.)
Percentages This option will appear if the chart is a pie or a
unibar and if you had selected the
legend text block. To remove the
^ Shoiu
Eg] Percentages
percentages displayed around the
1*1 Model ft
pie or unibar, click on this option to
deselect the Percentages option
(the X will be removed from the Percentages box).
Stagger This option will appear if you selected category names in
area, bar, column, point, or line charts. Clicking on this option will
stagger text, as in die following example:
Show
Stagger
1*1 Model ft
Click here...
Model ft
Model C
Model B
Model D
...to stagger the text.
The text will be staggered there is an X inside the Stagger box.
Styles The available styles are bold, outline, underline, italics, and
reverse. Click on any combination you wish.
•
Text Window The existing text is displayed in the lower window
in the dialog box. If you have more than one line of text, display
the next line by clicking on the scrolling arrows on either side of
the window. To change text, press IINST/DELl to backspace over
the existing text, then type in the new text.
6:
When you have selected from the options in Step 5, click OK or press
IRETURNI. The screen will redraw itself and reflect your changes.
x-x*x-x*x*x*x
Formatting Charts
73
Adding Text to a Chart
Some charts initially will not display all possible text block areas. If you
wish to add more text to a chart, you can do so easily.
To add a text block to a chart:
1:
Make sure you are in Chart Mode.
NOTE To enter Chart Mode, select chart mode from the mode menu.
2:
Select change text from the edit menu (or press [BE).
3:
When the dialog box displaying a map of possible text blocks appears,
click on the text block region where you wish to add text
For example,
if you wish to
add a sub
head to the
category
names, dick
here.
4:
The next dialog box will display the options described under Step 5 of
"Changing Text for All Charts" on page 71. Type in the text and click
on the options you need. Make sure that the Show option is selected.
(An X will appear inside the Show box.)
5:
After you have completed the options in Step 4, click OK or press
IRETURNI. The chart will redraw and the text you added will appear in
the chart.
74
Chapter 6
^
Changing the Patterns of Markers
markers in
a column
chart
The markers in a chart appear in a
variety of patterns. You can change the
pattern of a marker for any type of chart
except the pie and unibar charts. If you
wish to change the patterns of markers
for area charts, refer to "Changing
Drawing Modes in Area Charts," page
77.
To change the pattern of markers in area, bar, and
column charts:
1:
Make sure you are in Chart Mode.
NOTE To enter Chart Mode, select chart mode from the mode menu.
2:
Select change marker from the edit menu (or select ffrlfMl).
3:
A dialog box with windows representing the patterns in each marker
will appear. The series name will appear next to each window:
Jan
niiiiiiiiiiin Feb
scrolling arrow -f-r+ kNNSM ♦ I Apr
To cycle through the available patterns for a marker, click on the
scrolling arrows on either side of the marker's window. When you find
a suitable pattern, make sure it is displayed in the window.
4:
After you have made your pattern selections, click OK. The screen
will redraw and the new patterns will appear in the markers.
Formatting Charts
75
Marker Patterns for Area, Bar, or Column Charts
The available patterns for markers are as follows:
Choose
from 32
different
patterns.
To change the type of markers in point, line, and scatter
charts:
1:
Make sure you are in Chart Mode.
NOTE To enter Chart Mode, select chart mode from the mode menu.
2:
3:
Select change marker from the edit menu (or press [C*HM1).
A dialog box with possible marker types will appear for each series
name:
Choose from
4 types
of markers
for point, line,
or scatter charts.
The currently selected marker type will have a box around it. To select
a different marker type, click on the type you want It will become
enclosed in a box.
4:
After you have made the selections you want, click OK. The screen
will redraw and the new markers will appear on the grid.
76
Chapter 6
Changing Drawing Modes in Area
Charts
In area charts, the drawing mode is transparent by default. If desired, you
can vary the drawing mode to either transparent or opaque. Here is an area
chart drawn in transparent mode:
qeos j file j edit j chart j mode |
TurboNidq
Model A
Model B
Model C
Model D
And here is an area chart drawn in opaque mode:
qeos j file j edit j chart j mode |
TurboWidq
Model A
Model B
Model C
Model D
Formatting Charts
77
:*x<tt*x*w^^
X'X*X*X*X*X*X-X*X'X
X*X*X*X*X*X*X*X
To change the drawing mode in an area chart:
1:
Make sure you are in Chart Mode, and that the chart is an area chart.
NOTE To enter Chart Mode, select chart mode from the mode menu.
The chart can be redrawn as an area chart by selecting area from the
chart menu.
2:
Select change marker from the edit menu (or press Ffr1[Mi).
3:
The following dialog box will appear:
scrolling arrow
-4+l==l S Jan
!♦!
TjFeb
4*1 Mar
drawing mode
selection window
I+IXXV1 + |
-4 transparent
Apr
jdrauu
mode
1
OK
1
To change the drawing mode, click on the drawing mode selection
window. The name will change to either transparent or opaque.
If desired, cycle through the available patterns by clicking on the
scrolling arrows on either side of each pattern selection window.
4:
After you have made the selections you need, click OK. The screen
will be redrawn and reflect the changes you made.
Hidden Markers in an Opaque Area Chart
If an opaque marker hides another marker, you can bring the hidden marker
to the foreground. All you need to do is use the grid in Data Mode to
reselect the data series in a different order.
Whenever you select data series in the Data Mode grid, the first data series
you select will be drawn first when you enter Chart Mode. In an opaque
area chart, the first data series be drawn in the background. The next data
series will be drawn on top of the first, and so on. To bring a hidden marker
to the foreground, go to Data Mode and select the hidden marker's corre
sponding data series last.
78
Chapter 6
Changing the Axis Range
The values listed next to the chart's grid
are automatically calculated by geo-
Chart. In other words, you need not
enter these values in the original source
document. The minimum and maxi
You can increase
the maximum range
an additional 2600.
mum values by which you can increase
the range depend on how large the
current range of values is.
Here the
range is 2600.
The values you enter may be slightly
different from the values that appear in
1686
1488
1288
1888
888
688
488
288
8
the revised chart. This is because a
change in range may necessitate a
change in interval value.
2288
2900
You can increase
the minimum range
-288
ah additional 2600.
If you change the Y axis range for area, column, point, or line charts, the
change will be valid for all of those charts.
To change the values on the axes for all charts except scatter
charts:
1:
Make sure you are in Chart Mode.
NOTE To enter Chart Mode, select chart mode from the mode menu.
2:
Select change range from the edit menu (or press ® HD).
3:
The following dialog box will appear:
V Axis:
L
OK
Min
1*1 -466
Itl
Max
1*1
Itl
J
2266
1 Cancel 1
Formatting Charts
79
♦x*x*x*x*x*x*x-x*x*x
You can change the minimum and maximum values for the Y axis. To
cycle through the available values, click on the scrolling arrows on
either side of the Min and Max windows.
4:
After you have made the necessary changes, click on OK. The screen
will be redrawn and the new axis range will be displayed.
To change the valuesfor scatter charts:
1:
Make sure you are in Chart Mode.
NOTE To enter Chart Mode, select chart mode from the mode menu.
2:
Select change range from the edit menu (or press ifrifRl).
3:
The following dialog box will appear:
V Axis:
X Axis:
OK
l+l -369
Max l+l 900
Min l+l -1999
Max l+l 4000
Itl
Min
1
Itl
Itl
I Cancel I
You can change the minimum and maximum values for both X and Y
axes. To cycle through the available values, click on the scrolling
arrows on either side of the Min and Max windows.
4:
After you have made the necessary changes, click on OK. The screen
will be redrawn and reflect the changes you made.
80
Chapter 6
Changing Number Formats
You can use the following formats for the axis range values in your charts:
general
0
0.0
0.00
0.000
0.0000
#,##0
#,##0.00
$#,##0;($#,##0)
$#,##0.00;($#,##0.00)
0%
0.00%
0.00E+00
0.00000000000E+00
If desired, you can use one format for the X range of values and another
format for the Y range of values in scatter charts.
To change the numberformats in area, bar, column, point, and
line charts:
1:
Make sure you are in Chart Mode.
NOTE To enter Chart Mode, select chart mode from the mode menu.
2:
Select change format from the edit menu (or press ifrifFi).
3:
The following dialog box will appear:
Format
The general option is
the currently selected
format.
scrolling arrows
vXC^^
Formatting Charts
81
Click on the scrolling arrows until you find the format you wish to use.
4:
Click on the format you need, then click OK. The screen will be
redrawn and reflect the changes you made.
To change the numberformats for scatter charts:
1:
Make sure you are in Chart Mode.
NOTE To enter Chart Mode, select chart mode from the mode menu.
2:
Select change format from the edit menu (or press [frll~F"h.
3:
The following dialog box will appear:
| Format
scrolling
axis options
arrows
Click on the scrolling arrows until you find the format you wish to use.
4:
Select either or both of the X and Y Axis options. An X inside the box
will select the option. If the box is hollow, the format you select will
not apply to its axis option. For example, if you wish to change the X
axis but not the Y axis, make sure the X Axis box has an X inside it and
the Y Axis box is hollow.
5:
Once you select a format and decide whether to change one or both of
the X and Y axes, click OK. The screen will be redrawn and reflect the
changes you made.
82
Chapter 6
^
Changing the Background Grid
You can change the background grid pattern to any of the following styles:
dotted lines
solid lines
no lines
To change the background grid:
1:
Make sure you are in Chart Mode.
NOTE To enter Chart Mode, select chart mode from the mode menu.
2:
Select change grid from the edit menu (or press [frl[G|).
3:
The following dialog box will appear:
Here is the
current pattern.
The dialog box will display the current pattern. To view the other two
pattern styles, click on the current pattern in the dialog box. The next
pattern style will be displayed.
4:
When you find a pattern you want, click OK. The screen will be
redrawn and display the new grid pattern.
♦
Formatting Charts
83
:«««««<<<♦:•:•:•:•:•:•:•:•:•:•:•:•:•:♦:•:•:•:•:•:
84
Chapter 6
File Management
This chapter describes some basic file management features found in
geoChart: how to copy a chart to another document, ways you can save or
reverse the changes you make to a chart, how to rename a chart, how to
print a chart, and how to exit geoChart.
Unfamiliar terms are defined in Appendix A: Glossary (page 94). The
command menu options are summarized in Appendix B: Menu Listing
(page 98). Error messages are explained in Appendix D: Error Messages
(page 106).
File Management
85
x*x*wtttt*:*x«^^^
Copying a geoChart Document
Elsewhere
If desired, you can copy your chart to a photo scrap so that
you can paste it in another GEOS application document. It is
Phot* swap
important to note that some GEOS applications only accept
photo scraps of a certain size. In order to paste your chart into these
applications, geoChart will condense the chart's dimensions. While still in
geoChart, you will be able to view the condensed version of the chart, so
that you can make any necessary formatting changes right away.
Even though the photo scraps you create in geoChart are for different types
of applications, you cannot have more than one photo scrap per disk. For
example, if you copy a chart into a photo scrap for use with geoPaint, then
copy another chart into a photo scrap for use with geoWrite, the geoWrite
version will overwrite the geoPaint photo scrap. If you wish to store more
than one photo scrap on a work disk, you can do so by copying each photo
scrap to a photo album. Photo albums are created by using the Photo
Manager desk accessory. The Photo Manager is found in the GEOS, GEOS
128, and GEOS 2.0 packages.
To copy a chart into another document:
1:
Make sure you are in Chart Mode.
NOTE To enter Chart Mode, select chart mode from the mode menu.
2:
3:
Select copy from the edit menu.
The copy command will display the following menu options: full
screen, to geoWrite, and to geoPaint. Select one:
•
full screen
will save the chart to a regular, full sized photo scrap.
Since the chart will not be condensed, it will be saved to a photo
scrap right away in the normal manner that photo scraps are
created. Select this option if you wish to paste the chart into a
geoPublish document, for example.
86
Chapter 7
•
to geoWrite will condense the chart so that it will fit into a
geoWrite document. A window containing the chart as it would
appear in a geoWrite document will be displayed over the geo-
Chart document At this point, you can check the chart's appear
ance, making note of any changes you may need to make. For
example, a condensed chart's labels may necessitate a change in
the labels' point sizes. To exit the window and save the chart to a
photo scrap, click OK. You will be returned to Chart Mode. If
needed, you can make any changes to the chart.
•
togeoPaint will condense the chart so that it will fit into a
geoPaint document. A window containing the chart as it would
appear in a geoPaint document will be displayed over the geoChart
document. At this point, you can check the chart's appearance,
making note of any changes you may need to make. For example,
a condensed chart's labels may necessitate a change in the labels'
point sizes. To exit the window and save the chart to a photo
scrap, click OK. You will be returned to Chart Mode. If needed,
you can make any changes to the chart.
4:
Copy the photo scrap to the disk containing the destination document
Bar Charts with Overlapping Labels
If a bar chart with labels is copied into a geoWrite or geoPaint document,
the labels may overlap one another partially, particularly if you have a large
number of markers in the chart To avoid the problem, try using a smaller
font and point size for the labels.
File Management
87
«*>x*:*:*x«^^^
Saving or Reversing Changes
geoChart documents can be managed much the same way as other GEOS
documents. This section describes how to save (update) your document to
disk whenever you need, how to undo any changes made since the last time
you saved the document to disk (recover), and how to rename a document.
Saving Your Work to Disk
It is recommended that you save your work to disk every ten minutes.
Saving your work is a safeguard against an unexpected power outage.
To save your work to disk:
1:
Make sure you are in Chart Mode.
NOTE To enter Chart Mode, select chart mode from the mode menu.
2:
Select update from the file menu.
Recovering Your Document
If you need to reverse the changes you made since the last time your work
was updated, you can do so easily.
To recover your work:
1:
Make sure you are in Chart Mode.
NOTE To enter Chart Mode, select chart mode from the mode menu.
2:
Select recover from the file menu.
IMPORTANT You cannot reverse a recover procedure.
88
Chapter 7
Renaming Your Document
You can rename a chart in either Data Mode or Chart Mode.
To rename a document:
1:
Select rename from the file menu.
2:
A dialog box will ask you to "Please enter new filename." Type in a
new name and press iRETURNl.
NOTE To cancel the procedure, either press IRETURNl without
changing the current name, or click Cancel.
File Management
89
Printing Your Document
Before you try to print a chart, make sure that your printer is properly
connected, the correct printer driver is on the work disk containing the geo-
Chart application, and the correct printer driver has been selected as the
default (active) printer driver. To set up your printer, refer to pages 2-24
and 2-28 of the GEOS User's Manual. If you are using GEOS 2.0, refer to
page 17 of the GEOS 2.0 User's Manual.
NOTE geoChart is not intended for use with the Paint Drivers application.
To print a chart:
1:
Make sure you are in Chart Mode.
NOTE To enter Chart Mode, select chart mode from the mode menu.
2:
90
Select print from the file menu.
Chapter 7
Exiting geoChart
Each time you exit a geoChart document, the changes you made in the
current editing session will be saved to disk. When you exit a geoChart
document, you have the option of opening another geoChart document, or
exiting directly to the deskTop.
To go to another geoChart document:
1:
Select close from the file menu.
2:
A dialog box will give you three options: Create new document,
Open existing document, and Quit to deskTop. Select one.
NOTE If you select either Create or Open, you will have the option of
creating or opening the document on a disk in the other disk drive.
To go directly to the deskTop:
•
Select quit from the file menu.
File Management
91
92
Chapter 7
Appendices
This chapter contains the following appendices:
•
Appendix A: Glossary
•
Appendix B: Menu Listing
Appendix C: Chart Samples
•
Appendix D: Error Messages
•
Appendix E: GEOSDemo
Appendices
93
Appendix A: Glossary
Terms in italics are defined elsewhere in this glossary.
axis values
In a geoChart document, the range of values that
indicate units of measurement for the chart's
values. Axis values are created automatically by
geoChart and need not be entered in the source
document (i.e., geoCalc, geoWrite, geoFile, or
tins Note Pad).
background grid
In Chart Mode, the guide lines in a chart that
enable you to view the exact location of a value
in relation to its corresponding labels. In
geoChart, you can change the background grid to
one of three styles.
category name
A name assigned to the head of a group of
values. A category name represents the data that
is compared with a group of values. By default,
when first placed in a geoChart document, the
category names will appear alongside the chart's
grid. In pie or unibar charts, the category names
are placed in a legend box. See also chart title,
data series, label, series name, and value.
Chart Mode
The mode in geoChart that enables you to import
a text scrap and change the appearance of a
chart. See also Data Mode.
chart title
The name assigned to a chart. In geoCalc,
geoWrite, geoFile, or the Note Pad, the chart title
is entered in the upper left corner of the charting
data region.
charting data
In geoCalc, geoWrite, geoFile, or the Note Pad,
the data you create to be used in a geoChart
document. Charting data is composed of values,
category names, series names, and a chart title.
If desired, you need not include the category
94
Chapter 8
names, series names, or the chart title in the
original document. See also label.
Data Mode
The mode in geoChart that enables you to select
one to four data series. See also Chart Mode.
data point
One value in a set of values in the charting data.
In a non-scatter chart, a data point is the inter
section of a category name on the X axis and a
value on the Y axis. In a scatter chart, a data
point is the intersection of an X axis value and a
Y axis value. A data point is one point in a data
series.
data series
A set of data containing the series name(s)9
category name(s), and values. A data series is
selected in Data Mode.
font
Typeface used to create text. (The typeface on
this page is Times Roman.)
geoCalc
A GEOS application that enables you to perform
advanced calculations using a spreadsheet.
geoFile
A GEOS application that enables you to design
and store data in a database.
geoWrite
A GEOS application that is used to create word
processing documents.
grid
In Data Mode, the icon resembling a rectangle
composed of small squares. The grid represents
the charting data in the current text scrap. Its
size is determined by the size of its correspond
ing text scrap. It is used to select one to four
data series.
label
A chart title, category name, or series name. In
geoCalc, geoWrite, geoFile, or the Note Pad, the
labels are always entered as non-numeric text. If
desired, labels can be changed to numeric text
:*«*
Appendices
95
after the text scrap has been placed in a geoChart
document. It is not necessary to include labels in
the original source document.
legend
In a chart, the box listing each series name and
its corresponding marker.
marker
no
In a chart, the segments that represent the values
in a data series. Markers can appear as points,
lines, or pattern-filled shapes.
+ ■
non-scatter chart
Any chart used to plot data in value-category
pairs. See also scatter chart. Area, bar, column,
line, point, pie, and unibar charts are non-scatter
charts.
Note Pad
A desk accessory for creating charting data to be
imported into a geoChart document. The Note
Pad is also used to create memos.
photo scrap
In geoChart, a file containing a copy of a chart.
A photo scrap is used to transport data from one
document to another, even if the documents were
created with different applications. A photo
scrap is also used to transport a graphic from a
geoPaint document. See also text scrap.
plot
A chart "Plot" also refers to the action of
placing data into a chart.
scatter chart
A chart used to plot data in X, Y value pairs,
rather than category-value pairs. A scatter chart
will replace the category names with X values.
Use a scatter chart if you wish to plot values only
(i.e., with no category names). Scatter charts are
ideal for scientific and financial charts since you
can compare values only, rather than values with
categories. See also non-scatter chart.
See data series.
series
96
Chapter 8
x*x*x*xxxx*x»x*x
x*x*»x*x*x*:*:*x
X«X*X'X*X«X*X-X*X*X*X*X-X«
x*x*x*x-x*x-x*x
series name
A name assigned to the head of a series of
values. By default, when first placed into a
geoChart document, the series names will appear
in a legend. See also category name, data series,
label, and value.
source document
The document from which you import charting
data into a geoChart document. Source docu
ments are geoCalc, geoWrite, geoFile and the
Note Pad desk accessory.
text block
In a chart, an area reserved for text.
text scrap
A file containing text copied or moved from
geoCalc, geoWrite, geoFile, or the Note Pad. A
text scrap is used to transport text from one
document to another, even if the documents were
created with different applications. For example,
a text scrap is used to import charting data from
the source document into a geoChart document.
See also photo scrap.
text string
In a chart, the text in a text block.
tick mark
In a chart's grid, the small mark resembling a
zeal
horizontal line next to each axis value.
value
Numerical data used in a chart for comparisons.
In geoChart, values are represented by markers.
See also category name, data series, and series
name.
Xaxis
The horizontal direction of data.
Yaxis
The vertical direction of data.
x*x*x*x*x*x
Appendices
97
Appendix B: Menu Listing
The following menu listing includes keyboard shortcuts.
geos menu
geoChart info Displays copyright information and author of geoChart.
(To exit, press the input device button.)
photo mgr, text mgr, note pad, and other desk accessories, depending
on the desk accessories you have copied onto your application work
disk.
file menu
close Closes a document and enables you to create or open another
geoChart document.
update Saves changes to disk. Option is inactive while in Data Mode.
recover Reverses changes from last time a document was saved to
disk. Option is inactive while in Data Mode.
rename Enables you to change the name of a document
print Prints a document. Option is inactive while in Data Mode.
quit Closes a document and returns you to the deskTop.
edit menu
copy Copies a chart to a photo scrap. Displays the items full screen,
to geoWrite, and to geoPaint. Option is inactive while in Data Mode.
paste (IB |T|) Pastes a text scrap into the current chart, then opens
Data Mode. Option is inactive while in Data Mode.
change range (OS [R]) Enables you to change the axis values of a
chart. Option is inactive while in Data Mode and when a pie or unibar
chart is displayed.
change marker (O \M\) Enables you to change the pattern or style
used for the markers on the currently displayed chart. Option is
inactive in Data Mode, and for pie and unibar charts.
change text ([B QH) Enables you to add, change, or modify text in a
chart Option is inactive while in Data Mode.
change grid ([§ \G\) Enables you to change the display of the
background grid in a chart. Option is inactive while in Data Mode and
when a pie or unibar chart is displayed.
change format (IB LEI) Enables you to change the number format
Option is inactive while in Data Mode and when a pie or unibar chart is
displayed.
98
Chapter 8
chart menu
NOTE Refer to Appendix C: Chart Samples (page 100) for illustra
tions of the chart styles.
area Displays text scrap data in an area chart. Option is inactive while
in Data Mode.
bar Displays text scrap data in a bar chart. Option is inactive while in
Data Mode.
column Displays text scrap data in a column chart. Option is inactive
while in Data Mode.
pie Displays text scrap data in a pie chart. Option is inactive while in
Data Mode.
point Displays text scrap data in a point chart. Option is inactive
while in Data Mode.
line Displays text scrap data in a line chart. Option is inactive while
in Data Mode.
scatter Displays the items point and line. Enables you to place text
scrap data in either scatter point or scatter line chart. Option is inactive
while in Data Mode.
unibar Displays text scrap data in unibar chart. Option is inactive
while in Data Mode.
mode menu
chart mode Reads the selected data series in the Data Mode grid and
opens Chart Mode. Option is inactive while in Chart Mode.
data mode Opens Data Mode. Option is inaictive while in Data
Mode.
Appendices
99
ttro^^^
Appendix C: Chart Samples
Area Charts
Area charts will plot all four data series. These charts can be created on one
of two modes: transparent or opaque. Here is an area chart in transparent
mode:
geos | file 1 edit \ chart { mode
CDs
DUD Movies
E2 Videos
Books
Here is the same area chart in opaque mode:
geos j file j edit j chart j mode
100
Chapter 8
Bar Chart
Bar charts will plot all four data series.
geos j file
edit f chart
mode
Column Chart
Column charts will plot all four series in a data series selection.
:•>:•:•:«:•:•:•:•:•:•»:•:•:♦:•>:•:•:•:
Appendices
101
X
•^x•^^^x^•x«^^^x•^^^^^^^^^^^^^^;•:•^^:•^:•:•^^:•^^x•^^^^^:•^:•x•^:
Pie Chart
Use a pie chart to plot only one data series. A dialog box will enable you to
select which data series you would like to plot Pie charts do not accept
negative values.
qeos j file j edit j chart j mode |
Estimates
45.15s
14.2*
13.62
27.1*
Point Chart
Point charts will enable you to plot all four data series.
qeos j file j edit j chart j mode]
+ Books
Estimates
1888
Q....
588
■ Movies
d Videos
8
-588
-1888
-1588
-2888
-2588
Jcin
102
o CDs
Chapter 8
Feb
M<if
Apr
Line Chart
Line charts will enable you to plot all four data series.
geo* [ file j edit j chart j mode
+ Books
o CDs
■ Movies
a Videos
Scatter Charts
A scatter chart will eliminate the category labels (e.g., Jan, Feb, Mar, and
Apr in the line chart above) and replace these with the text scrap data's X
axis values. Note that the legend, which displays the chart's series labels,
will also be affected. In the scatter chart on the next page, the CDs series
has been combined with the Books series, and the Videos series has been
combined with the Movies series.
Appendices
103
Scatter charts have two styles: point and line. Here is a scatter line chart:
qeos j file [ edit j chart j mode
1089
980
800
700
.♦
600
500
j
r™Ti
I .........
300
-3000
I
1000
-2990
Here is a scatter line chart
qeos 1 file j edit { chart j mode
104
Chapter 8
*^^
x*x*x*x*x*x-x-x*x*x
Unibar Chart
As with pie charts, a unibar chart will plot one data series at a time. A
dialog box will enable you to select the series you would like to chart. A
unibar chart will not accept negative values.
geos | file j edit j chart j mode i|H
[lllllllllllllllllHM
1 Estim ate?
_._
■ Jan
Estimates
11 Feb
H Mar
M Apr
14.2*
■■
27.1*
13.6*
Appendices
105
Appendix D: Error Messages
All values are zero.
The data series values you are trying to place in a unibar or pie chart
are all zeros. Try using a different chart type if you wish to chart a data
series containing zero values only.
Bad format found in text scrap.
geoChart is unable to recognize the text scrap's format The charting
data you copied into the text scrap may have been incorrectly prepared.
You will need to exit geoChart and edit the charting data in the original
source document.
NOTE Refer to Chapter 3, •'Preparing a Text Scrap" (page 25) for how
to set up the charting data.
Cannot have negative values in unibar or pie charts.
•
The data series you tried to chart in a unibar or pie chart contains a
negative value. Try using a different chart type if you wish to chart
negative values.
Cannot install geoChart to this disk.
You tried to install geoChart on a work disk. As with all GEOS
applications, you can only install geoChart from its original application
disk. Close the current disk and install geoChart from its application
disk. After you have installed geoChart, copy the geoChart file to your
work disks.
Can't find printer driver.
Printer is inaccessible.
•
There is no printer driver on the work disk. If there is a printer driver
on the work disk, make sure that is has been selected as the default
printer driver. To select a printer driver, go to the deskTop and choose
select printer from the geos menu. A dialog box will display the
names of all the printer drivers on the disk. Click on the appropriate
printer driver, then click OK.
NOTE If you are using GEOS 1.3, refer to "Choosing a Printer Driver
& Printing," page 2-24, and "Selecting Your Printer as the Default
106
Chapter 8
Printer," page 2-28, of the GEOS User's Manual. If you are using
GEOS 2.0, see "Setting Up Your Printer," page 17, of the GEOS 2.0
User* s Manual.
Disk error reading text scrap.
There is a problem with the disk in that geoChart cannot read the text
scrap, or that the work disk does not contain a text scrap. Exit geo
Chart and make sure the text scrap has been copied to the work disk
containing the geoChart application.
Invalid label in text scrap.
•
The charting data in the text scrap contains a label in the region
reserved for values. You will need to exit geoChart and edit the
charting data you tried to import into geoChart
NOTE Refer to Chapter 3, "Preparing a Text Scrap" (page 25) for how
to set up the charting data.
Need at least 2 series for a scatter plot.
•
You tried to select a scatter chart when the current chart contains only
one series charted (i.e., one grid row or column in Data Mode). Click
OK to return to Chart Mode. Go to Data Mode and in the grid, select
at least two rows or columns of grid cells. A scatter chart will interpret
two grid row or column cell selections as one data series. After at least
two rows or columns of grid cells have been selected and charted, you
can use a scatter chart.
Not enough free space on disk for desk accessory.
•
Desk accessories require at least 10K bytes of memory on the current
work disk. If you wish to use the desk accessory, you will need to
delete files to make room.
Not enough space for chart.
•
The number of characters and the point size of a text string are too
large and leave no room for the chart area. Either edit the text string so
that it contains fewer characters, or use a smaller point size. You can
change the text in a chart by using the change text option in the edit
menu.
Appendices
107
Not enough values for area chart
Area charts require at least two data points in a data series. In Data
Mode, you will need to select more than one grid cell (since each cell
represents a data point value) if you wish to use an area chart.
Operation canceled due to disk error: missing or unformatted disk.
If the disk you are trying to open is formatted, then you may have
improperly inserted the disk into the disk drive. Click OK and re-insert
the disk, then try opening the disk again.
Pasting will destroy old data.
The text scrap you are about to paste into the geoChart document will
overwrite any data currently in the chart, including the generic chart
that appears when you first create a geoChart document Click OK to
paste the text scrap's charting data into the document, or click Cancel
to stop the operation and retain the current charting data.
Please insert a disk with deskTop V(#) or higher.
You tried to exit a document when there is no DESKTOP file on the
work disk. Remove the current disk from the disk drive and insert the
System disk, which contains the DESKTOP file. (If you are using
GEOS 2.0, make sure you insert the System disk you booted with.)
Click OK. You will be returned to the System deskTop. If you wish to
avoid this procedure in the future, copy the DESKTOP file to your
application work disks.
Printer is inaccessible.
•
See the instructions for the "Can't find printer driver" error message.
Range is too large.
The range of values you tried to chart is too big. The difference
between the largest value and the smallest value must be less than
lOe63. You will need to exit geoChart and edit the charting data you
tried to import into geoChart.
NOTE Refer to Chapter 3, "Preparing a Text Scrap" (page 25) for how
to set up the charting data.
Text scrap too big.
•
108
The charting data in the text scrap contains too many rows and col
umns. You will need to exit geoChart and edit the charting data you
tried to import into geoChart.
Chapter 8
NOTE Refer to Chapter 3, "Preparing a Text Scrap" (page 25) for how
to set up the charting data.
The file (name) is write protected and can't be deleted.
You can easily change a file's write protect status. In the dialog box,
click OK to return to the deskTop. Highlight the file's icon, then select
info from the file menu. A dialog box displaying basic information
about the file will appear. Look for the Write Protect option (it's
below the author's name). Click on the filled box next to Write
Protect. The box will become hollow, indicating that the file's write
protection has been removed. To exit the file info dialog box, click on
the close button in the top right corner. Now you can delete the file.
Too many columns in scrap.
The text scrap contains more than 50 columns of values. You will need
to exit geoChart and edit the charting data your tried to import into
geoChart
NOTE Refer to Chapter 3, "Preparing a Text Scrap" (page 25) for how
to set up the charting data.
Too many rows in scrap.
•
The text scrap contains more than 25 rows of values. You will need to
exit geoChart and edit the charting data you tried to import into
geoChart.
NOTE Refer to Chapter 3, ''Preparing a Text Scrap" (page 25) for how
to set up the charting data.
Too many series. Do you want a scatter plot?
•
In Data Mode, you tried to select more than four rows or columns of
grid cells. For a non-scatter chart, one row or column of selected grid
cells represents one data series. A scatter chart requires the selection of
two, not one, rows or columns of grid cells in order to specify one data
series. Therefore, you can select up to eight rows or columns of grid
cells (which represent four data series) to chart data for a scatter chart.
If you wish to use a scatter chart, click OK. You will be returned to
Data Mode so that you can resume your grid cell selections. When you
exit Data Mode, the data will be placed in a scatter chart. If you do not
wish to use a scatter chart, click Cancel. You will be returned to Data
Mode.
Appendices
109
^
NOTE For more information on scatter charts, refer to "The Grid and
Scatter Charts," page 59, "Using the Grid for Scatter Charts," page 62,
and "Selecting Scatter Point and Scatter Line Charts," page 69.
Too many values for bar chart
•
You have tried to place a text scrap containing too many values for a
bar chart to display. This is because the screen is smaller vertically
than it is horizontally. Therefore, charting data that fits in a column
chart may not necessarily fit in a bar chart. Try using another chart
type.
You have not pasted any data.
•
You have tried to enter Data Mode without having pasted any data into
the document. If a correctly prepared text scrap is on the current work
disk, you can paste the text scrap into the geoChart document by
selecting paste from geoChart's edit menu (or pressing [@ \T\).
NOTE Refer to Chapter 3, "Preparing a Text Scrap" (page 25) for how
to set up the charting data in a text scrap.
You will have to re-select data.
You have tried to select a desk accessory while in Data Mode. You
will be able to use the desk accessory; however, the selections you
made in the grid will be cleared. If you wish to go ahead and use the
desk accessory, click OK. When you exit the desk accessory, you will
need to re-select data in the grid. If you wish to keep the current grid
cell selections intact, click Cancel to return to Data Mode without
using the desk accessory.
110
Chapter 8
^
Appendix E: Demo Program
The GEOS demonstration program is provided on Side 2 of your geoChart
program disk. Use this demonstration program to get an introduction to
some of Berkeley Softworks' most popular programs, including GEOS 2.0.
Once you open the GEOS demonstration program, it will continue until it
completes its performance, then it will return you to the deskTop after
wards. You can interrupt the program at any time.
Ifyou wish to:
Do thefollowing:
Move to the next dialog box
Press the space bar.
Stop a screen
Continue after stopping
Hold down O and
Hold down [C*l and press [C].
Hold down [(5 and press \Z\.
Exit to the deskTop
To open the demonstration program:
1:
Boot GEOS.
NOTE If you are using a Commodore 128, boot GEOS in 64 mode.
2:
Remove the System disk from the disk drive.
3:
Insert Side 2 of the geoChart program disk into the disk drive. Activate
the disk by clicking on its disk drive icon.
4:
When the Demo deskTop appears, look for the GEOS
DEMO file icon.
5:
Double-click on the GEOS DEMO file icon to
open it.
file icon
CEOS DEMO
NOTE
Another method is to click once on the file icon so that it is
highlighted, then select open from the file menu.
The GEOS demonstration program will begin. Enjoy!
Appendices
111
112
Chapter 8
x*x«*x<*x*x*x-x*xx*x*x*x
Index
A
Chart Mode 12,53
background grid 83
appendices 93
area charts
changing axis values 79
chart size 8
chart title 9,26
diagram of placement 28
changing number formats 81
drawing modes 77
charts
hidden markers 78
copying to other documents 86
illustrated 100
printing 90
markers 75
(see also area, bar, column, line, pie,
selecting 66
point, scatter, & unibar charts)
staggering category names 73
axis values 13
Clear icon 11,55,61
column charts
changing 79
changing axis values 79
changing number values 81
changing number formats 81
description 79
illustrated 101
non-scatter 79
markers 75
scatter charts 80
selecting 66
staggering category names 73
command menu
B
description 52
background grid 13
changing pattern 83
backup disks 5
bar charts
changing axis values 79
italics 52
copy command 86
copying chart elsewhere 86
copying charts
full screen command 86
changing number formats 81
to geoPaint 87
illustrated 101
labels overlapping 87
markers 75
selecting 66
staggering category names 73
to geoWrite command 87
Create new document command 47
Customer Service (see "How to Get
Help")
D
category names 10, 27
diagram of placement 28
change format command 81, 82
change grid command 83
change marker command 75, 76, 78
change range command 79, 80
change text command 71,74
Chart icon 11,55, 61
chart menu 52
Data Mode 10
entering 54
icons 55
Data Mode screen 55
data point 26,56
non-scatter charts 56,59
scatter charts 59
data series 9,56
illustrated 21
Index
113
*x*x*x*x-x*x*x
illustrated in non-scatter 57,58
illustrated in scatter 59
tutorial 14
geoFile
Data Series dialog box 11,55
omitted data in text scrap 35
DESKTOP file 43
documents
text scrap preparation 34
geoPublish 86
entering 47
GEOS2.044
exiting 91
GEOS Demo program 111
printing 90
geoWrite
recovering 88, 89
omitted data in text scrap 33
saving 88
text scrap preparation 32
glossary 94
grid 11,55,56
E
edit menu 52
horizontal cell selections 58
F
vertical cell selections 57
size 56
file menu 52
grid cell selections
default 62
file menu options 98
non-scatter charts 61
Font option 72
scatter charts 62
fonts 44
full screen command 86
importing charting data (see Data Mode,
G
Generic Chart 52
geoCalc
omitted data in text scrap 31
text scrap preparation 30
geoChart
copying chart elsewhere 86
entering)
installation procedure 3
K
keyboard shortcut summary (see menu
listing)
creating new document 47
entering 47
L
exiting 91
labels 27
exiting to deskTop 50
diagram of placement 28
general procedure 45
interpreted by geoChart 27
how it works 8
numeric 27
installing 3
legend, adding 74
opening existing document 48
line charts
opening existing document from
changing axis values 79
deskTop 50
changing number formats 81
printing documents 90
illustrated 103
renaming documents 89
markers 76
reversing changes 88
selecting 66
saving changes 88
staggering category names 73
system requirements 2
:*ra«'^
M
point charts
markers 12
changing axis values 79
changing 75
changing number formats 81
if hidden in area charts 78
illustrated 102
patterns of 75
markers 76
megafonts 44
selecting 66
staggering category names 73
menu listing 98
Pointsize option 72
print command 90
N
non-scatter charts
printing documents 90
data point 56
data series 56
grid cell selections 56
Q
Quit to deskTop command 50
grid procedure 61
placement of data, illustrated 70
R
Note Pad desk accessory
recover command 88
adding page 39
rename command 89
changing entries 39
deleting contents 39
deleting page 39
moving to page 39
omitted data in text scrap 38
s
saving documents to disk 88
scatter charts
changing axis values 80
text scrap preparation 37
changing number formats 82
number formats 81
creating from Chart Mode 64
creating from Data Mode 62
0
data point 59
opaque mode 77
data series 59
Open existing document command 48
eliminated labels 59, 69
grid cell selections 59
P
grid procedure 62
Paint Drivers 90
illustrated 60,103,104
paste command 54
markers 76
selecting 69
patterns
illustrated 76
series names 9,27
diagram of placement 28
percentage values 68
Percentages display option 73
Show (text) option 73
Photo Manager 43
source document (see text scraps)
pie charts
Stagger option 73
changing axis values 79
Styles option 73
comparing data series 68
illustrated 102
percentages display 73
selecting 66
T
text 12
adding 74
Index
115
X«X-X'X*X*X«X*^^^^
editing 71
max characters 71
max point size 71
text block 71
Text Manager 43
text scraps
components of data 9
geoCalc preparation of 30
geoFile preparation of 34
geoWrite preparation of 32
maximum size 29
Note Pad preparation of 37
pasting 54
set-up of data 26
text string 71
to geoPaint command 87
to geoWrite command 87
transparent mode 77
tutorial 14
U
unibar charts
changing axis values 79
comparing data series 68
illustrated 105
percentages display 73
selecting 66
U
update command 88
V
values 9,28
blank 28
diagram of placement 28
W
work disks 42
general theory of 5
116
Index