1
Operating Manual anthos software version 1.23E manual version: 05/02 date: 06.05.2002 anthos labtec instruments Ges.m.b.H Lagerhausstraße 507 A-5071 Wals / Salzburg AUSTRIA Tel. +43-662-857220, Fax +43-662-857223 email: [email protected] homepage: www.anthos-labtec.com anthos ht1/ht2/ht3 Table of Contents TABLE OF CONTENTS.................................................................................. 2 INTRODUCTION ......................................................................................... 5 WARNINGS AND HAZARDS.......................................................................... 6 1 SPECIFICATION ACCORDING TO DIN 58960 PART 4 .................................. 7 1.1 1.2 1.3 General information regarding the absorption photometer............................... 7 Declaration of Conformity ........................................................................... 7 Metrological specification ............................................................................ 8 1.3.1 1.3.2 1.3.3 1.3.4 1.3.5 1.3.6 1.4 8 8 8 9 9 9 General technical data ..............................................................................10 1.4.1 1.4.2 1.4.3 1.4.4 1.4.5 1.4.6 1.5 1.6 1.7 1.8 Measuring system............................................................................................. Measuring process ............................................................................................ Definitions ....................................................................................................... Measuring range, specified according to DIN 58960 .............................................. Rated operating conditions ................................................................................ Limits of error and tolerance limits ..................................................................... Weight and Dimensions ....................................................................................10 Environmental influences..................................................................................10 Power supply ..................................................................................................10 Data connection ..............................................................................................10 Automation.....................................................................................................11 Supplementary equipment................................................................................11 Cleaning ..................................................................................................11 Photometry ..............................................................................................11 Scope of supply ........................................................................................12 Warning and directions ..............................................................................12 1.8.1 Environmental operating conditions ...................................................................12 1.9 Re-packing to prevent damage during transport ...........................................12 1.10 Description of operating elements ...............................................................13 2 3 WARRANTY......................................................................................... 16 START-UP AND SELF-TEST WITH ERROR MESSAGE AND SYSTEM SETUP.... 17 3.1 3.2 3.3 3.4 4 QUICK MEASUREMENTS WITHOUT TEST PROGRAMMING AND STORAGE (MONOCHROMATIC, BICHROMATIC AND MULTICHROMATIC MEASUREMENTS, KINETIC- AND SCAN MEASUREMENT) ................................................... 20 4.1 4.2 4.3 4.4 5 Printout of a self-test protocol ....................................................................17 Structure of the main menu .......................................................................18 Main menu display ....................................................................................18 System setup and input of a password.........................................................18 F1 F2 F3 F4 - NORMAL: monochromatic/bichromatic endpoint measurement .................20 MULTI: measurement with several wavelengths simultaneously ...............21 KINETIC: kinetic measurement ...........................................................21 SCAN: scan and agglutination measurements ........................................23 TEST DEFINITION - PROGRAMMING OF TESTS (EVALUATION MODES)....... 24 5.1 5.2 5.3 5.4 Programming a new application test ............................................................25 Test identification: naming, filter selection and range selection .......................25 Premeasurement functions - optional parameters for functions being performed prior to measurement ................................................................................26 Factor dilution & kinetic measurement - plate dilution factor and basic setting for kinetic measurements................................................................................27 5.4.1 5.5 Kinetic data reduction - Selection of data reduction method and parameters for screen graphics during kinetic measurement .................................................................28 Plate layout functions - Setting parameters for the validity of blanks, filling direction, replicates and control strips..........................................................30 operating manual 2 anthos ht1/ht2/ht3 5.5.1 5.6 Report & Evaluation: Setting printout format, relational measurement calculation and setting the basic data for quantitative evaluation ....................................32 5.6.1 5.6.2 5.6.3 5.7 Qualitative interpretation - Set to classify samples according to programmable threshold values .......................................................................................38 Cutoffs and ranges - Setting the tolerance values and naming the ranges...............39 5.8.1 Replicate elimination - Select the conditions for the automatic elimination of individual replicates .......................................................................................................40 Control validation - Condition to validate the mean value of standards, controls and blanks ............................................................................................................41 Control & test validation: Program to evaluate the control, standard and blank replicates and to automatically recognize and eliminate outliers......................39 5.8.2 5.9 Safeguarding the test in the test memory ....................................................42 EDITING, PRINTING AND CLEARING OF DEFINED TESTS.......................... 43 6.1 Edit Test - Changing a test already programmed...........................................43 6.1.1 6.2 6.3 6.4 7 Measurement Results ................................................................................46 Plate Layout .............................................................................................47 Quantitative displays .................................................................................47 7.3.1 7.3.2 Standard Curve ...............................................................................................47 Standard Data.................................................................................................48 7.6.1 7.6.2 7.6.3 Kinetic Raw Data .............................................................................................49 Graphics 8/12 .................................................................................................50 Zoomed Graphics ............................................................................................50 7.4 7.5 7.6 7.7 9 To copy a test .................................................................................................43 Print Test - Printout of all programmed test parameters.................................43 Dir - Printout of the entire test directory ......................................................44 Clear - Erasing individual tests or the entire test memory ..............................44 RUN TEST: MEASURING A PLATE WITH A PREPROGRAMMED TEST ............ 45 7.1 7.2 7.3 8 Standard points - definition of the concentration and OD-values of the individual standard points ...............................................................................................33 How to store a standard curve ..........................................................................34 Quantitative evaluation - Settings for quantitative evaluations such as curve calculations, coordinate scaling, extrapolation, etc...............................................35 5.7.1 5.8 6 Template setup - individual plate allocation with blanks, standards, controls and samples .........................................................................................................31 Quantitative Results ..................................................................................49 Qualitative Results ....................................................................................49 Kinetic results displays ..............................................................................49 Relational Results......................................................................................50 PLATES: PLATE MEMORY, RE-EVALUATION OF PLATES WITHOUT MEASURING, PRINTOUT OR VIEW OF MEASUREMENT AND EVALUATION DATA ................................................................................................ 51 ERROR MESSAGES .............................................................................. 53 9.1 9.2 Error messages in the display .....................................................................53 Error messages and warnings in the printout ................................................59 10 COMMUNICATION BETWEEN THE HT1/2/3 AND AN EXTERNAL COMPUTER . 61 10.1 10.2 10.3 10.4 Principles of the communication process ......................................................62 Command keys .........................................................................................63 Generation and transmission of checksum....................................................64 Description of commands ...........................................................................65 10.4.1 10.4.2 10.4.3 10.4.4 10.4.5 10.4.6 10.4.7 10.4.8 10.4.9 "V" - transmission of software version number ....................................................65 "F" - transmission of filters installed in setup ......................................................65 "N" - normal measurement with up to 8 wavelengths...........................................65 "D" Dual wavelength measurement (bichromatic measurement .............................66 "M" scan measurement of 35 measurement points per well...................................66 "A" Agglutination measurement with adjustable number of well positions (1 to 31 ...66 "K" kinetic measurement with interval shaking ....................................................67 "PD" - Plate directory (transmission of plate memory directory) ............................68 "PR" - Plate results (transmission of plate results) ...............................................68 operating manual 3 anthos ht1/ht2/ht3 10.4.10 10.4.11 10.4.12 10.4.13 10.4.14 10.4.15 "TD" - Test directory (transmission of test directory) ...........................................68 "TR" - Test run (plate measurement with predefined test) ....................................68 "H" - Shaking ..................................................................................................69 "B" - Transmission of plate identification number via barcode................................69 "R" - Repeat (repeat of the last data transmission) ..............................................69 Error messages ...............................................................................................69 10.5.1 10.5.2 Blocks with multiple information ........................................................................70 Blocks with the same type of information (=record format) ..................................70 10.5 Transmission of evaluation results...............................................................70 10.6 Description of individual blocks ...................................................................71 10.6.1 10.6.2 10.6.3 10.6.4 10.6.5 10.6.6 10.6.7 10.6.8 10.6.9 Header (block with multiple information) ............................................................71 Message (block with multiple information) ..........................................................72 Sample (record format)....................................................................................72 Blanks (record format) .....................................................................................72 Control (record format) ....................................................................................73 Cutoff (record format)......................................................................................73 Standards (record format) ................................................................................73 Curve (Block with multiple information)..............................................................73 Status ............................................................................................................74 10.7 Example of data transmission .....................................................................74 11 MAINTENANCE .................................................................................... 76 11.1 11.2 11.3 11.4 11.5 11.6 11.7 General....................................................................................................76 Recommended regular inspection................................................................76 Cleaning ..................................................................................................76 Changing the batteries...............................................................................77 Replacing the lamp block ...........................................................................78 Replacing the fuses ...................................................................................80 Self test - Interpretation ............................................................................80 11.7.1 11.7.2 Performing the self-test....................................................................................81 Self test interpretation .....................................................................................81 12 PRINCIPLES OF PHOTOMETRIC MEASUREMENT....................................... 83 12.1 12.2 12.3 12.4 12.5 Units of measurement ...............................................................................83 Measurement at specific wavelengths ..........................................................84 Measurement range calibration ...................................................................85 Plate centering .........................................................................................86 Reference channel.....................................................................................87 13 INTENDED USE ................................................................................... 88 13.1 Quality control ..........................................................................................88 13.2 Calibration ...............................................................................................88 13.2.1 13.2.2 Instrument calibration......................................................................................88 Reagent Calibration (Blanking) ..........................................................................88 13.3 Interpretation of measurement results.........................................................89 operating manual 4 anthos ht1/ht2/ht3 Introduction Picture 1.1: anthos ht2 The ht by ANTHOS LABTEC is a fully-automated, microprocessor-based microplate absorption photometer. Its range of application covers the universal measurement and evaluation of colorimetric endpoint specifications and kinetic tests. The ht 1 covers the visible range starting at 400nm (wavelength range: 400nm - 750nm). The ht 2 covers also the UV range starting at 340nm (wavelength range: 340nm - 750nm). The ht 3 can additionally temperature control the plate to 30° C or 37° C to the accuracy required in the specification. Note: The temperature-controlled photometers can hold micro-plates at a certain temperature, which can only be attained by preincubation, they are not incubators and may not be used as such. operating manual 5 anthos ht1/ht2/ht3 Warnings and Hazards 4 General: If Inflammable, toxic or Biologically Hazardous substances are used when operating the equipment, please observe the instructions and precautions enclosed with such substance. Never spill fluids in or on the equipment. Wash your hands thoroughly after handling test fluids. If equipment has been in contact with hazardous substances, it must be disinfected prior to shipment in accordance with the effective provisions. Do not touch the plate during movement of the plate transport (risk of injury). The equipment may not be opened other than as described in chapter 11, since it contains live parts (danger of life). 4 Electrical: Voltages dangerous to human life are present in this device. Before removing any covers disconnect the device from the power source. Ensure that the power cord supplied with the unit is used. The power cord may only be inserted in a socket outlet provided with a protective ground (earth) contact. The protective action must not be negated by use of an extension cord without a protective grounding contact. Do not replace fuses without first removing the main power cord. Ensure that only fuses with the required rated current and of the specified type are used for replacement. The use of makeshift fuses and the short-circuiting of fuse holders is prohibited. When the apparatus is connected to the main power source, the opening of the covers or removal of components is likely to expose life parts. The device shall be disconnected from all voltage sources before it is opened for adjustment or repair. Any adjustment or repair of the opened apparatus under voltage should be avoided, but, if necessary, it must be done by qualified service personnel who are aware of the hazards involved. operating manual 6 anthos ht1/ht2/ht3 1 Specification according to DIN 58960 part 4 1.1 General information regarding the absorption photometer Type: 8-channel single-beam absorption photometer with auxiliary beam path (reference) and discontinuous wavelength feed (filter) according to DIN 58960 part 2, 1988. 1.2 Declaration of Conformity EU-Certificate of Conformity Document-Nr./Month.Year: Manufacturer: Address: Product Name: QW-16/01-12/08 anthos labtec Instruments Ges.m.b.H. Lagerhausstraße 507 A-5071 Wals/Salzburg Absorption Photometers Anthos ht1, ht2, ht3 Above mentioned product intended for General Research Lab Use Only. Above mentioned product complies with the regulations defined in the following European guidelines: Number: 73/23/EWG Title: Low Voltage Directive EN 61010-1/1993 + A2/1995 EN 1658 / 1996 Number: Title: 89/336/EWG Electromagnetic Compatibility (Conforms to a Minimum of Performance Criteria B) EN 61326-1/1997 + A1/1998 EN 61000-3-2/1995 + A1/1998 + A2/1998 EN 61000-3-3/1997 + Corrigendum 1997 This declaration certifies the compliance with above mentioned guidelines. Safety instructions included with the supplied product information have to be adhered to. Issued by: anthos labtec Instruments Ges.m.b.H. Place, Date: Wals/Salzburg, 21.02.2002 operating manual 7 anthos ht1/ht2/ht3 1.3 Metrological specification 1.3.1 Measuring system Beam path: see diagram Radiator: preadjusted, automatically-controlled Tungsten halogen lamps (1 lamp per channel) spectral apparatus: dielectric interference filter, filter cartridge expandible for up to 8 filters; standard components: 620 nm, 450 nm, 405 nm, (340 nm only ht2 and ht3). Other wavelengths available upon request Radiation receptor: silicon-photodiodes Store for objects to be analyzed: all 8 x 12 microtitration plates with or without vertical subdivision Indication size: A (l) - spectral absorption factor Indication range: 0 - 2.5 A (< 400 nm; only ht2, ht3) 0 - 3.0 A (>= 400 nm) "normal" mode, 0 - 3.5 A (>= 400 nm) "extended" mode Indication type: Digital display Speed per measurement: monochromatic: 7 sec bichromatic: 10 sec kinetic cycles: 5 sec each 1.3.2 Measuring process Measuring class index: absorption (corresponds to O.D. optical density), measuring geometry (see diagram 1) Zero point setting: self-calibrating Concentration test: comparison value process Measured-value test: reference value process Control measurements: automatic prior to each measuring operation, self-test after switching on. 1.3.3 Definitions Linearity: The linearity is measured with a gray scale plate with linear increasing OD values. This is done to prove the linearity of the measurement results within the indication range of the instrument. The specified "...and ±0,005 OD" must be taken into consideration as un-linearities of the gray scale plate itself. Local Reproducibility: The local reproducibility proves that the measurement result of a sample is completely independent of its location in the microplate. Short time reproducibility: The short time reproducibility proves that the measurement result of a sample with a stable value is completely independent of the moment the measurement takes place and therefore reproducible when measuring it several times. Accuracy: The accuracy of the photometric measurement result proves that also the absolute photometric measurement result of a sample is within the specifications. operating manual 8 anthos ht1/ht2/ht3 The specified "...and ±0,005 OD..." must be taken into consideration as inaccuracy of the reference instrument. 1.3.4 Measuring range, specified according to DIN 58960 Spectral absorption factor A (l) : Normal mode: 0 - 2.0 O.D. (< 400nm; ht2, ht3) 0 - 2.5 O.D. (³ 400nm) Extended mode: 0 - 3.0 O.D. (³ 400nm) The limits of error and tolerance limits listed in Section 1.2.6 may be exceeded beyond this effective evaluation measuring range and for rated operating conditions other than the following section: 1.3.5 Rated operating conditions Measured wavelength l: 400 £ l ³ 750 (ht1) 340 £ l ³ 750 (ht2, ht3) Blank value: is deducted - depending on the application under the testing regulation to be defined by the user - from the measured value of the samples available on the microplate. Since this value greatly depends on the type of plate used, a blank cell is placed at a position on the microtitration plate to be specified by the user and measured together with all other samples in one operation. Warming-up time: Ready for operation immediately after switching on and automatic initialization, ready for measurement after 10 minutes pre-warming time. ht3: 30 minutes after switching on in temperated mode, otherwise like ht1 and ht2. Operating voltage: 90–130V and 180-260V system voltage Ambient temperature: 15°C - +40°C (operation non temperated mode) 22°C +/-1°C (operation temperated mode) -25°C - +50°C (storage) Relative humidity: 15 - 85% non-condensing (operation) < 95% non-condensing (storage) Air pressure tolerance: 54.000 - 106.000 Pascal Height over NN (operation): to 5000 m 1.3.6 Limits of error and tolerance limits Wavelength instability: l ± 2 nm (filter) Spectral width at half maximum intensity: l 12 nm at l ³ 450 nm l 15 nm at l < 450 nm Integral portion of misradiation (blocking) measured with all installed filters and band stop filter RG850 3mm: Result is outside of measurement range Accuracy (at 510 nm), measuring device: Schott NG3 1mm £± 1% and ± 0.005 O.D. at 1 O.D. Linearity (at 620 or 550, 540, 492, 510), measuring device: Grey-Scale NG4, NG5, Schott BK7 operating manual 9 anthos ht1/ht2/ht3 340 - 399nm: £± 0.7% and ± 0.005 OD from 0.1 OD to 2 OD (ht2, ht3) 400 - 750nm: £± 0.5% and ± 0.005 OD from 0.1 OD to 1.4 OD £± 0.75% from 1.3 O.D. to 3.0 O.D. Local reproducibility at 1 O.D., measuring device: Schott NG3 1mm 510nm: £± 1.0% Short-time reproducibility at 1 O.D.: 340 - 399nm: <± 0.5%, measuring device: Hoya LA100 (ht2, ht3) 400 - 750nm: <± 0.3%, measuring device: Schott NG3 1mm Temperature instability for ht3: After the device is pre-heated for 3 hours at 22° (± 1°) room temperature, the temperature in the incubation chamber is ± 0.1° stable at 30° and ± 0.2° stable at 37° upon reaching the control point (30 minutes per temperature setting). The tolerances of the measuring devices are based on the manufacturer’s information. 1.4 General technical data 1.4.1 Weight and Dimensions Weight: ht1, ht2: 13.5 kg, ht3: 18 kg net Charging space (width x length): 1700 cm2 bench model Dimensions (width x height x length): 34 cm x 17 cm x 44 cm (ht1, ht2) 34 cm x 23 cm x 44 cm (ht3) 1.4.2 Environmental influences Radio interference according to DIN VDE 0871: threshold class B for interference voltage, magnetic and electric interference field force Acoustic power level according to DIN 45 635 part 19: 40 dbA Outer lighting influences: Precaution, avoid direct sunlight. 1.4.3 Power supply Consumption: input 140VA max at 230V operating voltage. Adjustable operating voltage: 90-130V / 180-250V Mains frequency: 47 - 63 Hz. 1.4.4 Data connection Data interfaces: Serial RS232 (V24) 9-pole plug parallel Centronics printer interface (25-pole socket). User interface: keyboard with function keys 16-line LCD display for 40 characters per line in the normal text mode (240 x 128 pixels) with graphics capabilities. operating manual 10 anthos ht1/ht2/ht3 1.4.5 Automation Remote controlled via RS232. 1.4.6 Supplementary equipment Barcode spacing scanner, optional Printer: all EPSON/ESC-P or IBM-compatible parallel 9- and 24 matrix printers with parallel interface. Transfer rate of reader selectable between 300 and 19200 baud. 1.5 Cleaning Cleaning: for all accessible housing parts we recommend cleaning with a disinfecting agent commonly used in laboratories (effective against hepatitis B) or a 70% alcohol solution. Decontamination: If the equipment has been in contact with infectious substances, it may be disinfected with 37% formaldehyde steam at a temperature of 40°C (+/- 4°) for 6 to 8 hours in an air volume of approximately 160L and a relative humidity of 85 - 95%. The filters may be disinfected with a 96% ethyl alcohol solution and optical paper by means of short manual cleaning. Note Warnings regarding the use of toxic or inflammable liqids (page 6)! Take care on proper ventilation. 1.6 Photometry Monochromatic, bichromatic and multichromatic measuring with continuous scanning. Types of measuring: Endpoint measuring, kinetic measuring and scan measuring. Internal programs: Memory capacity for at least 30 application protocols (tests) and 10 plate files (identification data and test values). Evaluation potential: qualitative (flexible threshold value input, up to 4 threshold values, individual group descriptions), quantitative (various curve fit modes, point to point, linear regression, cubic spline, 4 parameter fit), kinetic data reduction (computation of average slope, maximum slope, delta OD, delta OD-maximum slope, delta t-maximum slope, delta t-relative, delta t-absolute). Relational calculations with free formula input etc. Combination of all evaluation possibilities (quantitative and/or qualitative evaluation of concentrations, values for data reduction and relation values). Plates/sample validation and elimination of replicates. operating manual 11 anthos ht1/ht2/ht3 1.7 Scope of supply 3 filters (620 nm, 450nm, 405nm) - with ht1 4 filters (620 nm, 450nm, 405 nm, 340 nm) - with ht2 and ht3, 1 filter case with lock-bar 1 dust-cover 1 user’s manual 2 spare air filters, 2 spare fuses. 1.8 Warning and directions If inflammable, toxic or biologically hazardous substances are used when operating the equipment, please observe the instructions and precautions enclosed with such substances. Never spill fluids in or on the equipment. Wash your hands thoroughly after handling test fluids. If the equipment has been in contact with hazardous substances, it must be disinfected prior to shipment in accordance with the effective provisions. Do not touch the plate during movement of the plate transport (risk of injury). The equipment may not be opened other than as described in the chapter 11, since it contains live parts (danger to life). 1.8.1 Environmental operating conditions Flat, dry, clean and vibration-proof working area (44 cm x 34 cm - length x width) Additional room for cables, connections, printer, etc. No direct sunlight Clean ambient air (free of corrosive vapors, smoke and dust) Ambient temperature between 15°C and 40°C, for HT3 : 15° C - 22°C in temperature mode. Humidity between 15% and 85%. 1.9 Re-packing to prevent damage during transport The original HT2 packing has been specially designed for this equipment. The drop and vibration tests described in the specification cannot be guaranteed with any other packing. operating manual 12 anthos ht1/ht2/ht3 It is therefore recommended to save the original carton with its foam parts (1), accessories box (2) and plate-transport brace (3). 1.10 Description of operating elements Front view: ht1/ht2 1. 2. 3. 4. ht3 Main switch Display with keyboard Plate transport system Temperature display (ht3 only) Rear view: operating manual 13 anthos ht1/ht2/ht3 1. 2. 3. 4. Parallel interface (Centronix) Serial interface (RS232) Type-plate (with serial number) Warning: „For continued protection against fire hazard replace only with the same type and rating of fuse“ 5. Mains connector 6. fuse holder (250V, 2 A, slow, 2 pieces) 7. Mains switch (115V/230V) with integrated mains filter 8. Symbol for: Notice user manual! 9. Warning: „Let instrument cool down before opening“ 10. Warning: „ Before opening disconnect power cord. Opening by authorized personnel only“ Side view: 2 1 Keyboard: operating manual 14 anthos ht1/ht2/ht3 1. Function keys (F1 - F5): selection of menu and input on monitor 2. Numerical keyboard with decimal point 3. CE (clear/entry): deleting- and change key 4. Cursor key 5. ENTER: Confirmation of entries 6. PREV (previous): one step back to previous function or page 7. STOP: return to main menu operating manual 15 anthos ht1/ht2/ht3 2 Warranty A warranty period of 12 months shall be granted to the original buyer of the HT2/HT3. This warranty shall lose effect if: the equipment is not used in the defined scope of application, the equipment has obviously been damaged by external influences which are not in accordance with the provisions for the nominal range of use, the equipment has been modified or parts exchanged by a person other than ANTHOS LABTEC personnel or an authorized servicing agent, the equipment’s serial number is no longer legible, has been removed or altered, the equipment has not been installed in accordance with the instructions supplied by ANTHOS LABTEC. the equipment has been damaged during return transport due to false packing (e.g. not in original packing material). Only those persons may operate the equipment who are technically qualified and can interpret the data properly. If a warranty is brought into operation, ANTHOS LABTEC shall repair or replace any defects which have resulted from faulty material or during production as it deems fit. No costs shall arise for the client. All components found in the original equipment shall be available for a period of 5 (five) years after production. This warranty contains all the obligations which ANTHOS LABTEC must fulfil and can only be amended upon the written consent of ANTHOS LABTEC. operating manual 16 anthos ht1/ht2/ht3 3 Start-up and Self-test with error message and system setup Place the switched-off device on a suitable working surface. Connect the Epson ESC/P or IBM compatible 9 or 24 matrix printer to the Centronics plug and/or computer to the RS232 interface. Check the mains voltage and plug on the back of the device. Remove filter case from the additional carton and check firm support of filters and lock bar. Connect power cable to standard mains plug. Switch on main switch (left bottom). The Reader performs the complete initialization including self-test in approx. 40 seconds. When the display "No plate carriage detected" appears, press ENTER. When the display "Please insert filter slider" appears, push the filter case into the right side filter carriage to the end stop and press any key. This automatic self-test re-calibrates the device and checks if the electronic and mechanical components are in the proper service condition. The following error display may appear: System halted: call service technician Lamp controller check not OK: call service technician Lamp controller check error - check power supply: call service technician ADC check not OK: call service technician Plate check not OK: Check microtitration plate in the plate transport, otherwise call service technician Check filter slider: Check filter slider in the device for position and completeness, otherwise call service technician No filter detected: No filter in this position - check filter adjustments. OV-energy/low energy/no energy: check filter adjustments and positions, otherwise call service technician. For further information on error interpretation and correction press F3 after the self-test has been performed. By pressing F5 the reader goes to the main menu. 3.1 Printout of a self-test protocol Upon completion of the self-test after approx. 5 sec. the main menu appears. If a printout of the results is desired, press one of the following function keys within this waiting period. F1-Report: Evaluated test printout F2-Raw Data: Printout of all raw data - important for service technician. Continue to main menu with F5 (see diagram). operating manual 17 anthos ht1/ht2/ht3 3.2 Structure of the main menu 3.3 Main menu display The position of the plate and filter case is displayed. Modifications are entered with the cursor keys. (Only for HT3): Temperature control is switched on/off with 0/1 on numerical keyboard. Cartridge: Since no external memory expansion is installed, no adjustment possible. Submenus available using the function keys: F1 - QUICK / F2 - RUN-TEST / F4 - PLATES / F5 – SETUP 3.4 System setup and input of a password In the main menu press F5 (SETUP) and then F3 (SYSTEM). Press F2 (SLIDER EJECT), remove filter case from the left side. operating manual 18 anthos ht1/ht2/ht3 Check setting of: Filter position and wavelength: To change, delete wrong entry with CE and enter new value using the numerical keyboard. Put filter case into reader. Press F1 (FILTER INSERT), automatic insertion of filter case. Date and time (important for printed protocols Time mode (12 or 24 hour cycle) Key click (to turn key clicking on or off) Plate storage (shift mode: a plate file already printed will be deleted automatically when the plate memory overflows (10 plates); Protect mode: plate files can only be deleted manually. Internal barcode (NO: not installed; YES: hardware installed) To turn the page, press F5 (NEXT). Printer type (choose between EPSON and IBM 9 or 24 matrix compatible printer. Many ink-jet printers are IBM-24 compatible, except HP-Deskjet which cannot be used) Baudrate (proceed to selection display by pressing CE, select value from 300 to 19200 bauds). Parity (RS232) (even or odd parity) Display background (blue or white background) Entering a password Input of a protection code for setup and/or tests: Modifications or deleting processes are only performable after input of the preset password. Password Setup: press CE, enter a 4-digit, numerical password, VERIFY input (input repetition), confirm with ENTER Password Tests: see password setup. If password is activated, the functions CLEAR and EDIT are not applicable anymore in the TESTS MENU. NOTE: If a password can not be remembered, please call your local anthos distributor (by means of a super user code, unknown passwords can be deleted). Leave the menu with F5 (EXIT) and return to the main menu by pressing the STOP or PREV key. Instrument Setup is stored when instrument is switched off. · operating manual Initial Shaking (if ON, the plate transport starts moving with a shake in order to stabilize the liquid meniscus, without respect if additional shaking is set up in the program) 19 anthos ht1/ht2/ht3 4 QUICK measurements without test programming and storage (MONOCHROMATIC, BICHROMATIC AND MULTICHROMATIC MEASUREMENTS, KINETIC- AND SCAN MEASUREMENT) 4.1 F1 - NORMAL: monochromatic/bichromatic endpoint measurement Measurement filter: select measurement filter (press CE and move cursor to desired wavelength, ENTER) Reference filter: select reference filter (as above; if no reference filter is required, press NONE) Measurement range: set measurement range, basic setting: normal mode Note: Using extended mode the indication limit is extended from 3.0 OD to 3.5 OD. Wavelengths under 400 nm are not permitted. Measurement time is doubled. Shaking: plate shaking selectable by pressing CE to YES prior to measuring ; enter time in seconds using keyboard, choose shaking intensity from three levels (enter menu by pressing CE: select low/medium/high). Output channel: three output channels available. Display: Measuring values of the measurement filter (M), reference filter (R) and their difference (M-R) are displayed on the screen, printout of difference or transmission of measurement data also possible after measurement. Printer: Immediate measurement printout; printout format selectable between M, R, M-R (output of three values per plate position) and Delta OD (output of differences for measurement and reference filters only). RS232: Transmission of measurement data to external computer. Start the measurement with F5 - START MEASUREMENT operating manual 20 anthos ht1/ht2/ht3 4.2 F2 - MULTI: measurement with several wavelengths simultaneously Number of wavelengths - (min = 2, max = 8) is entered using the numerical keyboard. Wavelength #1, wavelength #2, etc. - press CE to display menu, select filter with the cursor and press ENTER. Output channel : choose from three output channels: Display: Measurements are displayed on the screen, subsequent printout or transmission of measurement data also possible after measurement Printer: Immediate printout, highest measurement of each well will be marked (wavelength evaluation) RS232: Transmission of measurements to external computer. Starting the measurement with F5 - START MEASUREMENT. 4.3 F3 - KINETIC: kinetic measurement Measurement filter - to select filter press CE, move cursor to desired wavelength and press ENTER. Reference filter - to select filter press CE, move cursor to desired wavelength and press ENTER. Usually no reference filter is used for kinetic data since a reference reduction only shifts the relevant reaction process up or down, which has no effect on the results of the data reduction. Measurement range - basic setting: Normal Mode (in Extended Mode indication limit is extended to 3.5 OD) Note: Wavelengths under 400 nm are not permitted using Extended Mode. Measurement time is doubled. operating manual Interval: interval setting in seconds from the beginning of one measurement cycle to the beginning of the next cycle (maximum time = 36000 seconds). 21 anthos ht1/ht2/ht3 Minimum Intervals: Normal Mode: Single Wavelength: Single Wavelength+ Shaking: Dual Wavelength: Dual Wavelength + Shaking: 5 sec 7 sec + Shake Duration 10 sec 12 sec + Shake Duration Extended Mode: Single Wavelength: 10 Single Wavelength + Shaking: 12 Dual Wavelength: 20 Dual Wavelength + Shaking: 22 sec sec + Shake Duration sec sec + Shake Duration # cycles: number of measurement cycles to be performed (max = 40, press CE and enter number using keyboard). Shaking: plate shaking during each measurement cycle: press CE and change to YES, enter duration in seconds using keyboard, choose shaking intensity from three levels: low, medium, high). Output channel: choose from three output channels: Display: Measurements are displayed on the screen, subsequent printout or transmission of measurement data also possible after measurement. Printer: Immediate printout; for the printout format select either raw data (printout of measurement data for each cycle) or maximum slope (maximum reaction slope in mOD/min). RS232: Transmission of measurements to external computer. The kinetic reaction progress can be viewed directly on the screen and is displayed graphically after measurement. To optimize the display range of the curve, both of the following parameters must be set: OD range: the range in [mOD] by which the test fluid will increase or decrease (press CE and enter number using the numerical keyboard) Reaction: expected reaction process (increasing / decreasing). Inaccurate inputs have no effect on the quality of the measurement data. To start the measurement press F5 - START MEASUREMENT. For the output channel = Display, press F5 - SELECT SCREEN after the measurement has been performed and choose one of the following screens: Maximum slope: the measurements are reduced to the value of the maximum slope of the reaction in [mOD/min]. Raw wells: the measurement for each cycle is displayed (retrieve measurement for various cycles with cursor). Graphics 8/12: Curves per well displayed in series or rows (switch with F2). The OD-range and the reaction can be changed subsequently using F4 (limits). Zoomed graphics: The reaction of a well is enlarged on the screen. operating manual 22 anthos ht1/ht2/ht3 The data of a kinetic test remains in the Quick Menu memory F3 (KINETIC DATA) until another kinetic- or scan measurement is performed, even if the device is switched off in the meantime. Switch Output channel to "display" if kinetic data are to be viewed. 4.4 F4 - SCAN: scan and agglutination measurements Measurement filter: press CE, move cursor to desired wavelength and press ENTER. Result units: Measurements in transmission or absorption units (change by pressing CE). Output channel: Choose from three output channels: Display: Measurements displayed on the screen, a subsequent printout or transmission of measurement data also possible after measurement. Printer: Immediate printout of all values of the predefined well positions. RS232: Transmission of measurements to external computer. Select locations: 35 points are scanned in the well’s profile (+/- 17 from the centre of the well). These 35 points may be individually selected for printouts of the measurement. Press CE (= individual), move cursor down one row, press CE and move point by point to the desired locations with the right cursor and select with the upper cursor. Start measurement with F5 - START MEASUREMENT Output channel = display: After each measurement, the absorption or transmission profile of the well is displayed on all 35 grid points, also indicating the absorption value in OD or the transmission value in % for the locations selected. Basic setting = centre point "0". Other wells can be chosen by using the cursors. The function keys provide: F1-Print: Printout of measurements for all selected locations F2-Transmit: Transmission of measurements to an external computer F3-LOC -: Moving the location cursor in the graphic display to the left F4-LOC +: Move the location cursor in the graphic display to the right F5 - Print Graphics: Printout of all 96 grid profiles of a certain plate in the selected unit (absorption/transmission). operating manual 23 anthos ht1/ht2/ht3 5 Test Definition - Programming of tests (evaluation modes) Since all programming options together are seldom used during one test, optional settings may be skipped. If a special point, e.g. "quantitative evaluation" is required, the question regarding the use of such function must first be answered with YES (press CE) before the corresponding menu (e.g. "standard points" and "quantitative evaluation") is displayed. This chapter will describe all of the display menus. The flow diagrams will serve as an easy reference to select the program sections required. operating manual 24 anthos ht1/ht2/ht3 5.1 Programming a new application test Press F5 - SETUP in the main menu, then press F1 - TEST to continue to the directory of all tests previously programmed. If a password has been programmed in the system setup, enter password and confirm with ENTER or skip by pressing ENTER. Press F1 - DEFINE to begin programming a new test. 5.2 Test identification: naming, filter selection and range selection Test ID #: Select an individual test identification number. The first vacant position in the test memory is preset. Change by pressing CE and enter number using the keyboard. Press ENTER. Test name: Select an individual test name. May be skipped. Begin setting by pressing CE. When the alphabet appears on the screen , use the cursors to select the row with the desired letter. Press the function key (F1 - F5) to select the respective column. Delete characters with CE. Confirm the complete test name with ENTER. Measurement filter: Select a measurement filter. Go to menu with CE, move cursor to desired wavelength and confirm with ENTER. The preset filters are those set in the SETUP menu. Check for accuracy. Reference filter: Select a reference filter (optional, may be skipped). Go to menu with CE, move cursor to desired wavelength, confirm with ENTER. Measurement range: The measurement range is preset to „normal range“ (indication range: 0 - 3.0 OD). Change to „extended range“ (indication range 0 - 3.5 OD) by pressing CE. operating manual 25 anthos ht1/ht2/ht3 Note: in Extended Mode the indication limit is extended to 3.5OD. Measurement time is doubled and the use of wavelengths under 400 nm are not permitted. Turn page with F5 - NEXT. 5.3 Premeasurement functions - optional parameters for functions being performed prior to measurement Preshaking: Plate‚ Shaking to improve the fluid homogeneity at a maximum filling capacity of 200 µl per well. Change to YES by pressing CE, enter duration in seconds using the keyboard, and select shaking intensity from three levels (low / medium / high). Prewaiting: Waiting time prior to measuring. Set to YES by pressing CE, enter desired time in seconds using the keyboard (Maximum time = 99 sec) Monitoring: Automatic observation of certain wells. Measurement is started upon reaching a certain limiting value. Change to YES with CE. Additional settings: Well positions: Setting the plate positions to be observed. Press CE, position cursor in the menu, select with F4 (SELECT), delete with F3 (CLEAR) or F2 (CLEAR ALL), confirm with ENTER. The selected positions may be observed in two ways: Monitoring mode = "relative": Input of a certain OD value in [mOD] (OD increase / OD decrease). At the point of time when at least one of the selected wells has reached the defined decrease or increase measurement is started. Monitoring mode = "absolute": Input of an upper and a lower threshold in [mOD]. Again, measurement is only started when at least one of the selected wells has reached this threshold. Note: Upper threshold value must be higher than the lower one. Read interval: Select time interval for observation measurements in seconds. Turn page with F5 - NEXT. operating manual 26 anthos ht1/ht2/ht3 5.4 Factor dilution & kinetic measurement - plate dilution factor and basic setting for kinetic measurements Factor dilution: Press CE and enter multiplication factor to be used automatically for all measurement values (OD values or data reduction values) of the plate (including blanks, controls and standards). Use the numerical keyboard. The original measurement results will not be displayed any longer. Kinetic readings: Change to YES with CE. Kinetic mode (normal/special): In the normal mode, up to 40 consecutive kinetic cycles may be performed automatically. The special mode (change with CE) is only suited for twopoint kinetics with long interval time. The plate is stored with the status "s-kin" in the plate memory (submenu PLATES) after the first kinetic cycle. The reader is immediately available for other measurements. A second cycle can be run after any period of time by recalling the test in the menu RUN TEST. Note: Performing "special kinetics", ensure identical plate ID number of both cycles. Both measurements will automatically be evaluated as one special kinetic reading. The measurement results will be in Delta OD-values (mOD). The following parameters will only be visible if kinetic readings = YES was selected. Interval time: Note interval time setting in seconds from the beginning of one measuring cycle to the beginning of the next cycle (maximum time = 36000). Minimum Interval Time: Normal Mode: Single Wavelength: Single Wavelength+ Shaking: Dual Wavelength: Dual Wavelength + Shaking: 5 sec 7 sec + Shake Duration 10 sec 12 sec + Shake Duration Extended Mode: Single Wavelength: 10 Single Wavelength + Shaking: 12 Dual Wavelength: 20 Dual Wavelength + Shaking: 22 sec sec + Shake Duration sec sec + Shake Duration Number of cycles: number of measurement cycles to be performed (max. = 40). Press CE, enter number on keyboard, confirm with ENTER. operating manual 27 anthos ht1/ht2/ht3 Shaking: Shaking of plate before each measuring cycle. Change to YES with CE, enter duration in seconds using keyboard, select shaking intensity from three levels: low / medium / high. Maximum filling capacity per well: 200 µl; maximum shaking duration: 99 sec. Turn page with F5 - NEXT. 5.4.1 Kinetic data reduction - Selection of data reduction method and parameters for screen graphics during kinetic measurement Data reduction: Selection of data reduction method. Go to display menu with CE. Choose from the following parameters: Delta OD: Difference between two kinetic measurements in [mOD] Average slope: Slope in [mOD/min]between the first and last kinetic cycle. Only suited for linear reaction progressions with few cycles and measurement points. Maximum slope: Maximum slope of the curve in [mOD/min]. (Maximum reaction speed). Type of evaluation: Linear regression lines connect four measurement points at a time (line through measurement points #1, #2, #3, #4, then through #2, #3, #4, #5, through #3, #4, #5, #6, etc). The line with the highest slope is calculated. The accuracy of this calculation depends on the number of measurement cycles selected. Number of regression lines = number of measurement cycles v- 3 (see diagram). 4 5 OD 6 3 1 Maximum Slope [mOD/min] center point of maximum slope 2 t t operating manual 28 anthos ht1/ht2/ht3 Delta t - maximum slope: Time difference in [sec] between the first measurement and the occurrence of the center point of the maximum slope. Delta OD - maximum slope: Difference in [mOD] between the first measurement and the center point of the maximum slope. Calculation of the center point of the maximum slope: Center point between the four measurement points of the regression line with the maximum slope.elta OD - maximum slope: OD Delta t - maximum Slope center point of maximum slope Delta Time t Delta t - relative: Time in [sec] from the first measurement to reaching a set increase/decrease in [mOD]. Delta t - absolute: Elapsed time from one preselected threshold value to an other. OD Delta t - Absolute Threshold 2 Threshold 1 t Delta Time Online Kinetic - Graphic Parameters The kinetic reaction can be observed directly on the screen and is graphically displayed after measuring. To optimize the display range of the curve, the following parameters must be programmed. (Inaccurate inputs have no effect on the quality of the measurement data): OD-range (graphics): Select a value in [mOD] by which the measurement data is expected to increase or decrease (press CE and enter numbers on keyboard) Expected reaction: Reaction process to be expected (increasing / decreasing) Col (1-12) / Row (A-H): Graphic display of the reaction process on the screen for a certain row (row) or column (col) during measurement. Press CE, select a column between 1 and 12 or a row between A and H with the cursor and the respective function key, confirm with ENTER. Turn page with F5 - NEXT. operating manual 29 anthos ht1/ht2/ht3 5.5 Plate layout functions - Setting parameters for the validity of blanks, filling direction, replicates and control strips Blank validity: Validity of the blank value positions on the plate: Plate: Mean value of all individually positioned blanks is automatically deducted from other measurement values. Row (12): Free configuration of the blanks on the entire plate. The mean value of all blanks in each row is deducted from each sample of this row. e.g.: Setting blanks on plate position A01 and A08. Mean value of A01 and A08 = (A01 + A08) / 2. This mean value is deducted from each sample of this row (A02 / A03 / A04 / A05 / A06 / A07 / A09 / A10 / A11 / A12). Col (8): Free configuration of the blanks on the entire plate. The mean value of all blanks in a certain column is deducted from each sample of this column. e.g.: Setting blanks on A01, B01 and D01. Mean value of A01, B01 and D01 = (A01 + B01 + D01 / 3). This mean value is deducted from each sample of this column (C01 / E01 / F01 / G01 / H01). Automatic replicates: automatically set replicates, valid for all samples, blanks, controls and standards on the plate. Set the following parameters: Direction: Direction (horizontal / vertical) of replicates Number of wells: Number of replicates (maximum of 12 replicates for horizontal direction; maximum of 8 replicates for vertical direction) AG-control strips: Antigen control strip setting. A control sample, which is automatically deducted, is assigned to each sample. The sample and control sample have the same numbering on the printout. The control well sample positioning depends on the filling direction and the sample control setting combination of the reader. operating manual 30 anthos ht1/ht2/ht3 Note: AG-control strips cannot be used together with the automatic replicates. Set the following parameters: Direction: Direction (horizontal / vertical), i.e. one row/column consists of samples only, the next row/column consists of control samples only. Control well: Position of the control wells before/above (= first) or after/under (= second) the sample, respectively. Filling direction: Filling/pipetting direction (horizontal/vertical). Note: Groups of replicates are sorted according to their replicateddirection AND the filling direction. Press F4 - VIEW to display the current plate allocation. Press ENTER to return to the display menu „Plate layout functions“. Turn page with F5 - NEXT. 5.5.1 Template setup - individual plate allocation with blanks, standards, controls and samples Set blanks: Move cursor to desired position and press ENTER. Set standards: Press F1 (SET TYPE) until "Standard" is marked. The standard number is displayed at the upper right operating manual 31 anthos ht1/ht2/ht3 screen corner (up to 12 different standards may be set on the plate). For higher standard numbers press F2 (SET#+), for lower standard numbers press F3 (SET#). Move cursor to the desired position and confirm with ENTER. Set controls: Press F1 (SET TYPE) until "Control" is marked. The control number is displayed at the upper right screen corner (up to 4 controls may be set on the plate). For higher control numbers press F2 (SET#+), for lower control numbers press F3 (SET#-). Move cursor to the desired position and confirm with ENTER. Set samples: Press F1 (SET TYPE) until "Sample" is marked. The sample number is displayed at the upper right of the screen. For higher sample numbers press F2 (SET#+), for lower sample numbers press F3 (SET#-). Move cursor to the desired position and confirm with ENTER. For automatic sample positioning press F4 (SAMPLE FILL). The vacant positions are filled with samples in the prescribed filling direction. If samples have been positioned manually, their numbers will no longer be used. To subsequently delete individual samples: press CE. To delete all samples: press F4 (SAMPLE CLEAR). Turn page with F5 (NEXT). 5.6 Report & Evaluation: Setting printout format, relational measurement calculation and setting the basic data for quantitative evaluation Report Format (Printout): Matrix: Measurement printout for each plate position in 12 x 8 format. Mean value calculation of blanks, standards and controls only. Table: Tabular printout of mean values, variation coefficients (deviations of individual replicates in percent), concentration values and classification groups of blanks, standards, controls and samples. Combined: Printout of measurement positions (matrix format) with separate table for blanks, samples, standards and controls (table). Relative calculation: Setting all plate positions in relation to a predefined value. This value is calculated according to an algebraic formula which may contain all the standards, controls and blanks defined in the plate layout as well as the fundamental operations of arithmetic and numerical constants. Press CE to change the relative calculation to YES. operating manual 32 anthos ht1/ht2/ht3 X’=: Enter algebraic formula for the relative calculation. X’ corresponds to the new value for each individual plate position. Press CE. The display menu shows all the standards, controls and blanks defined in the plate layout as well as a variable X. This variable represents all the original measurement values. It must appear exactly once in each algebraic formula. Move the cursor to select a row in the screen display and select the desired character with the corresponding function key. Numbers may be entered on the numerical keyboard. Example: A negative control R1 that represents 100 % binding, has to be set in relation to all samples of the plate in order to deduce their amount of binding. X'=(X/R1)*100 Now the relational values correspond to percentage values showing the binding degree of each sample (B / B0 calculation). Quantitative evaluation: Method to obtain sample concentrations using a standard curve. Number of standards: Depending on the type of curve calculation, a minimum number of standards must be set: Linear regression Point to point Cubic spline 4 parameter fit 2 2 3 4 standards standards standards standards Maximum number of standards: 12. Enter number on numerical keyboard and press ENTER. A quantitative evaluation can be performed independent of the standards defined in the layout. Basis for quantification: Appears only if „relative calculation = YES“ was selected. Set according to whether the original measurement values or the results of the relative calculation (relative values) are to be used for the quantitative evaluation. Turn page with F5 - NEXT. 5.6.1 Standard points - definition of the concentration and ODvalues of the individual standard points #: Standard number. Only the number of standards set under „Report and Evaluation“ may be used for evaluation. The number of standards defined in the plate layout is not relevant for the actual number of standard points of a curve. operating manual 33 anthos ht1/ht2/ht3 Concentration value (x): Enter the concentration value to be plotted on the x-axis of the curve graphic. Constants of up to 12-digits may be entered on the numerical keyboard. Response value (y): Enter the absorption value to be plotted on the y-axis of the curve graphic. It usually corresponds to the OD-values of the standards on the plate, can, however also be defined by an algebraic formula containing all the set controls, standards and numerical constants. Note: When entering the formula make sure that the sequence for the „response values“ is either ascending or descending. Press CE, move cursor to the row in the display menu with the desired character and confirm with the corresponding function key. 5.6.2 How to store a standard curve Note: The use of stored standard curves is not generally recommended or applicable for the quantitative evaluation of ELISA's. It is explicitly the responsibility of the user to take advantage of the described software possibilities in the appropriate way! Once a standard curve has been measured and OD results have been obtained (by programming for standard S1 the response value as S1, for the standard S2 as S2, etc.), the curve can be copied in the following way: Make a printout of the measured test containing both concentration values and OD values. Begin definitions of a new test. The layout need not contain a real standard anymore. As response values enter the OD values of the standards from the printout protocolof the measured test. Now a new plate can be measured that will be evaluated by means of the stored standard curve. To be able to correct possible deviations of the curve, it is highly recommended to have at least one real standard on the plate by which a correction factor can be calculated. Example: A plate with 5 standards is programmed: S1 S2 Concentration Value 0.00001 0.0001 Response Value S1 S2 S3 0.001 S3 S4 0.01 S4 S5 0.1 S5 All the standards are put on the plate. The measured result for the response values are: Response Value S1 0.3 S2 0.6 S3 0.8 S4 0.9 S5 1.1 A new test is programmed. Only standard S3 is physically on the plate and its measurement value will be the correction factor for all other standards. Concentration Value Response Value operating manual S1 S2 S3 S4 S5 0.00001 0.3*(S3/0.8) 0.0001 0.6*(S3/0.8) 0.001 0.8*(S3/0.8) 0.01 0.9*(S3/0.8) 0.1 1.1*(S3/0.8) 34 anthos ht1/ht2/ht3 If the response value of standard S3 should deviate from 0.8, all other standards are corrected: Response für Response für 5.6.3 S1 0.32 0.27 S2 0.64 0.54 S3 0.85 0.72 S4 0.96 0.81 S5 1.06 0.90 erste neue Kurve zweite neue Kurve Quantitative evaluation - Settings for quantitative evaluations such as curve calculations, coordinate scaling, extrapolation, etc Units of concentration: Definition of concentration units (e.g.: [mg/l]; important for the documentation on the printout. Press CE. The alphabet and a number of special characters appear in 6 rows and 5 columns in the display menu. Move cursor to the row with the desired character and confirm with the corresponding function key. Curve fit method: The following mathematical functions may be used to calculate the standard curve: 1. Linear regression: Construction of a straight line according to the least squares method with the highest possible approximation to all standard points. (Formula: y = k*x + d) Minimum number of defined standard points: 2 Linear Regression OD 1.5 1.0 0.5 0.0001 operating manual 0.001 0.01 0.1 conc. 35 anthos ht1/ht2/ht3 2. Point to point: Direct connection of all standard points. Minimum number of defined standard points: 2 Point to Point OD 1.5 1.0 0.5 0.0001 0.001 0.01 0.1 conc. 3. Cubic spline: All standard points are connected by the best fitting curve. Can only be used for nonlinear and nonsigmoid functions. Minimum number of defined standard points: 3 Cubic Spline OD 1.5 1.0 0.5 0.0001 0.001 0.01 0.1 conc. Definition of the "natural cubic spline" as found in: G. EngelnMüllges, F. Reutter: "Formel-Sammlung für numerische Mathematik mit Pascal-Programmen", Bibliographical Institute, Mannheim, Vienna, Zurich; Wissenschaftsverlag, 1985; p.146 ff. 4. Parameter fit: This procedure can only be used to characterize sigmoid curves. Minimum number of defined standard points: 4 The curve is calculated according to the following formula: y={(a-d)/[1+(X/c)b]}+d 4 Parameter Fit OD 1.5 1.0 0.5 0.0001 operating manual 0.001 0.01 0.1 conc. 36 anthos ht1/ht2/ht3 Definition: "The dose level which results in a response exactly half way between the zero dose response "a" (upper asymptote) and the infinite dose response "d" (lower asymptote) is designated as the "midrange" of the assay and is designated "c". ... In addition, the curve is characterized by a "slope factor" or "exponent", designated by "b"." Definition according to "Radio-Immunoassay and Related Procedures in Medicine", International Atomic Energy Agency, Vienna, 1974, Volume 1, p.165 ff. The axial scaling is preset in the 4-parameter fit and cannot be adjusted. x-axis scale: Scaling the x-axis (linear/logarithmic). Change with CE. y-axis scale: Scaling the y-axis (linear/logarithmic). Change with CE. Minimum correlation: Only valid for curve fit method = linear regression. Method to control a certain curve quality. Setting a divergence coefficient (between 1% and 99%) of the individual measurement points from the real curve to control a certain curve quality. Best fit (= point lying on the curve) is 99. If the preset limit of individual points is exceeded, the respective warning appears on the printout. Press CE, enter number between 1 and 99 on the numerical keyboard and confirm with ENTER. Extrapolation: The concentration of samples having a higher / lower measurement results than the highest / lowest standard can only be determined mathematically. A continued calculation of the curve can be performed up to 40 % outside the real curve fits. This percentage corresponds to the concentration range between the lowest and highest standard (= 100 %). Extrapolated values are marked with an „x“ on the printout. If a curve loses its uniqueness in the extrapolation range (it reaches its maximum or minimum), extrapolation is blocked. Press CE, enter a number between 0 and 40 on the numerical keyboard and confirm with ENTER. Factor (* conc): Select a multiplication factor of up to 10 digits. All concentration values of a plate can be displayed in a certain display range. Graphics-report: Set (Yes/NO) to determine whether a measurement printout should contain a standard curve graph or not. Turn page with F5 - NEXT. operating manual 37 anthos ht1/ht2/ht3 5.7 Qualitative interpretation - Set to classify samples according to programmable threshold values Interpretation: If a qualitative evaluation of the samples is desired, press CE. The display changes from "NO" to "YES". Mode of interpretation: Set the type of threshold value subdivision 1. Normal: Up to 4 threshold (cutoffs) can be programmed individually and up to 5 ranges selected. 2. Auto-ranging: An upper and lower threshold are programmed in the next display menu. The intermediate range can be divided into 2 to 10 equidistant groups. 3. %-ranging: An upper and a lower tolerance value are programmed in the next display menu. The sample measurement values are printed also as percentages on the printout (the sample measurement values are scaled in percent). Number of ranges: Only appears for "mode of interpretation = normal". Enter the number of ranges to be subdivided (minimum = 2, maximum = 5) Equidistant groups: Only appears for "mode of interpretation = auto-ranging". Enter the number of equidistant tolerance value subdivisions (minimum = 2, maximum = 10). Group statistics (No/Yes): The group division of measurement values and their correlations can be displayed statistically on the printout. Change to YES by pressing CE. operating manual 38 anthos ht1/ht2/ht3 Data to interpret: Only appears if quantitative and qualitative evaluations are combined. The measured data can also be displayed in concentrations and evaluated qualitatively as such by using the standard curve. If a relational calculation was programmed, these values can also constitute the calculation basis. Turn page with F5 - NEXT. 5.7.1 Cutoffs and ranges - Setting the tolerance values and naming the ranges Cutoff values for measurement results / concentration values / relational values: Enter the formula or contents for the programmed tolerance values. (Normal: up to 4 cutoffs can be programmed / auto-ranging or %-ranging: two cutoffs must be programmed). Press CE. All standards, controls and arithmetic functions which can be used in the cutoff-formula appear in the display menu. Enter numbers with the keyboard. Move the cursor to select a row in the display menu and confirm the desired character with the corresponding function key. Confirm complete formula by pressing ENTER. Naming the groups defined by the preset cutoff values. Range #1 (x<CV1): All values falling in this range must be less than the first cutoff (CV). Press CE to display the alphabet in 6 rows and 5 columns. Move the cursor to select a row and confirm the desired character with the corresponding function key. Enter numbers with the keyboard. Confirm again by pressing ENTER. (etc.) If "mode of interpretation" = auto-ranging or %-ranging, the intermediate range between the two cutoff values cannot be individually named since either the group number or a percentage is automatically printed as the name. This range is referred to as "special". Turn page with F5 - NEXT. 5.8 Control & test validation: Program to evaluate the control, standard and blank replicates and to automatically recognize and eliminate outliers Press CE if an automatic replicate elimination and control/test validation is desired. Turn page with F5 - NEXT. operating manual 39 anthos ht1/ht2/ht3 5.8.1 Replicate elimination - Select the conditions for the automatic elimination of individual replicates This function serves to eliminate individual replicates which do not fulfil a certain programmed condition. After the first elimination, the mean value of the remaining replicates is recalculated and the condition re-examined. If necessary, the elimination cycle is repeated. If a minimum number of replicates (to be determined) is still available in the end, the test is valid, if not, it is marked "invalid" on the printout. If the mean value of the replicates remaining after an elimination constitutes are the basis for the test evaluation, the necessary conditions are to be defined according to the next chapter: 5.8.2 Control validation - Condition to validate the mean value of standards, controls and blanks Program entries: Column "CT": Definition of the standard / control / or blank which is to be evaluated with the following condition. Press CE, select the corresponding position in the display menu with the function keys, confirm with ENTER. Column "N": Enter the minimum number of remaining replicates. Use keyboard for numerical entries and confirm with ENTER. Column „Condition“: Enter one or more conditions which must be fulfilled by each replicate to avoid elimination. Press CE, a display menu appears on the screen with the following character options for formula selection: all special positions defined in the plate layout (standards, controls, blanks), arithmetic functions (+, -, *, /, (), <, >, =), logical combinations (NOT = true if condition is not fulfilled / AND = true if all conditions are fulfilled / OR = true if one of two conditions is fulfilled / XOR = true if none of the entered condition is fulfilled). X (represents each individual replicate of a certain control, blank or standard). Move cursor to select a row and confirm with the corresponding function key. Delete the last entry with CE. Finally reconfirm the formula with ENTER. Application examples: 1. The absorption of a blank value may not exceed 0.020 OD Formula: X <= 0.02 2. The absorption of the individual negative control value (R2) must be less than or equal to 0.150 OD, otherwise the operating manual 40 anthos ht1/ht2/ht3 replicate must be eliminated. Formula: X <= 0.15 3. The deviation of the individual standard values of S1 may exceed the mean value of all standards of S1 by no more than 20 %. Formula: S1 * 0.8 < X < S1 * 1.2 4. The absorption of the individual negative control values must be less than 0.2 OD. Furthermore, they may deviate from the mean value of all replicates by no more than 30 %. Formula: X < 0.2 AND 0.7 * R1 < X < 1.3 * R2 5. The absorption of the positive control R1 must be greater than the mean value of the first two standards (S1 / S2) and less than the mean value of the last two standards (S3 / S4). Formula: (S1+S2) * 0.5 < X < (S3+S4) * 0.5 To turn page press F5 - NEXT. 5.8.2 Control validation - Condition to validate the mean value of standards, controls and blanks If a programmed condition is not fulfilled, the entire test is marked "invalid". Press CE. The following characters shall appear in the display menu: all special positions defined in the plate layout (standards, controls, blanks), arithmetic functions (+, -, *, /, (), <, >, =), logical combinations (NOT = true if condition is not fulfilled / AND = true if all conditions are fulfilled / OR = true if one of two conditions is fulfilled / XOR = true if none of the entered condition is fulfilled). Move cursor to select a row, confirm with the corresponding function key. Delete the last entry with CE. Finally reconfirm the formula with ENTER. Application examples: 1. The test is only valid if the absorption value of the positive control R2 (i.e. the mean value of its replicates) is less than or equal to 0.8 OD. Formula: R2 <= 0.8 2. The test is only valid if both controls lie within the linear range of the photometer. (According to the specification, the linearity of READER 530 as of 0.1 OD is defined as +/- 1 % at 450 mm). Formula: R1 >= 0.1 AND R2 >= 0.1 operating manual 41 anthos ht1/ht2/ht3 The test validation is completed. Entries may still be modified by turning back the pages with PREV. Turn page with F5 NEXT. 5.9 Safeguarding the test in the test memory To safeguard the test just programmed in the test memory, press F2. The test is to be found in the test directory now. If the test is not to be stored, press F4 - NO. This display window does not permit turning back the pages with PREV. operating manual 42 anthos ht1/ht2/ht3 6 Editing, printing and clearing of defined tests 6.1 Edit Test - Changing a test already programmed With the reader turned off: Turn on the reader. After completion of the self-test press F5 - EXIT; in the main menu press F5 - SETUP and then F1 - TEST. The screen will display a directory of all the programmed tests. Mark the test to be edited with the cursor. Confirm by pressing F2 - EDIT. With the reader turned on: Press STOP. The main menu will appear on the screen. Press F5 - SETUP and then F1 - TEST to display all tests already programmed. Mark the test to be edited with the cursor and confirm by pressing F2 - EDIT. Screen display, input and delete functions of the Edit test are identical to test programming. Modifications will not be executed until the storage procedure has been carried out. 6.1.1 To copy a test Select the test to be copied in the test directory. The next display screen will show the parameters for the test identification. Select the test ID# (current identification number in the test memory) with the cursor. Press CE and enter a new (unused!) identification number for the test copy on the keyboard; confirm by pressing ENTER. If the test copy should not be stored under the same name, move the cursor to "Test Name", press CE, enter the new name and confirm with ENTER. Edit the copy and press F5 - NEXT up to the inquiry "Store changes - YES/NO". Press F2 - YES. 6.2 Print Test - Printout of all programmed test parameters Go to main menu with STOP. Check printer settings under System Setup. Press F5 - SETUP and then F1 - TEST. Use cursor to select the test whose parameters are to be printed. Turn on printer and press F3 - PRINT. Printout: All parameters programmed for the test including plate layout, printing date and time will be printed. operating manual 43 anthos ht1/ht2/ht3 6.3 Dir - Printout of the entire test directory Go to main menu with STOP. Check printer inputs under System Setup (F5 - SETUP, F3 SYSTEM, F5 - NEXT),. return to main menu with STOP. Press in sequence F5 - SETUP, F1 - TEST and F4 - DIR. Printout: All programmed tests including identification number, measurement and reference filters, measurement range, selected evaluation type (qualitative, quantitative, etc.) and test size in bytes will be printed. Depending on their complexity, at least 30 tests can be stored. 6.4 Clear - Erasing individual tests or the entire test memory Go to main menu with STOP. Press in sequence F5 - SETUP and F1 - TEST. Mark the test to be erased with the cursor and press F5 CLEAR. Either erase the selected test with F1 - CLEAR or erase the entire test memory with F3 - CLEAR STORAGE. Return to the test directory with F5 - EXIT. operating manual 44 anthos ht1/ht2/ht3 7 RUN TEST: Measuring a plate with a preprogrammed test Go the the main menu with STOP. Press F2 - RUN TEST. All parameters needed to identify a test will appear on the screen. Test #xx: Press CE, mark test in display screen with cursor and press ENTER. The stored test identification number will be searched for automatically. Plate ID: Enter a plate identification number which can consist of a combination of letters and numbers. The same plate identification number may not be given twice as long as the plate is in the plate memory. The default number is the next consecutive number after the last measured plate. Press CE and the alphabet will appear on the display screen in 5 rows and 6 columns. Select the row with the cursors and the column with the respective function key. Enter numbers with the keyboard. Confirm the entire identification number with ENTER. Last Position: If the entire plate has not been allocated, set the last used position on the plate, for which the measurement values are to be evaluated. Press CE and the microtitration plate pattern will appear on the screen. Move cursor to the desired position and confirm with ENTER. Output - Channel: Select the output channel after measuring. NONE: The measurement values are immediately stored in the plate memory with the status „meas.“ (measured) and can be retrieved at any time. DISPLAY: The data are displayed on the screen. They may be printed or transmitted afterwards. PRINTER, RS232: Output of measurement values via printer or external computer. Note: Check printer setup in Setup-System and turn printer on. Place the plate to be measured in the plate transport system. Note: The plate position A01 must be in the upper left corner. The plate will not fit tightly in the transport system until measuring is started and the automatic centering is activated. Press F5 - START MEASUREMENT. The plate is being measured. For the output channel "DISPLAY" the results of the individual wells will be displayed on the screen. A printout will be necessary for the mean values of replicates. operating manual 45 anthos ht1/ht2/ht3 The display of measurement independent of the type of test. data and plate layout is RUN TEST (Screens available according to selected test) Plate Layout Measurement Results (Kinetic Data Reduction) Quantitative Results Standard Data Standard Curve Qualitative Results Kinetic Raw Data Kinetic Raw Data Graphics Kin. Raw Data Graph. Zoom Relational Results 7.1 Measurement Results Press F5 - SELECT SCREEN, move cursor to "Meas. Result", press ENTER. Only half of a plate can be displayed on the screen at one time. Switch to the other plate half with the cursors. For kinetic measurements, the values for the programmed data reduction will be displayed instead of measurement results in [OD]. Function keys: F1 - Report: Printout of measurement data, evaluation results and plate layouts. This function is also available in other program sections. F2 - Transmit: Transmission of measurement data to an external computer. This function is also available in other program sections. F3 - Reject: Deleting measurement values that are not to be included in the calculation (can be revoked). Press CE to display a plate matrix on the screen. Move the cursors to select the well whose measurement value is to be deleted and confirm with F4 - SELECT. If previously marked well is to be included in the computation again, move the cursor to the desired position and press F2 - CLEAR (or F1 - CLEAR ALL). Confirm with ENTER. operating manual 46 anthos ht1/ht2/ht3 F5 - SELECT SCREEN: Depending on the programmed evaluation methods, different ways of displaying the results are available. This function is available for all other program sections of this submenu. 7.2 Plate Layout The plate layout with all special positions (blanks, standards, controls) and the numbered samples set in selected test are shown on the display. Function keys: F1 - REPORT F2 - TRANSMIT F5 – SELECT SCREEN 7.3 Quantitative displays For the test results of a quantitative evaluation the standard curve is always displayed first. Its computation may take a few minutes (above all in the case of the 4-parameter fit). A counter on the display shows that the reader is still working. 7.3.1 Standard Curve First the curve is computed according to the programmed Curve Fit Mode and displayed on the screen. In the case of a linear regression, the calculation limits for the measurement values are established by the calculated straight line. Thus concentration values can be displayed as "<Minimum" although they are greater than the programmed minimum concentration. operating manual 47 anthos ht1/ht2/ht3 Example: Standard point 1: Concentration: 100; Response Formula: (S1+S2) /2; linear regression Evaluation: Interpolated concentration value of the standard point 1: 113, last point of regression line ends at Conc = 120, thus: S1 = <120. Function keys: F1 F2 F4 F5 7.3.2 - Report – Transmit - Edit Standard: Switch to screen display "Standard Data" - Select Screen Standard Data Display of all standard data: Concentration (programmed concentration) Response formula (calculation formula for standard point) Response (measured OD-value) Interpolation (real concentration value of the standard center point). Depending on the selected curve calculation method, slope, offset of regression line from the zero-point of the x-axis (yint), average deviation of the standard points from the curve (correlation) - this value is between 0 and 1 (the best curve fit quality is "1") and the axis scaling are also displayed. Function keys: F1 - Edit: All replicates of the standard previously selected with the cursor keys are displayed. Standards can be removed from the calculation manually. Move cursor to the desired position and press CE. Renewed pressing of CE would include the replicate in the calculation again. F2 - Fit: Modifying the curve calculation method and the axis scaling. F3 - Curve: Switching the display screen to "Standard Curve" F4 - Recalc: Recalculation of the test. If test parameters have been modified, this will be performed automatically upon switching the display screen. F5 - Select Screen: Choice of all available display screens. operating manual 48 anthos ht1/ht2/ht3 7.4 Quantitative Results Display of real concentration values for all plate positions. Blanks are marked "-". Concentration values less or greater than the calculated minimum or maximum value, respectively are marked "<" or ">" if no extrapolation value was programmed. Extrapolated values are marked with an "x" in front of the value. Instead of automatically eliminated values, "A-REJ" (auto-rejected) is displayed. Function keys: F1 – Report F2 – Transmit F5 - Select Screen 7.5 Qualitative Results Group layout of the individual plate positions. Blanks are marked "-", instead of automatically eliminated values, "A-REJ" (auto-rejected) is displayed. Function keys: F1 - Report / F2 - Transmit / F5 - Select Screen 7.6 Kinetic results displays 7.6.1 Kinetic Raw Data For kinetic measurements, the internal absorption values for each measuring cycle are only stored up to the next kinetic or scan measurement, therefore a printout should be made. The cycles may be paged by using the cursor. Function keys F1 – Report F2 – Transmit F5 - Select Screen operating manual 49 anthos ht1/ht2/ht3 7.6.2 Graphics 8/12 Display of the reaction course of all wells according to the limits set in the test program ("Online Graphic Kinetic Parameters") Function keys: F1 - Print: Printout of all graphics for a certain plate. F2 - Col/Row: Choice of column or row of graphics to be displayed. Move cursor to desired position and press ENTER. F3 - Limits: Change of set display range (OD Range, Reaction: increasing/decreasing) F4 - Zoom: Enlarging graphic display of marked well. F5 - Select Screen 7.6.3 Zoomed Graphics Enlarged graphic display of selected plate position. Function keys: F1 - Print: Printout of enlarged graphic F3 - Zoom out: Graphic display of the entire row or column F5 - Select Screen 7.7 Relational Results If the option "relational calculation" has been selected in the test definition, this screen is available in any case, independent of the programmed evaluation methods. The results have been calculated according to the programmed formula. Function keys: F1 - Report F2 - Transmit F5 - Select Screen operating manual 50 anthos ht1/ht2/ht3 8 PLATES: Plate memory, re-evaluation of plates without measuring, printout or view of measurement and evaluation data After each measurement with a preprogrammed test, all measurement and evaluation data, all test parameters and the plate identification number are stored in the plate memory. It can permanently store the data of up to 10 plates. If the memory is full, the respective error message will be displayed on the screen. #: Number of the plate in the memory, consecutive from 1 to 10 Plate ID#: Plate identification number (combination of letters also possible). It is entered prior to the measurement in the menu "Run Test". The incremental number of the last measured test is preset. Test# - Test name: Identification name of the measured test with the corresponding test number (is programmed in the menu "Test Definition"). Stat.: Status display. There are three types of plate status: 1. measured (meas.): The plate was measured but the measured data have not been printed yet. These plates have the highest priority in the memory mode "Shift" and cannot be automatically deleted. 2. evaluated (eval.): The data of these plates were printed. In the shift mode they are automatically deleted consecutively from the plate memory as needed. 3. special kinetic (s-kin): A special two point kinetic has been programmed, the first cycle has already been measured and it is stored under this status in the plate memory. Right when the second cycle has been measured, the two halves are set together and the plate gets the status "meas" or "eval". Note: If no plate is to be deleted automatically, the plate storage mode must be switched to PROTECT in the system setup. Selection of plate with cursors. Function keys: F1 - View: All available results for this plate are displayed on the screen. The data may also be printed or transmitted to an external computer. This submenu is identical to the menu appearing after completion of a measurement (Run-Test) under "Output channel = Display". operating manual 51 anthos ht1/ht2/ht3 F2 - Report: Printout of a report in the matrix, table or combined format (depending on the test program setting). F3 - Transmit: Transmission of measurement values to an external computer. F4 - Re-eval: Repeated evaluation of the raw plate data without measurement. This function makes it possible to have the measurement values of a plate evaluated with another test or to have two or more tests performed on one plate. If a plate is to be evaluated with a new test, make sure the setting of blanks, controls, standards and replicate numbers, etc. conform with the layout programmed for the new test. This function is normally used to edit small programming errors in the test and to have the plate data re-evaluated without having to remeasure the entire plate. Move cursor to mark the plate to be re-evaluated, press F4 - Re-eval, press CE to select a new test from the display screen and confirm with ENTER. Set the last position to be measured on the plate under "Last Position" and select an output channel. Press F5 - START EVAL. After the plate has been evaluated, the data can either be displayed on the screen, printed or transmitted to an external computer. In the plate memory, the plate will remain linked to its original test. F5 - Clear: To erase individual plates or the entire plate memory. Note: Make sure printouts are available before starting to erase. Move cursor to the plate to be erased, press: F5 F1 F3 F5 operating manual – CLEAR: To erase a preselected plate, - CLEAR ID#: to erase the entire memory - CLEAR STORAGE – EXIT: to abort 52 anthos ht1/ht2/ht3 9 Error messages 9.1 Error messages in the display A ABORTED BY USER STOP KEY PRESSED: is displayed when a measurement was aborted by pressing the STOP key. ABORTED BY USER REMOTE CONTROL <STOP>: is displayed when a measurement was aborted by an external command. A/D CONVERTER TIMEOUT!: The AD converter (or one of its driver modules) on the ADC Board is defective. Call a service technician. A/D CONVERTER TOO SLOW: The AD converter (or one of its driver modules) on the ADC Board is defective. Call a service technician. ALL DATA IN PLATE STORAGE WILL BE LOST: is displayed when the entire plate memory is to be erased. (PLATES-CLEAR CLEAR STORAGE). Erase entire memory irreversibly by pressing F2 - CONTINUE or return to the plate directory by pressing F4 EXIT. AUTO REPLICATES AND AG-CONTROL STRIPS CANNOT BE COMBINED: is displayed if both functions were selected in the test program or test edit. Plate calculation must be performed by means of an automatic layout function, whereas the second function can be simulated manually in the menu "Setup Template". B BARCODE READ ERROR: is displayed if the barcode was set to "YES" in the device’s setup, a measurement was started in the menu "Run Test", but the barcode label for the plate identification cannot be read. Check if the plate in the plate transport has a barcode, if the label has been properly attached and if the hardware for an internal barcode reader has actually been installed. Only the following high density codes can be read: EAN8 / EAN13 / CODABAR / CODE-39 / UPC-A / UPC-E / INTERLEAVED 2/5 / CODE 128 (only on special request). Either restart with F2 - REPEAT, enter the plate identification number manually with F3 - MANUAL INPUT or return to the main menu with F4 - SKIP. operating manual 53 anthos ht1/ht2/ht3 C CONTROL MEASUREMENTS WRONG (MIN/CAL/MAX VALUES)!: signifies an error during a measurement in the extended range. Check the filter inputs, the diode values of the lamp block and the cleanliness of the grey glass at the end of the plate transport. If the error recurs, call a service technician. CUTOFF FORMULA MUST BE DEFINED!: is displayed if a certain number of cutoffs was programmed for the qualitative interpretation but no valid cutoff constants or formulas were programmed. Refer to the chapter "Test Definition - Qualitative Evaluation". D DEVICE NOT READY: Upon being activated externally, the computer does not send a „Clear to send“ - (CTS) signal. Check hardware connections (cable) and the computer’s ready to receive state. DO NOT USE BLANKS IN THIS FORMULA!: Blanks can only be used in formula calculations if their range of validity has been defined for the entire plate in the screen „Plate Layout“ (Blank Validity = Plate). E EXTENDED RANGE IS NOT ALLOWED FOR 340 - 400 NM FILTER!: is displayed if a filter under 400 nm is used in the extended range. Either change to normal range or program another filter. EXIT WILL QUIT PROGRAMMING WITHOUT SAVING THE TEST!: is displayed if PREV is pressed in an attempt to enter the test directory during a test definition or test edit. The test editor will remain active by pressing F2 - CONTINUE; the test definition will be discontinued by pressing F4 - EXIT; modifications or any other inputs made will not be stored. F FILTER HOME POSITION NOT REACHED!: is displayed if the filter case does not reach its home position for mechanical reasons. Possible source: the transport system is caught, the optical sensor which recognizes the case is disaligned or defective. In any case, call a service technician. FILTER WITH SELECTED WAVELENGTH IS NOT INSTALLED!: The selected wavelength is no longer installed in the device’s setup. Also check the correct positioning in the filter case when reprogramming, I operating manual 54 anthos ht1/ht2/ht3 INTERNAL BARCODE READER: Communication error between the internal barcode reader and the reader. Check data format and other setup inputs on the Barcode Board. INTERVAL TIME TOO SHORT FOR DEFINED MEASUREMENT: For the minimum time interval setting refer to the drawing in the handbook "Factor Dilution & Kinetic Measurement". INCOMPLETE RESULTS! CONTINUE EVALUATION?: This warning is displayed when a kinetic measurement was aborted before all measurement cycles could be completed. The evaluation can either be aborted or continued with the incomplete data. L LAMP HIGH - CALIBRATION FILTER: Calibration filter measurements in the extended range are too high. Measurements in the normal range are possible. Check the calibration glass at the rear left edge of the plate case for mechanical damage. Call a service technician. LAMP HIGH - MAXIMUM DETECTION: The lamp power on the detector is too high to be able to perform a precise measurement. Print the diode values as described in the chapter "Maintenance", check the installed filter and its program in the setup; if necessary, the filter and the lamp block must be replaced (call a service technician). LAMP HIGH - MINIMUM DETECTION: During a calibration measurement, the maximum darkness value has been exceeded. This can either be due to outside light (open device) or to dis-adjustments on the ADC board (amplifier offset). Print the diode values as described in the chapter "Maintenance" and call a service technician. LAMP LOW - CALIBRATION FILTER: The values obtained during calibration filter measurements in the extended range are too low. Measurements in the normal range are possible. Check the calibration glass on the left rear edge of the plate case for dirt collection and streaks. Clean as well as possible. Call a service technician. LAMP LOW - MAXIMUM DETECTION: The lamp power on the detector is too low to be able to perform a precise measurement. Print the diode values as described in the chapter "Maintenance", check the installed filter and its program in the setup; if necessary, the filter and the lamp block must be replaced. Call a service technician. Check the optical system for dirt collection, liquid residues, particles, etc. LAMP LOW - MINIMUM DETECTION: During a calibration measurement, the minimum darkness value has not been attained. This is usually due to dis-adjustments on the ADC board (amplifier offset, detector diodes) and can only be rectified by a service technician. operating manual 55 anthos ht1/ht2/ht3 LAYOUT PARAMETERS MODIFIED! CONTINUE WILL CLEAR TEMPLATE!: is displayed when the automatic plate layout functions are to be modified during a test edit. This also involves a new, individual plate layout. Press F2 to delete the previous plate layout; press F4 - EXIT to discontinue the modification attempt. M MEASUREMENT NOT POSSIBLE - TRANSPORT SYSTEM NOT INITIALIZED: occurs when the plate transport could not initialize properly. If this message recurs after repeated attempts to start (or self-tests in the service menu), store all test parameters and tests already measured. No further measurements can be performed. Call a service technician. N NO DEFINED TEST IS AVAILABLE! TEST DEFINITION IN SETUP/TESTS: is displayed when a plate is to be measured in the Run-Test menu but the test memory in the menu Setup/Tests is empty. See test programming in the chapter "Define-Tests". NO SAMPLE SET ON PLATE! EXIT WILL GIVE YOU ANOTHER CHANCE!: This warning is displayed, if no samples were set on the plate during test programming. Press F2 CONTINUE to ignore the warning. NOT ALL FILTERS HAVE BEEN DEFINED: is displayed if a certain number of filters to be measured was set in the Quick menu Multi, but not all were allocated a corresponding wavelength. Set the number of filters to the correct amount. NOT ENOUGH MEMORY - HEAP OVERFLOW: only occurs for internal software problems, i.e. after program dumping. If the message recurs after repeated attempts to initialize the device, print all programmed tests and plates already measured and call a service technician to replace the software. NOT ENOUGH MEMORY - PLEASE CLEAR TEST(S): The device’s test memory is equipped with a dynamic memory structure, so that although at least 30 tests can be programmed, a maximum capacity cannot be defined. The remaining memory available is displayed in the menu Setup/Test on the lower edge of the screen (Memory used: xxxx bytes). When this error message is displayed, the remaining memory is not sufficient for a new test definition. After printing the test parameters, erase one or more tests (move cursor to mark desired test, press F5 - CLEAR, confirm with F1 - ID# xxx). NOT ENOUGH STANDARDS DEFINED FOR THIS CURVE FIT METHOD!: The minimum number of standard points for various curve evaluation methods: linear regression: 2 points; point to point: 2 points; cubic spline: 3 points; 4-parameter fit: 4 points (refer to the chapter 5.5 "Report & Evaluation"). operating manual 56 anthos ht1/ht2/ht3 NO PLATE DETECTED: No microtitration plate was detected in the plate transport. Insert a plate and start again. If this error message occurs frequently for no apparent reason, inform a service technician. NO TEST WITH THE SELECTED ID NUMBER IS AVAILABLE: appears when a test was selected with a test identification number for which no defined test is yet available in the Run Test menu. Press ENTER, move the cursor to the right on the test name and press CE. A list of all the programmed tests with the corresponding identification number will appear. Set the cursor to the desired test and press ENTER. NO WELL POSITIONS SET FOR MONITORING: During test programming at least one plate position, whose value is to be compared with the defined parameters, must be selected in the Monitoring Mode. Go to "Well positions", press CE and select the desired position on the plate matrix displayed on the screen. O OD UPPER LIMIT MUST BE HIGHER THAN LOWER LIMIT: appears when the wrong limit was set for either the monitoring mode or for the kinetic data reduction (Delta t absolute) during test programming. The correct OD range must always be defined by a higher (=upper) limit and a lower limit“. P PLATE DATA IS CORRUPTED - CANNOT BE LOADED: The plate data cannot be loaded due to a checksum error in the device’s memory module (program dumping). If the error recurs after repeated attempts to initialize the reader, please measure new plate. Turn off device; after 1 hour, check if the complete data are still available. If not, replace batteries after incomplete plate memory was printed (see chapter "Maintenance") and erase entire memory. If the error occurs again, call a service technician. PLATE HOME POSITION NOT REACHED: appears when the plate carriage does not reach its initial position on the right side of the transport system. Check if transport is hindered for mechanical reasons (sticky or bent guide bars). Otherwise, call service technician (to check the home position sensor of the plate transport system and the positioning of the reflex strip). PLATE STORAGE IS FULL: The plate memory can store up to 10 plates including measurement data. If the "SHIFT" type of memory was selected under Setup, the evaluated plates will be erased from the memory automatically. If not (type of memory "PROTECT"), the plate memory must be erased in part or completely from time to time after the data has been printed. This also applies if only those plates whose status is "measured" remain in the memory. PLATE TRANSPORT INITIALIZATION: is displayed if the connection to the device’s lamp block is interrupted for operating manual 57 anthos ht1/ht2/ht3 hardware or software reasons. In any case, call a service technician (to check cable connections, temperature shut down board and lamp block for proper functioning). PLATE WITH SELECTED ID NUMBER EXISTS ALREADY: is displayed if a plate identification number is selected in the Run Test menu, that has already been allocated to a previous test. For an unequivocal allocation it is absolutely necessary to assign an individual number to each plate in the plate memory which is to be measured. Press ENTER and set a new ID#. The display is automatically preset to the next consecutive identification number. PRINTER NOT READY: Turn on printer, check that there is enough paper in the paper feed and check for proper functioning. R REFERENCE CHANNEL TOO LOW!: The values of the lamp block’s reference channel are too low. Print the diode values as described in the chapter "Maintenance". Measurements in the normal measurement range can usually be performed without error. Nevertheless, inform a service technician. S SELECTED TEST CONTAINS INVALID DATA: The contents of the selected test are incomplete or invalid due to errors in the device’s internal memory components (checksum error). Nevertheless, try to print the test parameters. If only one test is affected by this error message, do not erase, otherwise the defective memory area could spread to other tests. SERIAL COMMUNICATION: The device is having trouble in serial communication with a computer. Check if the baud rate, parity bit and data format conform in both devices (data is received with frame or overflow errors). SERIAL COMMUNICATION - BUFFER FULL: The maximum length of the data string sent by the computer may not exceed 192 bytes. SHAKING DURATION TOO LONG FOR DEFINED MEASUREMENT: Either the shaking duration must be shortened or the interval time extended. See drawing "Minimum interval time" in chapter "Factor dilution & kinetic measurement". T TRANSPORT STEPS LOST: The measurement value evaluation on the microtitration plate is defined by a certain number of steps. Steps can be lost due to an inaccurate plate transport and a plate evaluation is no longer possible. If the error message recurs, call a service technician. operating manual 58 anthos ht1/ht2/ht3 W WRONG X DEFINED - CANNOT USE X!: (*) The formula in the validation part of the test definition must not contain an "X" (incomplete erasing of XOR) WRONG X DEFINED - MUST BE USED ONCE!: A formula must be entered for the evaluation of relational values in the test definition, in which the variable X (representing all samples, controls, standards and blanks on the plate) occurs exactly once. This is necessary to limit the relational calculation to a linear model. Also refer to the chapter "Report & Evaluation". WRONG X DEFINED - YOU MUST USE X!: (*) For the automatic elimination of replicates in the test definition, a formula must be defined for each control, each blank and each standard to be evaluated, in which the variable X (represents the individual replicate of the control / the standard / the blank) must be used at least once. 9.2 Error messages and warnings in the printout ERROR: CALCULATION OF RELATIONAL FACTOR NOT POSSIBLE!: The relational factor is calculated with a formula programmed in the test definition. If an element of such formula becomes invalid after completion of the replicate elimination or test validation, etc. (e.g. S1 was "rejected" or R1 is "overflow"), no relational factor can be calculated. ERROR: INTERPRETATION NOT POSSIBLE: No qualitative evaluation can be performed. This error message occurs if the values of the cutoffs are not in ascending order or if the cutoff formula cannot be calculated at all (e.g. since an element in the formula is nonexistent, overflow, rejected, etc.). ERROR: INVALID CURVE SHAPE: is displayed if the standard curve cannot be calculated unequivocally. Possible remedy: Select another curve fit mode. ERROR: NO BLANK SUBTRACTION POSSIBLE: If all replicates of a certain blank are faulty (overflow, invalid), a blank subtraction is no longer possible. No evaluation takes place; the test is invalid. ERROR: QUANTITATIVE EVALUATION - MORE STANDARD POINTS REQUIRED: The minimum number of standard points depends on the selected curve fit mode. If not enough points were defined in the test definition or if plate evaluation points are lost (rejected, overflow, auto-eliminated), the curve can no longer be evaluated. Possible remedy: repeat the test or select another curve fit mode (also refer to the chapter „Report & Evaluation). ERROR: QUANTITATIVE EVALUATION - INVALID CURVE DATA: A standard curve calculation is no longer possible. operating manual 59 anthos ht1/ht2/ht3 Neither standard curves nor concentration values can be obtained. Find error by means of the printout. ERROR: QUANTITATIVE EVALUATION - INVALID POINT SEQUENCE: The points of the standard curve are not available in an uninterrupted ascending or descending order. No concentration calculation is performed. Find error by means of the printout. Try to re-evaluate after eliminating the standard "outlier" or re-evaluation after defining the test without including the faulty standard in the curve calculation. ERROR: TEST INVALID - AUTO REPLICATE ELIMINATION: (*) Due to the auto-elimination the minimum number of replicates for (at least) one standard, one control or one blank was not attained. The test is considered invalid, although an attempt to evaluate was made. ERROR: TEST INVALID (CONTROL VALIDATION)!!: (*) The test becomes invalid since a condition for control validation was not fulfilled. An attempt to evaluate is made nevertheless. Find error by means of the printout.. WARNING: BLANK STATUS!: At least one replicate of a blank is faulty (overflow / rejected / invalid / auto-eliminated). The test is evaluated. A check of the printout is recommended. WARNING: CONTROL STATUS!: At least one replicate of a control is faulty (overflow / rejected / invalid / auto-eliminated). The test is evaluated. A check of the printout is recommended. WARNING: STANDARD STATUS!: At least one replicate of a standard is faulty (overflow / rejected / invalid / autoeliminated). The test is evaluated. A check of the printout is recommended. WARNING: QUANTITATIVE EVALUATION - COEFFICIENT OF CORRELATION TOO LOW: The correlation coefficient has been defined as a measure for the fit of the individual standard points in the calculation mode of the linear regression lines. The best curve fit is defined as 99% (points lying on the line). In the test definition "Quantitative Evaluation" a minimum coefficient was defined, which falls short of the previously run test. A possible remedy is to strike out replicate outliers manually (if no automatic replicate elimination or an insufficient automatic replicate elimination was programmed). operating manual 60 anthos ht1/ht2/ht3 10 Communication between the HT1/2/3 and an external computer The serial interface is specified according to the CCITT and the EIA RS232-C interface standard. The following is a description of the pin configuration and the signals to be transmitted. TOP APPLE SERIAL RXD 1 TXD 3 2 6 7 5 4 8 GND 6 7 8 3 4 5 9 1 2 CTS DB-9 connector plug -pin configuration Signal level: The range from +3V to +12V corresponds to space (logical "0") for data signals and "ON" (logical "1") for control signals. The range from -3V to -12V corresponds to a mark (logical "1") for data signals and "OFF" (logical "0") for control signals. The serial RS232-C interface and the Sub MIN D9 socket used for the HT1/2/3 correspond to the PC-AT personal computers. IBM XT 25pin READER READER 1 1 TXD 2 2 TXT RXD 2 2 TXT RXD 3 3 RXD TXD 3 3 RXD DSR 6 4 DTR 4 4 GND 7 5 GND DCD 8 6 DTR 20 1 DCD 1 5 GND GND 5 DSR 6 6 7 CTS RTS 7 7 CTS RTS 4 8 CTS 8 8 CTS 5 9 9 9 MACINTOSH READER DIR 1 1 CTS 2 2 TXT TXD 3 3 RXD GND 4 RXD 5 6 DCD 7 operating manual IBM AT 9pin 4 5 GND 6 7 CTS 8 8 9 9 61 anthos ht1/ht2/ht3 Transmission format: 1 start bit 2 stop bit 8 data bits even parity The data transmission rate can be adjusted from 300 to 19200 baud (normal setting = 9600 baud) in the submenu SETUP/SYSTEM (press F5 in the main menu, then F3 and F5NEXT). A precondition for the serial communication with an external computer is a terminal program which is able to receive data transmitted in the ASCII format. The communication can begin as soon as the computer software is installed, the serial cable connected, the device setup correctly configured and the Reader in the standby mode (display in the main menu). The Reader’s display shows the current transmission status (e.g. data transfer, etc.), does not, however, indicate the remote controlled status. Communication can be discontinued by pressing the STOP key. 10.1 Principles of the communication process All transmissions, including the acknowledgement signal, begin with ASCII STX (start of text, hex 02) and end with ETX (end of text, hex 03). 1. Receipt of command: a command string defined by a command key with a maximum length of 192 bytes is sent to the Reader. 2. Transmission of answer: an answer string with checksum (Cxx) is sent to the computer. Either a successful command transmission is acknowledged (ack = +) or a transmission error message is displayed (nack = -). Transmission errors can have the following reasons: The Reader did not recognize the command, the parameters were not completely transmitted, the parameters were not within the specified range, etc. Example: STX + Cxx ETX STX - Cxx ETX Positive acknowledgement Negative acknowledgement 3. Execution of process (measurements, access to Reader data,...): Only if the command received a positive acknowledgement. operating manual 62 anthos ht1/ht2/ht3 1. Command to Reader OK! 2. Acknowledgement 3. Process Execution 4. Data Transmission measurements 10293 12093 01298 34748 29173 021938 18293 102938 82733 2873 access to reader data 4. Transmission of result data: After the specified process was successfully concluded in the Reader, the results are transmitted to the computer as defined. In case of an error, an error message is transmitted (message key = "E"). 10.2 Command keys 1. "V" - display of software version installed 2. "F" - display of filters installed in setup 3. "N" - normal measurement (also possible with several wavelengths) 4. "D" - bichromatic measurement (measurement and reference wavelengths) 5. "M" - transmission of 35 transmission values per well (agglutination and scan measurements) 6. "A" - agglutination measurement with adjustable number of well positions to be transmitted ( 0 - 31) 7. "K" - kinetic measurement combined with shaking function 8. "PD" - transmission of plate directory (plate identification numbers, tests, status of individual plates) 9. "PR" - transmission of the evaluated results of a specific plate in the plate memory 10. "TD" - transmission of the test directory (all tests defined in the test memory) 11. "TR" - measurement of a plate according to the parameters specified for a certain test in the Reader, evaluation of results and transmission 12. "H" - shaking 13. "R" - repeat of the last data transmission (only possible if no other remote control or stand-alone command has been executed in the mean time) 14. "B" - transfer of the plate identification number via barcode reader operating manual 63 anthos ht1/ht2/ht3 15. "?" - setup information (transfer of type of device, software version, installed filters, barcode reader status and temperature control status) If measurements are to be performed in the extended measurement range (display range = 0 - 3.5 OD), the letter "h" (high range) will be inserted after of the command character. Example: STX, Kh 450 15 20 H 2 5", ETX (kinetic measurement in the extended measurement range, 450 mm measurement filter, 15 seconds time interval, 20 measurement cycles with interval shaking of medium intensity, shaking duration = 5 seconds). 10.3 Generation and transmission of checksum The checksum is only transmitted from the Reader to the computer and not vice versa. If it contains an error, the last data string transmission can be repeated by using the "R" command. The next command cannot be carried out until all data have been received. Example: data string = 12345 1 2 3 4 5 [char] [char] [char] [char] [char] = = = = = 31 32 33 34 35 [hex] [hex] [hex] [hex] [hex] = = = = = 0011 0011 0011 0011 0011 0011 0001 0010 0011 0100 0101 0001 = XOR-logic Transmission of the checksum in the ASCII code: 0100 (defined supplement) plus 0011 (checksum, first part) —> 0100 0011 = 43 [hex] = C [char] 0100 (defined supplement) plus 0001 (checksum, second part) —> 0100 0001 = 41 [hex] = A [char] Thus, the resulting checksum is "CA" Thus, the transmitted string is: STX 12345 CCA ETX STX 12345 C CA ETX END OF TEXT CHECKSUM CHECKSUM KEY DATA STRING START OF TEXT Together with the setting of the parity bit (device setup), this type of error control is so efficient that only a 4-fold symmetrical bit error would cause an undiscovered transmission error. operating manual 64 anthos ht1/ht2/ht3 10.4 Description of commands 10.4.1 "V" - transmission of software version number Command string to the Reader: STX V ETX Answer string to the computer (example): STX Anthos Labtec HT2 Version 1.22 E Cxx ETX 10.4.2 "F" - transmission of filters installed in setup Command string to the Reader: STX F ETX Answer string to the computer (example): STX 620 540 492 450 405 340 Cxx ETX Up to eight filter values can be transmitted. 10.4.3 "N" - normal measurement with up to 8 wavelengths Command string to the Reader: STX Nh 3 405 550 620 ETX (start of text, key "N", optional character "h" for measurements in the extended measurement range, number of measurement filters, filter wavelengths, end of text). Note: remember to space between individual parameters. The answer string to the computer contains one or more socalled headers in front of the measurement results to indicate the wavelength (W), the time the measurement was started (T), the plate identification number (optional) and a CR signal at the end of a line (carriage return). The measurement results are multiplied by factor 1000, i.e. transmitted in [mOD]. Overflow values are displayed as 9999. A measurement value is always formatted right-justified to 5 places, always preceded by at least one leading space (hex 20). Generally, leading zeros are displayed as spaces. In case of a negative result, the number is preceded by a "-". The results are transmitted to the computer in the order A1 to H1 followed by a CR signal and the transmission of the next column. Example: STX W 405 T 9:13:12 CR 1290............... ....... ....2499 CR ...... ...... ...... ....... ...... ....... CR .............................. ... ...145 CR W 550 T 9_ 13: 14 CR 45 102............... ..... ...2200 CR ............................. ......2170 CR W 620 T 13: 1 CR operating manual Start, header of first wavelength Result A1 - H1 Result A12 - H12 Header of second wavelength Result A1 - H1 Result A12 - H12 Result of third wavelength 65 anthos ht1/ht2/ht3 1050.................. ............-35 CR 1000........................ .....930 CR Cxx ETX 10.4.4 Result A1 - A12 Result A12 - H12 Checksum, end of text "D" Dual wavelength measurement (bichromatic measurement Command string to the Reader (example): STX Dh 450 620 ETX (start of text, key "D", optional character "h" for measurements in the extended measurement range, measurement wavelength, reference wavelength, end of text) The answer string to the computer contains a header in front of the measurement results to indicate the wavelengths (W), the time the measurement was started (T) and the plate identification number (optional). For general formatting see "N" - normal measurement. Example: STX W 450 620 T 12:30:01 CR 1230............................2610 CR 9999............................2003 CR Cxx ETX 10.4.5 Start, header Result A1 - H1 Result A12 - H12 Checksum, end of text "M" scan measurement of 35 measurement points per well Command string to the Reader (example): STX M 450 ETX (start of text, key "M", measurement wavelength, end of text) The answer string to the computer contains a header indicating the wavelength (W) and the time the measurement was started (T). Subsequently the measurement results are transmitted: 35 transmission values per well. These values are multiplied by factor 100 and formatted right-justified to 6 places, always preceded by at least one leading space. Step size per measurement point = 0.1753 mm. For general formatting see "N" - normal measurement. Example: STX W 450 T 14:30:20 CR 50430 52790 52900... ..... CR ....................................... CR 49000 ..... ......... ..... 34500 CR Cxx ETX 10.4.6 Start of text, header Result A1 35 measurement points Result H12 35 measurement points Checksum, end of text "A" Agglutination measurement with adjustable number of well positions (1 to 31 Command string to the Reader (example): STX A 450 5 -2 -1 0 1 2 ETX (start of text, key "A", measurement wavelength, number of operating manual 66 anthos ht1/ht2/ht3 measurement points, position of measurement points (-15 to +15 in relation to the center of the well). The answer string to the computer contains a header indicating the wavelength (W), the number of measurement points per well (A), the time the measurement was started (T) and the plate identification number (optional). The measurement values are displayed as transmission values (multiplied by factor 100) and formatted right-justified to 6 places (preceded by at least one space). Step size per measurement point = 0.1753 mm. Example: STX W 450 A5 T 15:10:10 CR Start of text, header 1029 2981 12902 91002.... CR Result A1 - H1 Position -2 18935 199 .......................... CR Result A1 - H1 Position -1 ............................................ CR etc. 18393 9848......................... CR Result A1 - H1 Position +2 17653 18384 65372............. CR Result A2 - H2 Position -2 .............................................CR etc. 12903 28734 8273 897........ CR Result A12 - H12 Position +2 Cxx ETX Checksum, end of text 10.4.7 "K" kinetic measurement with interval shaking Command string to the Reader (example): STX Khd 450 620 30 10 H 2 3 578 ETX start of text, key "K", extended measurement range (h optional), bichromatic (d - optional), time interval between kinetic cycles in [sec], number of measurements, interval shaking (H): shaking mode (1 = low, 2 = medium, 3 = high), shaking duration (maximum 60 sec), optional plate identification number, end of text. The answer string to the computer contains at least headers indicating the wavelength(s) (W), time measurement was started (T - beginning with 0) and number of measurement cycles (N). For general formatting "N" - normal measurement. two the the see Example: STX W 450 620 T 00 N 1 CR 1290 234........................-23 CR .............................................CR ............9999..................145 CR W 450 620 T 30 N2 CR 1359 389.........................36 CR .......................................... CR W 450 620 T 300 N 10 CR 2524 672.......................832 CR ...........................................CR 2983 782.......................943 CR Cxx ETX operating manual Start of text, Header for 1st cycle Results A1 - H1 etc. Results A12 - H12 Header for 2nd cycle Results A1 - H1 etc. Header for last cycle Results A1 - H1 etc. Results A12 - H12 Checksum, end of text 67 anthos ht1/ht2/ht3 10.4.8 "PD" - Plate directory (transmission of plate memory directory) Command string to the Reader (example): STX PD ETX (start of text, key "PD", end of text) The answer string transmitted to the computer contains the plate status (E = evaluated, M = measured, K = special kinetics), the plate identification number, the test identification number according to test directory and the test name of each plate in the directory. Example: STX E A123 2 HERPES CR E 1000001 12 HIV+2 CR M 2214991 1 RUBESTAT CR M 1000002 12 HIV+2 CR Cxx ETX 10.4.9 Start of text, 1st plate 2nd plate 3rd plate 4th plate Checksum, end of text "PR" - Plate results (transmission of plate results) Command string to the Reader (example): STX PR 100001 ETX (start of text, key „PR“, plate identification number according to plate directory, end of text). The answer string to the computer transmits measurement and evaluation data. Refer to the chapter „Transmission of Evaluation Results“. 10.4.10 "TD" - Test directory (transmission of test directory) Command string to the Reader: STX TD ETX (start of text, key "TD", end of text) The answer string to the computer indicates the test identification number and the test name for each test in the directory. Example: STX 1 HIV+2 CR 2 HERPELISA CR 3 RUBELLA CR HIV.SCREEN CR Cxx ETX Start of text, 1st test 2nd test 3rd test 4th test Checksum, end of text 10.4.11 "TR" - Test run (plate measurement with predefined test) Command string to the Reader (example): STX TR 5 100001 ETX (start of text, key "TR", test identification number, plate identification number (optional, according to directories), end of text). operating manual 68 anthos ht1/ht2/ht3 If the plate identification number is specified, it must be different from the numbers already programmed in the directory, since if the numbers are identical, a "no acknowledgement" signal will be transmitted to the computer. If no particular plate identification number is specified, the last ID-number is automatically incremented. A measurement is started and the raw data evaluated in accordance with the programmed test. The measurement and evaluation data are transmitted in the answer string to the computer. Refer to the chapter "Transmission of Evaluation Results". 10.4.12 "H" - Shaking Command string to the Reader (example): STX H 2 5 ETX (start of text, key "H", shaking mode (1 = low, 2 = medium, 3 = high), shaking duration (maximum 60 sec), end of text). The Reader acknowledges the command, executes the shaking command but does not send an answer string back. 10.4.13 "B" - Transmission of plate identification number via barcode Command string to the Reader: STX B ETX (start of text, key "B" (= read barcode label), end of text) The plate carriage enters the device and an attempt is made to read the label via plate barcode. Upon acknowledgement the plate identification number is sent as an answer string to the computer. Example: STX 100001 Cxx ETX 10.4.14 "R" - Repeat (repeat of the last data transmission) If the last data transmission from the device was faulty (e.g. checksum error), it can be repeated using the command R. Command string: STX R ETX 10.4.15 Error messages If the measuring process is interrupted (light energy fluctuations, transport system, stop key...), communication is discontinued and an error message containing an error code number and a short description of the type of error is sent to the computer. operating manual 69 anthos ht1/ht2/ht3 Example: STX E 01 Plate transport Cxx ETX 10.5 Transmission of evaluation results 1. By selecting the output channel "RS232" in the Reader menu Plate or Run Test 2. By entering the remote control command "TR" (Run Test), "PR" (Plate Results) 3. By selecting "Transmit" with the function keys in the Reader menu Plate, Run Test. 4. By having programmed Outputchannel "RS232" in the Reader menu Setup Tests and having performed a measurement using this test. Note: Transmission of pure ASCII data as per result data string pattern. The data are merely separated from each other by space. The entire data file is divided into individual blocks or fields. Only those blocks needed for the respective test are transmitted (e.g. no quantitative data for a qualitative test). The block length depends on the complexity of the test used. Blocks are unmistakably identified by their headers. Each block begins with a character (#) and a key word (e.g. header) representing the block beginning. It ends with the character for the beginning of the next block or the end mark (#End) at the end of the data file. The following key words have been defined: Header / Message / Sample / Blank / Control / Cutoff / Standard / Curve Basically two different types of blocks have been defined: 10.5.1 Blocks with multiple information They consist of one or more lines, each line able to contain numerous information units. Only blocks with the key words "Header", "Message" or "Curve" at the block beginning can contain this type of information. Example: # Header Format 110 Plate ID 12234781 10.5.2 # = block beginning character, Header = key word Format = description of information, 110 = information Data line Blocks with the same type of information (=record format) The key words "Sample", "Blanks", "Control", "Cutoff" and "Standard" are used at the beginning of this type of block. Depending on the number of samples, these blocks always contain the same sequence of information. A row of field names operating manual 70 anthos ht1/ht2/ht3 defining the contents of the individual record follows after the key word. A record is always one line in length and contains data fields. Data fields contain the information defined by their field names, relating to one sample at a time. Example: block begin character | key word for the block beginning | | Field names | | | # SAMPLE_ID POSITION MEAS MEAS_STAT CONC CONC_STAT Schematic transmission format # blockbegin - keyword-1 datadescription 1 data 1-1 datadescription 2 data 2-1 datadescription 3 data 3-1 data 3-2, etc. # blockbegin-keyword-2 datadescription 1 data 1-1 datadescription 2 data 2-1 data 2-2 datadescription 3 data 3-1, etc. # blockbegin-keyword-3 fieldname1 fieldname 2 fieldname 3 datafield datafield datafield datafield datafield 1-1 2-1 3-1 4-1 5-1 datafield datafield datafield datafield datafield 1-2 2-2 3-2 4-2 5-2 datafield datafield datafield datafield datafield 1-3 2-3 3-3 4-3 5-3 # blockbegin-keyword-n fieldname 1 fieldname n etc. # end-keyword 10.6 Description of individual blocks 10.6.1 Header (block with multiple information) Example: # Header FORMAT 110 PLATE_ID 123457 TEST_ID HIV DATE92-JAN-09 TIME13-01-14 Evaluation quantitative qualitative Version number of data format Plate identification number Test identification Date Time of measurement Evaluation mode In addition the following information - depending on the test program - can be displayed in a separate line: Basis_quantitative measurement_data To indicate the basis of Basis_quantitative relational_factor the quantitative evaluation Basis_qualitative measurement_data To indicate the basis of Basis_qualititative concentration the qualitative evaluation Basis_qualitative relational_factor operating manual 71 anthos ht1/ht2/ht3 10.6.2 Message (block with multiple information) For the transmission of error messages and warnings. # Message message_type message_number message_text Example: # Message Warning 101 Standard_Status Summary of error messages and warnings: 10.6.3 Error 1 Interpretation_not_possible Error 2 Calculation_of_curve_not_possible Error 3 Quantitative_evaluation_not_possible Error 4 Calculation_of_relational_factor_not_possible Error 5 Test_invalid_Auto_replicate_elimination Error 6 Test_invalid_Control_validation Warning 100 status_of_blank_abnormal Warning 101 control_status Warning 102 standard_status Warning 110 COEFFICIENT_OF_CORRELATION_TOO_LOW Sample (record format) Display of measurement, identification and evaluation data for individual samples. (The line shown below is wrapped) # SAMPLE ID POS MEAS MEAS_STAT CONC CONC_STAT GROUP GROUP_STAT RELAT RELAT_STAT The data fields can contain the sample number (ID), the plate position (POS), the measurement value (MEAS), the status of the measurement value (MEAS_STAT), the concentration (CONC), the concentration status (CONC_STAT), the group (GROUP), the group status (GROUP_STAT), the relation values (RELAT), the status of the relation values (RELAT_STAT). 10.6.4 Blanks (record format) Display of validity range and positioning # Blank PLATE/COLx/ROWx POS MEAS MEAS_STAT The data fields contain the blank’s validity range: operating manual 72 anthos ht1/ht2/ht3 on the entire plate (PLATE) for one column (COL 1-12) for one row (ROW 1-8) In addition, they contain the blank’s position on the plate (POS), its measurement value (MEAS) and the measurement value status (MEAS_STAT). 10.6.5 Control (record format) Display of the set controls (The line shown below is wrapped): # Control ID POS MEAS MEAS_STAT CONC CONC_STAT GROUP GROUP_STAT RELAT RELAT_STAT The data fields can contain the sample number (ID), the plate position (POS), the measurement value (MEAS), the status of the measurement value (MEAS_STAT), the concentration (CONC), the concentration status (CONC_STAT), the group (GROUP), the group status (GROUP_STATUS), the relation value (RELAT), the status of the relation value (RELAT_STAT). 10.6.6 Cutoff (record format) Display of the set cutoff values. # Cutoff NR CUTOFF CUTOFF_STAT The data fields contain the number of the cutoff (NR), its value (CUTOFF) and its status (CUTOFF_STAT). 10.6.7 Standards (record format) Display of measurement, identification and evaluation data for the set standards. (The line shown below is wrapped) # Sample ID POS MEAS MEAS_STAT CONC CONC_STAT GROUP GROUP_STAT RELAT RELAT_STAT The data fields can contain the sample number (ID), the plate position (POS), the measurement value (MEAS), the status of the measurement value (MEAS_STAT), the concentration (CONC), the concentration status (CONC_STAT), the group (GROUP), the group status (GROUP_STAT), the relation value (RELAT), the status of the relation value (RELAT_STAT). 10.6.8 Curve (Block with multiple information) Display of curve fit mode and corresponding data. # Curve STATUS 0 (= okay) STATUS 1 (= invalid) operating manual - Curve status 73 anthos ht1/ht2/ht3 FIT_MODE FIT_MODE FIT_MODE FIT_MODE AXIS AXIS AXIS AXIS 10.6.9 0 1 2 3 LINEAR REGRESSION POINT_TO_POINT CUBIC_SPLINE 4_PARAMETER FIT LIN LIN LIN LOG LOG LIN LOG LOG - Curve fit mode - Type of axis (for x and y axis) SLOPE 0.2345 YK 2.4456 - Curve coefficient (for linear regression:) A 123.45 B 0.34E12 C 1.2234E-8 D 4.333E-14 - Curve coefficient (for 4_parameter fit:) Status The status is an evaluation key for the respective plate position. It is only displayed in connection with measurement values (MEAS_STAT), concentrations (CONC_STAT), groups (GROUP_STAT) and relational values (RELAT_STAT) and can have one of the following values: 10.7 0 okay 1 invalid 2 rejected 3 overflow 4 underflow 5 extrapolated + 6 extrapolated - 7 auto rejected Example of data transmission Via the command "TR" a test was run remote controlled on the reader. The following parameters have been set: Plate layout with 4 vertical replicates, horizontal filling direction and 4 blanks on position A01 to D01. Two standards on the positions A02-D02 and E03-H03 with the concentration value 1 ref. 100. As a curve fit method linear regression has been selected. operating manual 74 anthos ht1/ht2/ht3 Data output: HEADER FORMAT 110 PLATE_ID 1000 TESTNAME TEST DATE 2-DEC-1992 TIME 14:21:52 EVALUATION QUANTITATIVE BASIS_QUANTITATIVE MEASUREMENT_DATA # SAMPLE ID POS MEAS MEAS_STAT CONC CONC_STAT 1 A03+B03+C03+D03 .282 0 11.11 0 2 A04+B04+C04+D04 .420 0 21.13 0 3 A05+B05+C05+D05 .561 0 31.34 0 4 A06+B06+C06+D06 .699 0 41.34 0 5 A07+B07+C07+D07 .839 0 51.53 0 6 A08+B08+C08+D08 .977 0 61.5 0 7 A09+B09+C09+D09 1.118 0 71.7 0 8 A10+B10+C10+D10 1.256 0 81.72 0 9 A11+B11+C11+D11 1.394 0 91.75 0 10 A12+B12+C12+D12 1.534 0 100 3 11 E01+F01+G01+H01 1.141 0 73.39 12 E02+F02+G02+H02 1.326 0 86.82 13 E04+F04+G04+H04 1.690 0 100 3 14 E05+F05+G05+H05 1.877 0 100 3 15 E06+F06+G06+H06 2.059 0 100 3 16 E07+F07+G07+H07 2.247 0 100 3 17 E08+F08+G08+H08 2.434 0 100 3 18 E09+F09+G09+H09 2.623 0 100 3 19 E10+F10+G10+H10 2.814 0 100 3 20 E11+F11+G11+H11 3.000 3 100 3 21 E12+F12+G12+H12 3.000 3 100 3 # STANDARD ID POS MEAS MEAS_STAT CONC CONC_STAT GROUP GROUP_STAT S1 A02+B02+C02+D02 .142 0 1 0 S2 E03+F03+G03+H03 1.508 0 100 0 # CURVE STATUS 0 FIT_MODE 0 LINEAR_REGRESSION AXIS LIN LIN CORREL 1 SLOPE .01379 YK .1285 # END C@B operating manual 75 anthos ht1/ht2/ht3 11 Maintenance The device’s lamp block and the optical system located underneath, are very sensitive to all light changes and thus also to outside influences such as dust particles, soiling, etc. A few simple preventive measures can almost completely eliminate this risk. 11.1 General WARNING: PRIOR TO PERFORMING THE MAINTENANCE WORK DESCRIBED IN THE FOLLOWING CHAPTERS PLEASE MAKE SURE YOU WORK ACCORDING TO THE GUIDELINES GIVEN AT THE BEGINNING OF THIS MANUAL. All maintenance work requiring opening of the instrument must be performed ony with mains disconnected and must be performed by a technical qualified person! There are only a few parts in the anthos HT1/2/3 which need regular maintenance. 11.2 Recommended regular inspection The Anthos HT1/2/3 is designed in a way appropriate use no danger for the user is caused. that during The correct function with regards to measurement performance is assured by an automatic check of the relevant technical parameters prior to each individual measurement. In case of a problem the instrument reports an error message. Anthos recommends to have the instrument inspected by an authorized service partner at an interval of about 2 years. During this inspection the correct function of the instrument can be verified. Additionally Anthos offers special test plates which may be used by the user to regularly verify the performance of the instrument. 11.3 Cleaning 1. Always cover the turned off device with the dust cover included in supply. 2. Clean filter: Turn on device, press right cursor, remove filter case from the right insert. Press sides of locking bar together, carefully slide bar and filter from the case. Blow with compressed nitrogen and clean manually with a cotton operating manual 76 anthos ht1/ht2/ht3 swab or optical paper. Do not use alcohol or detergents containing water. Return filter to its case and check the order in the device’s setup. Push filter-case into the filter transport system till it reaches the end stop and press left cursor. The filter case moves to its operating position. 3. Change air filter every four to six months; Tools required: Philips no.1 or Pozidrive crosshead screwdriver, spare dust filter as included in supply. Loosen screw A on rear of lamp casing (see drawing next page) Slide lamp block casing forwards and lift off. Lay sideways on the outer casing without unplugging. Loosen air filter screw on the front of the lamp block, remove screw and lock washers, remove air filter with filter lattice and insert new filter Screw filter firmly into place Return lamp block casing into place and fasten with screw and corresponding plastic washer 11.4 Changing the batteries The batteries which provide the turned-off device with power to store tests and plate data should be replaced every two years. The following signs can indicate also weak batteries: Error message "Selected test contains invalid data" Error message "Plate data is corrupted - cannot be loaded" Error message "Not enough memory - heap overflow" operating manual 77 anthos ht1/ht2/ht3 Sudden changes in the settings under the device’s SETUP (wavelengths, time and date setting) Difficulty in printing plate data, tests and memory contents Tools required: Philips no.1 or Pozidrive crosshead screwdriver, 3 spare batteries (1.5V alkaline, format: LR6 / AA / AM3). If instrument data is already corrupted, make a printout of all remaining tests and all stored plates and delete them afterwards: Note: When changing the batteries as a preventive measure, it is not necessary to delete the stored data! Connect a printer and switch on both instruments. Go to the Main Menu by pressing STOP or F5-EXIT. Press in sequence F5-SETUP and F1-TEST . Press F4-DIR to make a printout of the test directory. Press F3-PRINT to make a printout of the parameters of the first test. Mark with cursor the second test and repeat procedure. Press in sequence F5 -CLEAR and F3-CLEAR STORAGE to delete all tests. After having performed a printout of all tests press STOP to go back to the Main menu. Press F4-PLATES and F2-REPORT. A printout of the first stored plate is performed. Mark with cursor the next plate and repeat procedure. After having performed a printout of all stored plates Press F5CLEAR and F3-CLEAR STORAGE to delete all plates. Loosen screw A on rear of lamp casing (see drawing). Slide lamp block cover forwards and lift off. Lay sideways on the outer casing without unplugging. Loosen tape and remove batteries from their holder. Insert three new 1.5 V alkaline batteries. The holder is marked + / - for the direction of inserting the batteries. Note: Incorrectly inserted batteries will cause storage problems and result in a loss of data. Put lamp cover into place and fasten with screw and corresponding plastic washer. To check: Program new setup and several tests. Note corresponding data or print test parameters. Turn device off. Check after approx. 24 hours. If the data does not conform, check if the batteries are inserted in the right direction and if the cable is connected to the battery holder. If no error can be found, make a test printout and call a service technician. 11.5 Replacing the lamp block Since the problems in and around the light source can have a variety of causes, the lamp block should only be exchanged operating manual 78 anthos ht1/ht2/ht3 after consulting a service technician. The following signs are an indication of lamp problems: Error message: "Lamp high - Maximum detection" Error message: "Lamp low - Maximum detection" Error message: "Reference channel too low!" Error message during initialization test: "Low energy" - lamp energy is still sufficient to perform the measurement, however, a check of the lamp block is recommended "OV - energy" - lamp energy is too high; check diode values of the reference channel." "No energy" - lamp energy is too low; check the lamp block. If the lamp block must be replaced, please follow the following directions: Tools required: Philips no.1 or Pozidriv crosshead screwdriver, spare lamp block with original packing. Switch off instrument Loosen screw A on rear of lamp cover (see drawing. Slide lamp block cover forward and lift off. Lay sideways on the outer casing without unplugging. Loosen air filter screw on the front of the lamp block, remove screw and lock washer, lift off air filter and filter screen and lay aside. Loosen two unvanished screws on the top of the lamp block and remove them. Loosen earthing screw under the right front corner of the block (only a few rotations with the screwdriver are sufficient). Evenly raise lamp block approximately 5 cm. Note: Do not touch lamps. Loosen the two cable connections on the end of the block. Note: pull off on plug only. Lay lamp block aside with the lamps facing up. Remove new lamp block from packing without touching lamps. Join plug connections . Note: Do not connect plugs displaced laterally and insure correct lock (latches on the plug) Place lamp block evenly on guide bolts and press down uniformly. Tighten two screws on the top of the lamp block (do not forget washers) Tighten earthing screw under the right front corner of the block firmly. Fasten air filter. Place lamp block cover back on device. Turn device on and wait for initialization. Print diode values according to manual. In case of malfunction, check cable connections and firm fit of earthing screws. If the values do not improve, call a service technician. Tighten screws on lamp block cover (do not forget plastic washers). Place the old lamp block, annotating the device’s operating manual 79 anthos ht1/ht2/ht3 serial number, and send to the service technician in its original packing. 11.6 Replacing the fuses In case of malfunction, the fuses (in the mains filter next to the mains socket on the rear of the device) can be checked and replaced. Open fuse-carrier next to the mains socket (see drawing) with a screwdriver Remove fuse Insert spare fuse included in supply (2 ampere, slow) Close fuse-carrier. Check set mains voltage next to fuse-carrier, turn device on and check functioning. In case of malfunction, call a service technician. replace fuse: 250 V; 2 A slow 11.7 Self test - Interpretation A diode printout should be printed each time an error occurs for self-interpretation and to facilitate error detection by the service technician. (A example for this printout is shown on the end of this chapter) The HT1/2/3 by ANTHOS LABTEC has a light source consisting of 8 individual measurement channels and one reference channel which regulates the internal light control. Nine individually selected tungsten-halogen lamps are located on the lamp block for this purpose. After the light beam has penetrated all lenses, microwells and filters the residual light (final transmission) is focused on 9 photodetectors. Their analog signal is transformed into digital values on the ADC (Analog-Digital Converter). operating manual 80 anthos ht1/ht2/ht3 The ADC can resolve up to 212 values, resulting in a theoretical range between 0 and 4095. We call these values "Diode values", because they are measured by the light detecting photodiodes on the ADC. Among other things, the test measurement provides the diode values for all 9 channels The lamp function, the state of the optical system, the measurement linearity, etc. can be checked in this manner. 11.7.1 Performing the self-test An automatic self-test is performed during each initialization. The same routine can be initiated in the service menu by pressing F1-SELF TEST. The raw data is printed by pressing F2PRINT RAW DATA. 11.7.2 Self test interpretation (see sample printout at the end of this chapter) ADC check: Check of the proper functioning of the Analog Digital Converter board. Lamp controller check: Check of the proper functioning of the lamp regulation. Check of the energy for all installed wavelengths. Eprom checksums: Check of the software chips by checksum calculation. Diode values: The diode values for all 8 measurement channels (A-H) and the reference channel (R) are shown. Remove the filter case from the device (press the right cursor in the main menu). Check the number of filters, filter position and wavelengths by referring to the protocol. Vacant positions in the filter case should not be programmed "0" to avoid error messages such as "Division by Zero" (better: position 5 = "5", position 6 = "6", etc.). The first part of the diode values indicates the so-called bright values. They should lie between 2500 and 4000. Vacant positions must be displayed as "4095", i.e. "Overflow" since the maximum lamp energy (white light) strikes the detector. Thus, the first position without a filter does not indicate an overflow-value, since normally no light can reach the detector due to the filter's lockbar. Usually the diode values decrease slightly for filters with shorter wavelengths. This is due to the fact that for filters with shorter wavelengths more energy is needed. This has no effect on the measurement results. The second part of the diode value printout indicates the so called dark values. They are attained by measuring with turned off lamps and correspond to the minimum measurement values. For wavelengths greater than 400nm they must lie between 10 and 50, for wavelengths less than 400nm between 30 and 100. This difference is due to a builtin amplification switch. Check ADC: A further check of the proper functioning of the amplifier switch for wavelengths less than 400 nm. The operating manual 81 anthos ht1/ht2/ht3 values for the first line should lie between 10 and 50, for the second line between 30 and 100. Check lamp controller: The values of the first line must clearly deviate from those of the second line (at least 100 diode values). Example for a selftest-printout of the anthos HT Anthos HTII Reader Version 1.22 Self Test ---------------------------------------------------------------------------------------------Date: 30-APR-1999 Time: 7:32:29 Page# 1 ---------------------------------------------------------------------------------------------Serial Nr.: ............................ ADC check OK Lamp controller check OK 1. 2. 3. 4. 5. 6. Filter Filter Filter Filter Filter Filter 620nm 540nm 492nm 450nm 405nm 340nm E P R O M IC 12: 1B03 IC 13: C9E0 IC14: 32F4 Energy Energy Energy Energy Energy Energy for for for for for for filter filter filter filter filter filter OK OK OK OK OK OK C H E C K S U M IC 15:0EBB IC 16:5E34 IC17: 9068 Diode Values R A 1. 620nm 3532 2. 540nm 3541 3. 492nm 3455 4. 450nm 3530 5. 405nm 3291 6. 340nm 3143 7. 007nm 63 8. 008nm 4095 B 3480 3501 3470 3470 3270 3075 62 4095 C 3357 3463 3475 3358 3416 3274 60 4095 D 3524 3542 3507 3501 3463 3258 4095 4095 E 3355 3386 3330 3363 3394 3041 61 4095 F 3143 3229 3218 3142 3138 3034 55 4095 G 3452 3548 3509 3599 3471 3286 57 4095 H 3294 3361 3326 3302 3267 3060 61 4095 3524 3603 3511 3424 3498 3220 60 4095 Lamp off: 1. 620nm 2. 540nm 3. 492nm 4. 450nm 5. 405nm 6. 340nm 7. 007nm 8. 008nm 21 22 21 20 21 60 59 58 23 23 24 22 23 56 55 57 20 20 20 21 21 61 60 61 23 23 23 23 23 59 60 59 22 22 22 21 22 59 58 58 21 21 20 20 20 54 55 53 23 23 22 20 22 56 59 58 20 20 20 24 21 59 59 60 21 20 21 22 21 60 59 59 Check ADC: 1. 23 2. 60 21 56 20 51 23 59 23 59 20 51 22 54 22 56 23 59 3543 1053 3385 1023 3226 969 3551 1075 3369 1017 3606 1080 Check Lamp controller: 1. 3543 3503 3467 2. 1070 1058 1054 operating manual 82 anthos ht1/ht2/ht3 12 Principles of photometric measurement Light is electromagnetic wave radiation. Rays from 100nm to 400nm are defined as the ultraviolet spectrum of light. Only rays in the range from 400nm to 780nm are visible for the human's eye, rays with longer wavelengths are called infrared. Color impressions are caused by reflection of electromagnetic waves striking the surface of material substances. Substances absorb the complementary spectrum of their visual perceptible color. Hence green plants look green since they absorb red light (light of a wavelength perceived as red, e.g.: round about 750nm). A photometer is an opto-electronical measuring device to determine the amount of transmission of a substance for light of a certain wavelength. 12.1 Units of measurement Transmission is defined as the ration between: the total available light energy at the detector (measured through air) and the residual luminous energy after sample transmission at a specific wavelength. Transmission is expressed as a percentage value that response in a nonlinear way to layer thickness and sample concentration. Thus, one layer of a certain material has a 10% transmission whereas 4 layers of the same material only have 0.01%. For this reason the resulting values are converted internally into a linear measurement unit, the absorption. The unit is expressed in OD (optical density). OD = log (1/trans) The absorption indicates the amount of light absorbed by the sample. Conversion is performed according to the "Bouger-LambertBeer" law: The logarithm of the ratio of the light intensity before (I0) and after the sample (I) expresses the result in so called OD values (also: Extinction = E) E = OD = log I0 / I The optical density (OD) is determined according to the following formula: operating manual 83 anthos ht1/ht2/ht3 E = OD = c * d * e c = the concentration of the sample to be measured d = the layer thickness of the sample to be measured e = the molar extinction coefficient 12.2 Measurement at specific wavelengths Each substance to be measured has a specific transmission profile that indicates its concentration and composition. A measurement with white light renders different sample concentrations in a certain spectral range only to a small amount and accordingly inaccurate. A higher significance can be obtained by using only that part of the light spectrum which is relevant to prove the respective wavelength of the substance. Due to this fact interference filters of a narrow banded wavelength spectrum are employed in this instrument. Each substance has a certain absorption spectrum. A measurement should be performed by selecting the correct filter for the maximum absorption of the sample, because in this way the best differentiability of various sample concentrations can be reached. We can also state that the differing absorption amplitude of two uniformly composed samples, is a measure for the concentration. For this reason measurements in the flank area of the spectrum are not very accurate and therefore to be avoided. In this operating manual 84 anthos ht1/ht2/ht3 connection, it has to be taken into consideration that - when using interference filters - wavelength tolerances of +/- 2 nm from the nominal wavelength value may also result in inaccuracies. Each sample has an absorption minimum not specific to the measurement value, which can be deducted from the measurement value automatically by choosing a suitable reference wavelength. This kind of measurement is referred to as bichromatic. Absorption spectrum (measurement and reference wavelength) 12.3 Measurement range calibration The device can resolve the luminous energy received by the detector into a maximum of 4095 values (diode values). Prior to each measurement, a calibration is performed automatically by measuring the dark value for 0% transmission and the bright value for 100% transmission (blank measurement against air). The resulting values correspond to the resolution limits which can be obtained in practice. The device has been pre-adjusted such that the diode values are greater than 0 for the dark value measurement and lower than the theoretical maximum for the bright value measurement (4095). This prevents an underflow or overflow of the theoretically possible limits. This initial calibration always guarantees a 100% measurement range, even if there is a change of the luminous energy. operating manual 85 anthos ht1/ht2/ht3 The formula to calculate a transmission value is as follows: T = (Meas - Min) / (Max - Min) T Meas Min Max = = = = Transmission Diode value during measurement Diode value at 0% measurement Diode value at 100% measurement Example 1: Max = 3600 ; Min = 20 ; Meas = 30 (30 - 20) / (3600 - 20) = 0.0028 Log (1 / 0.0028) = 2.552 OD Example 2: Max = 3600; Min = 20; Meas 3000 (3000 - 20) / (3600 - 20) = 0.754 Log (1 / 0.754) = 0.122 OD 12.4 Plate centering The microplate is centered precisely under the optical axis of the measuring system prior to transport for the following reasons: to minimize the influence of the sample meniscus that causes variations of the sample layer thickness within the cavity, to minimize its effect as a concave lens while determining the optical density. The centering preciseness is independent of the type or the manufacturer of the used plate. The plate is scanned in steps of 0.175 mm. This corresponds to approximately 35 measurements per well. The resulting OD-values are calculated as an average of two measurement values of the 5 center points of each well. operating manual 86 anthos ht1/ht2/ht3 12.5 Reference channel The device's lamp block consists of 9 independent tungstenhalogen lamps (8 measurement channels, 1 reference channel). Reference measurements compensate possible influences on the lamp's energy during measurement, as voltage fluctuations from the mains and the wear of the lamps. The reference channel also serves to regulate the lamp voltages according to the used wavelength. Any change of the reference value during course of measurement appears as a correction factor in the measurement. operating manual 87 anthos ht1/ht2/ht3 13 Intended Use This device is intended for photometric measurements in microplates in all kind of laboratories including clinical laboratories. 13.1 Quality control The quality control criteria of a diagnostic kit have to be described in the package insert of the kit. For the performance of any reagent quality control it has to be referred exclusively to those instructions. With an internal "Control Validation" (see chapter 5.8), the software provides optionally a mean to program such quality controlling processes in the HT1/2/3. 13.2 Calibration 13.2.1 Instrument calibration In some kit instructions the instrument calibration is referred to as "blanking against air". This is equivalent to the automatic instrument calibration described in chapter 1.3.2 Measuring process. 13.2.2 Reagent Calibration (Blanking) Generally reagent calibration is done by deducting a blank value from sample-, control- and standard values. See chapter 1.3.5 Rated operating conditions. The programming of blanks has to be done according to the instructions given in the package insert of a diagnostic kit. operating manual 88 anthos ht1/ht2/ht3 13.3 Interpretation of measurement results The interpretation of measurement values is subject to the limits of error and tolerances. See chapter 1.3.6 Limits of error and tolerance limits). Measurement data in the field of vertical photometry are dependent on liquid volumes, meniscus and microplate shapes. Therefore they are relative values and evaluation is possible only within one microplate. For the interpretation of results it has to be referred to the instructions given in the package insert of a diagnostic kit. It is the user's responsibility to check evaluated results with the corresponding raw data values. operating manual 89


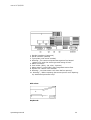
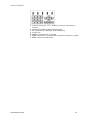


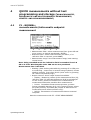
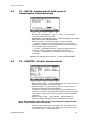


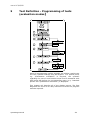
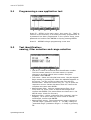
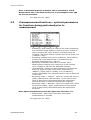
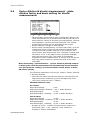
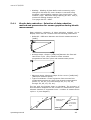
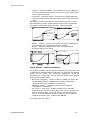
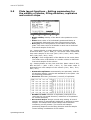
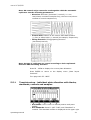
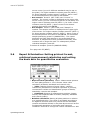
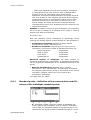

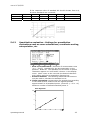

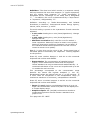


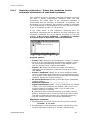
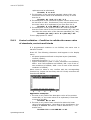

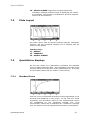

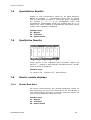


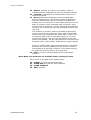

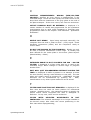


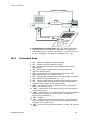


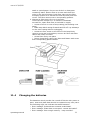

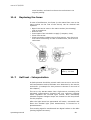
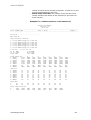

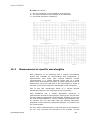
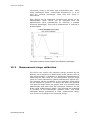


![[v0.3.5.63 Blue Release] (4.17MB PDF)](http://vs1.manualzilla.com/store/data/005758602_1-69f3b29a9a050ef0b6d8d37fccf12e09-150x150.png)