1
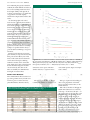
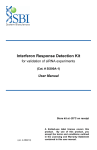
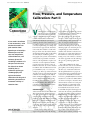
36 LCGC NORTH AMERICA VOLUME 23 NUMBER 1 JA N UA RY 2005
www.chromatographyonline.com
Flow, Pressure, and Temperature
Calibration: Part II
GC
Connections
In last month’s installment
of “GC Connections,” John
Hinshaw discussed how
peak retention times
depend upon relationships
between pre s s u re, flow
rate, oven temperature ,
column dimensions, and
stationary phase. This
concluding installment of a
two-part series discusses
the effects that column
variability has on
isothermal capillary gas
c h romatography and
e x p l o res instrument
calibration with the goal of
maximizing instrument-toinstrument similarity of
retention times.
V
ariations in the oven temperature
and carrier-gas pre s s u re influence
peak retention times significantly
enough so that differences from column to
column and instrument to instru m e n t
make method validation a necessity for
ensuring consistent results. Instrument-toi n s t rument variability can be brought under
c o n t rol by implementing a few simple calibration and set-up pro c e d u res, and va l i d ation is made more reliable as a result. The
first part of this series showed that analysts
should understand the effects of perf o r m i n g
the same analysis on different gas chromatography (GC) systems on theva r i a b i l i t y
of their results, in particular on retention
times (1). The dependencies of peak re t e ntion times on oven temperature and inlet
pressure can be large enough to cause significant deviations of 15 s or more betwe e n
i n s t ruments when the individual oven temp e r a t u res differ by only 1 °C or the pre ss u res by 1 psi. The scope of these variations
depends in turn upon the chromatographic
conditions, the column, and the analytes
under examination. Although not a substitute for validation and suitability testing,
i n s t rument calibration can help to reduce
the normal variability that will be encount e red when working with multiple instruments and multiple columns.
Column Effects
John V. Hinshaw
GC Connections Editor
T h e re are three main column variables that
affect retention times: dimensional va r i ations such as inner diameter and length;
stationary phase variations both in the
chemistry and the film thickness; and aging
effects due to gradual contamination with
sample residue as well as phase loss due to
overheating. This month’s column addresses
some of the issues related to dimensional
variations.
I vividly recall spending many long
nights in the graduate school lab drawing
out borosilicate glass columns on a cantank e rous machine that would have made cartoonist Rube Goldberg proud (see
www. rube-goldberg.com). If I was lucky
enough to obtain a single 10-m long piece
of coiled tubing, I then was faced with the
tasks of coating the column with a stationary phase that I had synthesized fro m
scratch and installing it intact into the gas
chromatograph’s oven. I made no pre t e n s e
of duplicating any of these handmade
columns and I don’t know what the tolerance levels we re on their inner diameters or
film thicknesses. Fortunately, this had no
bearing on my work. Howe ve r, it did leave
me with an appreciation of the technology
that goes into producing capillary GC
columns.
Two studies published in the 1970s
recorded the state of the art of commerc i a l
glass capillary GC column production at
the time (2,3). A statistical evaluation of
the data published in the two papers (4)
re veals retention-factor standard deviations
of 5.9% for 16 methylsilicone columns,
11.4% for 7 phenylmethylsilicone columns,
and 30.4% for 9 Carbowax 20M columns
(2). In the second report, the authors measured the relative retention of several peak
pairs and found, not surprisingly, much
smaller standard deviations: 0.28–0.37%
for methylsilicone and 0.32% for Carb owax 20M. Nonpolar columns pre p a red
with twice the stationary phase film thickness had even smaller column-to-column
relative retention variations (3). The va r iability of the column inner diameter does
not affect retention factors under the
isothermal conditions used, and its range
was given as dc 5 270 6 20 mm (2).
Today, analysts rely upon column manuf a c t u rers to produce a consistent pro d u c t
f rom fused-silica tubing. Ad vances in tubing production and chemical treatment,
stationary phase synthesis, column coating,
38 LCGC NORTH AMERICA VOLUME 23 NUMBER 1 JA N UA RY 2005
and conditioning have greatly reduced the
variability in column dimensions and re t e ntion as well as yielding much lower bleed
levels, higher stability, and longer life. It
would be ve ry interesting to see similar data
on populations of modern capillary
columns that compares them with the older
studies.
Gas chromatographers who want to
ensure the best consistency from column to
column should choose one manufacturer as
their column source for each specific analytical method. T h e re are no technical re asons to select or eliminate any part i c u l a r
manufacturer, but columns from the same
company will be much more self-consistent
than would be the case for columns fro m
d i f f e rent manufacturers with the same
nominal dimensions and stationary phase
types. Of course, some column companies’
proprietary stationary phases and column
chemistry might be better suited for certain
applications. Careful evaluation of multiple
examples of a specific column is always a
good idea before committing to any part i cular choice.
Batch-to-batch variations in stationary
phase chemistry are important because they
affect peak retention dire c t l y, but in this
article, I will assume that the columns all
a re the same in this respect. Working
within the tolerances of the old column
study, which can be taken as larger than the
absolute maximum range that would be
e n c o u n t e red today, what then are the
effects of variability in column diameter
and length on retention times?
www.chromatographyonline.com
F i g u re 1: Effect of column inner diameter on retention times. (a) Inner diameter 5 200–300 mm ;
(b) close-up view, inner diameter 5 240–260 mm. Column: 25 m 3 250 mm; column temperature:
100 °C; pressure drop: 15 psig, column outlet at room pressure. Key: (blue) n-dodecane, K100 °C 5
522.1; (green) n-undecane, K100 °C 5 270.2; and (red) n-nonane, K100 °C 5 70.99.
will decrease as the square of the inner
diameter decreases, as equation 1 show s .
[1]
[2]
We can compare the effect of differe n t
column inner diameters on velocity at con-
This type of square-law relationship predicts a strong dependence of the linear
velocity, and thus retention times, on the
column diameter.
Table I shows the effect of changing the
column inner diameter across a relatively
wide range — from 200 to 300 mm — on
the retention times of the same three example hyd rocarbon peaks as used in the first
part of this series, and the data are presented graphically in Fi g u re 1a. The effects
on retention time are large. Table II gives
the same data for a narrower range of inner
diameters, from 240 to 260 mm, as might
be encountered in practice, and the corresponding plot is shown in Fi g u re 1b.
Ac c o rding to this information, to keep
retention times within a maximum range of
Column Inner Diameter
The column diameter affects both the ave rage carrier gas linear velocity and the re t e ntion factor, given a constant stationary
phase film thickness. The linear velocity
Table I: Retention times (in seconds) for three peaks across a wide range of column inner
diameters, o p e rated isothermally at 100 °C. For conditions, see Fig. 1.
Peak Retention Time (s)
Inner Diameter (mm)
200
210
220
230
240
250
260
270
280
290
300
stant column pressure, length, and temperature as follow s :
n-Dodecane
n-Undecane
n- N o n a n e
K100°C 5 522.1
K100°C 5 270.2
K100°C 5 70.99
415.3
363.8
320.7
284.4
253.7
227.4
204.8
185.2
168.1
153.2
140.1
270.4
238.6
211.8
189.1
169.8
153.2
138.8
126.3
115.3
105.7
97.2
155.9
139.6
125.7
113.8
103.5
94.5
86.7
79.7
73.6
68.1
63.2
40 LCGC NORTH AMERICA VOLUME 23 NUMBER 1 JA N UA RY 2005
www.chromatographyonline.com
615 s, the inner diameter would have to
fall within 66 mm or about 62.4% of the
nominal 250-mm inner diameter for the
longest retained peak shown here; within
610 mm for the middle peak; and within
620 mm for the earliest eluted peak.
As peak retention increases, the variability in inner diameter required to keep peaks
within a defined range decreases rapidly.
Howe ve r, with isothermal elution, the
widths of the peaks increase with longer
retention, and the effect of the variability
becomes less significant. This is not the case
for temperature - p rogrammed elution, but
this topic lies outside of the discussion
being presented here .
Thus, it appears that for columns of the
same type used for the same isothermal
analysis, if the inner diameters from one
column to the next lie within less than
62% of the nominal diameter, then peaks
will be eluted within a fairly tight window.
Remember, though, that other variables are
also at play here. Temperature and pressure
variability will add more uncertainty to the
retention times.
Column Length
Variations in column length also affect
retention times. Di f f e rences between column lengths on the order of 1 m or more
a re not uncommon within a population of
initially equal-size columns that have been
in use for some time. Re m oval of a small
p o rtion of a column is part of good laborat o ry practices that call for the use of new
inlet and detector ferrules with each installation. Additional lengths can be remove d
from the column entrance as part of column reconditioning in order to re m ove
n o n volatile sample residues that have accumulated at the beginnings of columns.
The effects of varying column lengths
depend upon how the analyst sets up the
columns. One approach would be to
choose the same pre s s u re drop for all
columns of a particular type. In this case,
retention times will va ry with the square of
the column length, as shown in equation 3,
which was obtained by combining equations 1, 2, and 3 from the first installment
of this column series (1):
[3]
This is not a desirable situation. The
peak with partition coefficient K 5 522 at
100 °C (n-dodecane), which is eluted in
227 s on a 25-m column with a 15.0-psig
pressure dro p, would shift to 210 s on a
24-m column with the same pre s s u re dro p.
The effect on later-eluted peaks would be
e ven larger.
If, on the other hand, the carrier-gas linear velocity we re set the same for the 24-m
column as the 25-m column, by adjusting
the inlet pre s s u re dow n w a rd slightly to 14.4
psig for the shorter column, then the same
peak would shift by about half as much, to
a round 218 s. Keeping the retention time
the same for both column lengths would
require a further decrease in the shorter column’s pre s s u re drop to around 13.8 psig.
This pressure corresponds to an ave r a g e
carrier-gas linear velocity that is exactly the
ratio of the two columns’ lengths times the
original velocity. In this case, that’s
24.0/25.0 3 34.0 5 32.64 cm/s. The other
peaks follow suit in this case and have the
same retention times on the shorter column
under these lowe red inlet pre s s u re conditions as they do on the longer column at
15.0 psig.
Setting up by linear velocity: In practice, it’s fairly easy to set up a column in
this manner. First, measure the approximate
length of the column by counting the turns
(include any fractional first or last turn)
and multiplying by the average length of a
single turn, as in equation 4:
L ≈ tc • p dh
length, for which the method conditions
we re developed. Third, multiply by the
d e s i red average carrier gas linear velocity for
the method to obtain the linear velocity
goal for the specific column being installed,
as shown in equation 5:
[5]
Finally, as part of verifying the setup,
establish the operating or initial column
t e m p e r a t u re and then adjust the inlet pre ss u re as required to produce the calculated
velocity.
For GC systems with electronic pre s s u re
c o n t rol (EPC), the EPC system will calculate and set the correct pressure for the
d e s i red velocity if the measured column
length is entered first. Howe ve r, slight va r iations in the column diameter from the
nominal diameter can produce a slight
e r ror in this step. The operator can approx imate the apparent column diameter at this
point by comparing the measured carrier
gas linear velocity to the desired value as
e n t e red into the EPC system. Be c a u s e ,
a c c o rding to equation 2, the ratio of the
velocities is equal to the square of the ratio
of the diameters, a corrected diameter can
be calculated in this manner:
[6]
[4]
w h e re tc is the turns count and dh is the
nominal column helical coil diameter. Use
a value of dh that’s close to the appare n t
a verage value for the coils of the column.
Next, calculate the ratio of the length of
the column at hand to the nominal column
For the example given above, if the
d e s i red velocity was 32.64 cm/s for the 24
m 3 250 mm column, but the observe d
velocity was 34.9 cm/s, then the corrected
column inner diameter would be:
Table II: Retention times (in seconds) for three peaks across a narrow range of column
inner diameters, o p e rated isothermally at 100 °C. For conditions, see Fig. 1.
Peak Retention Time (s)
Inner Diameter (mm)
240
242
244
246
248
250
252
254
256
258
260
n-Dodecane
n-Undecane
n-Nonane
K100°C 5 522.1
K100°C 5 270.2
K 100°C 5 70.99
253.7
248.1
242.7
237.4
232.3
227.4
222.6
217.9
213.4
209.0
204.8
169.8
166.3
162.9
159.5
156.3
153.2
150.1
147.2
144.3
141.5
138.8
103.5
101.6
99.8
98.0
96.2
94.5
92.9
91.3
89.7
88.1
86.7
42 LCGC NORTH AMERICA VOLUME 23 NUMBER 1 JA N UA RY 2005
www.chromatographyonline.com
[7]
Upon entering this corrected inner diameter into the EPC column configuration,
the electronic pressure controller will adjust
the pre s s u re dow n w a rd sufficiently to produce the desired average carrier-gas linear
velocity. Due to the variations in inlet pre ss u res from instrument-to-instrument, howe ve r, this pro c e d u re should be re p e a t e d
w h e n e ver a column is set up.
Temperature and Pressure
Calibration
With a better understanding of the effects
of column variability on retention times,
we are in a position to examine the re q u i rements and effects of temperature and pre ss u re calibration in laboratories that utilize
multiple gas chromatographs.
What to expect: Gi ven that small
changes in temperature or pre s s u re can shift
retention times significantly, what should
gas chromatographers expect from their
i n s t rumentation? How much pressure and
t e m p e r a t u re variation is normal betwe e n
gas chromatographs that are operating
within the manufacture r’s specifications? I
read through a number of bro c h u res, specification sheets, operator’s manuals, and
s e rvice manuals. I found that pre s s u re and
t e m p e r a t u re tolerances va ry somewhat by
manufacturer and for some items, there was
little or no information. Most GC systems
p roduced in the past 10–15 years include
p rovisions for oven temperature, carrier
pressure, and flow calibration via the
instruments’ keyboard–display and
f i r m w a re. Thus, gas chromatographers can
bring these variables under some degree of
control.
Temperature: In my experience, ave r a g e
oven temperatures va ry between instruments by as much as 62 °C or slightly
m o re. When left uncalibrated, larger deviations can be expected between different
models than between the same model gas
c h romatographs. The apparent degree of
variation also depends upon how the temp e r a t u re is measured. All GC ovens exhibit
t e m p e r a t u re gradients between the internal
t e m p e r a t u re sensor, where the temperature
is measured, and other locations within the
oven. The degree of temperature gradients
depends upon many factors, such as the
oven temperature setpoint; whether the
cooling flap or door is open or shut; the
condition of the door closure and insulation; the temperatures of the inlets and
detectors; and any other material, such as
columns, va l ves, and other accessories, that
affect heat and air flow. Gradients of as
much as 2–4 °C across the oven are not
uncommon even under the best
c i rcumstances.
One very important consideration is the
distinction between the oven temperature
setpoint as displayed on the GC, calibrated
or not, and the actual temperatures along
the column. Columns are not located at the
t e m p e r a t u re sensor, which measures only a
single point anyway. As peaks move
t h rough the column, they circle aro u n d
with the column tubing and run through
slightly hotter and slightly cooler temperature areas. Upon elution, they have experienced an average temperature that is a composite of the temperature at any defined
point in the oven. This is the normal situation and these slight temperature variations
don’t affect peak shapes or resolution
significantly.
With a better
understanding of the
e ffects of column
variability on
retention times, we
a re in a position to
examine the
re q u i rements and
e ffects of
temperature and
p re s s u re calibration
in laboratories that
utilize multiple gas
chromatographs.
Placing a column too close to the oven
wall will increase this effect, because the
coolest areas in the oven tend to be nearest
the walls. Conve r s e l y, the hottest areas
often are near the inlets and detectors.
Shifting a column’s position from the fro n t
of the oven to the back can have a noticeable effect on retention times as well. Thus,
for the best consistency, it is wise to install
columns close to the central axis of the
oven and always either in the front or the
44 LCGC NORTH AMERICA VOLUME 23 NUMBER 1 JA N UA RY 2005
www.chromatographyonline.com
back position as dictated by the
inlet–detector configuration and the
methodology. As long as the overall thermal
e n v i ronment is consistent, the re t e n t i o n
times will be as we l l .
Pressure: Carrier-gas inlet pre s s u res are
c o n t rolled either by electronic pre s s u re cont rollers or by manual regulators, which may
or may not have electronic pressure gauges.
For capillary columns with inner diameters
less than 530 mm, a pre s s u re-controlled
split–splitless inlet system is the most common. Even for EPC in the constant-flow
mode, with this type of inlet, the GC system actually controls the inlet pre s s u re and
sets it as re q u i red to maintain the desired
f l ow rate, using relationships derived fro m
equations 3–5 from the first installment of
this column (1).Wi d e - b o re columns of
530 mm i.d. and up can use a true flow c o n t rolled carrier source instead.
If a Bourdon-type mechanical pre s s u re
gauge is in use, then there is little re a l i s t i c
need to calibrate it because it is inherently
inaccurate and nonlinear, compared to elect ronic transducers. In such cases, chromatographers should rely on the gauge as
an approximate pre s s u re indicator and
instead use carrier-gas average linear ve l o city measurements for column setup purposes. I also have seen a digital electro n i c
pressure device with an attached syringe
needle, which gives a fairly accurate reading
when inserted into an inlet.
Most of the electronic pressure transducers for EPC systems are specified to delive r
accuracies of 62% of their full-scale re a ding. For a 0–100 psig transducer, that’s
about 62 psig, while for a 0–30 psig transducer, it’s more like 60.6 psig. These erro r s
show up as deviations from a perfectly linear relationship between the actual pre s s u re
and the readout, and according to our calculations, they are large enough to cause
noticeable retention shifts from one instrument to another. The solid-state pre s s u re
transducers cannot be calibrated by the
i n s t rument for their nonlinear full-scale
e r rors, but all of these GC systems support
a ze ro offset adjustment, which can be as
large as an additional 60.5 psig or so.
Calibration
Properly performed, temperature calibration and inlet pre s s u re ze ro-compensation
can help tremendously in attaining more
consistent instru m e n t - t o - i n s t rument results.
Howe ve r, it also is necessary to consider
c a refully other variables such as column
dimensional variations and positions inside
the column ove n .
Oven tempera t u re: A precision temperature measuring device and appro p r i a t e
p robe are necessary for meaningful ove n
calibration. The probe and meter combination should be capable of 0.2 °C or better
resolution. If consistency of results betwe e n
i n s t ruments that will be calibrated with diff e rent thermometers is important, then the
thermometers should all be calibrated to
NIST standards by their manufacturers.
For single locations, a single thermometer
should work well enough with a simple icebath re f e rence.
As long as the overall
thermal enviro n m e n t
is consistent, the
retention times will
be as well.
It is ve ry important to place an external
t e m p e r a t u re probe consistently when measuring oven temperatures for calibration
purposes. Bearing in mind that in any case
the calibration will only reflect a singlepoint temperature, the best placement is as
close as possible to the instrument’s temperature sensor. If variations between differe n t
i n s t rument models are a concern, then
slightly better results might be obtained by
positioning the temperature probe close to
the center of the oven in the area where the
column will be located. In any case, the
p robe should never be placed close to the
oven walls or directly in a line of sight with
the oven heater coils. Be sure that the pro b e
cable does not interfere with the gas chromatograph’s oven door and that intro d u cing the probe does not create an extra air
leak from the outside.
See the user’s manual or service manual
for details on exactly how to calibrate the
t e m p e r a t u re for a specific instrument. In
general, operate the GC system at a temp e r a t u re in the middle of the method operating range, or at 100 °C. A well-controlled
room temperature also helps attain more
consistent oven temperature calibration.
Let the instrument stabilize for at least
1 h, and then access the instrument calibration routine. Compare the resulting high-
JA N UA RY 2005 LCGC NORTH AMERICA VOLUME 23 NUMBER 1
w w w. c h r o m a t o g r a p h y o n l i n e . c o m
resolution reading with the probe reading,
and enter a corresponding temperature offset value on the keypad, or in some cases,
enter the probe temperature reading itself
as instructed in the manual. Allow some
time for the new temperature level to settle
in, and then verify that the probe and ove n
n ow are consistent to within a few tenths of
a degree. Make a note of the temperature
p robe make and model, its position in the
oven, how it was calibrated, and the offset
value in effect after calibration.
Inlet pressure: As mentioned earlier,
pressure calibration is not practical to better
than 62% of the full-scale reading. If
d e s i red, howe ver, an external digital pre ss u remeasurement device can be used to
obtain an independent pre s s u re reading at
or close to a single setpoint. Such re a d i n g s
will be a valid indication of the relative
pressures in multiple instruments for the
purposes of setting up a method that uses
constant inlet pressure. Howe ver, if the
method calls out any type of pre s s u re programming, including constant flow mode
with temperature programming, then these
readings will only set the initial pressures
and will have little bearing on subsequent
c o n t rol changes. In the case of a mechanical
pressure gauge, then an external digital
transducer becomes a ve ry valuable tool.
Howe ver, the pre s s u re and related flow
transducers in a GC should be ze roed at
least eve ry three months, as well as whene ver the instrument is moved or serviced. If
the pre s s u re readout is not 0.0 when the
pressure is off and no column is attached,
then the associated transducer should be
ze roed.
To ze ro the transducers, first cool dow n
the column oven, then turn the carrier gas
off or set the pre s s u re to ze ro and either
disconnect the columns or re m ove the septum nuts from the inlets. Most EPCequipped instrument models also monitor
the incoming carrier-gas supply pre s s u re, so
disconnect the carrier-gas supply at the
i n s t rument bulkhead, being careful to cap
off the supply tubing to protect carrier-gas
filters from air incursion.
A l l ow at least a half hour for the instrument to warm up, if it is not alre a d y
warmed, then select the pre s s u re transducer
ze roing portion of the keyboard–display
user interface and execute the ze roing proc e d u re according to the user manual.
Finally, reconnect the supply lines and
establish a low pre s s u re for long enough to
purge air from the system before reconnect-
45
ing the columns or replacing the inlet septum nuts. This also would be a good time
to service the inlets if necessary.
References
Conclusion
(3) M.J. Hartigan, K. Bi l l e b, and L.S. Et t re, C h ro-
(1) J.V. Hinshaw, LCGC 22(12), 1160 (2004).
(2) M.J. Ha rtigan and L.S. Et t re, J. Chro m a t o g r.
119, 187–206 (1976).
Some variability in results obtained on diff e rent instruments with different columns
is always to be expected. Analysts can minim i ze instrument-to-instrument retention
time variability by calibrating the oven temp e r a t u re, installing the column in the same
oven location, and setting the carrier-gas
a verage linear velocity to compensate for
slight column-to-column variations in
length and inner diameter. Good column
maintenance practices also will help establish better repeatability. Although not discussed in detail in this article, with careful
thermal calibration, dimensionless retention
m e a s u rements such as the retention factor,
relative retentions, and retention indices
i n h e rently rationalize interinstrument va r i ations and intercolumn dimensional va r i ations and effectively make such results more
comparable.
matographia 1 0, 571–579 (1977).
(4) L.S. Et t re, personal communication, Nove m b e r
2004.
John V. Hinshaw
“GC Connections”
editor John V. Hinshaw is senior staff
engineer at Serveron
Corp., Hillsboro, Oregon, and a member
of L C G C ’s editorial
advisory board. Direct
correspondence about
this column to “GC
Connections,” L C G C, Woodbridge Corporate
Plaza, 485 Route 1 South, Building F, First Floor,
Iselin, NJ 08830, e-mail [email protected].
For an ongoing discussion of GC issues with
John Hinshaw and other chromatographers,
visit the Chromatography Forum discussion
group at http://www.chromforum.com.