1
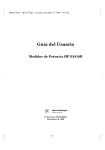
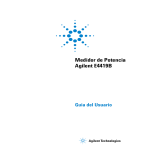
Agilent
EPM Series Power Meters
E-Series and 8480 Series Power Sensors
Data Sheet
Product specifications and
characteristics
EPM series E4418B and E4419B power meters
Specifications
Accuracy
Specifications describe the instrument’s warranted performance and
apply after a 30 minute warm-up.
These specifications are valid over
its operating/environmental range
unless otherwise stated and after
performing a zero and calibration
procedure.
Instrumentation
Supplemental
characteristics
Supplemental characteristics (shown
in italics) are intended to provide
additional information, useful in
applying the instrument by giving
typical (expected), but not warranted performance parameters. These
characteristics are shown in italics
or labeled as “typical”, “nominal” or
“approximate”.
Table 1
Model
8481A, 8482A, 8483A, 8485A,
8487A, R8486A, Q8486A,
ZERO SET
±50 nW
8481B, 8482B
±50 µW
8481D, 8485D, 8487D
±20 pW
8481H, 8482H
±5 µW
R8486D, Q8486D
±30 pW
V8486A, W8486A
±200 nW
E4412A, E4413A
±50 pW
Zero set (digital settability of zero):
sensor dependent (refer to
table 1). For E-series sensors, this
specification applies to a ZERO
performed when the sensor input is
not connected to the POWER REF.
E9300A, E9301A,E9304A 2
±500 pW
E9300B, E9301B 2
±500 nW
E9300H, E9301H 2
±5 nW
Power reference
1. National metrology institutes of member states
of the Metre Convention, such as the National
Institute of Standards and Technology in the
USA, are signatories to the ComitÈ International
des Poids et Mesures Mutual Recognition
Arrangement. Further information is available
from the Bureau International des Poids et
Mesures, at http://www.bipm.fr/
Absolute: ±0.02 dB (log) or ±0.5%
(linear). Please add the corresponding power sensor linearity percentage from tables 7 and 10 (for the
E-series sensors) and table 15 (for
the 8480 series sensors).
Relative: ±0.04 dB (Log) or ±1.0%
(linear). Please add the corresponding power sensor linearity percentage from table 16 (for the 8480
series sensors).
For information on measurement
uncertainty calculations, refer to
Application Note 64-1C, “Fundamentals of RF and Microwave
Power Measurements”, literature
number 5965-6380E.
Power output: 1.00 mW (0.0 dBm).
Factory set to ±0.4% traceable to the
National Physical Laboratory (NPL),
UK1.
Frequency range: 9 kHz to 110
GHz, sensor dependent
Accuracy: For two years:
±0.5% (23 ± 3°C)
±0.6% (25 ± 10°C)
±0.9% (0 to 55°C)
Power range: –70 dBm to +44 dBm
(100 pW to 25 W), sensor dependent.
Frequency: 50 MHz nominal
Power sensors: Compatible with all
8480 series and E-series sensors
SWR: 1.06 maximum
(1.08 maximum for Option 003)
Single sensor dynamic range:
Connector type: Type N (f), 50 Ω
2. Specification applies to the low power path
15% to 75% relative humidity.
90 dB maximum (E-series sensors),
50 dB maximum ( 8480 series
sensors).
Display units:
Absolute: Watts or dBm.
Relative: Percent or dB.
Display resolution: Selectable
resolution of 1.0, 0.1, 0.01, and 0.001
dB in Log mode, or 1 to 4 digits in
linear mode.
Default resolution: 0.01 dB in log
mode, 3 digits in linear mode.
2
Supplemental characteristics
Power reference
Frequency: 50 MHz nominal.
SWR: 1.05 maximum.
Connector: Type N (f), 50 Ω.
Measurement speed
Three measurement speed modes,
over the GPIB, are available as
shown, along with the typical maximum measurement speed for each
mode.
With the E4418B power meter
Normal: 20 readings/second
x2: 40 readings/second
Fast: 200 readings/second
With the E4419B, the measurement
speed is reduced, for example, with
both channels in FAST mode, the
typical maximum measurement
speed is 100 readings/second.
Fast mode is for E-series sensors
only.
Maximum measurement speed is
obtained using binary output
and in free run trigger mode.
Zero drift of sensors: Sensor dependent, refer to table 2. For E9300
sensors, refer to table 12 for
complete data.
Table 3
Number of averages
Noise multiplier
(normal mode)
Noise multiplier
(x2 mode)
Table 2
Model
8481A, 8482A, 8483A, 8485A,
8487A, R8486A, Q8486A
Zero drift 1
< ±10 nW
Measurement noise2
< 110 nW
8481B, 8482B
< ±10 µW
< 110 µW
8481D, 8485D, 8487D
< ±4 pW
< 45 pW
8481H, 8482H
< ±1µW
< 10 µW
R8486D, Q8486D
< ±6 pW
< 65 pW
V8486A, W8486A
< ±40 nW
< 450 nW
E4412A, E4413A
< ±15 pW
< 70 pW
E9300A, E9301A, E9304A3
< ±150 pW
< 700 pW
E9300B, E9301B3
< ±150 nW
< 700 nW
E9300H, E9301H3
< ±1.5 nW
< 7 nW
1. Within 1 hour after zero set, at a constant temperature, after a 24-hour warm-up of the power
meter.
2. The number of averages at 16 for normal mode and 32 for x2 mode, at a constant temperature,
measured over a one minute interval and two standard deviations. For E-series sensors, the
measurement noise is measured within the low range. Refer to the relevant sensor manual for
further information.
3. Specification applies to the low power path, 15% to 75% relative humidity.
Measurement noise: Sensor dependent, refer to table 2 and table 3. For
E9300 sensors, refer to table 12.
Example:
8481D power sensor, normal mode,
number of averages = 4.
Effects of averaging on noise: Averaging
over 1 to 1024 readings is available
for reducing noise. Table 2 provides
the measurement noise for a particular sensor with the number of
averages set at 16 (for normal mode)
and 32 (for x2 mode). Use the noise
multiplier, for the appropriate mode
(normal or x2) and number of
averages, to determine the total measurement noise value.
Measurement noise calculation:
(< 45 pW x 2.75) = < 121 pW.
1
5.5
2
3.89
4
2.75
8
1.94
16
1
32
0.85
64
0.61
128
0.49
256
0.34
512
0.24
1024
0.17
6.5
4.6
3.25
2.3
1.63
1
0.72
0.57
0.41
0.29
0.2
3
EPM series E4418B and E4419B power meters
Settling time 1
For 8480 series sensors:
Manual filter, 10 dB decreasing power step.
Table 4
Number of
1
averages
Settling time(s) 0.15
(normal mode)
Settling time(s) 0.15
x2 modes):
2
4
8
16
32
64
128
256
512
1024
0.2
0.3
0.5
1.1
1.9
3.4
6.6
13
27
57
0.18
0.22
0.35
0.55
1.1
1.9
3.5
6.9
14.5
33
Auto filter, default resolution, 10 dB decreasing power step (normal and x2 modes):
For E-series sensors:
In FAST mode (using free run
trigger), within the range –50 dBm
to +17 dBm, for a 10 dB decreasing
power step, the settling time is:
E4418B: 10 ms2
E4419B: 20 ms2
Table 5. Manual filter, 10 dB decreasing power step (not across the range switch point)
Number of
1
averages
Settling time(s) 0.07
(Normal mode)
Settling time(s) 0.04
2
4
8
16
32
64
128
256
512
1024
0.12
0.21
0.4
1
1.8
3.3
6.5
13
27
57
0.07
0.12
0.21
0.4
1
1.8
3.4
6.8
14.2
32
1. Settling time: 0 to 99% settled readings over the GPIB
2. When a power step crosses through the sensor’s auto-range switch point, add 25 mS. Refer to the relevant sensor manual for switch
point information.
4
For E4412A and E4413A sensors
Auto filter, default resolution, 10 dB
decreasing power step (not across the
range switch point)
For E-series E9300A sensors
For E-series E9300B and
H sensors
5
Power meter functions
Accessed by key entry: either hardkeys,
or softkey menu, and programmable.
Zero: Zeros the meter. (Power reference calibrator is switched off
during zeroing.)
Cal: Calibrates the meter using
internal (power reference calibrator)
or external source. Reference cal
factor settable from 1% to 150%, in
0.1% increments.
Frequency: Entered frequency range
is used to interpolate the calibration
factors table.
Range: 1 kHz to 999.9 GHz, settable
in 1 kHz steps.
Cal factor: Sets the calibration
Factor for the meter. Range: 1% to
150%, in 0.1% increments.
Relative: Displays all successive
measurements relative to the last
displayed value.
Offset: Allows power measurements
to be offset by –100 dB to +100 dB,
settable in 0.001dB increments, to
compensate for external loss or gain.
Save/recall: Store up to 10 instrument states via the save/recall
menu.
dBm/W: Selectable units of either
Watts or dBm in absolute power;
or percent or dB for relative
measurements.
Filter (averaging): Selectable from
1 to 1024. Auto-averaging provides
automatic noise compensation.
General characteristics
Duty cycle: Duty cycle valuesbetween
0.001% to 99.999%, in 0.001% increments, can be entered to display
a peak power representation of
measured power. The following
equation is used to calculate the
displayed peak power value: peak
power = measured power/dutycycle.
Recorder outputs: Analog 0 to
1 Volt, 1 kΩ output impedance, BNC
connector. E4419B recorder outputs
are dedicated to channel A and
channel B.
Sensor cal tables: Selects cal factor
versus frequency tables corresponding to specified sensors ( 8480 series
only).
Limits: High and low limits can be set
in the range –150.000 dBm to
+230.000 dBm, in 0.001 dBm
increments.
Preset default values: dBm mode,
rel off, power reference off, duty
cycle off, offset off, frequency
50 MHz, AUTO average, free run,
AUTO range (for E-series sensors).
Display: Selectable single and split
screen formats are available. A
quasi-analog display is available for
peaking measurements. The dual
channel power meter can simultaneously display any two configurations
of A, B, A/B, B/A, A-B, B-A and
relative.
Rear panel connectors
Remote input/output: A TTL logic
level is output when the measurement exceeds a predetermined limit.
TTL inputs are provided to initiate
zero and calibration cycles. RJ-45
series shielded modular jack assembly connector. TTL Output: high
=4.8V max; low = 0.2V max TTL
Input: high = 3.5V min, 5V max;
low = 1V max, -0.3V min.
GPIB: Allows communication with an
external controller.
RS-232/442: Allows communication
with an external RS-232 or RS-422
controller. Male/plug 9 position
D-subminiature connector
Ground: Binding post, accepts 4 mm
plug or bare-wire connection.
Line power
Input voltage range: 85 to 264 VAC,
automatic selection.
Input frequency range: 50 to 440 Hz.
Power requirement: approximately 50
VA (14 Watts) for E4418B and
E4419B.
6
Battery Option 001 operational
characteristics1
The following information describes
characteristic performance based at
a temperature of 25°C unless otherwise noted.
Typical operating time: up to 3.5
hours with LED backlight on; up to
5.5 hours with LED backlight off
(E4418B power meter).
Charge time: 2 hours to charge fully
from an empty state; 50 minutes
charging enables 1 hour of operation
with LED backlight on; 35 minutes
charging enables 1hr operation with
LED backlight off. Power meter is
operational whilst charging.
Service life: (to 70% of initial
capacity at 25°C): 450 charge/
discharge cycles
Chemistry: nickel metal hydride
Weight: 1kg
Environmental characteristics
Remote programming
General conditions: Complies with
the requirements of the EMC
Directive 89/336/EEC. This includes
Generic Immunity Standard EN
50082-1: 1992 and Radiated
Interference Standard EN 55011:
1991/CISPR11:1990, Group 1 Class A.
Interface: GBIB interface operates
to IEEE 488.2. RS-232 and RS-422
serial interface supplied as standard.
Command language: SCPI standard
interface commands. 436A and 437B
code compatible (E4418B only);
438A code compatible (E4419B
only).
Operating environment
Temperature: 0°C to 55°C.
Maximum humidity: 95% at 40°C
(non-condensing).
Minimum humidity: 15% at 40°C
(non-condensing).
Maximum altitude: 3000 meters
(9840 feet).
GPIB compatibility: SH1, AH1, T6,
TE0, L4, LE0, SR1, RL1, PP1, DC1,
DT1, C0.
Non-volatile memory
Battery: Lithium polycarbon
Monoflouride, approximate lifetime
5 years at 25°C.
Storage conditions
Storage temperature:
–20°C to +70°C.
Non-operating maximum humidity:
90% at 65°C (non-condensing).
Non-operating maximum altitude:
15240 meters (50,000 feet).
General
Dimensions: The following dimensions
exclude front and rear protrusions.
212.6 mm W x 88.5 mm H x 348.3 mm D
(8.5 in x 3.5 in x 13.7 in)
Weight
Net: E4418B: 4.0 kg (8.8 lb).
E4419B: 4.1 kg (9.0 lb).
Shipping:
E4418B: 7.9 kg (17.4 lb).
E4419B: 8.0 kg (17.6 lb).
Safety
Conforms to the following product
specifications:
EN61010-1: 1993/IEC 1010-1: 1990
+A1/CSA C22.2 No. 1010-1: 1993
EN60825-1: 1994/IEC 825-1: 1993
Class 1 Low Voltage Directive
72/23/EEC
Accessories supplied
Power sensor cable
11730A: E4418B has one
1.5 meter (5 ft) sensor cable.
E4419B has two 1.5 meter (5 ft)
sensor cables.
Power cord: One 2.4 meter
(7.5 ft) cable. Power plug matches
destination requirements.
1. Characteristics describe product performance
that is useful in the application of the product,
but is not covered by the product warranty.
7
EPM series power meters
Additional documentation
Accessories
E4418B: Single channel EPM series
power meter
Selections can be made for the localization of the User’s Guide, and an
English language Service Manual
Option E441xB-908: Rackmount kit
(one instrument)
Option E441xB-909: Rackmount kit
(two instruments)
34131A: Transit case for half-rack 2U
high instruments
34141A: Yellow soft carry/
operating case
34161A: Accessory pouch
E9287A1: Spare battery pack for the
EPM power meter
E4419B: Dual channel EPM series
power meter
Options available
Power
Option E441xB-001: Mains power and
internal rechargeable battery
Connectors
Option E441xB-002: Parallel rear panel
sensor input connector(s) and front
panel reference calibrator connector
Option E441xB-003: Parallel rear
panel sensor input connectors and
rear panel reference calibrator connector
Calibration documentation
Option E441xB-A6J: ANSI Z540 compliant calibration test data with measurement uncertainties
Documentation
A hard copy and CD version of the
English language User’s Guide and
Programming Guide is provided with
the EPM power meter as standard. A
selection can be made to delete the
hard copy
Option E441xB-OBO: Delete manual set
Option E441xB-915: English language
Service Manual
Option E441xB-916: English language
manual set (hard copy Users Guide
and Programming Guide)
Option E441xB-ABD: German localization (hard copy Users Guide and
English Programming Guide)
Option E441xB-ABE: Spanish localization (hard copy Users Guide and
English Programming Guide)
Option E441xB-ABF: French localization (hard copy Users Guide and
English Programming Guide)
Option E441xB-ABJ: Japanese localization (hard copy Users Guide and
English Programming Guide)
Complementary equipment
11683A: Range calibrator
Verifies the accuracy and linearity of
the EPM series power meters.
Outputs corresponding to meter
readings of 3, 10, 30, 100 and 300
µW and 1, 3, 10, 30 and 100 mW are
provided. Calibration uncertainty is
±0.25% on all ranges.
Cables
Option E441xB-004: Delete power
sensor cable
Additional cables
11730A: Power sensor and SNS noise
source cable, length 1.5 meters (5 ft)
11730B: Power sensor and SNS noise
source cable, length 3 meters (10 ft)
11730C: Power sensor and SNS noise
source cable, length 6.1 meters (20 ft)
11730D: Power sensor cable, length
15.2 meters (50 ft)
11730E: Power sensor cable, length
30.5 meters (100 ft)
11730F: Power sensor cable, length 61
meters (200 ft)
Service options
Warranty
Included with each EPM series
power meter2 is a standard 12
month return to Agilent warranty
and service plan. For warranty and
service of 5 years, please order 60
months of R-51B.
R-51B: Return-to-Agilent warranty
and service plan
Calibration3
For 3 years, order 36 months of the
appropriate calibration plan shown
below. For 5 years, specify 60 months.
R-50C-001: Standard calibration plan
R-50C-002: Standard compliant
calibration plan
The E-series and 8480 series power
sensors have a 12 months return to
Agilent warranty and service plan.
For more information, contact your
local sales and service office.
1. Only for EPM series power meter with Option
E441XB-001 installed.
2. For Option E441XB-001, the 36 month warranty
does not apply to the E9287A battery pack.
3. Options not available in all countries.
8
E-series power sensor
specifications
E-series CW power sensor specifications
The E-series of power sensors have
their calibration factors stored in
EEPROM and operate over a wide
dynamic range. They are designed
for use with the EPM series of power
meters and two classes of sensors
are available:
Table 6
Model
E4412A
Frequency range
10 MHz – 18 GHz
E4413A
50 MHz – 26.5 GHz
• CW power sensors (E4412A and
E4413A).
• Average power sensors (E9300
sensors).
Wide dynamic range CW sensors: 100 pW to 100 mW (-70 dBm to +20 dBm)
Maximum SWR
*10 MHz to 30 MHz: 1.12
30 MHz to 2 Ghz:1.15
2 GHz to 6 Ghz:1.17
6 GHz to 11 Ghz:1.2
11 GHz to 18 Ghz:1.27
50 MHz to 100 MHz: 1.21
100 MHz to 8 Ghz:1.19
8 GHz to 18 Ghz:1.21
18 GHz to 26.5 Ghz:1.26
Maximum power
Connector type
200 mW (+23 dBm) Type-N (m)
200 mW (+23 dBm) APC-3.5mm (m)
* Applies to sensors with serial prefix US 3848 or greater
Power linearity
Table 7
Power
Temperature (25ºC ±5ºC)
100 pW to 10 mW
±3 %
(-70 dBm to +10 dBm)
10 mW to 100 mW
±4.5%
(+10 dBm to +20 dBm)
Temperature (0º to 55ºC)
±7 %
±10%
Figure 1 : Relative mode power measurement
linearity with EPM series power meter/E-series
CW power sensor at 25°C ± 5°C (typical)
9
The chart in figure 1 shows the typical uncertainty in making a relative
power measurement, using the same
power meter channel and the same
power sensor to obtain the reference
and the measured values. Example A
illustrates a relative gain (amplifier
measurement). Example B illustrates
a relative loss (insertion loss measurement). This chart assumes negligible change in frequency and mismatch occur when transitioning
from the power level used as the
reference to the power level being
measured.
Example A:
P = 10(P)/10 x 1 mW
P = 10 6/10 x 1 mW
P = 3.98 mW
3% x 3.98 mW = 119.4 µW
(where P = power in Watts,
and (P) = power in dBm)
Example B:
P = 10 (P)/10 x1 mW
P = 10 -35/10 x 1 mW
P = 316 nW
3% x 316 nW = 9.48 nW
General
Dimensions:
E4412A:
130 mm L x 38 mm W x 30 mm H
(5.1 in x 1.5 in x 1.2 in)
E4413A:
102 mm L x 38 mm W x 30 mm H
(4 in x 1.5 in x 1.2 in)
Weight:
E4412A: 0.18 kg (0.4 lb).
E4413A: 0.18 kg (0.4 lb).
Calibration factor (CF) and
reflection coefficient (Rho)
Calibration factor and reflection
coefficient data are provided at
1 GHz increments on a data sheet
included with the power sensor. This
data is unique to each sensor. If you
have more than one sensor,match
the serial number on the data sheet
with the serial number on the power
sensor you are using. The CF corrects for the frequency response of
the sensor. The EPM power meter
automatically reads the CF data
stored in the sensor and uses it to
make the corrections. For power levels greater than 0 dBm, add 0.5%/dB
to the calibration factor uncertainty
specification.
Reflection coefficient (Rho) relates
to the SWR according to the following formula: SWR = 1 + Rho/1 - Rho
Maximum uncertainties of the CF
data are listed in table 8a, for the
E4412A power sensor, and table 8b
for the E4413A power sensor. The
uncertainty analysis for the calibration of the sensors was done in
accordance with the ISO/TAG4
Guide. The uncertainty data reported on the calibration certificate is
the expanded uncertainty with a
95% confidence level and a coverage
factor of 2.
Table 8a. E4412A calibration factor uncertainty
at 1 mW (0 dBm)
Frequency
10 MHz
30 MHz
50 MHz
100 MHz
1.0 GHz
2.0 GHz
4.0 GHz
6.0 GHz
8.0 GHz
10.0 GHz
11.0 GHz
12.0 GHz
14.0 GHz
16.0 GHz
18.0 GHz
Uncertainty (%)
1.8
1.8
Reference
1.8
1.8
2.4
2.4
2.4
2.4
2.4
2.4
2.4
2.4
2.6
2.6
Table 8b. E4413A calibration factor uncertainty
at 1 mW (0 dBm)
Frequency
50 MHz
100 MHz
1.0 GHz
2.0 GHz
4.0 GHz
6.0 GHz
8.0 GHz
10.0 GHz
11.0 GHz
12.0 GHz
14.0 GHz
16.0 GHz
17.0 GHz
18.0 GHz
20.0 GHz
22.0 GHz
24.0 GHz
26.0 GHz
28.0 GHz
Uncertainty (%)
Reference
1.8
1.8
2.4
2.4
2.4
2.4
2.6
2.6
2.8
2.8
2.8
2.8
2.8
3
3
3
3
3
10
E-series E9300
average power sensor
specifications
The E-series E9300 wide dynamic
range, average power sensors are
designed for use with the EPM family of power meters. These specifications are valid ONLY after proper
calibration of the power meter and
apply for CW signals unless otherwise stated.
Specifications apply over the temperature range 0°C to 55°C unless
otherwise stated, and specifications
quoted over the temperature range
25°C ±10°C, conform to the standard environmental test conditions
as defined in TIA/EIA/ IS-97-A and
TIA/EIA/IS-98-A [1].
The E-series E9300 power sensors
have two independent measurement
paths (high and low power paths):
High power path: -10 to +20 dBm (“A” suffix sensors), +20 to +44 dBm (“B” suffix sensors) and 0 to +30 dBm
(“H” suffix sensors).
Low power path: -60 to -10 dBm (“A” suffix sensors), -30 to +20 dBm (“B” suffix sensors) and -50 to 0 dBm
(“H” suffix sensors).
Some specifications are detailed for an individual measurement path.
Table 9
Wide dynamic range (-60 to +20 dBm) sensors
Model Frequency range
Maximum SWR
(25°C ± 10°C)
E9300B 10 MHz – 18.0 GHz 10 MHz to 30 GHz: 1.15
30 MHz to 2 GHz: 1.13
2 GHz to 14 GHz: 1.19
14 GHz to 16 GHz: 1.22
16 GHz to 18 GHz: 1.26
E9301A 10 MHz – 6.0 GHz
10 MHz to 30 GHz: 1.15
30 MHz to 2 GHz: 1.13
2 GHz to 14 GHz: 1.19
E9304A 9 MHz – 6.0 GHz
9 kHz to 2 GHz: 1.13
2 GHz to 6 GHz: 1.19
Maximum SWR
(0 – 55°C)
10 MHz to 30 MHz: 1.21
30 MHz to 2 GHz: 1.15
2 GHz to 14 GHz: 1.20
14 GHz to 16 GHz: 1.23
16 GHz to 18 GHz: 1.27
10 MHz to 30 MHz: 1.21
30 MHz to 2 GHz: 1.15
2 GHz to 14 GHz: 1.20
9 kHz to 2 GHz: 1.15
2 GHz to 6 GHz: 1.20
Wide dynamic range (-30 to +44 dBm) sensors
Model Frequency range
Maximum SWR
(25°C ± 10°C)
E9300B 10 MHz – 18.0 GHz 10 MHz to 8 GHz: 1.12
8 to 12.4 GHz: 1.17
12.4 to 18 GHz: 1.24
Maximum SWR
(0 – 55°C)
10 MHz to 8 GHz: 1.14
8 to 12.4 GHz: 1.18
12.4 to 18 GHz: 1.25
E9301B 10 MHz – 6.0 GHz
10 MHz to 6 GHz: 1.12
10 MHz to 6 GHz: 1.14
Wide dynamic range (-50 to +30 dBm) sensors
Model Frequency range
Maximum SWR
(25°C ± 10°C)
E9300H 10 MHz – 18.0 GHz 10 MHz to 8 GHz: 1.15
8 to 12.4 GHz: 1.25
12.4 to 18 GHz: 1.28
E9301H 10 MHz – 6.0 GHz
10 MHz to 6 GHz: 1.15
Maximum SWR
(0 – 55°C)
10 MHz to 8 GHz: 1.17
8 to 12.4 GHz: 1.26
12.4 to 18 GHz: 1.29
10 MHz to 6 GHz: 1.17
Maximum power
+25 dBm average;
+33 dBm peak
(< 10 µsec)
Connector
type
Type-N (m)
+25 dBm average;
+33 dBm peak
(< 10 µsec)
+25 dBm average;
+33 dBm peak
(< 10 µsec)
Type-N (m)
Maximum power
Connector
type
Type-N (m)
0 – 35°C: 30 W avg
35 – 55°C: 25 W avg
< 6 GHz: 500 W pk
> 6 GHz: 125 W pk
500 W-mS per pulse
0 – 35°C: 30 W avg
35 – 55°C: 25 W avg
< 6 GHz: 500 W pk
500 W-mS per pulse
Maximum power
3.16 W avg
100 W pk
100 W-µS per pulse
3.16 W avg
100 W pk
100 W-µS per pulse
Type-N (m)
Type-N (m)
Connector
type
Type-N (m)
Type-N (m)
11
Typical SWR, 10 MHz to 18 GHz, (25°C ± 10°C) for E9300A and E9301A sensors
Typical SWR, 9kHz to 6 GHz, (25°C ± 10°C) for E9304A sensors
12
Typical SWR, 10 MHz to 18 GHz, (25°C ± 10°C) for E9300B and E9301B sensors
Typical SWR, 10 MHz to 18 GHz, (25°C ± 10°C) for E9300H and E9301H sensors
13
E-series E9300 average power sensors
Table 10. Power linearity (after zero and cal at ambient environmental conditions)
Sensor
Power
Linearity
Linearity
(25°C ± 10°C)
(0 – 55°C)
E9300A, E9301A, E9304A
-60 to –10 dBm
±3.0%
±3.5%
-10 to 0 dBm
±2.5%
±3.0%
0 to +20 dBm
±2.0%
±2.5%
E9300B, E9301B
-30 to +20 dBm
±3.5%
±4.0%
+20 to +30 dBm
±3.0%
±3.5%
+30 to +44 dBm
±2.5%
±3.0%
E9300H, E9301H
-50 to 0 dBm
±4.0%
±5.0%
0 to +10 dBm
±3.5%
±4.0%
+10 to +30 dBm
±3.0%
±3.5%
Typical E9300A/01A/04A Power Linearity at 25°C, after zero and calibration, with associated
measurement uncertainty
Power range
Measurement uncertainty
-30 to -20 dBm
±0.9%
-20 to -10 dBm
±0.8%
-10 to 0 dBm
±0.65%
0 to +10 dBm
±0.55%
+10 to +20 dBm
±0.45%
14
E-series E9300 average power sensors
Typical E9300B/01B power linearity at 25°C, after zero and calibration, with associated
measurement uncertainty
Power range
Measurement uncertainty
-6 to 0 dBm
± 0.65%
0 to +10 dBm
± 0.55%
+10 to +20 dBm
± 0.45%
+20 to +26 dBm
± 0.31%
Typical E9300H/01H power linearity at 25°C, after zero and calibration, with associated
measurement uncertainty
Power range
Measurement uncertainty
-26 to -20 dBm
± 0.9%
-20 to –10 dBm -10 to 0 dBm 0 to +10 dBm +10 to +20 dBm
± 0.8%
± 0.65%
± 0.55%
± 0.45%
+20 to +26 dBm
± 0.31%
15
Note: If the temperature changes after calibration and you choose not to re-calibrate the sensor, the following additional power linearity error should be
added to the linearity specs in table 10: the typical maximum additional power linearity error due to temperature change after calibration, for small
changes in temperature, is ±0.15%/°C (valid after zeroing the sensor).
For large changes in temperature, refer to Table 11.
Typical maximum additional power linearity error due to temperature change after calibration
at 25ºC for any change in temperature (valid after zeroing the sensor)
Table 11
Sensor
E9300A, E9301A, E9304A
E9300B, E9301B
E9300H, E9301H
Power
-60 to –10 dBm
-10 to 0 dBm
0 to +20 dBm
-30 to +20 dBm
+20 to +30 dBm
+30 to +44 dBm
-50 to 0 dBm
0 to +10 dBm
+10 to 30 dBm
Additional power
linearity error
(25°C ± 10°C)
±1.5%
±1.5%
±1.5%
±1.5%
±1.5%
±1.5%
±1.5%
±1.5%
±1.5%
Additional power
linearity error
(0 – 55°C)
±2.0%
±2.5%
±2.0%
±2.0%
±2.5%
±2.0%
±2.0%
±2.5%
±2.0%
Figure 2. Relative mode power measurement linearity with an EPM series power meter, at 25°C ±10°C (typical)
Figure 2 shows the typical uncertainty in making a relative power measurement, using the same power meter channel and same power sensor to obtain
the reference and the measured values, and assumes that negligible change in frequency and mismatch error occur when transitioning from the power
level used as the reference to the power level being measured.
16
E-series E9300 average
power sensors
Switch point data
The E9300 power sensors have two
paths, a low power path covers:
-60 to -10 dBm (“A” suffix sensors),
-30 to +20 dBm (“B” suffix sensors),
and -50 to 0 dBm (“H” suffix sensors). The high power path covers: 10 to +20 dBm (“A” suffix sensors),
+20 to +44 dBm (“B” suffix sensors),
and 0 to +30 dBm (“H” suffix sensors). The power meter automatically selects the proper power level
path. To avoid unnecessary switching when the power level is near the
switch point, switching point
hysteresis has been added.
Table 12. E9300A, E9301A, and E9304A sensors zero and measurement noise
Conditions1
Zero set
Zero drift2
Measurement noise3
Low power path
500 pW
150 pW
700 pW
(15% to 75% RH)
Low power path
500 pW
4,000 pW
700 pW
(75% to 95% RH)
High power path
500 nW
150 nW
500 nW
(15% to 75% RH)
High power path
500 nW
3 nW
500 nW
(75% to 95% RH)
E9300B and E9301B sensors
Conditions1
Zero set
Low power path
500 nW
(15% to 75% RH)
Low power path
500 nW
(75% to 95% RH)
High power path
500 µW
(15% to 75% RH)
High power path
500 µW
(75% to 95% RH)
Zero drift2
150 nW
Measurement noise3
700 nW
4 µW
700 nW
150 µW
500 µW
3 mW
500 µW
Zero drift2
1.5 nW
Measurement noise3
7 nW
40 nW
7 nW
1.5 µW
5 µW
30 µW
5 µW
E9300 “A” suffix sensors example:
hysteresis causes the low power path
to remain selected until approximately -9.5 dBm as the power level
is increased, above this power the
high power path will be selected.
The high power path will remain
selected until approximately
-10.5 dBm is reached as the signal
level decreases, below this power the
low power path will be selected.
E9300H and E9301H sensors
Conditions1
Zero set
Low power path
5 nW
(15% to 75% RH)
Low power path
5 nW
(75% to 95% RH)
High power path
5 µW
(15% to 75% RH)
High power path
5 µW
(75% to 95% RH)
Switching point linearity: Typically
≤ ±0.5% (≤ ±0.02 dB)
Switching point hysteresis: 0.5 dB
typical
1. RH is the abbreviation for relative humidity.
2. Within 1 hour after zero set, at a constant temperature, after a 24-hour warm-up of the power meter with
power sensor connected.
3. The number of averages at 16 for normal mode and 32 for x2 mode, at a constant temperature, measured
over a one minute interval and two standard deviations.
17
Calibration factor (CF) and
reflection coefficient (Rho)
Calibration factor and reflection
coefficient data are provided at
frequency intervals on a data sheet
included with the power sensor. This
data is unique to each sensor. If you
have more than one sensor, match
the serial number on the data sheet
with the serial number on the power
sensor you are using. The CF corrects for the frequency response of
the sensor. The EPM series power
meter automatically reads the CF
data stored in the sensor and uses it
to make the corrections.
Reflection coefficient (Rho) relates
to the SWR according to the following formula:
SWR = (1 + Rho)/(1 - Rho)
Table 13A. Calibration factor uncertainties (low power path)
Frequency
Uncertainty (%)
(25°C +10°C)
10 MHz to 30 MHz
± 1.8%
30 MHz to 500 MHz
±1.6%
(E9304A: 9kHz to 500MHz)
500 MHz to 1.2 GHz
±1.8%
1.2 GHz to 6 GHz
±1.7%
6 GHz to 14 GHz
±1.8%
14 GHz to 18 GHz ± 2.0 %
±2.0%
Table 13B Calibration factor uncertainties (high power path)
Frequency
Uncertainty (%)
(25°C +10°C)
10 MHz to 30 MHz
±2.1%
30 MHz to 500 MHz
±1.8%
(E9304A: 9kHz to 500MHz)
500 MHz to 1.2 GHz
±2.3%
1.2 GHz to 6 GHz
±1.8%
6 GHz to 14 GHz
±1.9%
14 GHz to 18 GHz
±2.2%
Uncertainty (%)
(0° to 55°C)
±2.2%
±2.0%
±2.5%
±2.0%
±2.2%
Uncertainty (%)
(0° to 55°C)
±4.0%
±3.0%
±4.0%
±2.1%
±2.3%
±3.3%
Maximum uncertainties of the CF
data are listed in tables 13A and
13B. As the E-series E9300 power
sensors have two independent
measurement paths (high and low
power paths), there are two calibration factor uncertainty tables. The
uncertainty analysis for the calibration of the sensors was done in
accordance with the ISO Guide. The
uncertainty data reported on the
calibration certificate is the expanded
uncertainty with a 95% confidence
level and a coverage factor of 2.
General
Dimensions: Length 130 mm, width 38
mm, height 30 mm
Weight: 0.18 kg (0.4 lbs)
References:
[1] TIA is the Telecommunications
Industry Association; EIA is the
Electronic Industries Association.
TIA/EIA/IS-97-A is the recommended minimum performance standards
for base stations supporting dualmode wideband spread spectrum
cellular mobile stations. TIA/EIA/
IS-98-A is the recommended minimum performance standards for
dual-mode wideband spread
spectrum cellular mobile stations.
18
8480 series power sensors
(with EPM series power
meters)
The 8480 series power sensors are
designed for use with the 435B,
436A, 437B, 438A, 70100A, E1416A
and now the E4418B and E4419B
power meters. These thermocouple
and diode power sensors provide
extraordinary accuracy, stability,
and SWR over a wide range of
frequencies (100 kHz to 110 GHz)
and power levels -70 dBm to
+44 dBm).
Table 14. Root sum of squares (rss) uncertainty on the calibration factor data printed on the
power sensor
Freq
(MHz)
0.1
0.3
1
3
10
30
50
100
300
1000
2000
4000
8482A
8482B
8482H 8483A
1.3
1.2
1.2
1.2
1.3
1.4
0 (ref)
1.6
1.6
1.4
1.4
1.5
2.8
2.8
2.8
2.8
2.8
2.8
2.7
3.3
3.3
3.3
3.3
3.1
1.6
1.6
1.6
1.6
1.6
1.7
0 (ref)
1.9
1.9
1.7
1.7
1.8
1.5
1.4
1.4
1.4
1.6
1.6
0 (ref)
2
2
2
2.1
-
Freq (GHz)
1
2
4
6
8
10
12
14
16
18
22
26.5
8481A
1.6
1.4
1.5
1.5
1.7
1.9
2.1
2.6
2.9
3.2
-
8481B
3
3.1
3.1
3.1
3.2
3.3
4.1
4.1
4.2
4.3
-
8481H
1.9
1.7
1.8
1.8
2
2.2
2.4
2.8
3
3.1
-
8481D
1.9
1.8
1.8
1.8
2
2.2
2.8
3.2
3.4
3.7
-
8485A
1.6
1.6
1.7
1.8
1.9
2
2
2.2
2.3
2
2.1
2.1
8385D
1.8
1.8
1.8
2.1
2.2
2.1
2.2
2.2
2.5
2.6
2
2.3
Freq (GHz)
26.5
28
30
33
34.5
37
40
42
44
46
48
50
R8486A
2.2
2.4
2.5
2.1
2.1
2.2
2.2
-
Q8486A
2.8
2.8
2.8
2.9
3.9
3.9
3.9
4.9
5.3
R8486D
3
3.2
3
3
3
3
3
-
Q8486D
4.2
4.2
4.2
4.2
4.9
5.1
5.5
5.8
6.2
8487A
2.1
2.3
2.1
2.3
2.1
2.3
2.6
3.2
3.6
4.1
4.5
5
8487D
2.8
3
3
3
3
3
3
2.9
2.9
3.1
4.5
4.5
8487A
1.6
1.6
1.6
1.7
1.8
1.8
1.9
2.1
2.2
2.3
1.8
2.1
8487D
2
2
2
2.3
2.3
2.3
2.3
2.8
2.8
2.8
2.8
2.8
19
8480 series sensors (with EPM series power meters)
Table 15
25 Watt sensors, 1 mW to 25 W (0 dBm to +44 dBm)
Model Frequency range Maximum SWR
Power linearity1
8481B
10 MHz to 18 GHz
10 MHz to 2 GHz: 1.10
2 GHz to 12.4 GHz: 1.18
+35 dBm to + 44 dBm: (±4%)
12.4 GHz to 18 GHz: 1.28
8482B
100 kHz to 4.2 GHz
100 kHz to 2 GHz: 1.10
2 GHz to 4.2 GHz: 1.18
+35 dBm to + 44 dBm: (±4%)
10 MHz to 18 GHz
8482H
100 kHz to 4.2 GHz
10 MHz to 8 GHz: 1.20
8 GHz to12.4 GHz: 1.25
12.4 GHz to 18 GHz: 1.30
100 kHz to 4.2 GHz: 1.20
Connector type
Weight
Type - N(m)
Net: 0.8 kg (1.75 lb)
Shipping: 1.5 kg
(3.25 lb)
Type - N(m)
Net: 0.8 kg (1.75 lb)
Shipping: 1.5 kg (3.25 lb)
0.01 to 5.8 GHz: 500W pk
5.8 to 18 GHz: 125 W pk
500 W.µs per pulse
0°C to 350°C: 30W avg 2
35°C to 550°C: 25W avg
0.01 to 5.8 GHz: 500W pk
5.8 to 18 GHz: 125 W pk
500 W - µs per pulse
3 Watt sensors, 100 µW to 3 W (–10 dBm to +35 dBm)
Model Frequency range Maximum SWR
Power linearity (1)
8481H
Maximum power
0°C to 350°C: 30W avg 2
35°C to 550°C: 25W avg
Maximum power
Connector type
Weight
+25 dBm to + 35 dBm: (±5%)
3.5 W avg, 100 W pk
100 W.µs per pulse
Type - N (m)
Net: 0.2 kg (0.38 lb)
Shipping: 0.5 kg (1.0 lb)
+25 dBm to + 35 dBm: (±5%)
3.5 W avg, 100 W pk
100 W.µs per pulse
Type - N (m)
Net: 0.2 kg (0.38 lb)
Shipping: 0.5 kg (1.0 lb)
100 mW sensors, 1 µW to 100 mW (–30 dBm to +20 dBm)
Model Frequency range Maximum SWR
Power linearity (1)
Maximum power
Connector type
Weight
50 MHz to 26.5 GHz 50 MHz to 100 MHz: 1.15
100 MHz to 2 GHz: 1.10
2 GHz to 12.4 GHz: 1.15
12.4 GHz to 18 GHz: 1.20
18 GHz to 26.5 GHz: 1.25
Option 50 MHz to 33 GHz 26.5 GHz to 33 GHz: 1.40
8485A-033
8481A 10 MHz to 18 GHz 10 MHz to 30 MHz: 1.40
30 MHz to 50 MHz: 1.18
50 MHz to 2 GHz: 1.10
2 GHz to 12.4 GHz: 1.18
12.4 GHz to 18 GHz: 1.28
8482A 100 kHz to 4.2 GHz 100 kHz to 300 kHz: 1.60
300 kHz to 1 MHz: 1.20
1 MHz to 2 GHz: 1.10
2 GHz to 4.2 GHz: 1.30
8483A 100 kHz to 2 GHz
100 kHz to 600 kHz: 1.80
(75 ohm)
600 kHz to 2 GHz: 1.18
R8486A 26.5 GHz to 40 GHz 26.5 GHz to 40 GHz: 1.40
+10 dBm to + 20 dBm: (±3%)
300 mW avg, 15 W pk
30 W.µs per pulse
APC - 3.5mm(m)
Net: 0.2 kg (.38 lb)
Shipping: 0.5 kg (1.0 lb)
+10 dBm to + 20 dBm: (±3%)
300 mW avg, 15 W pk
30 W.µs per pulse
300 mW avg, 15 W pk
30 W.µs per pulse
APC - 3.5mm(m)
Net: 0.2 kg (.38 lb)
Shipping: 0.5 kg (1.0 lb)
Net: 0.2 kg (0.38 lb)
Shipping: 0.5 kg (1.0 lb)
Q8486A 33 GHz to 50 GHz
33 GHz to 50 GHz: 1.50
+10 dBm to + 20 dBm: (±3%)
V8486A 50 GHz to 75 GHz
50 GHz to 75 GHz: 1.06
+10 dBm to + 20 dBm: (±2%)
-30 dBm to + 10 dBm: (±1%)
W8486A 75 GHz to 110 GHz
75 GHz to 110 GHz: 1.08
(±2%)
8487A
50 MHz to 100 MHz: 1.15
100 MHz to 2 GHz: 1.10
2 GHz to 12.4 GHz: 1.15
12.4 GHz to 18 GHz: 1.20
18 GHz to 26.5 GHz: 1.25
26.5 GHz to 40 GHz: 1.30
40 GHz to 50 GHz: 1.50
+10 dBm to + 20 dBm: (±3%)
8485A
1.
2.
50 MHz to 50 GHz
+10 dBm to + 20 dBm: (±3%)
Type - N (m)
+10 dBm to + 20 dBm: (±3%)
30 W.µs per pulse
300 mW avg, 15 W pk
Type - N (m)
Net: 0.2 kg (0.38 lb)
Shipping: 0.5 kg (1.0 lb)
+10 dBm to + 20 dBm: (±3%)
300 mW avg, 10 W pk
+10 dBm to + 20 dBm: (±3%)
300 mW avg, 15 W pk
30 W.µs per pulse
300 mW avg, 15 W pk
30 W.µs per pulse
200 mW avg, 40 W pk
(10.µs per pulse, 0.5%
duty cycle)
200 mW avg, 40 W pk
(10.µs per pulse, 0.5%
duty cycle)
300 mW avg, 15 W pk
30 W.µs per pulse
Type - N (m)
(75 ohm)
Waveguide flange
UG-599/U
Waveguide flange
UG-383/U
Waveguide flange
UG-385/U
Net: 0.2 kg (0.38 lb)
Shipping: 0.5 kg (1.0 lb)
Net: 0.26 kg (0.53 lb)
Shipping: .66 kg (1.3 lb)
Net: 0.26 kg (0.53 lb)
Shipping: .66 kg (1.3 lb)
Net: 0.4 kg (0.9 lb)
Shipping: 1 kg (2.1 lb)
Waveguide flange
UG-387/U
Net: 0.4 kg (0.9 lb)
Shipping: 1 kg (2.1 lb)
2.4 mm (m)
Net: 0.14 kg (.28 lb)
Shipping: 0.5 kg (1.0 lb)
Negligible deviation except for those power ranges noted.
For pulses greater than 30 W, the maximum average power (Pa) is limited by the energy per pulse (E) in W.µs according to Pa = 30-0.02 E.
20
8480 series sensors (with EPM series power meters)
High sensitivity sensors, 100 pW to 10 µW (–70 dBm to –20 dBm)
Model
Frequency range
Maximum SWR
Power linearity1
Maximum power
Connector type
Weight
8481D3
10 MHz to 18 GHz
10 MHz to 30 MHz: 1.40
- 30 dBm to - 20 dBm: (±1%)
100 mW avg, 100 m W pk
Type - N (m)
Net: 0.16 kg (0.37 lb)
30 MHz to 3 GHz: 1.15
Shipping: 0.9 kg (2.0 lb)
4 GHz to 10 GHz: 1.20
10 GHz to 15 GHz: 1.30
15 GHz to 18 GHz: 1.50
8485D3
50 MHz to 26.5 GHz
0.05 GHz to 0.1 GHz: 1.19
-30 dBm to -20 dBm: (±2%)
100 mW avg, 100 m W pk
APC - 3.5mm (m)
0.1 GHz to 4 GHz: 1.15
Net: 0.2 kg (.38 lb)
Shipping: 0.5 kg (1.0 lb)
4 GHz to 12 GHz: 1.19
12 GHz to 18 GHz: 1.25
18 GHz to 26.5 GHz: 1.29
Option
50 MHz to 33 GHz
26.5 GHz to 33 GHz: 1.35
-30 dBm to -20 dBm: (±2%)
100 mW avg, 100 m W pk
APC - 3.5mm (m)
Net: 0.2 kg (.38 lb)
8485D-033
8487D3
50 kHz to 50 GHz
0.05 GHz to 0.1 GHz: 1.19
-30 dBm to -20 dBm: (±2%)
100 mW avg, 100 m W pk
2.4 mm (m)
Net: 0.2 kg (0.38 lb)
Shipping: 0.5 kg (1.0 lb)
0.1 GHz to 4 GHz: 1.15
30 W.µs per pulse
Shipping: 0.5 kg (1.0 lb)
2 GHz to 12.4 GHz: 1.20
12.4 GHz to 18 GHz: 1.29
18 GHz to 34 GHz: 1.37
34 GHz to 40 GHz: 1.61
40 GHz to 50 GHz: 1.89
R8486D3
Q8486D3
1.
2.
3.
26.5 GHz to 40 GHz
33 GHz to 50 GHz
26.5 GHz to 40 GHz: 1.40
33 GHz to 50 GHz: 1.40
-30 dBm to -25 dBm: (±3%)
100 mW avg, or pk
Waveguide flange
-25 dBm to -20 dBm: (±5%)
40 V dc max
UG-599/U
Net: 0.26 kg (0.53 lb)
Shipping: .66 kg (1.3 lb)
-30 dBm to 25 dBm: (±3%)
100 mW avg, or pk
Waveguide flange
Net: 0.26 kg (0.53 lb)
-25 dBm to -20 dBm: (±5%)
40 V dc max
UG-383/U
Shipping: 0.66 kg (1.3 lb)
Negligible deviation except for those power ranges noted.
For pulses greater than 30 W, the maximum average power (Pa) is limited by the energy per pulse (E) in W.µs according to Pa = 30-0.02 E.
Includes 11708A 30 dB attenuator for calibrating against 0 dBm, 50 MHz power reference. The 11708A is factory set to 30 dB ±0.05 dB at 50 MHz,
traceable to NIST. SWR < 1.05 at 50 MHz.
21
Agilent Technologies’ Test and Measurement Support, Services, and Assistance
Agilent Technologies aims to maximize the value you receive, while minimizing your
risk and problems. We strive to ensure that you get the test and measurement
capabilities you paid for and obtain the support you need. Our extensive support
resources and services can help you choose the right Agilent products for your
applications and apply them successfully. Every instrument and system we sell has
a global warranty. Support is available for at least five years beyond the production life
of the product. Two concepts underlie Agilent’s overall support policy: “Our Promise”
and “Your Advantage.”
Our Promise
Our Promise means your Agilent test and measurement equipment will meet its
advertised performance and functionality. When you are choosing new equipment, we
will help you with product information, including realistic performance specifications and practical recommendations from experienced test engineers. When
you use Agilent equipment, we can verify that it works properly, help with
product operation, and provide basic measurement assistance for the use of
specified capabilities, at no extra cost upon request. Many self-help tools are available.
Your Advantage
Your Advantage means that Agilent offers a wide range of additional expert test
and measurement services, which you can purchase according to your unique technical and business needs. Solve problems efficiently and gain a competitive edge
by contracting with us for calibration, extra-cost upgrades, out-of-warranty repairs,
and onsite education and training, as well as design, system integration, project
management, and other professional engineering services. Experienced Agilent
engineers and technicians worldwide can help you maximize your productivity, optimize the return on investment of your Agilent instruments and systems, and obtain
dependable measurement accuracy for the life of those products.
Agilent Email Updates
www.agilent.com/find/emailupdates
Get the latest information on the products and applications you select.
Agilent T&M Software and Connectivity
Agilent’s Test and Measurement software and connectivity products, solutions and
developer network allows you to take time out of connecting your instruments to
your computer with tools based on PC standards, so you can focus on your tasks,
not on your connections. Visit www.agilent.com/find/
connectivity for more information.
By internet, phone, or fax, get assistance with all your test & measurement needs
Phone or Fax
United States:
(tel) 800 452 4844
Canada:
(tel) 877 894 4414
(fax) 905 282 6495
China:
(tel) 800 810 0189
(fax) 800 820 2816
Europe:
(tel) (31 20) 547 2323
(fax) (31 20) 547 2390
Japan:
(tel) (81) 426 56 7832
(fax) (81) 426 56 7840
Korea:
(tel) (82 2) 2004 5004
(fax) (82 2) 2004 5115
Latin America:
(tel) (305) 269 7500
(fax) (305) 269 7599
Taiwan:
(tel) 0800 047 866
(fax) 0800 286 331
Other Asia Pacific Countries:
(tel) (65) 6375 8100
(fax) (65) 6836 0252
Email: [email protected]
Online Assistance:
www.agilent.com/find/assist
Product specifications and descriptions in this document subject to change
without notice.
© Agilent Technologies, Inc. 2002, 2003, 2004
Printed in USA, February 1, 2004
5965-6382E
22