1
Agilent
PSA Series Spectrum Analyzers
E4406A Vector Signal Analyzer
1xEV-DO Measurement Personality
Referring both 3GPP2 1xEV-DO Revision-0 and Revision-A
Technical Overview with
Self-Guided Demonstration
Option 204
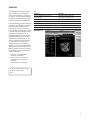
The 1xEV-DO measurement
personality, available on the
Agilent PSA Series high-performance spectrum analyzers and
the E4406A vector signal analyzer (VSA), solves your problems
in 1x evolution data only (1xEVDO) measurements with powerful signal analysis capabilities
designed for standards-based
measurements and easy-to-use
functions in one analyzer.
That means you can accelerate
your development schedule to
quickly obtain manufacturing
efficiency.
Make the Transition to Third-Generation (3G) Wireless Technology Faster and Easier
Migrating from cdma2000 to 1xEV-DO will
introduce new challenges in the design
and test of base stations and mobile transmitters. Be at ease in this transition with a
comprehensive, one-analyzer solution from
Agilent.
• Expand design possibilities with
powerful measurement capability
and flexibility for both 1xEV-DO revision 0 and revision A.
• Expedite troubleshooting and
design verification with numerous
features and an intuitive user
interface.
• Streamline manufacturing with
speed, reliability, and ease of use.
• Improve yields with highly
accurate measurements and
operator independent results.
• Simplify test systems with digital
demodulation, RF power measure ments, spur searches, and general
high-performance spectrum
analysis in one analyzer.
The Agilent PSA Series offers high-performance spectrum analysis up to 50 GHz
with powerful one-button measurements, a
versatile feature set, and a leading-edge
combination of flexibility, speed, accuracy,
and dynamic range. Expand the PSA to
include 1xEV-DO digital signal analysis
capability with the 1xEV-DO measurement
personality (Option 204).
For many manufacturing needs, the E4406A
VSA, a vector signal analyzer, is an affordable
platform that also offers the 1xEV-DO personality.
•
•
•
•
demonstrations
PSA Series key specifications for
1xEV-DO measurements
ordering information
related literature
All demonstrations utilize the PSA Series and
the E4438C ESG vector signal generator; however, they can also be performed with the E4406A
VSA. Keystrokes surrounded by [ ] indicate hard
keys located on the front panel, while key
names surrounded by { } indicate soft keys
located on the right edge of the display.
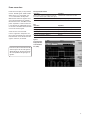
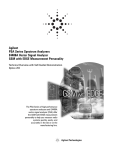
The 1xEV-DO measurement personality provides key transmitter measurements for
analyzing systems based on 3GPP2
Technical Specifications Group cdma2000
(TSG-C) specifications (C.S0032-A and
C.S0033-A, 2005-12). 3GPP2 C.S0024-A
(2005-07) is also referred to support modulation analysis on both forward link and
reverse link signals.
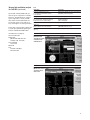
Channel power
page 4
Code domain
analysis
page 8
Power vs. time
page 5
Modulation
accuracy
page 9
Spurious
emissions &
ACP
page 6
PSA Series spectrum analyzer
Occupied
bandwidth
page 7
2
This technical overview includes
QPSK EVM
page 11
1xEV-DO
reverse link
page 12
E4406A vector signal analyzer
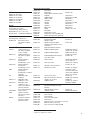
Demonstration preparation
To perform the demonstrations, the ESG
and the PSA Series require the following options.
Note: Signal Studio 1xEV-DO
(E4438C-404) provides the signal configuration for 1xEV-DO Revision-0. 1xEVDO Revision-A, subtype 2 signal
configuration, is already available with
another software N7601A-SW1. For
more details, please visit our web site
at http://www.agilent.com/find/signalstudio/
To configure the instruments, simply
connect the ESG’s 50 Ω RF output to
the PSA’s 50 Ω RF input with a 50 Ω
RF cable. Turn on the power in both instruments.
Now set up the ESG and Signal Studio to
provide a 1xEV-DO forward link signal via
LAN connection from the external PC.
Product type
Model number
Required options
ESG vector E4438C
signal generator
502, 503, 504, or 506 – frequency range
up to at least 2 GHz
601 or 602 baseband generator
404 – Signal Studio 1xEV-DO software
(rev 2.0 or later)
PSA Series
spectrum analyzer
B7J – Digital demodulation hardware
204 – 1xEV-DO measurement personality
E4440A/E4443A/E4445A/
E4446A/E4447A/E4448A
(Use PSA with firmware revision A.09 or later.
For E4406A VSA, firmware revision A.10 or later is necessary.)
ESG
InstructionsKeystrokes
Preset the ESG.
[Preset]
Check the IP Address.
[Utility] {GPIB/RS-232/LAN} {LAN Setup} eg.
{IP Addresss 192.168.100.1}
ESG Signal Studio-1xEV-DO
Instructions: Keystrokes:
Run the Signal Studio 1xEV-DO. Double-click the shortcut on your PC desktop or
access the program via Windows start menu.
Verify the communication between ESG and Signal Studio via LAN. Instruments menu has the list to connection.
Input the Hostname or IP address of the ESG.
Then press [Test Connection] button.
If “OK” comes out on Result and “EV-DO option If you cannot see the “OK” on Result, please check
is valid” on Note, it’s ready to generate and the instrument hostname and IP address.
download the signal data.
Select 1xEV-DO Forward link signal setup.
[Quick Setup] > [1xEV-DO Forward Link]
Name the signal as “FWD1”.
Change the Project Name “Untitled” to “FWD1”.
Set the carrier frequency and amplitude.
Frequency = 1 GHz, amplitude = –20 dBm
Change the configuration of the signals.
On Carrier 0, turn Traffic channel ON
Download the waveform to ESG.
Click [Generate] and [Download]
3
Connect the PC, ESG and PSA
Connect a PC or laptop (loaded with the
Signal Studio-1xEV software and
Agilent I/O Library) to the ESG over the
GPIB or LAN interface. The setup procedure for this guide assumes the LAN
interface is used. To use LAN interface
from Signal Studio, you need to set up
LAN Client with I/O Configuration of
Agilent I/O Library. Follow the steps
below, using
50 Ω RF cables:
• Connect the ESG RF Output port
to the PSA RF Input port.
• Connect the ESG 10 MHz Out to
the PSA Ext Ref In port.
• Connect the ESG event 1 port to
the PSA Ext Trigger Input (rear
panel).
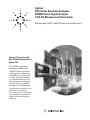
See Figure 1 for a diagram of this setup.
Channel power
The channel power measurement determines the total rms power in
a user-specified bandwidth. The power
spectral density (PSD) is
also displayed in dBm/Hz.
Control the following channel power measurement parameters:
•
•
•
•
integration bandwidth (defaults to 1.23 MHz)
channel power span (defaults to 2 MHz)
number of trace averages (defaults to 20)
data points displayed (64 to 65536, defaults to 512)
This exercise demonstrates the onebutton channel power measurement on the
PSA.
4
GPIB or LAN on
ESG back panel
ESG
RF OUT
ESG event 1 to PSA
ext rear trigger IN
ESG 10 MHz OUT
PSA
RF IN
Figure 1. A computer running Signal Studio-1xEV-DO software (top) is connected to the ESG Vector
Signal Generator (middle). The RF output of the ESG is connected to the RF input of the PSA Series
with 1xEV-DO measurement personality (bottom).
PSA
InstructionsKeystrokes
Perform factory preset.
(skip this step for E4406A VSA)
[System] {Power On/Preset}
{Preset Type} {Factory} [Preset]
Enter the 1xEV-DO mode in the analyzer.
{1xEV-DO}
[Mode] ({More} if necessary})
Choose transmitter device.
The PSA can make measurements on both the
forward and reverse links, but only the forward
link will be demonstrated in this guide.
[Mode Setup] {Radio} {Device BTS}
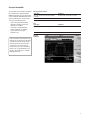
Activate channel power measurement.
Observe the white bars indicating the spectrum
channel width and the quantitative values
given beneath. (Figure 2)
[MEASURE] {Channel Power}
Figure 2.
Channel power
Power versus time
Power versus time (PvT) is a key measurement for 1xEV-DO signals. 3GPP2 C.S0032
defines the “3.1.2.3.1 Total power” and
“3.1.2.3.2 Pilot/ MAC channel power”.
Measurement of the burst signal is necessary in the transmitter test for 1xEV-DO
idle slot based on the “Pilot/MAC channel
power” requirement. The burst mask test
is very important for 1xEV-DO idle slot signal. As seen in the below window, the limit
mask can be set for 5 regions.
ESG Signal Studio-1xEV-DO
Instructions: Active slot also can be measured
in PvT to support the “Total power” test
item. In this measurement, only upper and
lower limit lines can be seen because the
signal is continuous, not bursted.
In this exercise, the PvT measurement for idle
slot burst signal can be seen. If the signal has
different idle slot gain, the burst search threshold can be adjustable to the target signal configuration.
Keystrokes
Remove traffic channel to change the signal from
Active slot to Idle slot (Pilot + MAC, burst signal).
Click the Traffic channel tab to turn OFF.
Download the waveform to ESG.
Click [Generate] and [Download]
PSA
Instructions Keystrokes
Activate PvT measurement. [MEASURE] {Power vs Time}
Set triggering for external rear port. [Meas Setup] {Trig Source} {Ext Rear}
Select single measurement (not continuous).
[Meas Control] {Measure Single}
Restart the measurement. (Figure 3).
[Restart]
Figure 3.
PvT measurement
display with burst
search threshold
line (white)
5
Spurious emissions & ACP
Because the ACP measurement for 1xEVDO is based on “Conducted Spurious
Emissions” by 3GPP2, this measurement is
merged into the personality as well. The
measurement mode can be selected as
either ACP or SEM (spectrum emission
mask). When switching modes between
ACP and SEM, the offset frequency, RBW,
and limit lines are automatically adjusted
according to the measurement definition in
the 3GPP2 standard. Even though this is a
burst signal, a RMS detector can be selected and the measurement offset and measurement interval can be set in units of
chips and microseconds. The spurious
emissions & ACP measurement has default
offset and interval settings that can be
accessed via the {Pre-Defined Ofs/Intvl}
soft key menu under [Meas Setup].
PSA
Instructions Keystrokes
Activate the spurious emissions & ACP measurement.
[MEASURE] {Spurious emissions & ACP}
Set triggering for external rear port. [Meas Setup] {Trig Source} {Ext Rear}
Restart the measurement (Figure 4). [Restart]
Figure 4.
SEM (spectrum
emission mask)
measurement
for idle slot
This exercise illustrates SEM and ACP measurements for idle slots. Notice in the PSA
measurement that the mask limit is represented by a green trace on the screen.
Note:
Because the PSA series performs fast Fourier transforms
(FFT) for this measurement, the local oscillator (LO)
steps in discrete frequency increments. (The step size
is assigned under [Meas Setup] {Offset/Limits} {Step
Freq}.) A measurement is made at each frequency
point; offset segments group the points. For each segment, the resolution bandwidth can be individually
specified. {Step Freq} and {Res BW} default to coupled
mode. When these parameters are set manually, it is
essential that the resolution bandwidth be larger than
the step size. If not, some signal components will be
missed when they fall between successive peaks of
the resolution bandwidth filter. In fact, it is good practice to make the {Res BW} twice as wide as the step
size given that the filter is Gaussian. This ensures that
successive filter bandwidth steps will overlap.
6
PSA
Instructions Keystrokes
Change measurement mode from SEM to ACP. [Meas Setup] {Meas Mode ACP}
Restart the measurement (Figure 5). [Restart]
Figure 5.
ACP measurement
for idle slot
Occupied bandwidth
The standards recommended by the 3GPP2
for 1xEV-DO have occupied bandwidth
(OBW) requirements for some of the band
classes. Effectively, OBW determines the frequency bandwidth that contains 99 percent of the total radiated power.
•
•
•
Specify the resolution bandwidth (defaults to 30 kHz) and the span (defaults to 3.75 MHz).
Customize a simple PASS/FAIL limit test (defaults to 1.48 MHz).
Specify number of averages (defaults to 10).
In this measurement, the total power of the
displayed span is measured. Then the power
is measured inward from the right and left
extremes until 0.5 percent of the power is
accounted for in each of the upper and
lower parts of the span. The calculated difference is the occupied bandwidth. For simple setup, the PSA defaults to a 1.48-MHz
PASS/FAIL limit value.
ESG Signal Studio-1xEV-DO
Instructions: Keystrokes
Add traffic channel for Active slot with QPSK modulation.
Click the Traffic channel tab to turn ON.
Download the waveform to the ESG. Click [Generate] and [Download]
PSA
Instructions Keystrokes
Change the occupied bandwidth (Figure 6)
[MEASURE] {Occupied BW}
Figure 6.
Occupied
bandwidth
7
Code domain analysis
The code domain analysis measurement provides a variety of results. First, code
domain power analysis measures the distribution of signal power across the set of
code channels, normalized to the total signal power. This measurement helps to verify that each code channel is operating at
its proper level and helps to identify problems throughout the transmitter design
from coding to the RF section. System
imperfections, such as amplifier non-linearity, will present themselves as an undesired
distribution of power in the code domain.
For the time division multiplexed (TDM)
feature of 1xEV-DO signals, we need to verify
that the access network (base station) is
transmitting the correct power in each of
the channels. Errors in the code domain
usually arise from the channel elements
that construct the individual channels
or from incorrect network software settings. Since the pilot channel is the active
channel, its power level relative to the carrier is displayed below the code domain
plot. This can also be verified using the
markers. Not only the pilot channel but
also MAC and traffic channels can be seen
in code domain. Once you capture a signal
in the code domain measurement, you can
change the channel types from pilot to
MAC and traffic.
A traffic channel of 1xEV-DO could have three
modulation types; QPSK, 8PSK, and 16QAM. For
the traffic channel code domain analysis, the
PSA will de-spread any single code channel in
chip power versus time trace, symbol IQ polar
vector, slot power versus time, and demodulated bits. Multiplexed demodulated bits information is also available by switching [Trace/View]
menu.
PSA
Instructions Keystrokes
Activate the code domain measurement. [MEASURE] {More} {Code Domain}
Swith the physical layer type.
[Mode Setup] {Demod} {Physical Layer Subtype 0/1 2}
Change the channel type from pilot to MAC (Figure 7).
[Meas Setup] {More} {Channel Type} {MAC}
Restart the measurement
[Restart]
Figure 7.
1xEV-DO code domain
for the MAC channel
with subtype 2
(1xEV-DO rev. A)
PSA
Instructions Keystrokes
Switch the physical layer type.
2}
[Mode Setup] {Demod} {Physical Layer Subtype 0/1
Change the channel type to data. [Meas Setup] {More} {Channel Type} {Data}
View the constellation of the traffic channels. [Trace/View] {Code Domain (Quad View)}
Place the marker on channel 15 and despread [Marker] [15] {Enter} {More} {Mkr - > Despread}
the channel to view the data (Figure 8).
Figure 8.
1xEV-DO code domain
for the DATA channel
with subtype 1
(1xEV-DO rev. O)
Now examine the 1xEV-DO signal using
each of the algorithms.
Note:
Notice that there are two active MAC channels. Each MAC channel is identified by a MAC Index(I) value that is between
0 and 63 that defines an 64 ary Walsh cover. The Reverse Activity (RA) channel is assigned MAC index 4 and Reverse
Power Control (RPC) channels are assigned MAC index 5 to 63. The Walsh code assigned to the MAC index values are
determined using the following equation:
W64 i/2
8
W64
(i-1)/2 + 32
for MAC Index i = 0,2,4,…,62
for MAC Index i = 1,3,5,…,63
Modulation accuracy (waveform quality)*
An important measure of modulation accuracy for 1xEV-DO signals is rho. Rho is the
ratio of the correlated power to the total
power. The correlated power is computed
by removing frequency, phase, and time
offset and performing a cross correlation
between the correlated signal and
an ideal reference. Rho is important
because uncorrelated power appears as
interference to a receiver. However, a rho
measurement can also be performed on signals with multiple code channels. This
measurement is known as composite rho.
It allows you to verify the overall modulation accuracy for a transmitter, regardless
of the channel configuration, as long as a
pilot channel is present. A composite rho
measurement accounts for all spreading
and scrambling problems in the active
channels and for all baseband IF and RF
impairment in the transmitter chain.
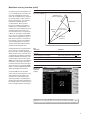
Figure 9.
Error vector magnitude
Another effective way to quantify modulation accuracy is to compare the signal
being measured to an ideal signal. Figure 9
defines the error vector, a measure of the
amplitude and phase differences between
the ideal modulated signal and the actual
modulated signal. The root-mean-square
(RMS) of the error vector is computed and
expressed as a percentage of the square
root of the mean power of the ideal signal.
This is the error vector magnitude (EVM).
EVM is a common modulation quality metric
widely used in digital communications.
PSA
Instructions Composite EVM measures the EVM
of the multi-code channel signal. It is valuable for determining the quality of the
transmitter for a multi-channel signal,
detecting spreading or scrambling errors,
identifying certain problems between baseband and RF sections, and analyzing errors
that cause high interference in the signal.
Magnitude error
(I/Q error magnitude)
Q
Error vector
Measured
signal
Phase error
(I/Q error phase)
ø
Ideal signal
(reference)
I
Keystrokes
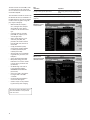
Activate modulation accuracy measurement (Figure 10).
[MEASURE] {More} {Mod Accuracy}
Turn on averaging for 10 slot length.
[Meas Setup] {Avg Number 10 slots On | Off
Select single measurement (not continuous).
[Meas Control] {Measure Single}.
Restart the modulation accuracy measurement.
[Restart]
Figure 10.
Pilot channel
modulation
accuracy
In PSA revision 8 or earlier and E4406A revision 9 or earlier, measurement name was
“Modulation accuracy (composite rho)”. To use the same measurement name defined in 3GPP2
conformance test, we’ve changed the name in the latest firmware (PSA A.09 and E4406A A.10).
9
The PSA measures rho and EVM, as well
as magnitude, phase, and code domain
errors. In this exercise, the above measurements will be explored.
The measurement results are shown in the
left window and the I/Q constellation is in
the right window. If you prefer to view the
numeric results only, please change displays in [Trace/View] key.
• Measure EVM, rho, frequency
error, I/Q origin offset, and pilot
offset with the active channel
numbers for the selected channel
type.
• Customize limits for rms EVM,
peak EVM, rho, frequency error
and I/Q origin offset.
• Select channel type from some
selections: pilot, MAC, data,
preamble, and overall in forward
link. pilot, DRC, ACK, and data in
reverse link.
• Comply the waveform quality
measurements in 3GPP2 defined
in C.S0032 (forward link) and
C.S0033 (reverse link).
• View I/Q polar vector constellation,
magnitude error, phase error, and
EVM plots.
• Specify PN offset (forward link).
• Read power, timing, phase and
EVM data for each active channel
in Power Timing and Phase view
(forward link).
• Set flexible long code mask for
I and Q separately between
00000000000 and 3FFFFFFFFFF
(reverse link).
• Choose to include or exclude the
I/Q origin offset in the EVM
calculation.
• Use the optional preamplifier to
measure low-level signals.
• Statistic analysis can be provided by [View/Trace] when averaging
This exercise explores the different ways in
which the modulation accuracy measurement can be used.
10
PSA
Instructions Keystrokes
Change channel type from pilot to data.
[Meas Setup] {More} {Display channel Type} {Data}
Restart the measurement (Figure 11).
[Restart]
Change the view for numeric results only (Figure 12).
[Trace/View] {Result Metrics (One Slot)}
Figure 11.
Modulation accuracy
for data channel
Figure 12.
Numeric result
summary of measured
channel for one-slot
QPSK EVM
The QPSK EVM measurement is used to
get some indication of the modulation
quality at the chip level for a single-channel signal. It can detect baseband filtering,
modulation, and RF impairments, but does
not detect spreading or scrambling errors.
PSA
Instructions Keystrokes
Perform the QPSK EVM measurement. [MEASURE] {More} {QPSK EVM}
Turn averaging off. [Meas Setup] {Avg Number Off}
Set triggering for external rear. {Trig Source} {Ext Rear}
In the default setting, the Meas Offset and
Interval are set as: 464 chips and 96 chips,
respectively. QPSK modulation can be
found not only in the pilot channel, but
also in the MAC and traffic (data) channels
if selected. Using the modulation accuracy
(composite rho) measurement, you can
check the EVM results for each channel
with QPSK modulation. To set the target
segment in the 1xEV-DO signal, you can
select the measurement offset and interval. The variable measurement offset
and intervals are very useful selecting the
desired slot to be analyzed with the QPSK
EVM measurement. For example, Pilot #1,
MAC #3, and Idle slot #2 can be selected
in {Preset Meas Ofs/Intvl} under [Meas
Setup] soft key menu.
Select single measurement (not continuous). [Meas Control] {Measure Single}
Restart the QPSK EVM measurement (Figure 14) [Restart]
•
•
•
Figure 13.
QPSK EVM for pilot
Determine rms and peak EVM (maximum and average).
View I/Q polar vector diagram or magnitude error, phase error, and EVM plots.
Enable adjacent carrier filtering.
This exercise involves changing the 1xEVDO signal to a single-channel
signal.
11
Reverse link modulation analysis
for 1xEV-DO
For the reverse link of 1xEV-DO, Option 204
provides the following measurements in Code
Domain and Modulation Accuracy (Waveform
Quality).
ESG Signal Studio-1xEV-DO
Instructions: Keystrokes
Select 1xEV-DO Reverse link signal setup
for 1xEV-DO revision 0 configuration.
[Quick Setup] > [1xEV-DO Reverse Link]
Name the signal as “REV1”.
Change the Project Name “Untitled” to “REV1”
Set the carrier frequency and amplitude.
Frequency = 1 GHz, Amplitude = -20 dBm
Change the configuration of the signals.
On Carrier 0, Pilot = ON, DRC = ON with DRC
relative gain 3.00 dB, ACK = ON with ACK relative
gain 3.00 dB, DATA = ON with DATA relative gain 3.75 dB. I and Q Mask should be 0 (zero)
Download the waveform to ESG.
Click [Generate] and [Download]
PSA
Instructions Keystrokes
Change the radio setup from BTS (Fwd) to MS (Rev).[Mode Setup] {Radio} {Device MS}
Go to code domain measurement.
[MEASURE] {Code Domain}
After capturing the signal, change the code order
from Hadamard to Bit Reverse.
[Display] {Code Order} {Bit Reverse}
Switch view to Code Domain quad view.
[Trace/View] {Code Domain (quad view)}
Put a marker on ACK channel to see the power
control of symbol power trace.
[Marker] [3] [Enter] {More} {Mkr -> Despread}
Modify the measurement setup to see longer data.
[Meas Setup] {Meas Offset} = 0 slot,
{Meas Interval} = 3 slot
Switch view to Demodulated bits (Figure 14).
[Trace/View] {Demod Bits}
Move to modulation accuracy measurement.
[MEASURE] {Mod Accuracy}
Select IQ polar vector graph and switch to other views (Figure 15).
[Trace/View] {I/Q Measured Polar Graph}
Figure 14.
Demodulated bits view
presents power-off half
slots with X
Figure 15.
Modulation accuracy
in I/Q polar graph view
12
Reverse link modulation analysis
for 1xEV-DO (continued)
PSA
Instructions Keystrokes
Switch the subtype from 0/1 to 2.
[Mode Setup] {Demod} {Physical Layer Subtype 2}
Signal Studio 1xEV-DO (E4438C-404) provides the signal configuration for 1xEV-DO
Revision-0. 1xEV-DO Revision-A, subtype 2
signal configuration, is already available
with another software N7601A-SW1. For
more details, please visit our web site at
http://www.agilent.com/find/signalstudio/
Go to Code Domain measurement and run a measurement.
[MEASURE] {Code Domain} [Start]
Change the view to Code Domain quad view.
[Trace/View] {Code Domain (quad view)}
Put a marker on data channel on Q phase and despread to see more symbol retails. [Marker] [20.5] [Enter]
{Mkr -> Despread}
Change the branch to IQ combined analysis (Figure 16).
[Meas Setup] {I/Q Branch IQC}
Move to Mod Accuracy measurement. [MEASURE] {Mod Accuracy}
Switch the view to see the detailed statistic results (Figure 17).
[Trace/View] {Peal/Avg Metrics}
Screen shots on this page were captured with
a sample signal generated by Agilent Signal
Studio for 1xEV-DO Rev.A N7601A-SW1.
1xEV-DO revision A (subtype 2)
All channels ON, E2E4
Relative Gain:
(RRI/AuxPilot: 0dB) DRC: 1dB ACK/DSC: 3dB Data: 5dB
Long Code Mask
I: 0x0, Q: 0x0
RRI bit: NA
Data:
Data Rate: 1843.2kbps,
Bit Pattern: PN9
Figure 16.
Code domain quad
view with data in 8PSK
constellation on IQ
combined branch
Figure 17.
Mod Accuracy in Peak
and Average result
metrics view
13
PSA Series
Key Specifications1
1xEV-DO measurement personality (10 MHz to 3 GHz)
The following specifications apply to models E4443A/45A/40A/ only.
Models E4446 and E4448A have similar but not warranted performance.
Channel power
Minimum power at RF input
Absolute power accuracy
Attenuation > 2 dB
Relative power accuracy:
Power vs. time (PvT)
Minimum power at RF input Absolute power accuracy: Attenuation > 2 dB Attenuation < 2 dB Measurement floor Relative power accuracy:
Fixed channel, fixed input attenuator
Mixer level –52 to –12dB
CCDF
Minimum carrier power at RF input
Histogram resolution
Intermodulation distortion
Minimum carrier power at RF input
Occupied bandwidth
Minimum carrier power at RF input
Frequency accuracy
Spurious emissions & ACP
Minimum carrier power at RF input
Dynamic range, relative:
750 kHz offset (30 kHz RBW)
Sensitivity, absolute:
750 kHz offset (30 kHz RBW)
Accuracy, relative:
750 kHz offset
–74 dBm (nominal)
±0.67 dB (±0.18 dB typical)
±0.08 dB (±0.03 dB typical)
–73 dBm (nominal)
(20 to 30 °C)
±0.24 dB (nominal)
±0.30 dB (nominal)
–84 dBm (nominal)
±0.03 dB (nominal)
–40 dBm (nominal)
0.01 dB
–30 dBm (nominal)
–40 dBm
0.3 percent (nominal)
–20 dBm
–84.7 dB (–86.4 dB typical)
–97.9 dBm (–99.9 dBm typical)
0.14 dB
Code domain
Specification applies at 0 dBm input power
For pilot, 2 MAC channels,
and 16 channels of QPSK data
Relative code domain power accuracy QPSK EVM
Minimum power at RF input
EVM accuracy
Frequency error accuracy
Modulation accuracy (composite rho)
Minimum carrier power at RF input Accuracy
Composite EVM
Rho
Frequency error
±0.15 dB
–20 dBm (nominal)
±1.0 percent (nominal)
±10 Hz (nominal) + (transmitter frequency x
frequency reference error)
–50 dBm (nominal)
±1.0 dB (nominal)
±0.0010 (at rho = 0.99751, EVM 5 percent)
±0.0044 (at rho = 0.94118, EVM 25 percent)
±10 Hz + (transmitter frequency x frequency reference error)
(nominal)
1. For specifications on the E4406A VSA, please refer to the E4406A VSA data sheet, literature number 5968-3030E.
14
Measurement Personalities
PSA Series spectrum analyzer
E4443A 3 Hz to 6.7 GHz
E4445A 3 Hz to 13.2 GHz
E4440A 3 Hz to 26.5 GHz
E4447A 3 Hz to 42.98 GHz
E4446A 3 Hz to 44 GHz
E4448A 3 Hz to 50 GHz
Options
To add options to a product,
use the following ordering scheme:
Model E444xA (x = 0, 3, 5, 6, 7 or 8)
Example options E4440A-B7J, E4448A-1DS
Warranty & Service
Standard warranty is three years.
R-51B-001-5C Warranty Assurance Plan, Return to Agilent,
5 years
E444xA-226
Phase noise
E444xA-219 Noise figure
E444xA-241
Flexible digital modulation analysis
E444xA-BAF
W-CDMA
E444xA-210
HSDPA/HSUPA
E444xA-202
GSM w/ EDGE E444xA-B78 cdma2000
E444xA-214
1xEV-DV
E444xA-204
1xEV-DO
E444xA-BAC
cdmaOne E444xA-BAE
NADC, PCD
E444xA-217
WLAN
E444xA-211TD-SCDMA
E444xA-215
External source control
E444xA-266
Programming code compatibility suite
E444xA-233
Built-in measuring receiver personality
Requires 1DS
Requires B7J
Requires B7J and BAF
Requires B7J
Requires B7J
Requires B7J and B78
Requires B7J
Requires B7J
Requires B7J
Requires 122 or 140
Hardware
E444xA-1DS
RF-internal preamplifier Excludes 110
100 kHz to 3 GHz
E444xA-110
RF/µW internal preamplifier
Exclude 1DS
(10 MHz to upper frequency limit
of the PSA)
Calibration 1
E444xA-B7J Digital demodulation hardware
Included
Calibration Assurance E444xA-122
80 MHz bandwidth digitizer
E4440A/43A/45A only,
Plan, Return to Agilent,
excludes 140, 107, H70
3 years, standard
E444xA-140
40 MHz bandwidth digitizer
E4440A/43A/45A only,
R-50C-011-5
Calibration Assurance excludes 122, 107, H70
Plan, Return to Agilent,
E444xA-123
Switchable MW preselector bypass
Excludes AYZ
5 years
E444xA-124
Y-axis video output
R-50C-016-3
Agilent Calibration + E444xA-AYZ
External mixing
E4440A/47A/46A/48A
Uncertainties + only, excludes 123
Guardbanding, 3 years
E444xA-107
Audio input 100 Ω
Requires 233 to operate;
R-50C-016-5
Agilent Calibration + Excludes 122, 140
Uncertainties + E444xA-111
USB device side I/O interface
Guardbanding, 5 years
E444xA-115
512 MB user memory
Excludes 117. Shipped
AMG
Agilent Calibration + standard in all PSA
Uncertainties + instruments with serial
Guardbanding, accredited number prefix ≥MY4615
calibration
unless 117 is installed
A6J
ANSI Z540-1-1994 E444xA-117
Secure memory erase
Excludes 115
Calibration
E4440A-BAB
Replaces type-N input connector E4440A only; required by
R-50C-021-3
ANSI Z540-1-1994 with APC 3.5 connector
E4440A-233
Calibration, 3 years
E444xA-H70
70 MHz IF output
Excludes 122, 140. Not
R-50C-021-5
ANSI Z540-1-1994 available for E4447A
Calibration, 5 years
PC Software
UK6
Commercial calibration E444xA-230 BenchLink Web Remote Control
certificate with data
Software
To be ordered with PSA
EE444xA-235
Wide BW digitizer external Requires 122
E444xA-0BW Service manual
calibration wizard
E4443A/45A/40A only
R-52A
Calibration software
Accessories
and licensing (ordered
E444xA-1CM Rack mount kit
with PSA)
E444xA-1CN Front handle kit
N7810A
PSA Series calibration
E444xA-1CP Rack mount with handles
application software
E444xA-1CR
Rack slide kit (stand-alone order)
E444xA-015
6 GHz return loss measurement accessory kit
E444xA-045
Millimeter wave accessory kit E444xA-0B1
Extra manual set including CD ROM
1. Options not available in all countries.
15
Related Literature
Publication Title
Number
Publication Type
Publication
Selecting the Right Signal Analyzer for Your Needs
Selection Guide
5968-3413E
PSA Series
Brochure5980-1284E
PSA Series
Configuration Guide
5989-2773EN
Self-Guided Demonstration for Spectrum Analysis
Product Note
5988-0735EN
Technical Overview
5989-1115EN
PSA in general
Wide bandwidth and vector signal analysis
40/80 MHz Bandwidth Digitizer
Using Extended Calibration Software for Wide Bandwidth Measurements, PSA Option 122 & 89600 VSA Application Note 1443
5988-7814EN
PSA Series Spectrum Analyzer Performance Guide Using 89601A Vector Signal Analysis Software
Product Note
5988-5015EN
89650S Wideband VSA System with High Performance Spectrum Analysis
Technical Overview
5989-0871EN
Phase Noise Measurement Personality
Technical Overview
5988-3698EN
Noise Figure Measurement Personality
Technical Overview
5988-7884EN
Measurement personalities and applications
External Source Measurement Personality
Technical Overview
5989-2240EN
Flexible Modulation Analysis Measurement Personality
Technical Overview
5989-1119EN
W-CDMA and HSDPA/HSUPA Measurement Personalities
Technical Overview
5988-2388EN
GSM with EDGE Measurement Personality
Technical Overview
5988-2389EN
cdma2000 and 1xEV-DV Measurement Personalities
Technical Overview
5988-3694EN
cdmaOne Measurement Personality
Technical Overview
5988-3695EN
WLAN Measurement Personality
Technical Overview
5989-2781EN
NADC/PDC Measurement Personality
Technical Overview
5988-3697EN
TD-SCDMA Measurement Personality
Technical Overview
5989-0056EN
Built-in Measuring Receiver Personality / Agilent N5531S Measuring Receiver
Technical Overview
5989-4795EN
BenchLink Web Remote Control Software
Product Overview
5988-2610EN
IntuiLink Software
Data Sheet
5980-3115EN
Programming Code Compatibility Suite
Technical Overview
5989-1111EN
PSA Series Spectrum Analyzers Video Output (Option 124)
Technical Overview
5989-1118EN
PSA Series Spectrum Analyzers, Option H70,70 MHz IF Output
Product Overview
5988-5261EN
Optimizing Dynamic Range for Distortion Measurements
Product Note
5980-3079EN
PSA Series Amplitude Accuracy
Product Note
5980-3080EN
PSA Series Swept and FFT Analysis
Product Note
5980-3081EN
PSA Series Measurement Innovations and Benefits
Product Note
5980-3082EN
Spectrum Analysis Basics
Application Note 150
5952-0292
Vector Signal Analysis Basics
Application Note 150-15
5989-1121EN
8 Hints for Millimeter Wave Spectrum Measurements
Application Note
5988-5680EN
Spectrum Analyzer Measurements to 325 GHz with the Use of External Mixers
Application Note 1453
5988-9414EN
EMI
Application Note 150-10
5968-3661E
Hardware options
Spectrum analyzer fundamentals
16
www.agilent.com
www.agilent.com/find/psa
myAgilent
www.agilent.com/find/myagilent
A personalized view into the information most relevant to you.
www.lxistandard.org
LAN eXtensions for Instruments puts the power of Ethernet and
the Web inside your test systems. Agilent is a founding member
of the LXI consortium.
Three-Year Warranty
www.agilent.com/find/ThreeYearWarranty
Beyond product specification, changing the ownership experience.
Agilent is the only test and measurement company that offers
three-year warranty on all instruments, worldwide
Agilent Assurance Plans
www.Agilent.com/find/AssurancePlans
Five years of protection and no budgetary surprises to ensure
your instruments are operating to specifications and you can
continually rely on accurate measurements.
www.agilent.com/quality
Agilent Electronic Measurement Group
DEKRA Certified ISO 9001:2008
Quality Management System
Agilent Channel Partners
www.agilent.com/find/channelpartners
Get the best of both worlds: Agilent’s measurement expertise and
product breadth, combined with channel partner convenience.
For more information on Agilent
Technologies’ products, applications or
services, please contact your local Agilent
office. The complete list is available at:
www.agilent.com/find/contactus
Americas
Canada
Brazil Mexico
United States
(877) 894 4414
(11) 4197 3600
01800 5064 800
(800) 829 4444
Asia Pacific
Australia 1 800 629 485
China
800 810 0189
Hong Kong 800 938 693
India 1 800 112 929
Japan
0120 (421) 345
Korea
080 769 0800
Malaysia 1 800 888 848
Singapore 1 800 375 8100
Taiwan
0800 047 866
Other AP Countries (65) 375 8100
Europe & Middle East
Belgium Denmark
Finland
France
Germany
Ireland
Israel
Italy
Netherlands
Spain
Sweden
United Kingdom
32 (0) 2 404 93 40
45 45 80 12 15
358 (0) 10 855 2100
0825 010 700*
*0.125 €/minute
49 (0) 7031 464 6333
1890 924 204
972-3-9288-504/544
39 02 92 60 8484
31 (0) 20 547 2111
34 (91) 631 3300
0200-88 22 55
44 (0) 118 927 6201
For other unlisted countries:
www.agilent.com/find/contactus
(BP-09-27-13)
Product specifications and descriptions in
this document subject to change without
notice.
© Agilent Technologies, Inc. 2013
Published in USA, November 25, 2013
5988-4828EN