1
Agilent
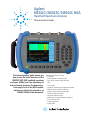
N9342C/N9343C/N9344C HSA
Handheld Spectrum Analyzer
Demonstration Guide
This demonstration guide shows you
how to use the basic functions of the
N9342C/43C/44C handheld spectrum
analyzers (HSAs) and take advantage of
their extensive features. The demonstrations apply to all of the HSA models,
which are collectively referred to as
N934xC HSAs in this document.
Demonstrated features include:
• Panel tour
• Auto-brightness and back-lit keys
• Save, recall, and the unique User key
• GPS
• Task planner
• Spectrum monitoring and interference hunting
• Remote control via LAN or USB port
• Marker, marker table, and peak table
• Advanced marker functions
• Limit lines and limit masks
• Multiple traces and simultaneous detectors
• Trace math functions
• Tracking generator
• Power meter
Table of Contents
Introduction..............................................................................................2
Demonstration Preparation...................................................................3
Panel Tour
■ Front panel..................................................................................4
■ Top panel....................................................................................5
Demonstrations
■ Auto-brightness and back-lit keys..........................................6
■ Measurement basics: frequency, span, amplitude..............7
■ Save, recall, and the unique User key...................................8
■ GPS..............................................................................................9
■ Task planner...............................................................................10
■ Spectrum monitoring and interference hunting...................16
■ Remote control via LAN or USB port.....................................17
■ Marker, marker table, and peak table....................................17
■ Advance marker functions.......................................................18
■ Limit lines and limit masks......................................................19
■ Multiple traces and simultaneous detectors........................20
■ Trace math functions................................................................21
■ Tracking generator....................................................................22
■ Power meter...............................................................................23
2
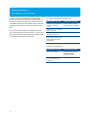
Demonstration Preparation
This demonstration provides the step-by step instructions
for using the extensive features of N934xC HSAs.
Model no. Product type
Options
E4438C-503
ESG vector signal generator
All demonstration key strokes surrounded by [ ] indicate
front panel hard keys and key strokes surrounded by { }
indicate soft keys on the right edge of the display.
400
602
N934xC
Handheld spectrum analyzer
N9342C-PA7
N9343C-P13
N9344C-P20
N934xC-PWM
N934xC-SIM
N934xC-TG7
N934xC-GPS
N934xC-GPA
N934xC-TPN
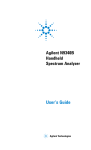
Instructions between E4438C and N934xC
HSAs
• Connect the 10 MHz out of E4438C to the Ext Trig/Ext
Ref of the HSA
• Press N934xC HSA’s [Shift], [System], {More 1 of 2},
{Port Setting}, {Ext Input (Ref)}
• Connect the RF out of the E4438C to RF In of the N934xC
HSA
• Power on both the E4438C and HSA
An AM/FM antenna
An Omni antenna (which is
used to receive over-the-air
signals)
A bandpass filter
Figure 1. Instrument connection
3
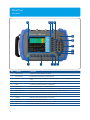
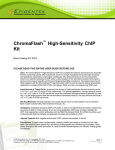
Panel Tour
Front panel
14
13 12 11
10
9
8
7
6
1
No.
4
2
3 4
5
Caption
Function
1
Power switch
Toggles the analyzer between on and off
2
Function keys
Includes function hard keys for measurements
3
Preset
Returns the analyzer to a known state, also On/Off power save features (press and hold for
1 sec)
4
Shift
Switches alternate upper function of the function keys and [Peak/Marker]
5
Enter
Confirms a parameter selection or configuration
6
Peak/Marker
Activates the peak search or marker function
7
ESC/Bksp
Exits and closes the dialog box or clears the character input as a back space key
8
Alphanumeric keys
Includes a positive/negative, a decimal point, and ten alphanumeric keys
9
Arrow keys
Increases or decreases a parameter step by step
10
Knob
Selects an option item or edits a numerical parameter
11
Softkeys
Indicates current menu functions on the screen
12
Speaker
Actives in demodulation mode
13
Light sensor
Adjust the brightness automatically
14
Screen
Displays spectrum traces and status information
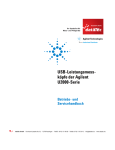
Panel Tour (continued)
Top panel
12
1
No.
2
3
11
10
4
9
5
8
6
7
Caption
Function
1
External DC power
connector
Provides input for the DC power source via an AC-DC adapter, or automotive type DC adapter.
2
LED indictor (charging)
Lights (On) when the battery is charging
3
LED indictor
Lights (On) when external DC power is connected
4
USB interface (device)
Connects to a PC
5
USB interface (host)
Connects to a USB memory stick or disk
6
Headphone
Connects to a headphone
7
LAN interface (option)
Connects to a PC for SCPI remote control
8
RF OUT connector
The output for built-in tracking generator (enabled with Option TG7)
9
Probe power
Provides power for high-impedance AC probes or other accessories (+15 V, -12 V, 150 mA
maximum)
10
EXT TRIG IN/REF IN
(BNC, female)
Connects to an external TTL signal or a 10-Hz reference signal. The TTL signal is used to trigger
the analyzer’s internal sweep
11
GPS antenna connector
Connects to an external GPS antenna for GPS application
12
RF IN connector (50 Ω)
Accepts an external input with a frequency range from 100 kHz to 7 GHz, tunable to 9 kHz
5
Demonstration 1
Auto-brightness and back-lit keys
Communication system maintenance and repair often
require a technician to troubleshoot in bright daylight or in
the darkness of night. The light sensor on the front panel
of the N934xC HSA senses the ambient light and automatically adjusts the brightness of the display and the back-lit
keys.
The user can also manually set the brightness of the display, and the brightness of the back-lit keys, so they can be
seen clearly even in any light. The duration of the key light
is settable to provide maximum battery life.
1.1 Adjust the display brightness
Instructions for HSA
Keystrokes for HSA
Switch the screen brightness
state from automatic to
manual
[Shift], [System], {Screen
Setting}, {Brightness (Man)}
Rotate the knob to adjust the
display brightness
Switch the screen brightness
state back to automatic
{Brightness (Auto)}
Cover the light sensor with
your finger and watch as the
display brightness adjusts
automatically
1.2 Back-lit key demo
6
Instructions for HSA
Keystrokes for HSA
Turn on key backlight
[Shift], [System], {Keypad
Setting}, {Backlight
Brightness}, {Auto}
Adjust backlight flash time
to 5, 10, 15, 30 seconds, or
“always on”
{Backlight off}, {15 s}
Demonstration 2
Measurement basics: frequency, span, amplitude
The key measurement setup parameters of a spectrum
analyzer are:
• Frequency
Adjust the frequency range measured
Instructions for the
source
Keystrokes for the
source
Set 2 GHz center frequency,
amplitude -10 dBm, CW
signal
[Preset], [FREQ], [2], {GHz},
[AMPTD], [-10], {dBm}, [RF On]
Instructions for HSA
Keystrokes for HSA
• Amplitude
Adjust the view of the signal’s level
Tune the center frequency to
2 GHz
[Freq], [2], {GHz}
[Span], [10], {MHz}
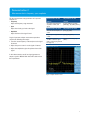
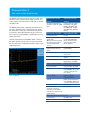
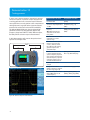
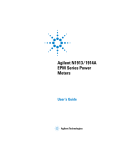
A typical spectrum analyzer measurement procedure
contains the following three steps:
1.Tune the center frequency of the analyzer to the signal
of interest.
Adjust span so signal fills the
screen
Set reference level to
-10 dBm so that the signal
peak is at the top of graticule
line (Figure 2)
[Amptd], {Ref Level}, [-10],
{dBm}
• Span
Adjust how closely you look at the signal
2.Adjust the span to zoom in on the signal of interest.
3.Adjust the amplitude to give the optimum view of the
signal.
In this demonstration, we will set signal generator to
output a signal to N934xC HSA with an RF cable and set
these parameters.
Figure 2. Adjust reference level
7
Demonstration 3
Save, recall, and the unique User key
The N934xC HSAs let you save the state, trace data, measurement results (peak and marker table), limit lines, and
screen captures to an internal file, a USB drive, or remotely
via LAN or USB.
The N934xC HSAs provide a dedicated Save button to let
you save a file quickly with a single button press. When
the Save button is used, you can choose to name the file
by yourself, or let the HSA automatically pick a file name
that consists of a prefix (N934xC is the default but can be
edited) and a index.
Another unique feature on the N934xC HSAs is the User
key, which provides a quick way to set up the instrument.
You can select from 7 predefined instrument setups with a
single button push.
Instructions for the
source
Keystrokes for the
source
Set 2-GHz center frequency,
amplitude -10 dBm, W-CDMA
signal
[Preset], [Freq], [2], {GHz},
[Amplitude], [-10], {dBm},
[Mode], {W-CDMA}, {Arb
W-CDMA (3GPP 12-2004},
{W-CDMA (On)}, [Mod On],
[RF On]
Instructions for HSA
Keystrokes for HSA
Preset N934xC HSA
[Preset]
Select internal C:/USER/
STATE folder
Note: For the user key feature,
the STA file must be placed
under the USER/STATE
directory
[Shift], [File], rotate the knob
to select the USER folder,
[Enter], rotate the knob to
select the STATE folder,
[Enter], {Return}
You may have to create the
USER and STATE directory
folders
[Shift], [File], {Directory},
{Create Folder}
Set QSave file type
[Shift], [File], {Setup}, {QSave
Type}, {STA}
Turn on QSave naming
{QSave Naming (On)},
{Return}
Set center frequency and span [Freq], {Center Freq}, [2],
{GHz}, [Span], [10], {MHz}
Figure 3. USER key
Turn on channel power
[Meas], {Channel Power}
Set integrated BW
{Integrated BW}, [5], {MHz}
Save file
[Shift], [Save], input the file
name [WCDMA_CHP] in the
“Save As” dialog box and
press [Enter]
Turn on OBW
[Meas], [Meas],
{Occupied BW}
Save file
[Shift], [Save], input the file
name [WCDMA_OBW] in the
“Save As” dialog box, [Enter]
Preset N934xC HSA
[Preset]
Use the User key
(As shown in Figure 17,
channel power and OBW’s
state file name appears on the
soft key button)
[Shift], [User]
Make measurement with User key
8
Channel power
{WCDMA_CHP}
OBW
[Shift], [User], {WCDMA_OBW}
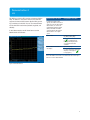
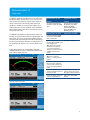
Demonstration 4
GPS
The HSA has a built-in GPS receiver and antenna (Option
GPS). In addition to the internal antenna, the HSA also
supports the external GPS antenna (Option GPA), providing convenience in the field. You can save measurement
results with GPS location data (latitude, longitude, and
altitude).
In this demonstration, we will show how to use the
N934xC HSA`s GPS feature.
Instructions for HSA
Keystrokes for HSA
In order to receive a GPS
signal, you need to move to an
open space to use the internal
GPS antenna, or connect an
external GPS antenna (option
GPA) to the HSA and make
sure the head of the external
GPS antenna is in an open
space.
Turn on GPS
[Shift], [System], {More 1 of
2}, {GPS}, {GPS, (On)}
A
icon will appear at
the top of the display after
successful lock of GPS
satellites
Turn on GPS information on
the display
{GPS Info, (On)}
Location information from GPS
displays on the right of
icon (Figure 3)
Note: The N934xC must have an unobstructed view of the sky in
order to lock onto GPS satellites.
Figure 4. GPS information
9
Demonstration 5
Task planner
Task planner is a unique tool provided with N934xC HSA
as an optional feature. It’s easy to sequentially execute
many pre-defined measurements, log results, and generate
reports automatically.
Step 1: Create a task plan file (.TPF)
Action 1: Save state file
Instructions for HSA
Keystrokes for HSA
The measurement modules which task plan supports
include: SA, ACP, CHP, and OBW. One task planner file
(*.tpf) can execute up to 20 test tasks.
Set center frequency and span
[Freq], {Center Freq}, [2],
{GHz}, [Span], [10], {MHz}
In this demonstration, we will compile a task planner file
(w_cdma.tpf) and run it. Before compiling it, you must
install N934xC HSA PC software and the Agilent I/O library
on your PC (download available at
www.agilent.com/find/hsapc).
Enter channel power
[Meas], {Channel Power}
Set integrated bandwidth
(BW)
{Integrated BW}, [5], {MHz}
Save the state file for channel
power
[Shift], {File}, {Save As}, input
the file name [WCDMA_CHP],
use the rotating knob to
choose file type: STA, [Enter]
Task 1: Channel power
Task 2: Occupied bandwidth (OBW)
Enter OBW
[Meas], [Meas], {OBW}
Save the state file for OBW
[Shift], {File}, {Save As}, input
the file name [WCDMA_
OBW], use the rotating knob
to choose file fype: STA,
[Enter]
Task 3: Adjacent channel power ratio (ACPR)
10
Enter ACPR
[Meas], [Meas], {ACPR}
Set main channel BW,
adjacent channel BW, and
space
{Main Channel}, [3.84], {MHz},
{Adj Chn BW}, [3.84], {MHz},
{adj Chn Space}, [5], {MHz}
Save the state file for ACPR
[Shift], {File}, {Save As}, input
the file name [WCDMA_
ACPR], use the rotating knob
to choose file fype: STA,
[Enter]
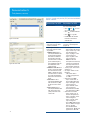
Demonstration 5
Task planner (continued)
Action 2: Compile task plan file (.TPF) with the free N934xC
HSA PC software
Figure 5. Connect to the N934xC HSA
Instructions for HSA
Keystrokes for HSA
Make sure the Agilent I/O
library and the N934xC HSA
PC software are correctly
installed. Connect the N934xC
HSA and PC via a USB cable
Run the N934xC HSA PC
Click the shortcut key of
software
Agilent HSA PC software on
Note: In order for the Agilent
the PC screen
I/O library to “discover” the
HSA USB connection, you
must connect the instrument
to the PC via the USB cable
and follow the “wizard”
directions. Running the Agilent
Connection Expert within the
I/O library may be required
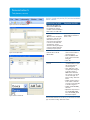
Figure 6. Task plan editor
Figure 7. Add from the device
Figure 8. Select a state file
Establish the connection
between the PC and the
N934xC HSA
• Click the connection
shortcut in the toolbar as
shown in Figure 5
• Select the N934xC HSA
in the connect instrument
dialog box
• Click “Ok”
Add state files into the task
plan file
• Click “Instruments” then
“Task Plan Editor” to open
the task plan editor as
shown in Figure 6
• Click “Add Task” in the
task plan editor dialog box
as shown in Figure 7
Note: If these state files
are on the PC, you should
choose media type “PC”
before clicking “Add Task”
button
• Double click the “Driver C”
in the “Select a state file
to create a task” dialog box
as shown in Figure 8
• Double click file WCDMA_
CHP.STA
• Repeat the steps from b to
d to add WCDMA_OBW.
STA, and WCDMA_ACPR.
STA to the task plan
Note: If these state files are on the PC, you should choose media
type “PC” before clicking “Add Task” button.
11
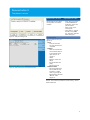
Demonstration 5
Task planner (continued)
Action 2: Compile task plan file (.TPF) with the free N934xC
HSA PC software
Instructions for HSA
Keystrokes for HSA
Edit the task list
As shown in Figure 9, the task
list can be easily edited:
• Click
and
to move
up or down the file
• Click
to delete task files
• Click
• Double click the selected
task file to rename the
selected task
Figure 9. Task list
Figure 10. Edit a task
12
to copy files
Edit the task description,
start/stop message, report
contents, and limits
The following demonstration
is on Test 1: Channel power
(Figure 10)
About report contents.
Four types of report content
are provided:
1. Marker result. If this is
selected, the N934xC will
log the marker readout if
the marker is enabled in
the state file. The upper
and lower limits can be set
up for marker frequency
and amplitude to indicate
the PASS/FAIL of the
marker readout
2. Measure result. Measure
result is only shown when
the measurement is CHP,
OBW, or ACPR. The upper
and lower limits can be set
up to indicate the PASS/
FAIL of the measurement
result
3. Save trace. If this is
selected, the N934xC HSA
will save the trace (.TRC)
at the end of the current
task
4. Save screen. If this is
selected, the N934xC HSA
will capture the screen
(.JPG) at the end of the
current task
• Task description:
-- Select CHP in the task list
-- Input “wcdma chp” in the
task description box
-- Input “chp begin” in the
start message box
-- Input “chp end” in the
stop message box
Note: Use the task
description and start/stop
message to provide brief
test setup instructions to
field engineer/technician
• “End by Cycle“ and set task
duration to 1
• Set report contents as the
following:
-- CHP’s lower limit is
-12 dBm and upper limit
is -8 dBm
• Select the task “OBW”
-- Input “wcdma obw” in
the Task Description box
-- Input “obw begin” in the
start message box
-- Input “obw end” in the
stop message box
-- Set lower limit as 4 MHz
and upper limit as 5 MHz
• Select the task “ACPR”
-- Input “wcdma acpr” in
the task description box
-- Input “acpr begin” in the
start message box
-- Input “acpr end” in the
stop message box
-- Set ±5 MHz ACPR’s lower
limit as -60 dBc and upper
limit as -44.2 dBc
-- Set ±10 MHz ACPR’s
lower limit as -60 dBc and
upper limit as -49.2 dBc
Demonstration 5
Task planner (continued)
Figure 11. Task plan running mode
Figure 12. Test measurement result (manual mode)
Instructions for HSA
Keystrokes for HSA
Edit the task plan description,
running mode, and save the
task plan
• Input “This task is used
to do W-CDMA BS RF
verification” as the task
plan description
• Select “Auto” as the
running mode
• Click “Save as” and save
this file as:“W_CDMA.
tpf”. Close the “Task Plan
Editor” dialog box
Running mode
There are three choices (see
Figure 11):
1. Auto
-- Tasks are executed
non-stop until tasks are
completed
2. Manual
-- After one measurement
task is finished, there is
a measurement result
report and you can
choose to
-- {Redo}
Redo the current task
-- {Next}
Execute the next task
-- {Skip}
Skip the next task
3. Manual if failed
-- The measurement tasks
are executed non-stop
and there is a failed
result, e.g. passing the
defined limit, it will enter
“Manual” mode
(Figure 12)
Note: A “Load” button is provided to load an existing *.TPF for
future modification
13
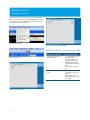
Demonstration 5
Task planner (continued)
There are two ways to transfer the task plan file to the N934xC
HSA: via a USB flash drive or using the N934xC HSA PC software.
In this example we will use N934xC HSA PC software to transfer
the task plan file to the N934xC HSA.
Figure 13. Data transfer
Figure 16. Task plan measurement result
Step 2: Transfer the task plan file to the HSA
Figure 14. Disconnect
Figure 15. Task plan preview
14
Instructions for HSA
Keystrokes for HSA
Transfer the task plan file to
the N934xC HSA
• As shown Figure 13, click
the “Data transfer”
• Just like Windows® file
operation, drag the W_
CDMA.tpf file from the PC
to N934xC HSA’s Internal
disc C
• Close the “Data Transfer”
box
N934xC HSA back to local
mode
• Click the shortcut key of
disconnection as shown in
Figure 14
• Press [Enter] on the
N934xC HSA and return to
local mode
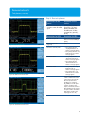
Demonstration 5
Task planner (continued)
Step 3: Run task planner
Figure 17. Channel power measurement result
Figure 18. OBW measurement result
Instructions for the
source
Keystrokes for the
source
Set 2 GHz center frequency,
amplitude -10 dBm, W-CDMA
signal
[Preset], [Freq], [2], {GHz},
[Amplitude], [-10], {dBm},
[Mode], {W-CDMA}, {Arb
W-CDMA (3GPP 12-2004},
{W-CDMA (On)}, [Mod On],
[RF On]
Instructions for HSA
Keystrokes for HSA
Load the task plan file
[Shift], [File], use the rotating
knob to choose W-CDMA.tpf,
[Enter]
Run the task plan file
(Figure 15)
{Run}
Run task 1: Channel power
• Press [Enter] after the
“chp begin Enter/Esc to
Confirm” message appears
• Press [Enter] after the “chp
end Enter/Esc to Confirm”
message appears
Run task 2: OBW
• Press [Enter] after the
“obw begin Enter/Esc to
Confirm” message appears
• Press [Enter] after the
“obw end Enter/Esc to
Confirm” message appears
Run task 3: ACPR
• Press [Enter] after “acpr
begin Enter/Esc to
Confirm” message appears
• Press [Enter] after “acpr
end Enter/Esc to Confirm”
message appears
N934xC HSA automatically
creates a folder whose name
is the same as the task plan
file name (for this demo,
the directory is named as
W_CDMA) to save all report
contents, including a text
report, screenshots, and trace
files depending on the choices
of report contents. The PASS/
FAIL result is shown in the
report (Figures 17 to 19)
Figure 19. ACPR measurement result
15
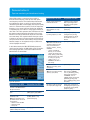
Demonstration 6
Spectrum monitoring and interference hunting
Option SIM provides a spectrogram that provides a
three-dimensional display of the spectrum with power
over frequency and time. This feature helps find intermittent interference signals, as well as locate and identify
unwanted signals that cause dropped calls and poor quality
service in communications systems. The X-axis represents
frequency as in a normal spectrum display, but amplitude
is represented by color: red for a strong signal and blue for
noise floor. The Y-axis represents time, with the trace from
the newest sweep displayed at the bottom of the screen.
Earlier traces move up towards the top of the screen with
each new sweep. Two coupled markers allow you to place
a marker on any trace in the spectrogram and view the normal spectrum for the time of that sweep. The time interval
between sweeps can be adjusted, and up to 1,500 traces
can be displayed and saved.
In this demonstration, the N9311X-500 whip antenna is
used to receive over the air GSM uplink signal. For interference hunting application, a directional antenna like the
N9311X-504 is recommended.
Instructions for HSA
Keystrokes for HSA
Set the update interval time
between two frames
{Update Int. (On)}, rotating
knob or pressing numeric
keypads to set the update
interval time
Turn on Marker 1 and Marker 2 [MARKER], {Marker (2)},
(Note: Marker 1 is on by
{State (On)}
default)
Move marker to the location
by setting frequency or time
Turn on file logging
[Meas], {File Logging}
Note: There are manual and
automatic methods to save
data, and the filename’s
format is <Prefix>_<Index>_
HHMMSS
• <Prefix> is N934X by
default, you can edit the
<Prefix> by pressing {File
Path}, {Setup}, {Prefix Edit},
input the name in the “Save
as” dialog box, [Enter]
• <Index> is 0, 1, 2, 3….
• HHMMSS is the time to
start saving
Manual save data
Note: To stop saving press
{Stop Save}
{Start Save}
Automatic save data
Note: To stop saving pressing
{Return}, {Stop Save}
{Timed Setting}, {Start Date},
date format is YYMMDD,
such as: [20100712], [Enter],
{Start time}, time format
is HHMMSS, such as:
[145945], [Enter], {Stop date},
[20100712], [Enter], {Stop
time}, [133000], [Enter], {Time
Save (On)}
Recall the saved spectrogram
file and playback (Figure 20)
[Shift], [File], rotating knob
and highlight the spectrogram
file, {Recall}, {Spctrg View},
{Playback}, {Play}
Figure 20. Spectrum
Instructions for HSA
Keystrokes for HSA
Connect the N9311X-500 whip
antenna to the N934xC HSA
RF input connector
Set the center frequency and
span
[FREQ], {Center Freq}, [925],
{MHz}, [Span], [70], {MHz}
Set Y scale/div and On HiSensitivity to On
Note: If Hi-Sensitivity is On,
parameters below can be set
automatically:
• Reference level -50 dBm
• Attenuator 0 dB
• Preamp On
[Amptd], {Scale/Div},
{5/DIV}, {More 1 of 2},
{Hi-Sensitive (On)}
Turn on spectrum monitor
(N934xC-SIM option needed)
[Meas], {Spectrum Monitor}
16
{Frequency} or {Time},
rotating knob or pressing
numeric keypads to change
the marker’s location as
desired
Demonstration 7
Remote control via LAN or USB port
In order to keep a communication system working reliably
long term, you need to monitor the spectrum routinely.
Regular spectrum monitoring is usually accomplished
automatically by using remote control software to drive
the spectrum analyzer. You can remotely control the HSA
using SCPI commands over LAN and USB, or use the HSA
PC software to monitor spectral changes. There are two
modes that are used to set up the HSAs’ LAN IP address:
static and DHCP.
Instructions for HSA
Keystrokes for HSA
Set HSA’s IP address is in
static mode
[Shift], {System}, {More 1 of
2}, {Port Setting}, {IP Config},
{IP Address (Static)}
Set IP address such as:
192.168.0. 12
[192.168.0.12], [Enter]
Set gateway such as:
192.168.0.8
[192.168.0.8], [Enter]
Set subnet mask such as:
255.255.255.0
[255.255.255.0], [Enter],
{Apply}
Set HSA’s IP address
automatically using DHCP
mode
[Shift], {System}, {More 1 of
2}, {Port Setting}, {IP Config},
{IP Address (DHCP)}, {Apply}
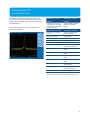
The N934xC HSAs each have a total of six markers that
can be used in normal or delta mode. In addition to the
marker table and peak search, each N934xC HSA also has
a peak table feature which automatically searches 10 max
or min peak signals simultaneously and is updated after
each sweep.
Instructions for the
source
Keystrokes for the
source
Set 2 GHz center frequency,
amplitude -10 dBm, 100 kHz
deviation, 30 kHz rate, FM
signal
In this demonstration, we will use peak table to find the
absolute values of FM signal sidebands.
[Preset], [FREQ], [2], {GHz},
[AMPTD], [-10], {dBm},
[FM/ФM], {FM On}, {FM Dev}
[100], {kHz}, {FM Rate}, [30],
{kHz}, [Mod On], [RF On]
Instructions for HSA
Keystrokes for HSA
Set center frequency to 2 GHz
[Freq], [2], {GHz}
Note: To prevent data corruption when saving the table to a USB
memory device, set the file directory to USB then reset to INT
before removing the device.
Set span to 500 kHz
[Span], [500], {kHz}
Set reference level to -10 dBm
[Amptd], {Ref Level}, {10},
{dBm}
Peak search
[Shift], [Peak], {Peak Search}
Measure the absolute peak
amplitude of FM sidebands
using the peak search table.
Peak search table will display
up to 10 peaks (Figure 21)
{More 1 of 2}, {Peak Table},
{Peak Table On}
Change peak criterion
[Shift], [Peak], {More 1 of 2},
{Peak Criterion}, user can set
the peak threshold limit, peak
excursion limit and peak type
Save peak table in a .csv
format
[Shift], [Peak], {More 1 of 2},
{Peak Table}, {Export Table to
CSV}, input file name, [Enter]
Turn the peak table off
[Shift], [Peak], {More 1 of 2},
{Peak Table}, {Peak Table Off}
In this demonstration, we will show how to set HSA’s IP
address.
Demonstration 8
Marker, marker table, and peak table
Figure 21. FM sidebands peak values in peak table
17
Demonstration 9
Advance marker functions
The N934xC HSAs provide powerful marker functions. In
addition to normal and delta marker modes, the instrument marker system provides noise markers, frequency
counter markers, AM/FM tune and listen, and band power
measurement. For the AM/FM tune and listen feature, the
AM/FM demodulated audio can be heard with the internal
speaker or the provided headphone. Speaker volume and
delay time can be adjusted to meet your specific needs.
In this demonstration, we will perform an AM/FM tune and
listen measurement using an external AM/FM antenna.
Instructions for HSA
Keystrokes for HSA
Connect an AM/FM antenna (such as 88 MHz to
108 MHz) to HSA RF input port
Set start frequency and stop
frequency
[Freq], {Start Freq}, [88],
{MHz}, {Stop Freq}, [108],
{MHz}
Turn on the hi sensitivity mode [Amptd], {More 1 of 2},
Note: If Hi-Sensitive is On,
{Hi-Sensitive (On)}
parameters below can be set
automatically:
• Reference level -50 dBm
• Attenuator 0 dB
• Preamp On
Enter into FM and listen mode
[Marker], {Function},
{Demod}, {Demod Setting},
{Demod Type (FM)}, rotate
the knob to move the marker
to one of the displayed FM
broadcast stations
In order to make sound smooth and clear
Figure 22. AM/FM-tune and listen marker
18
Set speaker volume
{Speaker Vol}, [50], {Enter}
Set delay time
{Delay Time}, [1], {s}
Demonstration 10
Limit lines and limit masks
The N934xC HSA offers two different limit lines. Limit
lines/limit masks and associated margins allow you to
quickly and easily identify signals that do not meet specified requirements.
In this demonstration, we will create a limit line and
perform a pass/fail test.
Figure 23. Limit lines
Instructions for the
source
Keystrokes for the
source
Connect the source output
to the HSA input. Set 2 GHz
center frequency, amplitude
-10 dBm, CW signal
[Preset], [FREQ], [2], {GHz},
[AMPTD], [-10], {dBm},
[RF On]
Instructions for HSA
Keystrokes for HSA
Preset, set center frequency
and span
[Preset], [Freq], [2], {GHz},
[Span], [10], {MHz}
Enter into limit menu
[Shift], [Limit]
Set the upper limit
{Limit 1}
Activate the limit
{Limit (On)}
Edit the limit mask (Figure 23)
{Limit Edit}
Edit point 0
{Frequency}, [1.995], {GHz},
{Amplitude}, [-50], {dBm}
Edit point 1
{Add}, {Frequency}, [1.999],
{GHz}
Edit point 2
{Add}, {Amplitude}, [-10],
{dBm}
Edit point 3
{Add}, {Frequency}, [2.001],
{GHz}
Edit point 4
{Add}, {Amplitude}, [-50],
{dBm}
Edit point 5
{Add}, {Frequency}, [2.005],
{GHz}, {Return}
Save the limit line
{More 1 of 2}, {Save Limits},
input file name, [Enter]
Set signal level to 0 dBm, CW
[AMPTD], [0], {dBm}
Note: Portions of trace which fail the limit are displayed in red
19
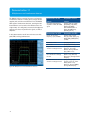
Demonstration 11
Multiple traces and simultaneous detectors
The N934xC HSA has a total of four traces and supports
simultaneous detectors including peak, average, sample,
negative peak, and the normal detector. Plus the N934xC
HSA supports simultaneous detectors, meaning that different detectors can be used on four different traces in a
single sweep—this will greatly increase the throughput to
measure crest factor of pseudo-noise signals, as well as
amplifiers.
In this demonstration, we will turn on three traces with
peak, RMS, and neg peak detectors.
Figure 24. Multiple traces and simultaneous detectors
20
Instructions for the
source
Keystrokes for the
source
Set 2 GHz center frequency,
amplitude -10 dBm, W-CDMA
signal
[Preset], [Freq], [2], {GHz},
[Amplitude], [-10], {dBm},
[Mode], {W-CDMA},
{Arb W-CDMA (3GPP 122004}, {W-CDMA (On)},
[Mod On], [RF On]
Instructions for HSA
Keystrokes for HSA
Preset, set the center
frequency, span, and RBW
[Preset], [Freq], {Center
Freq}, [2], {GHz}, [Span], [10],
{MHz}, [BW], {RBW} (Man),
{10 kHz}
Set reference level
[Amptd], [-30], {dBm}
Set Y scale
[Amptd], {Scale/DIV}, {2/DIV}
Set peak detector for trace 1
and turn on average function.
[Trace], {More 1 of 2},
{Detector}, {Pos Peak},
{Return}, {Average Number
(On)}, {More 2 of 2}
Set neg peak detector for
trace 2 and turn on average
function
{Trace (2)}, {Clear Write},
{More 1 of 2}, {Detector},
{Neg Peak}, {Average Number
100 (On)}
Set RMS detector for trace 3
and turn on average function
[BW], {Average Type},
{Power}, {Trace (3)}, {Clear
Write}, {More 1 of 2},
{Detector}, {Average (RMS)},
{Average Number (On)}
Demonstration 12
Trace math functions
The math functions in the N934xC HSA are true power
calculations, meaning that the measurements are
converted to power, the math function is performed, and
the results are displayed in dBm.
In this demonstration, we will subtract -6 dBm from 0 dBm
and the result will be -1.2 dBm. In order to get the correct
results, the source should be adjusted to as close to the
required power as possible as shown by the analyzer
marker:
• 0 dBm = 1 mw
• -6 dBm = 0.25 mw
• -1.2 dBm = 0.75 mw
Instructions for the
source
Keystrokes for the
source
Generate a 1 GHz, 0 dBm CW
signal
[Preset], [Freq], [1], {GHz},
[Amptd], [0], {dBm},
[Mod Off], [RF On]
Adjust the power of the signal
to -6 dBm on the HSA
[Amptd], [-6], {dBm}
Adjust the knob so that the
marker on the analyzer reads
-6 dBm
Instructions for HSA
Keystrokes for HSA
Set the center frequency
[Freq], {Center Freq}, [1],
{GHz}
Set zero span
[Span], {Zero Span}
Set reference level and scale
[Amptd], [4], {dBm}, {Scale/
Div}, [2], {dB}, if needed,
adjust amplitude on the ESG
so that the signal on the HSA
reads 0 dBm
Place trace 1 in view mode
and trace 2 in clear write
mode
[Trace], {View}, {Trace (2)},
{Clear Write}
Place marker 1 on trace 2
[Marker], {Marker Trace},
{Trace2}
Adjust the power of the signal
to -6 dBm on the HSA
[Amptd], [-6], {dBm}
Adjust the knob so that the
marker on the analyzer reads
-6 dBm
Subtract trace 2 from trace 1
and place the result on trace 3
[Trace], {More 1 of 2}, {Trace
Math}, {Math By (Pwr)},
{Math Type}, {A-B->C}
Move the marker to trace 3
and read the results
[Marker], {Marker Trace},
{Trace3}
The marker will read
approximately -1.2 dBm. To
see the difference between
rms power difference and
log difference, go to [Trace],
{More 1 of 2}, {Trace Math},
{Math By (Log Pwr}
21
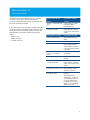
Demonstration 13
Tracking generator
In many cases, stimulus response characteristic measurements are important. A spectrum analyzer equipped with
a tracking generator forms a stimulus response measurement system that can easily perform scalar component test
with high dynamic range (due to the spectrum analyzer’s
tuned receiver architecture and narrow IF bandwidths).
The Agilent N924xC HSAs each have an optional highperformance, built-in tracking generator (Option TG7)
(frequency range from 5 MHz to 7 GHz). With this option,
the HSA performs stimulus response measurements.
In this demonstration, we’ll measure the passband and
rejection of a bandpass filter.
DUT
Instructions for HSA
Keystrokes for HSA
Preset the HSA
[Preset]
Turn on the tracking generator [Mode], {Track Generator},
and set its output amplitude to {Amplitude, (On)}, [-10],
-10 dBm
{dBm}
Set start frequency and stop
frequency
Note: Select frequencies
appropriate for the device
being tested
[Freq], {Start Freq}, [852.5],
{MHz}, [Stop Freq], [952.5],
{MHz}
Note: Decrease the resolution
bandwidths to increase
dynamic range
To measure the test system’s
frequency response more
accuracy, directly connect
the cable from the tracking
generator output to the
analyzer RF input
The normalization function
is used to eliminate the test
system’s frequency response
error from the measurements.
Store the frequency response
of the test system in trace 4
and make the Normalize On
[Meas], {Normalize}, {Store
Ref 1->4}, {Normalize (On)}
Connect the DUT to the
analyzer
Figure 25. Stimulus response measurements
22
Change the normalized
reference position to optimize
the view range (Figure 25)
{Norm Ref Posn}, [9], {Enter}
Measure the rejection of the
filter 20 MHz above to the
center frequency
[Marker], [902.5], {MHz},
{Mode}, {Delta}, [20], {MHz}
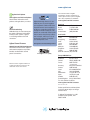
Demonstration 14
Power meter
The Agilent U2000 Series USB power sensor works with
the N934xC HSA to provide high accuracy average power
measurement. The frequency range for power measurements is from 9 kHz to 24 GHz and power levels from
-60 dBm to +20 dBm at a measurement speed of up to
1,000 readings per second in buffered mode. The N934xC
HSA provides power to the sensor and retrieves measurement results over USB.
The N934xC HSA displays the measurement results and
provides pass/fail indication with user-settable upper and
lower limits. The results are displayed in dBm and W for
absolute power measurements and in dB and percentage
for relative measurements. Results can be displayed on a
fast updating meter display or on a chart of power versus
time.
In this demonstration, we use the N934xC HSA with
U2000A USB power sensor to measure the output power
of an external signal generator.
Instructions for the
source
Keystrokes for the
source
Set 2 GHz center frequency,
amplitude -10 dBm, W-CDMA
signal
[Preset], [Freq], [2], {GHz},
[Amplitude], [-10], {dBm},
[Mode], {W-CDMA},
{Arb W-CDMA (3GPP 122004}, {W-CDMA (On)},
[Mod On], [RF On]
Instructions for HSA
Keystrokes for HSA
Connect the Agilent U2000A
power sensor to the N934xC
HSA via USB cable
Turn on the power meter
[Mode], {Power Meter}
function (N934xC-PWM option
needed) (Figure 26)
Note: Please don’t operate
until the warning message
“Connection initialization”
disappears and model number
“U2000A” appears on the
display
Zero and the zero type is INT
Note: “Zero calibration,
waiting…” warning message
appears
{Zero}, {Zero Type} to INT
Connect the signal generator’s
RF output to the USB power
sensor’s RF IN connector and
turn on the signal generator’s
output
Turn on the limit function.
Sound warning when power is
beyond limit value
{Return}, {Meas Setup},
{Limits}, {Limits (on)}, {Limit
Beep (On)}, {Return}, {Return}
Change the display mode from
meter to chart (Figure 27)
{Meas Disp}, {Disp Mode
(Chart)}
Figure 26. Power meter mode
Figure 27. Chart mode
23
www.agilent.com
For more information on Agilent
Technologies’ products, applications or
services, please contact your local Agilent
office. The complete list is available at:
Agilent Email Updates
www.agilent.com/find/emailupdates
Get the latest information on the
products and applications you select.
www.lxistandard.org
LAN eXtensions for Instruments puts
the power of Ethernet and the Web
inside your test systems. Agilent
is a founding member of the LXI
consortium.
Agilent Channel Partners
www.agilent.com/find/channelpartners
Get the best of both worlds: Agilent’s
measurement expertise and product
breadth, combined with channel
partner convenience.
Microsoft is either a registered trademark or
a trademark of Microsoft Corporation in the
United States and/or other countries.
Agilent Advantage Services is committed to your success throughout
your equipment’s lifetime. We share
measurement and service expertise
to help you create the products that
change our world. To keep you competitive, we continually invest in tools
and processes that speed up calibration and repair, reduce your cost of
ownership, and move us ahead of
your development curve.
www.agilent.com/find/advantageservices
www.agilent.com/quality
www.agilent.com/find/contactus
Americas
Canada
Brazil Mexico
United States
(877) 894 4414
(11) 4197 3500
01800 5064 800
(800) 829 4444
Asia Pacific
Australia 1 800 629 485
China
800 810 0189
Hong Kong 800 938 693
India 1 800 112 929
Japan
0120 (421) 345
Korea
080 769 0800
Malaysia 1 800 888 848
Singapore 1 800 375 8100
Taiwan
0800 047 866
Other AP Countries (65) 375 8100
Europe & Middle East
Belgium 32 (0) 2 404 93 40
Denmark
45 70 13 15 15
Finland
358 (0) 10 855 2100
France
0825 010 700*
*0.125 €/minute
Germany
49 (0) 7031 464 6333
Ireland
1890 924 204
Israel972-3-9288-504/544
Italy
39 02 92 60 8484
Netherlands
31 (0) 20 547 2111
Spain
34 (91) 631 3300
Sweden
0200-88 22 55
United Kingdom 44 (0) 118 9276201
For other unlisted Countries:
www.agilent.com/find/contactus
Revised: October 14, 2010
Product specifications and descriptions
in this document subject to change
without notice.
© Agilent Technologies, Inc. 2011
Printed in USA, April 28 , 2011
5990-7132EN